Article

Periodic Power Fluctuation Smoothing Control Using Blade Inertia and DC-Link Capacitor in Variable-Speed Wind Turbine

Department of Electrical Engineering, Kwangwoon University, Seoul 01897, Republic of Korea
*
Author to whom correspondence should be addressed.
Energies 2025, 18(14), 3763; https://doi.org/10.3390/en18143763
Submission received: 26 May 2025 / Revised: 4 July 2025 / Accepted: 11 July 2025 / Published: 16 July 2025

Abstract

Due to the structural aspects of the wind turbine, such as wind shear and tower shadow effects, the output power of the wind turbine has periodic fluctuations, known as 3P fluctuations. These fluctuations can reduce overall power generation and deteriorate power quality. In this context, this paper proposes a power smoothing control method that utilizes rotor inertia and a DC-link capacitor as small-scale energy storage devices. First, the typical energy storage capacities of the rotor’s rotational kinetic energy and the DC-link capacitor’s electrostatic energy are analyzed to assess their smoothing potential. Secondly, a control method is presented to apply the rotor and the DC-link capacitor as small-scale energy storage, with the smoothing frequency range allocated according to their respective storage capacities. Finally, the proposed method is compared with the conventional maximum power point tracking (MPPT) method and the 3P-notch filter method. The effectiveness of the proposed algorithm is verified through MATLAB/Simulink simulations, demonstrating its capability to mitigate periodic power fluctuations. The results showed that the proposed control method is applicable, reliable, and effective in mitigating periodic power fluctuations.

1. Introduction

With the global push toward carbon neutrality, the adoption of renewable energy sources is rapidly increasing. Among them, wind power is gaining particular attention due to its environmental friendliness and high efficiency. According to the Global Wind Report 2025 published by GWEC, the wind energy sector has demonstrated steady growth over the past two decades. In 2024 alone, a record-breaking 117 GW of new capacity was installed globally, underscoring the continued expansion of the industry [1]. As the grid penetration of wind power continues to rise, understanding its output characteristics and improving power quality have become essential topics; however, studies in this area remain insufficient.
This paper focuses on smoothing short-term periodic power fluctuations caused by wind shear and tower shadow effects in variable-speed wind turbine systems. Wind shear and tower shadow effects, both caused by the structural characteristics of wind turbines, lead to periodic fluctuations in the equivalent wind speed through the aerodynamic interaction between the wind and turbine blades [2]. As a result, the blade torque fluctuates, inducing periodic power fluctuations that are proportional to the rotor speed [3]. These fluctuations are short-term and sharply pulsate within a short duration [4]. Due to the symmetric three-blade structure of most turbines, the torque and power fluctuate three times per revolution, a phenomenon referred to as the 3P frequency component [5]. This 3P component introduces periodic torque pulsations, resulting in short-term power fluctuations. Although wind turbines possess substantial rotational inertia, these periodic torque pulsations are not sufficiently attenuated and are instead propagated through the drivetrain to the generator [6]. Such periodic power fluctuations can induce flicker in grid voltage and deteriorate power quality, especially as the grid penetration of wind energy increases [7]. Moreover, when these fluctuations are near the natural frequency of the grid, they may cause resonance with the power grid system [8,9]. These problems become more critical in weak grids, where short-term power fluctuations can have a stronger impact, thereby necessitating the mitigation of periodic power fluctuations.
Previous studies have proposed the utilization of external energy storage devices, such as energy storage systems (ESS) and flywheel energy storage, to smooth power fluctuations in wind energy systems [10,11]. These are primarily employed to mitigate long-term power fluctuations in large-scale grid-connected wind power systems. However, such external storage resources incur additional investment costs, require installation space, and involve additional ongoing maintenance. As an alternative, control methods utilizing internal components of wind turbines— pitch angle control, rotor inertia, and DC-link capacitor—have been investigated to mitigate periodic power fluctuations with existing resources of the wind turbine system. This strategy provides cost-effective benefits over external storage resource approaches by minimizing additional investment and fully leveraging the wind turbine’s internal resources. Although individual pitch angle control strategies have been proposed to smooth output power variations, they inherently decrease total power production by reducing energy conversion efficiency [12,13]. On the other hand, smoothing methods based on rotor inertia [14] or DC-link capacitors [15] offer advantages such as minimal loss of energy production and fast dynamic response enabled by inverter-based control. Nevertheless, some studies only mitigated specific frequency components using cascaded band-stop filters or limited smoothing capacities by the small energy storage capacity of the DC-Link capacitors, which restricts the applicable smoothing frequency range. To address these limitations, combined approaches using both rotor inertia and DC-link capacitors have been suggested [16,17]. However, in both studies, internal wind turbine components were employed to smooth power variations caused by wind turbulence. This resulted in the assignment of excessive smoothing beyond their physical limitations. As a consequence, the proposed algorithms in [16,17] showed reduced wind energy generation compared to conventional MPPT control.
This paper proposes a control method to smooth periodic output power fluctuations delivered to the grid from a variable-speed wind turbine equipped with a permanent magnet synchronous generator (PMSG). The proposed strategy operates during MPPT and calculates the periodic fluctuation components from both the generator-side and grid-side converters. These fluctuations are mitigated by utilizing the rotor inertia and the DC-link capacitor as internal energy storage components. The method requires no additional sensors or external devices and features a simple structure, making it suitable for integration into existing wind energy systems. Therefore, the proposed controller is cost-effective and can be broadly applied without hardware modifications.
This paper is organized as follows: In Section 2, the modeling of the wind energy conversion system, the conventional control scheme, and the structural characteristics of wind turbines that lead to periodic wind disturbances are described. Furthermore, frequency-domain analysis was performed to investigate the influence of wind speed fluctuations on the dynamic behavior of the power output. In Section 3, the energy storage capacities of the rotor inertia and the DC-link capacitor are analyzed, and a control algorithm is proposed that assigns smoothing tasks based on the frequency range suitable for each component. In Section 4, the dynamic performance of the proposed smoothing controller during MPPT is evaluated through MATLAB/Simulink simulations, and the results are compared with the conventional MPPT and the 3P-notch filter method.

2. Modeling of PMSM-Based Wind Turbine Systems

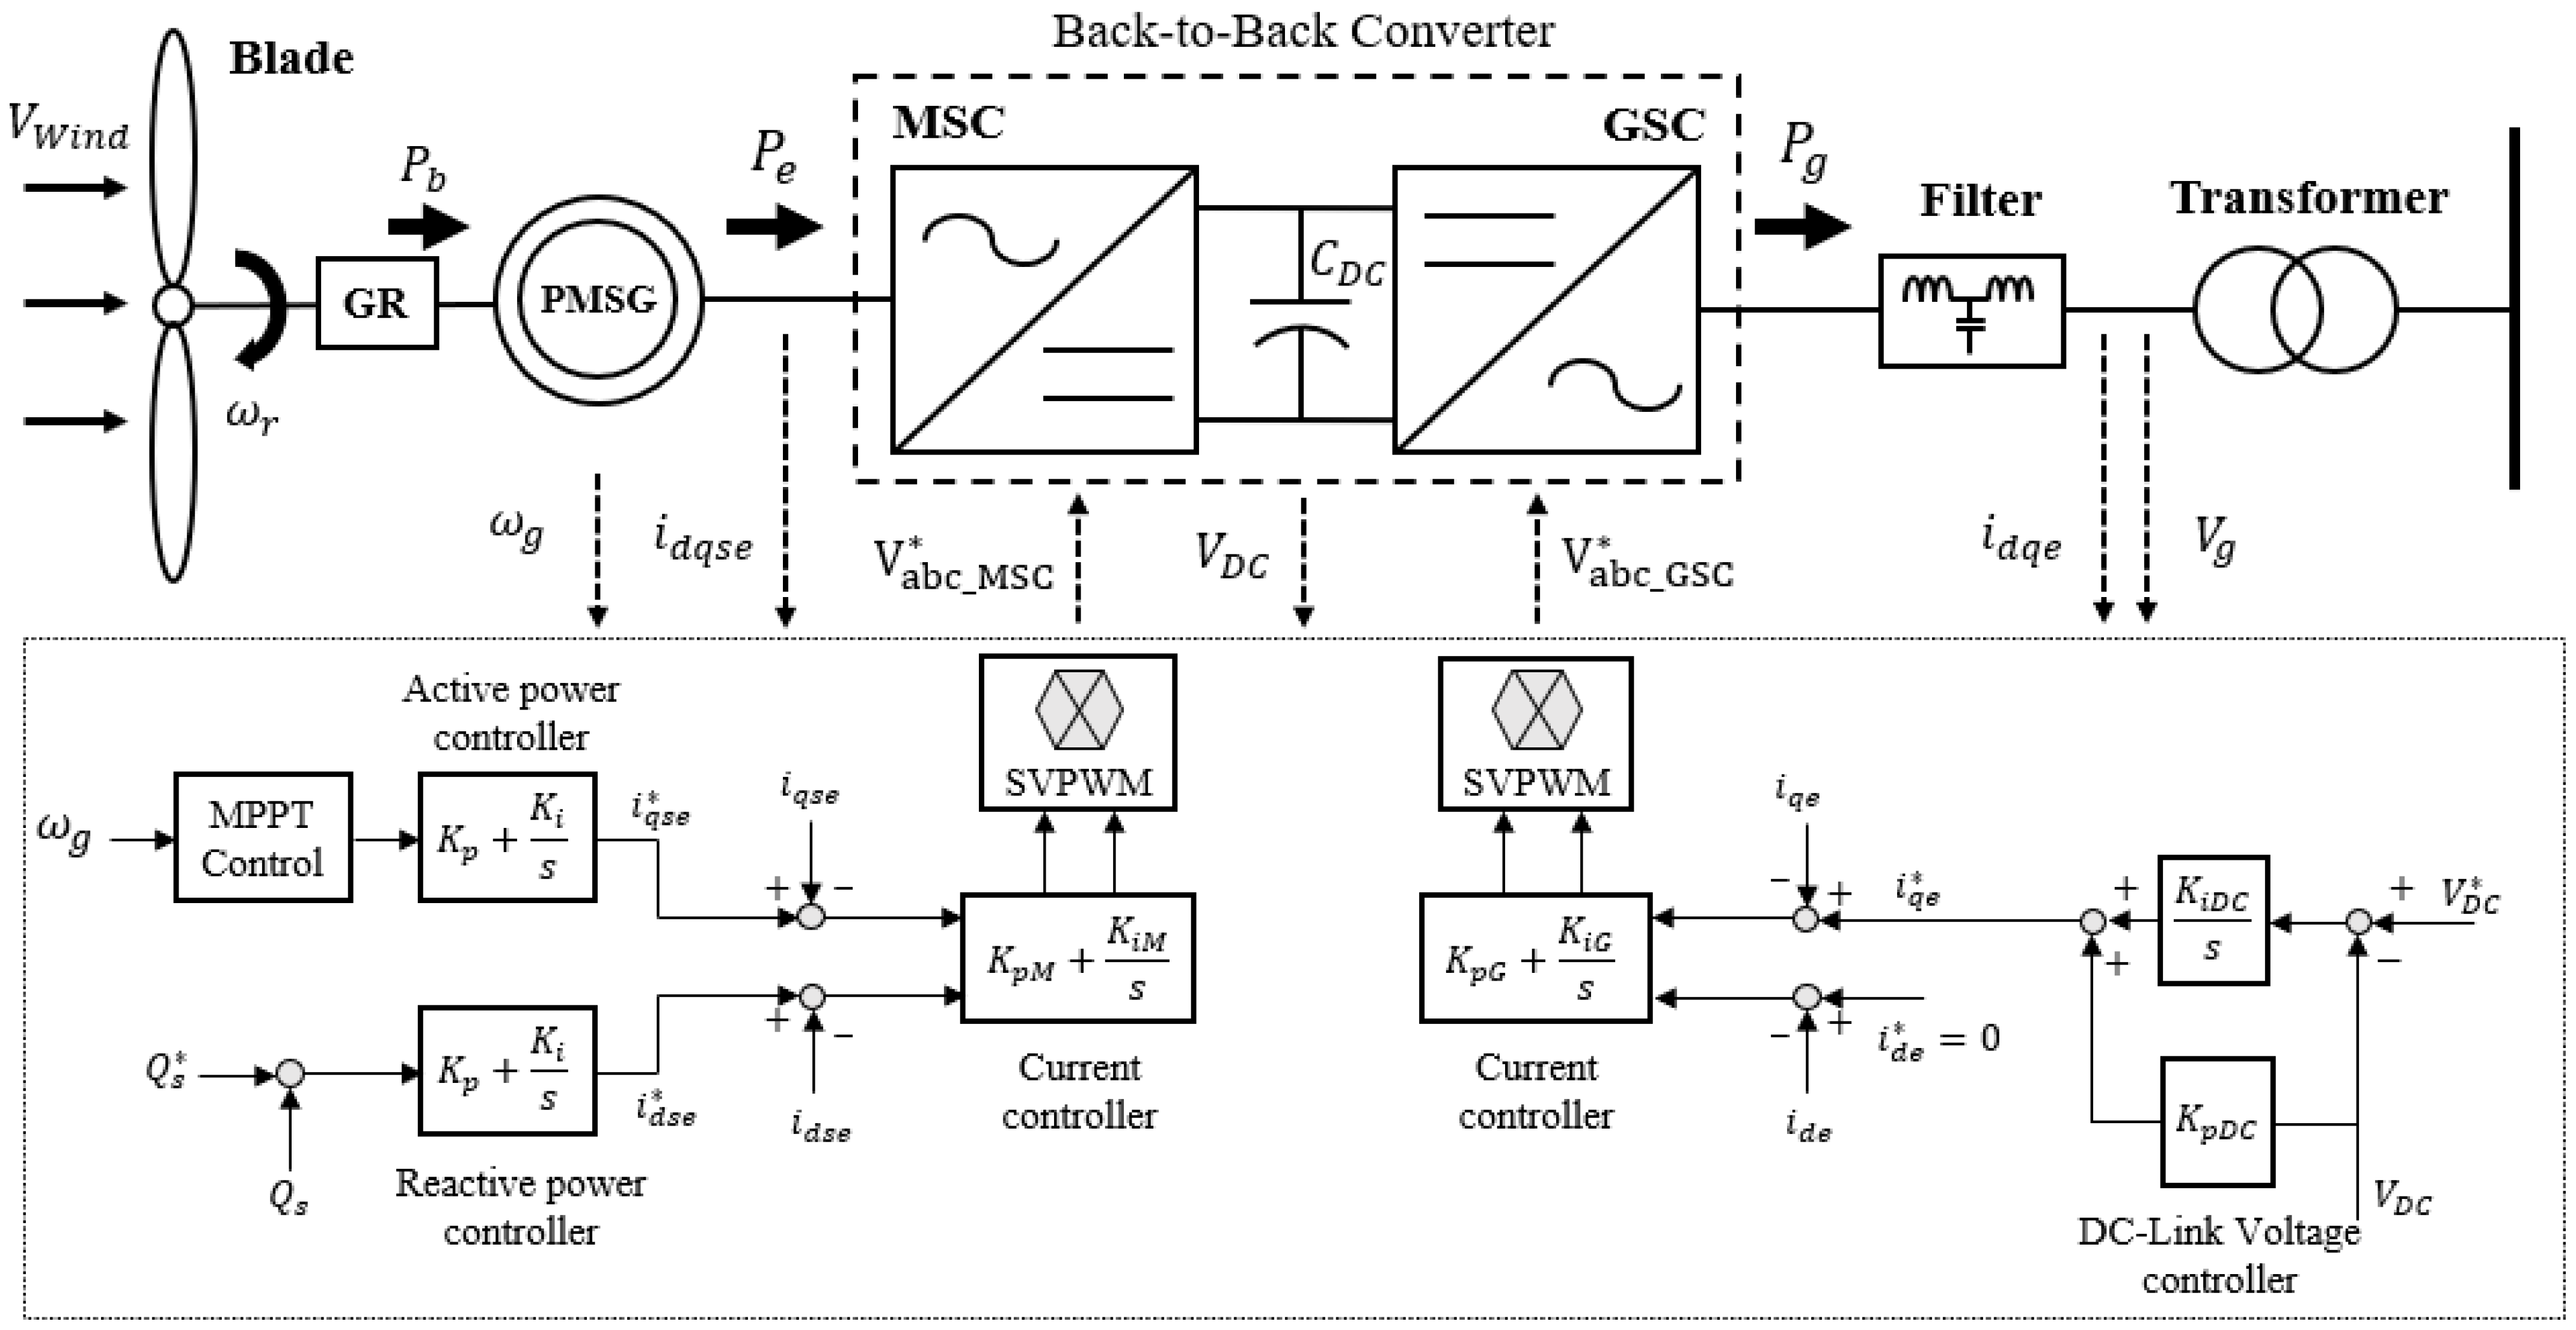
2.1. System Modeling and Configuration

The configuration of the variable-speed wind turbine system based on a PMSG is illustrated in Figure 1. The wind turbine is mechanically coupled to the PMSG, which is further connected to the grid through a back-to-back converter. The converter operates with the machine-side converter (MSC) synchronized to the rotor speed of the generator, implementing MPPT control [18]. Meanwhile, the grid-side converter (GSC) regulates the DC-link voltage and operates in synchronization with the grid [18]. The mechanical output power extracted from the blades is determined as (1).
P b = 1 2 ρ A C P ( λ , β ) V W i n d 3
In (1), ρ denotes the air density, A is the swept area of the blades, V e q is the equivalent wind speed, and C P ( λ , β ) is the power coefficient, which represents the efficiency of converting wind kinetic energy into rotational mechanical energy. Assuming C P remains constant, the mechanical power output of the blades becomes proportional to the cube of the equivalent wind speed. The power coefficient C P ( λ , β ) is determined by the tip speed ratio λ and the blade pitch angle β , where the tip speed ratio is defined as shown in (2).
λ = ω r R V W i n d
ω r is the rotor speed of the turbines, and R is the length of the blade. The pitch angle of a wind turbine is controlled by a pitch angle controller and cuts off the energy above the rated wind speed, which results in a reduction in the total energy output. In this study, only the sub-rated wind speed region is considered under MPPT control, and the pitch angle is assumed to remain fixed at 0° in this operating range.

2.2. Controller of Back-to-Back Converter

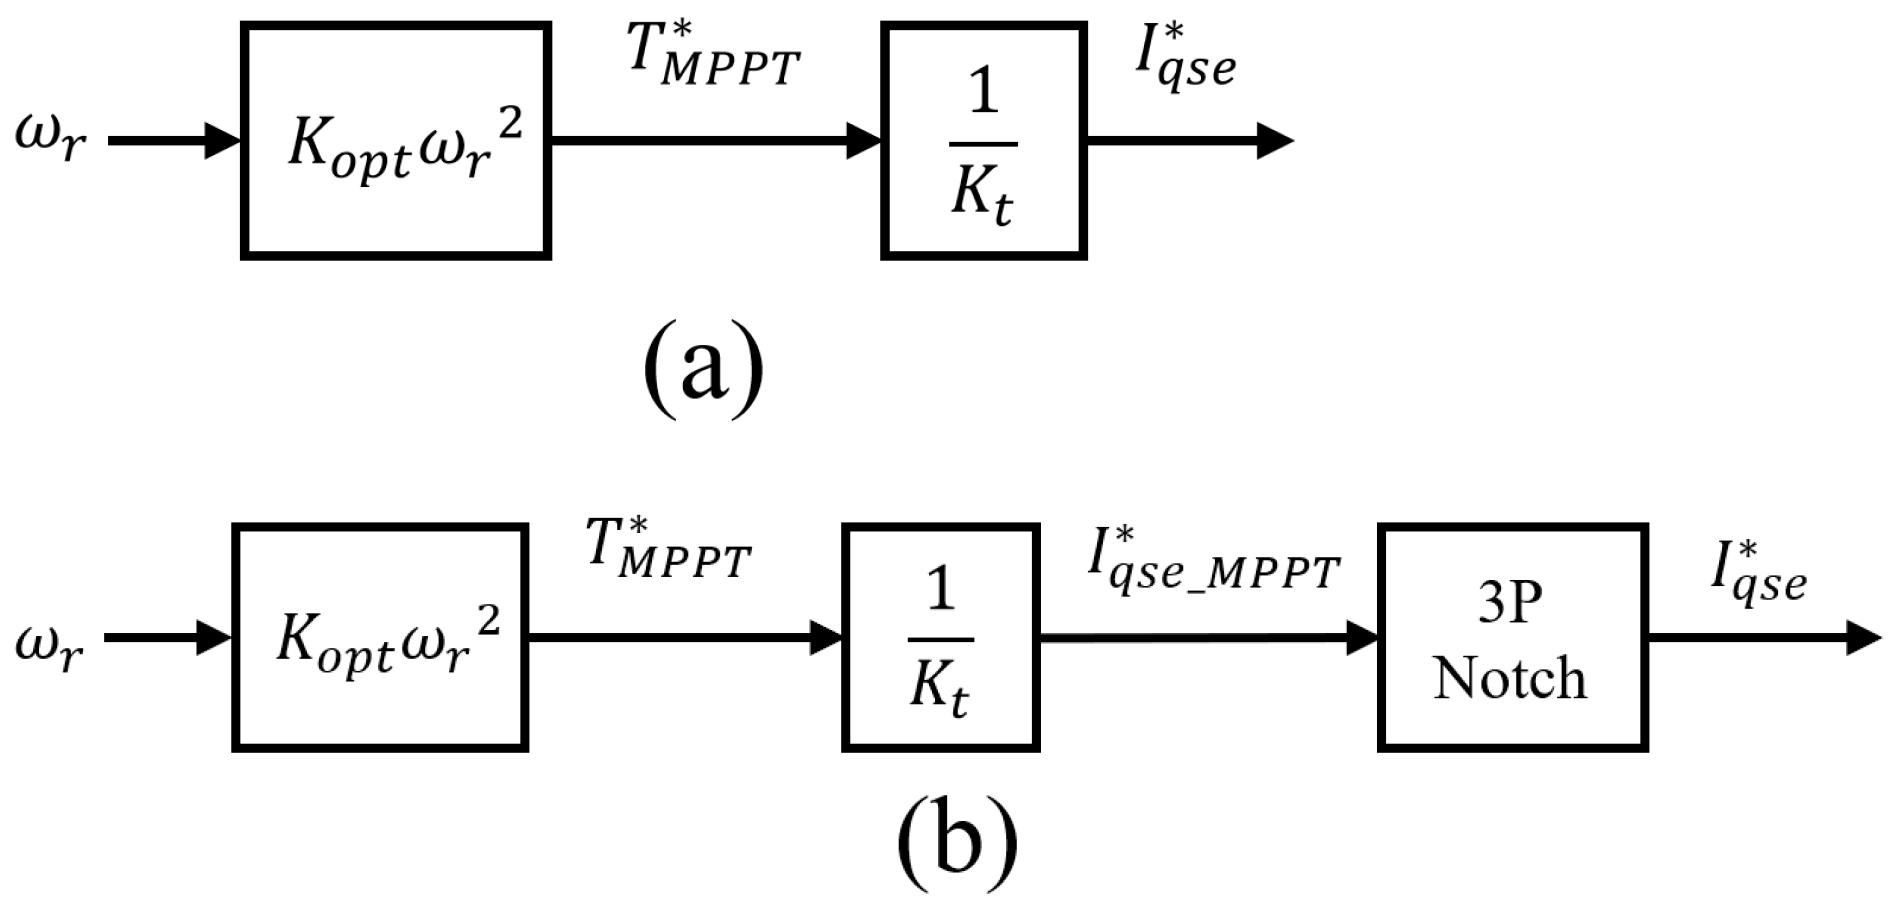
2.2.1. Controller of Machine-Side Converter

Under MPPT operation, the objective of the MSC control is to ensure that the rotor speed tracks the optimal tip speed ratio λ o p t corresponding to the given wind speed, so that the power coefficient C P reaches its maximum value [19]. To achieve this, the MSC regulates the generator reaction torque, whose magnitude is determined using the optimal mode gain K o p t , as defined in (3).
K o p t = 1 2 ρ π R 5 C P m a x λ o p t 3 N 3
K o p t is the optimal torque gain, where ρ is the air density, R is the blade radius, and C P m a x is the maximum power conversion coefficient, which represents the cube of the λ o p t .
The generator reaction torque reference is determined using K o p t to ensure that the rotor speed ω r follows the optimal tip speed ratio λ o p t . In this control scheme, the torque reference T M P P T is proportional to the square of the rotor speed, and the output power is proportional to the cube of the generator speed ω g , as given by (4).
T M P P T = K o p t ω g 2
Accordingly, the reference value for the active current i q s e is obtained by dividing the torque reference by the generator’s torque constant, as defined in (5), where K t denotes the torque constant of the generator.
i q s e = 1 K t T M P P T

2.2.2. Controller of Grid-Side Converter

The GSC regulates the overall power flow in the system to maintain a constant DC-link voltage [19]. This implies that the output powers of MSC and GSC are balanced. Neglecting the losses in the DC-link capacitor, a constant DC voltage indicates that all power from the MSC is transferred to the grid. The power delivered to the grid can be decomposed into active and reactive components P g and Q g , as expressed in (6) and (7).
P g = 3 2 ( E d e I d e + E q e I q e )
Q g = 3 2 ( E d e I q e + E q e I d e )
In this study, it is assumed that the reactive current I d e is controlled to zero, so that only active power is delivered to the grid. Given the conditions E d e = 0 and E q e = V g , the power transferred to the grid can be expressed as (8), where V g is grid voltage.
P g = 3 2 V g I q e

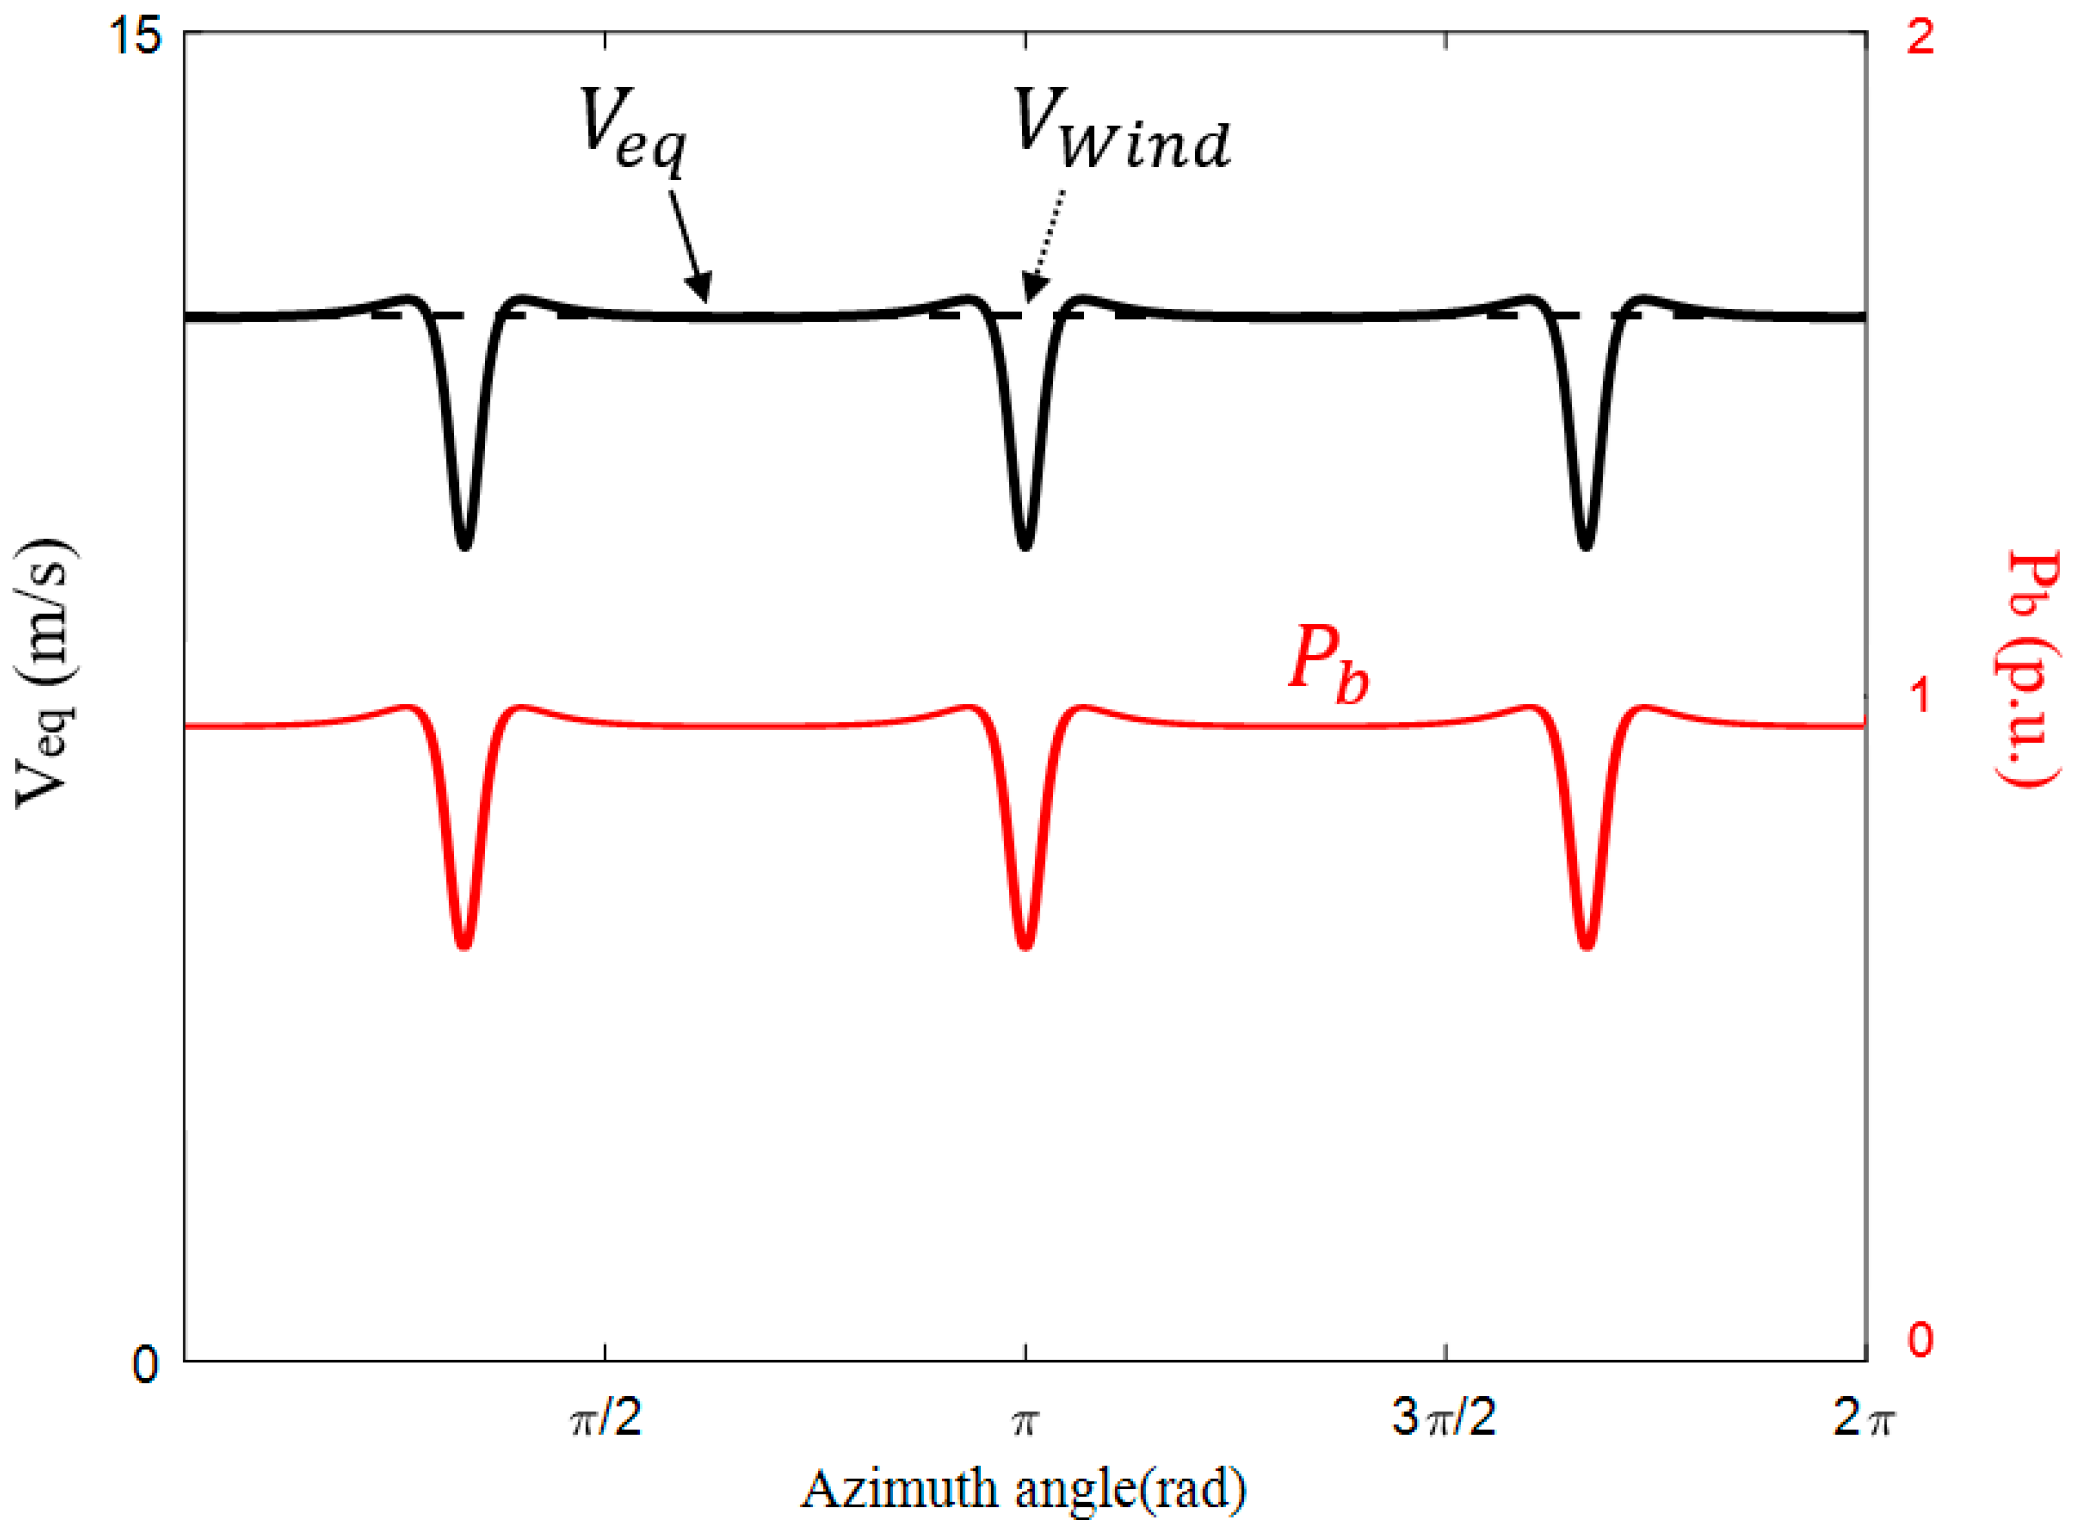
2.3. Modeling and Analysis of Periodic Power Fluctuations

2.3.1. Aerodynamic Aspects of Wind Turbine

Traditionally, wind turbine power output has been estimated based primarily on the mean wind speed at hub height. However, it is evident that the aerodynamic interactions between the incoming wind and turbine blades are inherently complex [20]. As wind turbines continue to scale up in size, the increasing rotor-swept area necessitates a more comprehensive consideration of the various aerodynamic factors that influence energy conversion. Among these, wind shear and tower shadow are two phenomena that inevitably occur due to the structural characteristics of wind turbines and affect the aerodynamic energy transformation process. These effects can be quantitatively modeled by computing the equivalent wind speed experienced by the rotor.
Wind energy generally increases exponentially with altitude, known as wind shear. As the three blades of a wind turbine rotate, each sequentially passes through the lowest and highest points of the rotor plane, resulting in output power pulsations caused by wind shear. These pulsations occur at three times the rotor speed, which is referred to as the 3P frequency component. The equivalent wind speed experienced by a single blade under wind shear can be expressed as in (9) [21].
V W S = R c o s θ + h h α
where θ is the rotational angle of the wind turbine, h is the hub height of the turbine, and α represents the empirical wind shear exponent.
The equivalent wind speed considering the wind shear effect on all three blades can be obtained by averaging the equivalent wind speeds of the individual blades. The variation in the equivalent wind speed received by the turbine due to wind shear, relative to the input wind speed, can be represented by a coefficient as shown in (10).
k W S = V W S 1 + V W S 2 + V W S 3 3
When the wind passes through the tower, the tower of wind turbines disrupts the airflow, decreasing the wind energy captured by the blade—this phenomenon is referred to as the tower shadow effect. Since the turbine has three blades, each blade passes the tower front three times per revolution, resulting in a reduction in blade output power that produces a 3P frequency component. The equivalent wind speed for a single blade affected by the tower shadow effect can be expressed as in (11) [2], where a denotes the tower radius, r is the length of the blade, θ is the rotational angle of the turbine, and x is the distance between the tower and the blade.
V T S E = 1 f o r   π 2 θ < π 2 a 2 ( R 2 s i n θ 2 x 2 ) ( R 2 s i n θ 2 + x 2 ) ^ 2 f o r   π 2 θ < 3 π 2
Similar to the wind shear case, the equivalent wind speed considering tower shadow effects for all three blades can be obtained by averaging the equivalent wind speeds of the individual blades. The wind speed variation caused by the tower shadow effect can be represented by a coefficient, as defined in (12).
k T S E = ( V T S E 1 + V T S E 2 + V T S E 3 ) 3
The equivalent wind speed of the wind turbine, considering both wind shear and tower shadow effects, can be expressed as in (13).
V e q = k W S   k T S E   V W i n d
Figure 2 shows the variation of the equivalent wind speed V e q , actual wind speed at hub height V w i n d , and blade output power P b as a function of the blade’s azimuth angle over one full rotation. Due to the wind shear and tower shadow effects, the wind speed encountered by each blade fluctuates periodically during rotation. These structural characteristics cause periodic dips in V e q , which lead to corresponding reductions in blade power output P b . As shown, both V e q and P b exhibit three clear drops per revolution, corresponding to the so-called 3P frequency component, which is a major source of periodic power fluctuations in wind turbines. This periodic nature highlights the necessity for targeted smoothing strategies in wind turbine control systems.

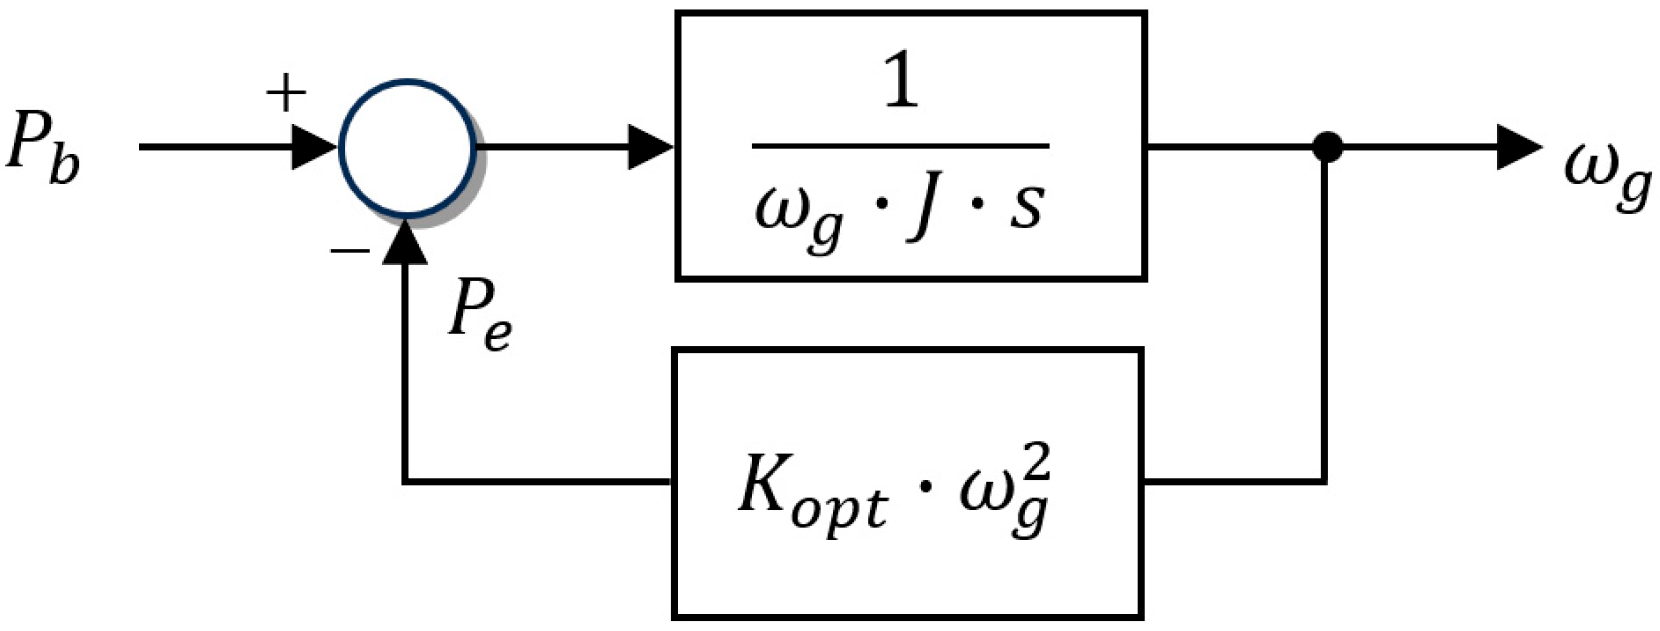
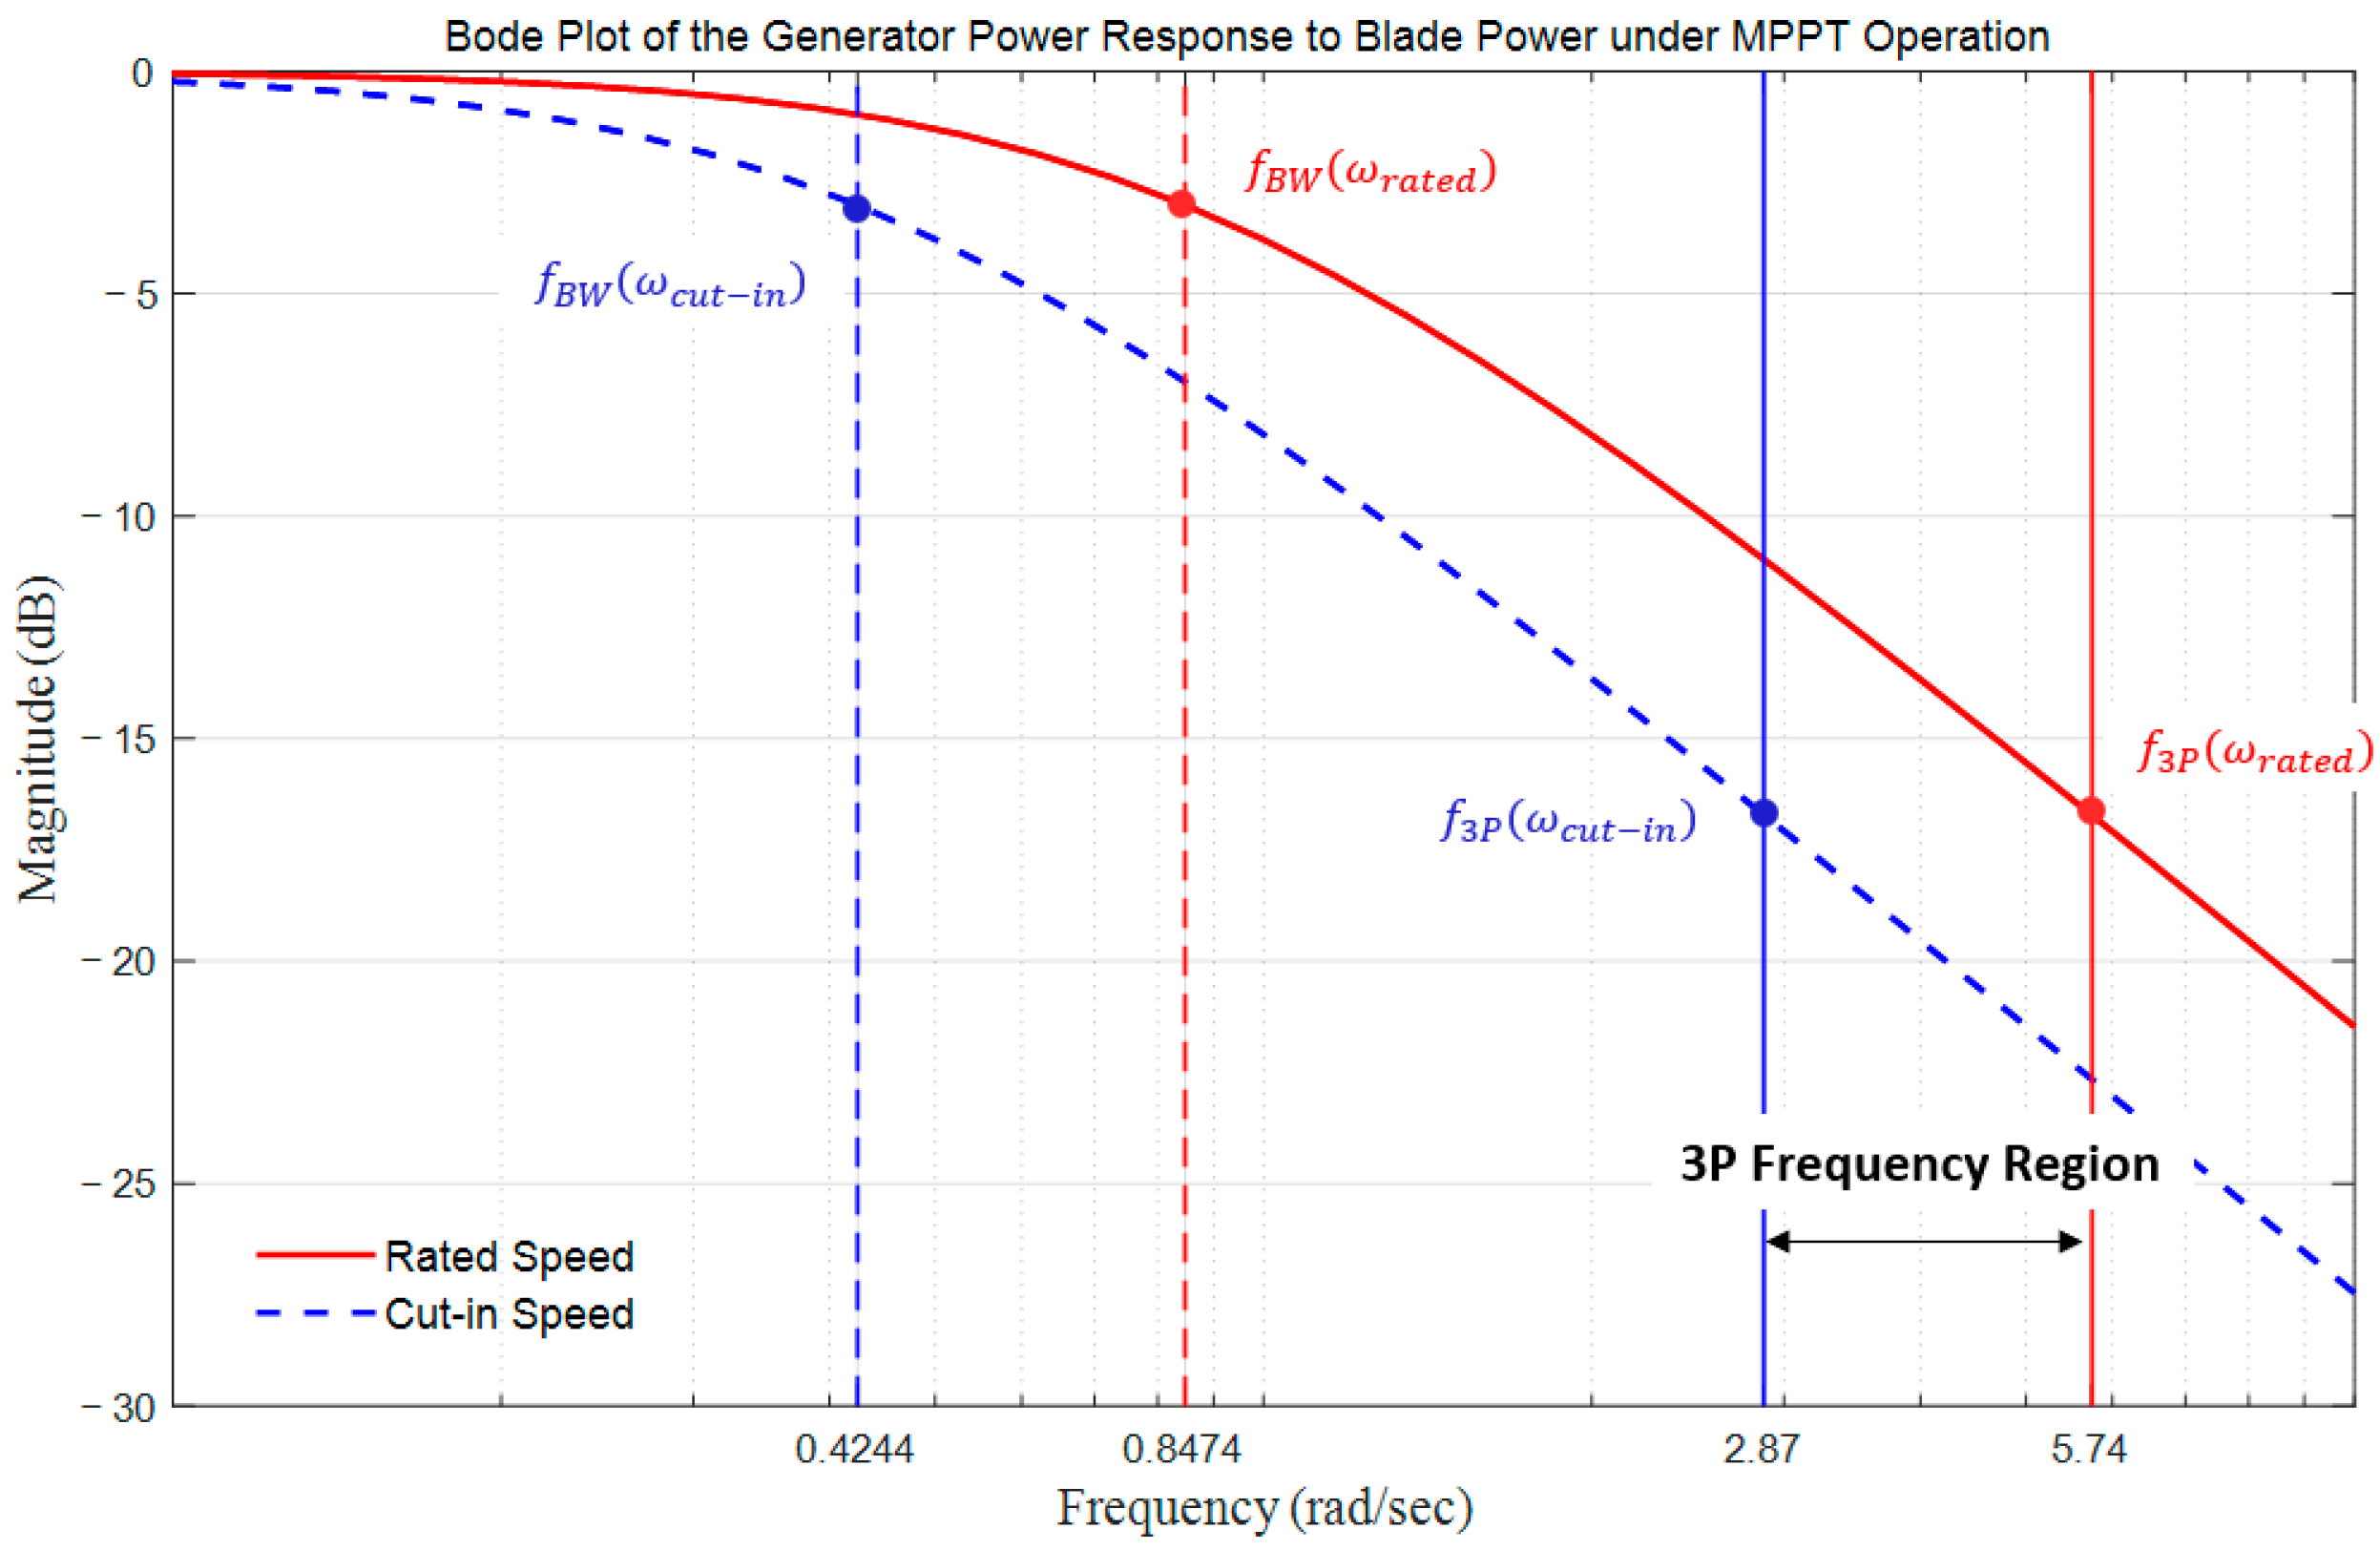
2.3.2. Frequency-Domain Analysis of 3P Oscillations in the MPPT Control System

To assess how 3P oscillations propagate through the system and appear in the generator output, a frequency-domain analysis was conducted. Starting from the block diagram of the MPPT control structure illustrated in Figure 3, the transfer function from blade aerodynamic power P b to generator speed ω g was derived. This derivation incorporates rotor inertia and the MPPT control loop defined in (3), which adjusts generator torque in proportion to the square of the rotational speed.
Based on the dynamic model illustrated in Figure 3, the nonlinear differential equation governing the mechanical dynamics of the wind turbine system is formulated in (14). Here, J denotes the rotational inertia of the generator, ω g is the generator rotational speed, and K o p t is the optimal torque control gain under MPPT operation.
J ω g ˙ ω g = P b P e = P b K o p t ω g 3
For the small-signal analysis, the system is linearized around a steady-state operating point ( P b 0 ,   ω g 0 ), where the rotor speed is constant ( ω g 0 ˙ = 0 ) and the power balance condition P b 0 = K o p t ω g 0 3 holds. Assuming small perturbations from the steady state, the time derivative of the generator speed can be approximated by the first-order Taylor expansion shown in (15), where ω g = ω g 0 + δ ω g and P b = P b 0 + δ P b .
ω g ˙ = f ω g , P b f ω g 0 , P b 0 + f ω g ( ω g ω g 0 ) + f P b ( P b P b 0 )
Applying the perturbation terms ω g = ω g ω g 0 and δ P b = P b P b 0 to the linearized equation, the time derivative of the generator speed ω g ˙ is expressed in terms of the partial derivatives evaluated at the steady-state operating point. This leads to the small-signal dynamic equation shown in (16), which explicitly represents the rotor acceleration as a linear combination of the perturbations in generator speed and blade power.
ω g ˙ = f ω g   δ ω g + f P b   δ P b
By applying a first-order Taylor expansion and evaluating the partial derivatives at the steady-state operating point, the small-signal dynamic equation can be expressed in terms of analytical expressions. Specifically, by computing the partial derivatives of the function f ω g , P b , (17) expressions are obtained.
f ω g = 3 K o p t ω g 0 J   ,   f P b = 1 J ω g 0
Substituting (17) into the linearized Equation (16) gives the small-signal dynamic model as shown in (18).
δ ω g ˙ = 3 K o p t ω g 0 J δ ω g + 1 J ω g 0 δ P b
Taking the Laplace transform under zero initial conditions, the transfer function from the input power fluctuation δ P b ( s ) to the generator speed fluctuation δ ω g ( s ) is derived as (19).
δ ω g ( s ) δ P b ( s ) = 1 J ω g 0 s + 3 K o p t ω g 0 2 = 1 K o p t ω g 0 · 1 s + 3 K o p t ω g 0 / J
Furthermore, to evaluate the dynamic response of the MPPT controller, it is beneficial to consider the cube of the generator speed, since the aerodynamic power is proportional to ω 3 under MPPT. Applying first-order expansion, the small-signal perturbation of the cube of the speed ω 3 is approximated as (20).
δ ω g 3 ( t ) 3 ω g 0 2 · δ ω g ( t )
This leads to (21) from the aerodynamic power input to the generator speed cubed.
δ ω g 3 ( s ) δ P b ( s ) = 3 ω g 0 2 J ω g 0 s + 3 K o p t ω g 0 2 = 1 K m p p t 3 · K m p p t · ω g 0 / J s + 3 · K m p p t · ω g 0 / J
By transposing K m p p t to the left-hand side in Equation (21), δ ω b 3 s has now become δ P e s shown in (22). In this study, we use ω g instead of the fixed operating point ω g 0 in the transfer function expression, as the generator speed is continuously updated in real time through feedback. This dynamic adaptation reflects the instantaneous operating condition rather than a static linearization point. Therefore, replacing ω g 0 with ω g better captures the system behavior under practical MPPT operation.
δ P e ( s ) δ P b ( s ) = 3 · K m p p t · ω g / J s + 3 · K m p p t · ω g / J
Figure 4 illustrates the Bode plot of the derived transfer function from blade power to generator output under MPPT operation. This plot characterizes the inherent low-pass filtering effect of the wind turbine’s mechanical system. The red solid line and blue dashed line represent the system’s frequency response at rated speed and cut-in speed, respectively. As the turbine operates at variable speeds, the actual system response will shift between these two lines. The analysis reveals that the system’s bandwidth is dependent on the generator speed; the bandwidth at rated speed (0.8474 rad/s) is wider than at cut-in speed (0.4244 rad/s). Crucially, at all operating speeds, the 3P frequency components (e.g., 5.74 rad/s at rated speed) lie well outside the system’s pass-band. This demonstrates the significant passive filtering provided by the large rotor inertia, which naturally attenuates a substantial portion of the blade power pulsations.
Quantitatively, the 3P frequency component is attenuated by −16.70 dB, which means that its magnitude is reduced to 14.6% of the original signal. Higher frequency harmonics, such as 6P and 9P, are filtered even more heavily. However, as shown previously in Figure 2, the initial power fluctuation at the blades caused by wind shear and tower shadow is very large. Therefore, despite the significant attenuation from the system’s inertia, this analysis allows us to predict that a residual fluctuation will inevitably be propagated to the generator output. This quantitatively defined residual fluctuation—with its specific frequency characteristics—is precisely the problem that our proposed control strategy is designed to mitigate.

3. Periodic Power Fluctuation Smoothing Controller

The proposed method aims to smooth periodic power fluctuations of a wind turbine caused by wind shear and tower shadow effects by utilizing the rotor inertia and the DC-link capacitor. The power flow in the wind energy system when the proposed method is applied is illustrated in Figure 3. The blade output pulsation, caused by the structural characteristics of the wind turbine, is first attenuated utilizing the rotor’s inertial energy. The smoothed power is then delivered to the capacitor through the generator. Subsequently, secondary smoothing is achieved by varying the DC-link voltage of the back-to-back converter to modulate the electrostatic energy stored in the DC-link capacitor. Section 3.1 and Section 3.2 describe the control strategies for mitigating output fluctuations via the rotor side and the DC-link capacitor, respectively, and compare their maximum energy storage capacities in a normalized form.

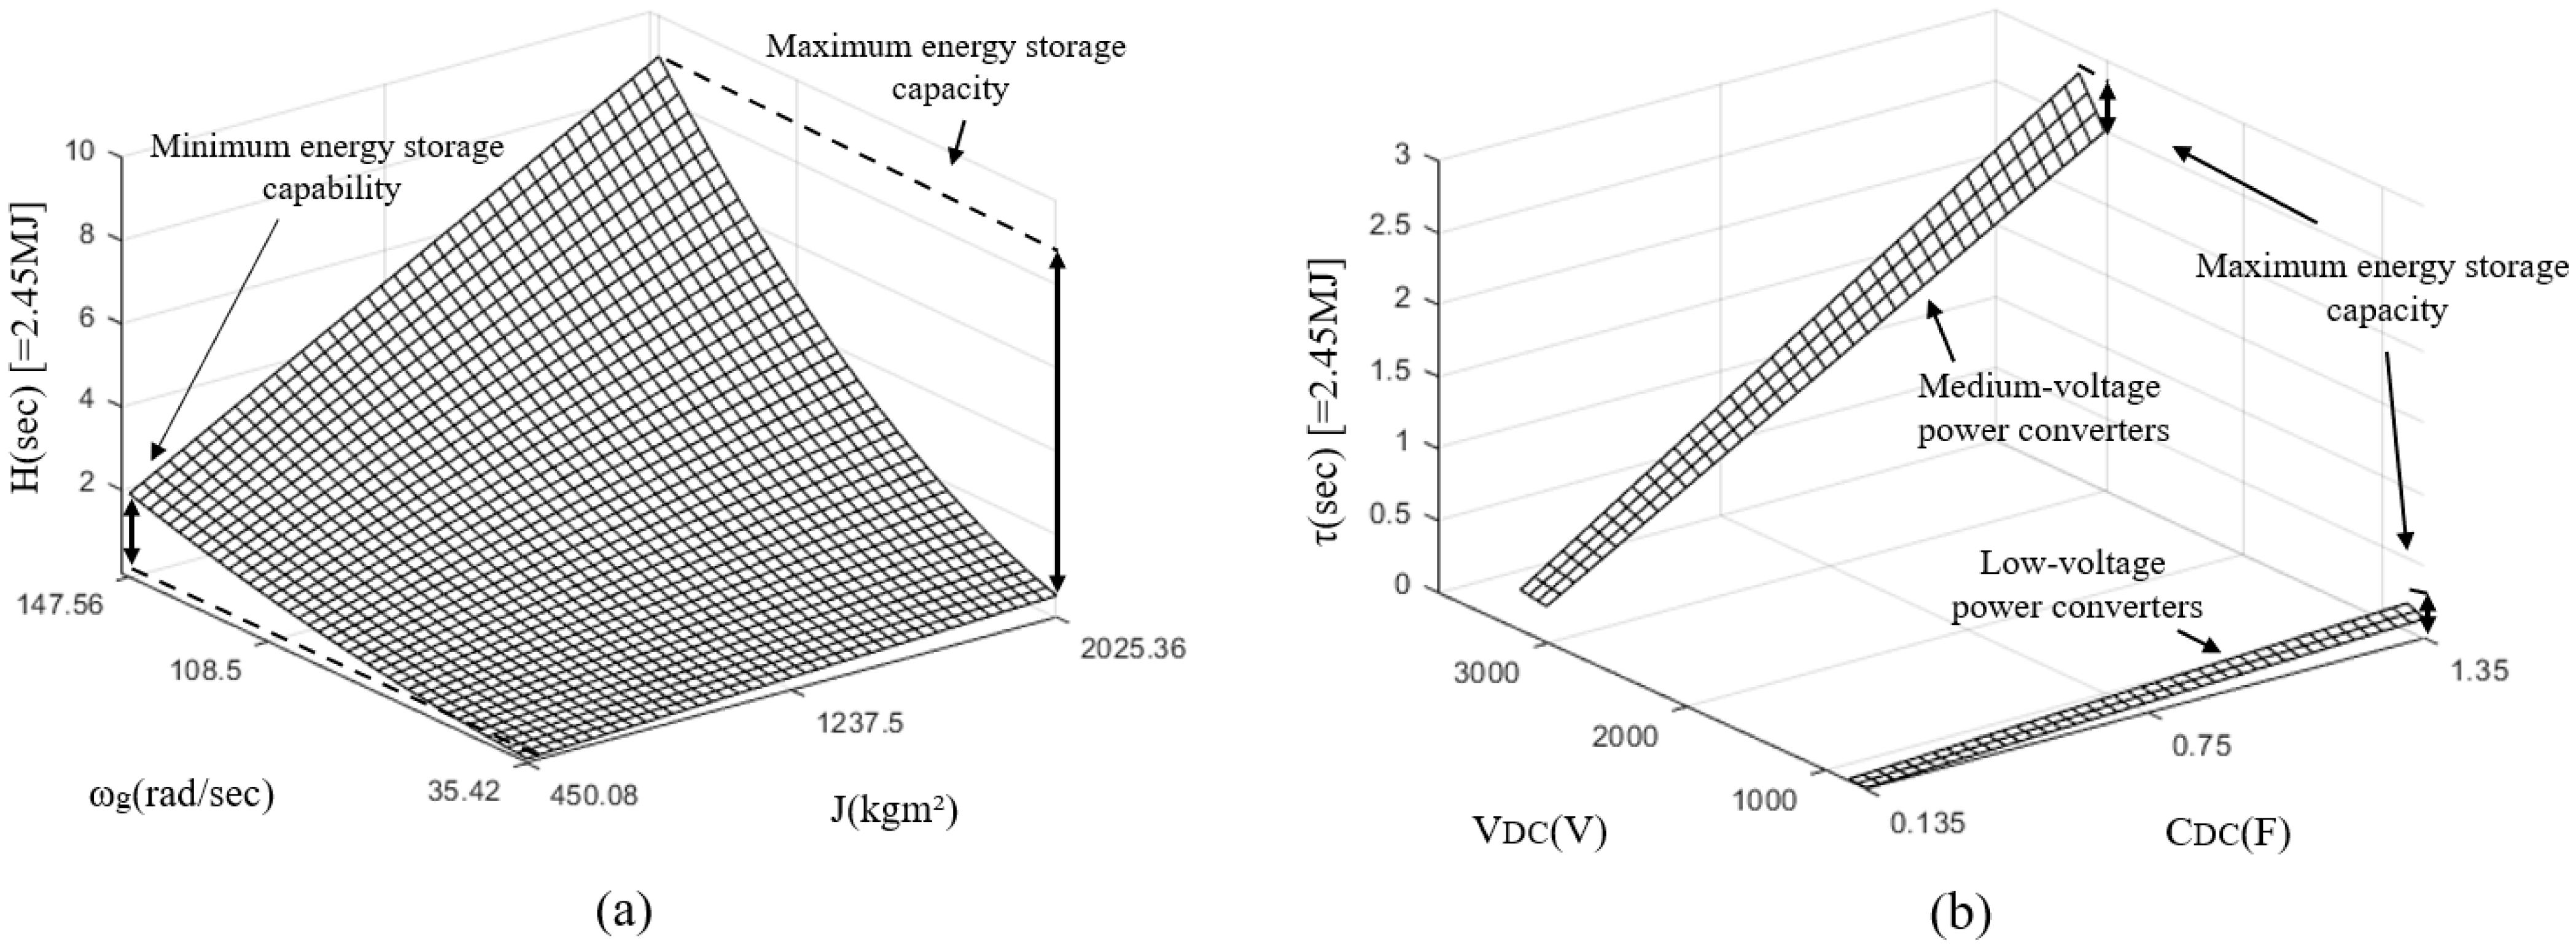
3.1. Energy Storage Analysis for Rotor Inertia and DC-Link Capacitor

The energy capacity that can be stored through blade inertia is limited, and the maximum energy storage capacity of the blade relative to the rated power of the wind turbine can be normalized using the inertia constant H , as shown in (23), where ω m a x is the rated rotor speed. Typically, multi-megawatt wind turbines have inertia constants in the range of 2 to 6 s [22], although some studies consider a wider range of up to 9 s [23]. Since the maximum energy storage capacity is proportional to rotor inertia, turbines with larger inertia exhibit better smoothing capability, while those with smaller inertia show limited performance. If excessive smoothing is imposed on the blade, the turbine’s ability to track the optimal tip speed ratio may degrade. Furthermore, not only does blade efficiency decrease, but frequent speed variations can also increase torque stress on the rotor shaft. Therefore, when the blade inertia is small, the frequency range or magnitude of power smoothing assigned to the rotor should be appropriately limited.
H = E k i n e t i c m a x S r a t e d = 1 2 J ω m a x 2 S r a t e d
Most wind turbine systems operate with low-voltage power converters, generally 690 V, which result in high current demands for multi-megawatt wind turbines. This increases conduction losses and necessitates larger, costlier cables, thereby reducing overall system efficiency. Therefore, medium-voltage power converters with higher DC-link voltages offer significant advantages. Furthermore, it can be seen from Equation (24) that a higher DC-link voltage increases the time constant of the DC-link capacitor. These converters typically feature DC-link voltages up to 3.3 kV [24]. Similar to the blade’s inertia constant, the energy stored in the capacitor τ can be expressed as shown in Equation (24).
τ = E e l e c t r o s t a t i c m a x S r a t e d = 1 2 C V m a x 2 S r a t e d
Figure 5 illustrates the time constant characteristics associated with energy storage in a typical wind turbine system, considering two components: (a) the rotor and (b) the DC-link capacitor. The x-axes in both Figure 5a,b. represent the blade inertia J and the DC-link capacitance C D C , which are determined by the mechanical and electrical design and are generally considered fixed. In contrast, the y-axes represent the generator speed ω g and the DC-link voltage V D C , which are controllable parameters regulated by the back-to-back converter controller. Therefore, with fixed x-axis parameters, the maximum and minimum values along the y-axis define the boundaries of the achievable energy storage capacity.
In Figure 5a, the time constant H represents the energy storage capacity of the rotor inertia. As blade inertia increases, the energy storage capacity also increases, indicating higher smoothing potential. The highlighted region represents the minimum and maximum achievable energy storage ranges. The x-axis values of J were calculated based on the corresponding H values for a 2.45 MW-class wind turbine. Figure 5b shows the time constant τ of the DC-link capacitor. It should be noted that although both H and τ are expressed in units of seconds, they represent fundamentally different physical concepts and operational constraints—mechanical inertia versus electrostatic storage. In this context, the time constants are introduced not to imply physical equivalence but to provide an intuitive, normalized basis for comparing the relative energy-buffering capabilities of each component. The plot includes distinctions between low-voltage and medium-voltage converter designs. Medium-voltage power converters—featuring higher DC-link voltages—enable greater energy storage capability, especially when paired with larger capacitance values. In contrast, conventional low-voltage converters are limited in their ability to store sufficient electrostatic energy, which can constrain their power smoothing performance.
Table 1 summarizes the energy storage capacity, expressed as time constants, for both rotor inertia and DC-link capacitors under different converter configurations. The rotor inertia provides a significantly broader range of energy storage capacity, depending on turbine size and design. In contrast, the DC-link capacitor offers a much shorter energy storage capacity, which is highly dependent on the converter’s voltage level. Low-voltage power converters, commonly used in conventional wind turbine systems, show a limited storage range of approximately 0.005 to 0.05 s. However, this can be significantly extended—up to 0.31s—when medium-voltage power converters are employed, due to their higher allowable DC-link voltages. This comparison highlights the need for differentiated smoothing strategies depending on the available energy storage characteristics of each component. While rotor inertia is suitable for smoothing over a broader frequency spectrum, the DC-link capacitor is effective for attenuating fluctuations within a limited frequency band.

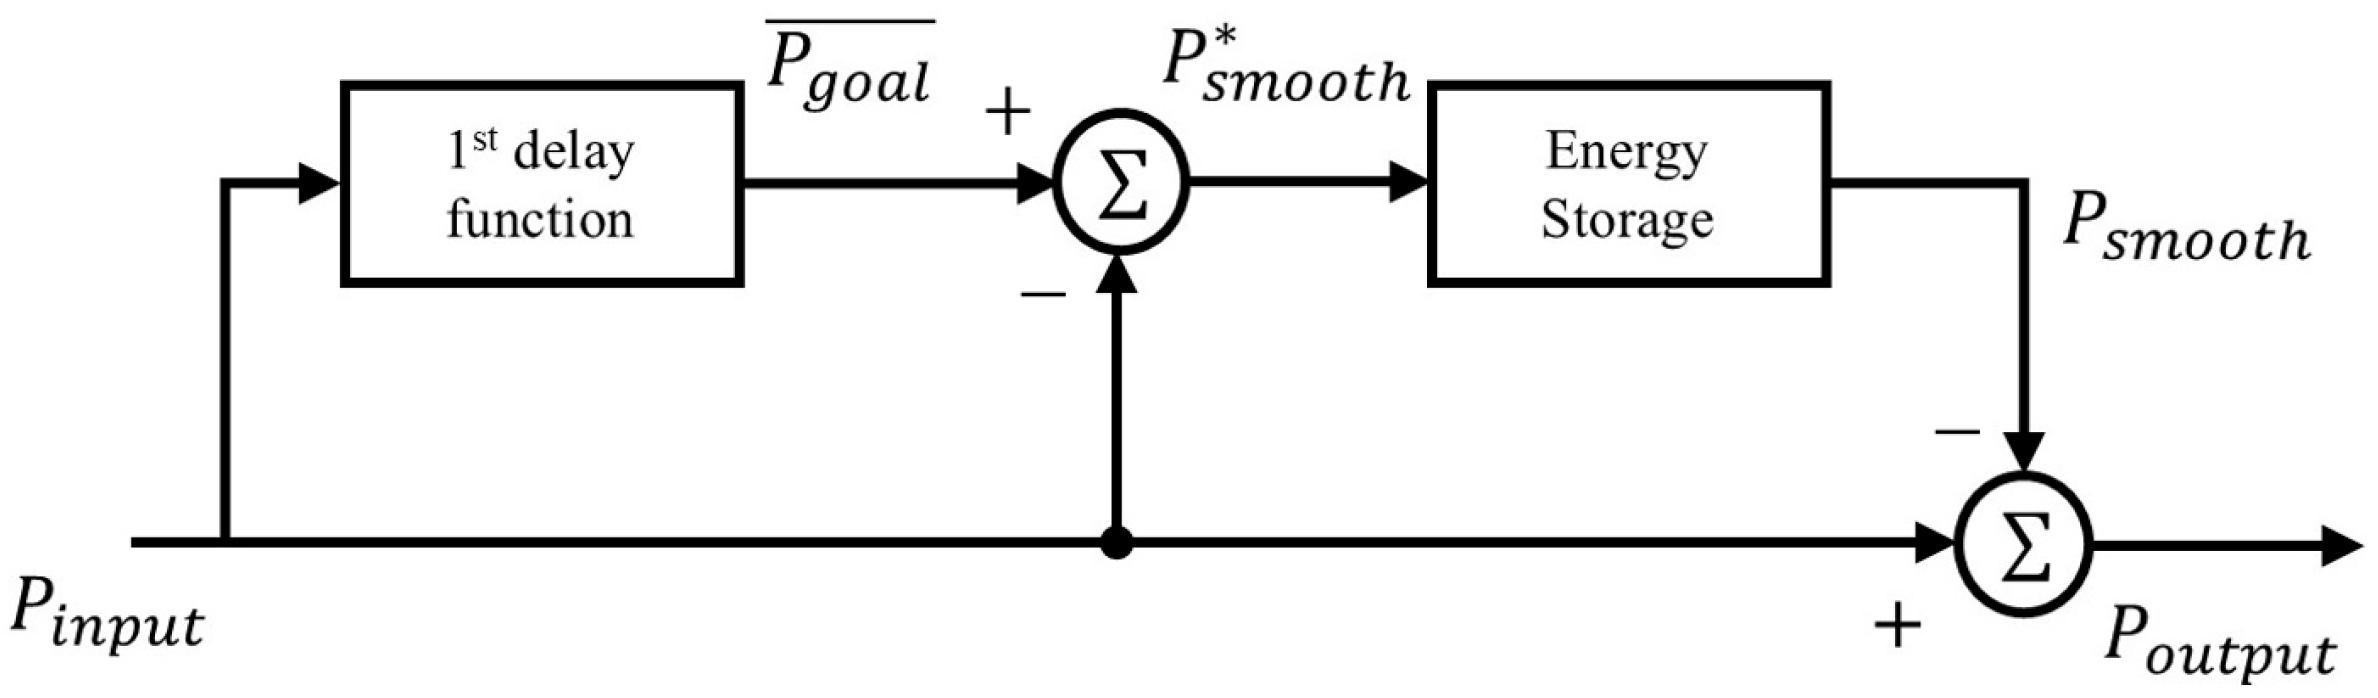
3.2. The Concept of Utilizing ESS Smoothing Method for Power Fluctuation Smoothing Algorithm

This section proposes a power fluctuation smoothing method that utilizes the rotor inertia and DC-link capacitor of a wind turbine, based on the concept of power smoothing algorithms commonly used in ESS. Figure 6 illustrates a representative control structure that adopts a first-order lag model for output power smoothing. First-order lag-based control algorithms are widely employed due to their simplicity and excellent real-time response characteristics. In this study, a moving average filter is adopted as the first-order lag model to design the proposed controller. Typically, both low-pass filter (LPF) and moving average filters are used as first-order smoothing techniques. LPF attenuates high-frequency components above a specified cutoff frequency, reducing output fluctuation. Moving average filters, on the other hand, mitigate fluctuations by averaging the input values over a finite window size, and are widely used in fields such as communication and signal processing. While both methods effectively reduce high-frequency components, LPFs incorporate input values over an infinite time horizon, whereas moving average filters rely solely on a finite set of past inputs [25].
In this study, moving average method is applied. The output fluctuations caused by wind shear and tower shadow effects exhibit a periodic fluctuation, characterized by a 3P frequency component—occurring three times per blade revolution. By setting the window size of the moving average filter to match 3P frequency, the periodic fluctuation can be averaged out, yielding a smoothed output that serves as the power reference. Since the rotational speed in a variable-speed wind turbine varies depending on wind conditions, the proposed power fluctuation smoothing method calculates the 1/3 blade rotation period based on the rotor speed ( ω r ), as defined in Equation (25).
T 3 p = 2 π 3 ω r
Based on the blade’s one-third rotation period T 3 p and the controller’s sampling time T s the window size N 3 P used in the moving average filter is determined as shown in Equation (26). Since T 3 p could not be an integer multiple of T s , the value of N 3 P is computed by applying a floor operation to ensure that it remains an integer. This ensures that the moving average is computed within the bounds of the available dataset, avoiding any overrun in the number of data points by applying the floor function.
N 3 p = T 3 p T s = 2 π 3 ω r T s
Based on the window size calculated in Equation (16), the moving average of the input power at time step k over one-third of a blade revolution can be obtained as shown in Equation (27). By applying a window of size N 3 p , the resulting signal P g o a l ¯ , which is the moving average of P i n p u t , effectively filters out fluctuating components above the 3P frequency, yielding a smoothed power reference.
P g o a l ¯ = 1 N 3 p i = 0 N 3 p 1 P i n p u t [ k i ]
Setting the window size to a multiple of N 3 p can yield a more smoothed output waveform. However, this increases the smoothing burden on both the blade inertia and the DC-link capacitor. Consequently, the wind turbine may operate further away from the MPPT condition, and the controller’s computational load increases. Therefore, selecting a window size equal to N 3 p represents a reasonable trade-off between power fluctuation mitigation and controller implementation complexity.

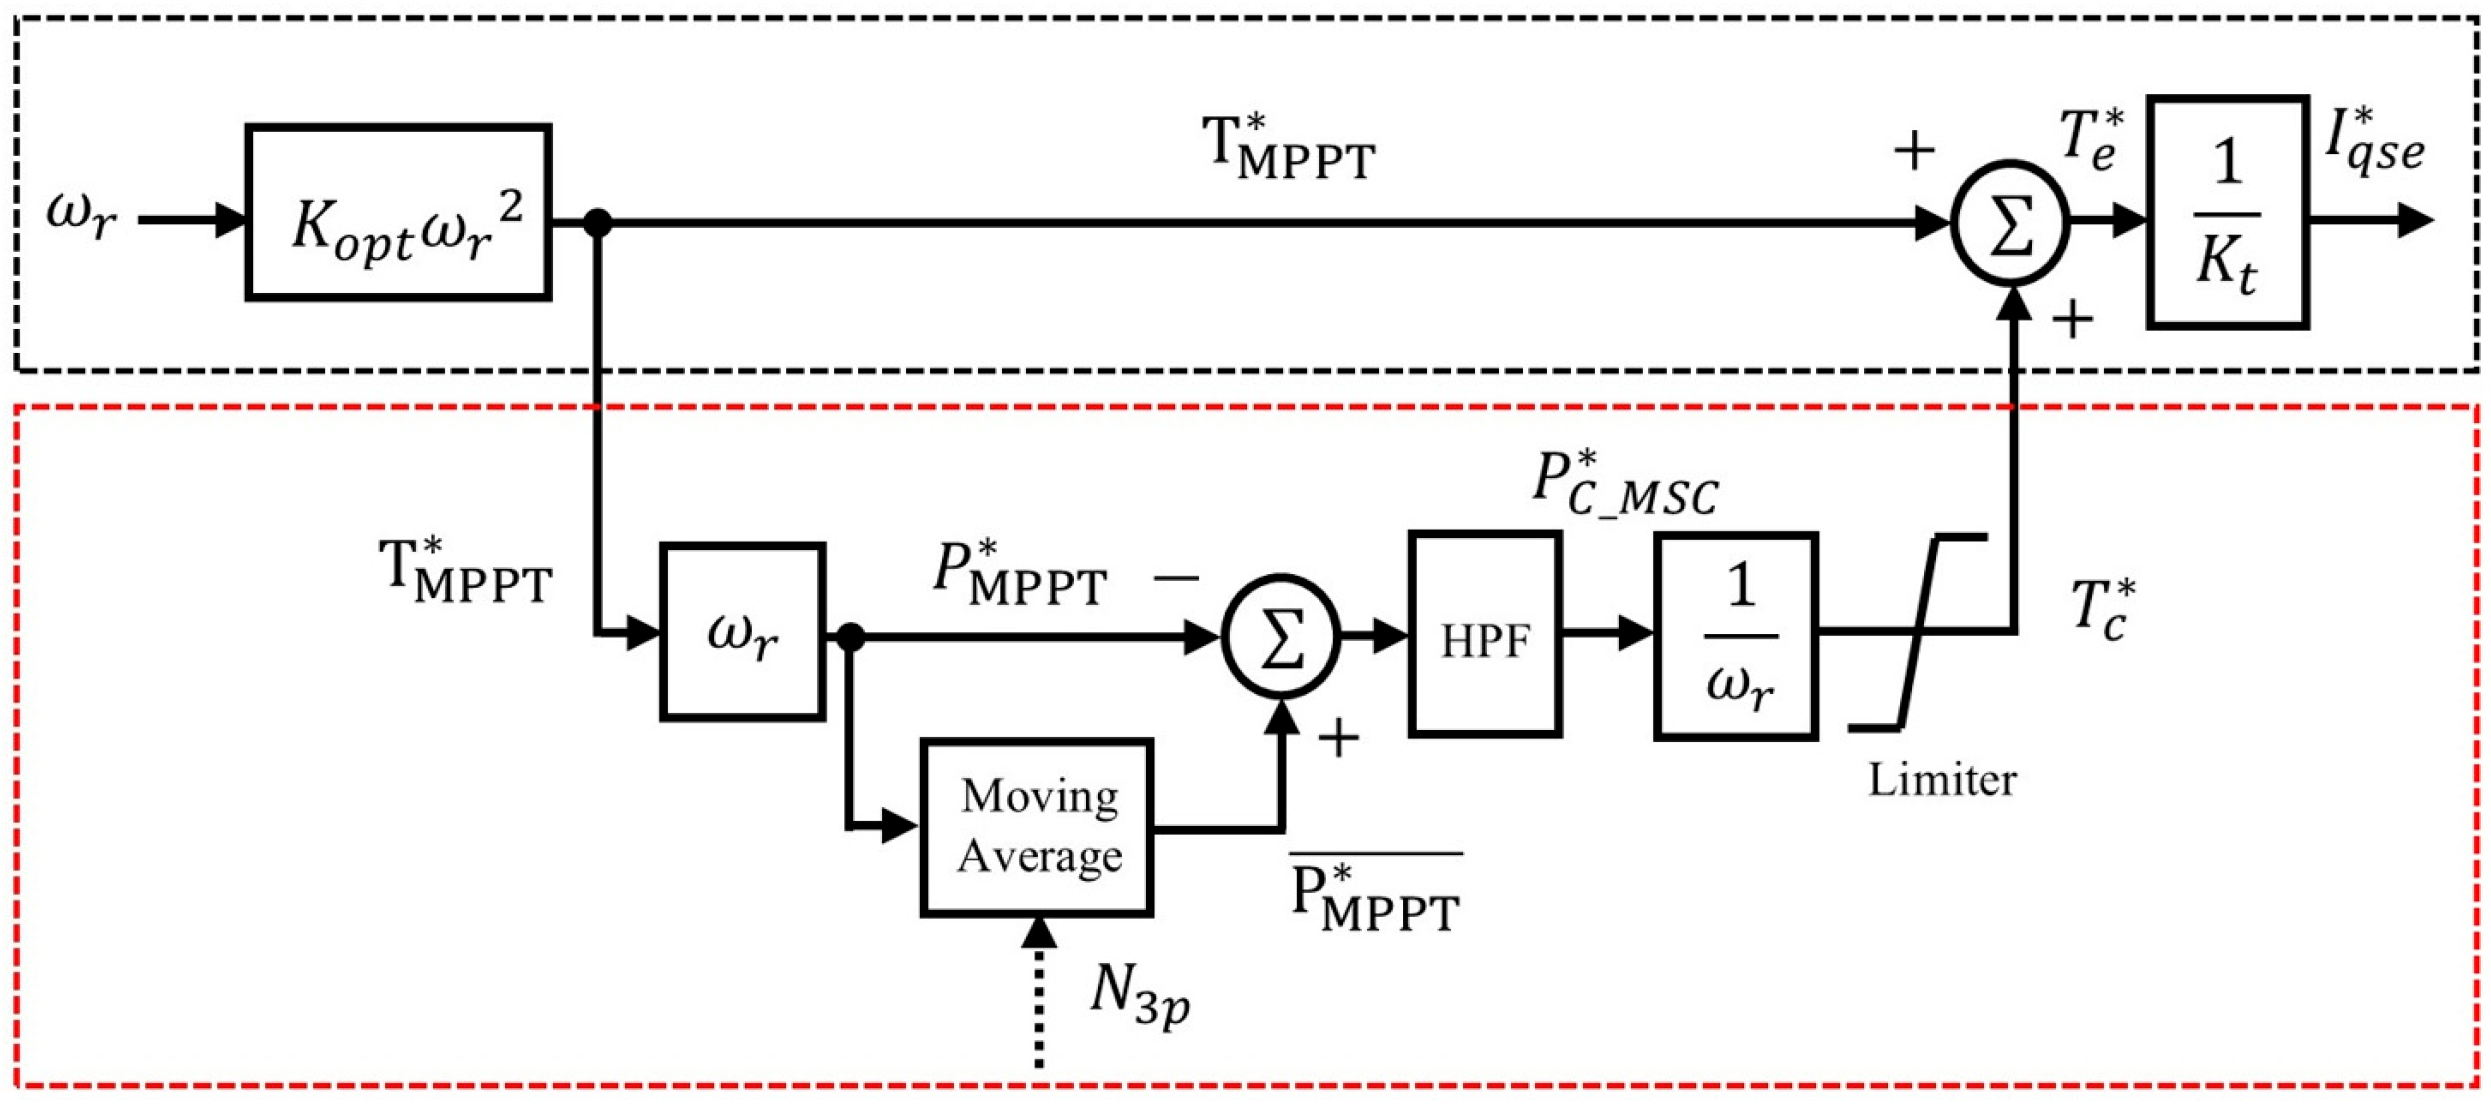
3.2.1. Periodic Power Fluctuation Smoothing Control of Machine-Side Controller (MSC)

As described in Section 2.2.1, the torque reference under MPPT control takes the form shown in Figure 7a. This conventional MPPT strategy does not suppress periodic power fluctuations, and therefore the output power delivered to the DC-link capacitor contains a 3P frequency component. Figure 7b illustrates a traditional approach for suppressing the 3P component, in which a notch filter is applied to the rotor speed ω r to eliminate the 3P band. This method attenuates the 3P components in the torque and power references of the MSC, thereby mitigating 3P frequency fluctuation in the output power to the DC-link. However, the mitigation effect is limited outside the narrow bandwidth of the notch filter.
As shown in Figure 8, the generator output power P M P P T under MPPT control is calculated by multiplying the torque reference T M P P T by the generator speed ω r . Since the output is proportional to the cube of the rotor speed, it inherently includes a 3P frequency component caused by wind shear and tower shadow effects.
In the proposed method, a moving average P M P P T ¯ over one-third of a rotor revolution is used to compute a smoothed power reference that filters out the periodic fluctuation. The difference between the instantaneous generator output power and the smoothed reference represents the power fluctuation component. This component is converted into a power compensation term T c by dividing it by the generator speed ω r and is added to the MPPT torque reference to mitigate the power fluctuation. As expressed in Equation (28), the energy difference between the blade output power and generator output power is either stored in or released from the blade’s rotational kinetic energy.
E b l a d e = 1 2 J ω r 2 = ( P b l a d e P e )   d t
Unlike large-scale ESS, the blade has a limited energy storage capacity. Therefore, in the proposed method, the fluctuation components assigned to the blade are restricted to high-frequency regions above the 3P frequency. To implement this, a high-pass filter (HPF) was used, with its cutoff frequency set to 0.2236 times the 3P frequency. Note that the 3P frequency is a variable quantity that changes with the rotor rotational speed. As a result of setting the HPF cutoff frequency to 0.2236 times the rotor speed-dependent 3P frequency, the rotor inertia is utilized to mitigate only the high-frequency portion of the power fluctuations, with the 3P component being attenuated by approximately 95%.

3.2.2. Periodic Power Fluctuation Smoothing Control of GSC

The GSC regulates the DC-link voltage to control the energy stored in the capacitor, thereby mitigating output power fluctuations. Figure 9 illustrates the proposed output power smoothing algorithm using the DC-link capacitor. The output power delivered from the capacitor to the grid can be expressed, as shown in Equation (8), as the product of the grid voltage V g and the GSC-side active current I q e .
The input power from the generator can be obtained by multiplying the torque reference of the MSC with the rotor speed ω r over one-third of a rotor revolution. As described in Section 3.2, a moving average is applied to the input power to calculate its fluctuating component. The difference between the instantaneous input power and its moving average is considered the power fluctuation component. The proposed GSC control method mitigates this fluctuation by appropriately adjusting the voltage reference. The rate of change in the energy stored in the DC-link capacitor due to this voltage adjustment is given by Equation (29), and the required voltage variation is expressed in Equation (30) [18], where C D C is the DC-link capacitance, P M S C ¯ is the moving average of P M S C , and V C _ G S C is the reference of the DC-link voltage.
E c a p = 1 2 C D C V D C 2 = ( P e P g )   d t
V C _ G S C = t 0 t 1 ( P M S C P M S C ¯ ) d t C D C   V D C
Unlike the MSC-side smoothing strategy, the square of the DC-link voltage, which is the control target of the GSC, represents the energy stored in the capacitor. To achieve the desired level of power fluctuation mitigation, variations in V D C due to power exchange with the capacitor must be considered. The smoothing method using the DC-link capacitor has the advantage of not interfering with MPPT control, and it benefits from a very fast dynamic response. However, unlike rotor speed, the allowable range of V D C must be constrained due to grid voltage levels and semiconductor device ratings. In this study, the nominal DC-link voltage is set to 2000 V and allowed to vary within ±50 V (0.025 p.u.). As a result, the voltage variation range of the DC-link capacitor is limited, which in turn constrains the energy storage capacity available to the GSC and reduces its power smoothing capability. To address this, a band-pass filter is applied to the computed power fluctuation component so that the DC-link capacitor only smooths the fluctuation within the 3P frequency band. This ensures that the smoothing operation is confined to a frequency range manageable by the GSC, thereby enabling efficient use of the limited energy storage capacity.

4. Controller Verifying Simulation Through MATLAB/Simulink

In this section, the dynamic response and stability of the proposed control algorithm are verified through a 2.45 MW PMSG-based wind turbine model built up on the simulation platform MATLAB/Simulink. The system parameters for the wind turbine and the PMSG are shown in Table 2. In this work, constant wind speed condition and time-varying wind with turbulence condition are considered for the simulation scenarios. The proposed control method is compared with the conventional MPPT controller and a 3P-notch filter-based control scheme. The key parameters in MATLAB/Simulink simulation are shown in Table 2. For this study, an inertia constant of H = 2 s was chosen. This corresponds to the lower end of the typical range for multi-megawatt wind turbines [23,24] and represents the most severe condition for analyzing power fluctuations. A lower H results in weaker passive filtering, allowing the largest magnitude of power fluctuations from wind shear and tower shadow to propagate through the drivetrain.

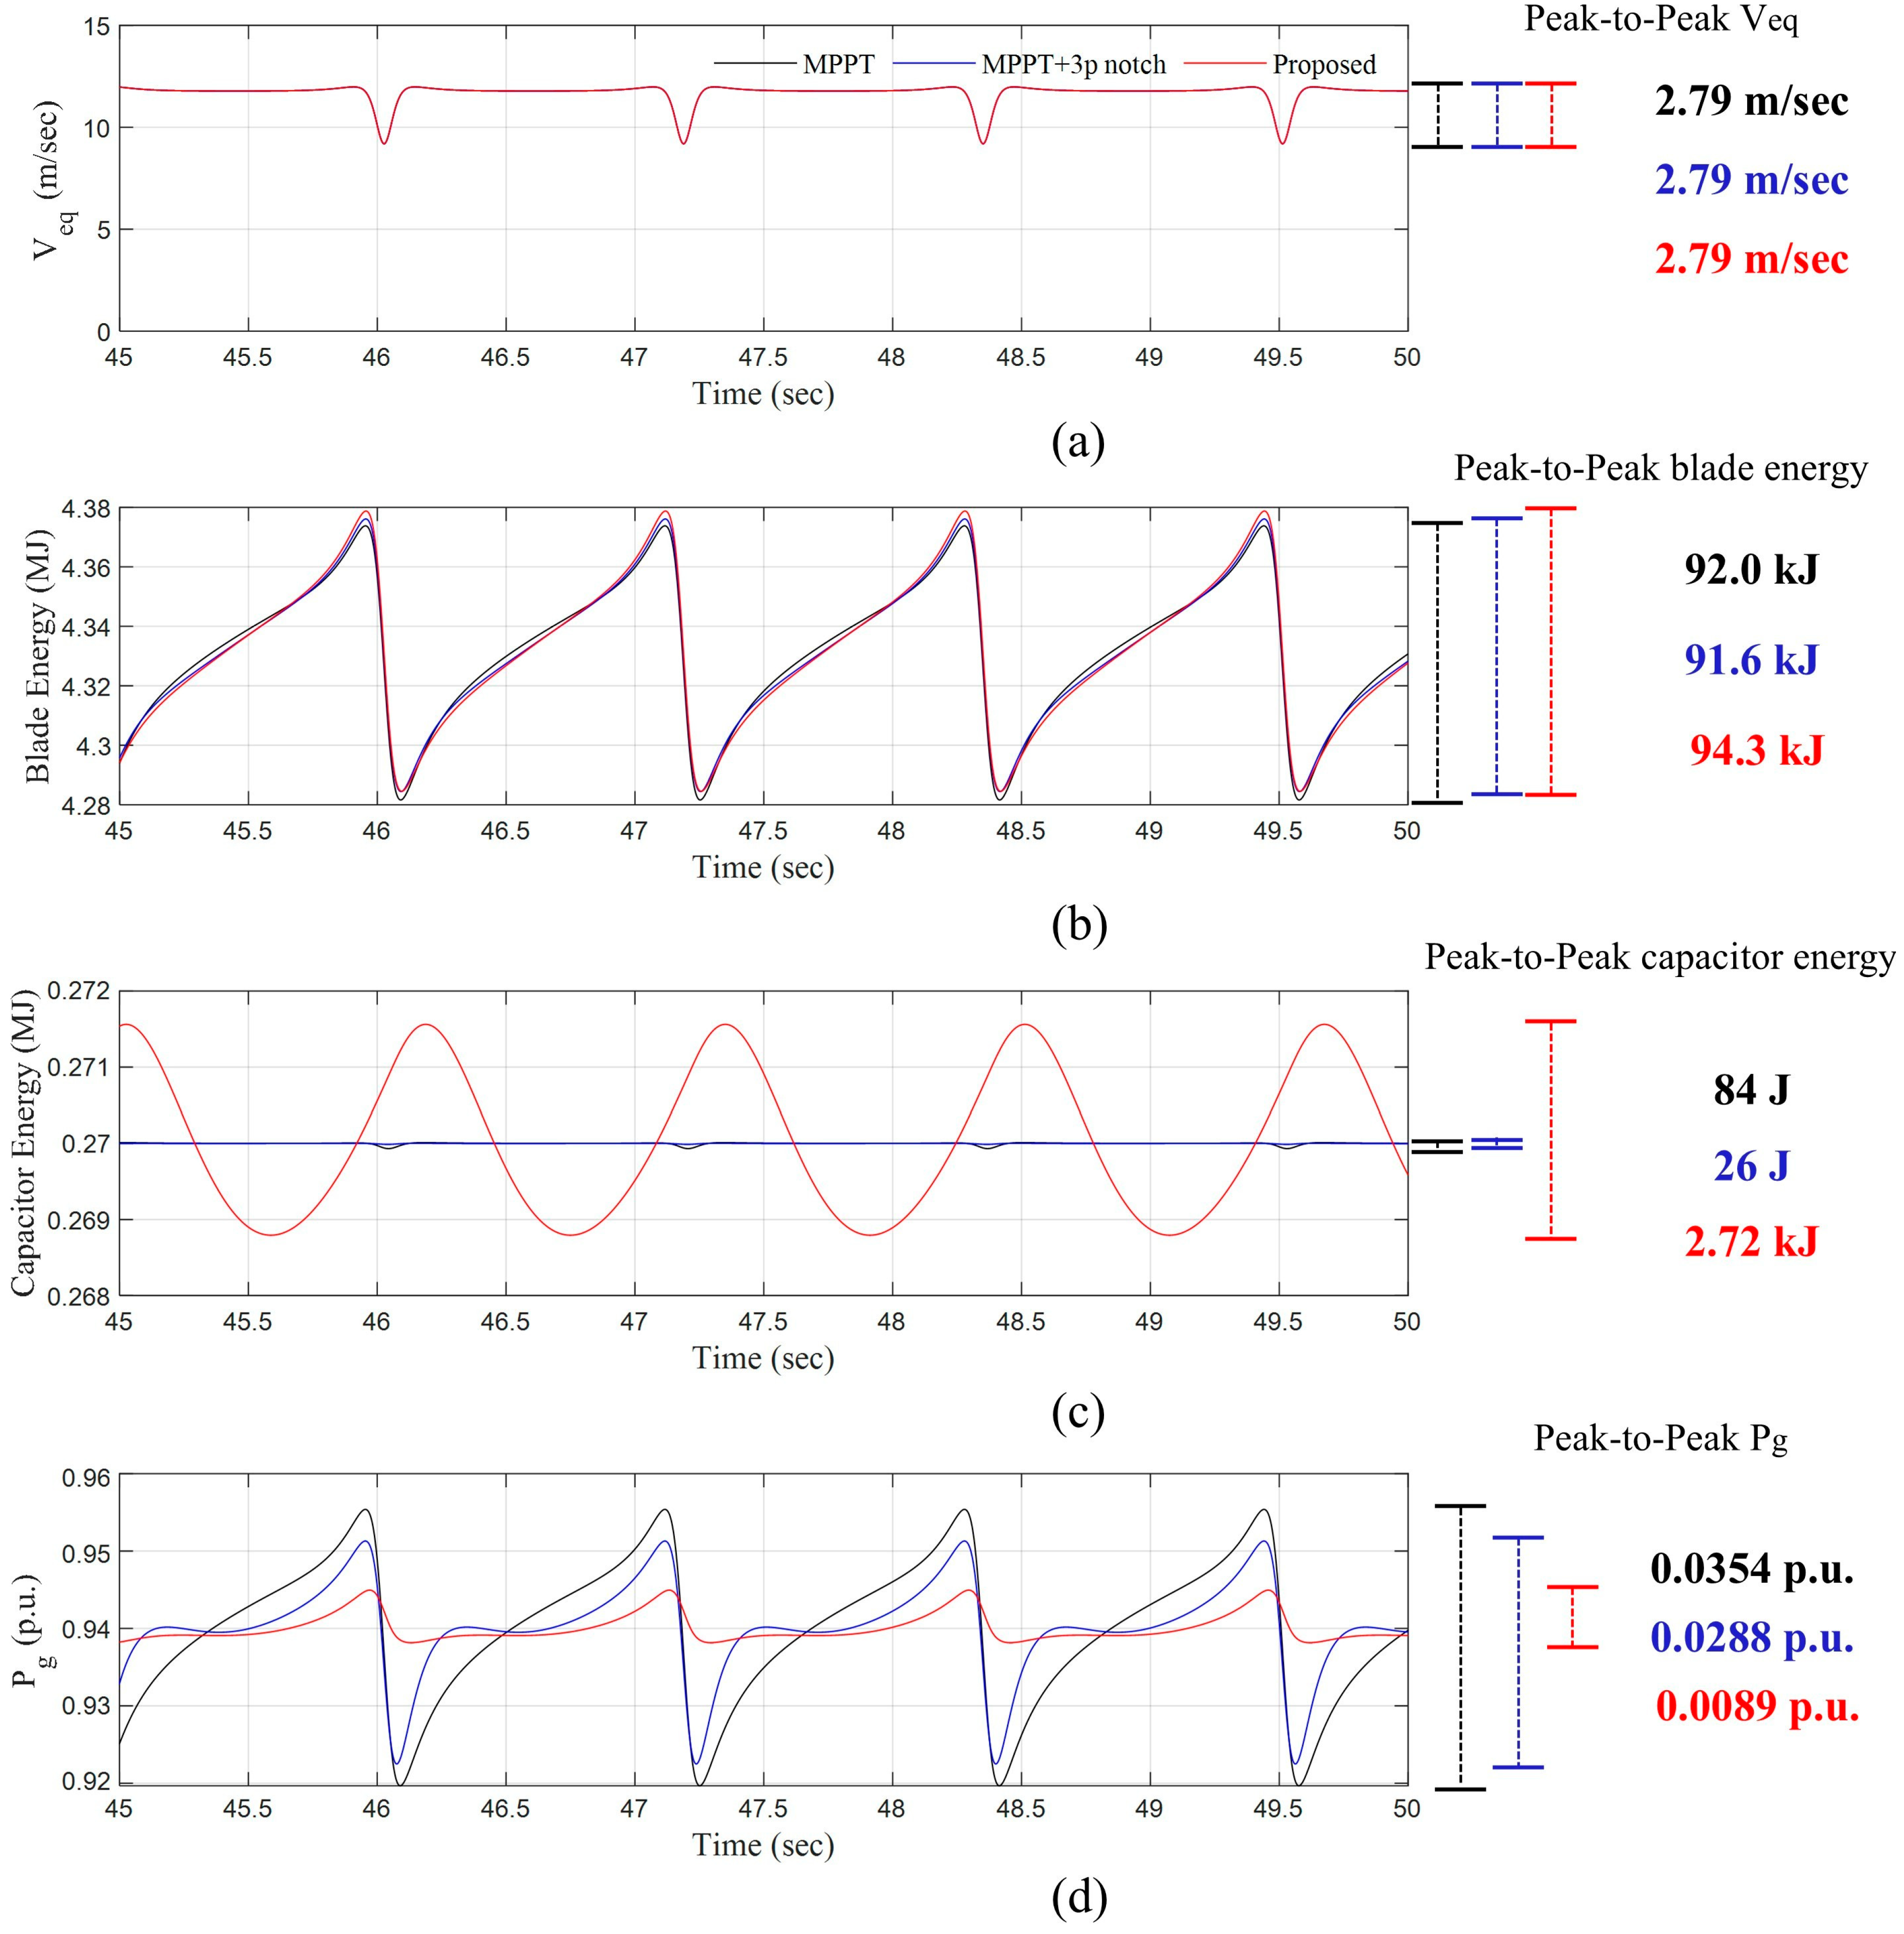
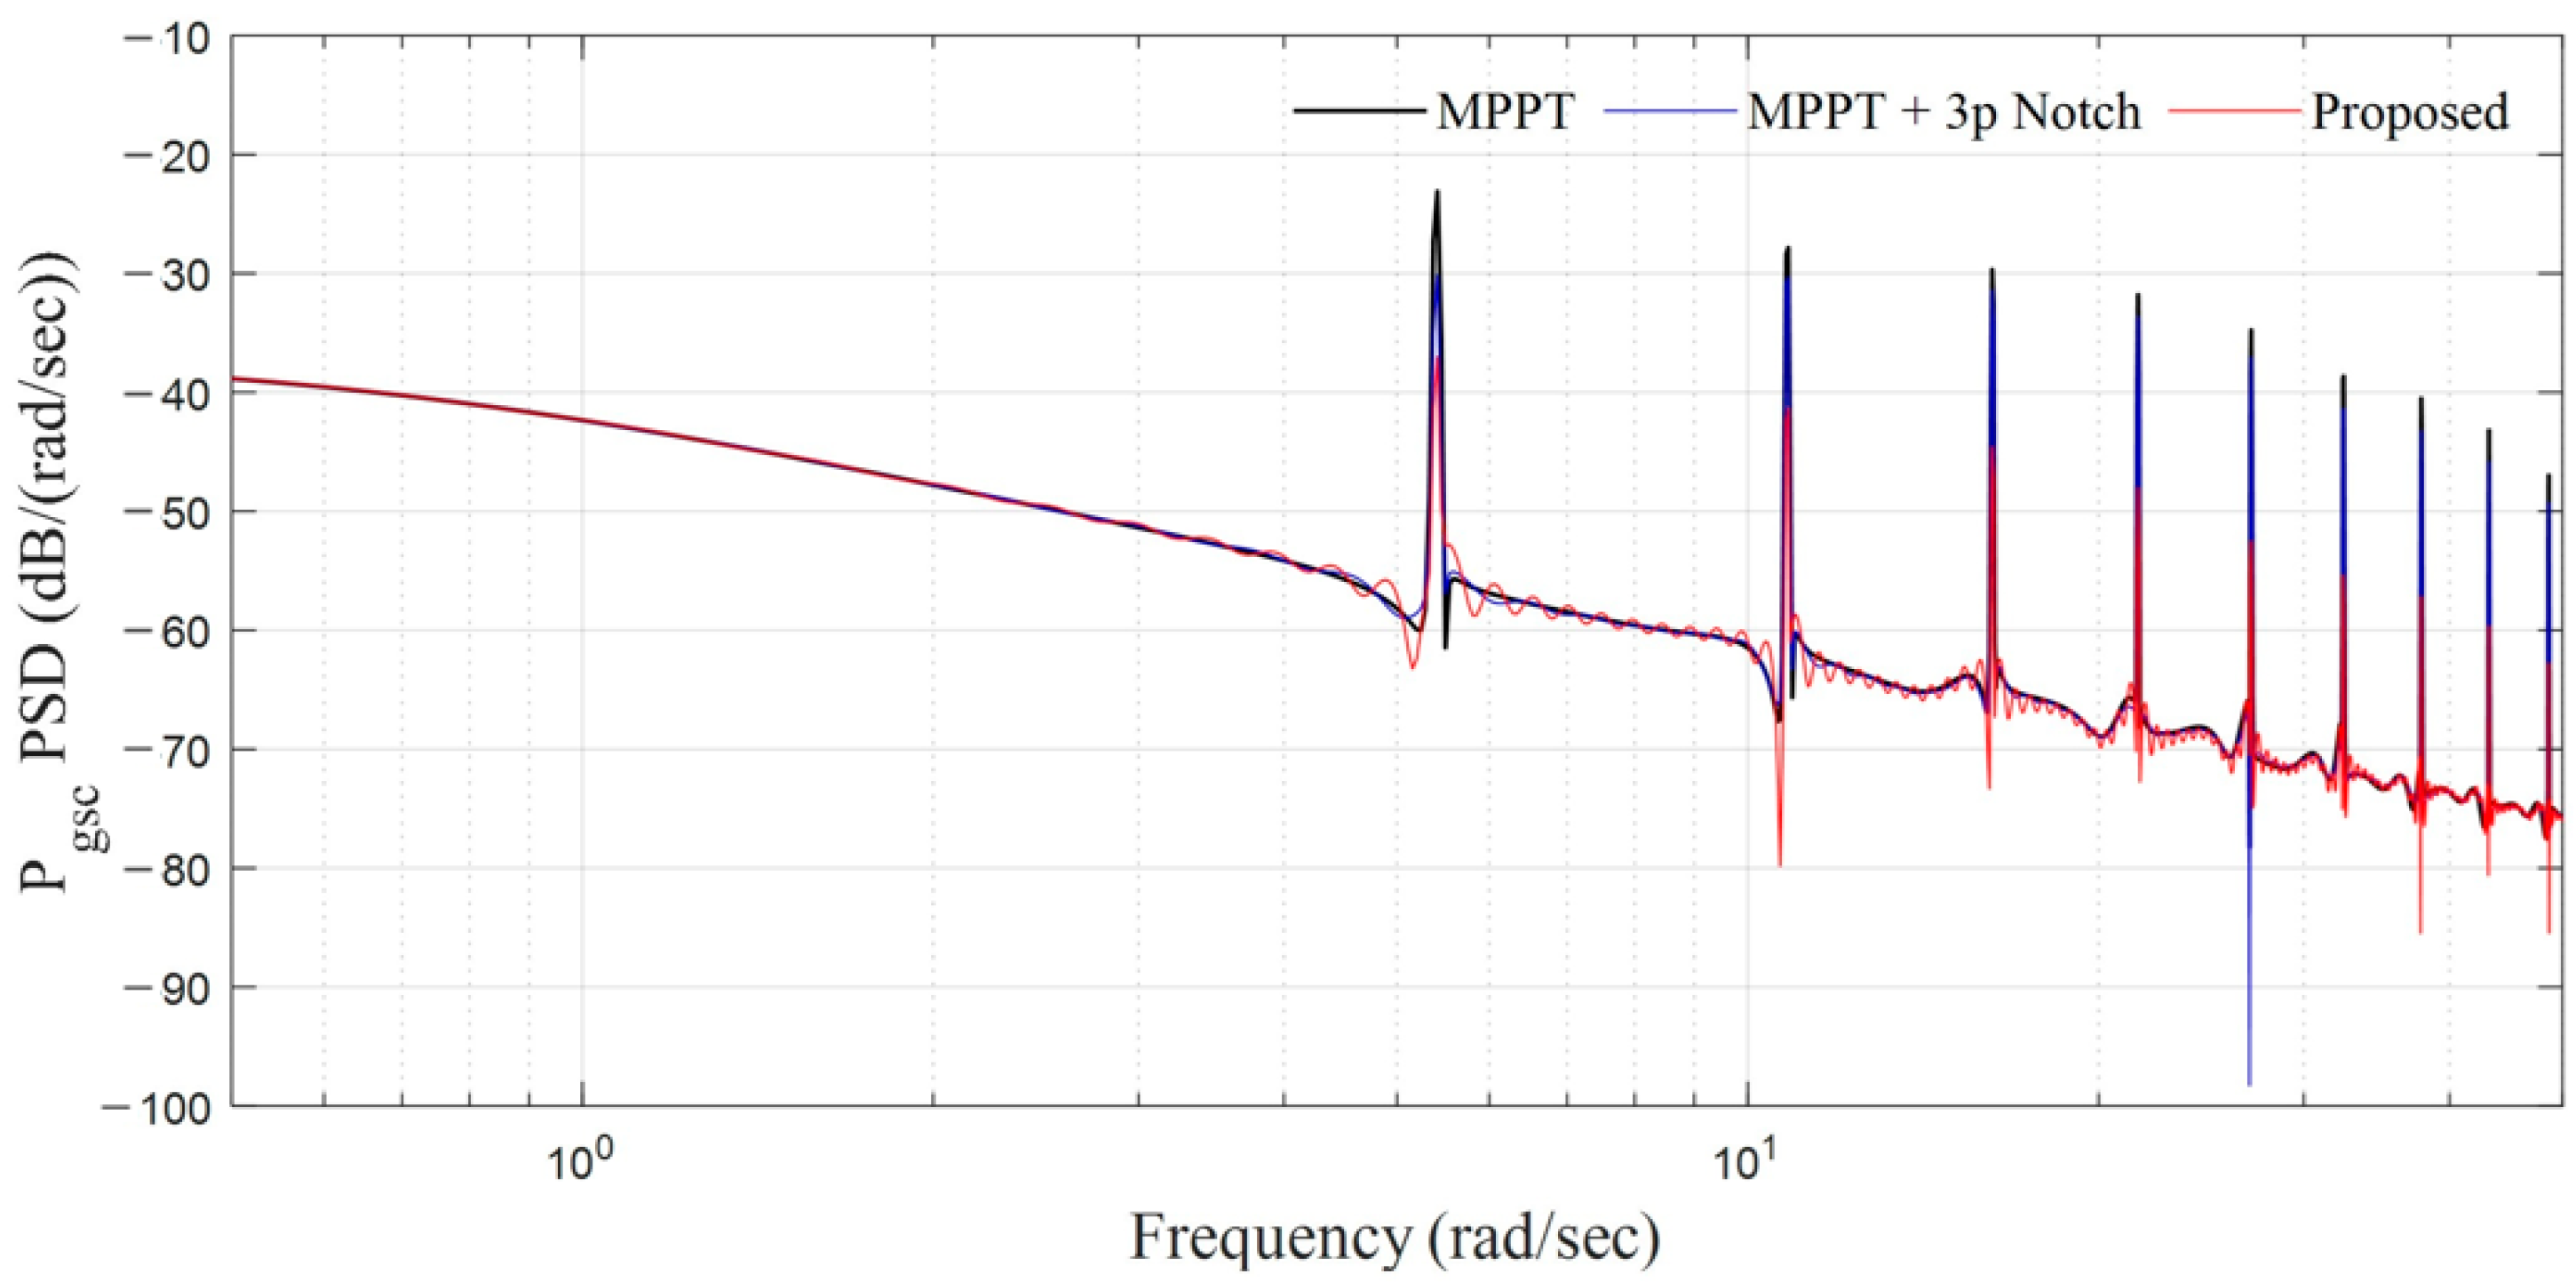
4.1. Case 1: Average Wind Velocity = 12 m/s Constant Wind Speed Condition

As shown in Figure 10, Case 1 considers a constant wind speed of 12 m/s, under which the PMSG operates near its rated speed. This scenario is used to validate the dynamic response of the controller, and it represents a condition where output power fluctuations are most significant due to wind shear and tower shadow effects. In all three methods, MPPT, MPPT with 3P-notch filter, and the proposed method, the equivalent wind speed momentarily drops from 12 m/s to 9 m/s due to periodic aerodynamic disturbances. However, since the rotor speed remains nearly identical across all cases, the differences in equivalent wind speed are not easily distinguishable from visual inspection alone. The energy stored in the rotor blades is also depicted in Figure 10. Just before the sudden drop in the equivalent wind speed, there is a slight increase. During this period, unlike the other methods, the proposed approach stores the surplus energy as rotational kinetic energy in order to maintain a steady output power. As a result, the energy stored in the blades is higher in the proposed method than in the other cases. Furthermore, when the equivalent wind speed sharply decreases due to the 3P fluctuation, the proposed method releases the stored kinetic energy to help sustain a stable output. The energy stored in the DC-link capacitor is also illustrated in Figure 10. In the MPPT and MPPT with 3P notch filter methods, the DC-link voltage remains fixed, resulting in a constant energy level without any power smoothing effect. In contrast, with the proposed control strategy, the DC-link voltage varies dynamically in response to changes in PMSG output power, leading to corresponding fluctuations in the stored energy. The energy stored in the DC-link capacitor can also be observed in Figure 10. In the MPPT method, without any power smoothing, the output drops by more than 0.03 p.u. with a very steep slope. The MPPT with the 3P-notch filter method reduces the fluctuation to approximately 0.03 p.u. but still shows a sharp decline. In contrast, the proposed method—despite using the same bandwidth for the current and voltage controller—reduces the power fluctuation to within 0.01 p.u. and significantly flattens the slope of the power drop. This demonstrates that the periodic output power fluctuation has been effectively mitigated.
Figure 11 shows the power spectral density (PSD) of the output power under three control strategies: conventional MPPT, MPPT with 3P-notch filter, and the proposed method. The power spectral density (PSD) is used to analyze the frequency components of the output power, providing insight into how different frequencies contribute to power fluctuations. By employing the PSD, it becomes possible to quantitatively evaluate the effectiveness of the proposed control strategies in suppressing specific frequency components, such as the 3P harmonic and its multiples, which are associated with periodic power fluctuations caused by wind shear and tower shadow effects.
The MPPT method exhibits dominant harmonic peaks at the 3P frequency and its higher-order multiples (6P, 9P, etc.), indicating strong periodic power fluctuations caused by structural wind disturbances such as wind shear and tower shadow effects. The MPPT with 3P-notch filter methods significantly attenuates the 3P component, but the suppression effect on higher-order harmonics is limited. In contrast, the proposed method not only mitigates the 3P component but also effectively suppresses higher-frequency harmonics such as 6P and 9P, leading to a more broadband smoothing effect.
Table 3 provides a quantitative summary of the results presented in Figure 11. The MPPT with 3P-notch filter method demonstrates an additional attenuation of approximately 7–9 dB compared to MPPT across all frequency components. However, this method primarily targets the 3P component, and its suppression effect on higher-order harmonics such as 6P, 9P, and 12P remains limited. In contrast, the proposed method exhibits a significantly higher attenuation effect across all harmonic components (3P, 6P, 9P, and 12P) compared to both MPPT and the MPPT with 3P-notch filter method, achieving an improvement of 14 dB at the 3P component relative to MPPT.
Figure 12 shows the peak-to-peak power variation under constant wind speed conditions, ranging from 5 m/s to 12 m/s. Figure 12a shows the blade power, while Figure 12b presents the resulting fluctuation at the grid-side output power. It should be noted that the y-axis scales differ between Figure 12a,b. In both subplots, the magnitude of the power variation is observed to increase in proportion to the cube of the wind speed. A comparison between Figure 12a,b confirms that a residual fluctuation persists at the output even under conventional MPPT control.
Furthermore, the grid-side output power is attenuated by a factor of approximately 10 across all wind speeds compared to the initial blade power fluctuation. This significant overall attenuation can be explained by the frequency-dependent filtering characteristics shown in Figure 4. While the 3P component alone is attenuated by −16.7 dB (to 14.6% of its original magnitude), the total fluctuation also includes higher-frequency harmonics (e.g., 6P, 9P), which are attenuated even more heavily. Therefore, the composite peak-to-peak fluctuation experiences a greater overall reduction than the 3P component alone, which is consistent with the observed tenfold attenuation.

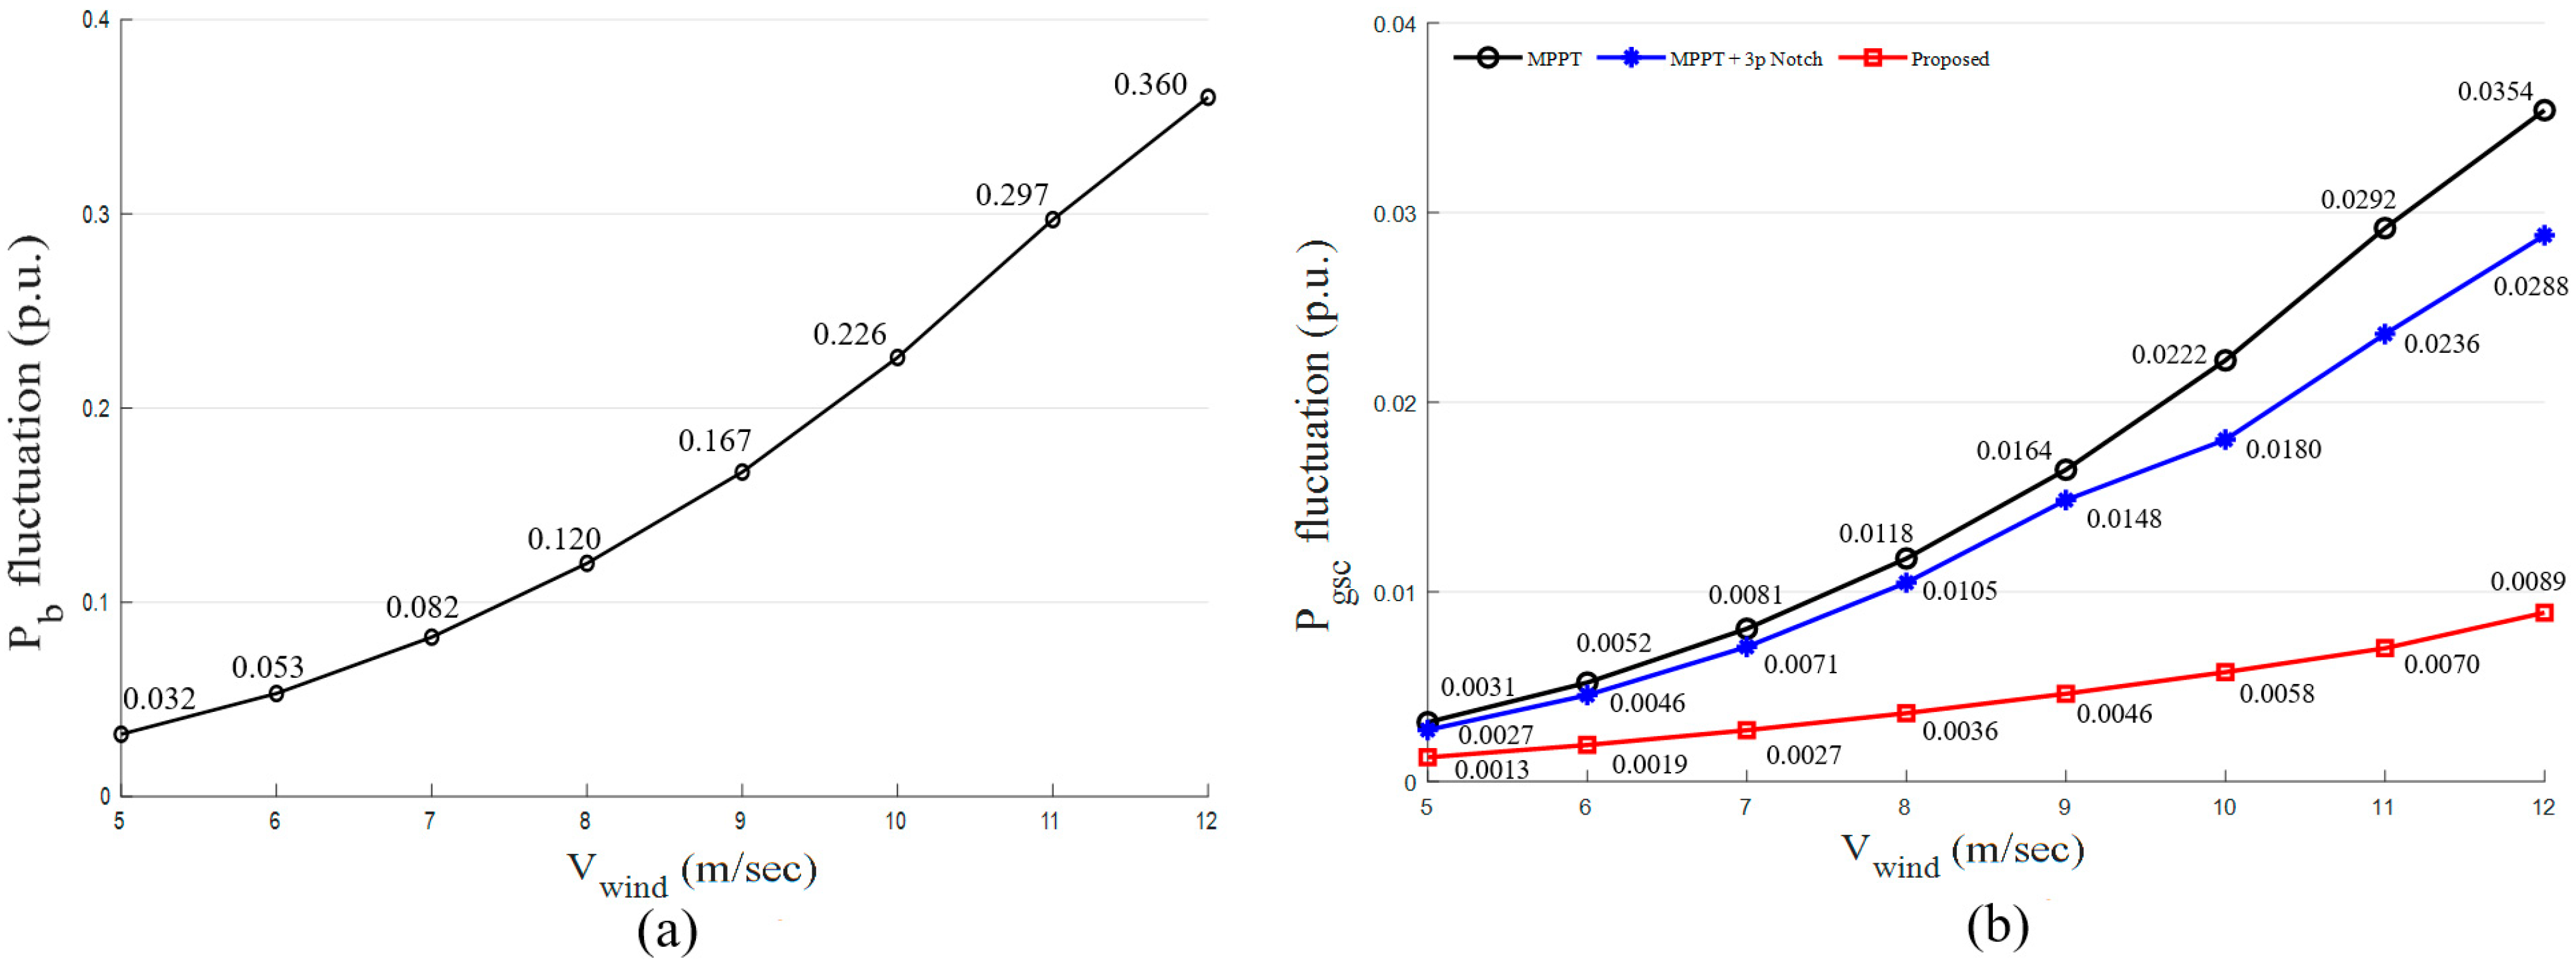
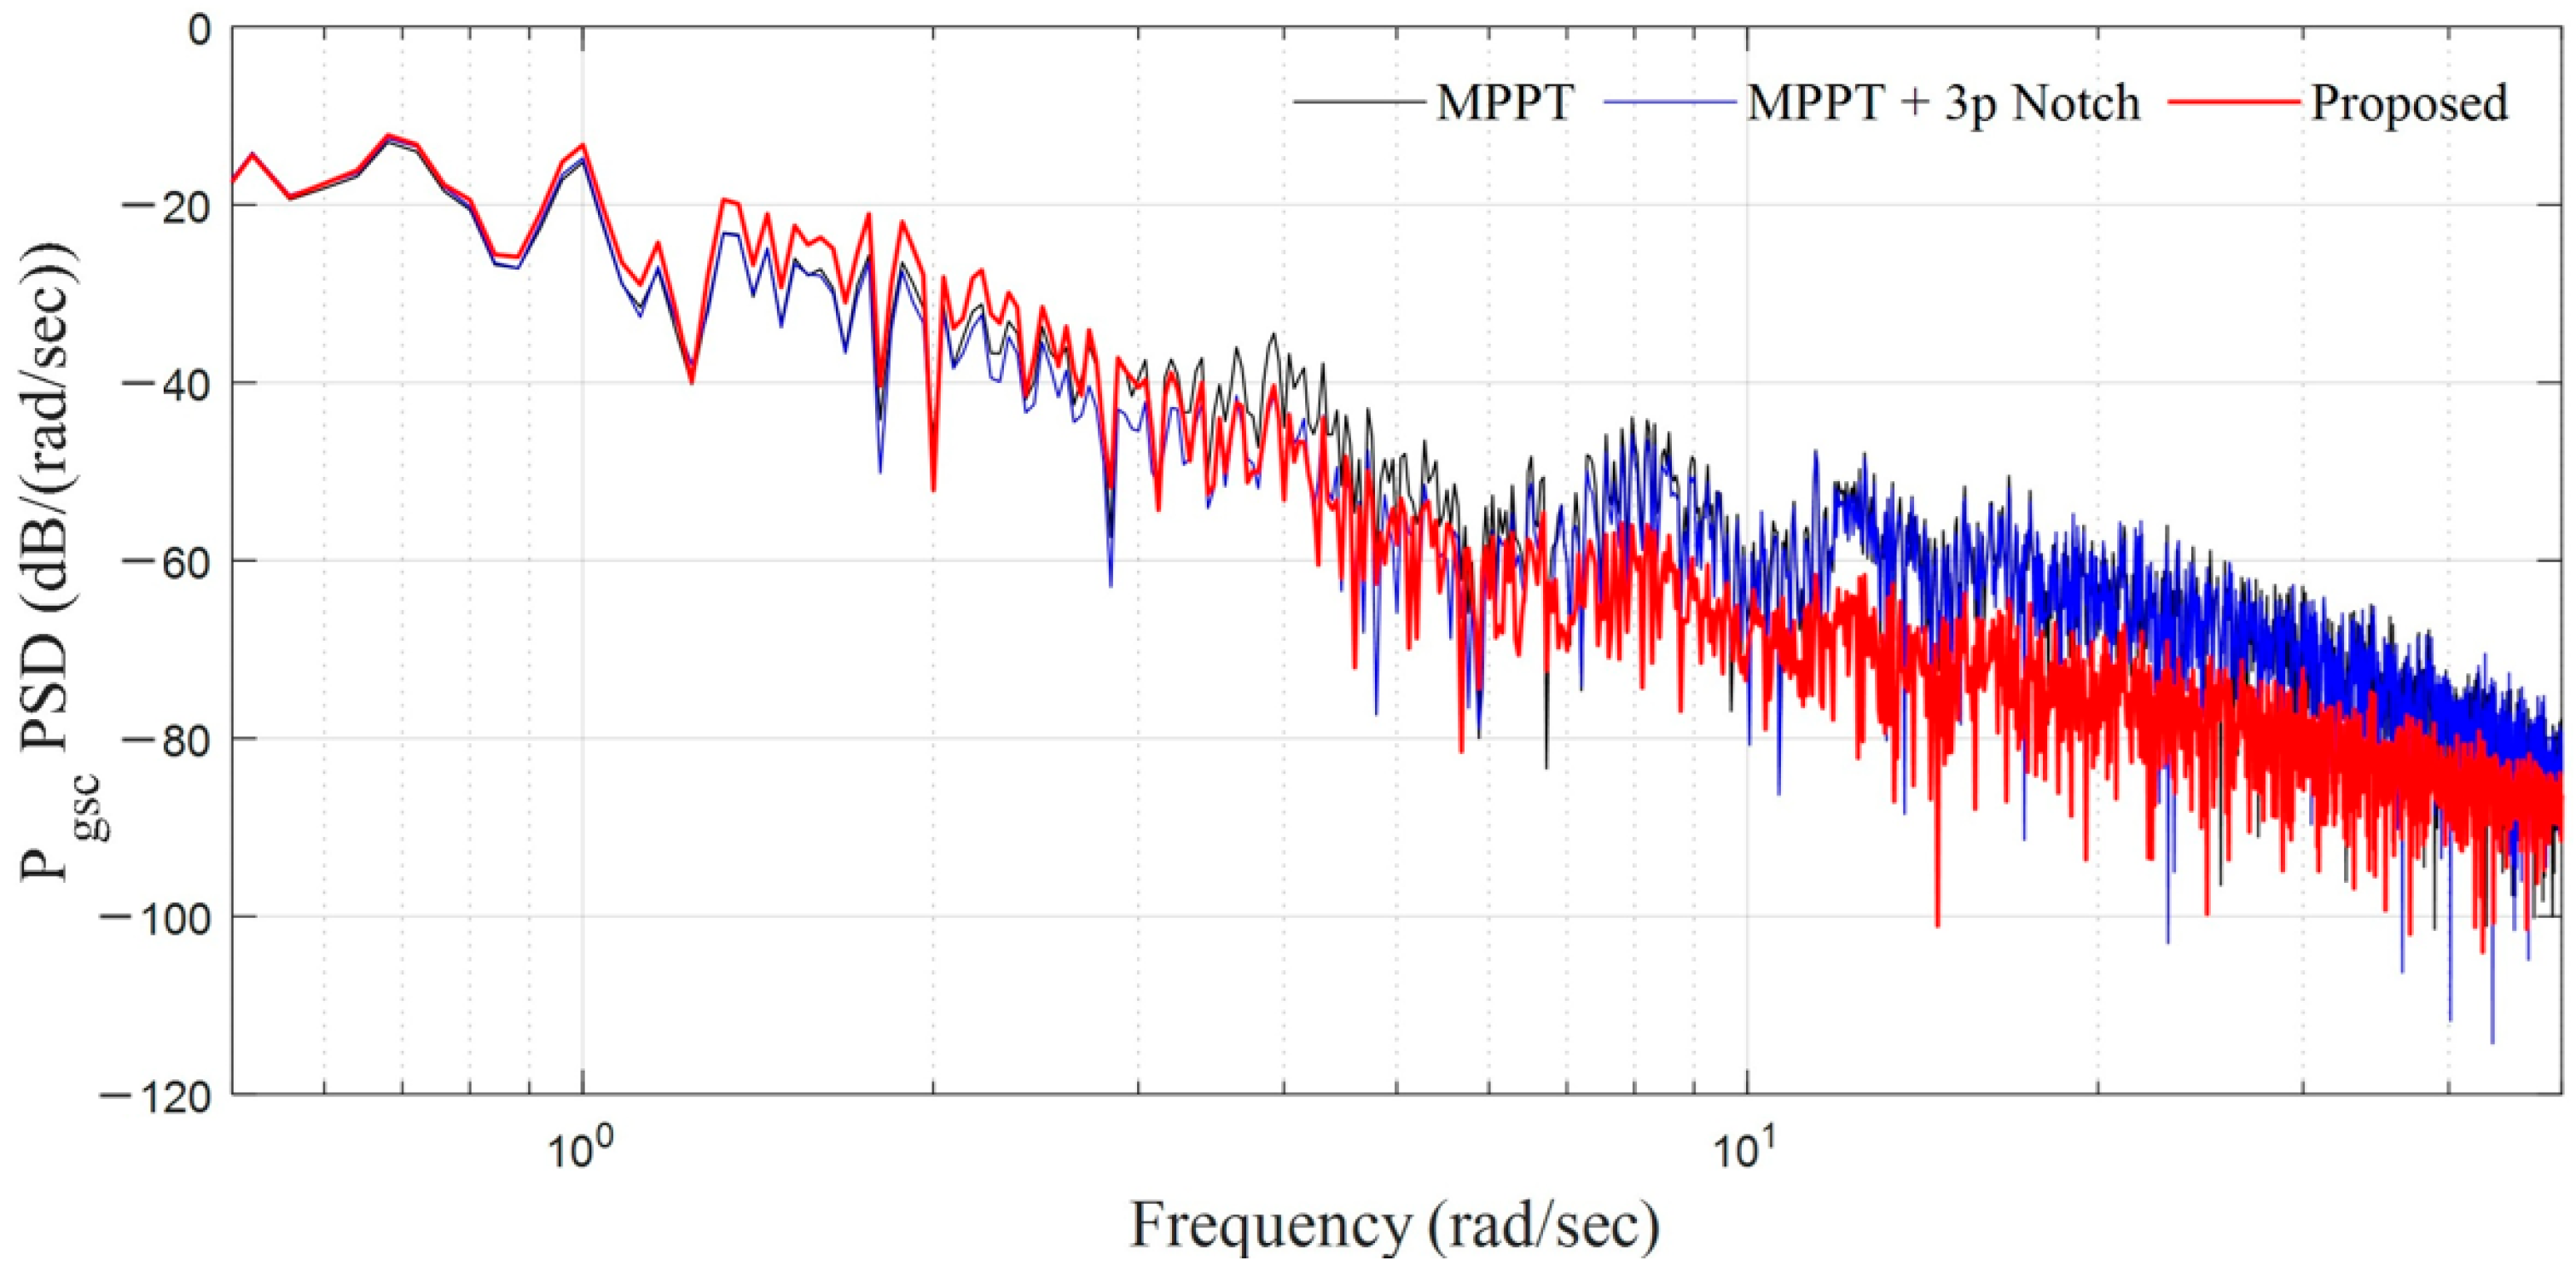
4.2. Case 2: Average Wind Velocity = 9 m/s Time-Varying Wind Speed with Turbulence

Case 2 evaluates the dynamic response of the proposed controller under a turbulent wind condition with a mean wind speed of 9 m/s, classified as Class A turbulence. A total of 120 s of simulation is conducted. Figure 13a illustrates the equivalent wind speed applied to the wind turbine, confirming that all three control strategies are subjected to the same wind conditions. Figure 13b shows the variation of rotational energy stored in the rotor. The energy changes gradually due to the inertia effect, showing no significant differences among the methods. When the wind speed drops suddenly, the rotor compensates for the drop in power by releasing stored kinetic energy. Figure 13c presents the energy stored in the DC-link capacitor. In the proposed method, periodic charging and discharging occur prominently, demonstrating the capacitor’s role in mitigating high-frequency power fluctuations as a small-scale energy storage unit. Around t = 130 s, the voltage limiter is activated to prevent overvoltage, and the DC-link voltage control remains stable. Figure 13d compares the output power of the wind turbine. The upper plot presents the entire simulation period, showing similar overall trends for all methods, while small fluctuations are clearly distinguishable. The zoomed-in lower plot highlights the interval from 120 s to 130 s, where periodic power fluctuations are dominant. While both the MPPT and MPPT with 3P-notch methods show periodic and abrupt reductions in output power caused by 3P fluctuations, this phenomenon is substantially alleviated in the proposed method. The proposed control strategy provides smoother output fluctuations, forming gentler transitions than those seen with MPPT or the 3P-notch filter method.
Figure 14 illustrates the power spectral density (PSD) of the output power under case 2. Due to the use of a variable-speed generator, the rotor speed varies with the wind speed, which leads to the broadening of the 3P and 6P frequency bands compared to the constant wind speed condition. The MPPT method shows a pronounced peak around 4 rad/s, corresponding to the 3P frequency band, and maintains relatively high spectral content in higher frequency ranges. The 3P-notch method selectively attenuates the specific 3P band but still retains residual high-frequency components across the spectrum. In contrast, the proposed method significantly reduces the spectral density above approximately 5 rad/s, indicating a more effective attenuation of high-frequency fluctuations. This result demonstrates that the combined use of rotor inertia and DC-link capacitor enables successful smoothing of periodic output fluctuations.
As shown in Table 4, the proposed method slightly outperforms the MPPT and MPPT + 3P notch filter methods in terms of total energy yield. This improvement, although marginal, is attributed to the control system’s ability to maintain generator speed closer to the optimal tip-speed ratio during rapid wind speed variations. In the conventional MPPT method, abrupt decreases in equivalent wind speed following minor increases lead to a temporary drop in the power coefficient due to deviation from the MPP. The recovery to the optimal operating point takes time, resulting in a short-term energy loss. In contrast, the proposed method leverages the rotor inertia and DC-link capacitor to buffer these fluctuations, maintaining smoother output power and enabling quicker re-alignment with the MPPT. Consequently, the proposed control improves the operational consistency of the turbines and maximizes energy harvesting efficiency under turbulent wind conditions.

5. Conclusions

This study presents a control method that effectively smooths short-term periodic power fluctuations caused by wind shear and tower shadow effect, which are inherent in all wind turbines. While previous studies primarily focused on smoothing long-term wind speed variations, such approaches often compromised MPPT performance due to excessive smoothing demands, resulting in a reduction in total energy yield. In contrast, this study analyzes the energy storage capacities of the blade and DC-link capacitor and targets the mitigation of short-term periodic power fluctuations. The proposed method reduced short-term periodic power fluctuations, particularly those in the 3P and higher frequency ranges, by more than 70% compared to conventional MPPT control, while maintaining the rated operating range of the blade and DC-link capacitor. Simulation results also showed that the overall energy yield was maintained or slightly improved. Since the proposed short-term power smoothing algorithm can be implemented by modifying only the MPPT control logic, without requiring additional hardware or structural changes, it offers high adaptability and cost-effectiveness for broad application across various wind turbine platforms.

Author Contributions

Conceptualization, J.-H.D. and S.-H.S.; methodology, J.-H.D.; software, J.-H.D.; validation, J.-H.D. and Y.-C.K.; formal analysis, J.-H.D.; investigation, J.-H.D.; resources, S.-H.S.; data curation, J.-H.D.; writing—original draft preparation, J.-H.D.; writing—review and editing, J.-H.D., Y.-C.K., and S.-H.S.; visualization, J.-H.D. and Y.-C.K.; supervision, S.-H.S. All authors have read and agreed to the published version of the manuscript.

Funding

This study was supported by Korean Energy Technology Evaluation and Planning (KETEP) and Kwangwoon University (Grant Numbers 20223030020110 and 2024-0410).

Data Availability Statement

The datasets generated during and/or analyzed during the current study are available from the corresponding author on reasonable request.

Conflicts of Interest

The authors declare no conflicts of interest.

References

  1. Global Wind Energy Council (GWEC). Global Wind Report 2025; GWEC: Brussels, Belgium, 2025; Available online: https://www.gwec.net/reports/globalwindreport (accessed on 21 June 2025).
  2. Das, S.; Karnik, N.; Santoso, S. Time-domain modeling of tower shadow and wind shear in wind turbines. ISRN Renew. Energy 2011, 2011, 890582. [Google Scholar] [CrossRef]
  3. Dolan, D.S.L.; Lehn, P.W. Simulation model of wind turbine 3p torque oscillations due to wind shear and tower shadow. In Proceedings of the 2006 IEEE PES Power Systems Conference and Exposition, Atlanta, GA, USA, 29 October–1 November 2006; pp. 2050–2057. [Google Scholar] [CrossRef]
  4. Ketabipour, S.; Samet, H.; Mohammadi, M.; Li, Q.; Terzija, V. Modeling of extremely short-time power variations of wound rotor induction machines wind farms for flicker studies. IEEE Access 2023, 11, 135556–135567. [Google Scholar] [CrossRef]
  5. Yin, L.; Zhu, R.; Gu, Y. Impacts of multi-physical domain coupling of wind turbine on power grid performances. In Proceedings of the 2023 8th IEEE Workshop on the Electronic Grid (eGRID), Karlsruhe, Germany, 16–18 October 2023; pp. 1–6. [Google Scholar] [CrossRef]
  6. Chen, W.L.; Chan, C.C. Periodic pulsation mitigation and operation speed extension in wind-driven squirrel-cage induction generators through voltage injection. J. Power Electron. 2025. [Google Scholar] [CrossRef]
  7. Esmaeilian, H.R.; Fadaeinedjad, R. Resolving power quality issues raised by aerodynamic aspects of wind turbine in isolated microgrids using fuel cell/electrolyzer system. IEEE Trans. Sustain. Energy 2016, 7, 1274–1283. [Google Scholar] [CrossRef]
  8. Liao, K.; Xu, Y.; Yin, M.; Chen, Z. A virtual filter approach for wind energy conversion systems for mitigating power system frequency fluctuations. IEEE Trans. Sustain. Energy 2020, 11, 1268–1277. [Google Scholar] [CrossRef]
  9. Su, C.; Hu, W.; Chen, Z.; Hu, Y. Mitigation of power system oscillation caused by wind power fluctuation. IET Renew. Power Gener. 2013, 7, 639–651. [Google Scholar] [CrossRef]
  10. Ammar, M.; Joós, G. A short-term energy storage system for voltage quality improvement in distributed wind power. IEEE Trans. Energy Convers. 2014, 29, 997–1007. [Google Scholar] [CrossRef]
  11. Díaz-González, F.; Bianchi, F.D.; Sumper, A.; Gomis-Bellmunt, O. Control of a flywheel energy storage system for power smoothing in wind power plants. IEEE Trans. Energy Convers. 2014, 29, 204–214. [Google Scholar] [CrossRef]
  12. Zhang, Y.; Chen, Z.; Hu, W.; Cheng, M. Flicker mitigation by individual pitch control of variable speed wind turbines with DFIG. IEEE Trans. Energy Convers. 2014, 29, 20–28. [Google Scholar] [CrossRef]
  13. Yang, G.; Chen, L.; Cai, P.; Gao, W.; Ai, C. Adaptive Disturbance Rejection and Power Smoothing Control for Offshore Hydraulic Wind Turbines Based on Pitch and Motor Tilt Angles. Energies 2024, 17, 6244. [Google Scholar] [CrossRef]
  14. Zhang, Y.; Hu, W.; Chen, Z.; Cheng, M.; Hu, Y. Flicker mitigation strategy for a doubly fed induction generator by torque control. IET Renew. Power Gener. 2014, 8, 91–99. [Google Scholar] [CrossRef]
  15. Hu, W.; Chen, Z.; Wang, Y.; Wang, Z. Flicker mitigation by active power control of variable-speed wind turbines with full-scale back-to-back power converters. IEEE Trans. Energy Convers. 2009, 24, 640–649. [Google Scholar] [CrossRef]
  16. Uehara, A.; Pratap, A.; Goya, T.; Senjyu, T.; Yona, A.; Urasaki, N.; Funabashi, T. A coordinated control method to smooth wind power fluctuations of a PMSG-based WECS. IEEE Trans. Energy Convers. 2011, 26, 550–558. [Google Scholar] [CrossRef]
  17. Lyu, X.; Zhao, J.; Jia, Y.; Xu, Z.; Wong, K.P. Coordinated control strategies of PMSG-based wind turbine for smoothing power fluctuations. IEEE Trans. Power Syst. 2019, 34, 391–401. [Google Scholar] [CrossRef]
  18. Kim, J.-J.; Song, S.-H. PSCAD/EMTDC simulation model of variable speed wind power generation system using permanent magnet synchronous machine. Trans. Korean Inst. Power Electron. 2005, 10, 253–256. [Google Scholar]
  19. Nam, Y.-S. Wind Turbine System Control; GS Intervision: Seoul, Republic of Korea, 2013; pp. 28–37. [Google Scholar]
  20. Yue, H.; Zhang, H.; Zhu, Q.; Ai, Y.; Tang, H.; Zhou, L. Wake dynamics of a wind turbine under real-time varying inflow turbulence: A coherence mode perspective. Energy Convers. Manag. 2025, 332, 119729. [Google Scholar] [CrossRef]
  21. Elkinton, M.R.; Rogers, A.L.; McGowan, J.G. An investigation of wind-shear models and experimental data trends for different terrains. Wind Eng. 2006, 30, 341–350. [Google Scholar] [CrossRef]
  22. Fernández-Guillamón, A.; Gómez-Lázaro, E.; Muljadi, E.; Molina-García, Á. Power systems with high renewable energy sources: A review of inertia and frequency control strategies over time. Renew. Sustain. Energy Rev. 2019, 115, 109369. [Google Scholar] [CrossRef]
  23. Grid Code Frequency Response Working Group. System Inertia. Available online: https://www.nationalgrid.com/sites/default/files/documents/16890-Meeting%208%20-%20Inertia%20presentation.pdf (accessed on 22 May 2025).
  24. Rajendran, S.; Diaz, M.; Cárdenas, R.; Espina, E.; Contreras, E.; Rodriguez, J. A review of generators and power converters for multi-MW wind energy conversion systems. Processes 2022, 10, 2302. [Google Scholar] [CrossRef]
  25. Kim, J.; Lee, S.; Seok, B. Analysis on smoothing algorithms performance and battery capacity for intermittent and variable wind power mitigation. J. Korean Inst. Electr. Eng. Power Eng. 2021, 70, 63–69. [Google Scholar] [CrossRef]
  26. Yoo, M.-S.; Kim, S.-B.; Song, S.-H.; Choy, Y.-D.; Yoon, G.-G. Periodic Pulsation of Wind Turbine Output Power due to Wind Shear and Tower Effect. In Proceedings of the KIEE Summer Conference, Gwangju, Republic of Korea, 12 October 2015; pp. 262–264. [Google Scholar]
Figure 1. Configuration of PMSG-based wind turbine system with control block diagram.
Energies 18 03763 g001
Figure 2. Effects of wind shear and tower shadow on equivalent wind speed and blade power.
Energies 18 03763 g002
Figure 3. Block diagram representing generator speed dynamics under MPPT control.
Energies 18 03763 g003
Figure 4. Bode plot of the generator power response to blade power under MPPT control.
Energies 18 03763 g004
Figure 5. Normalized comparative analysis of energy storage capacity based on kinetic and electrostatic energy equations: (a) blade inertia; (b) DC-link capacitor.
Energies 18 03763 g005
Figure 6. Typical power smoothing strategy commonly applied in ESS.
Energies 18 03763 g006
Figure 7. Block diagram of (a) conventional MPPT controller; (b) 3Pnotch filtering method.
Energies 18 03763 g007
Figure 8. Block diagram of proposed power fluctuation smoothing controller of MSC.
Energies 18 03763 g008
Figure 9. Block diagram of proposed power fluctuation smoothing controller of GSC.
Energies 18 03763 g009
Figure 10. Simulation results for case 1 with peak-to-peak variation comparison: (a) equivalent wind speed; (b) blade energy; (c) capacitor energy; (d) active power to the grid.
Energies 18 03763 g010
Figure 11. Comparison of PSD analysis for case 1 under different smoothing methods.
Energies 18 03763 g011
Figure 12. Peak-to-peak output power variation with wind speed (a) blade power; (b) comparison of power delivered to grid under different smoothing methods.
Energies 18 03763 g012
Figure 13. Simulation results for case 2: (a) equivalent wind speed; (b) blade energy; (c) capacitor energy; (d) active power to the grid with zoom-in view.
Energies 18 03763 g013
Figure 14. Comparison of PSD analysis for case 2 under different smoothing methods.
Energies 18 03763 g014
Table 1. The energy storage capability of rotor inertia and DC-link capacitor under the given parameters.
CategoryRoter InertiaLow Voltage
Power Converters
Medium Voltage
Power Converters
Energy Storage
Capacity (s)
2~9 s0.005~0.05 s0.04~0.31 s
Table 2. Key parameters of MATLAB/Simulink simulation [26].
ParameterValueUnit
Rated power2.45MW
Gear ratio77
Generator typePMSG
Rated generator speed1409.1rpm
Cut-in generator speed704.55rpm
Rated wind speed12.12m/s
Cut-in wind speed3m/s
ω s c 10rad/s
ω c c 200rad/s
C p m a x 0.4382
λ o p t 6.325
k o p t 0.8629
R 41 m
h 80 m
H 2 s
J 450.08 k g m 2
ρ 1.25 k g / m 3
α 0.3
a 3m
x 5m
Table 3. Mitigation of dominant harmonic components for each control method.
Harmonic
Components
MPPT (dB)MPPT with
3P Notch (dB)
Proposed
(dB)
Mitigation by
Proposed (vs. MPPT)
3P−23−30−37−14 dB
6P−27−30−41−14 dB
9P−29−31−44−15 dB
12P−31−33−48−17 dB
Table 4. Comparison of total energy yield under different smoothing methods.
CategoryMPPTMPPT + 3P NotchProposed
Total energy
Yield (MW·s)
144.790144.861144.865
Disclaimer/Publisher’s Note: The statements, opinions and data contained in all publications are solely those of the individual author(s) and contributor(s) and not of MDPI and/or the editor(s). MDPI and/or the editor(s) disclaim responsibility for any injury to people or property resulting from any ideas, methods, instructions or products referred to in the content.

