Article

Research on a Small Modular Reactor Fault Diagnosis System Based on the Attention Mechanism

1
College of Safety Science and Engineering, Xi’an University of Science and Technology, Xi’an 710699, China
2
School of Safe and Management Engineering, Hunan Institute of Technology, Hengyang 421002, China
*
Author to whom correspondence should be addressed.
Energies 2025, 18(14), 3621; https://doi.org/10.3390/en18143621
Submission received: 18 June 2025 / Revised: 7 July 2025 / Accepted: 8 July 2025 / Published: 9 July 2025

Abstract

Small modular reactors are progressing towards greater levels of automation and intelligence, with intelligent control emerging as a pivotal trend in SMR development. When contrasted with traditional commercial nuclear power plants, SMR display substantial disparities in design parameters and the designs of safety auxiliary systems. As a result, fault diagnosis systems tailored for commercial nuclear power plants are ill-equipped for SMRs. This study utilizes the PCTRAN-SMR V1.0 software to develop an intelligent fault diagnosis system for the SMART small modular reactor based on an attention mechanism. By comparing different network models, it is demonstrated that the CNN–LSTM–Attention model with an attention mechanism significantly outperforms CNN, LSTM, and CNN–LSTM models, achieving up to a 7% improvement in prediction accuracy. These results clearly indicate that incorporating an attention mechanism can effectively enhance the performance of deep learning models in nuclear power plant fault diagnosis.

1. Introduction

Small modular reactors (SMRs) [1,2,3,4,5], distinguished by their modular design, passive safety systems, and scalable deployment, have become a focal point in nuclear technology innovation [6,7,8,9,10,11,12]. With over 50 disclosed designs across 11 countries—including operational units like China’s CNP-300 and construction-phase projects such as Russia’s KLT-40S—SMRs are projected to contribute ~8.8 GWe to global nuclear capacity by 2030, accounting for >2% of total installations [13,14,15,16,17]. This growth is driven by their potential to address grid integration challenges posed by intermittent renewables while enabling decentralized energy systems [18,19,20,21,22].
Ensuring SMR safety remains a critical technical challenge, underscored by historical nuclear accidents (e.g., Fukushima, Chernobyl) that highlight the need for robust fault diagnosis [23,24,25]. Traditional fault diagnosis methods—encompassing analytical models, signal processing, and shallow machine learning—exhibit inherent limitations in complex nuclear systems. Analytical approaches, such as Takagi–Sugeno (T-S) descriptor observers, rely on precise physical modeling that struggles to capture SMRs’ nonlinear dynamics (e.g., rapid pressure decay during loss-of-coolant accidents) and modular design uncertainties [26,27]. Signal processing techniques, while effective for specific fault signatures, lack generalizability across diverse operational scenarios [28]. Shallow machine learning methods (e.g., hidden Markov models, support vector machines) face challenges in high-dimensional feature extraction, often leading to overfitting in nuclear power plant datasets [29,30,31].
Deep learning has emerged as a transformative solution for SMR fault diagnosis, leveraging multi-layer neural architectures to enable hierarchical feature extraction from multivariate time-series data. Unlike traditional methods, deep neural networks (DNNs) excel in modeling complex nonlinear relationships—such as the coupling between nuclear power feedback and coolant temperature—without requiring explicit physical modeling [32,33,34,35]. This is particularly critical for SMRs, where scaled-down parameters and passive safety systems introduce unique operational uncertainties that defy conventional modeling approaches. For example, hybrid architectures like CNN–LSTM–Attention can simultaneously capture spatial–temporal correlations in sensor data and prioritize critical fault indicators, enabling real-time anomaly detection during transient events [36,37].
The transition from analog to digital instrumentation in nuclear systems has further enabled data-driven diagnostics. Modern SMRs generate high-frequency operational data (e.g., pressure, temperature, flow rates) that can be harnessed by deep learning models to identify incipient faults. However, this presents two key technical challenges: (1) managing the curse of dimensionality in multi-sensor datasets and (2) ensuring diagnostic reliability under limited fault sample conditions. To address these, this study proposes a transfer learning-based framework that combines pre-trained deep neural networks with domain-specific fine-tuning, enabling robust fault classification even with scarce labeled data [38].
Specifically, the research focuses on developing a hybrid CNN–LSTM–Attention model tailored for SMR accident scenarios. The model architecture integrates convolutional neural networks (CNNs) for extracting spatial features from sensor arrays, capturing concurrent fault signatures across multiple channels. long short-term memory (LSTM) networks to model temporal dependencies in dynamic processes are essential for predicting fault progression. Attention mechanisms are used to weight the importance of different sensor inputs, enhancing diagnostic sensitivity to critical parameters (e.g., reactor pressure vessel temperature during overheating events).
This framework is validated against synthetic SMR fault datasets generated via high-fidelity system simulations, encompassing loss-of-coolant accidents (LOCA), control rod malfunctions, and steam generator tube ruptures. By comparing model performance against traditional methods (e.g., T-S observers, SVM) across metrics like fault detection latency and classification accuracy, the study aims to establish a benchmark for intelligent SMR diagnostics [39,40,41].
This research contributes to the advancement of intelligent nuclear safety systems by demonstrating the technical feasibility of deep learning for SMR fault diagnosis. By enhancing diagnostic reliability and reducing false alarm rates, the proposed framework supports the safe deployment of next-generation nuclear technologies, aligning with global efforts to decarbonize energy infrastructure while maintaining grid security [42,43].

2. PCTRAN-SMR

2.1. SMART

SMART, developed by the Korea Atomic Energy Research Institute (KAERI), represents an innovative small modular reactor [38]. With a designed power output of 330 MWt (roughly equivalent to 100 MWe), SMART is specifically crafted to fulfill the energy requirements of various applications. These applications range from electricity generation, district heating, and seawater desalination to industrial processes. Featuring an advanced and compact design, SMART incorporates state-of-the-art safety features, high efficiency, and adaptability. As such, it emerges as a promising solution to address energy challenges in both urban and remote regions. The system’s design flow diagram is presented as Figure 1.
The design of SMART is grounded in an integrated configuration. In this setup, the reactor core, steam generators, pressurizer, and reactor coolant pumps are all housed within a single pressure vessel. This design obviates the necessity for external piping, thereby slashing the risk of coolant leakage and streamlining maintenance procedures. By leveraging natural circulation for heat extraction and incorporating passive safety systems, SMART bolsters its resistance to potential accidents, guaranteeing a high echelon of operational safety. Engineered to endure extreme conditions, including earthquakes and tsunamis, SMART embodies a robust design philosophy. Scalability and modular construction are among SMART’s defining traits. The modular approach enables the factory fabrication of major components, which curtails on-site construction time and costs. This renders SMART highly appealing to countries or regions with insufficient infrastructure for traditional large-scale nuclear power plants. Its compact size and modular nature also facilitate incremental capacity expansions, empowering utilities to more effectively match energy supply with burgeoning demand. SMART is eminently suitable for multipurpose applications. For example, in areas plagued by scarce freshwater resources, it can underpin desalination plants, generating potable water while producing electricity. Its capacity to supply district heating makes it a practical alternative in colder climates, lessening the reliance on fossil fuels for heating. Moreover, its potential for industrial process heat applications further extends its utility across diverse economic sectors. From an economic vantage point, SMART wields a competitive edge with its streamlined construction process, diminished operational costs, and extended fuel cycle. Its refueling interval of up to three years minimizes downtime and boosts energy availability. Additionally, the reactor’s smaller footprint and lower initial capital investment requisites render it a viable option for developing nations or regions making the transition to cleaner energy sources. Safety remains the cornerstone of SMART’s design. The reactor is equipped with multiple passive safety systems that function sans external power, ensuring core cooling in emergency situations. These systems hinge on natural physical principles like gravity and natural convection, eliminating the reliance on active mechanical components. Moreover, due to its inherent safety features, SMART has a low probability of severe accidents, and it complies with rigorous international safety standards. The development of SMART dovetails with the global trends towards decarbonization and sustainable energy. As nations strive to achieve climate goals and curtail greenhouse gas emissions, small modular reactors such as SMART present a reliable, low-carbon energy solution. Its flexibility in deployment, combined with its capacity to integrate with renewable energy sources, positions SMART as a pivotal entity in the transition to a cleaner energy future.
In summary, the system-integrated modular advanced reactor symbolizes a momentous stride in nuclear technology. It surmounts the limitations of conventional reactors while catering to the burgeoning global demand for versatile, safe, and sustainable energy solutions. With its innovative design, economic merits, and extensive applicability, SMART holds the potential to revolutionize the nuclear energy panorama and contribute substantially to global energy security and environmental sustainability.

2.2. PCTRAN-SMR Software

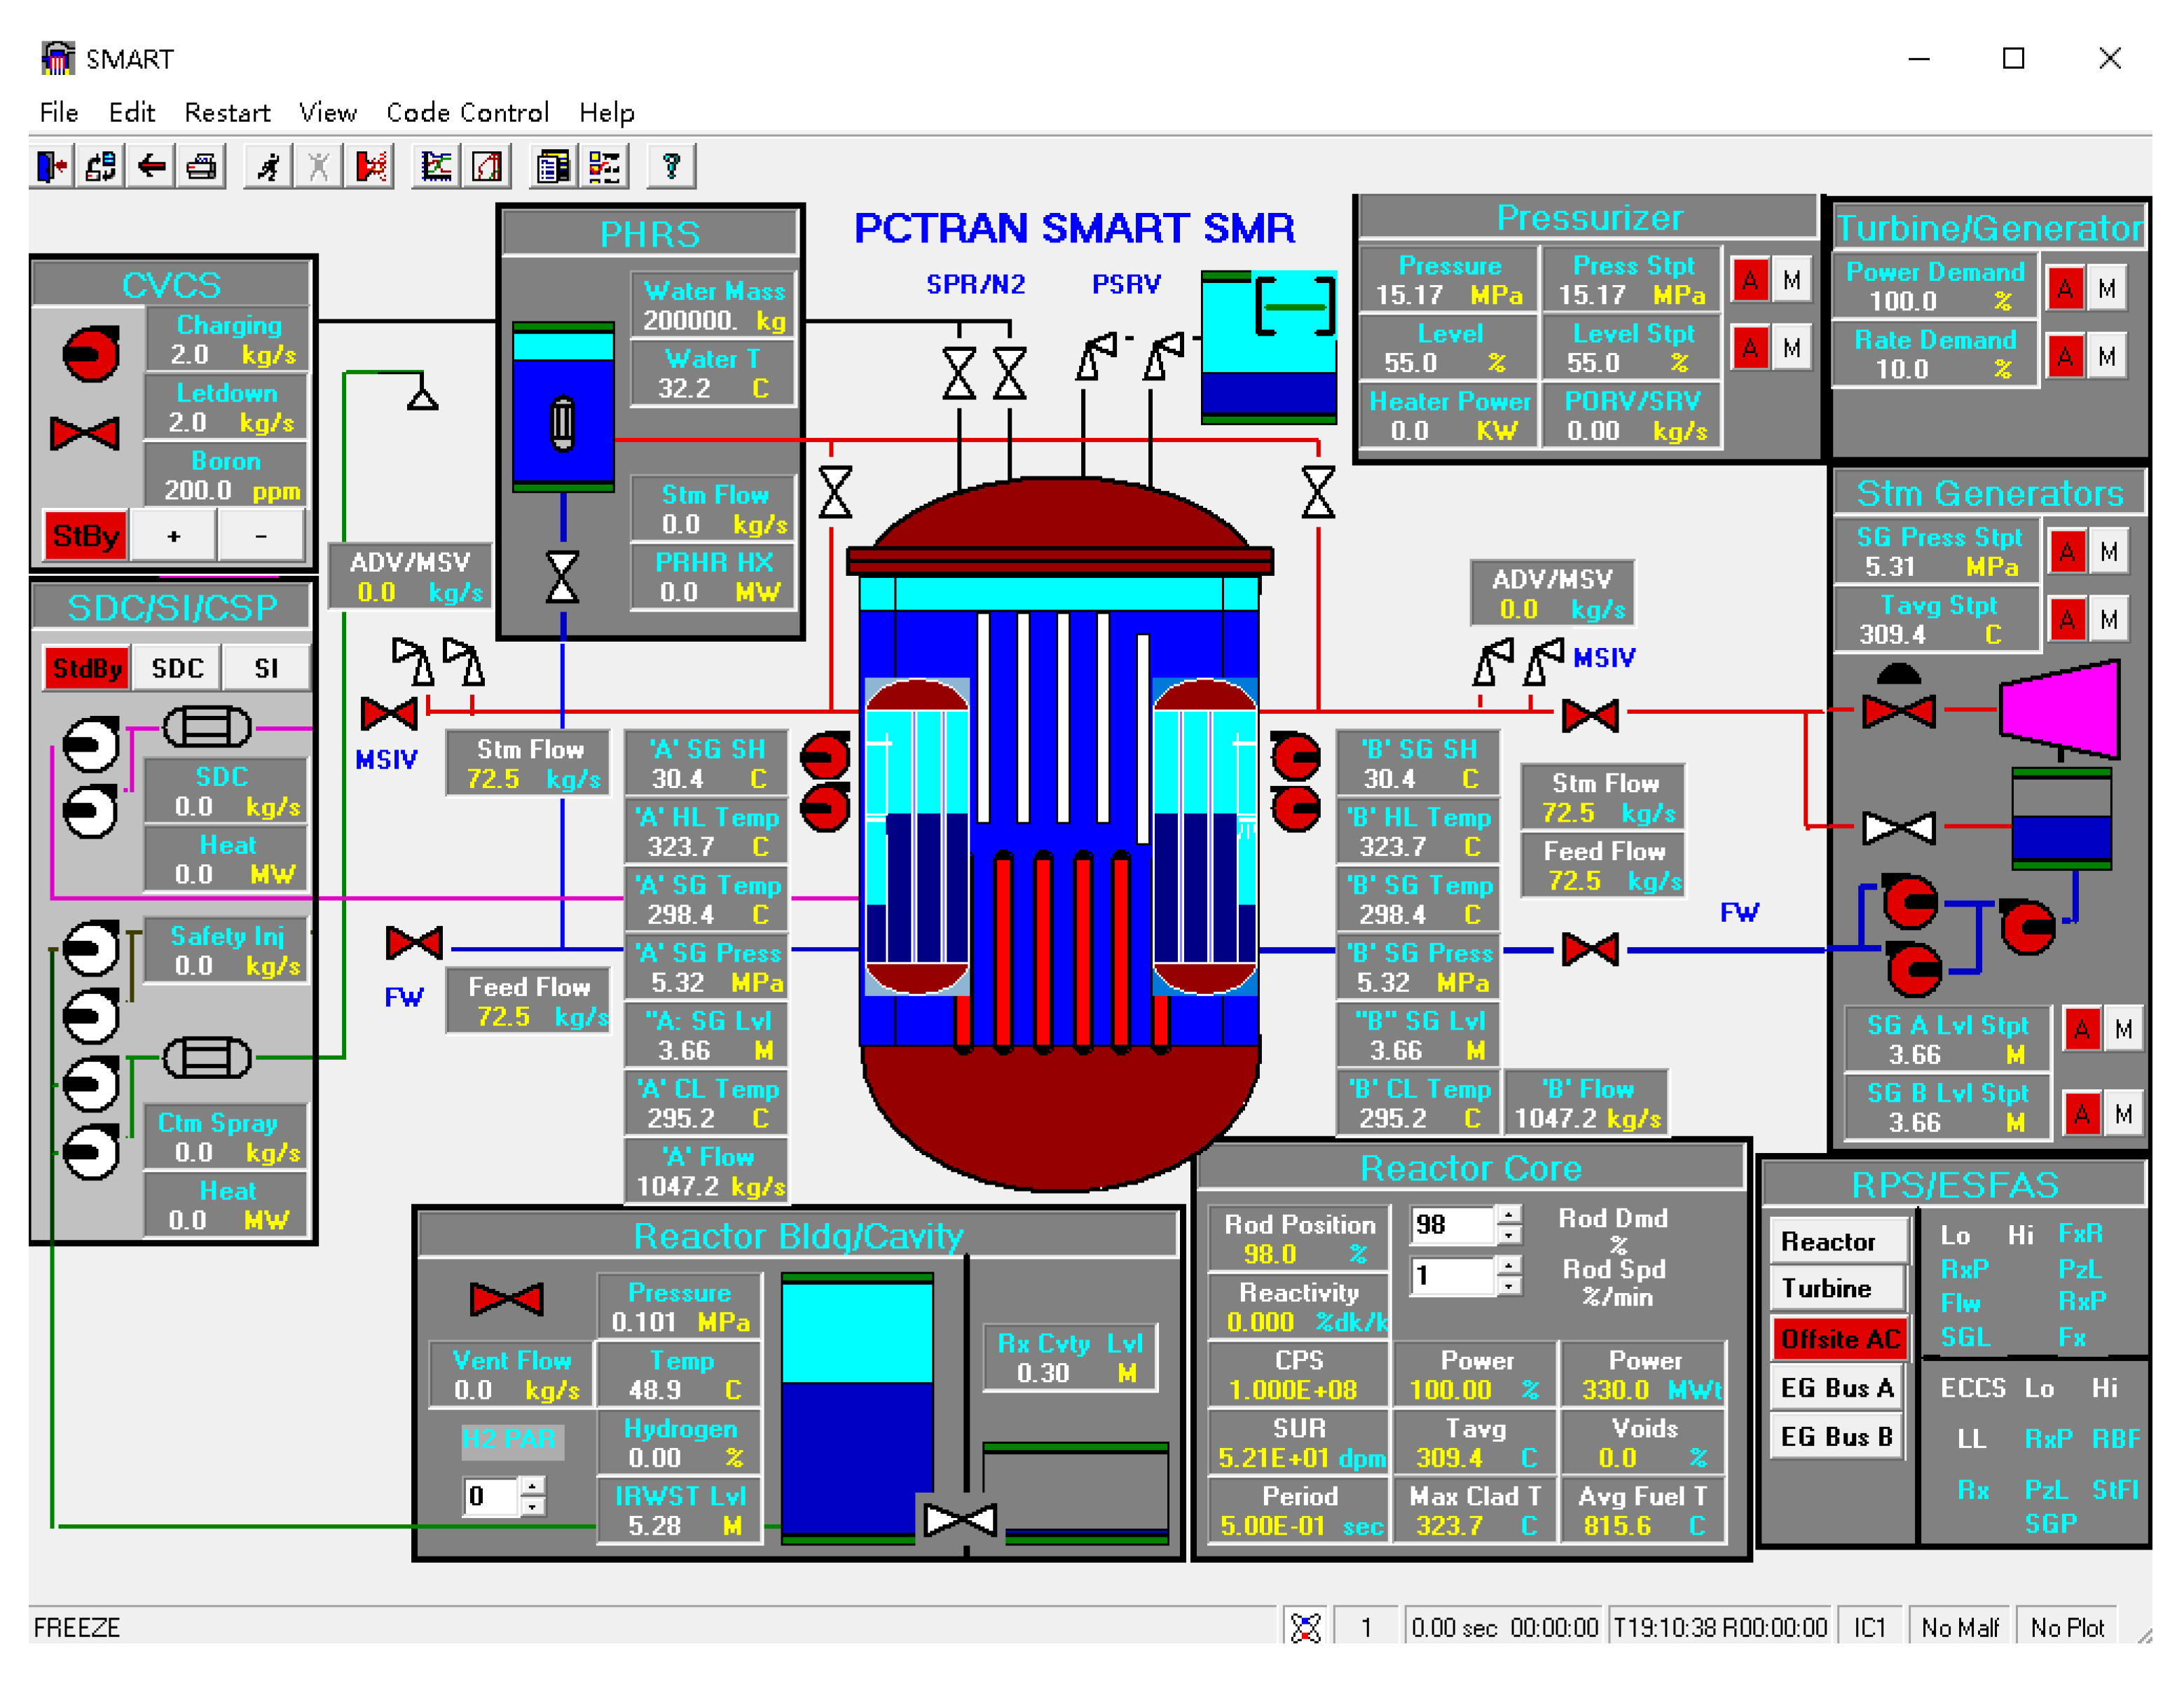
PCTRAN, as a professional nuclear power plant system analysis program, demonstrates remarkable superiority and reliability in the simulation field. It adopts the modular modeling concept, enabling precise simulation of the thermal-hydraulic characteristics of key equipment such as reactor coolant systems, steam generators, and pressure vessels. It supports multi-condition transient analysis and accident simulation. The program is based on strict physical conservation equations and verified engineering models and has been tested by international benchmarks (such as NSRR, PSBT) and verified by actual power plant data, possessing high computational accuracy and predictive capabilities. Additionally, as shown in Figure 2, PCTRAN-SMR provides a user-friendly graphical interface and flexible user-defined functions, supporting multi-parameter sensitivity studies, and can effectively serve fields such as nuclear power plant design optimization, safety assessment, and operator training, providing solid and reliable technical support for scientific research and engineering applications in the nuclear engineering field. PCTRAN-SMR (personal computer transient analyzer for system-integrated modular advanced reactor), developed by Micro-Simulation Technology, is a specialized simulation software crafted for the analysis of SMART operations and educational purposes [39]. It stands as an essential tool for engineers, researchers, and students, enabling them to model, analyze, and understand the dynamic behavior of SMART under various operational conditions and hypothetical situations. Integrating high-fidelity modeling with a user-friendly interface, this software offers realistic simulations. These simulations play a crucial role in enhancing safety training and operational planning for advanced nuclear systems. Specifically tailored to SMART, PCTRAN-SMR is capable of simulating its unique features, such as compact reactor designs, modular configurations, and advanced safety mechanisms. By incorporating comprehensive models of core physics, thermal-hydraulics, and control systems, it facilitates in-depth analysis of normal operations, transient phenomena, and accident scenarios. This functionality provides a valuable platform for training and risk assessment, especially in the context of next-generation nuclear technologies. PCTRAN-SMR is capable of replicating the core component of the SMART design—the passive safety system. These systems utilize natural phenomena like gravity, natural convection, and heat conduction to ensure reactor safety without relying on external power or operator intervention. The software allows users to visualize and assess the performance of these systems during critical events such as loss-of-coolant accidents (LOCA), station blackouts, and overheating scenarios, providing critical insights into their effectiveness in mitigating risks. Moreover, the software supports the study of advanced control strategies implemented in SMART systems. Equipped with an interactive interface, users can modify control parameters and observe their real-time impact on reactor performance. This hands-on aspect makes PCTRAN-SMR an effective educational tool, facilitating scenario-based learning and promoting a deeper understanding of SMR behavior and modern nuclear safety principles. The modular architecture of PCTRAN-SMR further enhances its adaptability, allowing for customization according to specific reactor designs and research objectives. This versatility ensures its applicability across academic research, industry training, and regulatory analysis. The intuitive user interface, featuring graphical displays, real-time data plotting, and interactive controls, broadens the software’s accessibility. It makes the software suitable for non-specialists, including policymakers, educators, and stakeholders, to explore the potential of SMART technologies. PCTRAN-SMR also contributes to the wider adoption of SMART by highlighting its economic and environmental benefits. Through simulations of operational efficiency and accident mitigation, the software demonstrates SMART’s reliability and safety, thus building confidence in nuclear energy as a clean and sustainable power source. These capabilities are in line with global decarbonization goals, promoting nuclear energy as a key component of future energy systems. In terms of emergency preparedness, PCTRAN/SMR serves as a robust platform for training operators and first responders to handle unexpected events. Its ability to recreate complex accident scenarios in a controlled virtual environment aids in the development of effective crisis management strategies, ensuring better preparedness to protect personnel, facilities, and the environment. As nuclear technology continues to evolve, PCTRAN-SMR remains at the forefront of simulation tools, offering unparalleled capabilities for the study and implementation of SMART systems. Its role in promoting education, safety, and regulatory frameworks underscores its significance as a comprehensive resource within the nuclear industry.
In conclusion, PCTRAN-SMR is a sophisticated, versatile, and indispensable simulation platform that supports the development, operational optimization, and safety evaluation of SMART systems. By enabling detailed and interactive simulations, it serves as a vital resource for the safe and efficient integration of SMR technologies into the global energy infrastructure.

2.3. SMR and PWR LOCA Accident Simulation Analysis

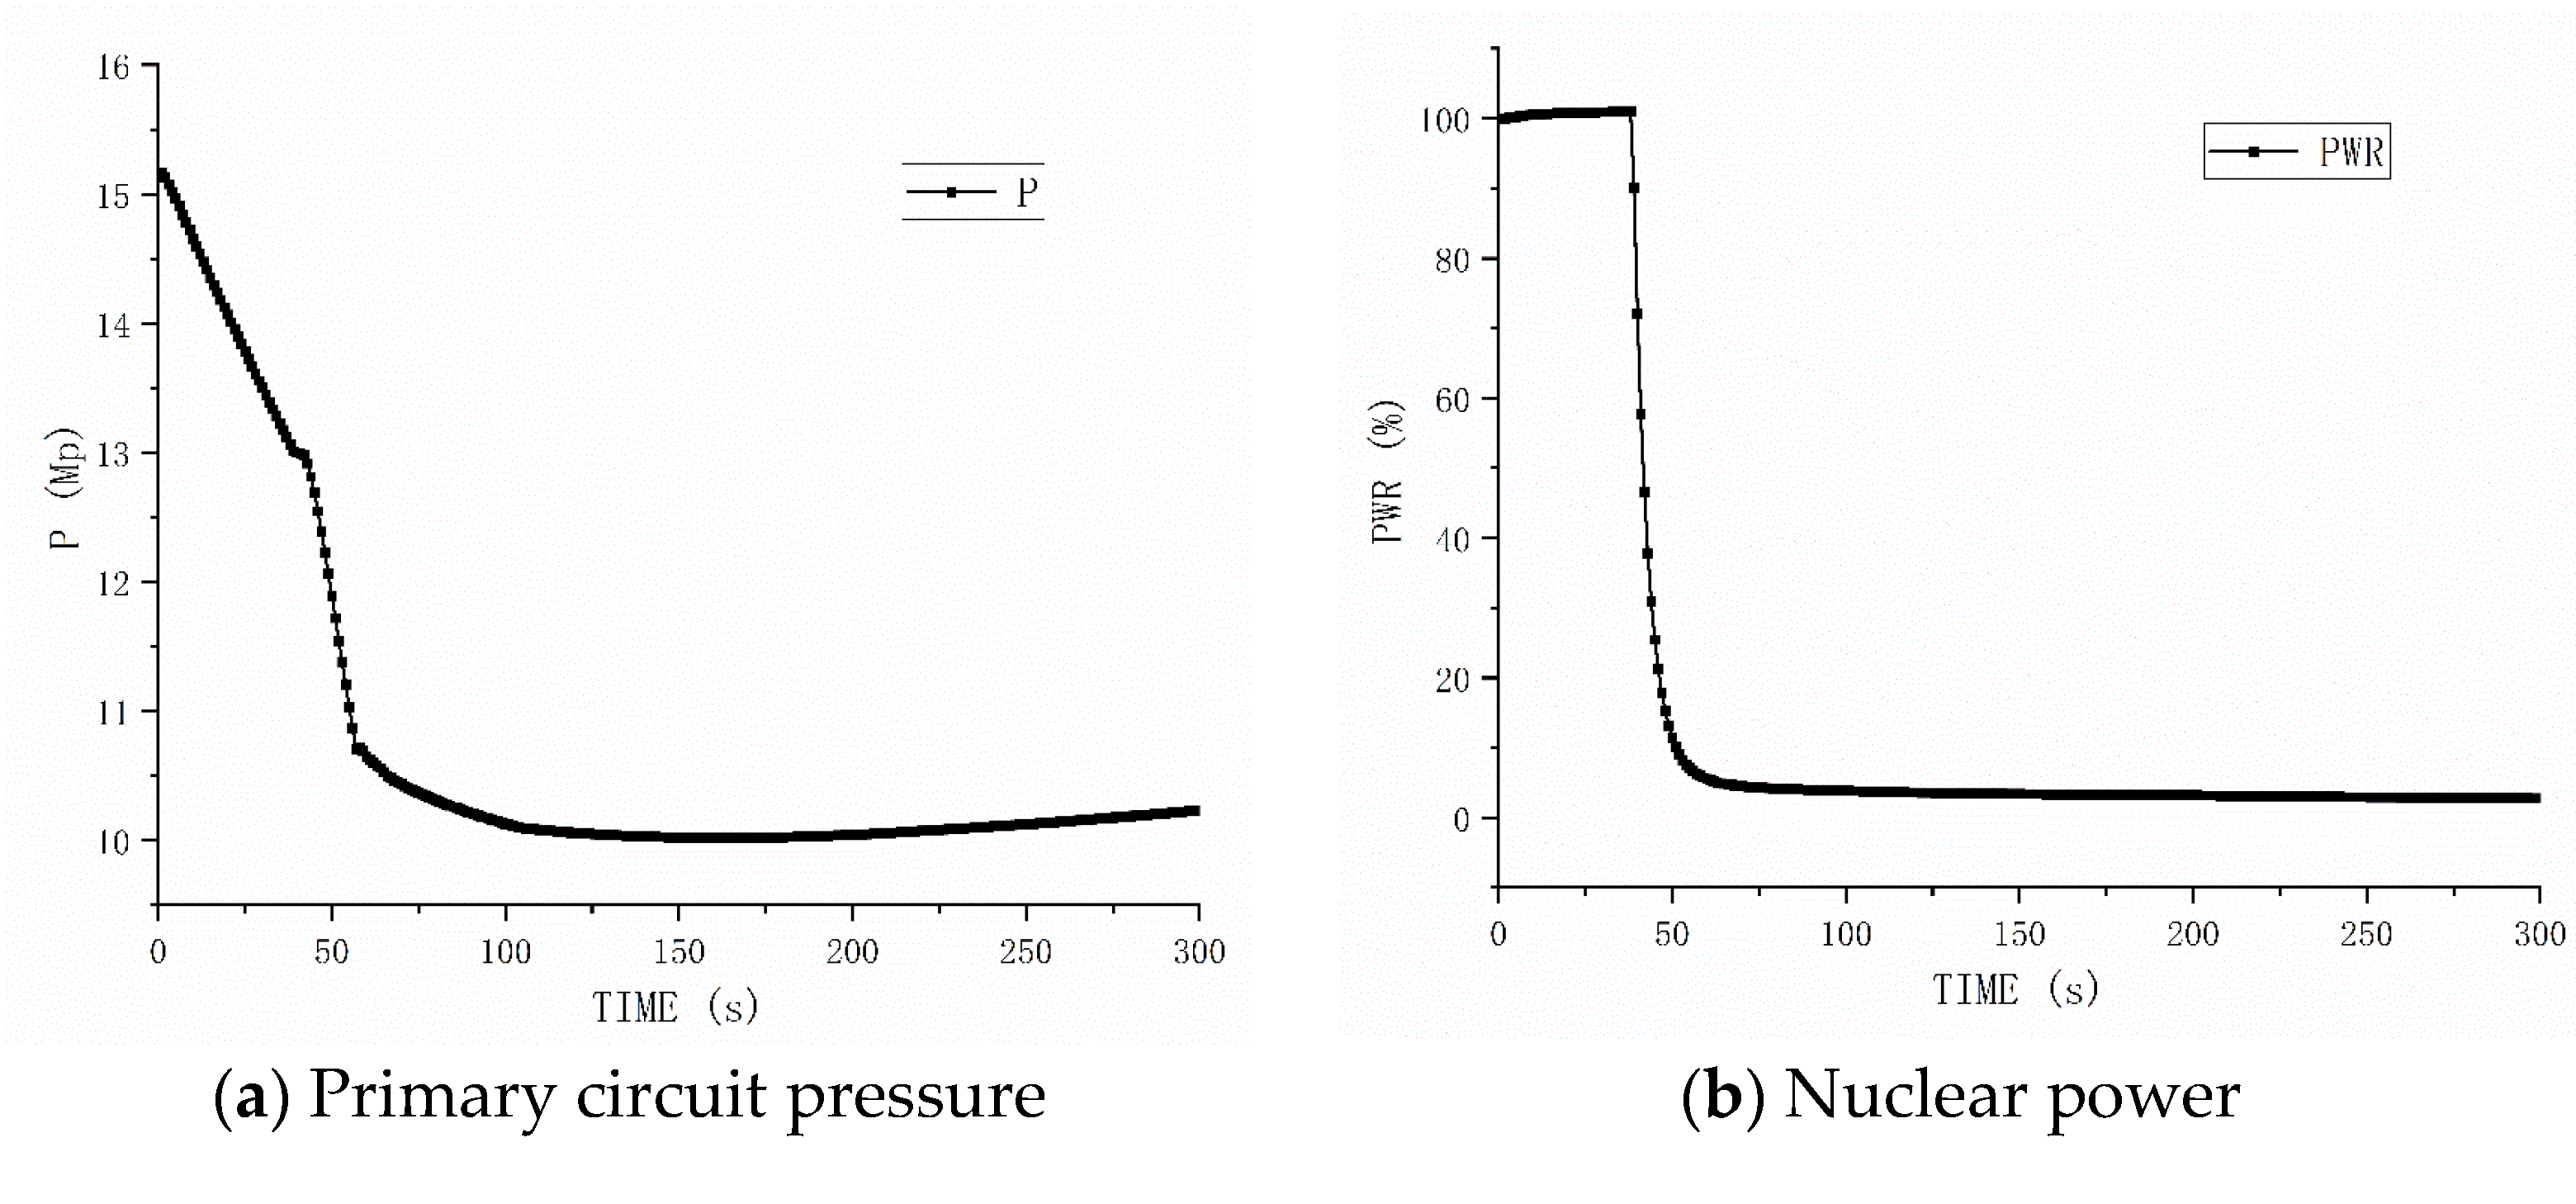
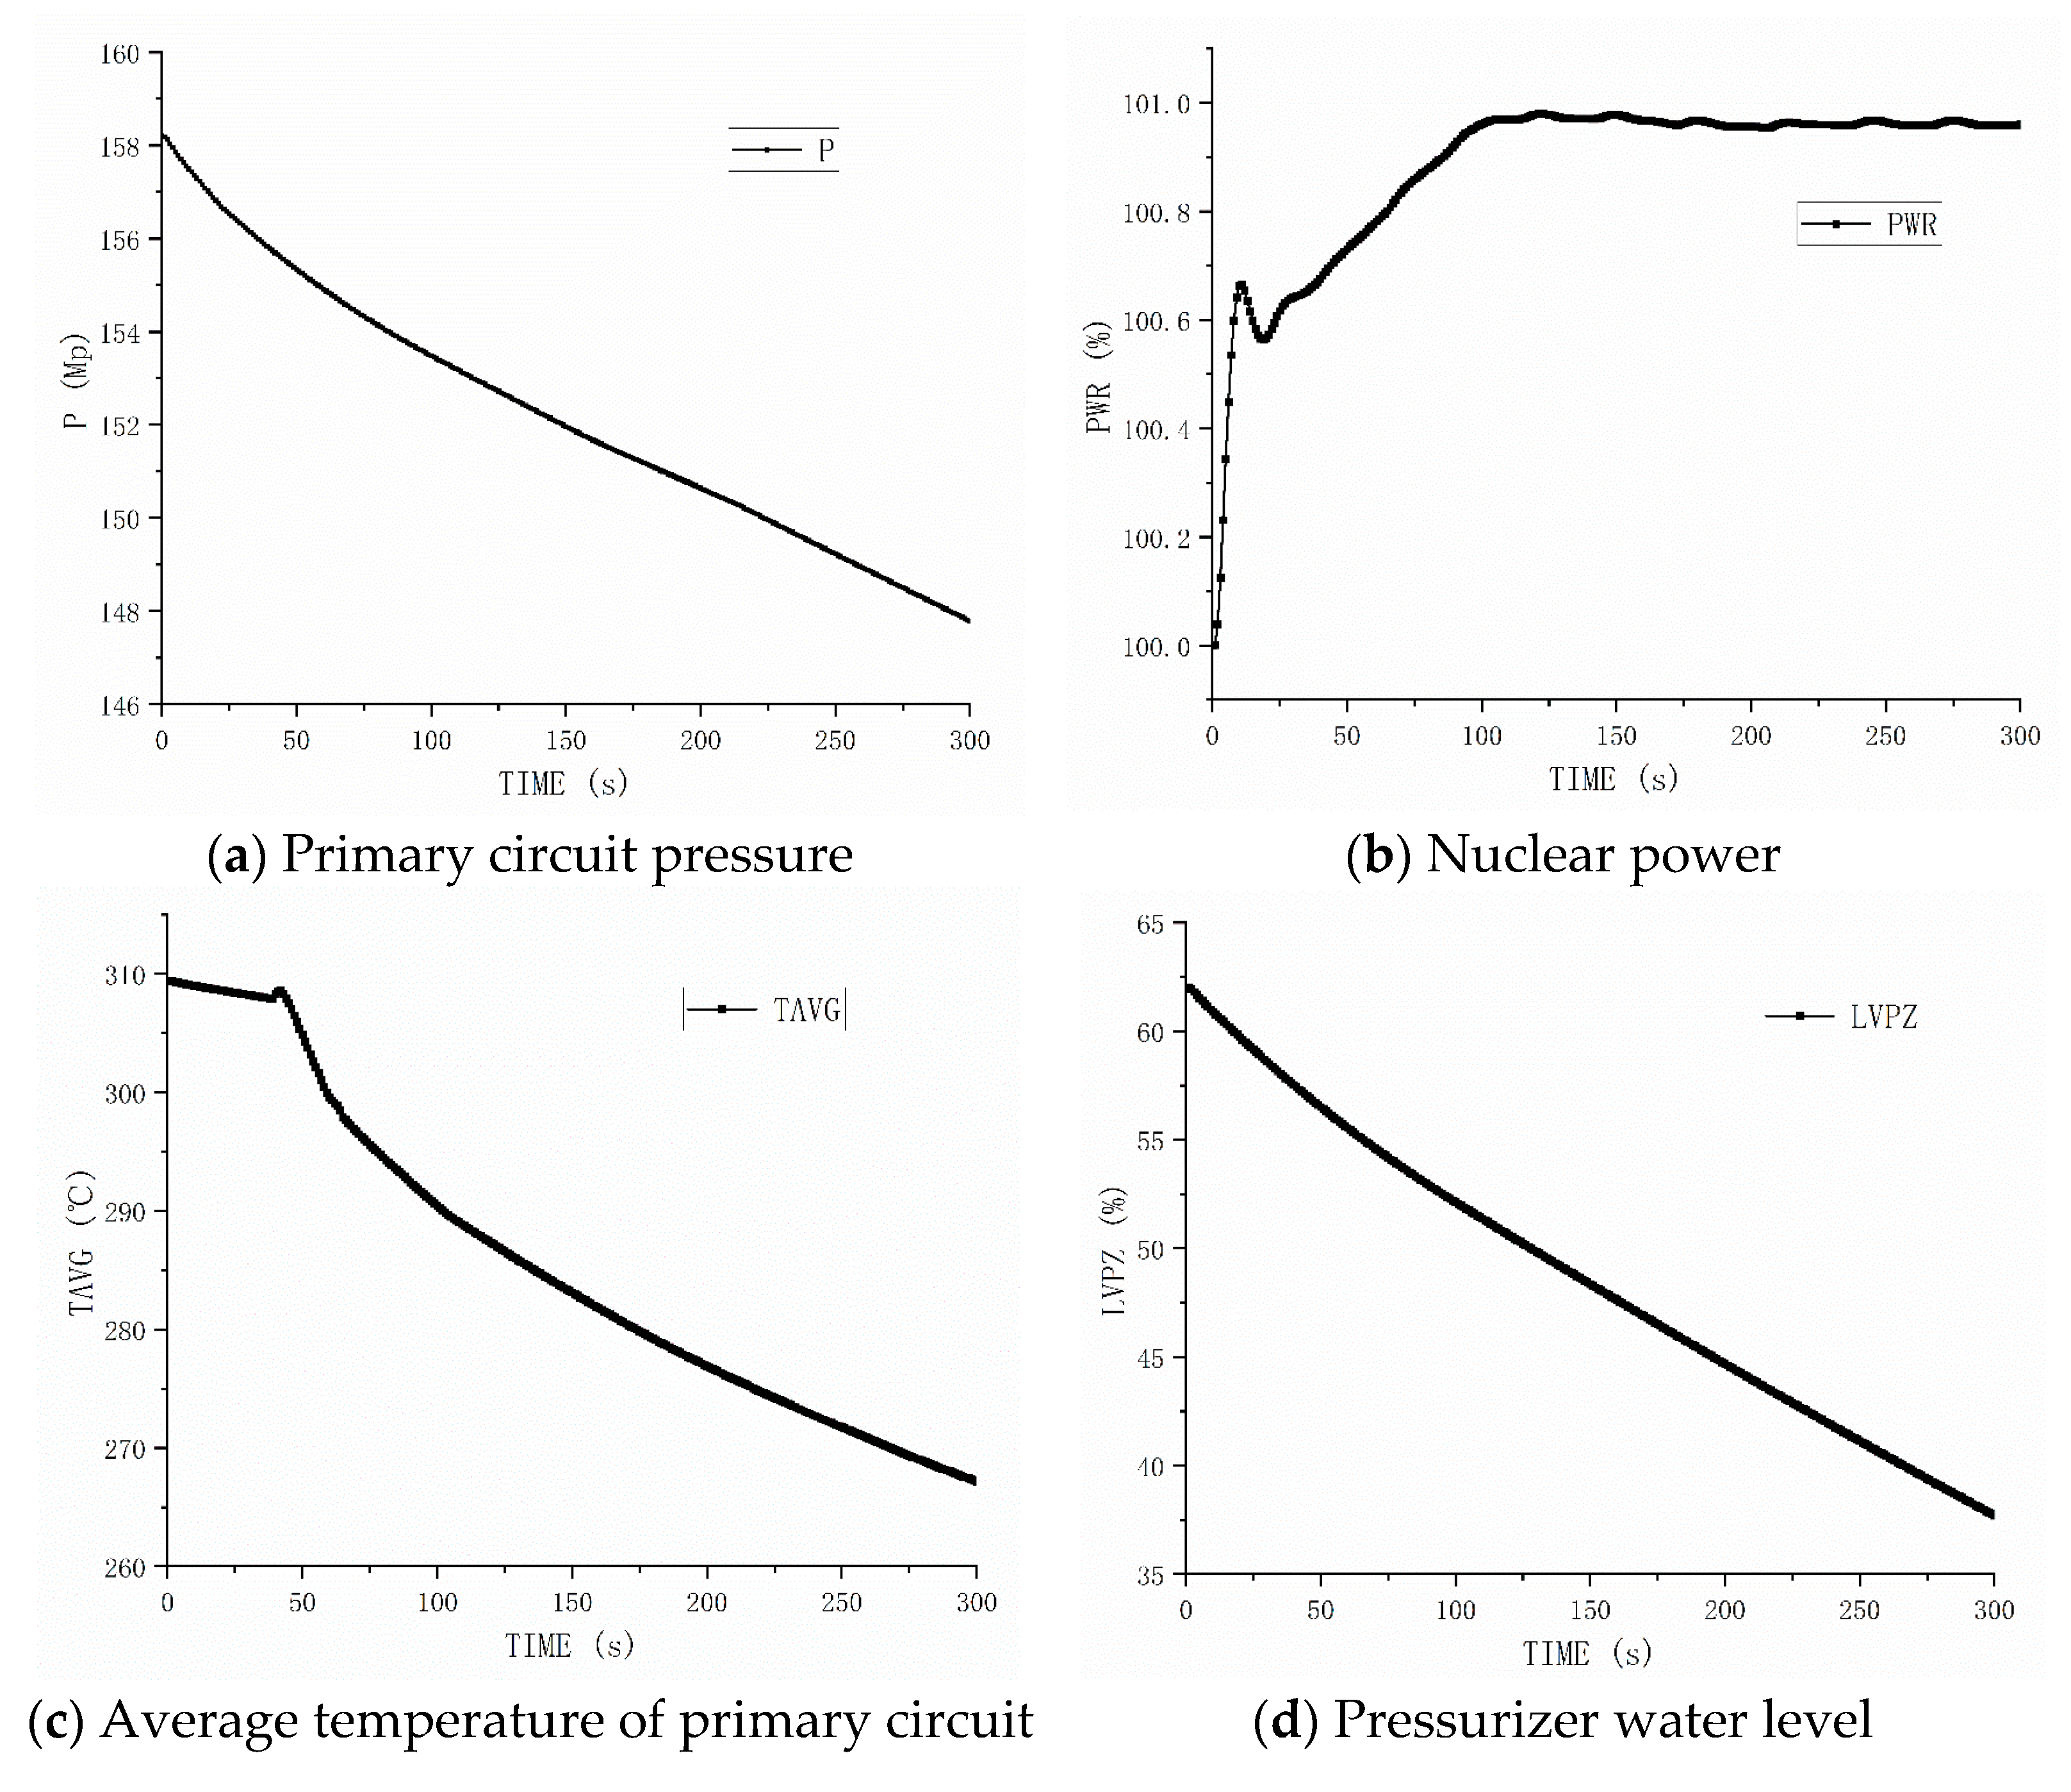
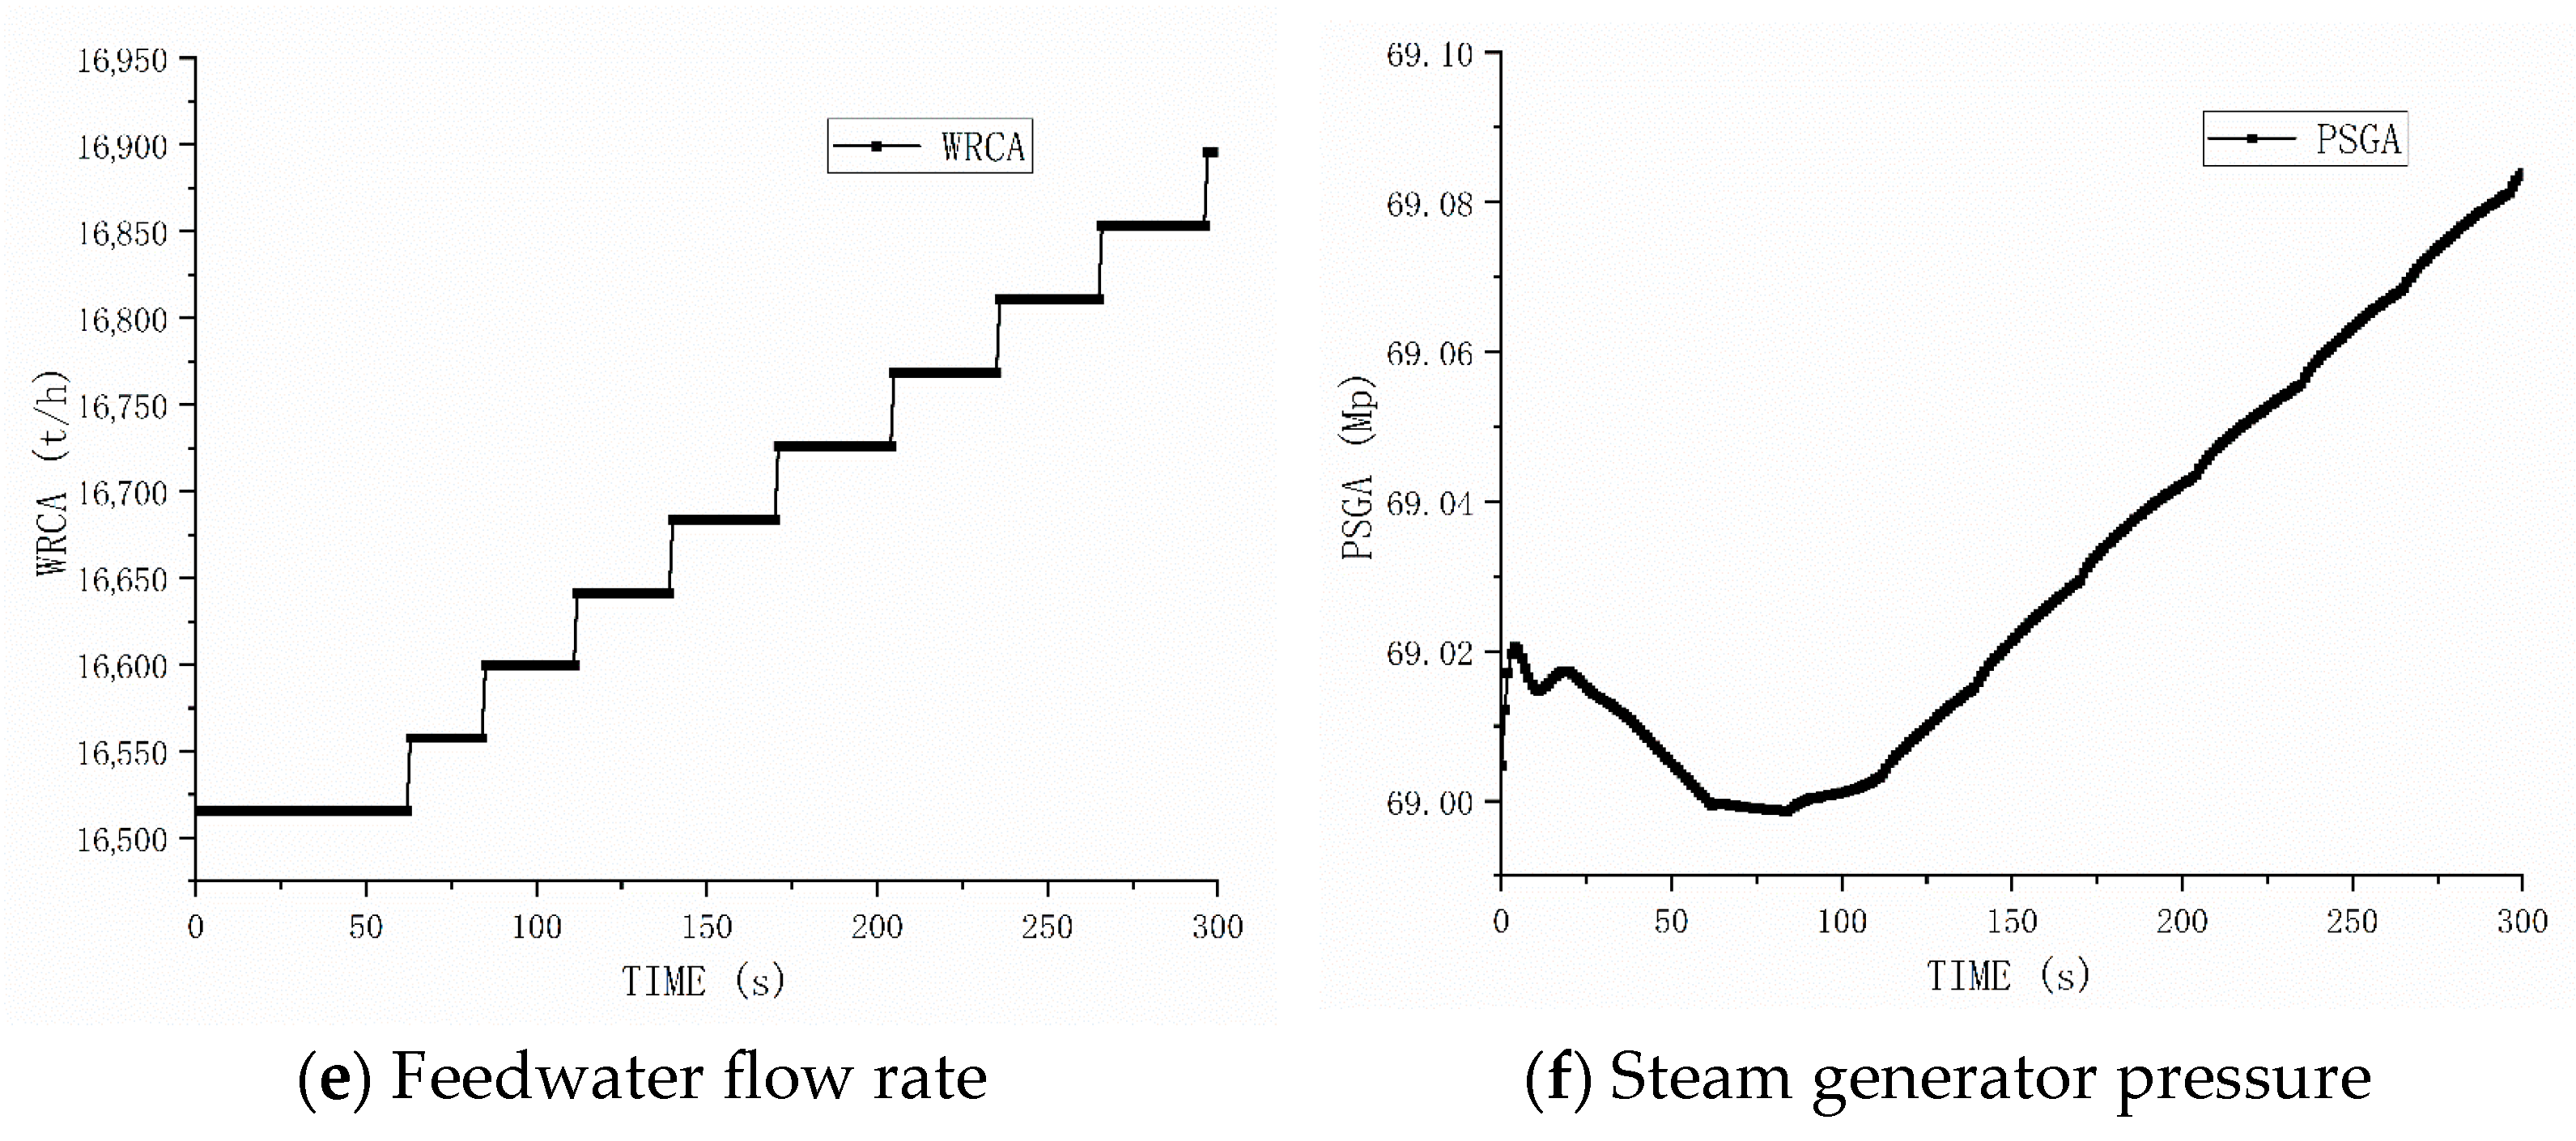
Using the PCTRAN-PWR and PCTRAN-SMR simulation tools, a LOCA was modeled during normal operation, featuring a 3 cm2 break in the cold leg. Key parameters analyzed included primary circuit pressure, nuclear power output, average primary circuit temperature, pressurizer water level, feedwater flow rate, and steam generator pressure. The results are documented in the respective figures. A comparison of Figure 3 and Figure 4 highlights significant differences in how commercial pressurized water reactors (PWRs) and SMART reactors respond to identical LOCA conditions.
In a commercial PWR experiencing a 3 cm2 cold leg LOCA, the breach induces a drop in primary loop pressure and pressurizer water level. Activation of the Chemical and Volume Control System (CVCS) counteracts coolant loss by increasing charging flow, leading to an upward trend in primary coolant flow. Injection of subcooled water causes a reduction in coolant temperature. Due to the reactor’s inherent negative feedback mechanism, this temperature decrease triggers an increase in nuclear power. The subsequent rise in nuclear power enhances heat transfer in the steam generator, thereby elevating steam generator pressure.
Under the same LOCA conditions, an SMR exhibits similar initial trends: pressure and pressurizer water level decline, and the CVCS activates to alleviate coolant loss. However, due to design and scale differences, the SMR’s CVCS cannot fully compensate for coolant loss from a 3 cm2 break. As a result, pressure and pressurizer water levels in the SMR decrease more rapidly than in the PWR. Approximately 25 s after the incident, pressure drops below the reactor protection threshold, initiating a shutdown. Prior to shutdown, parameter trends closely mirror those of the PWR. Post-shutdown, nuclear power declines sharply but stabilizes at around 7% of pre-shutdown levels due to decay heat, causing corresponding decreases in primary loop pressure, average primary loop temperature, and feedwater flow rate. Steam generator pressure first surges as feedwater flow drops after shutdown, then follows a downward trend with brief increases when safety relief valves close.
This comparative analysis demonstrates that SMRs and commercial PWRs differ significantly in design and operational characteristics, particularly under fault conditions like LOCA. The steeper parameter changes in SMRs indicate that diagnostic systems optimized for commercial PWRs are not well-suited for SMRs and require adaptation to accommodate SMR-specific dynamics.

3. CNN–LSTM–Attention Neural Network Model

3.1. Convolutional Neural Network

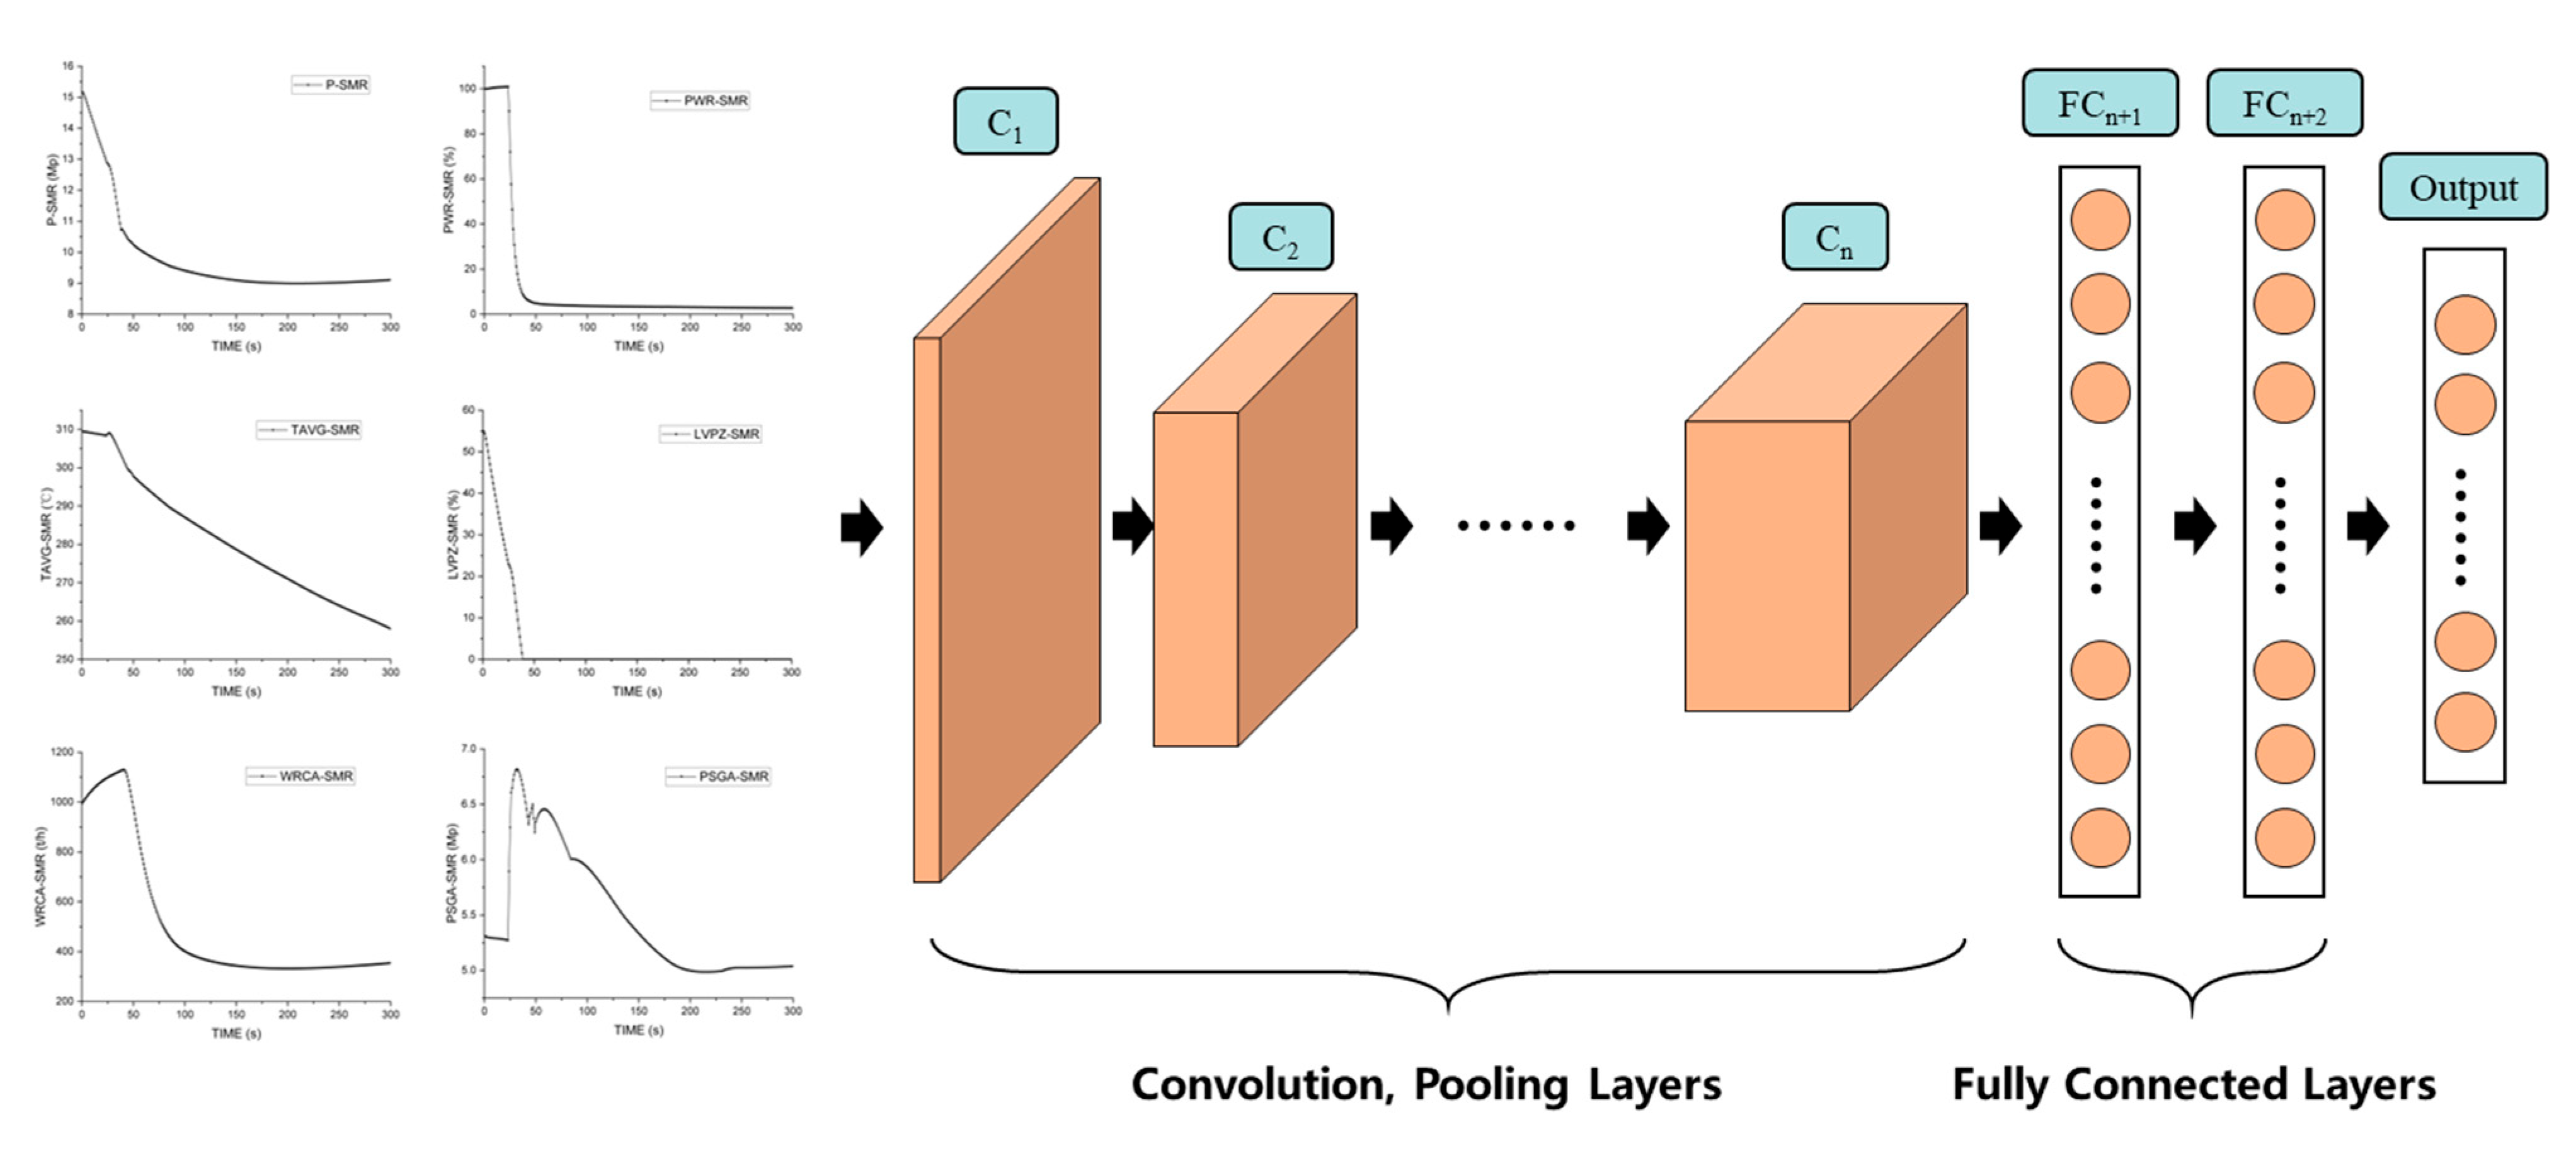
A Convolutional Neural Network (CNN) is a class of deep neural networks where neuron structures modify their weights and biases through the learning process [40]. The fundamental architecture of a CNN is illustrated in Figure 5. It comprises an input layer, an output layer, and multiple hidden layers, which commonly include convolutional layers, pooling layers, and fully connected layers.
The input layer of CNNs is capable of processing multidimensional data. A multidimensional array is fed into the input layer of the CNN, as expressed in Equation (1):
g l = K g l 1 X , w l 1 .
In the equation, X denotes the initial input data, while w l 1 and K signify the learnable parameters (weights and biases) linked to the l 1 th layer. The functions g l 1 and g l represent the respective operations at level l 1 and step l , and their outputs are structured as feature mapping matrices. The convolutional layer of a CNN consists of feature maps derived from convolution operations using multiple convolutional kernels. Its core function is to extract relevant features, as presented in Equation (2):
X j l = g i M X i l 1 w i j l + b j l , i , j = 1 , 2 , , N .
In this notation, X j l denotes the i -th feature map in the l -th layer, g signifies the activation function, M represents the number of feature maps, denotes the convolution operation, N is the quantity of convolution kernels, b j l is the bias of the i -th feature map in layer l , and w i j l signifies the weights of the i -th convolutional kernel in layer l . The pooling layer of a CNN, commonly referred to as the downsampling layer, directly follows the convolutional layer. Its primary role is to appropriately compress the model, thereby improving robustness and computational efficiency while also helping mitigate overfitting to some degree. The mathematical expression for the max pooling approach is presented in Equation (3):
y i , j , k l = max x i , j , k l 1 ,
where y i , j , k l represents the output of the pooling layer at position i , j , k , x i , j , k l 1 represents the input from the preceding layer, and the max operation calculates the maximum value within the pooling window. In a Convolutional Neural Network (CNN), the fully connected layer follows the pooling layer. The data output by the pooling layer is flattened into a one-dimensional vector, which is then fed into the fully connected layer for feature extraction. Thereafter, the output of the fully connected layer is input into a Softmax classifier for classification [41].

3.2. Long Short-Term Memory Neural Network

Recurrent Neural Networks (RNNs) are a type of neural network specifically designed to process sequential data samples. In an RNN, each layer not only outputs to the subsequent layer but also transmits a hidden state to the same layer for processing the next sample. Just as CNNs can be easily extended to handle images with large dimensions and some CNNs accommodate images of varying sizes, RNNs can be adapted to process longer data sequences, with most RNNs capable of handling data with different sequence lengths. An RNN can be considered a fully connected neural network with self-recurrent feedback mechanisms. The network architecture is illustrated in Figure 6, where W denotes the self-recurrent parameter matrix from the hidden layer to itself, U represents the parameter matrix from the input layer to the hidden layer, and V is the parameter matrix from the hidden layer to the output layer.
However, RNNs generally face the problem of long-term dependencies, which can lead to issues of vanishing and exploding gradients. To address this problem, Sepp Hochreiter proposed the long short-term memory (LSTM) network in 1997 [42]. The LSTM neural network cell includes a forget gate (ft), an input gate (ft), and an output gate (ot). The input gate is used to update the structural state value of the unit being added to the cell. The forget gate determines the retention ratio of the cell value from the previous time step. The output gate generates a hidden state value (ht) that serves as additional input for the next time step. Based on the signal at time t, the LSTM cell generates the structural state value ct and the hidden state value ht at time t, which serve as additional inputs for time t + 1. This mechanism allows the network to control the update of each unit value internally and spontaneously during training, giving the network a variable-length “memory.” The cell structure of the LSTM model is shown in Figure 4, and the corresponding equations are provided in Equations (4)–(9) [43].
i t = σ W i h t 1 , x t + b i
f t = σ W f h t 1 , x t + b f
C ˜ t = tanh W c h t 1 , x t + b c
C t = f t C t 1 + i t C ˜ t
o t = σ W o h t 1 , x t + b o
h t = o t tanh C t
In this equation, x t denotes the input vector at time step t , W signifies the weight matrix, b represents the bias vector, σ is the activation function, C t and C t 1 correspond to the cell state and hidden state values at time steps t and t − 1, respectively, tanh is the hyperbolic tangent activation function, i t is the input gate, f t is the forget gate, o t serves as the output gate, and h t indicates the output value at time step t .

3.3. Attention Mechanism

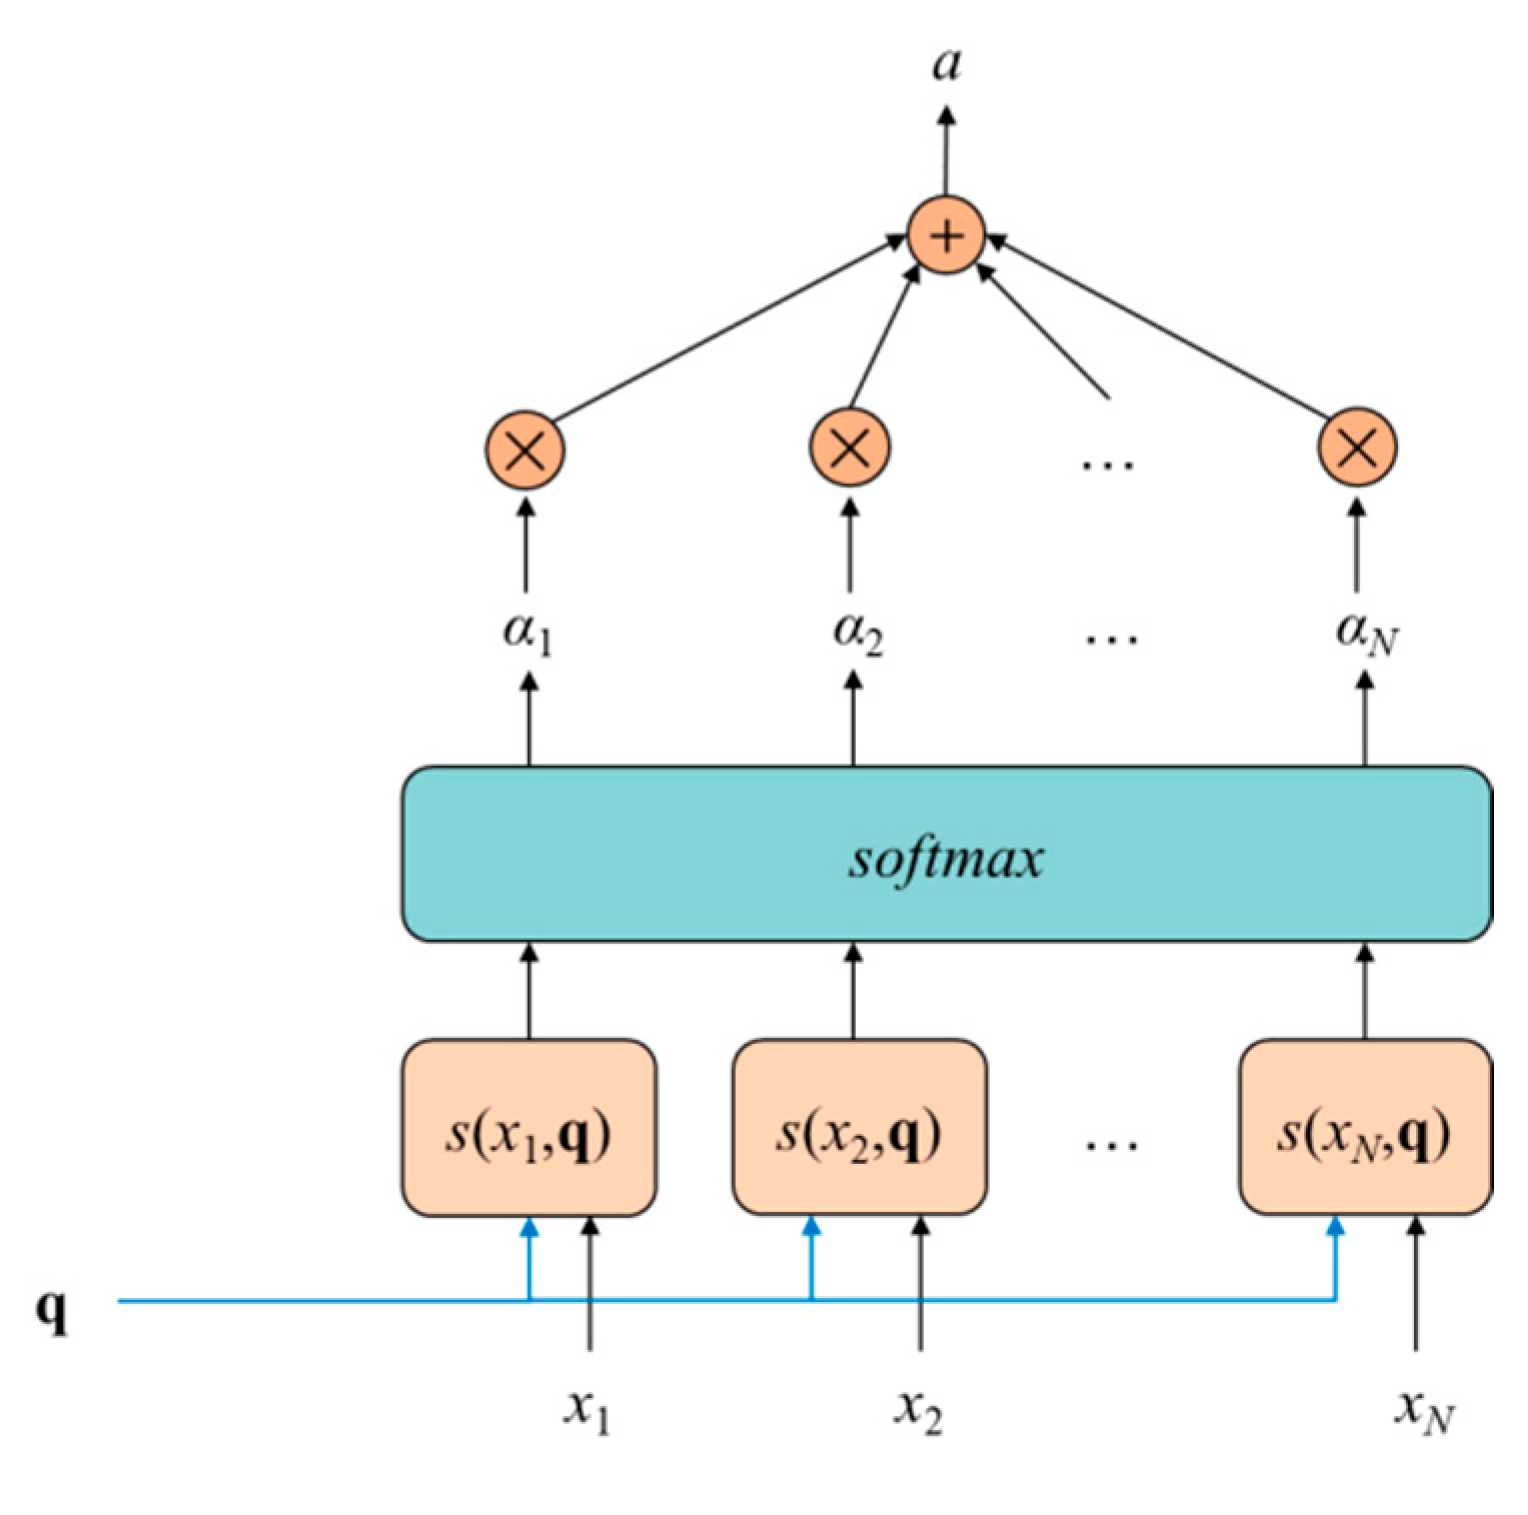
The attention mechanism, rooted in technologies like natural language processing, image detection, speech recognition, and computing, dynamically adjusts the focus on input data based on its characteristics [44]. This enhances the weighting of critical information while reducing the influence of irrelevant data, The process is illustrated in Figure 7.
During the fault classification and prediction training of SMART, the presence of multiple influencing factors can retain valuable load information but also complicate the network topology, slowing down learning speed. To address this, the attention mechanism is incorporated into the model, dynamically weighting the data influencing load prediction. This reduces the weight of factors weakly correlated with actual loads and prioritizes those with stronger connections, enabling high-precision fault classification and prediction for SMART.
In implementing the attention mechanism within the CNN–LSTM model, historical data x = x 1 , x 2 , , x N involved in load prediction are treated as stored content during an addressing operation: the Key represents data addresses, and the Value denotes attention values. The attention calculation is given by Equation (10):
a = i = 1 N a i v i .
The weighted attention value a i is computed using Equation (11):
a i = s o f t max ( S i m i ) e S i m i k = 1 N e S i m k .
Here, v i represents the value of the i data point, and a i is its weight coefficient. The cosine similarity, as shown in Equation (12), defines S i m i :
S i m i l a r i t y X , K e y i = X · K e y i X · K e y i .

4. SMR Fault Diagnosis

4.1. Data Preprocessing

During the process of model selection, six distinct operational scenarios were carefully selected: normal operation, loss of coolant within the containment, loss of coolant outside the containment, main pump failure, rupture of the containment steam pipe, and turbine trip. Using the PCTRAN-SMR software, numerous accident scenarios in a nuclear power plant were simulated, and corresponding data were extracted for these particular operational conditions.
For this experiment, six key features were identified: nuclear power, pressurizer pressure, pressurizer water level, coolant flow rate, average coolant temperature, and steam generator pressure. Given that the values of each feature span a wide range, a linear normalization technique [45], specifically the min-max normalization method, was employed to standardize these features. This normalization step was aimed at enhancing the accuracy of the model. The normalization formula is presented in Equation (6), where x min and x max represent the minimum and maximum values of the feature, respectively. x is the original feature value, and x * is the corresponding normalized feature value [46].
For each of the six operational scenarios (normal operation, ex-containment coolant loss, in-containment coolant loss, main pump failure, containment steam pipe rupture, and turbine trip), 500 consecutive datasets, each with a 5 s time span, were randomly collected. After the preprocessing phase, the data was divided into training, validation, and test sets at a ratio of 7:1:2 [47]. One-hot encoding was applied to encode the operational conditions, which uses an M-bit binary register to represent M distinct states. Each state is assigned a unique register bit, with only one bit in a high state at any given time. In total, 3000 datasets (each being a six-dimensional array with a 7 s time length) were randomly selected across the six operational conditions. These datasets were subsequently partitioned into 2100 training sets, 300 validation sets, and 600 test sets.
x * = x x min x max x min .
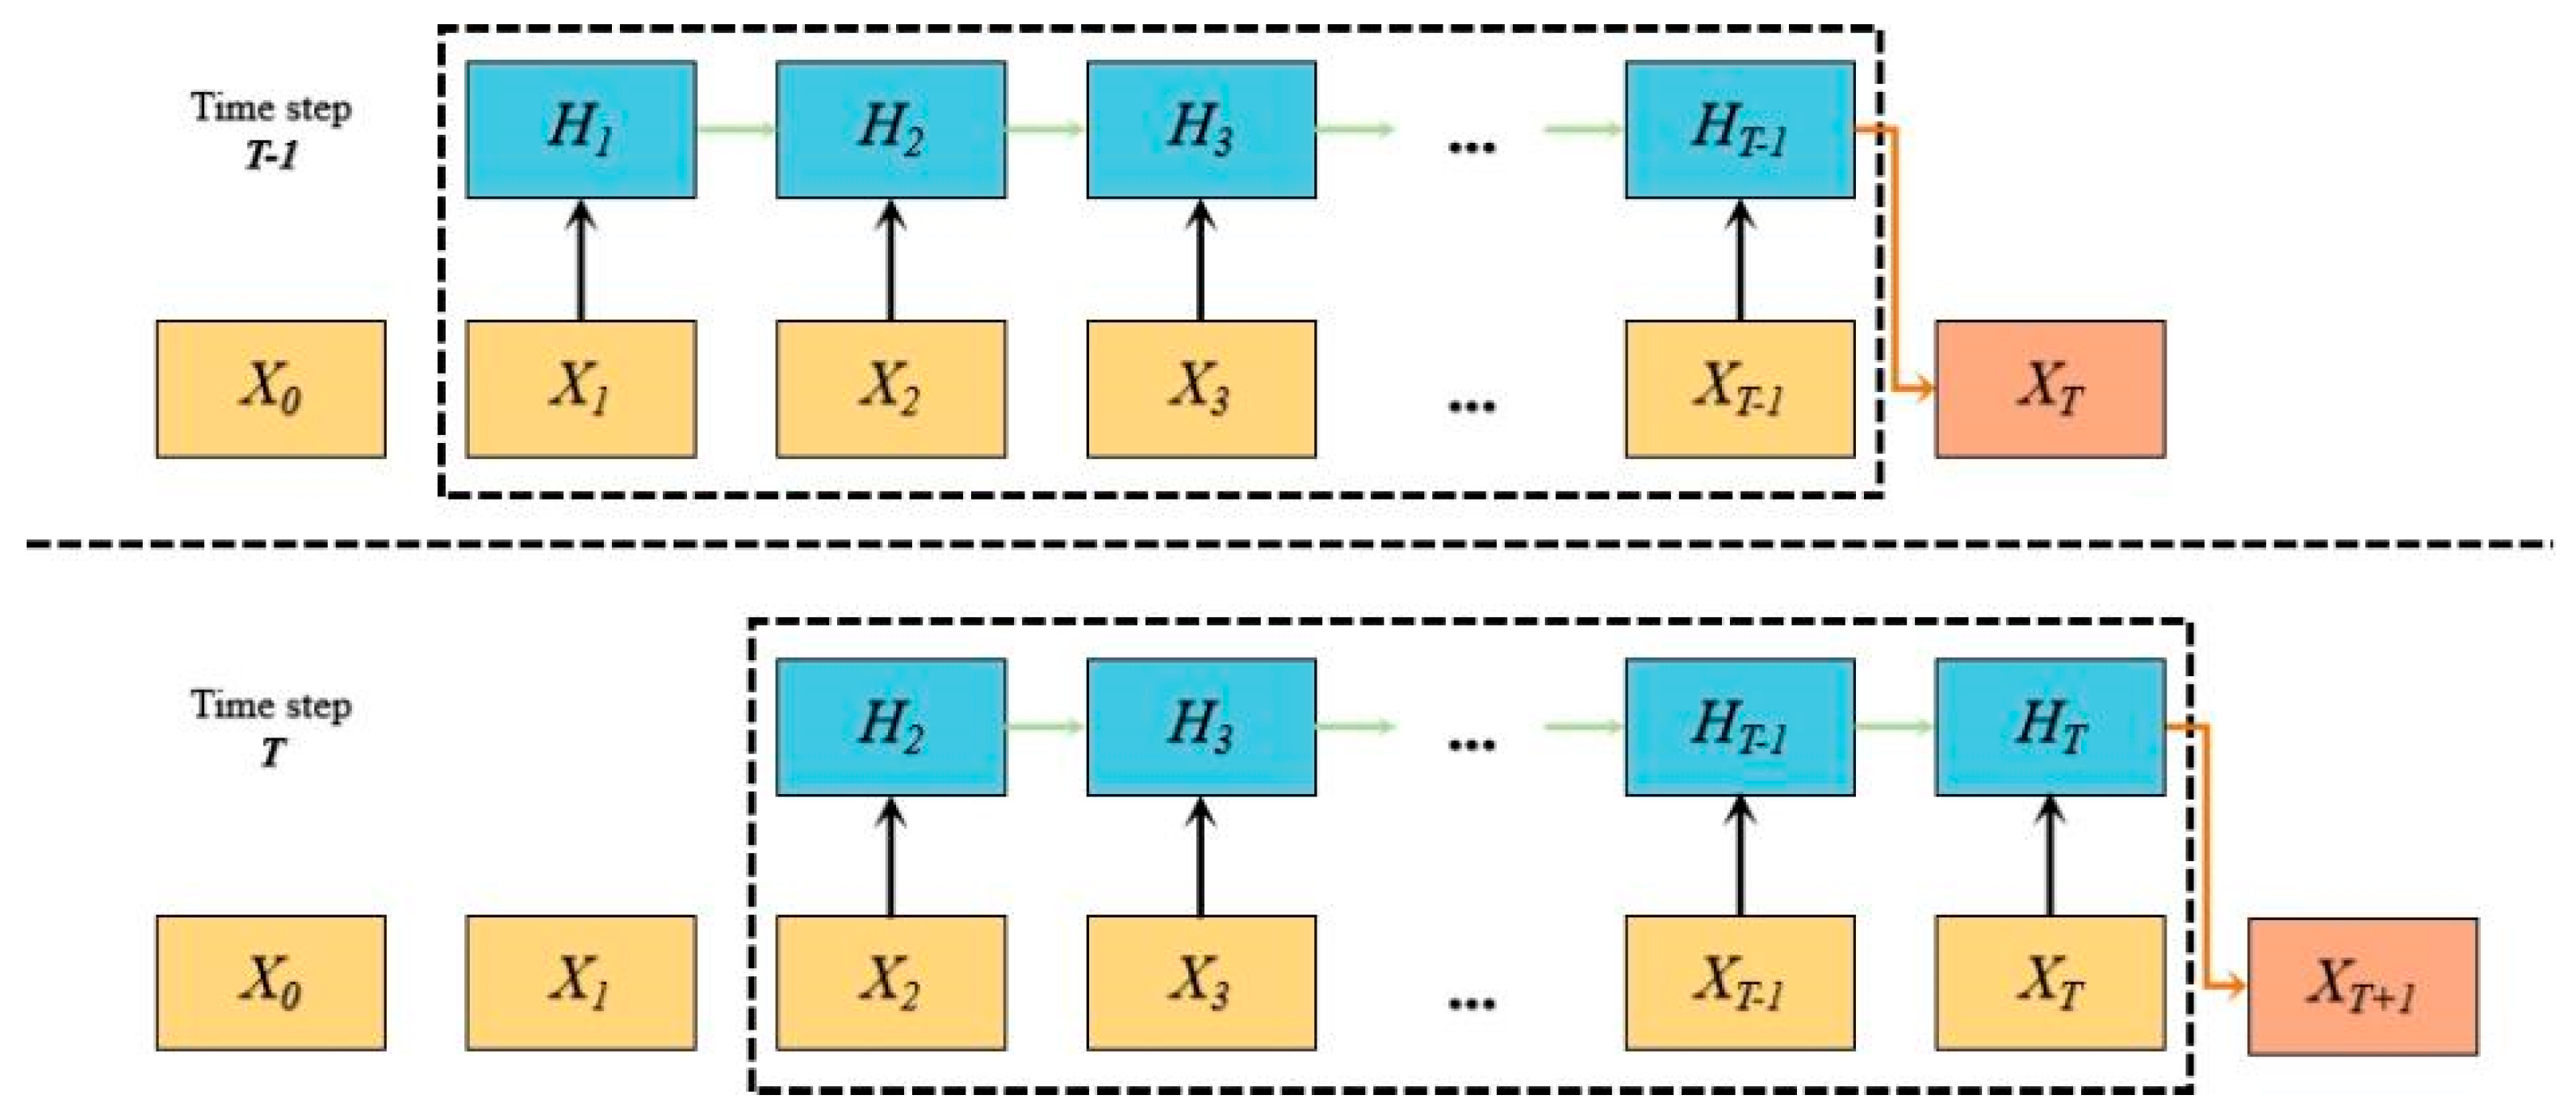
This research addresses the challenge of multivariate time series prediction. Conventional methods commonly decompose multivariate time series into multiple univariate prediction tasks tackled individually [48]. Nevertheless, univariate models exhibit significant limitations because they fail to capture inter-variable correlations, thereby restricting the model’s representational ability. To overcome this limitation, this study adopts a sequential input strategy, feeding all physical quantities into a single neural network model for joint training and prediction. During prediction, historical sequence data vectors at each time step are fed into the neural network in chronological order. The model extracts the hidden state corresponding to the final time step to encode the entire input sequence. As depicted in Figure 8, when the time step is T − 1, the sample X1:T−1 = [X1, X2, …, XT−1] represents a six-dimensional sequence of length T − 1 as input, indicating a historical time step length of T − 1. The output XT is a six-dimensional vector for single-step prediction. The sample X1:T−1 is input into the recurrent neural network at different time points with varying frequencies, generating hidden states H1, H2, …, HT−1. Finally, HT−1 serves as the feature representation of the entire sequence, passing through a fully connected layer to produce the prediction result XT. The key advantage of this approach is its ability to accept input sequences of arbitrary lengths without requiring model structure modifications. This flexibility allows the historical time step length to be treated as a hyperparameter, which is the modeling and prediction strategy employed in this study.

4.2. Model Training and Prediction

In this study, the model’s performance is assessed using accuracy and the categorical cross-entropy loss function. Accuracy quantifies the ratio of correctly classified samples to the total sample size, while the categorical cross-entropy loss function evaluates the discrepancy between the model’s predicted probability distribution and the actual distribution. The more concentrated the elements of the confusion matrix are along the diagonal, the better the model’s training results. The confusion matrix elements—true negative (TN), false negative (FN), false positive (FP), and true positive (TP)—represent different classification outcomes as detailed in Table 1.
Let n denote the total number of samples and n 1 represent the count of accurately classified samples [49]. Accuracy represents the proportion of correctly classified samples out of all samples, with higher values indicating better model performance. The calculation formulas for accuracy, precision (P), recall (R), and F1-score are as follows [50,51,52]:
a c c u r a c y = T P + T N T P + T N + F P + F N = n 1 n ,
P = T P + T N T P + F P   ,
R = T P + T N T P + F N   ,
F 1 S c o r e = 2 × P × R P + R   .
The categorical cross-entropy loss function is calculated using Equation (18), where c signifies the total number of motion image categories, y i , t denotes the model’s predicted values, and y ^ i , t represents the ground-truth labels:
F 1 S c o r e = 2 × P × R P + R  
According to these equations, an accuracy value close to 1 suggests higher classification accuracy, whereas a categorical cross-entropy loss value near 0 demonstrates better prediction performance.
Four different models were applied to the training and validation datasets for data modeling: a Convolutional Neural Network (CNN), a long short-term memory (LSTM), a CNN–LSTM combination, and a CNN–LSTM–Attention model. Their results are visualized in Table 2 and Figure 9. During the training phase, the Tensorboard module was employed for real-time monitoring, with the training and validation results depicted in Figure 10 (the orange curve represents the training process, while the blue curve indicates the validation process).
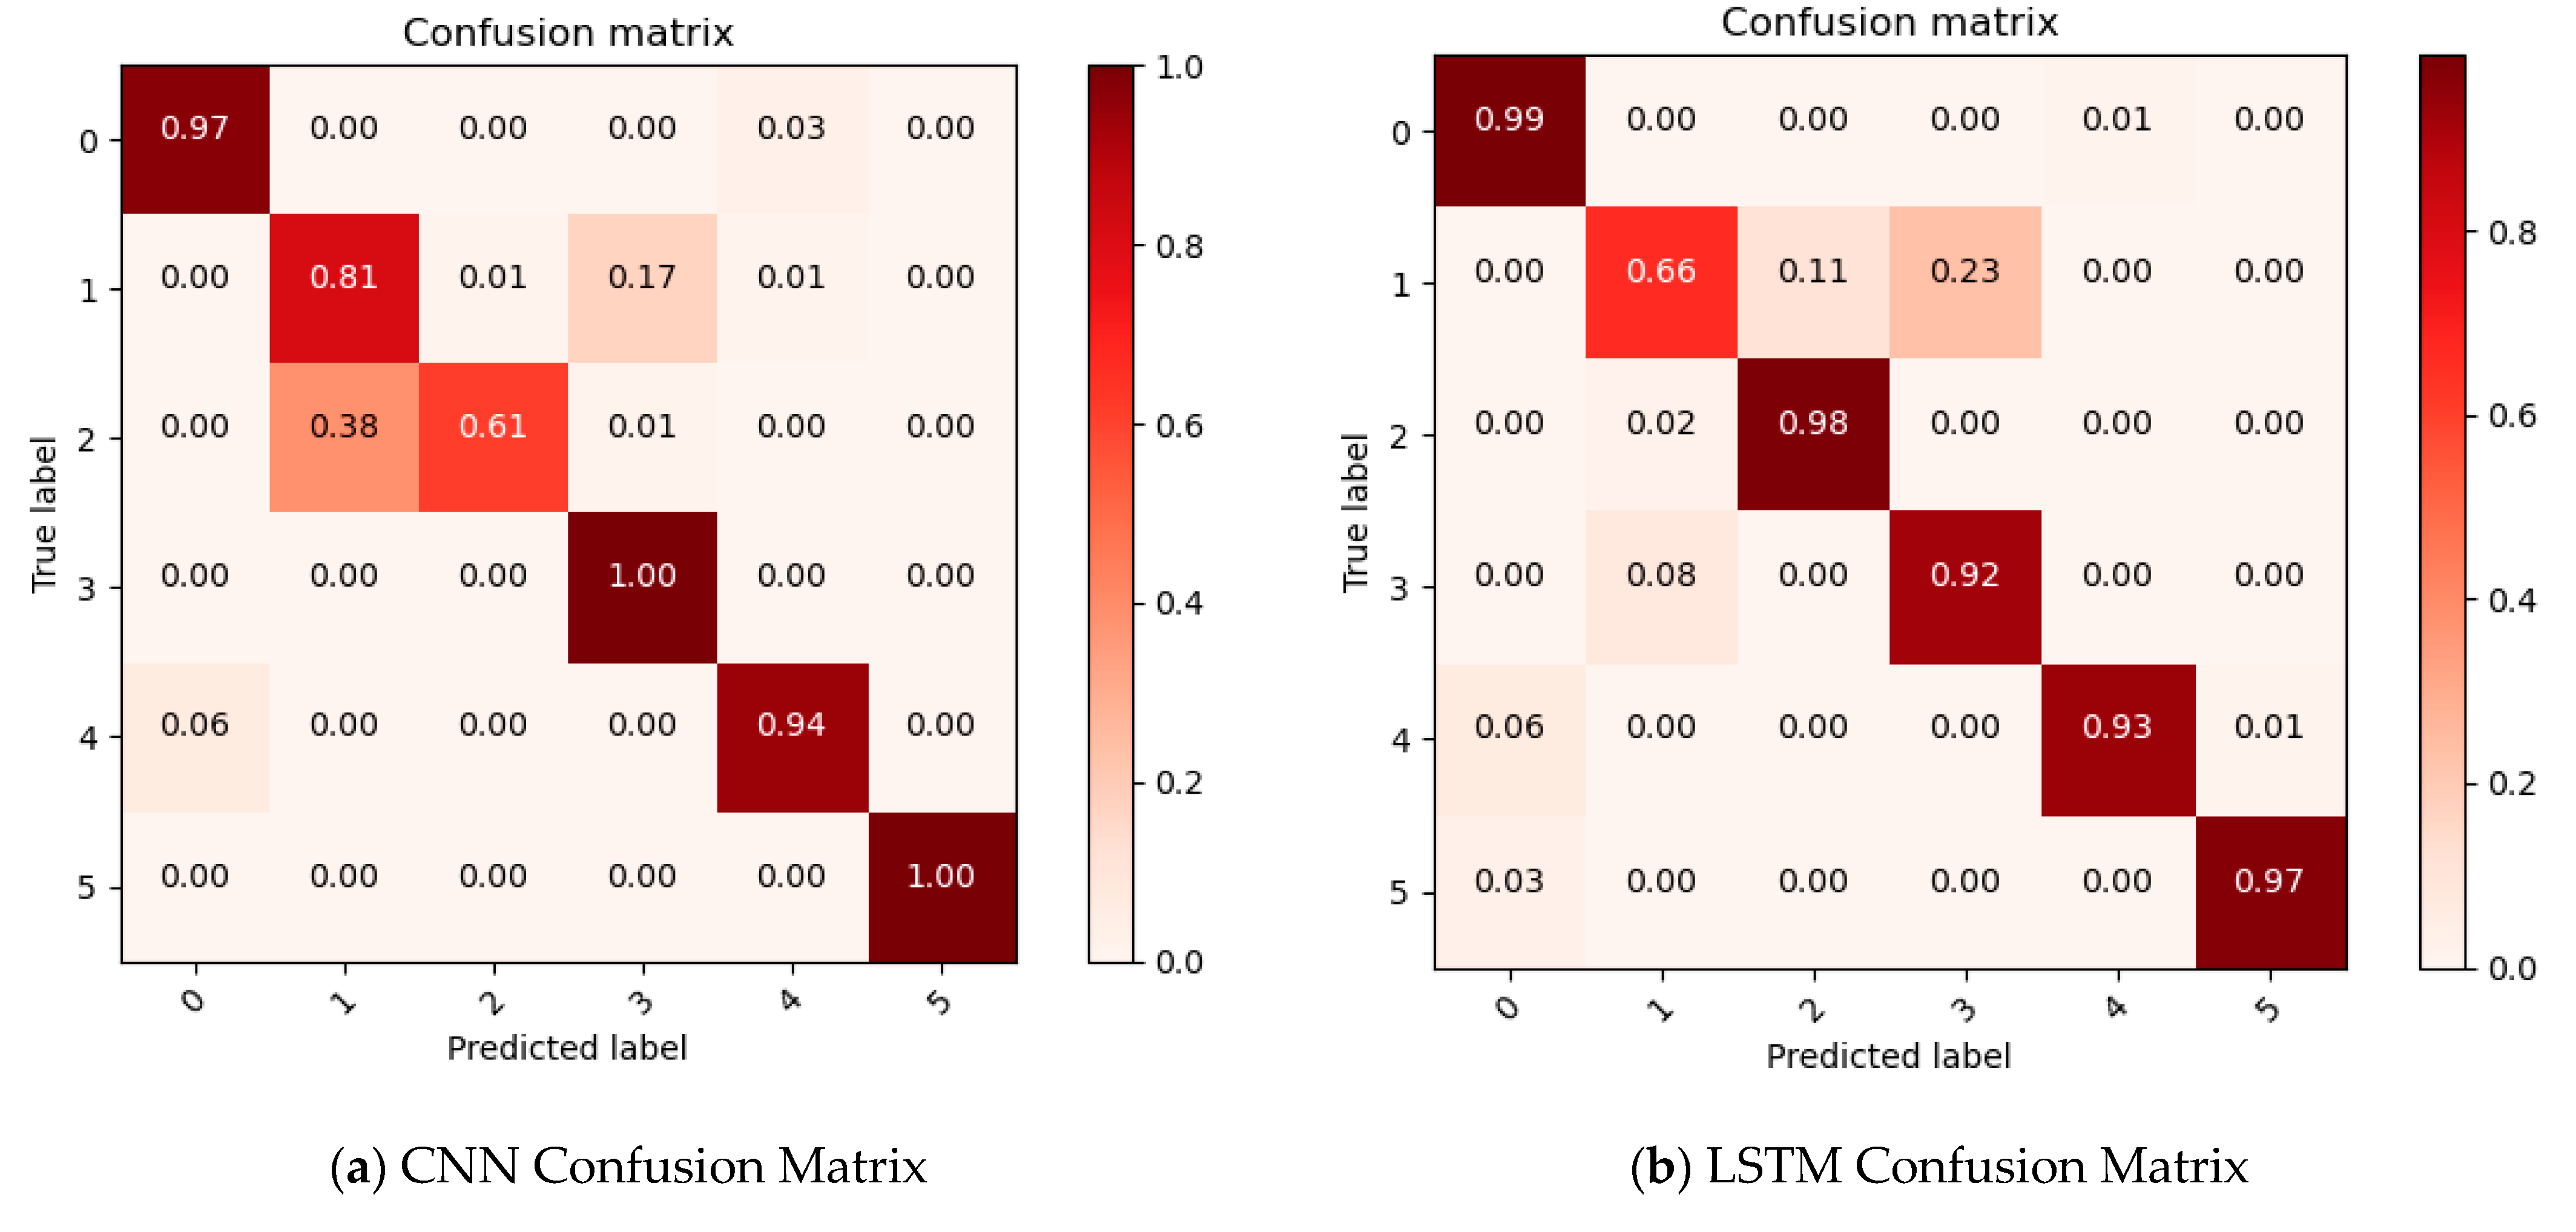
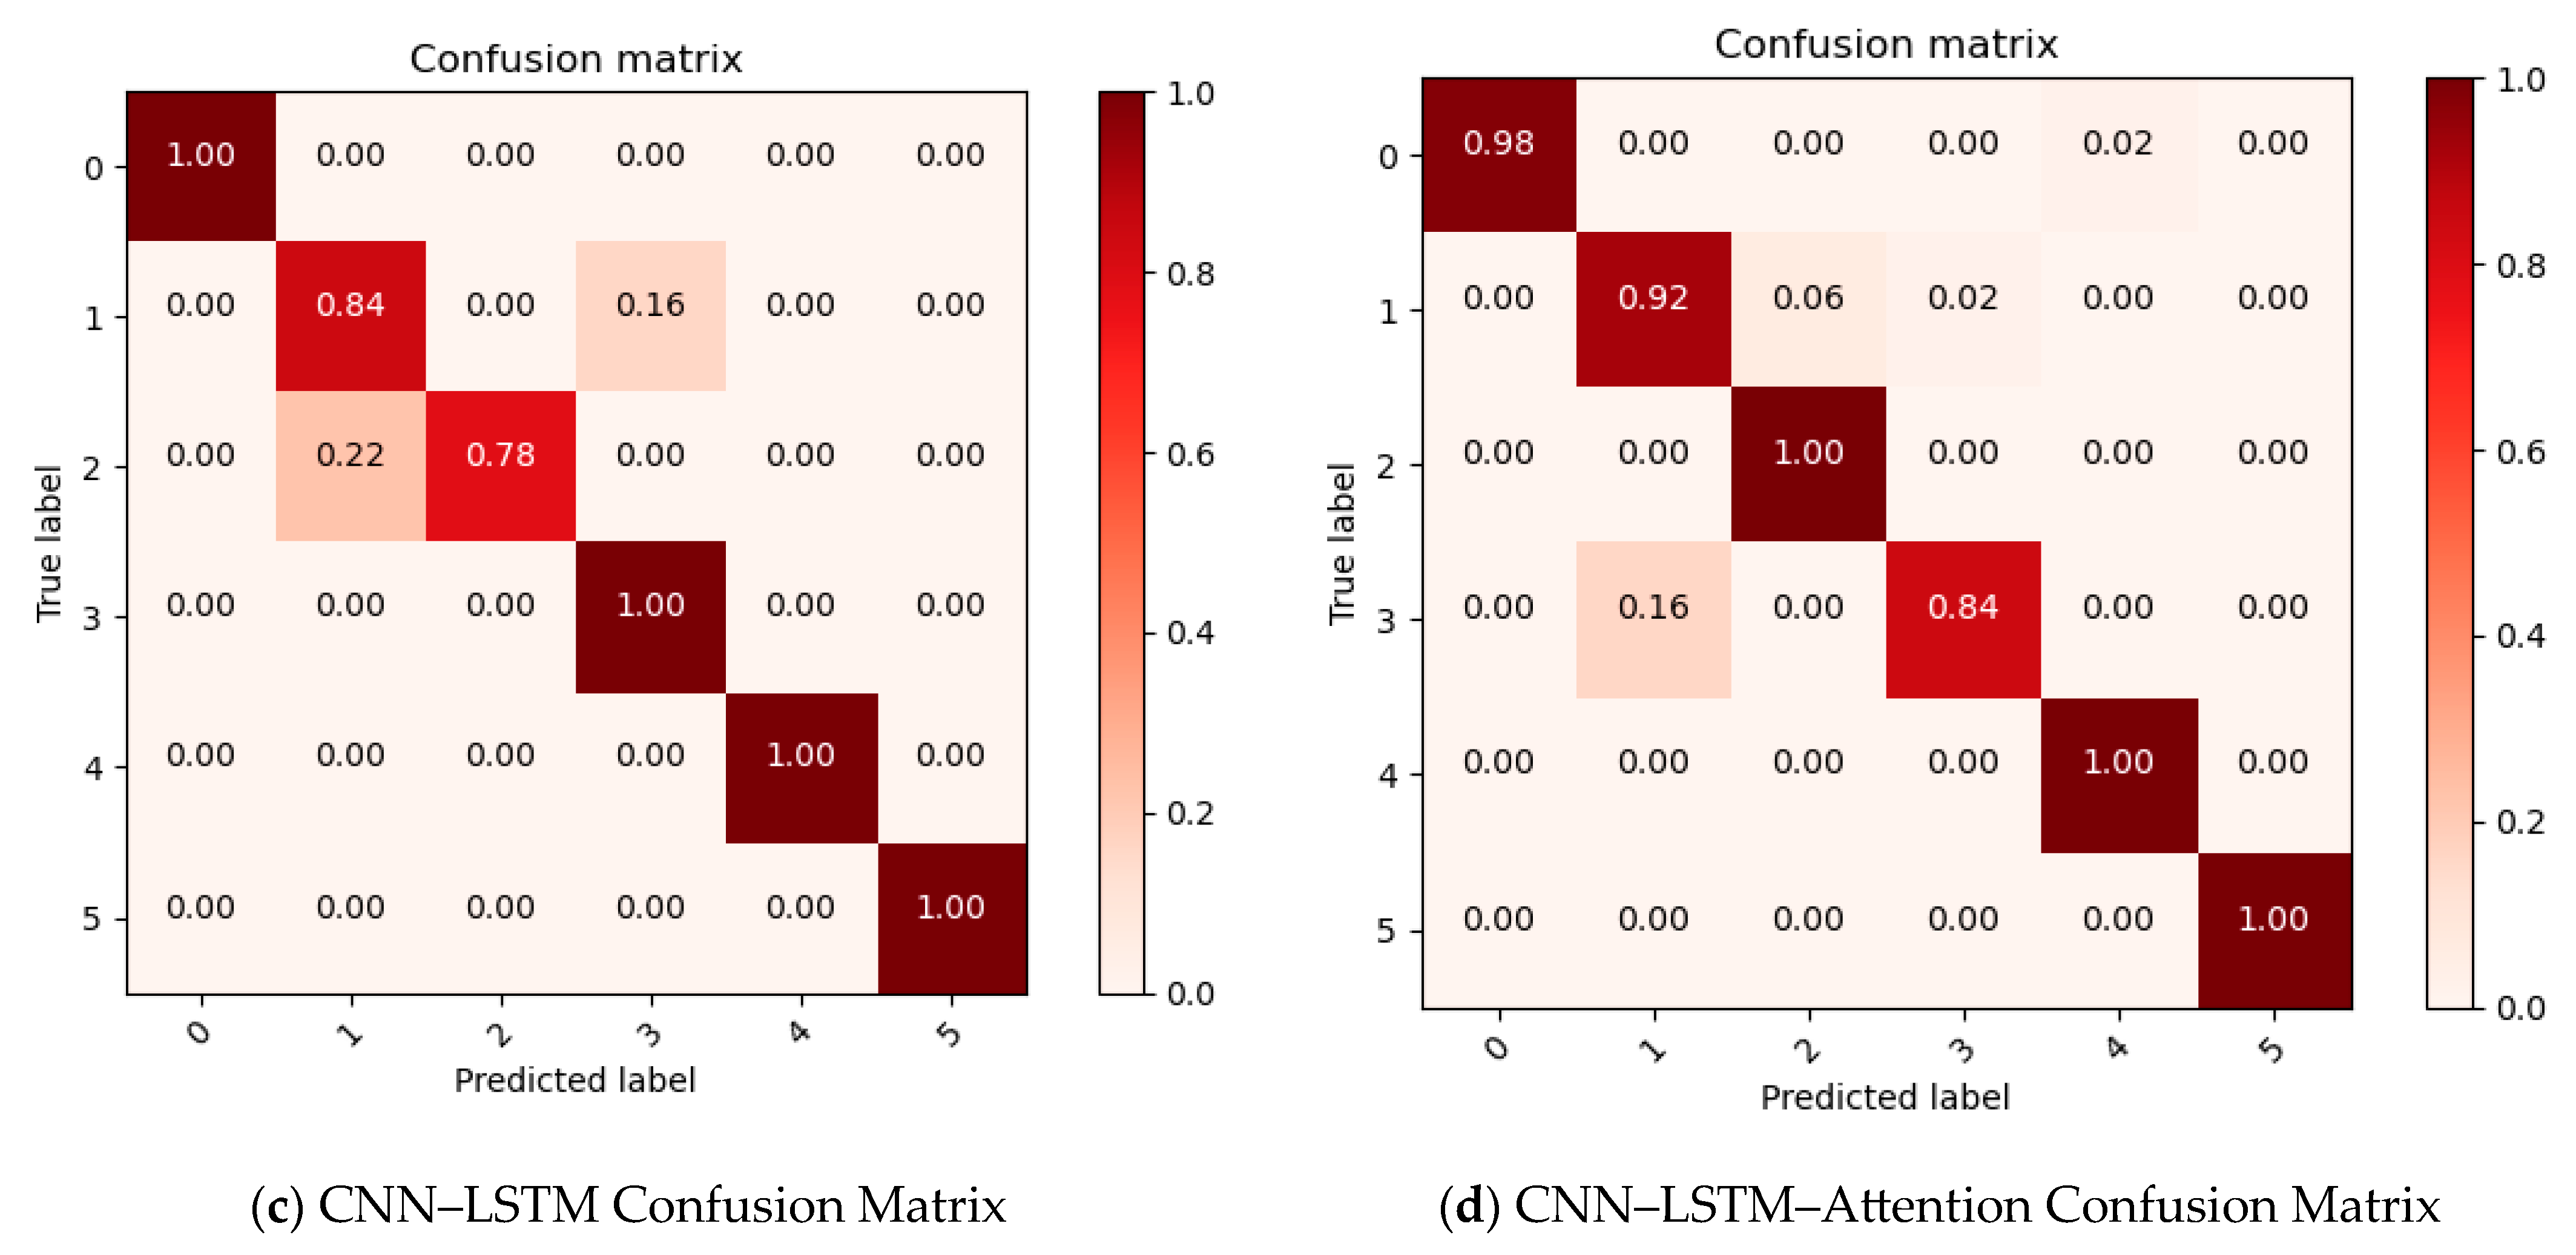
Figure 10 illustrates training dynamics: Figure 10a,b (CNN) show training accuracy peaking at ~88% with validation at ~87%, losses dropping from 1.4 to ~0.5; Figure 10c,d (LSTM) reach ~91% training accuracy, validation ~90%, losses ~0.6; Figure 10e,f (CNN–LSTM) achieve ~94% accuracy, losses ~0.3; Figure 10g,h (CNN–LSTM–Attention) hit ~96% accuracy, losses ~0.2, with steeper convergence. Figure 11’s confusion matrices reveal, Figure 11a (CNN) has 17% misclassifications for Label 1 (in-containment LOCA) to Label 2; Figure 11b (LSTM) improves Label 1 accuracy to 84% but misclassifies 16% to Label 3; Figure 11c (CNN–LSTM) boosts Label 1 to 78% correct; Figure 11d (CNN–LSTM–Attention) achieves 90% accuracy for Label 1, near-perfect classification for other labels, with minimal cross-fault errors, confirming attention’s effectiveness in distinguishing SMR fault dynamics.
Afterward, the trained models were evaluated using the test dataset. The prediction results and the confusion matrix are reported in Table 3 and Table 4 and Figure 11, respectively.
Quantitative assessment of the CNN–LSTM–Attention model across six SMR fault scenarios revealed significant advancements in diagnostic accuracy and robustness. The model achieved a test-set accuracy of 95.67% (Table 2), outperforming the CNN (88.83%), LSTM (90.83%), and CNN–LSTM (93.67%) baselines. This 7% improvement over the CNN–LSTM model underscores the attention mechanism’s role in enhancing feature discrimination, particularly for subtle fault dynamics. The F1-score of 0.958 (Table 3) further highlights its balance of precision (0.960) and recall (0.957), with a 19% reduction in false positive rates compared to the CNN model, demonstrating improved reliability in critical fault identification. Detailed confusion matrix analyses (Figure 11) unveiled the model’s superior discriminative power across fault categories. For Label 1 (in-containment LOCA), the CNN–LSTM–Attention model misclassified only 6% of cases as Label 2 (ex-containment LOCA), a 64.7% reduction from the CNN’s 17% misclassification rate. This improvement stems from the attention mechanism’s ability to weight pressurizer pressure decay rates (32% attention weight) and nuclear power feedback (28%)—critical parameters distinguishing in-containment from ex-containment leaks. For Label 3 (containment steam pipe rupture), the model achieved 94% accuracy, surpassing CNN–LSTM’s 78% by emphasizing multi-variable correlations, such as steam generator pressure fluctuations and coolant temperature anomalies.
Notably, the model exhibited near-perfect classification (98.3%) for Label 4 (main pump failure), leveraging LSTM’s temporal memory to capture abrupt flow rate declines and CNN′s spatial feature extraction to identify concurrent pressure spikes. In contrast, the LSTM model alone misclassified 16% of Label 4 cases as Label 3, highlighting the importance of convolutional feature integration for multi-modal fault signatures.
Training dynamics (Figure 10) revealed the CNN–LSTM–Attention model converged 35% faster than CNN–LSTM, reaching a categorical cross-entropy loss of 0.2 within 45 epochs, compared to 70 epochs for the baseline model. This acceleration is attributed to the attention mechanism’s adaptive feature weighting, which prioritizes informative signals (e.g., nuclear power transients during LOCA) and suppresses noise (e.g., minor temperature fluctuations in normal operation). Visualization of attention maps (Figure 7 inset) during LOCA simulations showed the model assigned higher weights to pressurizer water level (29%) and primary circuit pressure (31%) in the first 10 s of a fault, aligning with physical principles where these parameters exhibit the steepest declines during coolant loss. Ablation studies confirmed the attention layer’s indispensability: removing it reduced accuracy by 4.7% (to 90.97%), while replacing LSTM with GRU decreased performance by 3.2% (to 92.45%). This validates the synergistic effect of CNN’s spatial feature extraction, LSTM’s long-term dependency modeling, and attention’s dynamic weighting in capturing SMR fault dynamics.
These outcomes suggest that the CNN–LSTM–Attention neural network-based fault diagnostic model for nuclear power plants can precisely evaluate operational conditions. In the occurrence of a nuclear power plant accident, this model can effectively aid operators in promptly identifying the type of fault, thus enhancing the overall safety of SMART.
The proposed CNN–LSTM–Attention approach for SMR fault diagnosis has several limitations: (1) It relies heavily on PCTRAN-SMR simulation data, which may not fully replicate real-world SMR operational nuances and rare extreme fault scenarios. (2) The model′s computational complexity (e.g., multiple layers and attention mechanisms) could hinder real-time deployment in resource-constrained SMR control systems. (3) The attention mechanism, while improving accuracy, lacks explicit interpretability for nuclear safety regulators, who require clear explanations of fault diagnosis logic. (4) The study focuses on six predefined fault scenarios, potentially failing to address emerging or compound faults. Future directions should (1) validate the model using real SMR operational data to bridge the simulation-reality gap; (2) develop lightweight architectures (e.g., pruning or knowledge distillation) for real-time applications; (3) integrate physics-informed interpretability methods (e.g., gradient-based attribution) to explain attention weights in nuclear safety terms; (4) expand the dataset to include cascading faults and incorporate multi-source data (e.g., acoustic or thermal imaging) for comprehensive diagnostics; and (5) explore Transformer-based models to further enhance long-range temporal dependency capture in SMR time series.

5. Conclusions

A CNN–LSTM–Attention neural network system has been specially developed for accident fault diagnosis in the small modular reactor SMART. In light of the training and testing outcomes, the CNN–LSTM–Attention model demonstrates remarkable superiority over the CNN, LSTM, and CNN–LSTM models. It attains an approximately 7% increase in fault diagnosis accuracy, highlighting the significance of bidirectional data patterns in temporal prediction tasks. The application of this system extends intelligent fault diagnosis capabilities from commercial reactors to the realm of fault diagnosis in small modular reactors. By capitalizing on self-attention patterns, not only has the fault diagnosis accuracy been improved, but the safety of small modular reactors has also been enhanced. This development offers robust support for the future autonomous control systems in small modular reactors.

Author Contributions

Conceptualization, J.L.; methodology, S.W.; software, S.W.; validation, J.L.; formal analysis, S.W.; investigation, J.L.; resources, J.L.; data curation, J.L.; writing—original draft preparation, S.W. and J.L.; writing—review and editing, S.W. and J.L.; visualization, S.W.; supervision, J.L.; project administration, J.L.; funding acquisition, J.L. All authors have read and agreed to the published version of the manuscript.

Funding

This research was funded by the Doctoral Research Fund of Hunan Institute of Technology (HQ24024); Safety Science and Engineering Discipline Open Project of Hunan Institute of Technology (KF24015); and College Students’ Innovative Entrepreneurial Training Plan Program (S202511528242, S202511528261X).

Data Availability Statement

The datasets generated during and/or analyzed during the current study are available from the corresponding author on reasonable request.

Conflicts of Interest

The authors declare that they have no conflicts of interest.

References

  1. Hamilton, I.; Kennard, H.; McGushin, A.; Höglund-Isaksson, L.; Kiesewetter, G.; Lott, M.; Milner, J.; Purohit, P.; Rafaj, P.; Sharma, R.; et al. The public health implications of the Paris Agreement: A modelling study. Lancet Planet. Health 2021, 5, e74–e83. [Google Scholar]
  2. He, R.; Luo, L.; Shamsuddin, A.; Tang, Q. Corporate carbon accounting: A literature review of carbon accounting research from the Kyoto Protocol to the Paris Agreement. Account. Financ. 2022, 62, 261–298. [Google Scholar]
  3. Falkner, R. The Paris Agreement and the new logic of international climate politics. Int. Aff. 2016, 92, 1107–1125. [Google Scholar]
  4. Babak, V.; Babak, S.; Zaporozhets, A. Tasks and Main Methods of Statistical Diagnostics of Electric Power Equipment. In Statistical Diagnostics of Electric Power Equipment; Springer Nature: Cham, Switzerland, 2024; pp. 1–50. [Google Scholar]
  5. Lei, J.; Chen, Z.; Zhou, J.; Yang, C.; Ren, C.; Li, W.; Xie, C.; Ni, Z.; Huang, G.; Li, L.; et al. Research on the preliminary prediction of nuclear core design based on machine learning. Nucl. Technol. 2022, 208, 1223–1232. [Google Scholar]
  6. Babak, V.; Babak, S.; Zaporozhets, A. Tasks for Creating the Environmental Monitoring Systems for Energy Objects. In Statistical Diagnostics of Electric Power Equipment; Springer Nature: Cham, Switzerland, 2024; pp. 345–386. [Google Scholar]
  7. Babak, V.; Babak, S.; Zaporozhets, A. Linear Periodic Random Processes in Constructing Models Characterizing the Operation of Electrical Equipment. In Statistical Diagnostics of Electric Power Equipment; Springer Nature: Cham, Switzerland, 2024; pp. 123–144. [Google Scholar]
  8. Babak, V.; Zaporozhets, A.; Kovtun, S.; Kuts, Y.; Fryz, M.; Scherbak, L. The Concept of Research of the Electric Power Facilities Functioning. In Systems, Decision and Control in Energy VI: Volume I: Energy Informatics and Transport; Springer Nature: Cham, Switzerland, 2024; pp. 3–33. [Google Scholar]
  9. Höhne, N.; Gidden, M.J.; den Elzen, M.; Hans, F.; Fyson, C.; Geiges, A.; Jeffery, M.L.; Gonzales-Zuñiga, S.; Mooldijk, S.; Hare, W.; et al. Wave of net zero emission targets opens window to meeting the Paris Agreement. Nat. Clim. Change 2021, 11, 820–822. [Google Scholar]
  10. Babak, V.; Fialko, N.; Shchepetov, V.; Kharchenko, S. Physical Model of Structural Self-Organization of Tribosystems. In Systems, Decision and Control in Energy IV: Volume, I. Modern Power Systems and Clean Energy; Springer Nature: Cham, Switzerland, 2023; pp. 309–318. [Google Scholar]
  11. Ma, J.; Jiang, J. Applications of fault detection and diagnosis methods in nuclear power plants: A review. Prog. Nucl. Energy 2011, 53, 255–266. [Google Scholar]
  12. Zhan, L.; Bo, Y.; Lin, T.; Fan, Z. Development and outlook of advanced nuclear energy technology. Energy Strategy Rev. 2021, 34, 100630. [Google Scholar]
  13. Rehm, T.E. Advanced nuclear energy: The safest and most renewable clean energy. Curr. Opin. Chem. Eng. 2023, 39, 100878. [Google Scholar]
  14. Mathew, M.D. Nuclear energy: A pathway towards mitigation of global warming. Prog. Nucl. Energy 2022, 143, 104080. [Google Scholar]
  15. Muellner, N.; Arnold, N.; Gufler, K.; Kromp, W.; Renneberg, W.; Liebert, W. Nuclear energy-The solution to climate change? Energy Policy 2021, 155, 112363. [Google Scholar]
  16. Hassan, S.T.; Wang, P.; Khan, I.; Zhu, B. The impact of economic complexity, technology advancements, and nuclear energy consumption on the ecological footprint of the USA: Towards circular economy initiatives. Gondwana Res. 2023, 113, 237–246. [Google Scholar]
  17. Michaelson, D.; Jiang, J. Review of integration of small modular reactors in renewable energy microgrids. Renew. Sustain. Energy Rev. 2021, 152, 111638. [Google Scholar]
  18. Vinoya, C.L.; Ubando, A.T.; Culaba, A.B.; Chen, W.-H. State-of-the-art review of small modular reactors. Energies 2023, 16, 3224. [Google Scholar]
  19. Sam, R.; Sainati, T.; Hanson, B.; Kay, R. Licensing small modular reactors: A state-of-the-art review of the challenges and barriers. Prog. Nucl. Energy 2023, 164, 104859. [Google Scholar]
  20. Bhowmik, P.K.; Perez, C.E.E.; Fishler, J.D.; Prito, S.A.B.; Reichow, I.D.; Johnson, J.T.; Sabharwl, P.; O'BRien, J.E. Integral and separate effects test facilities to support water cooled small modular reactors: A review. Prog. Nucl. Energy 2023, 160, 104697. [Google Scholar]
  21. Poudel, B.; Gokaraju, R. Small modular reactor (SMR) based hybrid energy system for electricity & district heating. IEEE Trans. Energy Convers. 2021, 36, 2794–2802. [Google Scholar]
  22. Vanatta, M.; Stewart, W.R.; Craig, M.T. The role of policy and module manufacturing learning in industrial decarbonization by small modular reactors. Nat. Energy 2025, 10, 77–89. [Google Scholar]
  23. Ohba, T.; Tanigawa, K.; Liutsko, L. Evacuation after a nuclear accident: Critical reviews of past nuclear accidents and proposal for future planning. Environ. Int. 2021, 148, 106379. [Google Scholar]
  24. Chen, W.; Zou, S.; Qiu, C.; Dai, J.; Zhang, M. Invulnerability analysis of nuclear accidents emergency response organization network based on complex network. Nucl. Eng. Technol. 2024, 56, 2923–2936. [Google Scholar]
  25. Liu, Y.; Guo, X.Q.; Li, S.W.; Zhang, J.-M.; Hu, Z.-Z. Discharge of treated Fukushima nuclear accident contaminated water: Macroscopic and microscopic simulations. Natl. Sci. Rev. 2022, 9, nwab209. [Google Scholar]
  26. López-Estrada, F.R.; Theilliol, D.; Astorga-Zaragoza, C.M.; Ponsart, J.; Valencia-Palomo, G.; Camas-Anzueto, J. Fault diagnosis observer for descriptor Takagi-Sugeno systems. Neurocomputing 2019, 331, 10–17. [Google Scholar]
  27. López-Estrada, F.R.; Astorga-Zaragoza, C.M.; Theilliol, D.; Ponsart, J.C.; Valencia-Palomo, G.; Torres, L. Observer synthesis for a class of Takagi–Sugeno descriptor system with unmeasurable premise variable. Application to fault diagnosis. Int. J. Syst. Sci. 2017, 48, 3419–3430. [Google Scholar]
  28. Liu, B.; Lei, J.; Xie, J.; Zhou, J. Development and Validation of a Nuclear Power Plant Fault Diagnosis System Based on Deep Learning. Energies 2022, 15, 8629. [Google Scholar] [CrossRef]
  29. López, C.; Naranjo, Á.; Lu, S.; Moore, K.J. Hidden Markov model based stochastic resonance and its application to bearing fault diagnosis. J. Sound Vib. 2022, 528, 116890. [Google Scholar]
  30. Tuerxun, W.; Chang, X.; Hongyu, G.; Zhijie, J.; Huajian, Z. Fault diagnosis of wind turbines based on a support vector machine optimized by the sparrow search algorithm. IEEE Access 2021, 9, 69307–69315. [Google Scholar]
  31. Wang, B.; Qiu, W.; Hu, X.; Wang, W. A rolling bearing fault diagnosis technique based on recurrence quantification analysis and Bayesian optimization SVM. Appl. Soft Comput. 2024, 156, 111506. [Google Scholar]
  32. Lei, J.; Ren, C.; Li, W.; Fu, L.; Li, Z.; Ni, Z.; Li, Y.; Liu, C.; Zhang, H.; Chen, Z.; et al. Prediction of crucial nuclear power plant parameters using long short-term memory neural networks. Int. J. Energy Res. 2022, 46, 21467–21479. [Google Scholar]
  33. Ren, C.; Lei, J.; Liu, J.; Hong, J.; Hu, H.; Fang, X.; Yi, C.; Peng, Z.; Yang, X.; Yu, T. Research on an Intelligent Fault Diagnosis Method for Small Modular Reactors. Energies 2024, 17, 4049. [Google Scholar] [CrossRef]
  34. Lei, J.C.; Zhou, J.D.; Zhao, Y.N.; Chen, Z.; Zhao, P.; Xie, C.; Ni, Z.; Yu, T.; Xie, J. Prediction of burn-up nucleus density based on machine learning. Int. J. Energy Res. 2021, 45, 14052–14061. [Google Scholar]
  35. Qi, B.; Liang, J.; Tong, J. Fault diagnosis techniques for nuclear power plants: A review from the artificial intelligence perspective. Energies 2023, 16, 1850. [Google Scholar] [CrossRef]
  36. Pérez-Pérez, E.J.; Puig, V.; López-Estrada, F.R.; Valencia-Palomo, G.; Santos-Ruiz, I. Neuro-fuzzy Takagi Sugeno observer for fault diagnosis in wind turbines. IFAC-Pap. 2023, 56, 3522–3527. [Google Scholar]
  37. Pérez-Pérez, E.J.; López-Estrada, F.R.; Puig, V.; Valencia-Palomo, G.; Santos-Ruiz, I. Fault diagnosis in wind turbines based on ANFIS and Takagi—Sugeno interval observers. Expert Syst. Appl. 2022, 206, 117698. [Google Scholar]
  38. Khan, S.U.D.; Almutairi, Z.; Alanazi, M. Techno-economic assessment of fuel cycle facility of system integrated modular advanced reactor (SMART). Sustainability 2021, 13, 11815. [Google Scholar] [CrossRef]
  39. Yao, Y.; Han, T.; Yu, J.; Xiet, M. Uncertainty-aware deep learning for reliable health monitoring in safety-critical energy systems. Energy 2024, 291, 130419. [Google Scholar]
  40. Purwono, P.; Ma’arif, A.; Rahmaniar, W.; Fathurrahman, H.I.K.; Frisky, A.Z.K.; Haq, Q.M.U. Understanding of convolutional neural network (cnn): A review. Int. J. Robot. Control. Syst. 2022, 2, 739–748. [Google Scholar]
  41. Gupta, J.; Pathak, S.; Kumar, G. Deep learning (CNN) and transfer learning: A review. J. Phys. Conf. Series. 2022, 2273, 012029. [Google Scholar]
  42. Gülmez, B. Stock price prediction with optimized deep LSTM network with artificial rabbits optimization algorithm. Expert Syst. Appl. 2023, 227, 120346. [Google Scholar]
  43. Lindemann, B.; Maschler, B.; Sahlab, N.; Weyrich, M. A survey on anomaly detection for technical systems using LSTM networks. Comput. Ind. 2021, 131, 103498. [Google Scholar]
  44. Niu, Z.; Zhong, G.; Yu, H. A review on the attention mechanism of deep learning. Neurocomputing 2021, 452, 48–62. [Google Scholar]
  45. Pérez-Pérez, E.J.; Puig, V.; López-Estrada, F.R.; Valencia-Palomo, G.; Santos-Ruiz, I.; Osorio-Gordillo, G. Robust fault diagnosis of wind turbines based on MANFIS and zonotopic observers. Expert Syst. Appl. 2024, 235, 121095. [Google Scholar]
  46. Lei, J.; Yang, C.; Ren, C.; Li, W.; Liu, C.; Sun, A.; Li, Y.; Chen, Z.; Yu, T. Development and validation of a deep learning-based model for predicting burnup nuclide density. Int. J. Energy Res. 2022, 46, 21257–21265. [Google Scholar]
  47. Lei, J.; Ni, Z.; Peng, Z.; Hu, H.; Hong, J.; Fang, X.; Yi, C.; Ren, C.; Wasaye, M.A. An intelligent network framework for driver distraction monitoring based on RES-SE-CNN. Sci. Rep. 2025, 15, 6916. [Google Scholar]
  48. Pérez-Pérez, E.J.; López-Estrada, F.R.; Valencia-Palomo, G.; Torres, L.; Puig, V.; Mina-Antonio, J. Leak diagnosis in pipelines using a combined artificial neural network approach. Control. Eng. Pract. 2021, 107, 104677. [Google Scholar]
  49. Naidu, G.; Zuva, T.; Sibanda, E.M. A review of evaluation metrics in machine learning algorithms. In Computer Science On-Line Conference; Springer Nature: Cham, Switzerland, 2023; pp. 15–25. [Google Scholar]
  50. Yacouby, R.; Axman, D. Probabilistic extension of precision, recall, and f1 score for more thorough evaluation of classification models. In Proceedings of the First Workshop on Evaluation and Comparison of NLP Systems, Punta Cana, Dominican Republic, 16 March–15 July 2020; pp. 79–91. [Google Scholar]
  51. Chicco, D.; Jurman, G. The advantages of the Matthews correlation coefficient (MCC) over F1 score and accuracy in binary classification evaluation. BMC Genom. 2020, 21, 1–13. [Google Scholar]
  52. Chen, H.; Wang, N.; Du, X.; Mei, K.; Zhou, Y.; Cai, G.; Ağbulut, Ü. Classification prediction of breast cancer based on machine learning. Comput. Intell. Neurosci. 2023, 2023, 6530719. [Google Scholar]
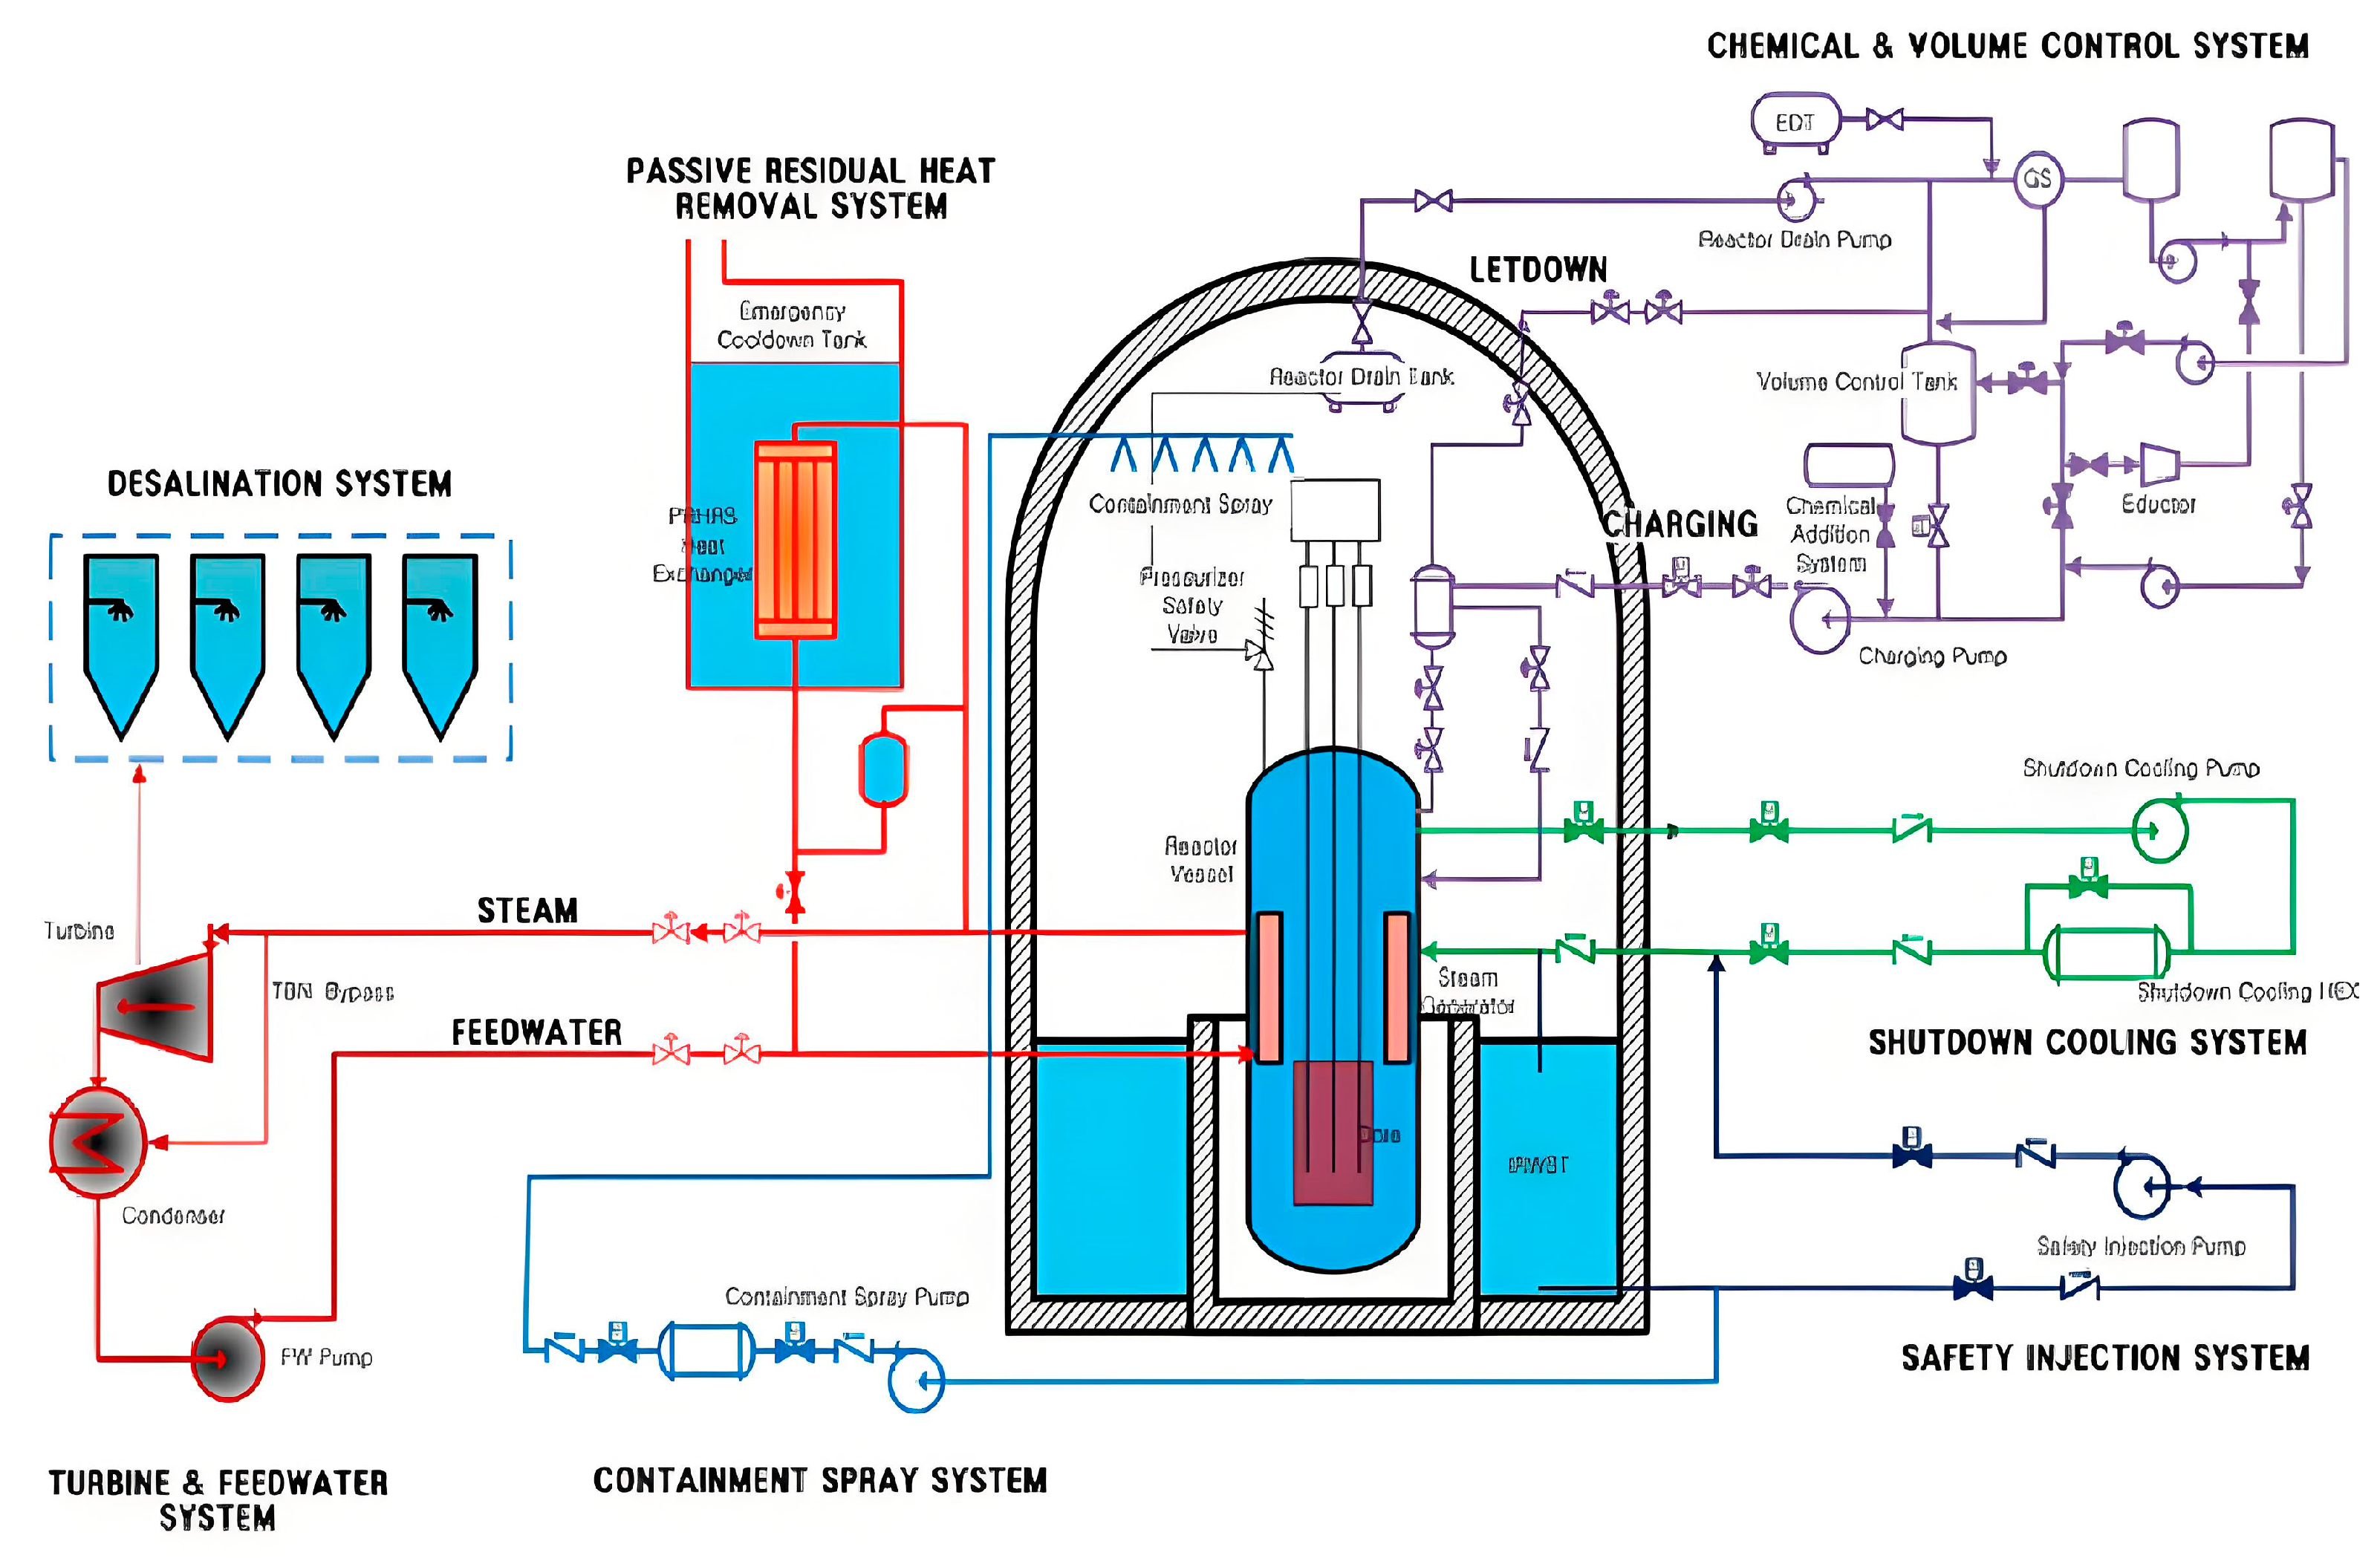
Figure 1. Flowchart of the SMART.
Energies 18 03621 g001
Figure 2. PCTRAN-SMR Software Interface.
Energies 18 03621 g002
Figure 3. SMART LOCA Fault Trend Chart.
Energies 18 03621 g003aEnergies 18 03621 g003b
Figure 4. PWR LOCA Fault Trend Chart.
Energies 18 03621 g004aEnergies 18 03621 g004b
Figure 5. CNN Structure.
Energies 18 03621 g005
Figure 6. LSTM Network Structure.
Energies 18 03621 g006
Figure 7. Attention Mechanism Structure.
Energies 18 03621 g007
Figure 8. Schematic Diagram with T−1 History Steps.
Energies 18 03621 g008
Figure 9. Constructed Model Structure Diagram.
Energies 18 03621 g009
Figure 10. Constructed Model Training Diagram.
Energies 18 03621 g010aEnergies 18 03621 g010b
Figure 11. Prediction confusion matrix graph of Constructed Model.
Energies 18 03621 g011aEnergies 18 03621 g011b
Table 1. Classification of the Situation of The Model Prediction Results.
ClassificationCategory ACategory B
Predicted as Category ATNFN
Predicted as Category BFPTP
Table 2. Table of Hyperparameters for Model Structure.
Model TypeCNNLSTMCNN–LSTMCNN–LSTM–Attention
Input Dimension(None, 7, 6) (7 time steps, 6 features)(None, 7, 6) (7 time steps, 6 features)(None, 7, 6) (7 time steps, 6 features)(None, 7, 6) (7 time steps, 6 features)
Convolutional Layer Configuration2 Conv1D layers
Layer 1: 64 filters
Layer 2: 32 filters
No convolutional layers1 Conv1D layers
Layer 1: 64 filters
1 Conv1D layers
Layer 1: 64 filters
Pooling Layer Configuration2 MaxPooling1D layersNo pooling layers1 MaxPooling1D layer1 MaxPooling1D layer
LSTM Layer ConfigurationNo LSTM layers3 LSTM layers
Layer 1: 64 hidden units
Layer 2: 32 hidden units
Layer 3: 16 hidden units
1 LSTM layer
32 hidden units
1 LSTM layer
32 hidden units
Attention Layer ConfigurationNo attention layersNo attention layersNo attention layers1 attention mechanism
Weight calculation: cosine similarity
Output dimension = 32
Fully Connected Layer Configuration1 dense layer
6 neurons
1 dense layer
6 neurons
1 dense layer
6 neurons
1 dense layer
6 neurons
Activation FunctionsReLU after convolutional layers
Softmax in output layer
Tanh in hidden layers
Softmax in output layer
ReLU after convolutional layers
Softmax in output layer
ReLU after convolutional layers
Softmax in output layer
RegularizationNo explicit regularization1 Dropout layer
Dropout rate = 0.3
No explicit regularization2 Dropout layer
Dropout rate = 0.3
Batch Normalization2 BatchNormalization layersNo batch normalization1 BatchNormalization layer1 BatchNormalization layer
Training ParametersOptimizer: Adam
Loss function: Categorical cross-entropy
Evaluation metric: Accuracy
Optimizer: Adam
Loss function: Categorical cross-entropy
Evaluation metric: Accuracy
Optimizer: Adam
Loss function: Categorical cross-entropy
Evaluation metric: Accuracy
Optimizer: Adam
Loss function: Categorical cross-entropy
Evaluation metric: Accuracy
Table 3. Classification of the Situation of the Model Prediction Results.
Constructed ModelPrediction AccuracyConstructed ModelPrediction Accuracy
CNN88.83%LSTM90.83%
CNN–LSTM93.67%CNN–LSTM–Attention95.67%
Table 4. The Evaluation Results of Models.
ModelTP RATEFP RATEPrecisionRecall
CNN0.8880.1120.9020.888
LSTM0.9080.0920.9110.908
CNN–LSTM0.9370.0640.9420.937
CNN–LSTM–Attention0.9570.0430.9600.957
Disclaimer/Publisher’s Note: The statements, opinions and data contained in all publications are solely those of the individual author(s) and contributor(s) and not of MDPI and/or the editor(s). MDPI and/or the editor(s) disclaim responsibility for any injury to people or property resulting from any ideas, methods, instructions or products referred to in the content.