Article

Hybrid Prediction Model of Burn-Through Point Temperature with Color Temperature Information from Cross-Sectional Frame at Discharge End

by
Mengxin Zhao
1,
Yinghua Fan
1,
Jing Ge
1,
Xinzhe Hao
1,
Caili Wu
2,
Xian Ma
1,3,4 and
Sheng Du
1,3,4,*
1
School of Automation, China University of Geosciences, Wuhan 430074, China
2
School of Future Technology, China University of Geosciences, Wuhan 430074, China
3
Hubei Key Laboratory of Advanced Control and Intelligent Automation for Complex Systems, Wuhan 430074, China
4
Engineering Research Center of Intelligent Technology for Geo-Exploration, Ministry of Education, Wuhan 430074, China
*
Author to whom correspondence should be addressed.
Energies 2025, 18(14), 3595; https://doi.org/10.3390/en18143595
Submission received: 13 June 2025 / Revised: 5 July 2025 / Accepted: 7 July 2025 / Published: 8 July 2025

Abstract

Iron ore sintering is a critical process in steelmaking, where the produced sinter is the main raw material for blast furnace ironmaking. The quality and yield of sinter ore directly affect the cost and efficiency of iron and steel production. Accurately predicting the burn-through point (BTP) temperature is of paramount importance for controlling quality and yield. Traditional BTP temperature prediction only utilizes data from bellows, neglecting the information contained in sinter images. This study combines color temperature information extracted from the cross-sectional frame at the discharge end with bellows data. Due to the non-stationarity of the BTP temperature, a hybrid prediction model of the BTP temperature integrating bidirectional long short-term memory and extreme gradient boosting is presented. By combining the advantages of deep learning and tree ensemble learning, a hybrid prediction model of the BTP temperature is established using the color temperature information in the cross-sectional frame at the discharge end and time-series data. Experiments were conducted with the actual running data in an iron and steel enterprise and show that the proposed method has higher accuracy than existing methods, achieving an approximately 4.3% improvement in prediction accuracy. The proposed method can provide an effective reference for decision-making and for the optimization of operating parameters in the sintering process.

1. Introduction

In recent years, the Fourth Industrial Revolution has been flourishing. Information technologies, represented by the Internet, artificial intelligence, and other technologies, have injected new impetus into global industrial development. Many countries have actively responded by launching national strategies to accelerate industrial transformation, aiming to transform from traditional manufacturing economies to innovation-driven powerhouses under the trend of deep integration of intelligence and industrialization. While making breakthroughs in high-end manufacturing, these efforts seek to drive widespread transformation and upgrading across global manufacturing industries through technological integration and digital innovation.
The iron ore sintering process is a key preparatory process in modern steelmaking, and it is of great significance for achieving the goals of high quality, high yield, and low consumption in blast furnace ironmaking [1]. In the iron ore sintering production process, BTP temperature is a key parameter that directly characterizes the combustion status of sinter. An excessively high or low BTP temperature will significantly affect the output and quality of sinter, directly influencing the production efficiency of subsequent blast furnace ironmaking. A stable bellows temperature is crucial for reducing the consumption of fuel gas and coke powder in the sintering process, thereby optimizing energy efficiency [2]. For the realization of production objectives focused on superior quality, enhanced yield, and reduced resource consumption in blast furnace ironmaking, the precise prediction of BTP temperature plays a pivotal role. This prediction is critical for maintaining stable control over BTP temperature and supplying operators with operational guidelines, thereby facilitating the stable management of the sintering process.
In the field of sintering process modeling, a theoretical basis for BTP prediction is provided by modeling methods based on physico-chemical mechanisms. A two-dimensional non-stationary mathematical model was established by Zhang et al. [3], in which key physico-chemical processes such as coke combustion and melt formation were integrated, and the mechanism of BTP influence on sintering strength and yield was systematically analyzed. On the other hand, a sinter bed temperature prediction model based on the lognormal distribution function was constructed by Ding et al. [4], through which a mechanistic description of the sintering process was realized by quantifying the reaction kinetic parameters. The intrinsic law of the sintering process is revealed by this kind of mechanistic modeling of the sintering process, which provides a solid theoretical foundation for the subsequent establishment of the sintering endpoint prediction model. However, not only does mechanistic modeling require an accurate description of the multiphase chemical reaction paths, leading to high complexity in solving the high-dimensional differential equations; it also heavily relies on the experimental data to calibrate the parameters, resulting in poor generalization ability of the model.
In the field of intelligent control for sintering processes, recent advancements have shifted toward parameter-prediction-based approaches, ultimately leading to the proposal of methods in which neural networks are fused with control strategies. A backpropagation–PID-based temperature management system for selective laser sintering was designed by Xu et al., in which fiber Bragg grating sensors were utilized to determine temperature readings [5]. Additionally, an intelligent control framework based on gray theory combined with BP neural networks was proposed by Wu et al. to regulate the BTP by manipulating the speed of the sintering chain [6]. Furthermore, BP neural networks were integrated with intelligent control methods by Du et al. to fine-tune gas fuel levels and thereby adjust sintering temperatures [7].
With the rapid development of industrial big data technology, leapfrog development has been achieved in BTP prediction technology based on time-series data. In this research process, a hybrid prediction model for the iron ore sintering BTP was designed by Du et al., in which fuzzy time series and fuzzy C-means clustering were integrated [8]. Experiments showed it outperformed existing models, facilitating stable sintering process control. An integrated neural-network-based model for predicting the BTP in a lead–zinc sintering process was designed by Wu et al., incorporating a time-sequence model [9]. The innovativeness of these studies is reflected in the fact that the computation bottleneck of traditional mechanistic models was broken through, enabling end-to-end time-series pattern learning. However, as far as the prediction method based on time-series data is concerned, it is very sensitive to the data quality, and the model prediction may fail if the data is not properly pre-processed.
In recent years, methods based on sintered image features have shown unique advantages. Chi et al. designed an intelligent system for sintering furnace temperature control, integrating an adaptive graph convolution network (AGCN) to model spatial-temporal bellows temperature via graph structures, with industrial experiments showing stabilized fluctuations [10]. Li et al. designed a BTP prediction model with data correction using cross-sectional frame feature matching at the discharge end, incorporated feature extraction for discharge-end cross-sectional images to correct raw BTP data, and employed temporal convolutional neural networks and gated recurrent units for prediction, verified by industrial experiments [11]. However, the current image acquisition is limited by the industrial field environment, such as dust interference, and the image quality is more general, so determining how to build a model to enable the effective extraction of flame key information and utilize this for BTP temperature prediction is a problem yet to be solved.
Considering the prediction errors of the above-mentioned models for non-stationary sequences, as well as their exclusive focus on variables in the sintering process while image information at the cross-sectional frame is neglected, a hybrid prediction model of the BTP temperature is proposed to address these challenges. This model offers a solution that integrates cross-sectional frame image information with time-series data to achieve the accurate prediction of BTP temperature. The main contributions of this paper are listed below.
(1)
By combining image information with time-series data, traditional data-driven approaches are supplemented to help the model predict BTP temperature.
(2)
Combining the strengths of ensemble learning helps to mitigate the impact of non-stationary sequences.

2. Description of Sintering Process and Design of Hybrid Prediction Model of Burn-Through Point Temperature

In this section, the sintering process is comprehensively explained, along with the characteristics and structural design of the cross-section at the discharge end. Moreover, a detailed explanation is given for the model architecture proposed in this paper.

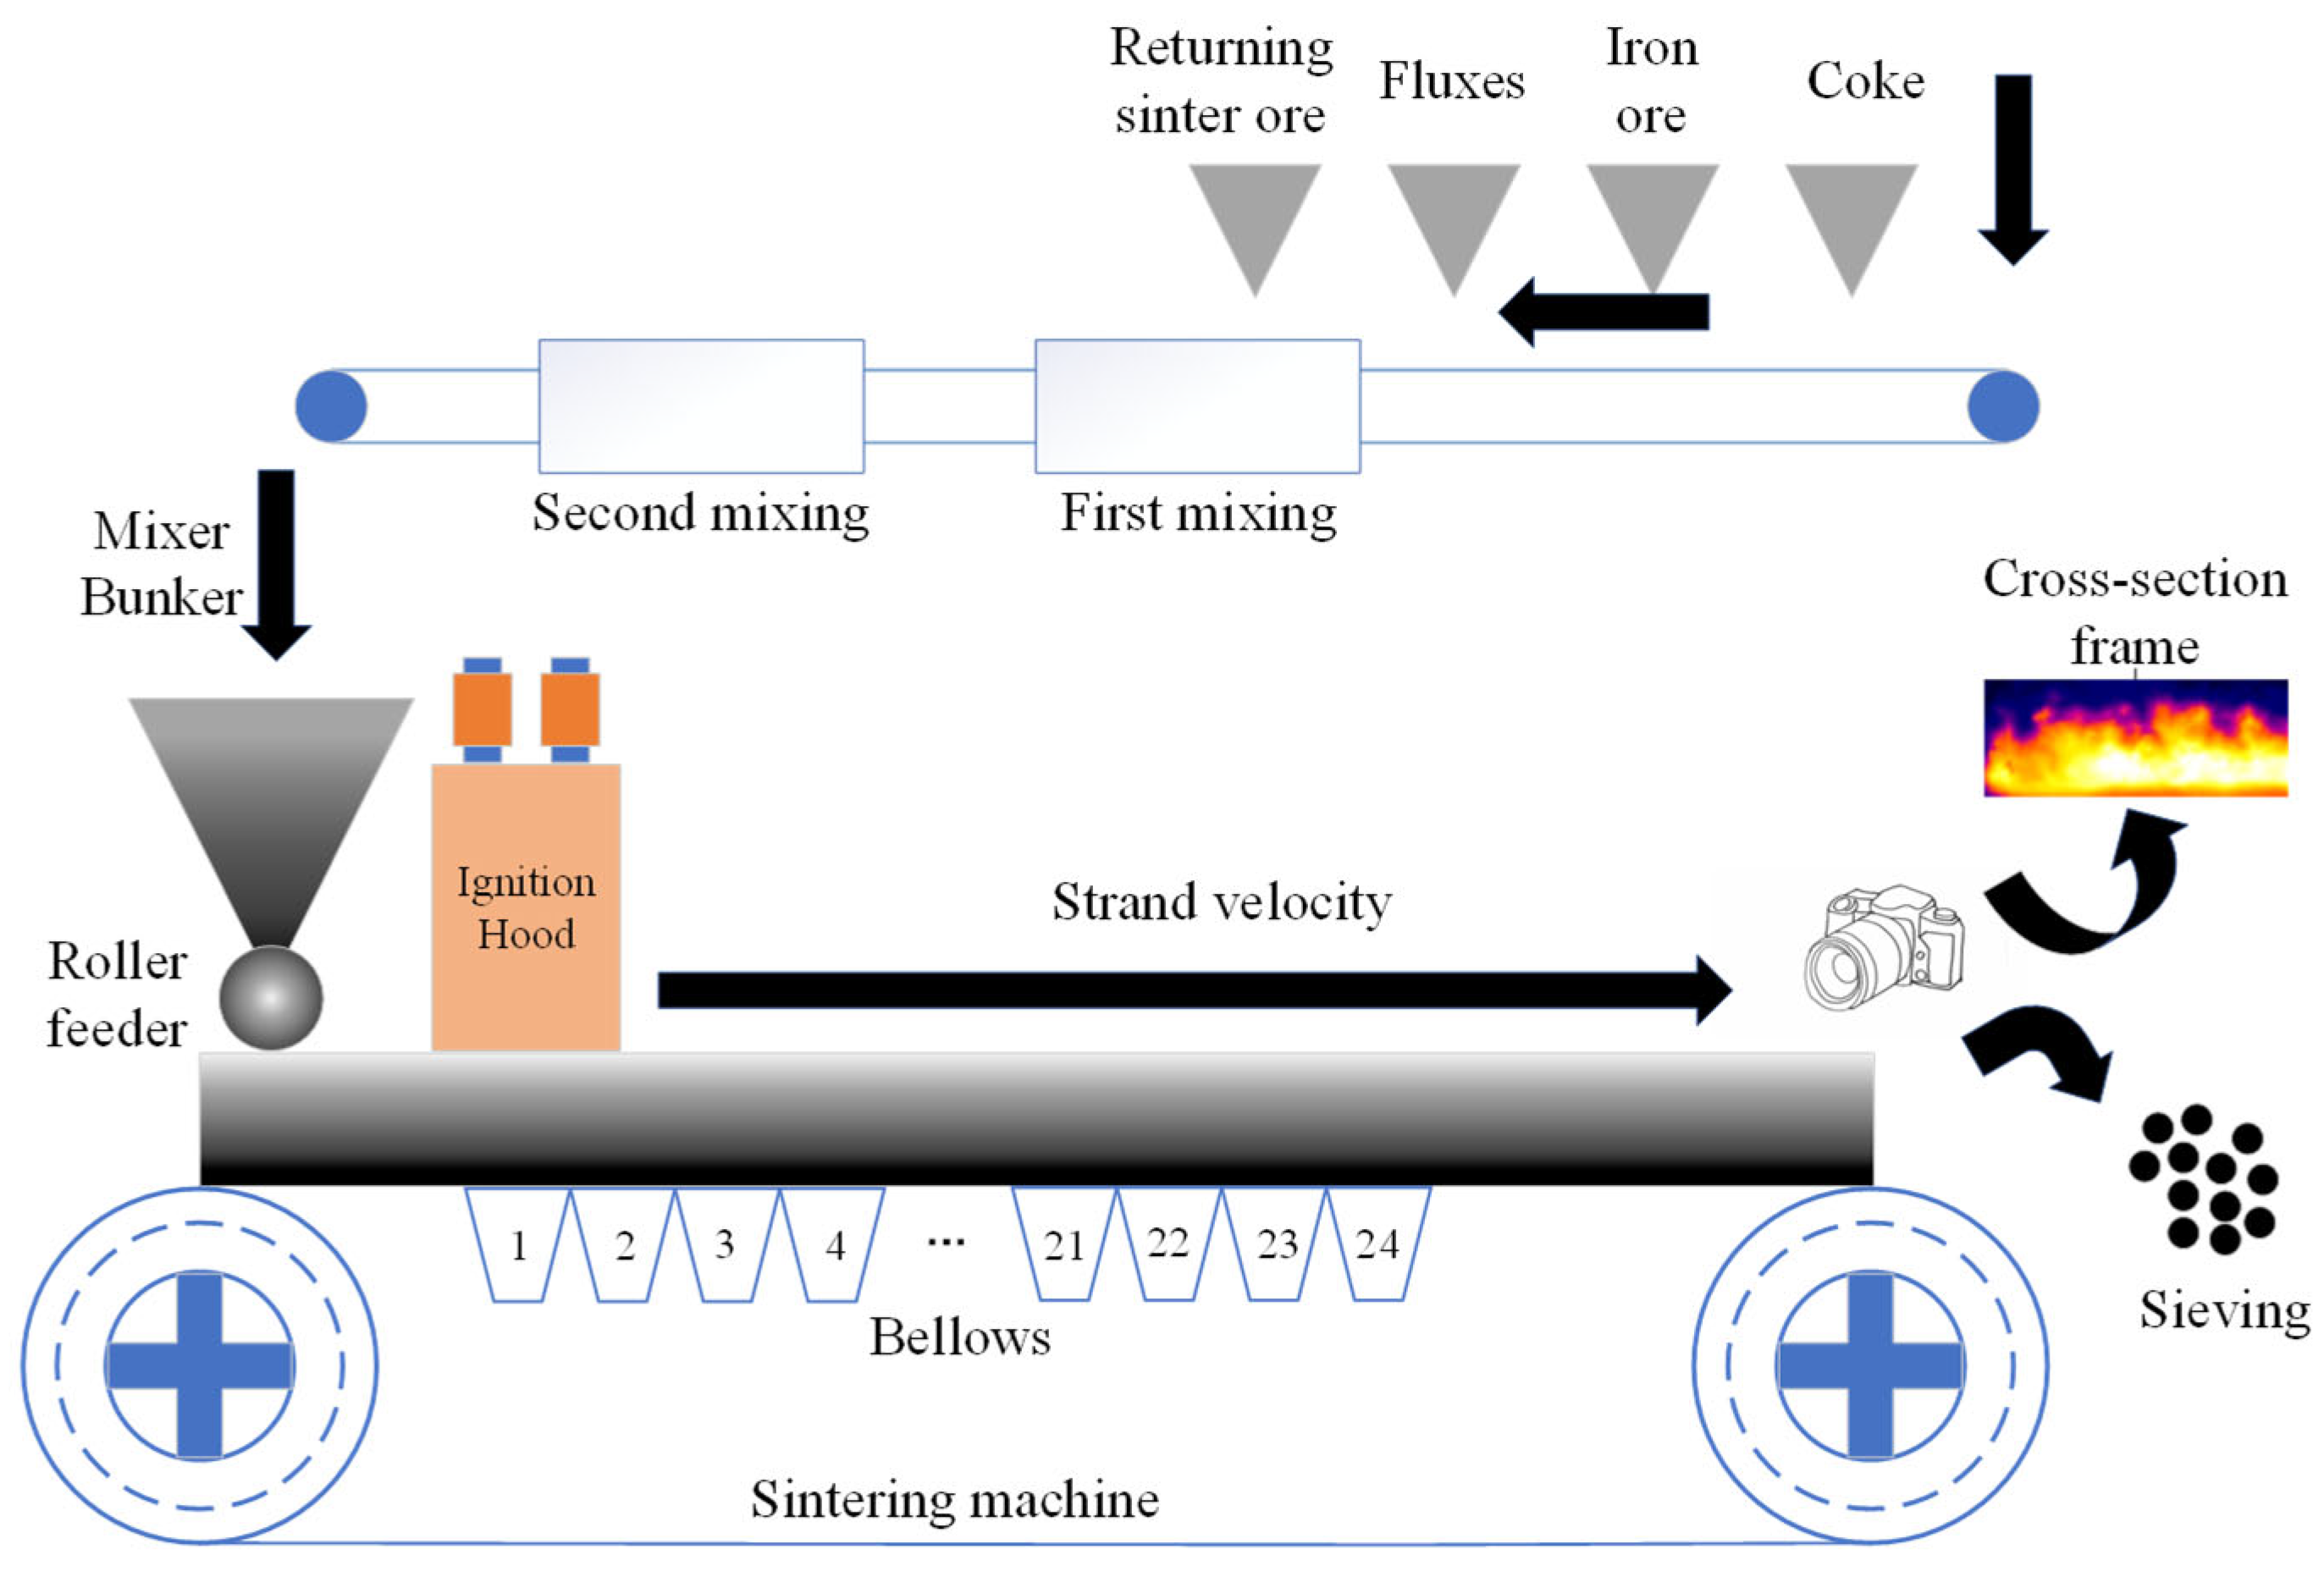
2.1. Sintering Process

This study focuses on a 360 m2 sintering machine with 24 bellows, which is shown in Figure 1. Under normal operation, the BTP stabilizes at the 23rd bellows [11]. After fully sintered material advances one bellows spacing, it reaches the sectional framework, where the sinter cake forms and detaches naturally from the trolley surface. When the sinter cake is fully discharged, the discharge-end cross-sectional framework is exposed, facilitating equipment maintenance and repair.
The equipment processes mixed raw materials (iron ore, coke, limestone, and return ore) [3]. During pretreatment, these raw materials are mixed with water in a mixer and transferred to a storage bin. A roller distributor spreads the mixture evenly onto a moving sintering trolley, forming a burden layer of a specific thickness. An igniter beneath the ignition hood heats the upper surface of the burden layer. Blast furnace gas and coke oven gas are introduced via butterfly valves to ignite the coke and trigger the sintering reaction.
As the trolley moves away from the ignition zone, the 24 bellows along the equipment generate negative pressure, pushing the combustion front through the burden layer and exhausting waste gas to the bottom of the sintering burden layer. The trolley speed is precisely calibrated to ensure that the raw materials are fully sintered when reaching the end of the trolley. The position where the burden layer is completely sintered is defined as the BTP, and the temperature corresponding to this position is the BTP temperature [9].
After combustion, the sinter is discharged from the end of the trolley, then cooled, crushed, and screened: some particles are used for quality inspection or enter the steelmaking process, while the rest are recycled as return ore into the sintering process [9]. The specific positions of the bellows are determined by the structure of the sintering burden layer and are arranged below it [12,13]. The physical variables in the sintering process are presented in Table 1.

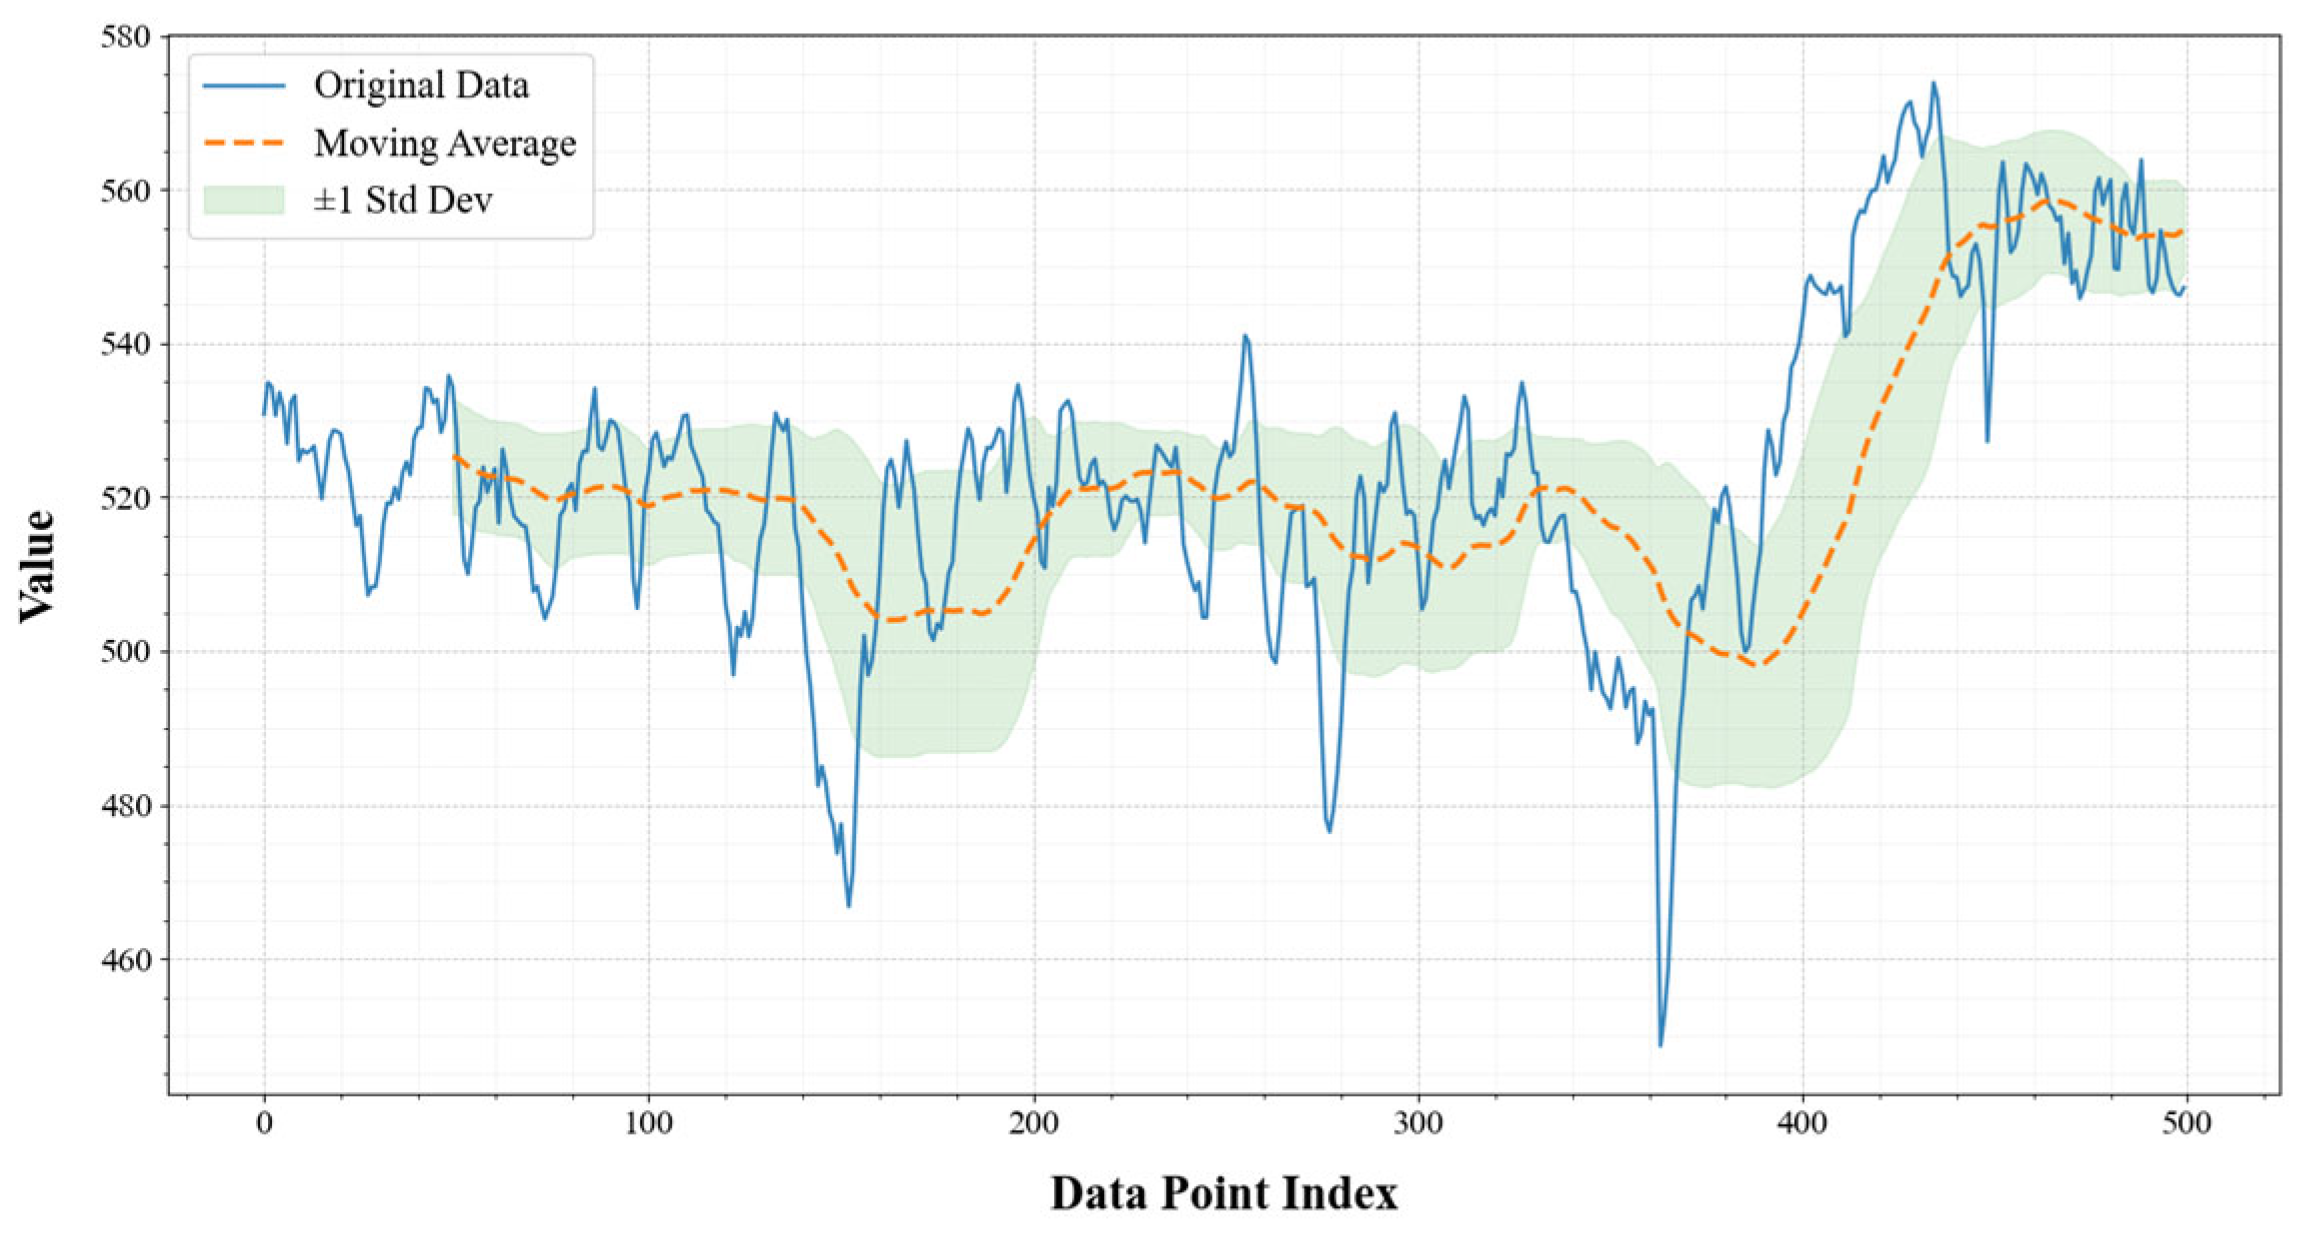
2.2. Analysis of Influencing Factors on BTP Temperature and Data Stationarity

During sintering, coke combustion elevates the temperature of both the burden layer and the underlying bellows. At the burn-through point, where the burden layer fully sinters, the corresponding bellows temperature peaks at a value markedly higher than that of other bellows. Thus, the bellows temperature curve indirectly reflects burden layer temperature dynamics and key parameters, as illustrated in Figure 2. In this figure, the BTP aligns with the bellows position of maximum temperature.
The stationarity of time-series data is a critical factor affecting model results. The less stationary the data, the closer it is to random walk data, which can significantly reduce the model’s accuracy in predicting the target variable. Multiple indicators are used to conduct stationarity tests on the BTP temperature.
The autocorrelation function (ACF) is employed to quantify the linear correlation between the observation at lag k and the current value in a time series [14]. The computational formula is expressed as follows:
ρ k = γ k γ 0 #
where γ k is the autocovariance at lag k , and γ 0 is the variance of the sequence.
The Hurst exponent quantifies the long-term memory and trend persistence of the time series, with the rescaled range (R/S) analysis being a common calculation method [15].
Analysis revealed that a value of the ACF closer to 0 indicates faster autocorrelation decay and stronger stationarity, whereas a Hurst exponent closer to 0.5 suggests the series more closely resembles a random walk. Calculations demonstrated that the ACF value at a lag of 10 was 0.884, indicating that autocorrelation remained substantially high. This implies that historical fluctuations exert a prolonged influence on current values, thereby reducing the time series’ mean-reverting tendency. The calculated Hurst exponent was 0.383, signifying a certain degree of non-stationarity. The non-stationarity of the BTP temperature is shown in Figure 3.
An infrared thermal imager, installed opposite the tail of the sintering trolley, is used to collect infrared video data. To boost computational efficiency and meet the needs of industrial production, only the valid frame data is chosen for analysis.
The captured infrared video has a periodic pattern. As the trolley moves forward, sintered ore cakes fall off every 60 s. When the trolley bottom tilts, the cakes drop, creating dust that blocks the discharge-end cross-section in a few seconds, thus changing the brightness and edges of the red fire layer. This change in brightness is the basis for designing a key-frame selection strategy. Frames from the discharge-end cross-section are collected at 5-s intervals, and the frame with the greatest grayscale difference compared to the previous moment is selected. This method is both fast and precise, fulfilling the requirements of industrial applications.
The before and after images of cake falling are shown in Figure 4 [11]. Before the cake falls, the intact structure enables the unobstructed capture of red-hot-layer thermal radiation and accurate color temperature data. After falling, cake fragments occlude the red-hot layer, impairing the acquisition of valid color temperature information.
Information from the red-hot layer is crucial for the prediction of the BTP temperature. Therefore, the segmentation of this region must be performed before calculating the image features. Sobel edge detection is a classic image-processing algorithm. It identifies edges by evaluating the gradient magnitude and direction of each pixel and is applied to the segmentation of key frames in this study. Specifically, the core parameters of the Sobel edge detection are defined as follows: A 3 × 3 convolution kernel is employed (horizontal kernel: [[−1, 0, 1], [−2, 0, 2], [−1, 0, 1]]; vertical kernel: [[−1, −2, −1], [0, 0, 0], [1, 2, 1]]). The gradient threshold for edge detection is set to 45, optimized based on the image grayscale range (0–255); edges below this threshold are identified as noise and filtered out. The stride is 1, with no zero-padding applied to avoid edge artifacts.
There is a certain correlation between the information contained in the tail section images and the sintering endpoint. The color temperature information of the red-hot layer in the images can reflect the value of the BTP temperature.
The sintering conditions are presented as follows in Figure 5: normal burning is illustrated in Figure 5a, where the BTP temperature is 500.93 °C; over-burning is depicted in Figure 5b, with the temperature measured at 471.33 °C. Over-burning means that combustibles are burned out due to excessive combustion, resulting in lower temperatures observed in the machine tail section. This phenomenon indicates that there is a certain degree of correlation between the color temperature information in the cross-sectional frame images and the BTP temperature.
After grayscaling the images, the average grayscale value of each image is calculated as the color temperature information of the image. The calculation formula is as follows:
p ¯ = i = 1 m p i n
where p ¯ is the average value of all pixel points, p i is the value of a pixel point, and m is the total number of pixel points.
A Spearman’s rank correlation analysis is conducted between the color temperature information and the BTP temperature. The formula is as follows:
  ρ s = 1 6 d i 2 n n 2 1
where d i is the difference in the rank values of the i -th pair of color temperature and BTP temperature observations, and n is the number of observation pairs.
The Spearman’s rank correlation coefficient between the two is calculated as 0.47 through Spearman correlation analysis, indicating a moderate level of correlation. This finding can provide assistance for BTP temperature prediction.

2.3. Structure Design of Hybrid Prediction Model of BTP Temperature

In view of the strong nonlinearity and non-stationarity of the sintering process [16], this study proposes a prediction model based on cross-sectional image information extraction at the machine tail, where an accurate prediction of BTP temperature requires comprehensive consideration of process state parameters and framework characteristic parameters highly correlated with BTP temperature as input variables.
The prediction framework integrates three core modules:
First, key-frame extraction is performed on the images to reduce the impact of falling slag. An image-processing module is then employed to extract cross-sectional framework characteristic parameters at the discharge end. The analysis focuses on the color temperature information of the red-hot layer while considering the influence of dust generated by the slag, thereby calibrating the color temperature information accordingly.
Second, data preprocessing methods are applied to process the raw data. Specifically, the boxplot method is used to detect outliers and standardize the data. Subsequently, important feature screening is conducted via the mutual information algorithm to select features with significant impacts on the model.
Finally, a hybrid prediction model of BTP temperature serves as the prediction module to fuse image features with traditional process parameters such as the temperature of the exhaust gas in the bellows and exhaust gas pressure in the bellows for BTP temperature prediction.
This hybrid approach combines visual features of the sintering state (color temperature analysis), neural network learning, and ensemble learning algorithms to compensate for the limitations of traditional methods, thereby enhancing prediction accuracy under process fluctuations. The overall model architecture, highlighting the fusion mechanism of image data and process data streams in the hybrid prediction model framework, is shown in Figure 6.

3. Hybrid Prediction Model of BTP Temperature

In this section, a BTP temperature prediction model is established. First, the image-processing module is used to extract feature parameters from the cross-sectional frames at the discharge end. Second, data preprocessing methods are employed to process the data. Subsequently, mutual information is used to analyze the relationships between data and screen features. Finally, a hybrid prediction model is built to predict the BTP temperature. Figure 6 shows the architecture of the BTP temperature prediction model.

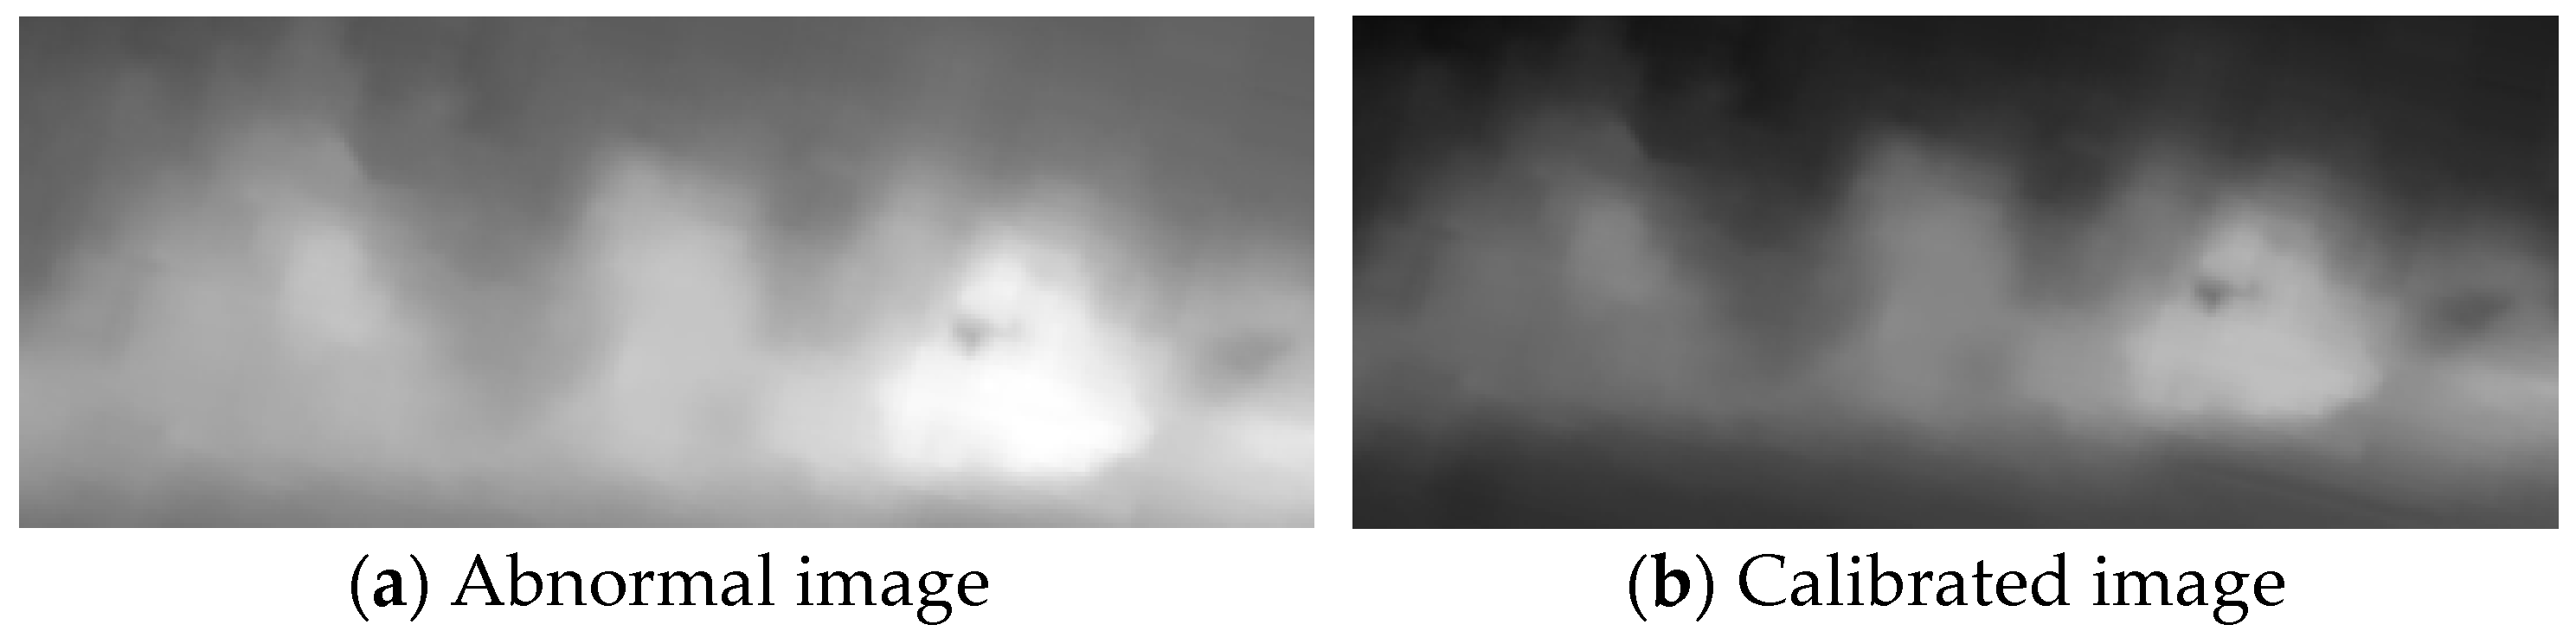
3.1. Color Temperature Information Calibration

Cross-sectional frame images still have issues. Upon the fall of the ore cake, the raised dust and flames significantly affect the red-hot layer, partially obscuring the true color of the images and resulting in image noise, which impacts the extraction of color temperature information. The impact of raised dust and flames on the images is shown in Figure 7.
Figure 7b is obviously disturbed by flames and dust. To mitigate the impact of this situation on BTP temperature prediction, denoising processing is performed on abnormal images.
Images are initially captured at a rate of one frame every 5 s, from which one frame per minute is selected. This selection strategy ensures that the chosen frames exhibit certain variability across different time points, helping to reduce data redundancy while avoiding an excessive number of images and increased processing complexity. After grayscale processing of these selected frames, the average pixel value of the background in normal frames is calculated as a reference standard, while the average pixel values of the background in other frames are also computed. Based on this reference standard, the values of all pixel points are adjusted through addition or subtraction operations to restore the background of abnormal frames to the normal state, thereby achieving denoising of the cross-sectional frame images.
    p m = p a b s b a
where p m denotes the magnitude of the corrected pixel value, p a denotes the magnitude of the pixel value in abnormal images, b s denotes the magnitude of the average pixel value of the standard image background, and b a denotes the magnitude of the average pixel value of the abnormal image background.
By using the background of normal images as the reference value, denoising processing is performed on abnormal images to reduce the influence of dust and flames. The magnitude of pixel values represents the brightness or darkness of the image. The image before and after calibration is shown in Figure 8.
The average value of all pixel points in the grayscale image is calculated to characterize the color temperature information. The comparison of grayscale histograms before and after denoising is shown in Figure 9.

3.2. Analysis and Selection of Feature Variables

Industrial on-site data in the sintering process requires preprocessing due to environmental interferences (e.g., electromagnetic noise, mechanical vibration, high temperature), which introduce significant anomalies and noise. To address this, the boxplot method is employed to identify outliers across the 81-dimensional sensor data. For each dimension, boxplots are generated to flag data points outside the interquartile range. All sensor data rows containing such outliers are removed entirely, ensuring the synchronous elimination of faulty measurements across all variables.
Given the wide numerical range variations among physical quantities, data normalization is critical to avoid dimension-driven biases in model analysis. Since the data does not follow a normal distribution, min–max normalization is applied to scale temperature, pressure, and color temperature information to a unified range. This linear transformation adjusts values to a standard interval, mitigating the impact of data amplitude on deep learning models like hybrid prediction models. Normalization enhances threshold calculation accuracy, accelerates model convergence, and improves prediction precision by ensuring features contribute equitably to the analysis.
The BTP is a key parameter in characterizing the thermal state of the sintering process. Its location is subject to the influence of various factors, such as strand speed, ignition temperature, and ambient temperature. Moreover, the material layer thickness is also a significant determinant. The thickness of the material layer also has a significant impact on the working capacity of the sintering machine [17].
The sintering process dataset contains 81 measurement variable features. To evaluate the importance of the features, mutual information is used to analyze the correlation between features and BTP temperature.
The sintering process dataset contains many key variables, and there are latent nonlinear relationships between each variable and BTP temperature. These relationships cannot be detected by traditional methods such as Pearson correlation and Spearman correlation, potentially leading to the loss of important nonlinear dependencies; therefore, mutual information is employed to evaluate the importance of each feature and analyze its correlation with BTP temperature. Mutual information (MI) is a measure of the dependence between two random variables, defined as follows:
    I X ; Y = H X H X Y
where H ( X ) represents the uncertainty of variable X , and H ( X | Y ) is the remaining uncertainty of X when Y is known.
Taking BTP temperature and wind box pressure as examples, a larger mutual information (MI) value indicates that wind box pressure can reduce the uncertainty of BTP temperature, suggesting a strong correlation between the two. Conversely, an MI value of 0 implies that the two are statistically independent and unrelated.
Through the mutual information method, the top 10 features that can reduce the uncertainty of the BTP temperature are screened out. The results show that four of these features are temperature-related parameters, and six are pressure-related parameters. Among them, the mutual information values of the first two temperature features (temperature of exhaust gas in the 23rd bellows and temperature of exhaust gas in the 22nd bellows) are 2.410 and 1.166, respectively, which are significantly higher than those of other features. This indicates that they have a strong correlation with the BTP temperature and serve as the core driving factors reflecting the sintering endpoint. The mutual information between features is shown in Table 2.
Further analysis shows that the high-mutual-information features are concentrated in the wind box temperature category (such as temperatures of exhaust gas in the 21st–24th bellows). Although they can characterize the heat conduction state in the sintering process, there is a limitation in process coverage (not involving links like burden distribution and ore blending). Meanwhile, the mutual information values among similar-temperature features are generally higher than 0.7, indicating significant feature redundancy. To balance feature representativeness and model robustness, the following are finally chosen:
(1)
The two temperature features with the largest mutual information values (temperature of exhaust gas in the 23rd bellow and 22nd bellow), which cover the key thermal areas of the sinter ore layer;
(2)
The exhaust gas pressure in the 24th bellow with the largest mutual information value in the exhaust gas pressure category, supplementing the information in the air permeability dimension.
This integration not only preserves the key characteristics of the thermal state but also minimizes redundancy via cross-process parameters. Such an approach can mitigate the generalization error of deep learning models and significantly enhance prediction stability under intricate operational conditions.

3.3. Construction of Hybrid Prediction Model for BTP Temperature

The process state parameters of the sintering process are characteristic time-series data. When contrasted with long short-term memory (LSTM) and recurrent neural network (RNN), BiLSTM showcases more advanced time-series-processing capabilities. Its bidirectional architecture significantly elevates prediction accuracy, rendering it especially apt for complex industrial systems marked by high nonlinearity and strong coupling. To thoroughly excavate the features of production process data, this paper adopts BiLSTM for feature extraction. BiLSTM leverages two separate LSTM layers to process the forward and reverse information streams of the sequence, respectively, to achieve holistic modeling of temporal context. The calculation formula is as follows:
h t = G z tanh F z , C t 1
where h t is the forward hidden state, G z is the output gate function, F z , C t 1 is the cell state update function, and C t 1 is the previous cell state.
h t = GRev z tanh F R e v z , C t 1
where h t is the backward hidden state, GRev z is the reverse output gate function, F R e v z , C t 1 is the reverse cell state update function, and C t 1 is the reverse previous cell state.
h t = h t + h t
where h t is the bidirectional hidden state.
As a tree-based model, XGBoost receives the time-series features output by BiLSTM and combines them with other static features. It accomplishes the task of BTP temperature prediction through a gradient-boosting mechanism. As an ensemble learning method, XGBoost can effectively suppress problems brought about by non-stationary sequence prediction and improve the robustness and anomaly-resistance capabilities of the model. Therefore, this paper selects XGBoost to predict the BTP temperature.
When the features fused by BiLSTM are concatenated, the feature vector serving as the input to XGBoost is as follows:
  X X G B = H t
where X X G B is the input feature vector for XGBoost, and H t is the transposed hidden state vector.
To predict the BTP temperature using XGBoost, gradient-boosted trees are employed to minimize the objective function, the core form of which is:
    L = i = 1 N l y i , y ^ i + k = 1 K Ω f k
where L is the objective function, N is the number of samples, y i is the actual BTP temperature of i -th sample, y ^ i is the predicted BTP temperature of i -th sample, l ( y i , y ^ i ) is the loss function for single sample, K is the number of gradient-boosted trees, f k is the function of the k -th gradient-boosted tree, and Ω ( f k ) is the regularization term for single tree.
The predicted values of all trees are accumulated to obtain the prediction of the BTP temperature by XGBoost:
            T ^ B T P = k = 1 K f k X X G B
where T ^ B T P is the final prediction of XGBoost model.

4. Experimental Study and Analysis

This section reports the findings of comparative experiments utilizing actual production data from a specific sintering plant, aiming to validate the efficacy of the developed predictive methodology that integrates image color temperature information, neural network-based learning, and ensemble learning approaches. The experimental results demonstrate that the hybrid prediction model outperforms other time-series forecasting models in terms of prediction accuracy, particularly excelling in handling the nonlinear dynamic characteristics and time-delay features inherent in the sintering process.

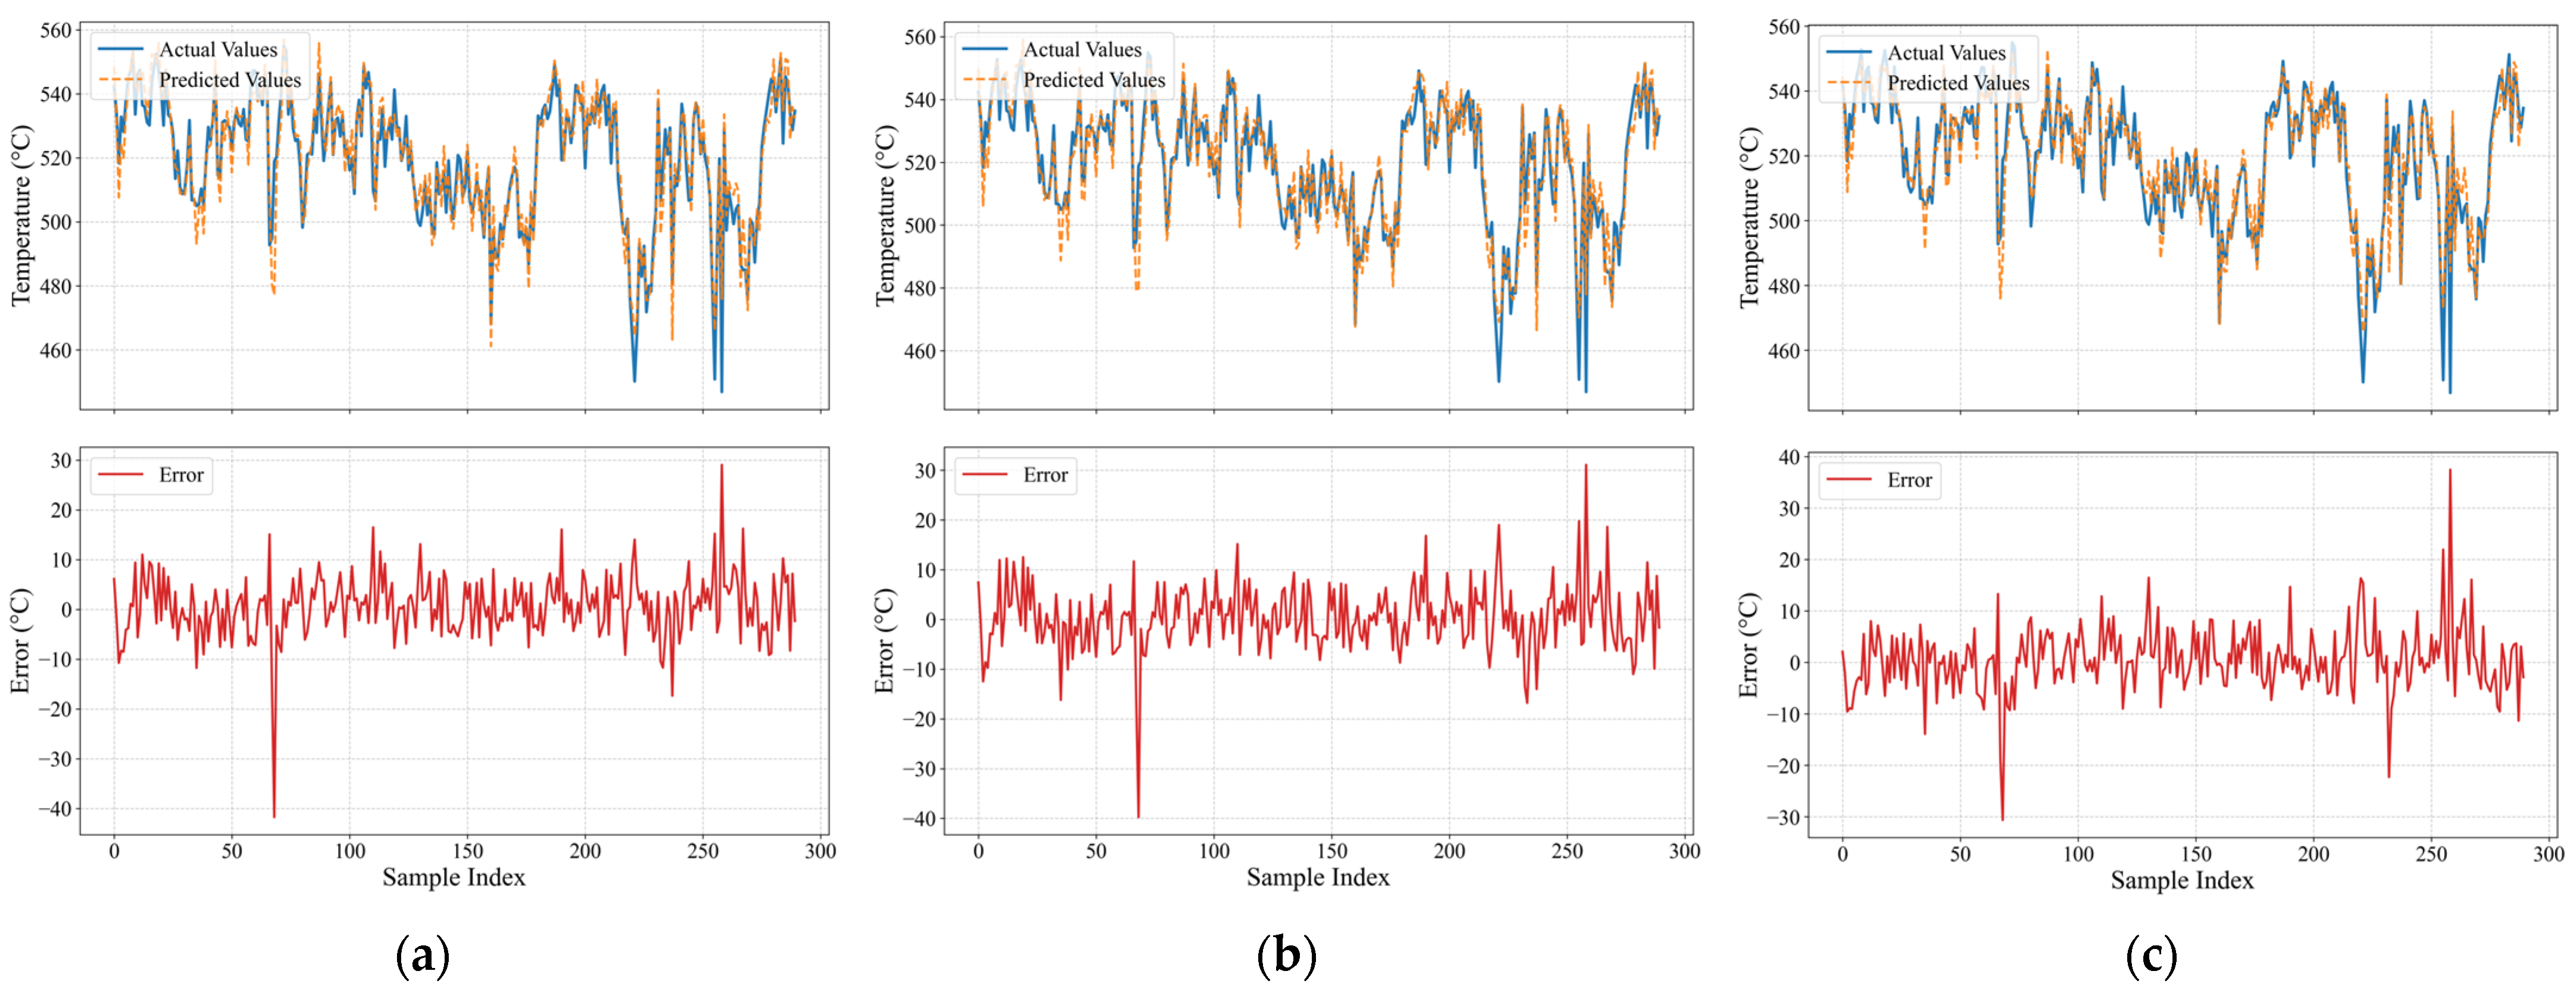
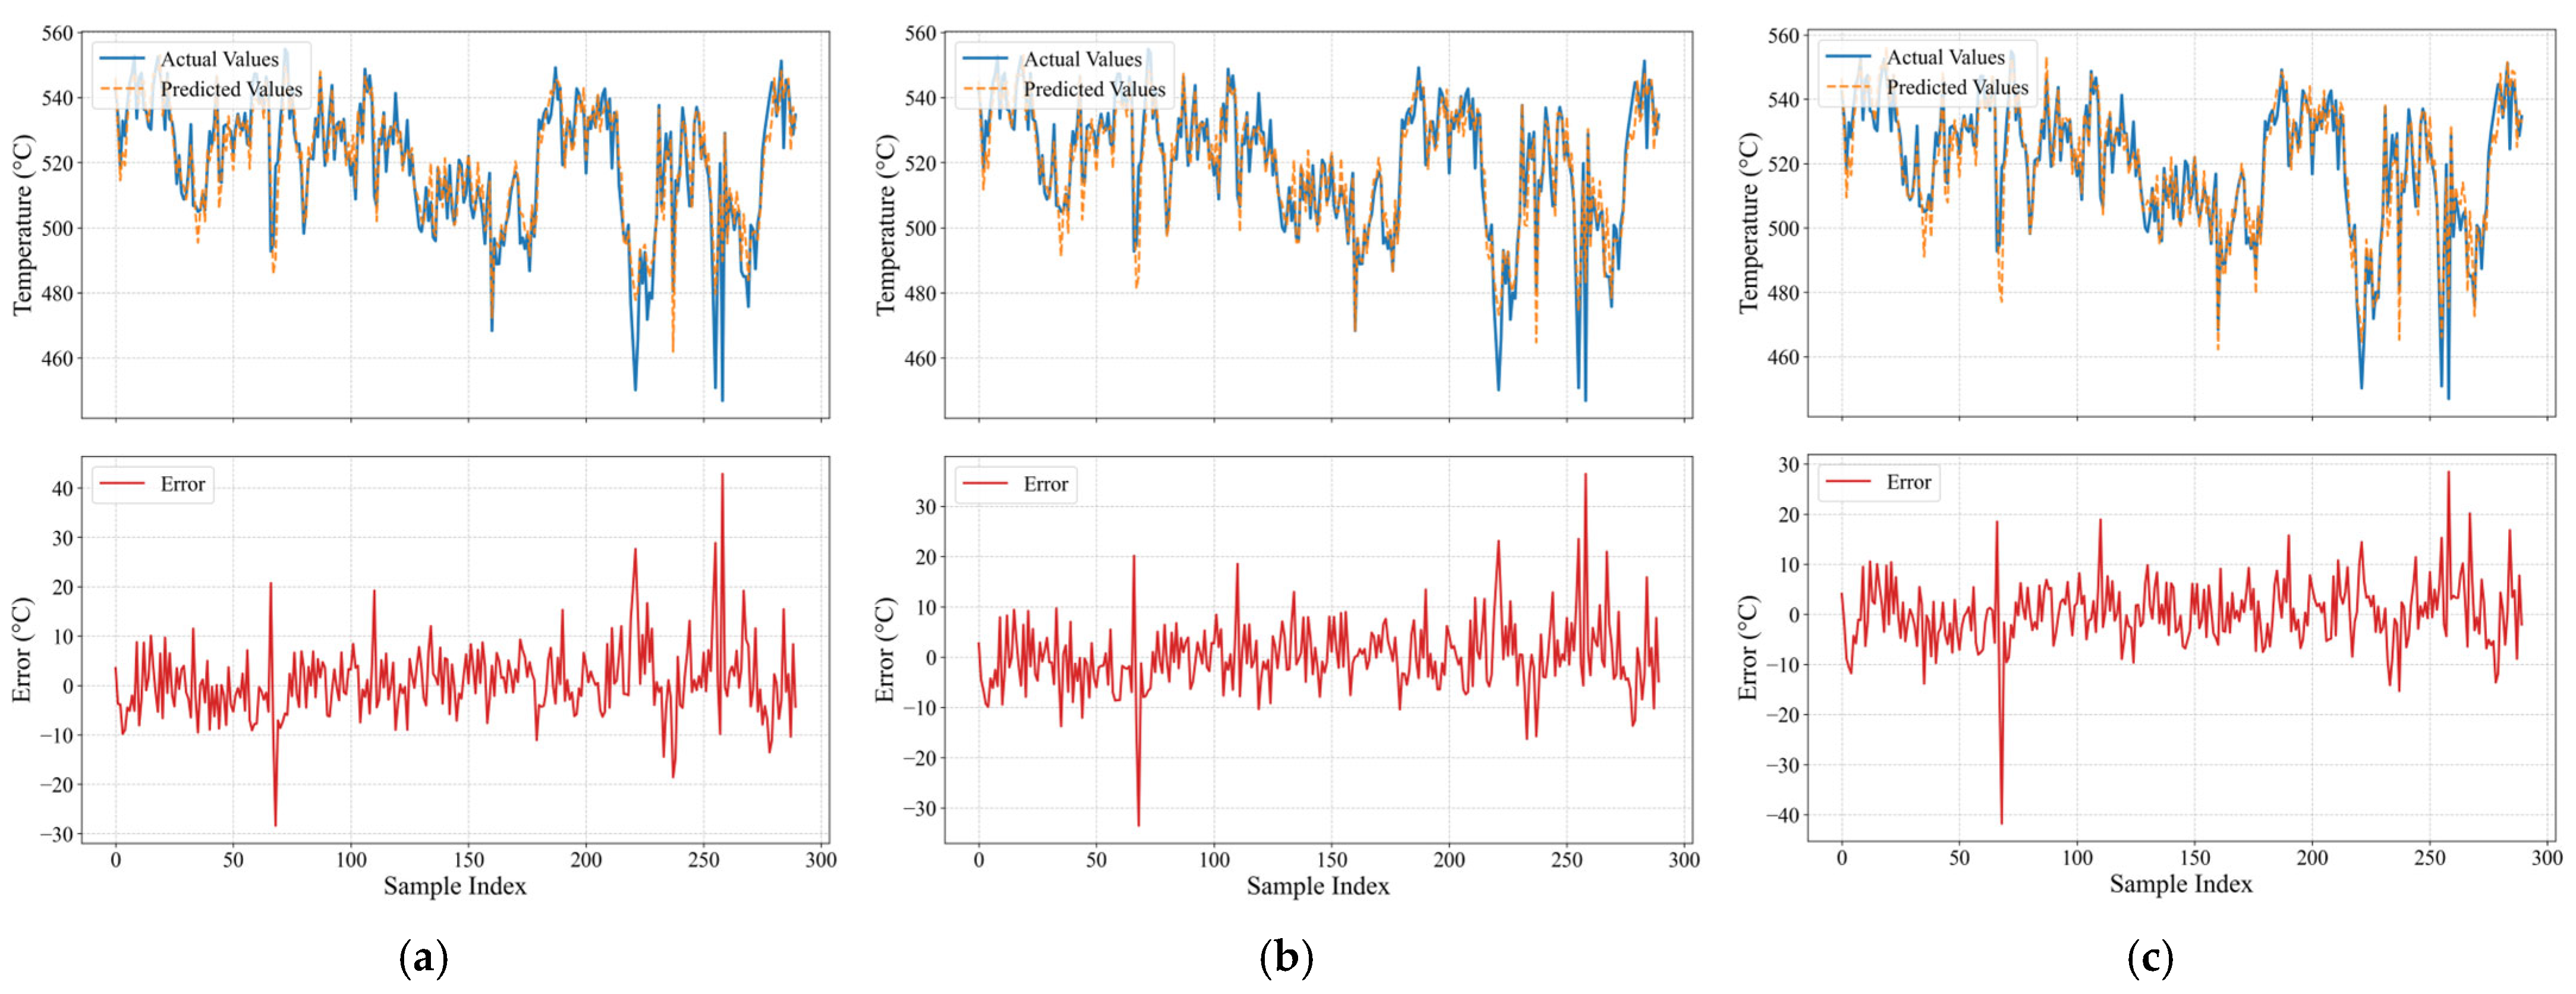
4.1. Ablation Experiments

This section details the actual sintering plant production data utilized in the experiments. To mitigate the substantial noise introduced by the field sensors’ 5 s sampling interval, which adversely impacts model prediction accuracy, the original data sampling interval was expanded to 1 min. A total of 2000 sets of time-series data were retrieved from the database, each spanning 600 steps, with 300 sets allocated for testing. The validity of the proposed model was verified by processing the sintering process state parameter time-series data.
Network parameters were determined through multiple optimization experiments to enhance the experimental outcomes. The experimental environment comprised a Python (version 3.10.0) setup running on a Windows 11 Professional system.
To rigorously evaluate the prediction accuracy, the following metrics were employed to validate the effectiveness of the proposed BTP temperature prediction model.
          e R M S E = 1 n i = 1 n y i y ^ i 2
    e M A E = 1 n i = 1 n y i y ^ i
  e M S E = 1 n i = 1 n y i y ^ i 2
    e M A P E = 100 % n i = 1 n y i y ^ i y i
      R 2 = 1 i = 1 n y i y ^ i 2 i = 1 n y i y ̄ 2
where y ^ i is the prediction data, y i is the actual data, and n is the sample size. e R M S E is the root mean square error, e M A P E is the mean absolute percentage error, e M A E is the mean absolute error, e M A P E is the mean square error, and R 2 represents the proportion of variance in the dependent variable that is predictable from the independent variables.
To more vividly illustrate the predictive model’s effectiveness, we carried out a series of ablation tests by removing the XGBoost and BiLSTM modules in sequence. The prediction results of the combined hybrid prediction model are presented in Figure 10a, with the corresponding prediction errors detailed in Table 3.
The prediction accuracy of the ablation experiments is presented in Table 2. The results demonstrate that the combined hybrid prediction model achieves the highest prediction accuracy, whereas the XGBoost method alone yields the lowest accuracy. This indicates that the integration of both approaches provides effective predictive capability for BTP temperature.

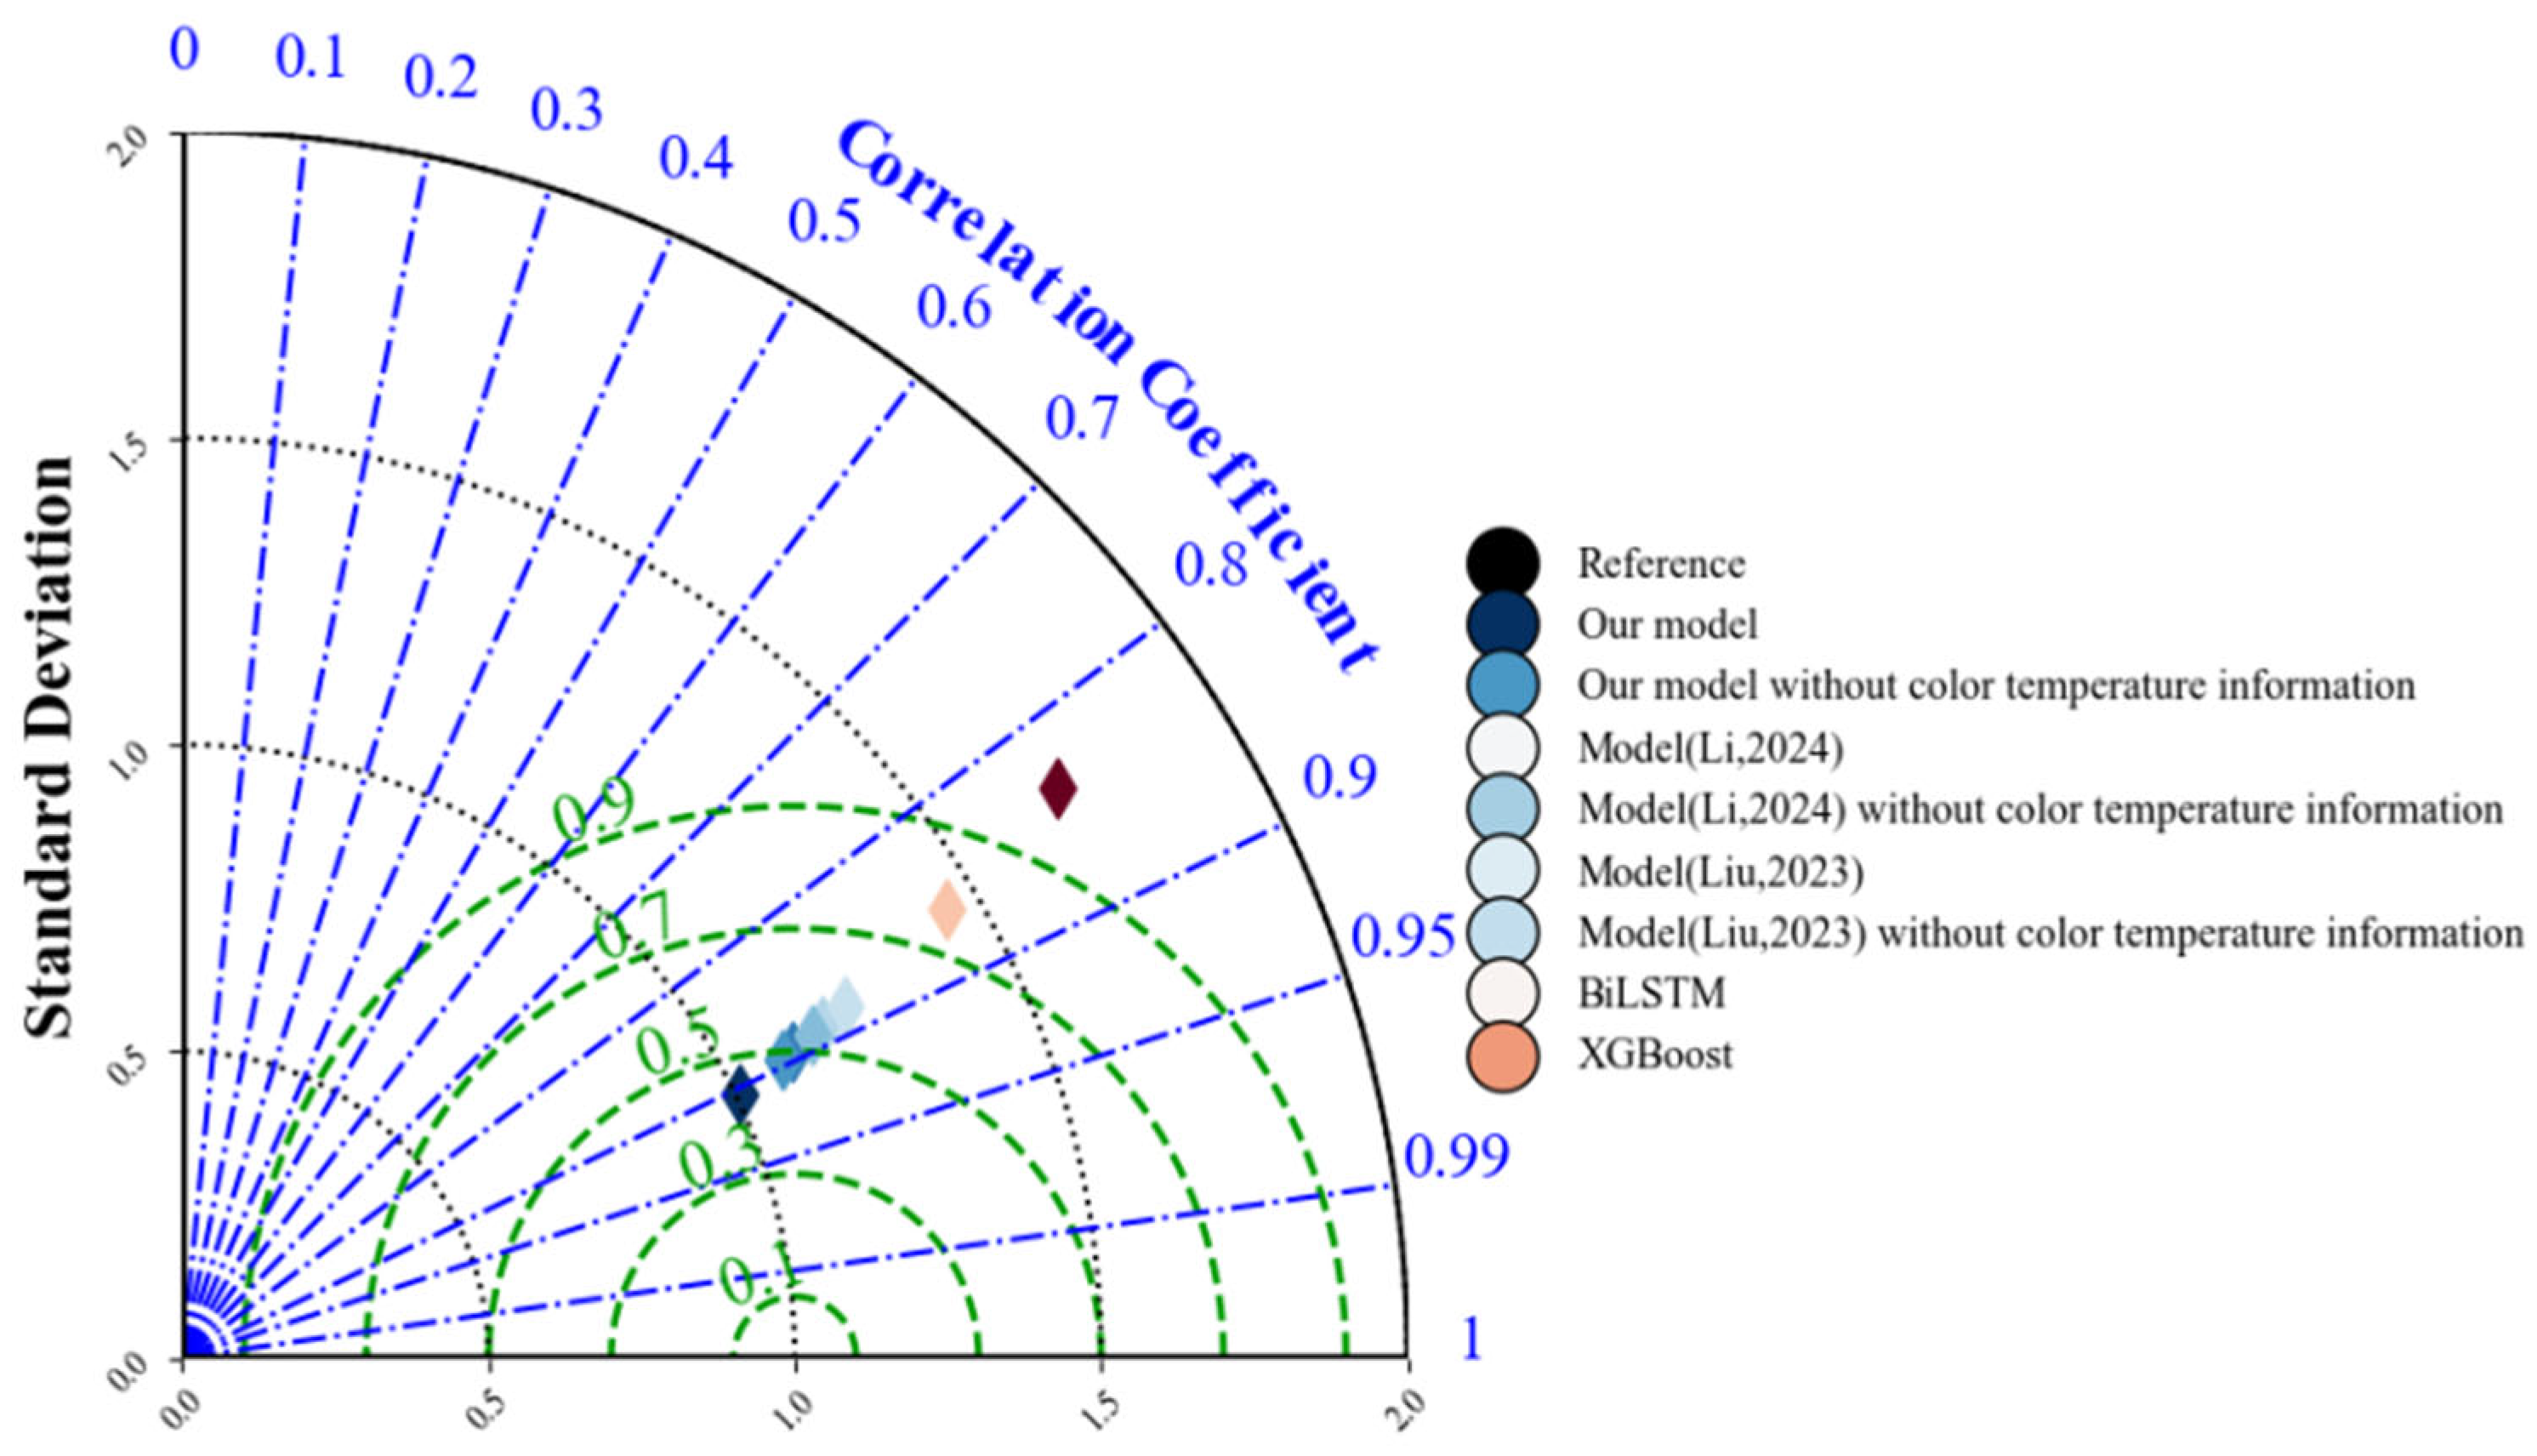
4.2. Comparison Experiments

To further validate the efficacy and superiority of the proposed BTP temperature prediction approach, comparative experiments were conducted against multiple established state parameter prediction techniques in steel metallurgy.
The model in [11] is a BTP position prediction system based on TCN and GRU. The model in [18] is a time-series prediction method based on CNN and LSTM.
To further investigate the impact of the color temperature information on model performance, we conducted an ablation experiment by removing the color temperature information from the input features. The modified model was then used for prediction, with its performance systematically compared against the original model configuration.
As evidenced in Table 4, the incorporation of combustion zone color temperature information yields significant improvements across all evaluation metrics of the BTP temperature prediction model. These results demonstrate that the chromatic temperature data of the combustion layer contributes measurably to the model’s predictive performance.
To ensure the reliability of comparative experimental outcomes, 2000 datasets are used in this study, among which 1700 groups are used for model training, and 300 independent samples are used as the test set to evaluate the generalization performance of the model. Multiple experimental repetitions were conducted under identical conditions, with the minimal-error results presented subsequently. Comparison diagrams of prediction results of three different models with and without color temperature information are respectively shown in Figure 10 and Figure 11.
It is worth noting that the error peaks of each model in Figure 10 and Figure 11 correspond to sample points within intervals of sudden temperature jumps in the non-stationary sequence.
The prediction performance of three models, evaluated through metrics such as e R M S E , e M A E , e M S E , e M A P E , and R 2 , is presented in Table 4. Our model stands out by achieving the lowest error metrics. Specifically, it has an e R M S E value of 6.1031, e M A E of 4.3542, e M S E of 37.2479, and e M A P E of 0.8490%. Complementing these low error values is an R2 of 0.9049, which is indicative of strong predictive accuracy and a high capacity to explain variance within the data.
Our model outperforms both others in all error-related metrics ( e R M S E , e M A E , e M S E , e M A P E ) and has a higher R 2 than the model in [11] and the model in [18], highlighting its superiority in minimizing prediction errors and capturing variance. This makes our model more robust for the nonlinear sintering process, critical for accurate BTP temperature forecasting.
Upon comparing models with and without color temperature information, the accuracy of each model is improved to a certain extent after incorporating color temperature information. The accuracy of the hybrid prediction model increases by 8.1%, that of the model in [11] increases by 1.8%, and that of the model in [18] increases by 5.8%. Therefore, color temperature information contributes to enhancing the prediction accuracy of models.
A Taylor diagram of the three models is presented in Figure 12. It can be seen from the diagram that after combining BiLSTM with XGBoost, the prediction capability of the hybrid model is significantly improved compared with that of the sub-models. When color temperature information is added to the hybrid model, it shows stronger comprehensive ability than other models in predicting BTP temperature and can effectively predict BTP temperature.
In conclusion, the hybrid prediction model of BTP temperature proposed in this paper, which integrates the color temperature information of the red-hot layer in images, exhibits higher precision in BTP temperature forecasting. This model can offer guiding insights for control within industrial processes.

4.3. Analysis of Model Robustness and Limitations

Robustness is crucial for the practical application of prediction models in industrial processes, where input parameters often fluctuate due to sensor noise, environmental interference, or operational variations. To evaluate the stability of the proposed hybrid prediction model under such fluctuations, robustness tests were conducted by introducing simulated perturbations to input features.
The tests used the same dataset as in Section 4.2 (2000 sets of production data, with 300 sets for testing) and ±10% random perturbations were artificially added to key input features, including color temperature information from cross-sectional images and time-series data.
Model performance was evaluated using RMSE, MAE, and R2 before and after introducing perturbations. The prediction results of the model before and after adding interference are shown in Figure 13.
As shown in Table 5, after adding ±10% perturbations, the increases in RMSE and MAE are less than 6%, and the change in R2 is less than 2%. These results indicate that the model has basic stability against input fluctuations.
Although the model demonstrates certain robustness in controlled experiments, there are still limitations in actual industrial scenarios that need further discussion.
Dust from cake fallout introduces image noise, while camera aging impairs color temperature extraction—both collectively disrupt feature consistency.
Ambient temperature fluctuations affect process parameters like bellows temperature, altering sintering thermal equilibrium and potentially causing measurement deviations in model inputs.
To address these limitations, future research can mitigate the influence of environmental factors through the calibration of features such as bellows temperature. This calibration process would help correct for perturbations introduced by ambient conditions, thereby enhancing the robustness of the model against environmental variability.

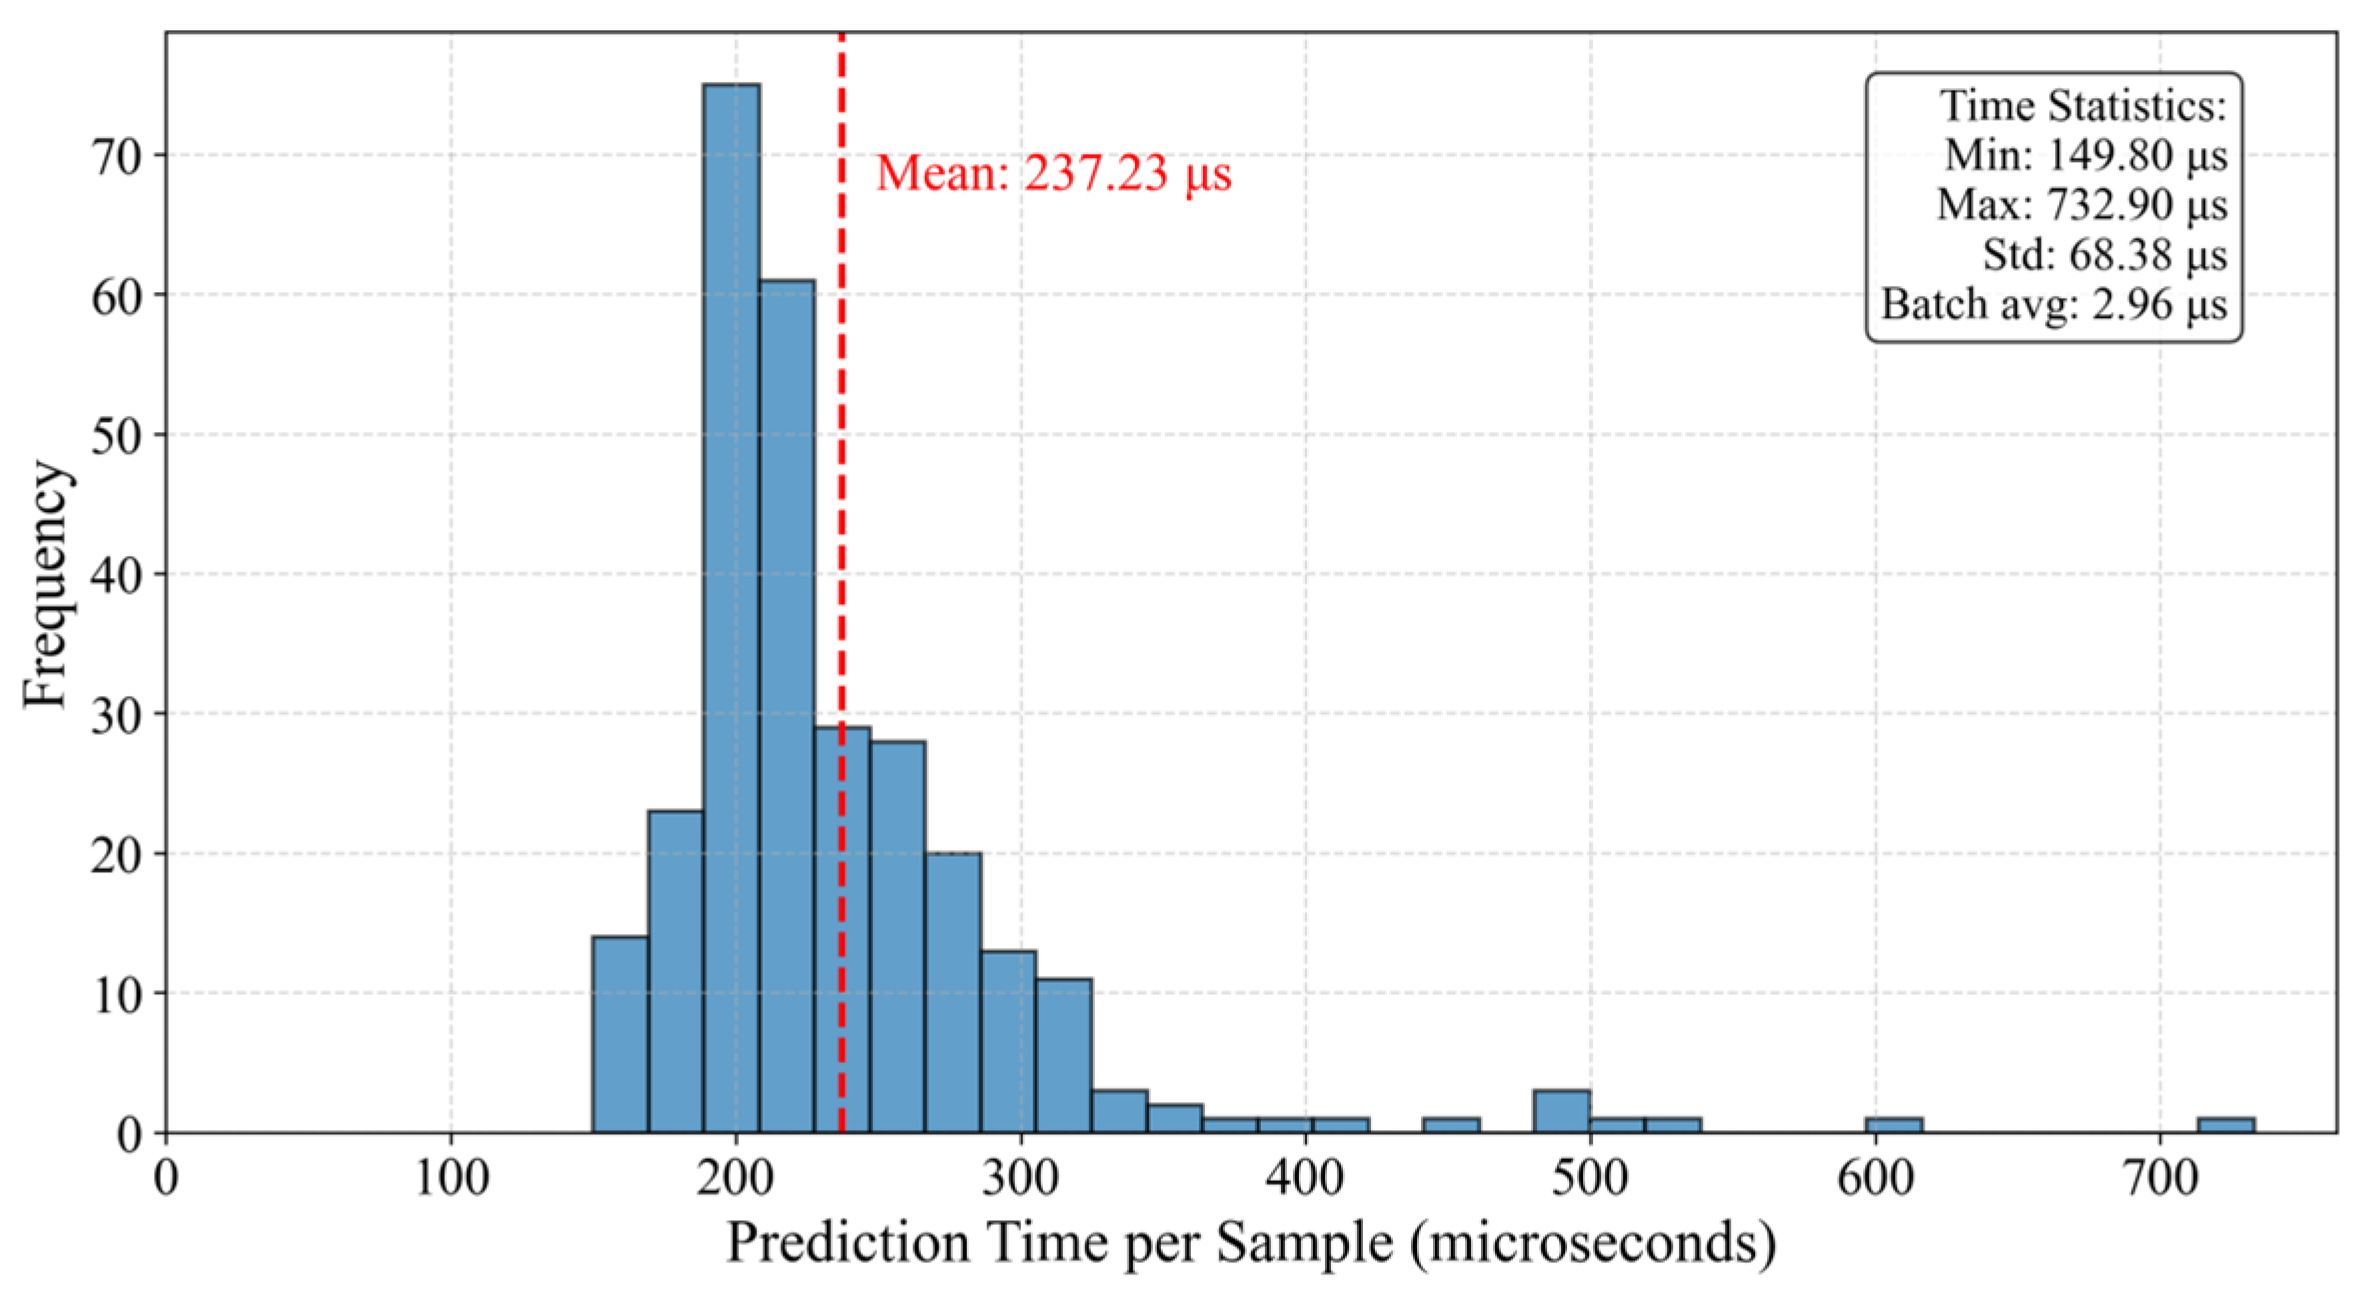
4.4. Analysis of Model Real-Time Performance

Real-time performance is critical for industrial applications, as timely predictions support on-site process control. To evaluate this, a real-time performance test was conducted in an experimental environment with the following hardware configuration: Intel Core i7-12700H processor, 16 GB memory, RTX 3060; software: Python 3.10.
The test involved continuous prediction time measurements on 300 samples from the test set. The results showed a stable average time consumption of 237.23 microseconds per sample. A histogram of the time required to predict each sample is shown in Figure 14.
Considering the real-time requirements for sintering process control in industrial sites, the prediction time of this model is less than 1 ms and fully meets the response needs in actual production.

5. Conclusions

This paper presents a hybrid prediction model that innovatively fuses red-hot-layer color temperature imagery with sequential feature learning and nonlinear regression, addressing the limitations of traditional purely sequential methods. By extracting visual features from sintering process images and coupling them with time-series process data, the model enables multi-modal data-driven prediction, effectively capturing process nonlinearity, time-variance, and cross-modal parameter correlations. Specifically, the integration of color temperature imagery allows the model to visualize and quantify the spatial-temporal distribution of sintering heat sources, which traditional methods relying solely on time-series data fail to capture.
The proposed approach offers a high-precision, multi-dimensional solution for BTP temperature prediction in steel metallurgy, directly guiding real-time sintering control to mitigate energy waste and quality instability caused by BTP fluctuations.
This method has certain applicability to other types of sintering machines and metallurgical processes. Its core lies in focusing on general characteristics such as temperature, pressure, and color temperature, rather than being limited to specific equipment models. However, when applying this method to other scenarios, it is necessary to conduct dataset adaptation verification in combination with specific equipment configurations and raw material properties. Future work will further enhance its universality in the metallurgical field through multi-scenario experiments.

Author Contributions

Conceptualization, M.Z. and S.D.; Methodology, M.Z. and S.D.; Software, Y.F.; Formal analysis, M.Z. and Y.F.; Data curation, Y.F., J.G., X.H., C.W. and X.M.; Writing—original draft, M.Z. and J.G.; Writing—review & editing, X.M. and S.D.; Visualization, M.Z.; Supervision, M.Z. All authors have read and agreed to the published version of the manuscript.

Funding

This work was supported in part by the Hubei Provincial Natural Science Foundation of China under Grant No. 2025AFB471, the Natural Science Foundation of Wuhan under Grant No. 2024040801020280, the 111 Project under Grant No. B17040, and in part by the Fundamental Re-search Funds for the Central Universities, China University of Geosciences under Grant No. 2021237.

Data Availability Statement

The original contributions presented in the study are included in the article, further inquiries can be directed to the corresponding author.

Conflicts of Interest

The authors declare no conflict of interest.

References

  1. Hu, J.; Li, H.; Li, H.; Wu, M.; Cao, W.; Pedrycz, W. Relevance vector machine with hybrid kernel-based soft sensor via data augmentation for incomplete output data in sintering process. Control Eng. Pract. 2024, 145, 105850. [Google Scholar] [CrossRef]
  2. Hu, J.; Wu, M.; Chen, L.; Cao, W.; Pedrycz, W. Real-time dynamic prediction model of carbon efficiency with working condition identification in sintering process. J. Process Control 2022, 111, 97–105. [Google Scholar] [CrossRef]
  3. Zhang, B.; Zhou, J.; Li, M. Prediction of sinter yield and strength in iron ore sintering process by numerical simulation. Appl. Therm. Eng. 2018, 131, 70–79. [Google Scholar] [CrossRef]
  4. Ding, C.; Jiang, F.; Xue, S.; Chang, R.; Long, H.; Yu, Z.; Ding, X. Prediction model of sintering bed temperature based on lognormal distribution function: Construction and application. J. Mater. Res. Technol. 2023, 26, 5478–5487. [Google Scholar] [CrossRef]
  5. Xu, B.; Ye, N. BP-PID Temperature Controlling System for Selective Laser Sintering Based on Fiber Bragg Grating Temperature Sensors. Instrum. Technol. Sens. 2022, 2, 61–64. [Google Scholar]
  6. Wu, M.; Duan, P.; Cao, W.; She, J.; Xiang, J. An intelligent control system based on prediction of the burn-through point for the sintering process of an iron and steel plant. Expert Syst. Appl. 2012, 39, 5971–5981. [Google Scholar] [CrossRef]
  7. Du, S.; Wu, M.; Chen, X.; Cao, W. An intelligent control strategy for iron ore sintering ignition process based on the prediction of ignition temperature. IEEE Trans. Ind. Electron. 2020, 67, 1233–1241. [Google Scholar] [CrossRef]
  8. Du, S.; Wu, M.; Chen, L.; Pedrycz, W. Prediction model of burn-through point with fuzzy time series for iron ore sintering process. Eng. Appl. Artif. Intell. 2021, 102, 104259. [Google Scholar] [CrossRef]
  9. Wu, M.; Xu, C.; She, J.; Cao, W. Neural-network-based integrated model for predicting burn-through point in lead–zinc sintering process. J. Process Control 2012, 22, 925–934. [Google Scholar] [CrossRef]
  10. Chi, Z.; Chen, X.; Xia, H.; Liu, C.; Wang, Z. An adaptive control system based on spatial–temporal graph convolutional and disentangled baseline-volatility prediction of bellows temperature for iron ore sintering process. J. Process Control 2024, 140, 103254. [Google Scholar] [CrossRef]
  11. Li, H.; Wu, M.; Du, S.; Hu, J.; Zhang, W.; Chen, L.; Ma, X.; Li, H. Prediction model of burn-through point with data correction based on feature matching of cross-section frame at discharge end. J. Process Control 2024, 140, 103265. [Google Scholar] [CrossRef]
  12. Chen, X.; Shi, X.; Lan, T. A semi-supervised linear-nonlinear prediction system for tumbler strength of iron ore sintering process with imbalanced data in multiple working modes. Control Eng. Pract. 2021, 110, 104766. [Google Scholar] [CrossRef]
  13. Chen, X.; Hu, Y.; Liu, C.; Chen, A.; Chi, Z. Dynamic spatio-temporal graph network based on multi-level feature interaction for sinter TFe prediction. J. Process Control 2025, 148, 103401. [Google Scholar] [CrossRef]
  14. Anisimov, S.V.; Galichenko, S.V.; Prokhorchuk, A.A.; Klimanova, E.V.; Kozmina, A.S.; Aphinogenov, K.V. Estimation of autocorrelation functions of atmospheric electric field variations using a Golomb array of sensors. Atmos. Res. 2025, 315, 107847. [Google Scholar] [CrossRef]
  15. Averty, T.; Boudraa, A.O.; Daré-Emzivat, D. Hurst exponent estimation using natural visibility graph embedding in Fisher–Shannon plane. Signal Process. 2025, 230, 109884. [Google Scholar] [CrossRef]
  16. Du, S.; Wu, M.; Chen, L.; Jin, L.; Cao, W.; Pedrycz, W. Operating Performance Improvement Based on Prediction and Grade Assessment for Sintering Process. IEEE Trans. Cybern. 2022, 52, 10529–10541. [Google Scholar] [CrossRef] [PubMed]
  17. Yan, F.; Yang, C.; Zhang, X. DSTED: A Denoising Spatial–Temporal Encoder–Decoder Framework for Multistep Prediction of Burn-Through Point in Sintering Process. IEEE Trans. Ind. Electron. 2022, 69, 10735–10744. [Google Scholar] [CrossRef]
  18. Liu, K.; Zhang, Y.; He, H.; Xiao, H.; Wang, S.; Zhang, Y.; Li, H.; Qian, X. Time series prediction of the chemical components of PM2.5 based on a deep learning model. Chemosphere 2023, 342, 1040153. [Google Scholar] [CrossRef] [PubMed]
Figure 1. Iron ore sintering process.
Energies 18 03595 g001
Figure 2. Temperature of the exhaust gas in the bellows.
Energies 18 03595 g002
Figure 3. Analysis of BTP temperature instability.
Energies 18 03595 g003
Figure 4. Comparison of sintered ore cake before and after falling.
Energies 18 03595 g004
Figure 5. Comparison of cross-sectional frame images.
Energies 18 03595 g005
Figure 6. Structure of the hybrid prediction model of the BTP temperature.
Energies 18 03595 g006
Figure 7. Comparison of normal and abnormal images.
Energies 18 03595 g007
Figure 8. Comparison image before and after calibration.
Energies 18 03595 g008
Figure 9. Comparison chart of grayscale histograms.
Energies 18 03595 g009
Figure 10. (a) BTP temperature prediction results of our model with color temperature information; (b) BTP temperature prediction results of model [11] (TCN-GRU, a BTP position prediction system) with color temperature information; (c) BTP temperature prediction results of model [18] (CNN-LSTM, a time-series prediction method) with color temperature information.
Energies 18 03595 g010
Figure 11. (a) BTP temperature prediction results of our model without color temperature information; (b) BTP temperature prediction results of model [11] (TCN-GRU, a BTP position prediction system) without color temperature information; (c) BTP temperature prediction results of model [18] (CNN-LSTM, a time-series prediction method) without color temperature information.
Energies 18 03595 g011
Figure 12. Taylor diagram for model comparison [11,18].
Energies 18 03595 g012
Figure 13. (a) Prediction results without interference. (b) Prediction results with interference.
Energies 18 03595 g013
Figure 14. Histogram of prediction time cost for each sample.
Energies 18 03595 g014
Table 1. Physical variables in the sintering process.
Physical VariableMeaningUnit
T B T P Burn-through point temperature°C
L B T P Burn-through point position/
Temperature of exhaust gas in bellowsThe temperature of exhaust gas in the sintering machine bellows°C
Exhaust gas pressure in bellowsThe pressure of exhaust gas in the bellowsPa
Strand velocityThe moving speed of the sintering trolleym/min
Ignition temperatureThe temperature in the ignition hood, used to ignite coke in the sinter mixture°C
Material layer thicknessThe thickness of the material layer on the sintering trolleymm
Ambient temperatureThe environmental temperature at the sintering site°C
Pixel valueA value representing the brightness of pixels in an image/
Table 2. Mutual information values of important features.
FeatureMutual Information
Temperature of exhaust gas in the 23rd bellows2.410
Temperature of exhaust gas in the 22nd bellows1.166
Exhaust gas pressure in the 24th bellows0.734
Temperature of exhaust gas in the 24th bellows0.705
Exhaust gas pressure in the 23rd bellows0.698
Temperature of exhaust gas in the 21st bellows0.646
Exhaust gas pressure in the 17th–19th bellows0.633
Exhaust gas pressure in the 5th bellows0.630
Exhaust gas pressure in the 4th bellows0.629
Exhaust gas pressure in the 13rd–15th bellows0.628
Table 3. Ablation experiment prediction errors.
Method e R M S E e M A E e M S E e M A P E R 2
Hybrid Prediction Model6.10314.354237.24790.8490%0.9049
BiLSTM7.31685.207953.53521.0222%0.8633
XGBoost7.94155.683663.06711.1096%0.8389
Table 4. Prediction errors of our model and other methods.
InformationModel e R M S E e M A E e M S E e M A P E c
With color temperature informationOur model6.10314.354237.24790.8490%0.9049
Model in [11]6.42294.553441.25340.8890%0.8946
Model in [18]6.36444.634440.50080.9011%0.8965
Without color temperature informationOur model6.59954.825443.55360.9408%0.8887
Model in [11]6.53994.729242.76970.9208%0.8908
Model in [18]6.73264.865145.32780.9500%0.8842
Table 5. Changes in the model’s metrics before and after introducing perturbations.
MetricOriginalWith 10% NoiseChange (%)
e R M S E 6.12076.46885.3%
e M A E 4.44414.62023.8%
R 2 0.90430.89311.2%
Disclaimer/Publisher’s Note: The statements, opinions and data contained in all publications are solely those of the individual author(s) and contributor(s) and not of MDPI and/or the editor(s). MDPI and/or the editor(s) disclaim responsibility for any injury to people or property resulting from any ideas, methods, instructions or products referred to in the content.

