Article

Process Performance and Biogas Output: Impact of Fluctuating Acetate Concentrations on Methanogenesis in Horizontal Anaerobic Reactors

by
Jovale Vincent Tongco
1,*,
Md Abu Hanifa Jannat
2,
Sangmin Kim
2,
Sang Hyeok Park
2 and
Seokhwan Hwang
2,3,*
1
Department of Forest, Rangeland and Fire Sciences, University of Idaho, 875 Perimeter Dr, Moscow, ID 83844, USA
2
Division of Environmental Science and Engineering, Pohang University of Science and Technology (POSTECH), 77 Cheongam-ro, Nam-gu, Pohang 37673, Republic of Korea
3
Institute for Convergence Research and Education in Advanced Technology (I-CREATE), Yonsei University, 85 Songdogwahak-ro, Yeonsu-gu, Incheon 21983, Republic of Korea
*
Authors to whom correspondence should be addressed.
Energies 2025, 18(12), 3120; https://doi.org/10.3390/en18123120
Submission received: 30 April 2025 / Revised: 1 June 2025 / Accepted: 11 June 2025 / Published: 13 June 2025
(This article belongs to the Section A4: Bio-Energy)

Abstract

:
The influence of introducing fluctuations in acetate feeding concentrations on the process stability of a lab-scale horizontal anaerobic reactor (HAR) was investigated to ascertain its effects on acetoclastic methanogenesis. Acetate concentrations were randomized at 85 g COD/L ± 20% and discontinuously fed in the duplicate HARs for five days per week (giving the system time to rest and equilibrate for two days). The reactors were monitored daily with respect to performance indicators (physicochemical variables). The residual acetate concentration was observed to fluctuate at the initial stages, followed by a converging trend (decrease in variance) until the end of operation. Furthermore, letting the system self-neutralize and equilibrate during rest days resulted in improved process performance. The daily acetate degradation efficiency at ~90% and methane concentration at ~60% were attained after operating the reactors for 80 days. The results divulged that introducing fluctuations in acetate feeding concentrations does not affect the stability of biogas production and methane concentration. The acclimatization of the methanogenic population (predominantly Methanosaeta, then shifting to Methanosarcina) was also observed.

1. Introduction

Technological advances in anaerobic digestion (AD), a process with a wide range of applications in bioenergy production and waste treatment, have been rapid for the past couple of decades, with recent discoveries in microbiological population dynamics and reactor design and operation leading to optimized biogas production and higher substrate degradation efficiency. The anaerobic digestion process at field-scale digesters often faces challenges in terms of maintaining the stability of operation due to fluctuations and inherent variabilities in the characteristics and composition of food wastes used [1,2,3]. There are different stages in the anaerobic digestion of organic compounds that are associated with the biological activity of microorganisms and variability in substrate characteristics that are dependent on geographic location and seasons. To guarantee the optimal rate and volume of methane production, stable anaerobic conditions, the right pH, and substrate balance must be maintained [4]. Typical food waste is used as substrate in field anaerobic digesters, but due to availability and seasonal variability, the concentrations fed into field digesters also vary from time to time [5,6]. Pertinent feeding patterns and frequency are also important strategies in operating AD systems, apart from reactor design and substrate variability in consideration of biogas production, reactor efficiency, economics, and profitability [7,8]. Research suggests that feeding frequency influences biogas production, methane concentration, and microbial community [9,10]. Continuous feeding often results in accidental organic overloading and the accumulation of volatile fatty acids (VFA) and long-chain fatty acids (LCFA), thus leading to process failure [10,11]. A study has also shown that a higher amount of biogas was produced if a reactor was fed less frequently (once per day and every other day), albeit the amount remained constant if fed more frequently (every 2 h) [12]. Intermittent feeding has been shown to minimize the accumulation of excess VFAs and LCFAs, therefore leading to process stability and overall improvement in AD reactor performance [13,14]. A non-feeding period would provide the time needed for the methanogens to degrade the excess substrate in the reactor, thereby giving the system a period to equilibrate.
Acetoclastic methanogenesis is an essential metabolic process in AD that constitutes more than 60% of methane production. The initial step in acetoclastic methanogenesis involves the activation of acetate to acetyl-CoA, a process that diverges between the two primary acetoclastic genera, namely, Methanosaeta and Methanosarcina. Methanosaeta is known to be competitive at relatively low acetate levels as compared to Methanosarcina and the other way around at higher acetate concentrations [15]. Methanosarcina employs the acetate kinase (AckA) and phosphotransacetylase (Pta) pathway, requiring an ATP molecule to generate acetyl-CoA [16,17]. On the other hand, Methanosaeta utilizes acetyl-CoA synthetase (ACS), which is a two-step ATP-dependent process that provides a stronger affinity for acetate, which allows Methanosaeta dominance in low-acetate environments [18]. Acetogenesis from substrate degradation in an anaerobic digester directly affects the methanogens and subsequent biogas production. This leads to concomitant interchanging of dominance between the two archaeal genera depending on the substrate fed and reactor conditions [8]. Only these two archaeal genera are known to effectuate acetoclastic methanogenesis through the conversion of acetate into methane and carbon dioxide [15,19,20]. The acetate conversion rate by methanogens is known to be a rate-limiting step in the biodegradation of soluble organics in AD systems. Therefore, the study of acetoclastic methanogens, along with their interactions and degradation efficiency in AD processes, will give an understanding of their optimal application in treating organic wastes from various sources [21]. The mechanistic understanding of acetoclastic methanogenesis is important for the optimization of AD and subsequent methane production. Despite substantial variability in microbial community dynamics, acetoclastic methanogenesis consistently dominates methane production in most AD research [22,23,24].
In this study, the HARs were assessed using acetate, a soluble substrate, focusing on acetoclastic methanogens to understand the effect of fluctuations on feeding concentrations. Using a soluble substrate such as acetate gives an idea of how soluble organic compounds behave in such horizontal reactors and reduces confounding variables present if more complicated substrates were utilized. The objectives of this study included: (1) mimicking the effects of variability in food waste characteristics from treatment facilities (fluctuations in daily substrate concentration) by randomized and discontinuous acetate feeding concentrations within a set magnitude of variation (85 g COD/L ± 20%) to the HARs; and (2) measuring the effects of randomizing acetate feeding concentration on substrate degradation efficiency, methanogenic community, biogas production, and methane concentration in HARs. A successful and stable anaerobic reactor operation relies on maintaining optimal conditions for microbial activity [25]. The key success criteria for this study are as follows: maintaining a stable temperature (35–40 °C) and pH (7.0–7.5), stabilization of reactor performance (consistent alkalinity, VSS, residual acetate concentrations), achievement of high removal efficiency (90%), consistent biogas production, stable methane concentration (60%), microbial community acclimatization.

2. Materials and Methods

2.1. Substrate and Inoculum

The concentration of acetic acid (ACS reagent, ≥99.7%, Sigma-Aldrich, St. Louis, MO, USA) fed to the reactors was randomized using the Index and Rand Between-Function in Microsoft™ Excel to determine a value within a preset range (magnitude of variation) of 85 g COD/L ± 20%. Values for the actual acetate concentrations, therefore, fall within the range of 68 to 102 g COD/L (at 3.4 g COD/L increments). The seed inoculum was obtained from a full-scale digester in Yeongcheon, South Korea. The inoculum samples were settled and starved for 48 h to let the microbes digest the residual organics present. Lastly, the settled portion of the concentrated inoculum was collected and used for HAR operation. Table 1 shows the characteristics of the settled seed inoculum at the start of the reactor operation.

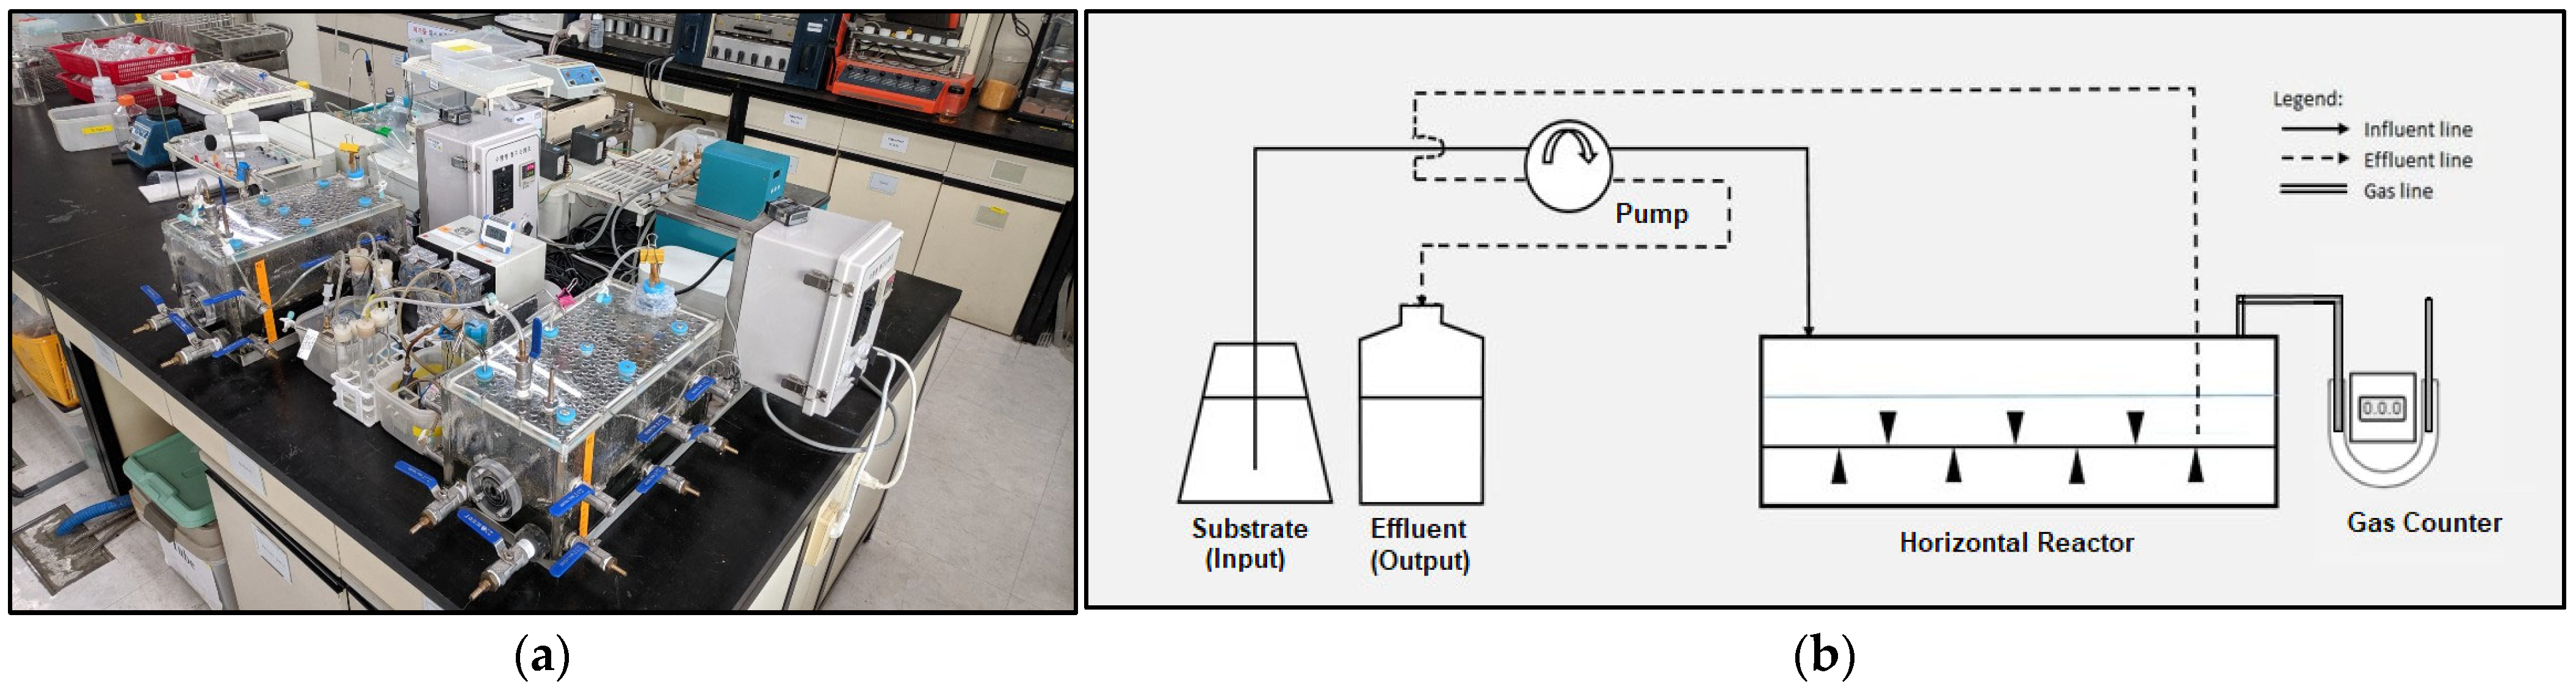
2.2. Horizontal Anaerobic Reactor (HAR)

Two HARs with dimensions of 450 mm (L) × 180 mm (W) × 180 mm (H) were custom-fabricated. The total volume per reactor is 14.6 L, which can accommodate a working volume of 10.0 L. An effective system depth of 123 mm was observed during reactor operation with 10.0 L of initial seed inoculum. A horizontal shaft composed of paddles (connected to an external motor) is responsible for mixing. The temperature was maintained by applying a built-in series of tubes inside the reactor connected through an external recirculating water bath, which is in turn controlled by a tandem temperature controller and RTD (resistance thermometer detector) probe. The temperature controller is connected to the water bath, which automatically turns off as long as the temperature of the reactor is constant. Figure 1 shows the photograph and schematic diagram of the HARs.

2.3. Experimental Conditions and Setup

The settled seed inoculum was equally divided into the two HARs (R1 and R2, for duplicate operation at 10.0 L per reactor). Varying concentrations of acetic acid were prepared prior to feeding, depending on the result of the randomizer function. Discontinuous feeding of acetic acid solution into each reactor using peristaltic pumps was employed once every 24 h for 20 min per feeding session, corresponding to 40 d HRT and a flow rate of 250 mL/d [13]. A weekly feeding strategy of five days of feeding and two days of rest was observed. The total amount of effluent removed corresponded with the amount of acetic acid fed to maintain the reactor working volume. Portions of the effluent removed from the reactors were used for further physicochemical and microbial analysis. The experimental HAR setup was operated for 80 d with a mixing rate kept constant at 3 rpm and temperature at 37 °C. Mixing and operating temperature were maintained during rest periods.

2.4. Physicochemical Analyses

The physicochemical variables were analyzed and monitored to determine process efficiency and stability. A benchtop pH meter was used to measure the pH of the effluent. The total and soluble chemical oxygen demand (COD and sCOD), volatile suspended solids (VSS), and alkalinity were analyzed according to Standard Methods [26]. Soluble samples were prepared by filtering through a 0.45 μm porosity Ministar-RC membrane filter (Sartorius, Göttingen, Germany). Daily biogas production was measured by an electronic gas counter (U-tube manometer type) and attachment to the gas line of the reactor. A gas chromatograph (6890 Plus, Agilent, Palo Alto, CA, USA) equipped with an HP INNOWax capillary column and a flame ionization detector (GC-FID) were used to measure acetate concentrations. The biogas composition and methane content were measured using a gas chromatograph (6890 Plus, Agilent, Palo Alto, CA, USA) equipped with an HP-5 capillary column and a thermal conductivity detector (GC-TCD). Inlet and detector temperatures were set at 50 °C and 250 °C, respectively. The column oven temperature was set at 60 °C. All analyses were performed in duplicate.

2.5. Microbial Community Analysis

Small amounts (~2 mL) of the effluent at different time points, preferably around the initial, middle, and endpoints of the reactor operation, were processed, frozen, and stored at −81 °C for microbial community analysis. Centrifugation of thawed samples was carried out prior to DNA extraction. Automatic total genomic DNA extraction was performed using magLEAD® 12gC and magLEAD® consumable kit (Precision System Science, Chiba, Japan) following procedures in the included manual. The extracted DNA concentration was measured using a Qubit ® 3.0 Fluorometer (Invitrogen, Carlsbad, CA, USA). Analysis of the microbial community was conducted by using Illumina® iSeqTM 100 sequencing system (Illumina, San Diego, CA, USA) with Nextera® XT index kit v2 (Illumina). Amplification of the microbial 16S rRNA utilized the selected primers: (1) 518 F (5′-CCAGC AGCCG CGGTA ATACG-3′) and 805 R (5′-GACTA CCAGG GTATC TAATC C-3′) as the bacterial primer; (2) 787 F (5′-ATTAG ATACC CSBGT AGTCC-3′) and 1059 R (5′-GCCAT GCACC WCCTC T-3′) as the archaeal primer [27]. UPARSE (USEARCH ver. 7.0.1090, Sonoma, CA, USA) was utilized to cluster sequences with ≥97% similarity as operational taxonomic units (OTUs). Classification of the OTUs was carried out by referencing the SILVA database (ver. 128) and NCBI BLAST (ver. 2.10.0) [28].

2.6. Statistical Analysis

The mean and standard deviation of the data obtained from physicochemical analysis were calculated for each reactor (R1 and R2). Since the reactors were operated as duplicates, the mean and standard deviation for the physicochemical data for both reactors were calculated and presented. The 16S rRNA quantification results sequenced by Illumina® iSeqTM 100 were utilized to perform non-metric multidimensional scaling (NMDS). Visualization of similarity in the archaeal community structure changes in the HAR over time was performed through NMDS ordination using Bray–Curtis distance [29,30]. Similarities of archaeal genus populations of both the reactors at different periods were constructed using cluster analysis by unweighted pair group method with arithmetic averages (UPGMA). The correlation of microbial community composition (relative abundance) with performance indicators (physicochemical variables) at different time points during reactor operation was visualized using canonical correspondence analysis (CCA) [8,31]. A permutation test (n = 999) was employed to evaluate the significance of the relationships between and among the archaeal community and reactor performance indicators. NMDS, cluster, and CCA analyses were conducted in PAST v4.03 for Windows.

3. Results and Discussion

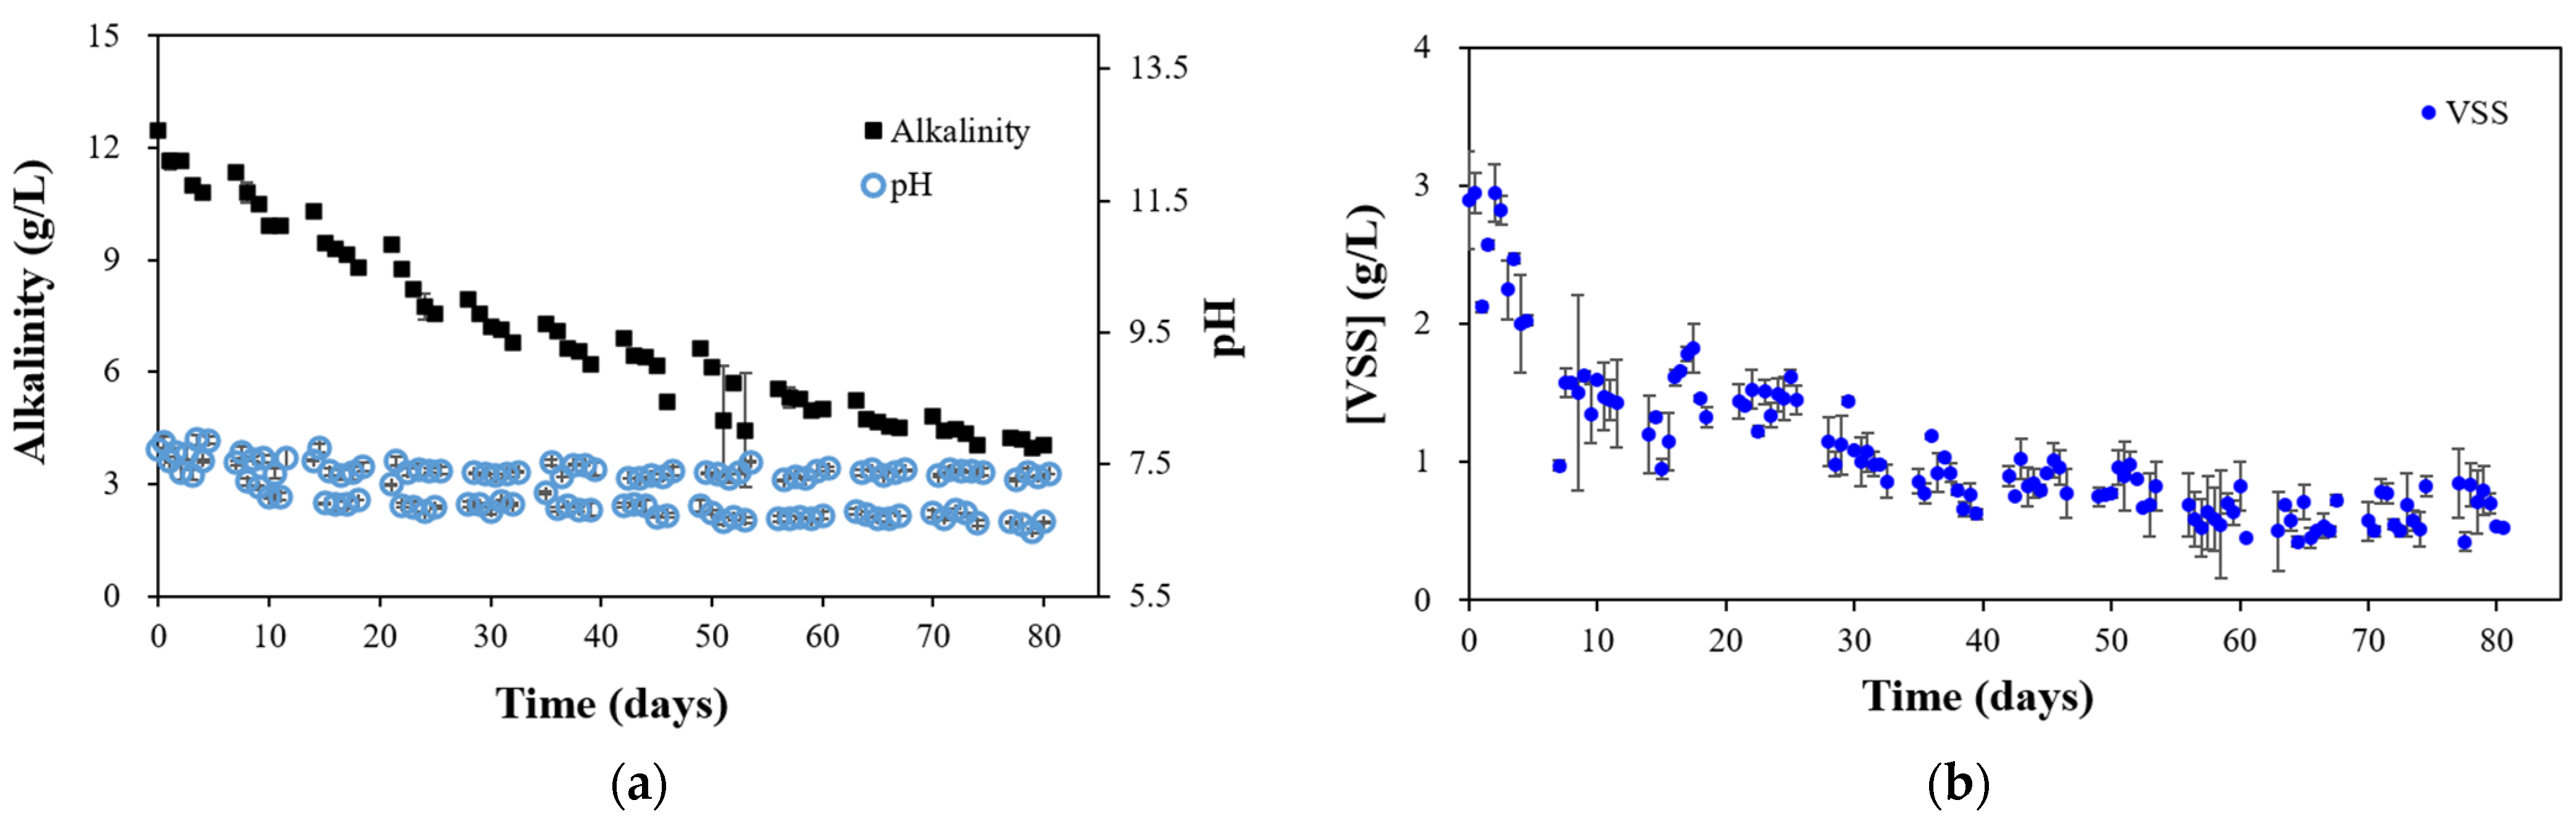
3.1. Horizontal Anaerobic Reactor (HAR) Performance

The reactor performance and stability were measured by maintaining the mixing rate and temperature and monitoring the pH, alkalinity, and daily biogas production. Implementation of slow mixing rates, typically from 3 to 5 rpm, provides advantages for maintaining the robustness of the microbial communities and subsequent substrate conversion and biogas production. A study on mixing intensities shows that high shear rates are detrimental to anaerobic digestion performance because excess agitation disrupts spatial associations between the substrates, bacteria, and methanogens [32]. The same study also demonstrated that using impeller speeds ranging from 50 to 1500 rpm affected digester performance negatively, with low biogas production rates and higher VFA accumulation. Conversely, digesters operating at 5 rpm achieved 60% higher biogas production. Maintaining the temperature of the reactors at 37 °C (mesophilic temperature) ensures optimal methanogenic metabolic activity and adaptation [33]. Mesophilic AD operates effectively at a temperature range of 25–40 °C, with the optimal range falling between 30 and 38 °C. This temperature range supports the diverse microbial community required for efficient substrate conversion and methane production [34,35,36]. Acetoclastic methanogenesis shows maximum activity within a relatively narrow pH range, with optimal values between pH 6.8 to 7.5. A study on isolated Methanosarcina mazei strains revealed optimal growth conditions at pH 6.8 to 7.2, signifying the preference of these methanogens for slightly neutral pH [37]. Methanosarcina species are known to have greater pH tolerance compared to Methanosaeta species, with the difference particularly more pronounced at lower pH. The versatility in metabolic capabilities of Methanosarcina contributes to its pH resilience. Unlike obligately acetoclastic methanogens, Methanosarcina can also utilize other substrates, providing alternative metabolic pathways during periods of unfavorable acetoclastic conditions. This metabolic flexibility allows this genus to maintain community viability even when acetoclastic conditions are inhibited, facilitating quick recovery when favorable pH conditions return [38]. Figure 2 shows the fluctuations in pH and alkalinity due to randomized concentrations of acetate fed, highlighting the gap (two-day rest) between the clustered data points (five-day feeding period). The pH of the reactors was measured every 12 h and alkalinity every 24 h to monitor the immediate changes in the reactor within a minimal period. The pH of the reactors was observed to fluctuate by decreasing to at least 6.6 immediately after feeding acetic acid and then reaching a near-neutral pH of 7.5 after 12 h. Alkalinity, on the other hand, exhibited a steep decrease in value up to day 40, after which it reached stability and showed a steady decrease until the end of the experiment. Alkalinity (bicarbonate measurement) is the direct measure of a reactor or digester’s stability [39]. Alkalinity is the first parameter to be affected before pH in terms of the accumulation of VFA in the reactor. Consequently, to guarantee stability, it is important to monitor alkalinity along with pH and VFA and not just pH or VFA alone. Since it is not designed in the experiment to have some sort of alkalinity and pH control through the addition of chemicals or buffers, a proper feeding strategy was formulated to let the reactor equilibrate and self-neutralize [13,14]. The reactors were fed once a day (24 h intervals) for five straight days, and the system was allowed to rest for two days (weekly feeding strategy). This feeding strategy made the pH and residual acetate concentration equilibrate and prevented further pH drop and VFA accumulation that is detrimental to the performance of the reactor and may lead to failure.
The volatile suspended solids (VSS) concentration was also monitored to estimate the concentration of microbes in the reactor. The VSS of the system is a rough estimate of solids concentration derived by measuring volatile solids. Because microbes are mostly organic, the VSS of the samples is a good indicator of organic solids concentrations and, therefore, the concentrations of microbes in the system [40,41,42]. The VSS of the two reactors both exhibited a steep decline from 0 d until 40 d, a point wherein the estimated microbial concentrations were stabilized (Figure 2b).

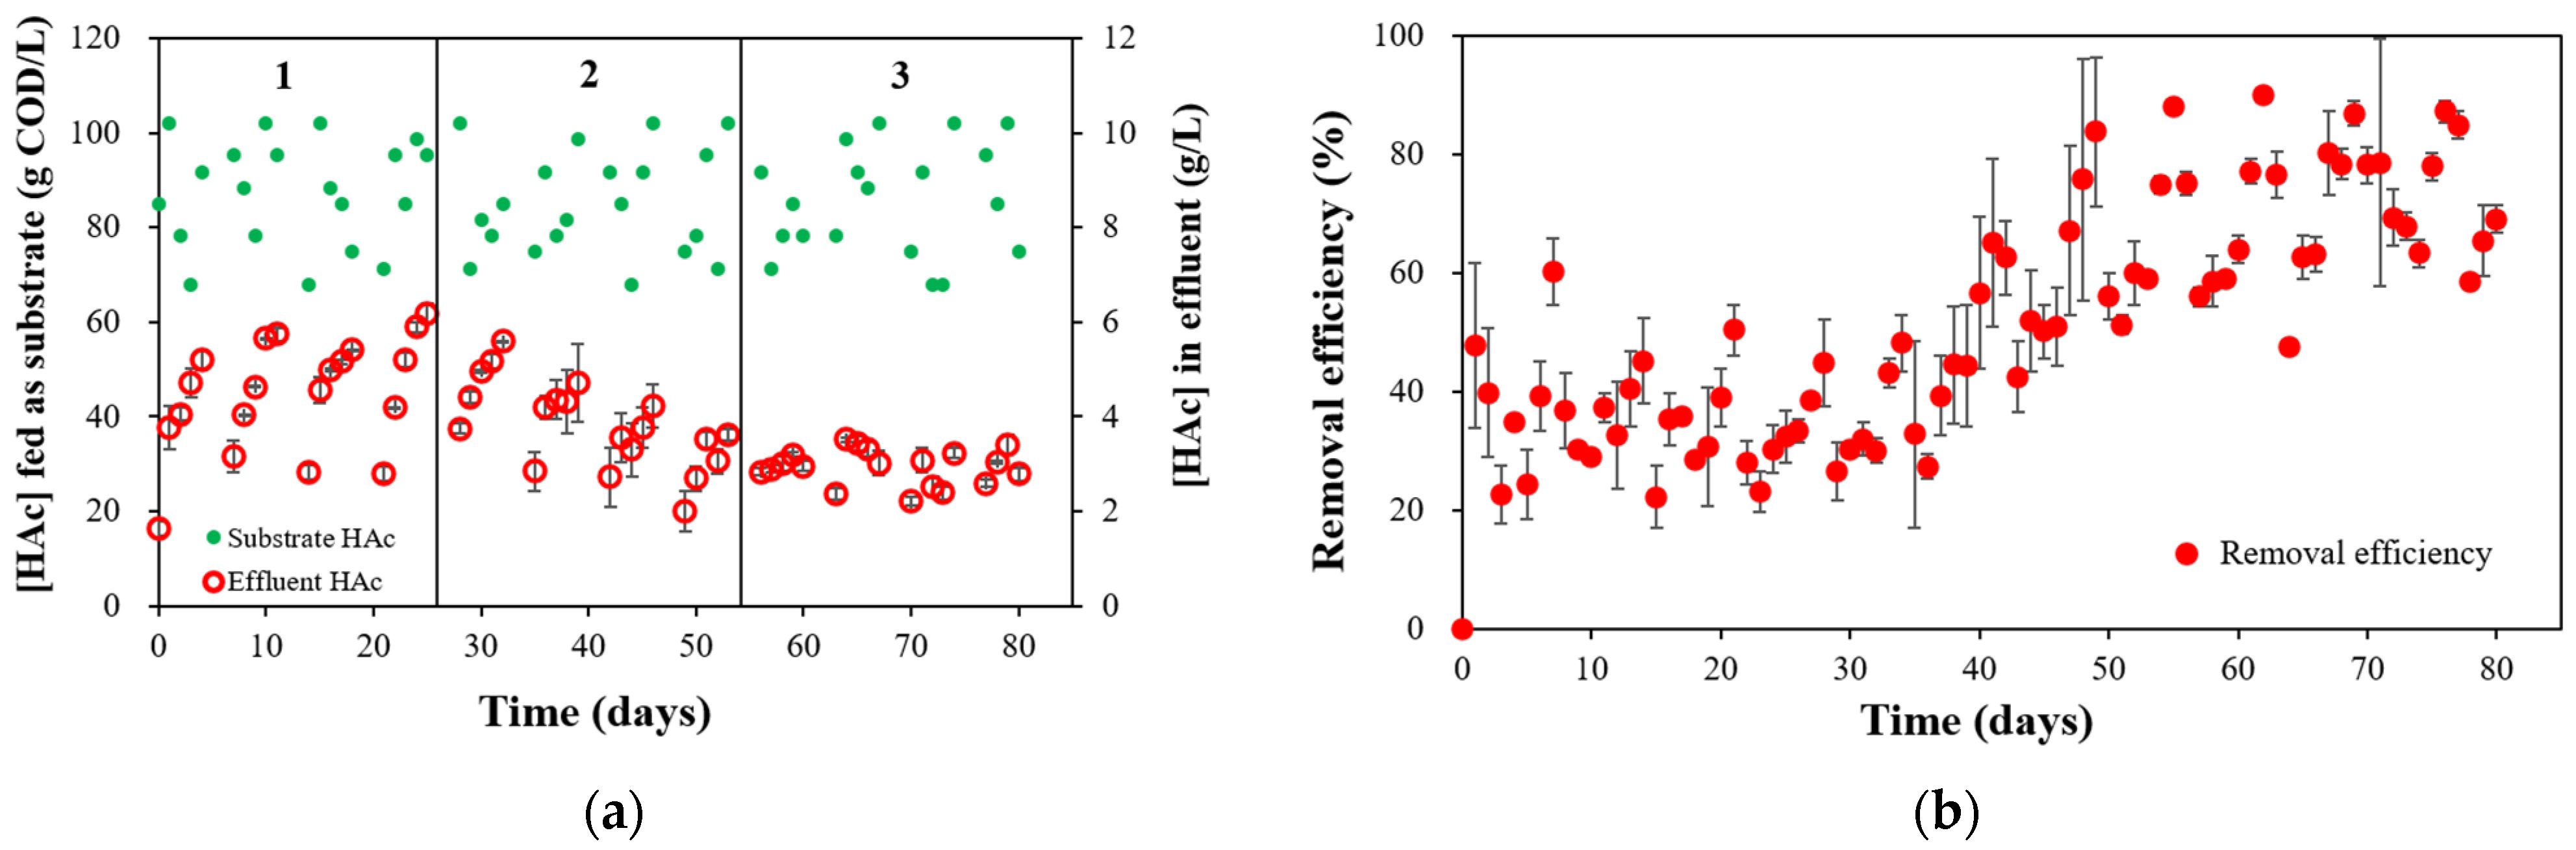
3.2. Substrate Degradation

The application of randomized acetate feeding concentrations expressed an interesting look at the residual acetate concentrations in the system, as measured in the effluent (Figure 3a). Randomized feeding within the bounds of a certain magnitude of variation (85 g COD/L ± 20%) did not induce the same pattern for the residual acetate concentrations. The specific acetate concentration range of 68 to 102 g COD/L was selected because it is well within the middle of the minimum and maximum soluble COD concentrations for food waste, which in itself is variable depending on the season and geographical source. The range also reflects the soluble COD concentrations of food waste samples reported in previous works, having average values of around 90 g COD/L, with the minimum soluble COD concentrations at around 60 g COD/L and the maximum soluble COD concentrations at around 120 g COD/L [43,44,45]. A related study concerning the pretreatment of food waste reported soluble COD concentrations for their food waste samples ranging from 40 to 120 g COD/L [46]. The effluent acetate concentration plot was categorized into three periods, as shown in the figure with respect to the concentration variance (<0.99, 1.0–2.9, >3.0). Calculating the variance at each period can illustrate more clearly the trend of effluent concentration during the reactor operation. The pattern for residual acetate concentrations started to show wide variations during the five-day feeding phase and two-day rest phase cycle in the initial period of the experiment (0 d–40 d). After that time, the weekly pattern in residual acetate concentrations started to converge and exhibit lower degrees of variation (decrease in calculated variance). There was an observed acetate accumulation during the five-day feeding phase and a sharp decrease after the two-day resting phase. The residual acetate concentration exhibited this trend until it was hardly noticeable at around 50 d. This pattern could be explained by a sharp increase in the calculated daily acetate removal efficiency after 40 d. The daily acetate removal efficiency was quantified based on the acetate concentration fed and the amount of residual acetate in the reactors 24 h after (Figure 3b). The daily acetate removal efficiency reached 90% at some points after 40 d as a consequence of changes in the microbial community structure that favored acetate consumption and degradation over other microbes (bacteria) and the introduction of discontinuous feeding that maintained the stability of the reactors by preventing residual acetate accumulation and subsequent drop in pH and alkalinity [8,12,13].

3.3. Biogas Production and Composition

The application of randomized acetate feeding concentrations also influenced biogas production and methane concentration. Randomizing the acetate feeding concentrations within the magnitude of variation (85 g COD/L ± 20%) does not affect the weekly pattern of biogas production, which followed the sharp increase from 0 to 1.3 L/L/d for the first five days of operation. After the first five days, the daily biogas production did not deviate from its range of around 1–2 L/L/d until the end of the experiment (Figure 4a). Excluding the initial point at t = 0, the minimum amount of biogas produced was 0.9 L/L/d, and the maximum was 1.8 L/L/d. This can be explained by the ability of the system to produce gas consistently with no regard to the input acetate concentrations rather than the residual acetate concentrations in the reactors due to discontinuous feeding [12,13]. It can be seen from the figure that gas production also increased daily during the five-day feeding phase and then decreased right after the two-day rest but overall followed a weekly trend until the end of the experiment. Figure 4b depicts the daily methane concentration corresponding to biogas production. It can be observed that the methane concentration also followed a sharp increase for the first five days of operation and then exhibited a slow rate of increase in overall concentration during the operation. This could be attributed to the fact that the initial microbial communities require buffer time for acclimation, especially the high increase in acetate fed during the first week of operation [8]. The peak average methane concentration of around 60% was obtained at t = 40 d, a point in time during the reactor operation in which the VSS and residual acetate concentrations stabilized.

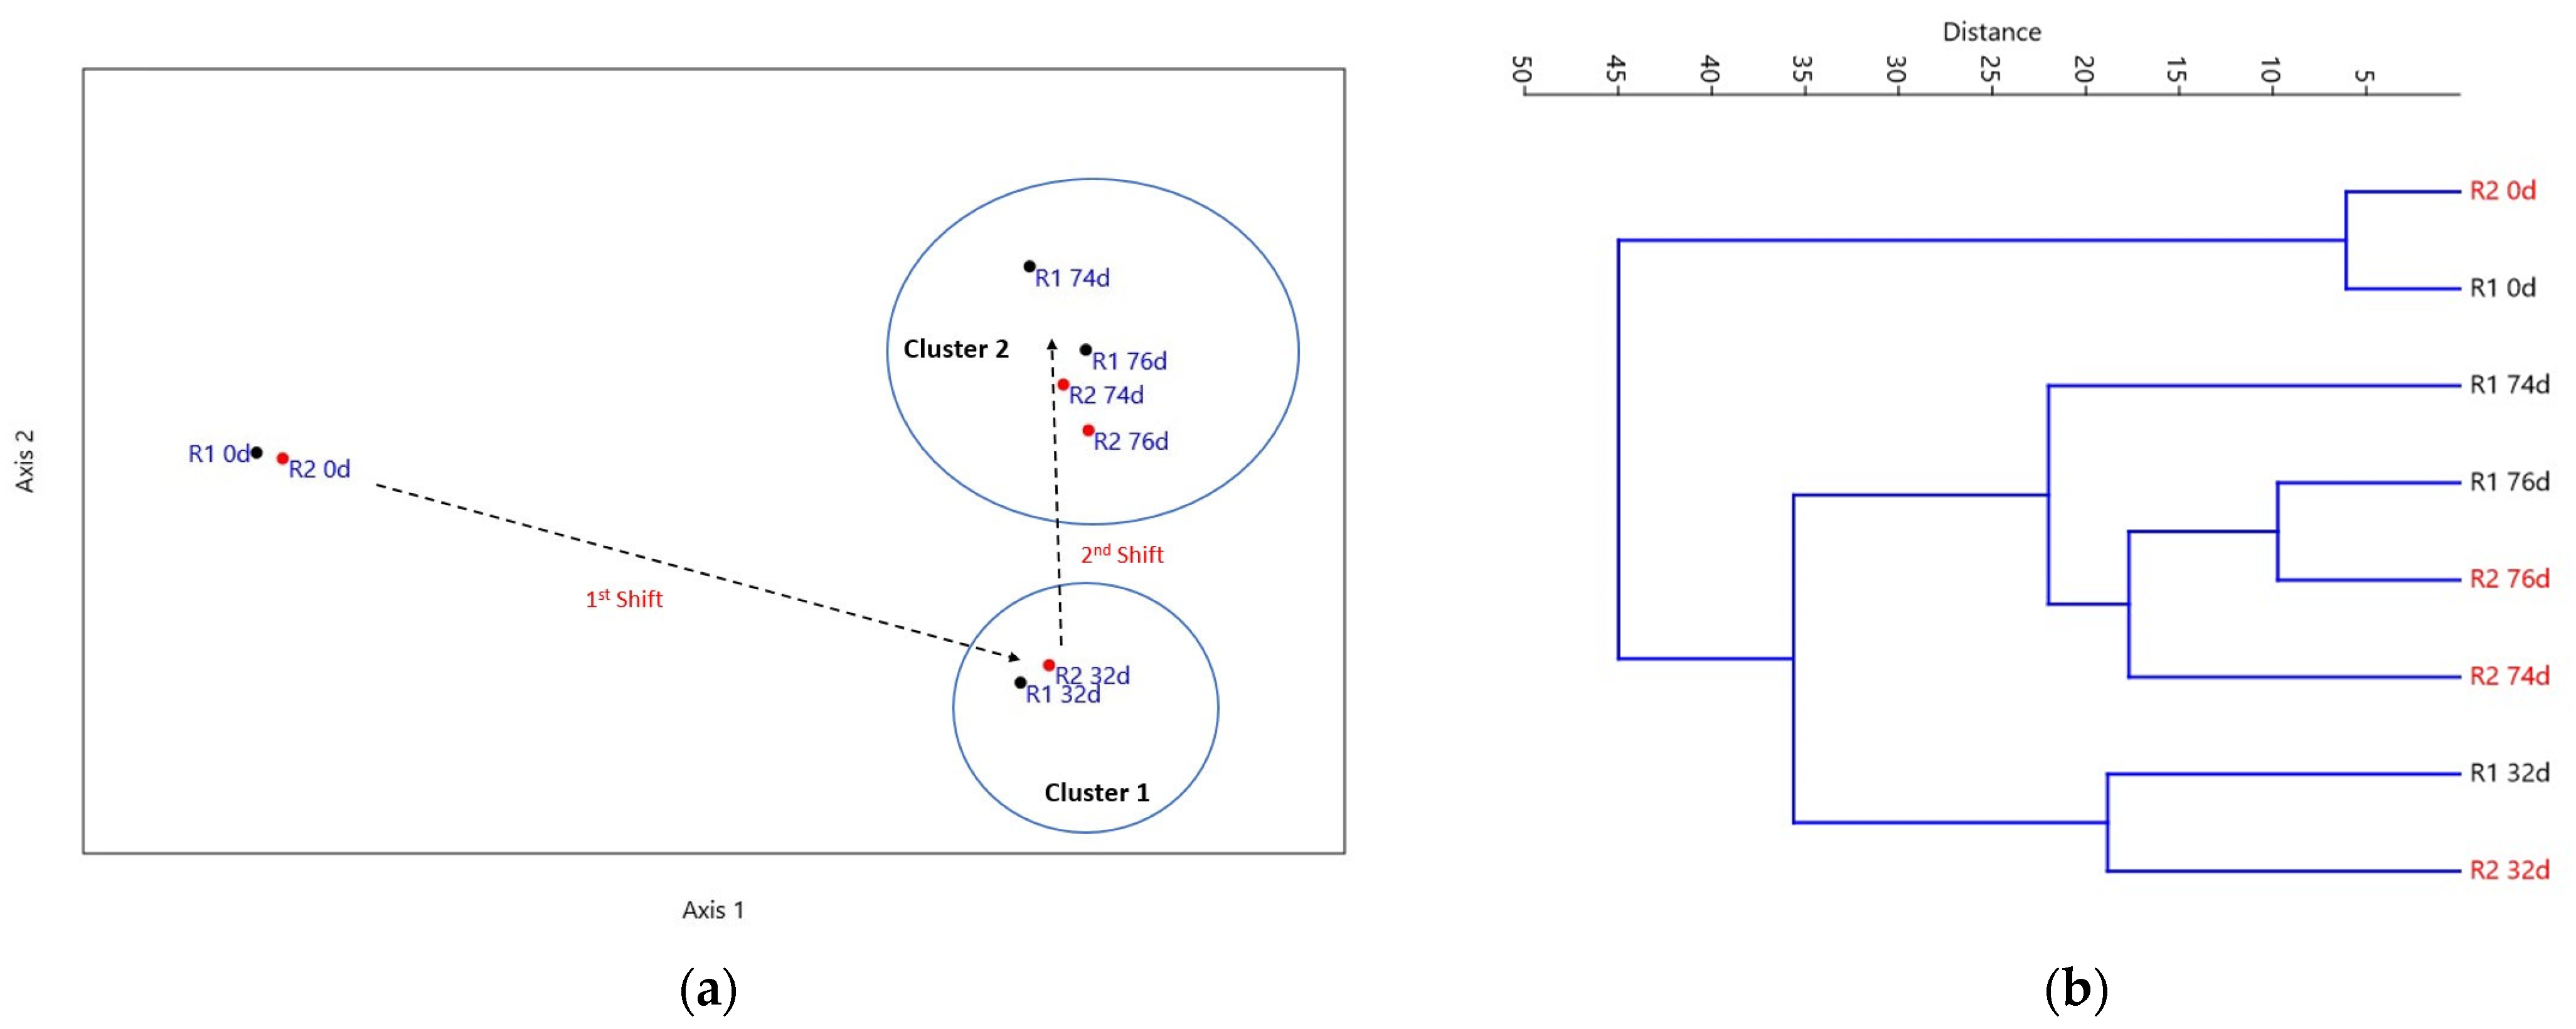
3.4. Microbial Community Analysis

To characterize the microbial communities in the operation of HAR, an analysis was conducted using the 16S rRNA gene high-throughput sequencing on the initial (0 d), the middle (32 d), and the endpoints (74 d and 76 d) of the effluent samples to reveal the archaeal communities. The two days observed at the endpoints were selected because 74 d was the start of a rest day during the last week of operation, and 76 d was the end of a rest day. Comparing these two days showed the differences in the microbial community during the start and end of a rest period, in which an increase in Methanosarcina was observed in both reactors. The initial and endpoints were observed for the bacterial communities. In general, the results revealed 139 different OTUs of archaeal communities, which were classified into 11 predominant genera, and 559 different OTUs of bacterial communities, which were classified into 19 predominant genera. In this case, the OTUs were considered as predominant genera if the numbers of relative abundance were more than 1% in at least one sample, while the others were considered as a minor group.
The relative abundance of the bacterial community at the genus level showed that Sedimentibacter (17.1% average relative abundance) and Fastidiosipila (30.8% average relative abundance) appeared as the predominant genus at 0 d (Figure 5a). Then, after the operation reached 76 d, Sedimentibacter dramatically declined, and Thiopseudomonas increased as a result. Fastidiosipila and Thiopseudomonas were reported as the main genera in anaerobic digestion, which could survive in an acetoclastic environment. In the case of the other genera, most of them were mostly decreased until they were less than 1% of relative abundance at the end of the operation [47].
In the case of the archaeal community at the genus level, Methanoculleus (21.7% average relative abundance) and Methanosaeta (27.2% average relative abundance) appeared as predominant genera at 0 d, and the same pattern was observed until 32 d, even though Methanoculleus started to decrease at that time. However, at 74 and 76 d, Methanosarcina was increasing, while Methanosaeta observed a slightly decreased trend, followed by a significant decrease in Methanoculleus (Figure 5b). Methanosaeta and Methanosarcina are acetoclastic methanogens that are involved in the process of converting acetate into methane and carbon dioxide directly [48]. The core enzymatic complex for acetoclastic methanogenesis in both these methanogens involves the CO dehydrogenase/acetyl-CoA synthase (Cdh) enzyme, encoded by several genes such as cdhA, cdhB, cdhC, cdhD, and cdhE in archaea [49]. This nickel-containing complex cleaves acetyl-CoA into methyl and carbonyl groups, with the former transferred to tetrahydrosarcinapterin (H4SPT) and the latter oxidized to CO2 (carbon dioxide). The methyl groups are then transferred to coenzyme M (HSCoM) through the corrionoid iron-sulfur protein. The methyl group is subsequently reduced to CH4 (methane) by methyl-coenzyme M reductase (Mcr) [50,51]. Methanosaeta and Methanosarcina are well known in the literature as predominant genera in anaerobic digesters in terms of treating acetate as intermediates during the methanogenesis phase [30,52].
By connecting the results of the microbial analysis with the physicochemical performance of the HAR, it was found that the shift in archaeal genera was not significantly affected by the randomized acetate feeding rather than the trend itself shows how Methanosaeta and Methanosarcina acclimatized with the fluctuation shock given in the system although both genera are considered as active acetoclastic methanogens. The observed decrease in the calculated variance of the residual acetate concentrations (converging pattern) can be attributed to the shift in dominance between these two archaeal genera, as the balance between the contributors in acetate degradation changes through the reactor operation, the acetate removal efficiency also improved. However, as Methanosarcina was barely discovered at the start of the operation, regardless of its ability to grow faster and produce a higher yield than Methanosaeta, it must be taken into consideration that the shock given to the reactors might be one of the contributing factors for the hampered growth since Methanosarcina could grow steadily before one turnover (less than 40 d) of the anaerobic digester operation if it were given constant substrate supply [53,54]. Moreover, even if Methanosaeta already existed from the start of the HAR operation and tended to keep its predominance throughout the entire process, it also experienced the shock differently as it struggled to keep the predominance after about 30 days of the operation even though it is the most tolerant to the wide range of physical changes during anaerobic digestion process [55]. The observed increase in the relative abundance of Methanosarcina after the midpoint part of the reactor operation was due to its ability to resist higher acetate concentrations. In the initial phase of the reactor operation, the dominance of Methanosaeta was due to its high substrate affinity for acetate, enabling efficient scavenging under low-acetate conditions (Km < 1 mM) [56]. This metabolic strategy prioritizes energy conservation over growth rate, resulting in doubling times exceeding 72 h. In contrast, Methanosarcina demonstrates lower acetate affinity but achieves rapid growth and higher Vmax under 24 h in high-acetate conditions (Km > 5 mM) [38,57]. Methanosaeta-dominated systems achieve near-stoichiometric methane yields (1 mol CH4/mol acetate) following a strict acetoclastic metabolism [56]. Methanosarcina is also capable of utilizing methanol and methylamines as co-substrates, diverting up to 30% of carbon to CO2 via the methylotrophic pathway when utilizing these co-substrates, reducing methane yield. However, in pure acetoclastic mode, Methanosarcina matches the methane stoichiometric yield of Methanosaeta, explaining the stable methane concentration (~60%) observed in the current study [57,58].

3.5. Statistical Analysis

NMDS analysis based on the relative abundance of OTUs from the reactors on a temporal basis was employed to visualize the changes in archaeal community structure. This ordination method is most effective in terms of showing the relationships among and between variables in the context of interpreting ecological community data. The NMDS result illustrates R2 = 0.68 and stress = 0.048 values, indicating acceptable accuracy. The NMDS result showed that there are shifts in the archaeal community structure throughout the operation, and two noteworthy shifts were observed: from 0 d to 32 d and from 32 d to 76 d (Figure 6a). The first shift could be attributed to the sharp increase in Methanosaeta, mainly due to the acclimatization of this methanogen on the continuous sole feeding of acetate [12,21]. The second shift was mainly dominated by the appearance and gradual increase in Methanosarcina, which is known to be more tolerant when susceptible to higher acetate concentrations, stress, and perturbations [12,15,55,59]. The significance of the ordination method was confirmed at p < 0.05. Figure 6b shows the shift as visualized by a cluster dendrogram. This ordination method serves as a quick view of the similarities of the reactors in terms of the relative abundance of OTUs at different time points.
Canonical correspondence analysis (CCA), shown in Figure 7, was performed to correlate how microbial species respond to particular environmental variables [60,61]. In this study, the environmental variables taken into consideration were the physicochemical data describing the reactor performance indicators (alkalinity, COD, sCOD, VSS, residual acetate, and methane%). As stated in Section 3.2, the residual acetate concentrations were a direct measure of reactor efficiency, showing the capability of the methanogens to utilize acetate in the reactor. CCA suggests that the decrease in residual acetate concentrations and subsequent methane concentrations was predominantly caused by Methanosaeta, being the dominant genus in the reactors (p < 0.05). The CCA diagram also shows that since acetate was the sole substrate fed in the reactors, the sCOD gives a clear estimate of the acetate concentrations more than COD and that the sCOD and COD were observed more during the beginning of the operation for both reactors at 0–32 d as compared to 32–76 d. VSS was attributed more to the beginning of the operation, which was driven by the other methanogens (microbial concentration) besides Methanosaeta and Methanosarcina. As the alkalinity and VSS decreased, a corresponding increase in methane concentration was observed, this time nearing the end of the operation (endpoint). The CCA diagram also shows that Methanosarcina is more inclined towards the endpoint (76 d) rather than the starting point (0 d), whereas Methanosaeta was observed to have reasonably similar correspondence to all of the time points, especially the midpoint (32 d), where it was the most dominant genus (p < 0.05). It can also be deduced that near the endpoint, only three genera were responsible for the methanogenesis, namely Methanosaeta, Methanosarcina, and Candidatus Methanogranum.

3.6. Implications, Applications, and Recommendations

A practical implication of this study is that by discontinuous (five-day feeding and two-day rest) and infrequent (once every 24 h) feeding, self-neutralization and equilibration can be achieved, which helps to maintain the biogas production and process performance of the reactor. This scenario applies to scaled-up operations in terms of maintaining the capability of site digesters to supply energy during the active periods of the week and supply less energy for at least 2 days before restarting the feeding cycle again for the next week [12]. Another implication is the utilization of varying concentrations of food waste produced by a certain treatment site. Variations in food waste concentrations fed into field digesters correspond to variations in acetate concentrations produced by acidogenic bacteria [59]. These variations and fluctuations affect the methanogens in the digester in the same way that the randomization of acetate fed in this study affected the methanogens in the reactors. A good application of this study would be the design of future digesters with an emphasis on substrate concentration variations and corresponding process performance monitoring. The study focused on acetate, a direct methanogenic precursor and an ideal model substrate. Real-world applications call for the use of complex organic matter, such as food waste, sludge, and agricultural residues. It is recommended for future studies to apply real food waste or other complex organics as a substrate on different types of reactor designs and to evaluate different degrees of the magnitude of variation (range) of substrate concentrations. Reactor design is also crucial. The fabrication of simpler and more cost-effective reactors would translate to a more comprehensive experimental design with various levels of control and treatments, leading to a more robust statistical analysis. It is also recommended to construct a dynamic model for simulating the effects of substrate concentration fluctuations on microbial community structures and process performance of anaerobic reactors. Simulation studies will facilitate predicting the behavior of reactors under different working conditions and provide baseline data for further research.

4. Conclusions

Randomizing acetate feeding concentrations and implementing a discontinuous feeding strategy were employed to measure process stability, substrate degradation efficiency, microbial population, and biogas production. The success of randomized acetate concentrations and discontinuous feeding strategy points to a system that is not just stable but also exhibits resilience to variations in organic loading. This is vital for real-world applications where substrate (feedstock) composition and availability can be inconsistent. Accumulation of acetate in the reactors was prevented by discontinuous feeding, regardless of the randomized concentrations fed. Consequently, this led to a self-neutralizing and equilibrating system with acclimatized methanogenic consortia, increasing acetate degradation efficiency and methane concentration. Self-neutralization and equilibration were advantageous due to the prevention of residual acetate accumulation and pH drops that could inhibit methanogenesis. Discontinuous feeding provided periods of rest where acetate was consumed without immediate replenishment, leading to intrinsic buffering of the system, preventing external chemical additions, and leading to more cost-effective and sustainable reactor operation. Microbial community analysis showed Methanosaeta as the dominant genus, followed by Methanosarcina after the midpoint of operation. The shift in dominance from Methanosaeta to co-dominance between Methanosaeta and Methanosarcina near the endpoint of reactor operation was due to the difference in acetate resiliency of the two methanogens. Methanosaeta thrives at low acetate concentrations due to its high substrate affinity, while Methanosarcina is capable of faster growth at high acetate concentrations. Fluctuating acetate levels and discontinuous feeding initially favored Methanosaeta during periods of low acetate. As the system experienced higher acetate concentrations during feeding, Methanosarcina found its niche, improving the acetate degradation efficiency of the reactors. Multivariate analysis successfully showed the correlation between the methanogens in the system and performance indicators (physicochemical variables). The results of the analysis can be potentially utilized for the development of predictive models for anaerobic digester performance.

Author Contributions

Conceptualization: S.H.; methodology: J.V.T. and S.H.; software: S.K. and S.H.P.; validation: M.A.H.J., S.K., and S.H.P.; formal analysis: J.V.T. and M.A.H.J.; investigation: J.V.T.; resources: M.A.H.J. and S.H.; data curation: M.A.H.J., S.K., and S.H.P.; writing—original draft preparation: J.V.T.; writing—review and editing: J.V.T., M.A.H.J., S.H.P., and S.H.; visualization: J.V.T. and S.K.; supervision: S.H.; project administration: S.H.; funding acquisition: S.H. All authors have read and agreed to the published version of the manuscript.

Funding

This research was financially supported by the Korea Ministry of Environment as Waste to Energy-Recycling Human Resource Development Project (No. YL-WE-21-002) and by the Korea Environmental Industry & Technology Institute (KEITI) grant funded by the Ministry of Environment (ME) of the Korean government (No. 2022003590002).

Institutional Review Board Statement

Not applicable.

Informed Consent Statement

Not applicable.

Data Availability Statement

Data are contained within the article.

Conflicts of Interest

The authors declare no conflicts of interest.

References

  1. Jo, Y.; Rhee, C.; Choi, H.; Shin, J.; Shin, S.G.; Lee, C. Long-term effectiveness of bioaugmentation with rumen culture in continuous anaerobic digestion of food and vegetable wastes under feed composition fluctuations. Bioresour. Technol. 2021, 338, 125500. [Google Scholar] [CrossRef] [PubMed]
  2. Zhou, H.; Jiang, J.; Zhao, Q.; Li, L.; Wang, K.; Wei, L. Effects of organic loading rates on high-solids anaerobic digestion of food waste in horizontal flow reactor: Methane production, stability and mechanism. Chemosphere 2022, 293, 133650. [Google Scholar] [CrossRef] [PubMed]
  3. Zhang, L.; Yuan, Y.; Zhang, Y.; Liu, Y. Switching from wet to dry anaerobic digestion of food waste with different dilution times under no mechanical mixing condition. Chemosphere 2024, 352, 141299. [Google Scholar] [CrossRef] [PubMed]
  4. Nurgaliyev, N.; Akimzhanov, A.; Klivenko, A.; Sabitova, A.; Astemessova, K.; Turlybekova, G.; Nyssanbayeva, S.; Kurmangaliyev, R. Mathematical Model of Biomethane Yield at Anaerobic Methane Fermentation of Organic Wastes: Influence of Various Parameters and Factors. Eng. Sci. Publ. 2024, 26, 1280. [Google Scholar] [CrossRef]
  5. Bong, C.P.C.; Lim, L.Y.; Lee, C.T.; Klemeš, J.J.; Ho, C.S.; Ho, W.S. The characterisation and treatment of food waste for improvement of biogas production during anaerobic digestion—A review. J. Clean. Prod. 2018, 172, 1545–1558. [Google Scholar] [CrossRef]
  6. Zhang, R.; El-Mashad, H.M.; Hartman, K.; Wang, F.; Liu, G.; Choate, C.; Gamble, P. Characterization of food waste as feedstock for anaerobic digestion. Bioresour. Technol. 2007, 98, 929–935. [Google Scholar] [CrossRef]
  7. Willeghems, G.; Buysse, J. Changing old habits: The case of feeding patterns in anaerobic digesters. Renew. Energy 2016, 92, 212–221. [Google Scholar] [CrossRef]
  8. Kurade, M.B.; Saha, S.; Salama, E.S.; Patil, S.M.; Govindwar, S.P.; Jeon, B.-H. Acetoclastic methanogenesis led by Methanosarcina in anaerobic co-digestion of fats, oil and grease for enhanced production of methane. Bioresour. Technol. 2019, 272, 351–359. [Google Scholar] [CrossRef]
  9. Svensson, K.; Paruch, L.; Gaby, J.C.; Linjordet, R. Feeding frequency influences process performance and microbial community composition in anaerobic digesters treating steam exploded food waste. Bioresour. Technol. 2018, 269, 276–284. [Google Scholar] [CrossRef]
  10. Ziels, R.M.; Beck, D.A.C.; Stensel, H.D. Long-chain fatty acid feeding frequency in anaerobic codigestion impacts syntrophic community structure and biokinetics. Water Res. 2017, 117, 218–229. [Google Scholar] [CrossRef]
  11. Kleyböcker, A.; Liebrich, M.; Verstraete, W.; Kraume, M.; Würdemann, H. Early warning indicators for process failure due to organic overloading by rapeseed oil in one-stage continuously stirred tank reactor, sewage sludge and waste digesters. Bioresour. Technol. 2012, 123, 534–541. [Google Scholar] [CrossRef] [PubMed]
  12. Mulat, D.G.; Fabian Jacobi, H.; Feilberg, A.; Adamsen, A.P.S.; Richnow, H.-H.; Nikolausz, M.; Kelly, R.M. Changing feeding regimes to demonstrate flexible biogas production: Effects on process performance, microbial community structure, and methanogenesis pathways. Appl. Environ. Microbiol. 2016, 82, 438–449. [Google Scholar] [CrossRef] [PubMed]
  13. Bonk, F.; Popp, D.; Weinrich, S.; Sträuber, H.; Kleinsteuber, S.; Harms, H.; Centler, F. Intermittent fasting for microbes: How discontinuous feeding increases functional stability in anaerobic digestion. Biotechnol. Biofuels 2018, 11, 1–15. [Google Scholar] [CrossRef]
  14. Chan, P.C.; de Toledo, R.A.; Shim, H. Anaerobic co-digestion of food waste and domestic wastewater—Effect of intermittent feeding on short and long chain fatty acids accumulation. Renew. Energy 2018, 124, 129–135. [Google Scholar] [CrossRef]
  15. Chen, S.; Cheng, H.; Liu, J.; Hazen, T.C.; Huang, V.; He, Q. Unexpected competitiveness of Methanosaeta populations at elevated acetate concentrations in methanogenic treatment of animal wastewater. Appl. Microbiol. Biotechnol. 2017, 101, 1729–1738. [Google Scholar] [CrossRef]
  16. Castaño-Cerezo, S.; Pastor, J.M.; Renilla, S.; Bernal, V.; Iborra, J.L.; Cánovas, M. An insight into the role of phosphotransacetylase (pta) and the acetate/acetyl-CoA node in Escherichia coli. Microb. Cell Fact. 2009, 8, 1–19. [Google Scholar] [CrossRef]
  17. Fournier, G.P.; Gogarten, J.P. Evolution of acetoclastic methanogenesis in Methanosarcina via horizontal gene transfer from cellulolytic Clostridia. J. Bacteriol. 2008, 190, 1124–1127. [Google Scholar] [CrossRef]
  18. Penning, H.; Claus, P.; Casper, P.; Conrad, R. Carbon isotope fractionation during acetoclastic methanogenesis by Methanosaeta concilii in culture and a lake sediment. Appl. Environ. Microbiol. 2006, 72, 5648–5652. [Google Scholar] [CrossRef]
  19. Kang, X.; Lin, R.; Li, L.; Wu, B.; Deng, C.; O’SHea, R.; Sun, Y.; Murphy, J.D. Assessment of pretreatment and digestion temperature on anaerobic digestion of whiskey byproducts and microbial taxonomy. Energy Convers. Manag. 2021, 243, 114331. [Google Scholar] [CrossRef]
  20. Paillet, F.; Crestey, E.; Gaval, G.; Haddad, M.; Lebars, F.; Nicolitch, O.; Camacho, P. Utilization of dissolved CO2 to control methane and acetate production in methanation reactor. Bioresour. Technol. 2025, 416, 131722. [Google Scholar] [CrossRef]
  21. Jetten, M.S.M.; Stams, A.J.M.; Zehnder, A.J.B. Methanogenesis from acetate: A comparison of the acetate metabolism in Methanothrix soehngenii and Methanosarcina spp. FEMS Microbiol. Lett. 1992, 88, 181–198. [Google Scholar] [CrossRef]
  22. Chang, H.; Du, B.; He, K.; Yin, Q.; Wu, G. Mechanistic understanding of acclimation and energy metabolism of acetoclastic methanogens under different substrate to microorganism ratios. Environ. Res. 2024, 252, 118911. [Google Scholar] [CrossRef] [PubMed]
  23. Wang, S.; Sun, A.; Yang, S.; Ni, R.; Lin, X.; Shu, W.; Price, G.; Song, L. Dominance of acetoclastic methanogenesis in municipal solid waste (MSW) decomposition despite high variability in microbial community composition: Insights form natural stable carbon isotope and metagenomic analyses. Energy Environ. Sustain. 2025, 1, 100018. [Google Scholar] [CrossRef]
  24. Abu Hanifa Jannat, M.; Hyeok Park, S.; Chairattanawat, C.; Yulisa, A.; Hwang, S. Effect of different microbial seeds on batch anaerobic digestion of fish waste. Bioresour. Technol. 2022, 349, 126834. [Google Scholar] [CrossRef]
  25. Gómez-Quiroga, X.; Aboudi, K.; Álvarez-Gallego, C.J.; Romero-García, L.I. Successful and stable operation of anaerobic thermophilic co-digestion of sun-dried sugar beet pulp and cow manure under short hydraulic retention time. Chemosphere 2022, 293, 133484. [Google Scholar] [CrossRef]
  26. APHA-AWWA-WEF. Standard Methods for the Examination of Water and Wastewater, 21st ed.; American Public Health Association: Washinton, DC, USA, 2005. [Google Scholar]
  27. Yu, Y.; Lee, C.; Kim, J.; Hwang, S. Group-specific primer and probe sets to detect methanogenic communities using quantitative real-time polymerase chain reaction. Biotechnol. Bioeng. 2005, 89, 670–679. [Google Scholar] [CrossRef]
  28. Lee, J.; Kim, E.; Han, G.; Tongco, J.V.; Shin, S.G.; Hwang, S. Microbial communities underpinning mesophilic anaerobic digesters treating food wastewater or sewage sludge: A full-scale study. Bioresour. Technol. 2018, 259, 388–397. [Google Scholar] [CrossRef]
  29. Kim, E.; Shin, S.G.; Jannat, M.A.H.; Tongco, J.V.; Hwang, S. Use of food waste-recycling wastewater as an alternative carbon source for denitrification process: A full-scale study. Bioresour. Technol. 2017, 245, 1016–1021. [Google Scholar] [CrossRef]
  30. Lee, J.; Koo, T.; Yulisa, A.; Hwang, S. Magnetite as an enhancer in methanogenic degradation of volatile fatty acids under ammonia-stressed condition. J. Environ. Manag. 2019, 241, 418–426. [Google Scholar] [CrossRef]
  31. Roopnarain, A.; Nkuna, R.; Ndaba, B.; Adeleke, R. New insights into the metagenomic link between pre-treatment method, addition of an inoculum and biomethane yield during anaerobic digestion of water hyacinth (Eichhornia crassipes). J. Chem. Technol. Biotechnol. 2019, 94, 3217–3226. [Google Scholar] [CrossRef]
  32. Hoffmann, R.A.; Garcia, M.L.; Veskivar, M.; Karim, K.; Al-Dahhan, M.H.; Angenent, L.T. Effect of Shear on Performance and Microbial Ecology of Continuously Stirred Anaerobic Digesters Treating Animal Manure. Biotechnol. Bioeng. 2008, 100, 38–48. [Google Scholar] [CrossRef] [PubMed]
  33. Goberna, M.; Gadermaier, M.; García, C.; Wett, B.; Insam, H. Adaptation of Methanogenic Communities to the Cofermentation of Cattle Excreta and Olive Mill Wastes at 37 °C and 55 °C. Appl. Environ. Microbiol. 2010, 76, 6564. [Google Scholar] [CrossRef] [PubMed]
  34. Bi, S.; Wang, C.; Wang, H.; Du, Y.; Yu, X.; Wang, Y. Comparison of mesophilic and thermophilic anaerobic digestion of food waste: Focusing on methanogenic performance and pathogens removal. Renew. Energy 2024, 233, 121184. [Google Scholar] [CrossRef]
  35. Stefanov, B.I.; Tzanova, A.I. Influence of Dairy Cattle Diet on Manure’s Methanogenic Potential for Biogas Generation. In Proceedings of the 16th Electrical Engineering Faculty Conference (BulEF 2024), Varna, Bulgaria, 19–22 September 2024; Institute of Electrical and Electronics Engineers Inc.: Varna, Bulgaria, 2024. [Google Scholar]
  36. Palacios, P.A.; Sieborg, M.U.; Kuipers, S.B.; Fruergaard, S.; Kofoed, M.V. Temperature tactics: Targeting acetate or methane production in autotrophic H2/CO2 conversion with mixed cultures. Biochem. Eng. J. 2025, 214, 109574. [Google Scholar] [CrossRef]
  37. Battumur, U.; Yoon, Y.; Bae, G.S.; Kim, C.H. Isolation and characterization of new Methanosarcina mazei strains KOR-3, -4, -5, and -6 from an anaerobic digester using pig slurry. Asian-Australas. J. Anim. Sci. 2017, 30, 1198–1205. [Google Scholar] [CrossRef]
  38. He, P.; Duan, H.; Han, W.; Liu, Y.; Shao, L.; Lü, F. Responses of Methanosarcina barkeri to acetate stress. Biotechnol. Biofuels 2019, 12, 1–14. [Google Scholar] [CrossRef]
  39. Hmissi, M.; Harmand, J.; Alcaraz-Gonzalez, V.; Shayeb, H. Evaluation of alkalinity spatial distribution in an up-flow fixed bed anaerobic digester. Water Sci. Technol. 2018, 77, 948–959. [Google Scholar] [CrossRef]
  40. Brown, M.R.; Hands, C.L.; Coello-Garcia, T.; Sani, B.; Ott, A.; Smith, S.; Davenport, R. A flow cytometry method for bacterial quantification and biomass estimates in activated sludge. J. Microbiol. Methods 2019, 160, 73–83. [Google Scholar] [CrossRef]
  41. Hwang, S.; Hansen, C.L. Evaluating a correlation between volatile suspended solid and adenosine 5’-triphosphate levels in anaerobic treatment of high organic suspended solids wastewater. Bioresour. Technol. 1998, 63, 243–250. [Google Scholar] [CrossRef]
  42. Tongco, J.V.; Kim, S.; Oh, B.; Heo, S.-Y.; Lee, J.; Hwang, S. Enhancement of Hydrolysis and Biogas Production of Primary Sludge by Use of Mixtures of Protease and Lipase. Biotechnol. Bioprocess Eng. 2020, 25, 132–140. [Google Scholar] [CrossRef]
  43. Shin, S.G.; Park, S.H.; Hwang, S. Substrate Characteristics Fluctuations in Full-Scale Anaerobic Digesters Treating Food Waste at Marginal Organic Loading Rates: A Case Study. Energies 2022, 15, 3471. [Google Scholar] [CrossRef]
  44. Kim, S.I.; Aghasa, A.; Choi, S.; Hong, S.; Park, T.; Hwang, S. Variations in Lipid Accumulation and Methanogenic Predominance in Full-Scale Anerobic Digestors Treating Food Waste Leachate. Waste Biomass Valorization 2023, 14, 3223–3234. [Google Scholar] [CrossRef]
  45. Park, S.; Jannat, M.A.H.; Hwang, S. Annual Physicochemical Characteristics and Biogas Potential of Food Waste from a Coastal City in Korea. J. Korea Soc. Waste Manag. 2022, 39, 267–279. [Google Scholar] [CrossRef]
  46. Jiang, J.; Gong, C.; Wang, J.; Tian, S.; Zhang, Y. Effects of ultrasound pre-treatment on the amount of dissolved organic matter extracted from food waste. Bioresour. Technol. 2014, 155, 266–271. [Google Scholar] [CrossRef]
  47. Lee, J.; Shin, S.G.; Han, G.; Koo, T.; Hwang, S. Bacteria and archaea communities in full-scale thermophilic and mesophilic anaerobic digesters treating food wastewater: Key process parameters and microbial indicators of process instability. Bioresour. Technol. 2017, 245, 689–697. [Google Scholar] [CrossRef]
  48. Li, X.X.; Mbadinga, S.M.; Liu, J.F.; Zhou, L.; Yang, S.-Z.; Gu, J.-D.; Mu, B.-Z. Microbiota and their affiliation with physiochemical characteristics of different subsurface petroleum reservoirs. Int. Biodeterior. Biodegrad. 2017, 120, 170–185. [Google Scholar] [CrossRef]
  49. Adam, P.S.; Borrel, G.; Gribaldo, S. Evolutionary history of carbon monoxide dehydrogenase/acetyl-CoA synthase, one of the oldest enzymatic complexes. Proc. Natl. Acad. Sci. USA 2018, 115, E1166–E1173. [Google Scholar] [CrossRef]
  50. Prakash, D.; Chauhan, S.S.; Ferry, J.G. Life on the thermodynamic edge: Respiratory growth of an acetotrophic methanogen. Sci. Adv. 2019, 5, 9059–9080. [Google Scholar] [CrossRef]
  51. Ferry, J.G. Methanosarcina acetivorans: A Model for Mechanistic Understanding of Aceticlastic and Reverse Methanogenesis. Front. Microbiol. 2020, 11, 545389. [Google Scholar] [CrossRef]
  52. Botello Suárez, W.A.; da Silva Vantini, J.; Duda, R.M.; Giachetto, P.F.; Cintra, L.C.; Ferro, M.I.T.; de Oliveira, R.A. Predominance of syntrophic bacteria, Methanosaeta and Methanoculleus in a two-stage up-flow anaerobic sludge blanket reactor treating coffee processing wastewater at high organic loading rate. Bioresour. Technol. 2018, 268, 158–168. [Google Scholar] [CrossRef]
  53. De Vrieze, J.; Pinto, A.J.; Sloan, W.T.; Ijaz, U.Z. The active microbial community more accurately reflects the anaerobic digestion process: 16S rRNA (gene) sequencing as a predictive tool. Microbiome 2018, 6, 63. [Google Scholar] [CrossRef] [PubMed]
  54. Smith, K.S.; Ingram-Smith, C. Methanosaeta, the forgotten methanogen? Trends Microbiol. 2007, 15, 150–155. [Google Scholar] [CrossRef] [PubMed]
  55. Conklin, A.; Stensel, H.D.; Ferguson, J. Growth Kinetics and Competition Between Methanosarcina and Methanosaeta in Mesophilic Anaerobic Digestion. Water Environ. Res. 2006, 78, 486–496. [Google Scholar] [CrossRef]
  56. Berger, S.; Welte, C.; Deppenmeier, U. Acetate Activation in Methanosaeta thermophila: Characterization of the Key Enzymes Pyrophosphatase and Acetyl-CoA Synthetase. Archaea 2012, 2012, 315153. [Google Scholar] [CrossRef]
  57. Wang, M.; Tomb, J.F.; Ferry, J.G. Electron transport in acetate-grown Methanosarcina acetivorans. BMC Microbiol. 2011, 11, 1–10. [Google Scholar] [CrossRef]
  58. Rohlin, L.; Gunsalus, R.P. Carbon-dependent control of electron transfer and central carbon pathway genes for methane biosynthesis in the Archaean, Methanosarcina acetivorans strain C2A. BMC Microbiol. 2010, 10, 1–15. [Google Scholar] [CrossRef]
  59. Cho, S.K.; Im, W.T.; Kim, D.H.; Kim, M.-H.; Shin, H.-S.; Oh, S.-E. Dry anaerobic digestion of food waste under mesophilic conditions: Performance and methanogenic community analysis. Bioresour. Technol. 2013, 131, 210–217. [Google Scholar] [CrossRef]
  60. Krakat, N.; Schmidt, S.; Scherer, P. Potential impact of process parameters upon the bacterial diversity in the mesophilic anaerobic digestion of beet silage. Bioresour. Technol. 2011, 102, 5692–5701. [Google Scholar] [CrossRef]
  61. Mccune, B. Influence of noisy environmental data on canonical correspondence analysis. Ecology 1997, 78, 2617–2623. [Google Scholar] [CrossRef]
Figure 1. (a) Photograph and (b) schematic diagram of the horizontal anaerobic reactors (HARs).
Energies 18 03120 g001
Figure 2. Monitoring the (a) pH and alkalinity and (b) residual effluent VSS concentration in the horizontal anaerobic reactors (HARs). Stability in the VSS concentrations can be observed at around t = 40 d.
Energies 18 03120 g002
Figure 3. (a) Randomized acetate feeding concentrations within a certain magnitude of variation (85 g COD/L ± 20%) and subsequent residual acetate concentration in the effluent. The plot was categorized according to the variance in effluent acetate concentration and divided into three phases: 1 (var: 3–6), 2 (var: 1–2.9), and 3 (var: 0–0.99). (b) A converging pattern emerged (decrease in variance) as time elapsed due to the increasing efficiency of the methanogens in utilizing the acetate as substrate. Calculated daily acetate removal efficiency based on daily residual acetate concentrations in the effluent. A sharp increase in efficiency can be observed at around t = 40 d, reaching around 90% afterward.
Energies 18 03120 g003
Figure 4. (a) Daily biogas production (L/L/d) corresponding to randomized acetate concentrations fed to the reactors. (b) Daily methane concentration (%) with respect to biogas production (L/L/d). A sharp increase was observed for both reactors for the first five days of operation (From 0 to around 50%). Peak average methane concentration was observed at around 60% after t = 40 d.
Energies 18 03120 g004
Figure 5. (a) Bacterial and (b) archaeal populations at the genus level of reactors (R1 and R2) at different time points, as identified by Illumina® iSeqTM 100 next-generation sequencing. Populations with relative abundance < 1% were categorized as part of the minor group.
Energies 18 03120 g005aEnergies 18 03120 g005b
Figure 6. (a) Non-metric multidimensional scaling (NMDS) ordination plot and (b) cluster dendrogram (UPGMA) of the archaeal genus of both reactors (R1—black, R2—red) at different time points. The NMDS plot and cluster analysis dendrogram were based on the Bray–Curtis distance of relative abundance of the archaeal genus in the reactors.
Energies 18 03120 g006
Figure 7. Canonical correspondence analysis (CCA) ordination diagram showing the correlations between the archaeal genus relative abundance, reactors (R1—black, R2—red) at different periods, and reactor performance variables (alkalinity, COD, sCOD, VSS, residual acetate, and methane concentration – blue). All process variables applied in the analysis were significant (p < 0.1), and the model was statistically significant (p < 0.05). Significance was tested using a permutation test (n = 999).
Energies 18 03120 g007
Table 1. Physical and chemical characteristics of seed inoculum.
ParameterUnitValue *
pH-8.14
CODg CODcr/L19.6 ± 0.4
sCODg/L2.6 ± 0.0
TSg/L28.0 ± 0.4
VSg/L12.6 ± 0.1
VS/TS%45.1
TSSg/L20.3 ± 0.7
VSSg/L12.3 ± 0.4
VFA + Ethanolg/L0.07 ± 0.00
* Average ± standard deviation (n = 2).
Disclaimer/Publisher’s Note: The statements, opinions and data contained in all publications are solely those of the individual author(s) and contributor(s) and not of MDPI and/or the editor(s). MDPI and/or the editor(s) disclaim responsibility for any injury to people or property resulting from any ideas, methods, instructions or products referred to in the content.

