Abstract
Wells turbines are one of the most attractive types of rotating machines installed in Oscillating Water Column (OWC) devices, owing to their simplicity of construction and reliability. Their unconventional design, with symmetrical blades staggered orthogonally with respect to the axis of rotation, simultaneously represents one of the main strengths and weaknesses of the turbine, and makes their aerodynamic behavior complex and significantly different from that of other types of machines. The importance of numerical analyses in explaining the physics behind the Wells rotor operation has significantly grown in recent years as proved by the vast available literature. Nevertheless, experimental analyses still hold an important role in modern turbomachinery design, both for the validation of Computational Fluid Dynamics (CFD) models and for verifying the improvements suggested by optimized design in a realistic environment. This review aims to collect and classify published experimental studies on Wells turbines, distinguishing among the types of experimental setups, methodologies adopted, and measurements performed, to identify the current research gaps and guide future experimental research.
1. Introduction
Ocean energy is expected to play an important role in decarbonizing the electricity generation sector [1], given its widespread availability and high energetic content coupled with a better predictability with respect to more commonly exploited renewable energy sources such as solar and wind. These considerations have attracted the attention not only of researchers but also of government grants and private investors [2].
The researchers’ attention for wave energy has produced a number of different Wave Energy Converters (WECs), each exploiting a specific mean of interaction with the waves, hence being more or less suitable for different sites and power densities. Of particular interest are the systems based on the Oscillating Water Column (OWC) principle, given their reliability and applicability to a variety of locations (on- and off-shore) and collector platforms [3]. A WEC based on the OWC principle consists of a chamber (a caisson made of concrete [4] or even a natural cave [5]) open at its bottom and partially submerged under the free water surface as schematically represented in Figure 1. The external sea wave motion is converted into a reciprocating motion of a water column inside the air chamber, which, in turn, induces a similar movement of the air in the upper part of the chamber, where another opening is present. A Power Take-Off (PTO), generally an air turbine, is finally necessary to convert the pneumatic energy of the bidirectional airflow into mechanical energy available for electricity production, by means of a generator.
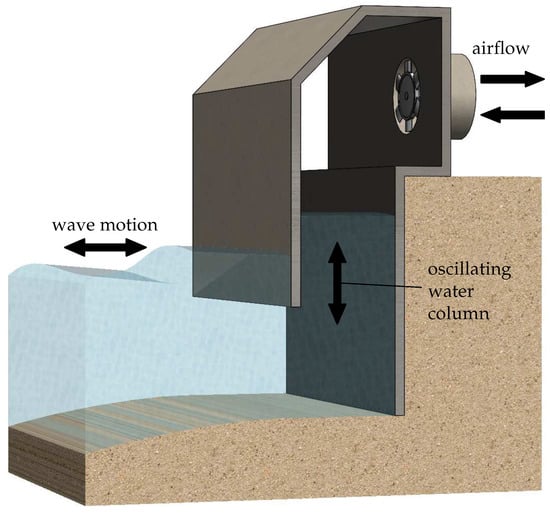
Figure 1.
Working principle of an OWC device.
The peculiarity of the airflow established inside the OWC, i.e., its bidirectional nature, represents the key factor for the selection of an appropriate PTO. Traditional impulse turbines [6] require rectifying systems to be coupled to OWC systems, introducing the need for additional parts. A more convenient choice of PTO is usually represented by self-rectifying turbines.
The Wells turbine, patented in the 1970s by Dr. A. A. Wells [7], is the most studied self-rectifying turbine for wave energy plants since its invention. Its rotor consists of symmetrical blades, originally made of NACA00xx profiles, staggered at 90 degrees with respect to the axis of rotation as sketched in Figure 2.
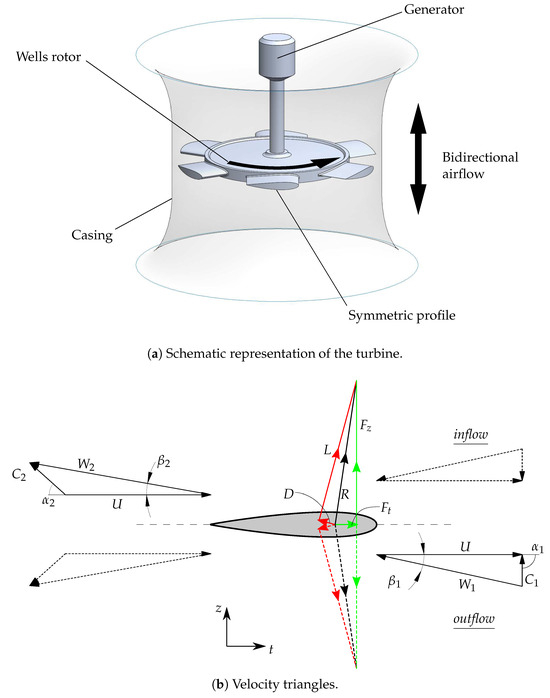
Figure 2.
Representation of a Wells turbine and its aerodynamic behavior.
This simple design results in the aerodynamic forces represented in Figure 2: the tangential force, acting in the direction of rotation, is positive both during the inflow (air is flowing from the atmosphere into the OWC chamber) and the outflow phases (air is pushed out from the chamber), with the exception of very low incidence angle conditions that happen near the flow inversion. The main advantage lies in this simple design that makes the turbine easy to manufacture and reliable. In the last few decades, Wells turbines have been installed in a number of OWC plants for wave energy conversion. These are summarized in Table 1, where the main characteristics of the installed turbines are also reported.
Nevertheless, this simple design comes with some very relevant drawbacks, consisting in a limited operating range due to the aerodynamic stall that occurs at high incidence angles, and a moderate efficiency.
Despite being almost 50 years old, the Wells turbine cannot be considered a consolidated machine, as its aerodynamic behavior, its performance variation as a function of the most relevant geometric parameters, and finally its design procedure have not been completely investigated. Simplified numerical methods can help to understand the rotor behavior: for instance, approaches based on potential flow theory [8,9] can be adopted for an initial selection of the main rotor geometric parameters. Several researchers made use of more sophisticated numerical approaches, often based on Computational Fluid Dynamics (CFD) simulations, to predict the performance of the Wells turbine [10,11,12], also analyzing the features of the local flow near the rotor [13,14,15] and, ultimately, to guide performance optimization processes [16,17,18,19].

Table 1.
Wave energy plants equipped with Wells turbines.
Table 1.
Wave energy plants equipped with Wells turbines.
| Project Name, Site of Installation | Year | Turbine Configuration | Power Output (No. of Turbines × Power) |
|---|---|---|---|
| Sakata Port, Japan [20] | 1989 | Monoplane with guide vanes | 60 kW ( kW) |
| Islay, Scotland, UK [21] | 1991 | Biplane | 70 kW ( kW) |
| Vizhinjam OWC [22] Trivandrum, India | 1991 | Monoplane | 150 kW ( kW) |
| OSPREY [23] Dounreay, Scotland, UK | 1995 | Contra-rotating | 2000 kW ( kW) |
| Mighty Whale [24,25] Gokasho Bay Nansei, Japan | 1998 | Monoplane with guide vanes | ≈110 kW (≈3 kW) |
| Pico power plant [26] Azores, Portugal | 1999 | Monoplane with guide vanes | 400 kW ( kW) |
| LIMPET [4] Islay, Scotland, UK | 1999 | Contra-rotating | 500 kW ( kW) |
| Mutriku Wave Power plant [27] Mutriku, Basque Country, Spain | 2011 | Biplane Contra-rotating | 296 kW ( kW) |
| REWEC3 [28] Port of Civitavecchia, Italy | 2016 | Monoplane | 2.2–2.5 MW |
For a correct description of any fluid dynamic phenomenon, numerical results should be validated against experimental data [29,30]. For the particular case of the Wells turbine, a total number of more than 100 published experimental works can be found in the literature, evenly distributed in time since its invention. Figure 3 reports a timeline of published papers, grouped in periods of 5 years, since the early 1980s until today. This paper aims to provide a systematic classification of all the experimental works on Wells turbines available in literature, focusing on the experimental setup used to test the Wells rotor and on the level of detail of the measurements and analyses conducted, with particular attention given to the final goal of the experimental investigations. Other reviews on Wells turbines can be found in the literature. Raghunathan [8] published complete and extensive reviews in 1995, reporting on the operating principles, expected and measured performance, and alternative Wells turbine configurations, but this work is now dated, given the last 30 years of research. The more recent review written by Shehata et al. [31], collecting a large number (230) of papers, does not focus specifically on experimental works, but it is more centered on numerical approaches, in particular CFD, for analyzing Wells turbine performance.
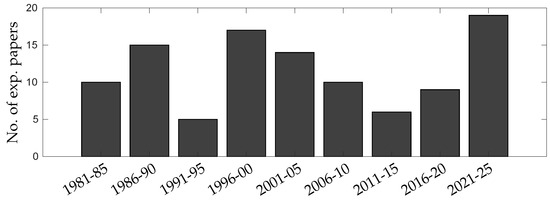
Figure 3.
Number of published experimental works on Wells turbines during years.
In the authors’ opinion, the present literature analysis can support researchers interested in existing experimental works on Wells turbines, as it puts together in one single document useful information on the rig used for turbine testing and on the aspects of Wells turbine design and operation investigated so far. It also provides a summary of experimental benchmarks available for validation of future numerical analyses.
The work is organized as follows: Section 2 presents a classification of the experimental rigs built for testing Wells turbines based on the type of flow, i.e., unidirectional or bidirectional. Section 3 presents a classification of the analyses conducted based on whether they aimed at providing only global performance measures or detailed flow analyses. Section 4 presents a summary of the effects of the main geometric parameters and control methods on the performance measures, derived from the available literature. Finally, Section 5 presents some closing remarks together with a few guidelines for future experimental analyses.
2. Experimental Rigs
Different test rigs have been designed and used with the intent of evaluating Wells turbine performance. Linear cascades, traditionally used to investigate the two-dimensional behavior of different profiles in a cascade arrangement [32], have never been used, to the authors’ knowledge, for the characterization of the Wells rotor due to its uncommon blade stagger angle. This peculiar rotor design, together with the relatively small flow angles experienced by symmetrical blade profiles before stall [33], would have resulted in highly skewed linear cascades with challenges that overcome the simplifications provided by this type of experimental test rig.
For this reason, Wells turbine test rigs have always employed the full rotor prototype, both in its traditional and modified configurations (biplane, contra-rotating, with guide vanes). Nevertheless, considering that Wells turbines find their only application in OWC systems, a first classification of test rigs can be made with respect to the possibility of reproducing the bidirectional airflow present in the real system. Unidirectional and bidirectional test rigs are discussed in the following sections.
However, it is important to highlight how, given the low frequencies of the airflow oscillations in an OWC device, no dynamic effects can be observed in the turbine performance as widely discussed in the reference literature on oscillating airfoils [34,35,36] and Wells turbines [37,38,39].
2.1. Unidirectional (Stationary) Flow Rigs
The first experimental characterizations of Wells turbines were conducted in the UK [40,41] using traditional unidirectional-flow test benches. The setup housed at Queen’s University of Belfast, the UK [37], is schematized in Figure 4.
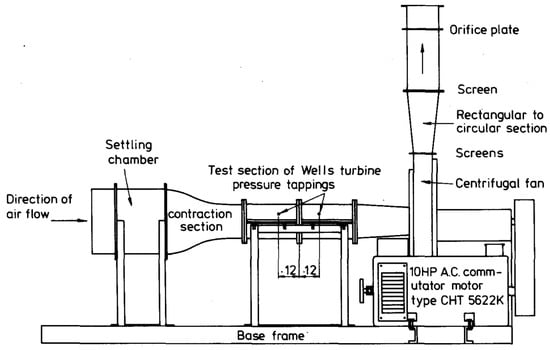
Figure 4.
Unidirectional test rig at Queen’s University of Belfast (UK). Reproduced with permission from [37], Cambridge University Press, 2016.
The rig consisted of a suction wind tunnel driven by a centrifugal fan that produced the airflow and provided the pneumatic power for the turbine under test. A calibrated orifice plate was used to measure the flow rate, in accordance with fan testing standards [42], while pressure measurements were used to evaluate the power available to the turbine. Torque and rotational speed measurements allowed to evaluate the output power from the turbine. Only a few years later, Gato et al. [43,44] installed an analogous setup at the Instituto Superior Técnico of Lisbon, Portugal [43,44], initially using an axial-flow and later a centrifugal fan to reproduce the airflow, allowing the installation of turbines with a three times larger diameter (Figure 5).
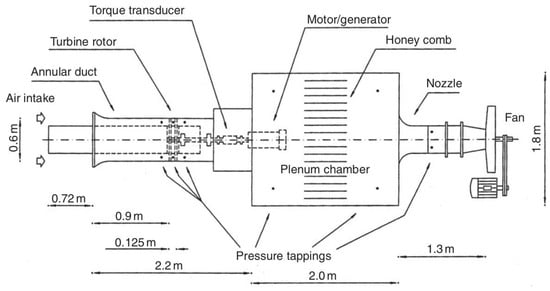
Figure 5.
Unidirectional test rig at Insituto Superior Técnico (PT). Reproduced with permission from [9], Elsevier, 2012.
The advantage of these unidirectional rigs consists in the possibility to perform long experiments under stationary conditions, simplifying the use of aerodynamic probes, such as pressure ones [43] and Hot-Wire Anemometers (HWAs) [45], to perform detailed local flow measurements. As a drawback, characterizing turbomachines performance under stationary operating conditions, i.e., fixing the flow rate delivered by the fan, could result in longer acquisition times given the necessity to analyze a large number of points to describe the performance curve of the machine. In addition, the stall point is not easily identifiable under stationary condition, given the intrinsically unsteady nature of this phenomenon.
Other unidirectional test rigs are the ones built at the University of Tokyo, Japan [46], at the Politecnico of Bari, Italy [47], at the Helwan University at Cairo, Egypt [48], and the Institute of Technology at Madras, India [49]. A list of available experimental rigs, together with a list of the type of turbines tested and their sizes, is given in Table 2.

Table 2.
Experimental rigs for testing Wells turbines.
Table 2.
Experimental rigs for testing Wells turbines.
| Experimental Setup | Flow Type/Conditions | Tested Types of Tested Wells Turbines | Diameter of the Test Section [mm] |
|---|---|---|---|
| Queen’s University, Belfast (UK) | Unidirectional/Stationary | Monoplane [40,41], biplane [50] | 200 |
| Bidirectional/Non-stationary | Monoplane [37] | 200 | |
| University of Limerick, Limerick (IE) | Bidirectional/Stationary, non-stationary | Monoplane [51] | 600 |
| University of Tokyo, Tokyo (JP) | Unidirectional/Stationary | Monoplane [46] | 304 |
| Istituto Superior écnico, Lisbon (PT) | Unidirectional/Stationary | Monoplane [43], biplane [52], contra-rotating [53], with guide vanes [54] | 593 |
| Saga University, Saga (JP) | Bidirectional/Stationary, non-stationary | Monoplane [55], with guide vanes [55] | 300 |
| University of Cagliari, Cagliari (IT) | Bidirectional/Quasi-stationary, non-stationary | Monoplane [56] | 252 |
| Politecnico di Bari University, Bari (IT) | Unidirectional/Stationary, non-stationary | Monoplane [47] | 310 |
| Helwan University, Cairo (EG) | Unidirectional/Stationary | Monoplane [48] | 500 |
| University of Siegen, Siegen (DE) | Unidirectional/Stationary | Monoplane [57] | 400 |
| Bidirectional/Stationary | Monoplane [58] | ||
| Indian Institue of Technology, Madras (IN) | Unidirectional/Stationary | Monoplane with guide vanes [49] | 265 |
| Indian Institue of Technology, Madras (IN) | Bidirectional/Non-stationary | Monoplane with guide vanes [59], biplane [60] | 196 |
2.2. Bidirectional (Non-Stationary) Flow Rigs
With the aim of characterizing the behavior of Wells turbines under conditions as similar as possible to the ones present in an OWC, bidirectional test benches have been designed and built since the early 1980s. These rigs, often referred to as oscillating airflow tests [37] or OWC simulators [61], are typically equipped with a piston running inside a cylindrical chamber, driven by an electric motor [55], an hydraulic actuator [37,62] or a rod and crank mechanism [60], reproducing the water surface motion inside an OWC chamber. Figure 6 shows two schematics for rig configurations of this type: the OWC simulator of the University of Cagliari, Italy, and the reversing airflow test rig of Saga University, Japan.
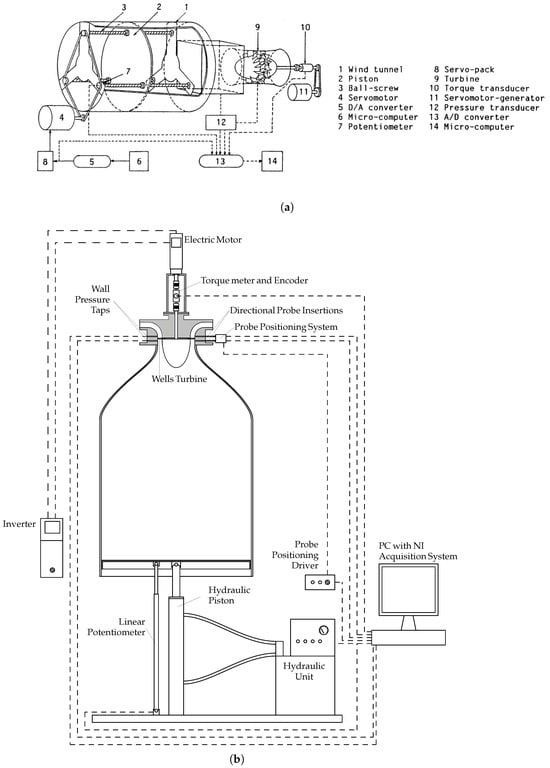
Figure 6.
Oscillating flow test rigs. (a) Oscillating flow rig at Saga University (JP) [55]. Adapted with permission from [9], Elsevier, 2012; (b) OWC simulator with Wells turbine at University of Cagliari (IT) [62].
A similar, recently built test rig is housed at the Indian Institute of Technology of Madras (India) [60], which employs a rod and crank mechanism, driven by a motor, to reproduce the alternate motion of a piston inside a chamber. Both the piston period and stroke length can be varied to simulate different wave motions. The peculiar configuration of these setups does not allow to adopt the defined standards for the measurement of the flow rate (e.g., calibrated orifice plates, conical inlets, and venturi nozzles). The flow rate is therefore calculated based on the piston motion, even though this approach introduces the need for a phase-lag correction to account for the capacitive effect of the chamber volume [39,63]. In addition, the non-stationary flow typically produced within this type of setup complicates detailed flow measurements. As a partial solution, stationary conditions can be produced for a limited time span, fixing a constant piston speed as in [64,65].
An ingenious configuration used to perform bidirectional flow experiments on Wells turbines is the one housed at the University of Limerick, Ireland [51]. It makes use of a directional valve in a traditional suction tunnel as schematized in Figure 7. A similar setup is installed at the University of Siegen, Germany [58]. The most relevant advantage of this particular configuration consists in the possibility to test Wells turbines using standardized airways under reversible flow using the unidirectional flow conditions established with a fan. The price of this configuration is a more complex configuration that typically results in less compact rigs than traditional oscillating ones that make use of pistons.
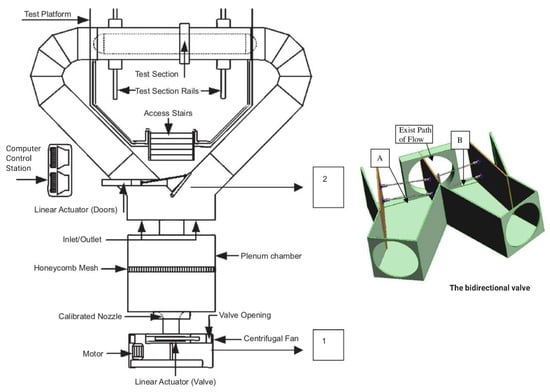
Figure 7.
Bidirectional test rig at University of Limerick (IE) [51]. Adapted with permission from [9], Elsevier, 2012.
As seen previously, non-stationary flow conditions are typically reproduced within oscillating flow facilities, given their particular configuration [37]. However, [47] successfully used the unidirectional test rig installed at Politecnico di Bari University [47] to reproduce non-stationary flow conditions, acting on a vector control drive that regulates the suction blower rotational speed, and therefore the flow rate through the tested Wells rotor [66]. With this approach, they were able to reproduce an oscillating flow, although always in one direction.
Table 2 lists the most used experimental setups for the characterization of Wells turbines, including some useful information on their operation, particularly with respect to the flow conditions reproduced (i.e., stationary or non-stationary), the types of turbines tested, and their sizes.
3. Experimental Investigations: Global and Local Performance Analyses
Experimental analyses in turbomachinery can be classified as “global” or “local”. The former type of investigation provides exclusively information related to the performance of the machine, often presented as performance characteristic curves. The latter type provides local analyses of the flow throughout more detailed investigations, using pneumatic multi-hole pressure probes, HWAs, and non-intrusive techniques such as Laser Doppler Anemometry (LDA) and Particle Image Velocimetry (PIV).
3.1. Global Performance Analyses
Most of the experimental investigations published since the early 1980s concern the characterization of Wells turbines with different design configurations from a global point view. The term “global” refers to the overall performance of the machine described in terms of the non-dimensional performance parameters typically used for turbomachinery characterization [67]. These are as follows:
- The flow coefficient
- The torque coefficient (or the power coefficient)
- The pressure drop coefficient (or, in general, the head coefficient)
- The efficiency
The above parameters are written in a general form, given that authors have adopted different (although equivalent for their practical implications) formulations. For example, some researchers defined the pressure coefficient on the static pressure drop, which can be obtained from wall static pressure measurements [56,68], while others used the total pressure drop through the rotor [51,62]. Given that the exhaust kinetic energy from the Wells turbine is entirely lost [69], a more appropriate definition of the pressure coefficient is the one based on the total-to-static pressure drop, used in [37,68]. Different definitions of efficiency have also been used, depending on the quantity considered to be the available energy [37,51,68,69]. Regardless of the specific definition, global performance parameters in Equations (1)–(4) do not require any local flow measurement but only the flow rate Q (or the axial flow speed at the inlet, ), the output torque T, the turbine rotational speed , and the pressure drop through the rotor.
Several authors adopted global performance characterizations to study the fundamental aspects of Wells turbine operation, e.g., the self-starting behavior [70], or to compare different rotor designs, both in terms of geometric parameters [43,46,71,72,73,74,75,76,77,78,79] and configurations [80,81,82,83]. Wells turbine performance typically shows trends similar to the ones repoorted in Figure 8, which gathers results from both unidirectional [37,80] and bidirectional flow rigs [84].
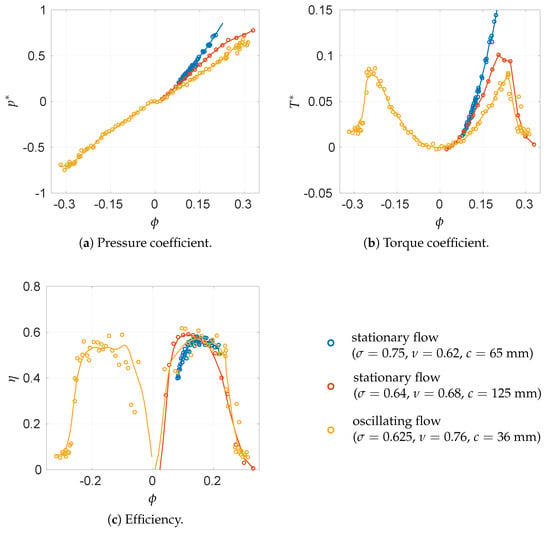
Figure 8.
Typical performance curves for a Wells rotor. stationary flow [37], stationary flow [80] and oscillating flow [84].
The non-dimensional pressure drop shows an almost linear dependence on the flow coefficient as initially observed from experiments in unidirectional flow rigs [37,41,57,80,85] and confirmed under oscillating flow conditions [84], while the torque coefficient follows a quadratic law as a function of until the stall occurs, identified by the steep reduction in both and [80,84]. These behaviors are in agreement with the predictions from basic fluid mechanics approaches [8,9], such as the potential flow theory experiments under oscillating flow conditions [56,61,85], providing an important confirmation of these results, except near the flow inversion. In particular, close to the inversion, i.e., where the flow coefficient attains values close to zero, the curve deviates from the linear trend, due to the very low incidence that the blades operate at and the interaction with the wakes coming from the neighboring blades. Based on Equation (4), an almost constant value of efficiency is expected at every operating condition, except near the inversions, where non-linearities produce very poor values of , and for values of larger than the stall limit. This is essentially confirmed by the experimental analyses shown in Figure 8c, with minor deviations from the expected theoretical trends. Torque coefficient and efficiency suddenly drop after the occurrence of stall due to the flow separation from the blade profile, while only a minor deviation in the slope can be observed for the behavior in Figure 8a for the same value of the flow coefficient, more visible in stationary flow experiments [80].
An important parameter that can be derived by these typical performance representations is the damping coefficient of the turbine, i.e., the pressure drop through the rotor for a given flow rate [86]. Based on the non-dimensional performance definitions of Equations (1) and (3), a non-dimensional damping coefficient K can be defined as the slope of the curve -. This parameter is of paramount importance for the correct coupling of a Wells turbine with an OWC chamber, and its variation with rotor geometric parameters should be known for appropriately designing and selecting Wells turbines [43,79].
Less frequently, the torque coefficient and the efficiency are reported as a function of the non-dimensional pressure drop [58,87], considering that in an OWC installation, the turbine is driven by the pneumatic energy imposed by the wave collector to the rotor.
The expected uncertainties for global parameters vary depending on the type of the rig and on the specific characteristics of the rig itself. For unidirectional rigs and tests conducted under stationary flow conditions, the expected uncertainties depend on the instruments used to conduct the experiments [43,44,71,74,83,85], i.e., torque sensors and pressure transducers. Errors on performance parameters can be derived from the sensors’ accuracy specifications by applying the uncertainty propagation method (UPM) [88]. When specified, performance parameters uncertainties are in the order of [89,90,91], although the maximum uncertainties on efficiency calculations are typically slightly larger than the values for other coefficients, given that is evaluated based on , and , as shown in Equation (4). Other authors [57,58,92] reported values of for the efficiency, providing detailed uncertainty analyses.
Oscillating flow rigs introduce the need for additional considerations on performance uncertainties, given that they operate under non-stationary conditions. Since the flow is typically periodic and alternate, performance characteristics can be obtained from the measured quantities only after a phase-locked averaging process [56]. Licheri et al. [79] clarified the effect of the number of piston periods acquired on the phase-locked averaged quantities, suggesting a minimum of 5 periods for an acceptable data reduction. Uncertainties are in the order of – for , – for and and – for . Uncertainties in the order of were declared by Setoguchi et al. [74] for non-stationary measurements, although only minimal information on the averaging process was provided.
3.2. Local Performance Analyses
Limited information on the aerodynamics of the rotor can be drawn from global measurements, and the physics of the flow field near the Wells turbine can be only assumed based on the knowledge of the behavior of similar lifting surfaces. Only a few studies have focused on the “local flow”, i.e., they provided detailed analyses of the flow field inside the turbine using aerodynamic probes, typically multi-hole pressure ones or HWAs. The former are typically used to characterize the mean flow velocity both upstream and downstream of the rotor, typically neglecting the velocity contribution in the radial direction [37,43,46,92] or reconstructing the fully three-dimensional velocity field [56,93]. HWA probes can be important for rotors with relatively high values of the hub-to-tip ratio, where wall proximity effects and leakage flow interaction are expected to affect the flow field distribution. Figure 9 reproduces a representation of the outlet flow in the meridian plane of a Wells turbine [93], where secondary flow structures are observed using a 4-holes aerodynamic pressure probe to reconstruct the mean flow field close to the rotor.
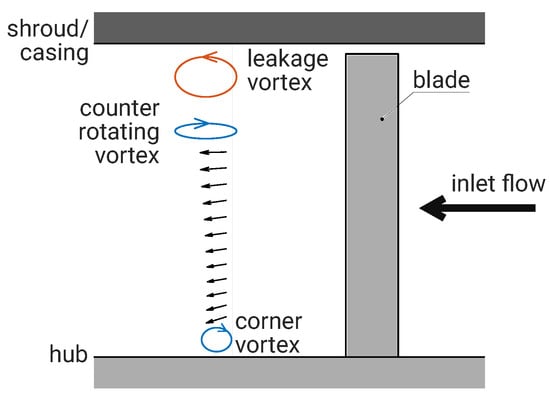
Figure 9.
Flow structures downstream of a Wells rotor in the meridian plane. Adapted with permission from [93], Elsevier, 2024.
HWA probes are characterized by a very high response frequency coupled to a limited intrusiveness [94,95], allowing very detailed measurements, including the turbulence intensity of the inlet flow as in [45,65]. In particular, Raghunathan et al. [45] evaluated the effect of turbulence intensity on the performance of both a monoplane and biplane Wells turbine, under constant flow rate conditions. They observed that increasing the inlet turbulence intensity generally results in a higher turbine efficiency while delaying the occurrence of stall. This is explained considering that Wells turbine prototypes typically operate at relatively low Reynolds’ numbers, which cause a laminar separation bubble to form near the leading edge of the blade, inducing complete separation on the suction surface. Higher inlet turbulence levels may facilitate the laminar bubble reattachment, promoting transition to a turbulent boundary layer. Nevertheless, the gain in efficiency associated to the larger inlet turbulence is small, due to the fact that the blade speed is typically about 3–5 times larger than the inlet absolute velocity that determines the turbulence intensity.
Licheri et al. [65] employed a slanted HWA probe to reconstruct the flow field inside the blade pitch of a Wells rotor, using the multi-rotation technique to evaluate the fully three-dimensional flow field downstream of the rotor. They characterized the flow distortion associated to (a) the constant-chord design of the rotor, (b) the leakage flow through the tip gap, and (c) the obstruction at the blade root. They used this information to locate the least performing regions inside the blade pitch. A representation of the outlet axial velocity component in two adjacent blade vanes for a Wells rotor prototype is shown in Figure 10, where the regions affected by the leakage flow are clearly highlighted at larger radii by low, and even negative, values of , thus altering the flow field distribution.
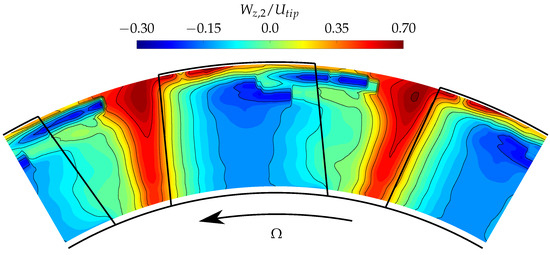
Figure 10.
Map of the outlet axial velocity in two adjacent blade vanes, for a Wells rotor with , , %, , and . Reproduced from [65].
Another interesting local flow analysis, despite being only qualitative, was performed by Suzuki and Arakawa [96] to visualize the flow patterns on the blade surface of differently shaped rotors inside a circulating-water tunnel with the oil-film method.
4. The Effects of Geometric Parameters and Control Methods
With the aim to better understand how the simple design of the Wells turbine impacts on its performance, a survey into the aspects of Wells turbine design and operation investigated in experimental studies is reported in the following paragraphs. Figure 11 highlights the most relevant geometric parameters for a Wells rotor: the tip clearance size t, the tip and hub radii and , respectively, the blade chord c, the blade height h, the number of blades z, the blade sweep angle , and offset g, and the blade profile.
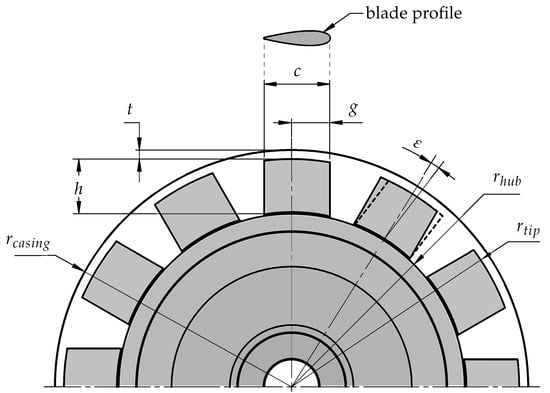
Figure 11.
Schematic view of the Wells rotor dimensions.
Following the standard similarity practices, non-dimensional geometric parameters can be defined and used for the evaluation of their impact on the performance of a rotor:
- The hub-to-tip ratio
- The rotor solidity, which is a measure of the flow obstruction on the annulus area of the rotor, due to the presence of the blades
- The non-dimensional tip gap, with respect to the chord or the blade height
- The blade aspect ratio
- The sweep ratio, or blade offset,
- The blade shape.
All the effects associated to the above geometric parameters have been experimentally investigated since the early 1980s. A review of these experimental results before 1995 was published by Raghunathan [8], clarifying that a complete separation of the effects due to the geometric parameters listed above is not always easy to be obtained, in particular with experimental analyses. Most of the investigations have been focused on the effects of solidity [37,43,46,51,57,64,71,72,74,78] and blade profile [51,64,71,72,73,74,75,76,77,97,98,99,100,101] on global performance, in particular on the rotor efficiency and on the occurrence of stall [8]. In addition, some studies have considered the effects of these geometric parameters on the starting characteristic of the Wells rotor [46,71] (of great importance in years when AC/AC power converters were not used but less important at the time of writing) and on the so-called “hysteretic effect” of turbine performance under unsteady operating conditions [72,74], a phenomenon that was later proved to be caused by the OWC and not by the turbine [63]. Figure 12 shows a classification of the experimental studies on Wells turbines with respect to the most significant aspects analyzed. It highlights how a large number of experimental articles on the geometry effects in monoplane turbines focus on solidity and blade profile. The bin named “others” includes all the remaining geometric effects studied in the last 50 years, such as sweep ratio [64,102], skew (or sweep angle) [91,103,104], blade aspect ratio [72,74,79,105], and other geometry modifications such as end plates [59,106,107], porous fences [108], cut trailing edge [109], and suction slots [110].
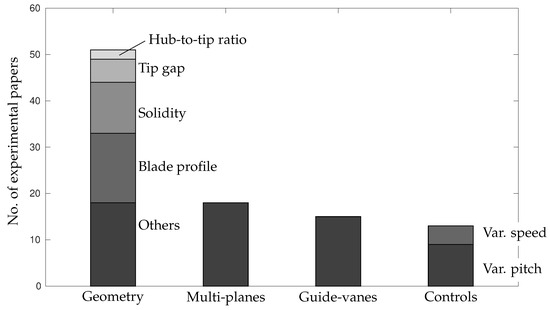
Figure 12.
Classification of experimental works on Wells turbines.
4.1. The Rotor Solidity
The fundamental importance of this parameter in determining the rotor characteristic curves, in particular the damping coefficient, presented in Section 3.1, and the turbine self-starting behavior, justifies the large number of investigations dedicated to this aspect [37,43,46,51,57,64,71,74,78]. Raghunathan and Tan [71] compared different rotor solidities under stationary flow conditions, indicating 0.6 as the optimal value to obtain a reasonable compromise between the starting behavior [111] and global efficiency. Gato and Fãlcao [43] compared the global performance of three rotors with different solidities under stationary flow conditions against the performance predictions obtained with simplified numerical methods (i.e., actuator disk theory), finding a general good agreement between numerical and experimental results. Moreover, they reconstructed the local mean flows along the blade span downstream of each rotor configuration, under the assumption of two-dimensional flow in the axial-tangential surface, i.e., neglecting radial flow components. Apart from the expected discrepancies observed between measured velocities and numerical predictions in the wall regions, they highlighted the effects associated to (a) the leakage flow in the tip region, and (b) the lower solidity at higher radial positions. In particular, see Figure 13, it can be observed that for higher rotor solidities, the axial velocity contribution (non-dimensionalized with respect to the mean flow velocity) along the blade span is even more unbalanced from hub to tip, where it reaches higher values due to the increasingly high blockage at the hub induced by the constant chord design used in traditional monoplane rotors.
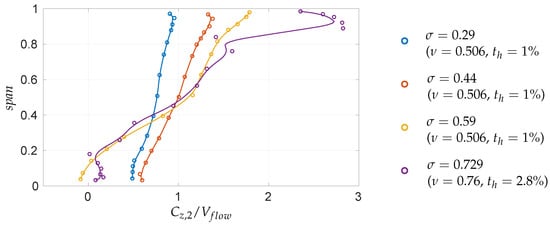
Figure 13.
Radial distribution of the outlet axial velocity component for conventional Wells rotors with different solidities. [43], [43], [43] and [61].
Figure 13 reports, in addition to the measurements from [43], also the traverse measurements made with a similar probe by Licheri et al. [61], for a rotor with a larger solidity, showing an analogous trend, even more exacerbated by the higher solidity that produces a higher hub blockage. Moreover, the effect associated to a larger tip clearance size (% in [43] while % in [61]) appears at larger radial positions, showing like a “jet flow” of higher velocity.
A way to obtain a more uniform axial flow at the turbine outlet consists of using constant solidity rotors as investigated by Suzuki et al. [46]. In this work, the performance of four rotors with different solidities, kept constant (for each machine) along the blade radius, was evaluated both from a global and a local point of view under stationary flow conditions. The authors used a bidimensional pressure probe to reconstruct axial and tangential velocity components downstream of the so-called “fan-shape” (i.e., with a radially increasing blade chord), with the aim of evaluating local efficiencies and aerodynamic coefficients. They found the best efficiency rotor to have a value of solidity of 0.6, while they predicted that a value of 0.8 would be necessary to have a self-starting turbine. A comparison of flow structures between constant-chord and constant-solidity blades was presented by the same authors [96], using the oil-film method to visualize the near-wall flow on the blade surface for different blade configurations. Starzmann and Carolus [112] investigated the impact of the so-called “fan-shaped” blades, i.e., with a positive radial variation in blade chord length, comparing rotors with different values of solidity and hub-to-tip ratios under stationary conditions. They evaluated the effect of design parameters not only with reference to turbines performance but by additionally measuring acoustic emissions, a truly important characteristic for real OWC–Wells turbine installations.
4.2. The Blade Profile
Several authors studied the influence of the blade profile on the aerodynamics of the Wells rotor, mostly from a global point view [51,64,71,72,73,74,75,76,77,97,98,100,101]. With the aim of evaluating the “hysteresis” in performance under oscillating flow conditions, Setoguchi et al. [74] conducted an interesting experimental investigation of the local flow by measuring the pressure distribution along the blade surface at midspan. A slip ring unit, represented in Figure 14, was adopted to connect the rotating pressure taps to the non-rotating pressure transducers. With this arrangement, the authors of [74] reconstructed the pressure distribution on one of the most common blade profiles used in the Wells turbine, i.e., the NACA 0015, at different incidence angles and for rotors with a different number of blades. In the same work [74], the authors compared NACA 00xx series profiles with different thickness ratios, while other authors investigated Wells turbine performance with CA9 and HSIM15 profiles [51,64,100], and modified NACA 0015 and Eppler 472 profiles [77]. As a general result, thicker symmetric profiles have shown better performance together with a more effective starting characteristic [8].
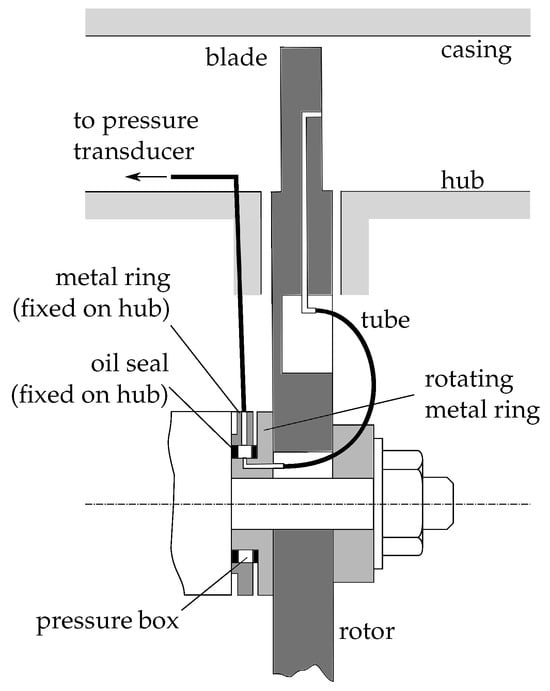
Figure 14.
Pressure measurements on the rotating blade surface of a Wells rotor used by Setoguchi et al. [74].
4.3. The Hub-to-Tip Ratio
The hub-to-tip ratio has a significant effect Wells turbine performance, given its relevant influence on the tip leakage flow and the evolution of secondary flows at the blade root [8,71], both associated with the stall occurrence. In addition, the hub-to-tip ratio plays a role on the self-starting behavior of the turbine, although the value of to obtain this feature depends on the value of the rotor solidity [113]. Nevertheless, these effects have not yet been analyzed with local flow investigations which can better clarify the expected influence of this parameter on the local flow. On the other hand, small size experimental rigs make it difficult to perform similar detailed analyses, and the minimum achievable value of is often limited by the dimension of the measuring section [71,79]. Raghunathan’s considerations on the design of the Wells turbine recommend values of [114], although a more recently experimental and numerical analysis from [78,112] pointed out that sensibly lower values of the hub-to-tip ratio are preferable for aerodynamic and acoustic performance, considering that the self-starting issue has now lost its importance.
4.4. The Tip Clearance Size
Several works have investigated the relevance of the tip gap size on the rotor performance [72,74,77,79,105], all focused on global performance. They observed that increasing the size of the tip clearance, typically reported in non-dimensional form with respect to the blade chord [72,74], determines a wider stable operating range for the turbine, while the cycle-averaged efficiency of the rotor reduces [8]. Torresi et al. [12] provided an explanation of these effects using numerical investigations, showing how a larger tip leakage can energize the boundary layer near the suction side of the blade, effectively delaying stall. Even though no detailed experimental analyses to characterize the tip leakage flow in a Wells turbine are available at the present time, the loss quantification recently proposed by Licheri et al. [79] confirms the general explanation of the tip clearance effects proposed by Torresi et al. [12]. Figure 15 shows the influence of the tip gap-to-height ratio on the efficiency and flow coefficient at stall. This figure reports the cycle-averaged efficiency , evaluated based on loss contributions defined by the same authors in [68], under non-stationary operating conditions representative of a regular wave motion. Larger tip clearance sizes, non-dimensionalized with respect to the blade height, result in lower rotor efficiencies due to the larger amount of fluid flowing through the tip gap, i.e., not producing work. On the other hand, the stall point is effectively delayed with larger tip clearance size, due to the energizing effect on the suction side of the boundary layer [12].
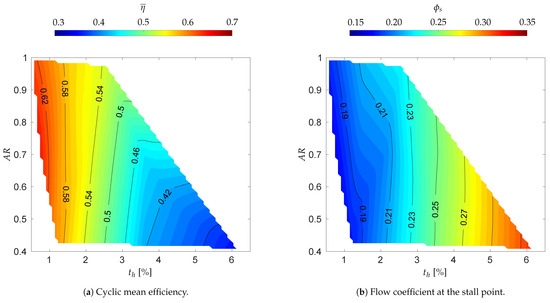
Figure 15.
Isolated effects of blade aspect ratio and tip clearance size on efficiency and operating range for a monoplane Wells turbine with and . Adapted with permission from [79], Elsevier, 2025.
Takao et al. [107] investigated the effects of end plates at the tip of a monoplane Wells rotor with the aim of improving the initial performance while delaying the stall occurrence. They tested different sizes and positions of end plates using the Saga University bidirectional rig [55], comparing these experimental results with numerical simulations. The presence of end plates modifies the interaction between the leakage flow and the flow on the suction surface, resulting in a more efficient Wells rotor with a larger stable operating range.
4.5. The Blade Aspect Ratio
Suzuki et al. [105] investigated the effects on global performance and stall onset induced by different values of the blade aspect ratio . A reduction in the turbine efficiency as well as in the operating range was observed and confirmed by a comparison with other existing experimental results. Nevertheless, in his review, Raghunatan [8] noticed that the variation of the in the existing works was obtained by simply varying the blade chord, at the price of conducting tests under different values of the Reynolds’ number. Following this important consideration and taking into account the low values of the Reynolds’ number (in the transitional range) typical of Wells turbine prototypes, Licheri et al. [79] investigated the effects of , paying particular attention to reproduce similar flow regimes for all tested geometries, confirming the results obtained in [105] and explaining how the performance variation is caused by a change in the effective Reynolds’ number and not by a direct effect of the . Figure 15 clearly shows the very limited influence of on both the loss contributions and operating range, for the values considered in [79].
4.6. The Blade Sweep
The sweep ratio represents the distance of the blade staking line from the leading edge line (g), non-dimensionalized with the chord c as shown in Figure 11. The value of this parameter plays a role on the mechanism of flow separation from the blade surface as highlighted by Raghunathan in [8]. More specifically, for a constant chord blade design with a (backward-swept blades), the stall is postponed with also a limited gain in the peak efficiency of the turbine. Setoguchi et al. presented more extended comparisons for this parameter [64], confirming the previous results for a NACA0020 blade profile but showing an opposite trend in the stall occurrence for CA9 and HSIM15 profiles. Unfortunately, the authors could not find any local flow analyses available in the literature evaluating the flow modifications due to this parameter, and the explanation of these differences is not completely clear and only based on numerical studies [115].
Also the blade sweep angle, represented in Figure 11 with the symbol , and often referred to as the blade skew [104], plays a role both on the stall occurrence and on the rotor efficiency [116]. Simply backward or forward swept blades have shown to reduce both the operating range and the rotor efficiency [73,96], although the stall is less abrupt than for unswept blades [73]. Optimized combinations of backward (at the hub) and forward sweep [104] can provide improvements both in terms of the operating range and efficiency, although the increment of the latter is only marginal.
4.7. Other Wells Rotors Configurations
In order to allow a Wells turbine to operate with higher pressure drops, for a given flow rate, without introducing transonic effects due to high rotational speeds at the blade tip (see Equation (3)), multiplane turbines can be adopted [50]. Only configurations with two blade rows have been reported in the literature, and the resulting arrangement is named the biplane Wells turbine. Figure 16 sketches the velocity triangles in this machine, assuming a fully axial inlet flow.
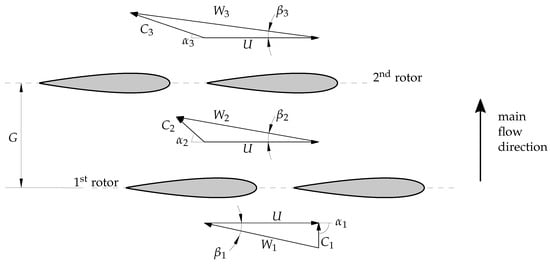
Figure 16.
Velocity triangles in a biplane Wells turbine.
The performance of a biplane Wells turbine was initially investigated by Raghunathan [50] under stationary flow conditions, in order to understand the effect of the inter-row distance G (typically non-dimensionalized with the blade chord c) on the global performance, finding a less abrupt stall with respect to a monoplane Well turbine. Gato and Curran [52] extended these analyses, testing different turbine solidities and values of and investigating the effect of the relative blade stagger angle (blade clocking) between the two planes on the overall turbine performance. Setoguchi et al. [117] performed similar investigations on different biplane Wells turbine configurations, comparing their performance and suggesting some guidelines for their design. Morais et al. [118] presented a more detailed investigation on biplane Wells turbines, comparing a high solidity biplane rotor with other similar machines, including a local flow characterization using a bidimensional pressure probe downstream of each row. Moreover, this study evaluates the effect of introducing a row of guide vanes between the two rotors, both analyzing the global performance and comparing the local 2D flow field, extending the analyses proposed by Alves et al. [92] on the same turbine configurations and in the same test rig. Carrelhas et al. [83] extended the previous work, focusing on biplane rotors with different solidities, with and without intermediate guide vanes and comparing these configurations also with respect to their acoustic emissions. The biplane turbine with intermediate guide vanes produced the highest peak efficiency, although with the smallest operating range due to stall, while acoustic emissions in the free-stall operating range were almost the same for all the tested turbines, given that the turbulent boundary layer at the trailing edge is the primary noise source. Das et al. [60] evaluated the operation of a small biplane Wells turbine, characterizing its performance under different load conditions as well as its starting behavior under oscillating flow.
Gato et al. [43,69] observed how the exit kinetic energy represents a considerable, although not the most relevant [68], loss contribution in the conversion process provided by a Wells turbine. In order to recover this exit kinetic energy, they proposed the addition of stator blades, placed both at the inlet and outlet of the rotor (given the bidirectional flow). Stator blades, typically referred as guide vanes, represent a relatively simple solution that allows to obtain a fully axial outlet flow. Unfortunately, the bidirectional nature of the flow in Wells turbine operation requires the use of a double row of guide vanes [54], with a modification of the inlet flow to the turbine. Experimental studies on such a configuration were conducted in unidirectional and stationary setups [54], confirming the expected modifications in turbine global performance with an increase, of about 5%, in the peak efficiency for the tested rotor geometry. Takao et al. [119] presented similar analyses, while Govardhan and Dhanasekaran [120] compared the radial distributions of velocity components at the exit of the inlet guide vane row, also referred as inlet guide vanes (IGVs), for Wells rotors with constant chord and constant solidity blade, explaining the reasons behind the performance improvements produced by the presence of IGVs. Setoguchi et al. [121] proposed an improvement, introducing a radial shape variation instead of the simpler configuration obtained, maintaining a fixed blade profile along the blade span.
Exit kinetic energy recovery can be achieved also using two contra-rotating Wells rotors [8], at the price of introducing an additional generator (or a gear box) to reverse the direction of rotation of one rotor and, finally, resulting in a more complex and expensive configuration than monoplane and biplane Wells turbines. Unidirectional stationary investigations conducted on small scale turbines [53,122] confirmed the expected performance of this particular turbine configuration, although bidirectional analyses conducted on a full-scale turbine by Folley et al. [123] showed significant differences from the predictions, suggesting the inadequacy of stationary experiments for reproducing the unsteady behavior of contra-rotating Wells rotors.
Curran and Gato [80] summarized and compared the global performance of different Wells turbine configurations, including monoplane turbines with and without guide vanes, biplane, and contra-rotating turbines. They also reported local analyses, with the aim of comparing exit flow angles for a monoplane rotor with and without guide vanes and for biplane and contra-rotating turbines.
4.8. Control Methods for Wells Turbine Operation
One of the most important limitations of the Wells turbine design is the stall occurrence at relatively small incidence angles, which leads to a limited stable operating range. Two control strategies, already used in other turbomachinery applications [124], have been suggested to control the operating conditions of a Wells monoplane turbine [8], without the need to introduce any other components into the system: the variable rotational speed and the variable pitch blades. Velocity triangles in Figure 17, drawn under the assumption of a fully axial inlet flow, help to visualize how the flow incidence angle i can be controlled using these two control strategies.
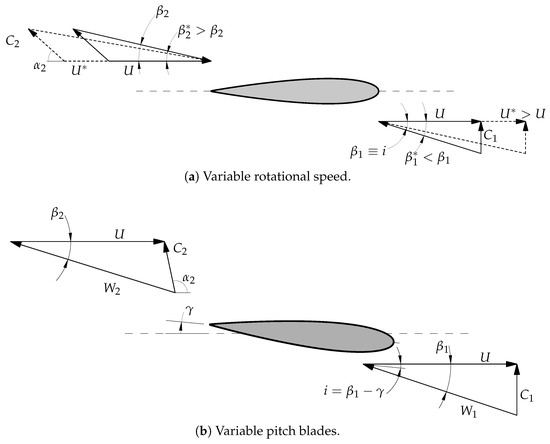
Figure 17.
Velocity triangles modification for different control strategies.
Lekube et al. [125] investigated, using numerical approaches, the possibility of regulating the turbine rotational speed, evaluating the possibility to avoid stall under real sea states. Starting from experimental measurements of acoustic emissions for a laboratory scale Wells turbine, Starzmann et al. [87] used a numerical approach to reproduce the effect of this control strategy on the noise of Wells turbine installations, showing the potentiality of a rotational speed regulation to reduce acoustic emissions. Licheri et al. [84,126] conducted an experimental analysis on a variable speed Wells rotor prototype at the University of Cagliari under oscillating flow conditions reproduced within an OWC simulator. They demonstrated, through investigations based only on global performance quantification, the effectiveness of a rotational speed control to obtain the desired turbine operating condition, maximizing the cycle operating efficiency with respect to the constant speed rotor.
Gato et al. conducted experimental analyses on Wells rotors with variable pitch blades in the late 1980s [127], with the aim of characterizing the aerodynamic performance of a Wells rotor with staggered blades. Gato and Fãlcao [127,128] characterized the stationary performance of a Wells rotor for several fixed values of the stagger angle, showing an improved efficiency and, as expected, the actual extension of the stable operating range. Inoue et al. [129,130] conducted tests in rotors with a fixed blade pitch angle under under stationary conditions, evaluating the self-starting behavior. At the present time, the only work that analyzed the performance of a Wells rotor with continuously varying pitch angle is that of Tease [131]. In this experimental investigation, a mechanism was capable of regulating the blade pitch angle under pulsating conditions, with the aim to limit the maximum flow angle achieved during operation. Setoguchi et al. [132] proposed a Wells rotor with self-pitch-controlled blades, focusing their investigations on its starting behavior of such a rotor and showing the benefits of this passive control strategy. Very recently, Licheri et al. [133] evaluated the performance of a Wells turbine prototype, equipped with variable pitch blades and installed in an OWC simulator, reconstructing its global and local performance under oscillating operating conditions for several constant values (during a test) of the the blade stagger angle. The results are in agreement with the previous literature and also with two-dimensional CFD simulations [134], showing the potential of less expensive calculations to define control laws for the performance maximization of variable pitch Wells rotors.
5. Discussion
5.1. Current Limitations of Available Studies
Despite the large number of analyses published in the last 40 years on Wells turbines, conducted both using numerical and experimental approaches, existing correlations between the performance and geometric parameters are still not exhaustive, and further studies are needed. This lack of information translates into the scarcity of usable rules for the design of a Wells turbine optimized for a specific site or for coupling it to an existing OWC. Raghunathan [114] provided important guidelines for designing a Wells turbine, but these do not include all geometric parameters and are based on requirements that are not longer relevant (e.g., the need for self-starting capabilities). In addition, many researchers were unable to obtain a complete separation of the effects due to different geometric parameters due to practical experiments limitations. Although still of general validity, the correlations provided in [114] should be reviewed in light of more recent research and integrated with more detailed and rigorous analysis.
The systematic study of the effect of geometric parameters on the Wells turbine performance is nowadays strongly based on numerical simulations, in particular on CFD analyses, but experimental investigations still play a fundamental role for (a) providing an adequate database for the validation of numerical predictions and (b) the verification of optimized solution from numerical simulations under operating conditions representative of the real ones.
However, the size of existing test rigs does not allow to always reproduce the real operating conditions of the Wells turbine, particularly in terms of the Reynolds’ number, which is typically lower due to the reduced size used in prototypes. Only a few investigations [71,79,99] have analyzed the Reynolds’ number effect on the performance of a Wells turbine, and in particular on the efficiency, essentially confirming the general behavior of isolated profiles. Takao et al. [99] found the critical Reynolds’ numbers for Wells turbines to be of the order of : for larger values, the peak and mean efficiency (obtained under stationary and oscillating operating conditions, respectively) are almost constant. They obtained this result using the rig available at the University of Limerick [51], which is at the time of writing the largest experimental setup built for Wells turbine testing (see Table 2).
5.2. Further Investigations Needed
In order to satisfy these requirements, experimental analyses conducted only from a global point of view are not sufficient, and detailed local flow analyses are necessary to provide more thorough information and explanations of the rotor aerodynamics. Moreover, the characterization of secondary flow losses in Wells turbines can be used to define or to adapt existing turbomachinery loss models to such an unusually staggered rotor. With this in mind, Wells turbine test rigs, that always employ the full rotating components of the machine, still represent an effective solution for investigating and characterizing cascade effects. These analyses should also be extended even in innovative configurations, for instance in rotors with the control of the blade stagger angle [133].
During the last decade, a number of novel geometric configurations have been proposed and evaluated by numerical analyses. These new configurations promise to overcome some limitations of traditional Wells turbine designs, i.e., the relatively low aerodynamic efficiency and the limited operating range. Fences, end-plates, casing treatments, slats, gurney flaps and many other solutions have been analyzed, but never tested experimentally. It is the authors’ opinion that experimental tests continue to have a fundamental importance in analyzing the proposed solutions and, in general, validating the numerical result in terms of global and local quantities. Laboratory test rigs, and particularly oscillating rigs, are therefore of fundamental importance to guide the search for better performing and more stable machines.
Author Contributions
Conceptualization, F.L.; methodology, F.L.; investigation, F.L.; data curation, F.L.; writing—original draft preparation, F.L., P.P., T.G., F.C. and M.C.; writing—review and editing, F.L., P.P., T.G., F.C. and M.C.; visualization, F.L.; supervision, F.C.; project administration, F.C.; funding acquisition, F.C. All authors have read and agreed to the published version of the manuscript.
Funding
This study was carried out by Fabio Licheri within the “e.INS—Ecosystem of Innovation for Next Generation Sardinia” funded by the Italian Ministry of University and Research under the Next-Generation EU Programme (National Recovery and Resilience Plan—PNRR, M4C2, INVESTMENT 1.5—DD 1056 of 23/06/2022, ECS00000038). This manuscript reflects only the authors’ views and opinions, neither the European Union nor the European Commission can be considered responsible for them. Francesco Cambuli acknowledges financial support by the National Recovery and Resilience Plan (NRRP), Mission 4, Component 2, Investment 1.3, Call for Tender No. 1561 dated October 11, 2022, PE_0000021, financed by the Italian Ministry of University and Research, funded by the European Union—Next-GenerationEU—Project Title “Network 4 Energy Sustainable Transition NEST”. Francesco Cambuli, Tiziano Ghisu and Pierpaolo Puddu acknowledge financial support under the National Recovery and Resilience Plan (NRRP), Mission 4, Component 2, Investment 1.1, Call for tender No. 1409 published on 14.9.2022 by the Italian Ministry of University and Research (MUR), funded by the European Union—NextGenerationEU—Project Title APEIRON—CUP F53D23009560001—Grant Assignment Decree No.0001385 adopted on 01-09-2023 by the Italian Ministry of Ministry of University and Research (MUR).
Data Availability Statement
The data presented in this study are available on request from the corresponding author.
Conflicts of Interest
The authors declare no conflicts of interest.
Nomenclature
| Acronyms | |
| CFD | Computational Fluid Dynamics |
| HWA | Hot-Wire Anemometer |
| IGV | Inlet Guide Vanes |
| LDA | Laser Doppler Anemometry |
| OWC | Oscillating Water Column |
| PIV | Particle Image Velocimetry |
| PTO | Power Take-Off |
| UPM | Uncertainty Propagation Method |
| WEC | Wave Energy Converter |
| Latin symbols | |
| A | area |
| aspect ratio | |
| c | blade chord |
| C | absolute velocity |
| D | drag force |
| F | aerodynamic force |
| g | stagger position |
| G | axial distance between planes |
| h | blade height |
| i | incidence angle |
| K | damping coefficient |
| L | lift force |
| p | static pressure |
| Q | flow rate |
| R | resultant force |
| r | radius |
| T | torque |
| t | tip gap size |
| U | blade speed |
| V | velocity |
| W | relative velocity |
| Greek symbols | |
| absolute flow angle | |
| relative flow angle | |
| pitch angle | |
| difference | |
| sweep angle | |
| efficiency | |
| hub-to-tip ratio | |
| density | |
| solidity | |
| flow coefficient | |
| angular rotational speed | |
| Subscripts and superscripts | |
| * | non-dimensional quantity, new value |
| averaged quantity | |
| 1 | inlet |
| 2 | outlet |
| blade root | |
| s | stall, stalled |
| blade tip | |
| t | tangential |
| z | axial |
References
- World Energy Transitions Outlook 2024: 1.5 °C Pathway; International Renewable Energy Agency: Abu Dhabi, United Arab Emirates, 2024.
- Ocean Energy Stats & Trends 2023; Ocean Energy Europe: Brussels, Belgium, 2024.
- Heath, T.V. A review of oscillating water columns. Philos. Trans. R. Soc. A: Math. Phys. Eng. Sci. 2012, 370, 235–245. [Google Scholar] [CrossRef] [PubMed]
- Heath, T. Chapter 334—The Development and Installation of the Limpet Wave Energy Converter. In World Renewable Energy Congress VI; Sayigh, A., Ed.; Pergamon: Oxford, UK, 2000; pp. 1619–1622. [Google Scholar] [CrossRef]
- Monteiro, W.M.L.; Sarmento, A.; Monteiro, C.P.; Monteiro, J.A.L. Wave energy production by a maritime Natural Cave: Performance characterization and the power take-off design. J. Ocean Eng. Mar. Energy 2021, 7, 327–337. [Google Scholar] [CrossRef]
- Setoguchi, T.; Santhakumar, S.; Maeda, H.; Takao, M.; Kaneko, K. A review of impulse turbines for wave energy conversion. Renew. Energy 2001, 23, 261–292. [Google Scholar] [CrossRef]
- Wells, A. Fluid Driven Rotary Transducer. BR. Patent 1595700, 13 November 1976. [Google Scholar]
- Raghunathan, S. The Wells air turbine for wave energy conversion. Prog. Aerosp. Sci. 1995, 31, 335–386. [Google Scholar] [CrossRef]
- de O. Falcão, A.F.; Gato, L.M.C. 8.05—Air Turbines. In Comprehensive Renewable Energy; Elsevier: Oxford, UK, 2012; pp. 111–149. [Google Scholar] [CrossRef]
- Camporeale, S.M.; Torresi, M.; Pascazio, G.; Fortunato, B. A 3D Unsteady Analysis of a Wells Turbine in a Sea-Wave Energy Conversion Device. In Proceedings of the ASME Turbo Expo 2003, Collocated with the 2003 International Joint Power Generation Conference, Atlanta, GA, USA, 16–19 June 2003; International Gas Turbine Institute: Houston, TX, USA, 2003; Volume 6: Turbo Expo 2003, Parts A and B, pp. 989–998. [Google Scholar] [CrossRef]
- Dhanasekaran, T.; Govardhan, M. Computational analysis of performance and flow investigation on Wells turbine for wave energy conversion. Renew. Energy 2005, 30, 2129–2147. [Google Scholar] [CrossRef]
- Torresi, M.; Camporeale, S.; Strippoli, P.; Pascazio, G. Accurate numerical simulation of a high solidity Wells turbine. Renew. Energy 2008, 33, 735–747. [Google Scholar] [CrossRef]
- Torresi, M.; Camporeale, S.; Pascazio, G. Detailed CFD analysis of the steady flow in a Wells turbine under incipient and deep stall conditions. J. Fluids Eng. Trans. ASME 2009, 131, 0711031–07110317. [Google Scholar] [CrossRef]
- Ghisu, T.; Puddu, P.; Cambuli, F. A detailed analysis of the unsteady flow within a Wells turbine. Proc. Inst. Mech. Eng. Part A J. Power Energy 2017, 231, 197–214. [Google Scholar] [CrossRef]
- Licheri, F.; Cambuli, F.; Puddu, P.; Ghisu, T. A comparison of different approaches to estimate the efficiency of Wells turbines. J. Fluids Eng. 2021, 143, 051205. [Google Scholar] [CrossRef]
- Mohamed, M.H.; Janiga, G.; Pap, E.; Thévenin, D. Multi-objective optimization of the airfoil shape of Wells turbine used for wave energy conversion. Energy 2011, 36, 438–446. [Google Scholar] [CrossRef]
- Shaaban, S. Wells turbine blade profile optimization for better wave energy capture. Int. J. Energy Res. 2017, 41, 1767–1780. [Google Scholar] [CrossRef]
- Gratton, T.; Ghisu, T.; Parks, G.; Cambuli, F.; Puddu, P. Optimization of blade profiles for the Wells turbine. Ocean Eng. 2018, 169, 202–214. [Google Scholar] [CrossRef]
- Das, T.K.; Kerikous, E.; Venkatesan, N.; Janiga, G.; Thévenin, D.; Samad, A. Performance improvement of a Wells turbine through an automated optimization technique. Energy Convers. Manag. X 2022, 16, 100285. [Google Scholar] [CrossRef]
- de O. Falcão, A.F. Wave energy utilization: A review of the technologies. Renew. Sustain. Energy Rev. 2010, 14, 899–918. [Google Scholar] [CrossRef]
- Whittaker, T.; McIlwaine, S. Shoreline Wave Power Experience With the Islay Prototype. In Proceedings of the International Offshore and Polar Engineering Conference, Edinburgh, UK, 11–16 August 1991; p. ISOPE–I–91–053. [Google Scholar]
- Ravindran, M.; Koola, P.M. Energy from sea waves—The Indian wave energy programme. Curr. Sci. 1991, 60, 676–680. [Google Scholar]
- Mustapa, M.; Yaakob, O.; Ahmed, Y.M.; Rheem, C.K.; Koh, K.; Adnan, F.A. Wave energy device and breakwater integration: A review. Renew. Sustain. Energy Rev. 2017, 77, 43–58. [Google Scholar] [CrossRef]
- Washio, Y.; Osawa, H.; Ogata, T. The open sea tests of the offshore floating type wave power device "Mighty Whale"—Characteristics of wave energy absorption and power generation. In Proceedings of the MTS/IEEE Oceans 2001. An Ocean Odyssey. Conference Proceedings (IEEE Cat. No.01CH37295), Honolulu, HI, USA, 5–8 November 2001; Volume 1, pp. 579–585. [Google Scholar] [CrossRef]
- Ogata, T.; Washio, Y.; Osawa, H.; Tsuritani, Y.; Yamashita, S.; Nagata, Y. The Open Sea Tests of the Offshore Floating Type Wave Power Device “Mighty Whale”: Performance of the Prototype. In Proceedings of the 21st International Conference on Offshore Mechanics and Arctic Engineering, Oslo, Norway, 23–28 June 2002; Volume 4, pp. 517–524. [Google Scholar] [CrossRef]
- de, O. Falcão, A.F.; Sarmento, A.; Gato, L.M.C.; Brito-Melo, A. The Pico OWC wave power plant: Its lifetime from conception to closure 1986-2018. Appl. Ocean Res. 2020, 98, 102104. [Google Scholar] [CrossRef]
- Torre-Enciso, Y.; Ortubia, I.; Aguileta, L.; Marqués, J. Mutriku Wave Power Plant: From the Thinking out to the Reality. In Proceedings of the 8th European Wave and Tidal Energy Conference, Uppsala, Sweden, 7–10 September 2009; pp. 319–329. [Google Scholar]
- Arena, F.; Romolo, A.; Malara, G.; Ascanelli, A. On Design and Building of a U-OWC Wave Energy Converter in the Mediterranean Sea: A Case Study. In Proceedings of the ASME 2013 32nd International Conference on Ocean, Offshore and Arctic Engineering, Nantes, France, 9–14June 2013; Volume 8: Ocean Renewable Energy, p. V008T09A102. [Google Scholar] [CrossRef]
- Guide for the Verification and Validation of Computational Fluid Dynamics Simulations (AIAA G-077-1998(2002)); American Institute of Aeronautics and Astronautics: Reston, CA, USA, 2002. [CrossRef]
- Oberkampf, W.L.; Trucano, T.G. Verification and validation in computational fluid dynamics. Prog. Aerosp. Sci. 2002, 38, 209–272. [Google Scholar] [CrossRef]
- Shehata, A.; Xiao, Q.; Saqr, K.; Alexander, D. Wells turbine for wave energy conversion: A review. Int. J. Energy Res. 2017, 41, 6–38. [Google Scholar] [CrossRef]
- Hirsch, C. Advisory Group for Aerospace Research and Development; NATO Science & Technology Organization. In Advanced Methods for Cascade Testing; AGARD-AG-328; AGARD: Paris, France, 1998. [Google Scholar]
- Abbott, I.H.; von Doenhoff, A.E. Theory of Wing Sections: Including a Summary of Airfoil Data; Dover Publications, Inc.: New York, NY, USA, 1959. [Google Scholar]
- Glassman, A.J. Dynamic Stall Experiments on the NACA 0012 Airfoil; NASA Special Publication, National Aeronautics and Space Administration, Scientific and Technical Information Office: Washington, DC, USA, 1978. [Google Scholar]
- Ericsson, L.; Reding, J. Fluid mechanics of dynamic stall part I. Unsteady flow concepts. J. Fluids Struct. 1988, 2, 1–33. [Google Scholar] [CrossRef]
- Carta, M.; Putzu, R.; Ghisu, T. A comparison of plunging- and pitching-induced deep dynamic stall on an SD7003 airfoil using URANS and LES simulations. Aerosp. Sci. Technol. 2022, 121, 107307. [Google Scholar] [CrossRef]
- Raghunathan, S.; Tan, C.P.; Ombaka, O.O. Performance of the Wells self-rectifying air turbine. Aeronaut. J. 1985, 89, 369–379. [Google Scholar] [CrossRef]
- da Fonseca, F.X.C.; Henriques, J.C.C.; Gato, L.M.C.; de O. Falcão, A.F. Oscillating flow rig for air turbine testing. Renew. Energy 2019, 142, 373–382. [Google Scholar] [CrossRef]
- Ghisu, T.; Cambuli, F.; Puddu, P.; Virdis, I.; Carta, M.; Licheri, F. A critical examination of the hysteresis in Wells turbines using computational fluid dynamics and lumped parameter models. J. Offshore Mech. Arct. Eng. 2020, 142, 052001. [Google Scholar] [CrossRef]
- Grant, R.J.; Johnson, C.G.; Sturge, D.P. Performance of a Wells turbine for use in a wave energy system, 1981. Available online: https://www.osti.gov/etdeweb/biblio/5281457 (accessed on 29 May 2025).
- Raghunathan, S.; Tan, C.; Wells, N. Theory and performance of a Wells turbine. J. Energy 1982, 6, 157–160. [Google Scholar] [CrossRef]
- ISO 5081:2017(E); Fans—Performance Testing Using Standardized Airways. International Organization for Standardization: Geneva, Switzerland, 2017.
- Gato, L.M.C.; de O. Falcão, A.F. Aerodynamics of the Wells turbine. Int. J. Mech. Sci. 1988, 30, 383–395. [Google Scholar] [CrossRef]
- Gato, L.M.C.; Warfield, V.; Thakker, A. Performance of a High-Solidity Wells Turbine for an OWC Wave Power Plant. J. Energy Resour. Technol. 1996, 118, 263–268. [Google Scholar] [CrossRef]
- Raghunathan, S.; Setoguchi, T.; Kaneko, K. The Effect of Inlet Conditions on the Performance of Wells Turbine. J. Energy Resour. Technol. 1989, 111, 37–42. [Google Scholar] [CrossRef]
- Suzuki, M.; Arakawa, C.; Tagori, T. Fundamental studies on Wells turbine for wave power generator (1st Report, The effect of solidity, and self-starting). Bull. JSME 1984, 27, 1925–1931. [Google Scholar] [CrossRef]
- Camporeale, S.M.; Filianoti, P.; Torresi, M. Performance of a Wells Turbine in a OWC Device in Comparison to Laboratory Tests. In Proceedings of the Ninth European Wave and Tidal Energy Conference (EWTEC2011), Southampton, UK, 5–9 September 2011. [Google Scholar]
- Heikal, H.; Hafiz, A.; Bayomi, N.; Ahmed, M. Theoretical and experimental investigation on the Wells turbine performance. In Proceedings of the 7th Conference on Theoretical & Applied Mechanics, Cairo, Egypt, 11–12 March 2003; pp. 213–233. [Google Scholar]
- Govardhan, M.; Dhanasekaran, T. Effect of guide vanes on the performance of a self-rectifying air turbine with constant and variable chord rotors. Renew. Energy 2002, 26, 201–219. [Google Scholar] [CrossRef]
- Raghunathan, S.; Tan, C.P. Performance of Biplane Wells Turbine. J. Energy 1983, 7, 741–742. [Google Scholar] [CrossRef]
- Thakker, A.; Abdulhadi, R. The performance of Wells turbine under bi-directional airflow. Renew. Energy 2008, 33, 2467–2474. [Google Scholar] [CrossRef]
- Gato, L.M.C.; Curran, R. Performance of the Biplane Wells Turbine. J. Offshore Mech. Arct. Eng. 1996, 118, 210–215. [Google Scholar] [CrossRef]
- Gato, L.; Curran, R. Performance of the Contrarotating Wells Turbine. Int. J. Offshore Polar Eng. 1996, 6, ISOPE-96-06-1-068. [Google Scholar]
- Gato, L.M.C.; de, O. Fãlcao, A.F. Performance of the Wells Turbine with a Double Row of Guide Vanes. JSME Int. Journal. Ser. 2 Fluids Eng. Heat Transf. Power Combust. Thermophys. Prop. 1990, 33, 265–271. [Google Scholar] [CrossRef]
- Maeda, H.; Santhakumar, S.; Setoguchi, T.; Takao, M.; Kinoue, Y.; Kaneko, K. Performance of an impulse turbine with fixed guide vanes for wave power conversion. Renew. Energy 1999, 17, 533–547. [Google Scholar] [CrossRef]
- Paderi, M.; Puddu, P. Experimental investigation in a Wells turbine under bi-directional flow. Renew. Energy 2013, 57, 570–576. [Google Scholar] [CrossRef]
- Starzmann, R.; Carolus, T.; Tease, K.; Arlitt, R. Wells turbine rotors: A comparison of the predicted and measured aerodynamic performance. In Proceedings of the 9th European Conference on Turbomachinery: Fluid Dynamics and Thermodynamics, ETC 2011, Istanbul, Turkey, 21–25 March 2011; Volume 2, pp. 1085–1094. [Google Scholar]
- Moisel, C.; Carolus, T.H. A facility for testing the aerodynamic and acoustic performance of bidirectional air turbines for ocean wave energy conversion. Renew. Energy 2016, 86, 1340–1352. [Google Scholar] [CrossRef]
- Kumar, A.; Das, T.K.; Samad, A. Experimental study of Wells turbine with multiparameter modification for wave energy conversion. In Proceedings of the OCEANS 2021: San Diego—Porto, San Diego, CA, USA, 20–23 September 2021; pp. 1–7. [Google Scholar] [CrossRef]
- Das, T.K.; Kumar, K.; Samad, A. Experimental Analysis of a Biplane Wells Turbine under Different Load Conditions. Energy 2020, 206, 118205. [Google Scholar] [CrossRef]
- Licheri, F.; Puddu, P.; Ghisu, T.; Cambuli, F. Experimental analysis of the unsteady flow inside a Wells turbine. In Proceedings of the 76th Italian National Congress ATI, Rome, Italy, 15–17 September 2021; Volume 312, p. 11009. [Google Scholar] [CrossRef]
- Puddu, P.; Paderi, M.; Manca, C. Aerodynamic characterization of a Wells turbine under bi-directional airflow. Energy Procedia 2014, 45, 278–287. [Google Scholar] [CrossRef]
- Ghisu, T.; Cambuli, F.; Puddu, P.; Virdis, I.; Carta, M.; Licheri, F. A lumped parameter model to explain the cause of the hysteresis in OWC-Wells turbine systems for wave energy conversion. Appl. Ocean Res. 2020, 94, 101994. [Google Scholar] [CrossRef]
- Setoguchi, T.; Kim, T.W.; Takao, M.; Thakker, A.; Raghunathan, S. The effect of rotor geometry on the performance of a Wells turbine for wave energy conversion. Int. J. Ambient Energy 2004, 25, 137–150. [Google Scholar] [CrossRef]
- Licheri, F.; Ghisu, T.; Cambuli, F.; Puddu, P. Experimental Analysis of the Three-Dimensional Flow in a Wells Turbine Rotor. Int. J. Turbomach. Propuls. Power 2023, 8, 21. [Google Scholar] [CrossRef]
- Stefanizzi, M.; Camporeale, S.M.; Torresi, M. Experimental investigation of a Wells turbine under dynamic stall conditions for wave energy conversion. Renew. Energy 2023, 214, 369–382. [Google Scholar] [CrossRef]
- Dixon, S.L.; Hall, C.A. Fluid Mechanics and Thermodynamics of Turbomachinery, 6th ed.; Elsevier, Inc.: Amsterdam, The Netherlands, 2010. [Google Scholar]
- Licheri, F.; Ghisu, T.; Cambuli, F.; Puddu, P. Detailed investigation of the local flow-field in a Wells turbine coupled to an OWC simulator. Renew. Energy 2022, 197, 583–593. [Google Scholar] [CrossRef]
- Gato, L.M.C.; de O. Falcão, A.F. On the theory of the Wells turbine. J. Eng. Gas Turbines Power 1984, 106, 628–633. [Google Scholar] [CrossRef]
- Inoue, M.; Kaneko, K.; Setoguchi, T.; Raghunathan, S. Simulation of starting characteristics of the Wells turbine. In Proceedings of the 4th Joint Fluid Mechanics, Plasma Dynamics and Lasers Conference, Atlanta, GA, USA, 12–14 May 1986. [Google Scholar] [CrossRef]
- Raghunathan, S.; Tan, C. Aerodynamic performance of a Wells air turbine. J. Energy 1983, 7, 226–230. [Google Scholar] [CrossRef]
- Inoue, M.; Kaneko, K.; Setoguchi, T.; Koura, F. Hysteretic characteristics of wells turbine in reciprocating flow. Trans. Jpn. Soc. Mech. Eng. Ser. B 1987, 53, 3699–3704. [Google Scholar] [CrossRef]
- Webster, M.; Gato, L.M.C.; White, P.R.S. Variation of blade shape and its effect on the performance of the Wells turbine. Int. J. Ambient Energy 1998, 19, 149–156. [Google Scholar] [CrossRef]
- Setoguchi, T.; Takao, M.; Kaneko, K. Hysteresis on Wells turbine characteristics in reciprocating flow. Int. J. Rotating Mach. 1998, 4, 17–24. [Google Scholar] [CrossRef]
- Thakker, A.; Frawley, P.; Bajeet, E.S.; Heffernan, A. Experimental investigation of CA9 blades on a 0.3m Wells turbine rig. In Proceedings of the International Offshore and Polar Engineering Conference, Seattle, WA, USA, May 28–2 June 2000; Volume 4, pp. 345–350. [Google Scholar]
- Webster, M.; Gato, L. The Effect of Rotor Blade Shape On the Performance of the Wells Turbine. Int. J. Offshore Polar Eng. 2001, 11, ISOPE-I-99-027. [Google Scholar]
- Takao, M.; Setoguchi, T.; Nagata, S.; Toyota, K. A Study on the Effects of Blade Profile and Non-Uniform Tip Clearance of the Wells Turbine. In Proceedings of the International Conference on Offshore Mechanics and Arctic Engineering, Estoril, Portugal, 15–20 June 2008; Volume 6, pp. 625–632. [Google Scholar] [CrossRef]
- Starzmann, R.; Carolus, T.H.; Tease, K.; Arlitt, R. Effect of Design Parameters on Aero-Acoustic and Aerodynamic Performance of Wells Turbines. In Proceedings of the International Conference on Offshore Mechanics and Arctic Engineering, Rotterdam, The Netherlands, 19–24 June 2011; Volume 5: Ocean Space Utilization; Ocean Renewable Energy, pp. 299–308. [Google Scholar] [CrossRef]
- Licheri, F.; Ghisu, T.; Cambuli, F.; Puddu, P.; Carta, M. Effects of tip gap size and aspect ratio on the performance of a Wells turbine. Renew. Energy 2025, 242, 122389. [Google Scholar] [CrossRef]
- Curran, R.; Gato, L. The energy conversion performance of several types of Wells turbine designs. Proc. Inst. Mech. Eng. Part A J. Power Energy 1997, 211, 133–145. [Google Scholar] [CrossRef]
- Takao, M.; Fukuma, S.; Okuhara, S.; Ashraful Alam, M.M.; Kinoue, Y. Performance comparison of turbines for bi-directional flow. IOP Conf. Ser. Earth Environ. Sci. 2019, 240, 052002. [Google Scholar] [CrossRef]
- Gish, L.A.; Selby, J.B. Experimental Analysis of Oscillating Water Column Air Turbines. In Proceedings of the OCEANS 2022, Hampton Roads, Hampton Roads, VA, USA, 17–20 October 2022; pp. 1–7. [Google Scholar] [CrossRef]
- Carrelhas, A.; Gato, L.; Morais, F. Aerodynamic performance and noise emission of different geometries of Wells turbines under design and off-design conditions. Renew. Energy 2024, 220, 119622. [Google Scholar] [CrossRef]
- Licheri, F.; Ghisu, T.; Cambuli, F.; Puddu, P. Wells turbine efficiency improvements: Experimental application of a speed control strategy. J. Phys. Conf. Ser. 2022, 2385, 012132. [Google Scholar] [CrossRef]
- Torresi, M.; Camporeale, S.M. Wind tunnel measurements for the characterization of a small scale monoplane Wells turbin. In Proceedings of the 2018 IEEE International Workshop on Metrology for the Sea; Learning to Measure Sea Health Parameters (MetroSea), Bari, Italy, 8–10 October 2018; pp. 252–256. [Google Scholar] [CrossRef]
- Tease, W.K.; Lees, J.; Hall, A. Advances in Oscillating Water Column air turbine development. In Proceedings of the 7th European wave and tidal energy conference, Porto, Portugal, 11–13 September 2007. [Google Scholar]
- Starzmann, R.; Moisel, C.; Carolus, T.; Tease, K.; Arlitt, R. Assessment method of sound radiated by cyclically operating Wells turbines. Int. J. Mar. Energy 2013, 2, 12–27. [Google Scholar] [CrossRef]
- Coleman, H.W.; Glenn Steel, W., Jr. Experimentation, Validation, and Uncertainty Analysis for Engineers, 3rd ed.; John Wiley & Sons, Ltd.: Hoboken, NJ, USA, 2009. [Google Scholar] [CrossRef]
- Maeda, H.; Setoguchi, T.; Takao, M.; Sakurada, K.; Kim, T.; Kaneko, K. Comparative study of turbines for wave energy conversion. J. Therm. Sci. 2001, 10, 26–31. [Google Scholar] [CrossRef]
- Kim, T.H.; Takao, M.; Setoguchi, T.; Kaneko, K.; Inoue, M. Performance comparison of turbines for wave power conversion. Int. J. Therm. Sci. 2001, 40, 681–689. [Google Scholar] [CrossRef]
- Gato, L.M.C.; Webster, M. An experimental investigation into the effect of rotor blade sweep on the performance of the variable-pitch Wells turbine. Proc. Inst. Mech. Eng. Part A J. Power Energy 2001, 215, 611–622. [Google Scholar] [CrossRef]
- Alves, J.S.; Gato, L.M.C.; de, O. Falcão, A.F.; Henriques, J.C.C. Experimental investigation on performance improvement by mid-plane guide-vanes in a biplane-rotor Wells turbine for wave energy conversion. Renew. Sustain. Energy Rev. 2021, 150, 111497. [Google Scholar] [CrossRef]
- Licheri, F.; Ghisu, T.; Cambuli, F.; Puddu, P. Experimental reconstruction of the local flow field in a Wells turbine using a three-dimensional pressure probe. Energy 2024, 296, 131062. [Google Scholar] [CrossRef]
- Bradshaw, P. An Introduction to Turbulence and Its Measurement, 1st ed.; Pergamon: Bergama, Turkey, 1971. [Google Scholar] [CrossRef]
- Jensen, K.D. Flow measurements. J. Braz. Soc. Mech. Sci. Eng. 2004, 26, 400–418. [Google Scholar] [CrossRef]
- Suzuki, M.; Chuichi, A. Influence of Blade Profiles on Flow around Wells Turbine. Int. J. Fluid Mach. Syst. 2008, 1, 148–154. [Google Scholar] [CrossRef]
- Raghunathan, S.; Tan, C. Effect of blade profile on the performance of the Wells self-rectifying air turbine. Int. J. Heat Fluid Flow 1985, 6, 17–22. [Google Scholar] [CrossRef]
- Takao, M.; Thakker, A.; Abdulhadi, R.; Setoguchi, T. Effect of blade profile on the performance of large-scale Wells turbine. In Proceedings of the International Offshore and Polar Engineering Conference, Toulon, France, 23–28 May 2004; pp. 272–276. [Google Scholar]
- Takao, M.; Thakker, A.; Abdulhadi, R.; and, T.S. Effect of blade profile on the performance of a large-scale Wells turbine for wave-energy conversion. Int. J. Sustain. Energy 2007, 25, 53–61. [Google Scholar] [CrossRef]
- Thakker, A.; Abdulhadi, R. Effect of blade profile on the performance of Wells turbine under unidirectional sinusoidal and real sea flow conditions. Int. J. Rotating Mach. 2007, 2007, 51598. [Google Scholar] [CrossRef]
- Harby, A.H.; Shehata, A.S.; Afify, R.S.; Hanafy, A.A. Experimental and mathematical investigation of wells turbine under bi-directional flow. Aip Conf. Proc. 2022, 2437, 020113. [Google Scholar] [CrossRef]
- Setoguchi, T.; Raghunathan, S.; Kaneko, K.; Inoue, M. Studies on a Wells Turbine for a Wave Power Generator. 5th Report on Some Factors Concerning the Stall Condition. Trans. Jpn. Soc. Mech. Eng. Ser. B 1987, 53, 945–949. [Google Scholar] [CrossRef]
- Webster, M.; Gato, L. The effect of rotor blade sweep on the performance of the wells turbine. Int. J. Offshore Polar Eng. 1999, 9, 233–239. [Google Scholar]
- Starzmann, R.; Carolus, T. Effect of blade skew strategies on the operating range and aeroacoustic performance of the Wells turbine. J. Turbomach. 2013, 136, 011003. [Google Scholar] [CrossRef]
- Suzuki, M.; Arakawa, C.; Tagori, T. Fundamental studies on Wells turbine for wave power generator (2nd report. Influences of tip clearances). Trans. Jpn. Soc. Mech. Eng. Ser. B 1988, 54, 609–615. [Google Scholar] [CrossRef]
- Takao, M.; Setoguchi, T.; Kinoue, Y.; Kaneko, K. Effect of end plates on the performence of a wells turbine for wave energy conversion. J. Therm. Sci. 2006, 15, 319–323. [Google Scholar] [CrossRef]
- Takao, M.; Setoguchi, T.; Kinoue, Y.; Kaneko, K. Wells turbine with end plates for wave energy conversion. Ocean Eng. 2007, 34, 1790–1795. [Google Scholar] [CrossRef]
- Setoguchi, T.; Takao, M.; Kinoue, Y.; Kaneko, K.; Inoue, M. Studies on a Wells turbine for wave energy conversion (Improvement of performance by the use of porous fences). Nihon Kikai Gakkai Ronbunshu B Hen/Trans. Jpn. Soc. Mech. Eng. Part B 1999, 65, 262–266. [Google Scholar] [CrossRef][Green Version]
- Takasaki, K.; Tsunematsu, T.; Takao, M.; Alam, M.M.A.; Setoguchi, T. Wells Turbine for Wave Energy Conversion—Effect of Trailing Edge Shape. Int. J. Fluid Mach. Syst. 2016, 9, 307–312. [Google Scholar] [CrossRef]
- Harby, A.H.; Shehata, A.S.; Afify, R.S.; Hanafy, A.A. Experimental investigation for suction slots of wells turbine and shapes of point absorber. Energy Rep. 2022, 8, 1275–1287, Technologies and Materials for Renewable Energy, Environment and Sustainability. [Google Scholar] [CrossRef]
- Raghunathan, S.; Tan, C.P. Performance of the Wells turbine at starting. J. Energy 1982, 6, 430–431. [Google Scholar] [CrossRef]
- Starzmann, R.; Carolus, T. Model-based selection of full-scale Wells turbines for ocean wave energy conversion and prediction of their aerodynamic and acoustic performances. Proc. Inst. Mech. Eng. Part A 2014, 228, 2–16. [Google Scholar] [CrossRef]
- Raghunathan, S.; Setoguchi, T.; Kaneko, K. Aerodynamics of Monoplane Wells Turbine—A Review. In Proceedings of the International Ocean and Polar Engineering Conference, Edinburgh, UK, 11–16 August 1991; p. ISOPE-I-91-050. [Google Scholar]
- Raghunathan, S. A Methodology for Wells Turbine Design for Wave Energy Conversion. Proc. Inst. Mech. Eng. Part A: J. Power Energy 1995, 209, 221–232. [Google Scholar] [CrossRef]
- Kim, T.; Setoguchi, T.; Kaneko, K.; Raghunathan, S. Numerical investigation on the effect of blade sweep on the performance of Wells turbine. Renew. Energy 2002, 25, 235–248. [Google Scholar] [CrossRef]
- Kumar, A.; Das, T.K.; Samad, A. Effect of blade skew, endplate and casing groove on the aerodynamic performance of Wells turbine for OWC: A review. J. Phys. Conf. Ser. 2022, 2217, 012070. [Google Scholar] [CrossRef]
- Setoguchi, T.; Kaneko, K.; Hamakawa, H.; Inoue, M. Biplane Axial Turbine for Wave Power Generator: (Aerodynamic Characteristics of Noncambered Blades). Trans. Jpn. Soc. Mech. Eng. Ser. B 1989, 55, 1159–1163. [Google Scholar] [CrossRef]
- Morais, F.; Carrelhas, A.; Gato, L. Biplane-rotor Wells turbine: The influence of solidity, presence of guide vanes and comparison with other configurations. Energy 2023, 276, 127514. [Google Scholar] [CrossRef]
- Takao, M.; Setoguchi, T.; Kaneko, K.; Yu, S. Performance of wells turbine with guide vanes for wave energy conversion. J. Therm. Sci. 1996, 5, 82–87. [Google Scholar] [CrossRef]
- Govardhan, M.; Dhanasekaran, T. Effect of guide vanes on the performance of a variable chord self-rectifying air turbine. J. Therm. Sci. 1998, 7, 209–217. [Google Scholar] [CrossRef]
- Setoguchi, T.; Santhakumar, S.; Takao, M.; Kim, T.; Kaneko, K. Effect of guide vane shape on the performance of a Wells turbine. Renew. Energy 2001, 23, 1–15. [Google Scholar] [CrossRef]
- Raghunathan, S.; Beattie, W. Aerodynamic performance of contra-rotating Wells turbine for wave energy conversion. Proc. Inst. Mech. Eng. Part A J. Power Energy 1996, 210, 431–447. [Google Scholar] [CrossRef]
- Folley, M.; Curran, R.; Whittaker, T. Comparison of LIMPET contra-rotating Wells turbine with theoretical and model test predictions. Ocean Eng. 2006, 33, 1056–1069. [Google Scholar] [CrossRef]
- Dick, E. Fundamentals of Turbomachines, 2nd ed.; Fluid Mechanics and Its Applications; Springer: Cham, Switzerland, 2022; p. 600. [Google Scholar] [CrossRef]
- Lekube, J.; Garrido, A.J.; Garrido, I. Variable speed control in wells turbine-based oscillating water column devices: Optimum rotational speed. IOP Conf. Ser. Earth Environ. Sci. 2018, 136, 012017. [Google Scholar] [CrossRef]
- Licheri, F.; Puddu, P.; Cambuli, F.; Ghisu, T. Experimental Investigation on a Speed Controlled Wells Turbine for Wave Energy Conversion. In Proceedings of the International Conference on Offshore Mechanics and Arctic Engineering, Hamburg, Germany, 5–10 June 2022; Volume 8: Ocean Renewable Energy, p. V008T09A077. [Google Scholar] [CrossRef]
- Gato, L.M.C.; de, O. Falcão, A.F. Aerodynamics of the wells turbine: Control by swinging rotor-blades. Int. J. Mech. Sci. 1989, 31, 425–434. [Google Scholar] [CrossRef]
- Gato, L.M.C.; Eça, L.R.C.; de, O. Falcão, A.F. Performance of the Wells Turbine With Variable Pitch Rotor Blades. J. Energy Resour. Technol. 1991, 113, 141–146. [Google Scholar] [CrossRef]
- Inoue, M.; Kaneko, K.; Setoguchi, T.; Hamakawa, H. Air turbine with self-pitch-controlled blades for wave power generator (estimation of performance by model testing). JSME Int. J. Ser. B: Fluids Therm. Eng. 1989, 32, 19–24. [Google Scholar] [CrossRef][Green Version]
- Kim, T.; Setoguchi, T.; Takao, M.; Kaneko, K.; Santhakumar, S. Study of turbine with self-pitch-controlled blades for wave energy conversion. Int. J. Therm. Sci. 2002, 41, 101–107. [Google Scholar] [CrossRef]
- Tease, W.K. Dynamic Response of a Variable Pitch Wells Turbine Report; Turbine Department Wavegen: Inverness, Scotland, 2007. [Google Scholar]
- Setoguchi, T.; Kaneko, K.; Takao, M.; Inoue, M. Air turbine with self-pitch-controlled blades for wave energy conversion. Int. J. Offshore Polar Eng. 1996, 7, 70–74. [Google Scholar]
- Licheri, F.; Ghisu, T.; Cambuli, F.; Puddu, P. Experimental characterization of a variable-pitch Wells turbine. J. Phys. Conf. Ser. 2024, 2893, 012131. [Google Scholar] [CrossRef]
- Licheri, F.; Climan, A.; Puddu, P.; Cambuli, F.; Ghisu, T. Numerical Study of a Wells Turbine with Variable Pitch Rotor Blades. Energy Procedia 2018, 148, 511–518. [Google Scholar] [CrossRef]
Disclaimer/Publisher’s Note: The statements, opinions and data contained in all publications are solely those of the individual author(s) and contributor(s) and not of MDPI and/or the editor(s). MDPI and/or the editor(s) disclaim responsibility for any injury to people or property resulting from any ideas, methods, instructions or products referred to in the content. |
© 2025 by the authors. Licensee MDPI, Basel, Switzerland. This article is an open access article distributed under the terms and conditions of the Creative Commons Attribution (CC BY) license (https://creativecommons.org/licenses/by/4.0/).