Abstract
System operators (SOs) manage power supply, focusing on risk management. In small emerging economies, proactive risk management is crucial as major disruptions require SOs to redirect resources into recovery efforts. Therefore, SOs prioritize risk reduction, proactively minimizing the possibility of major disruption to ensure the industry’s long-term advancement. However, SOs frequently focus on residual risk mitigation while ignoring their exposure to inherent risk. This study investigated the inherent risks associated with power supply management using the SO’s operations and pertinent third parties. It used a seasonal multivariate strategy to identify risk factors, create univariate distribution models, and generate multivariate distributions using the copula method. Joint risk exposure was calculated using different percentile metrics for each scenario, allowing for a comparison of exposure levels. The study found that risk variables can sometimes reinforce or offset each other, impacting exposure behaviour. Exposure levels indicate periods of increased or decreased exposure to risk variables. Copula-modelled interdependencies captured larger exposure levels but had lower unit likelihoods, presenting less conservative exposure forecasts for SO managers. Case 1 exhibited the highest exposure levels in the early dry season (0.237 and 0.179), while case 2 showed peak exposure levels in the late wet season (1.009 and 0.948), along with cases 3 (0.977 and 0.908) and 4 (0.950 and 0.879).
1. Introduction
System operators (SOs) [1] oversee power supply management, including considerations of risk. Effective risk management enables SOs to make informed decisions on power supply [2]. In small emerging economies, proactive risk management is a top priority. This is because major disruption events require SOs to re-direct a significant portion of their resources into recovery efforts [3]. The short-term redirection of resources delay medium- and long-term advancement for the power industry. Consequently, SOs in small emerging economies prioritize risk reduction, thereby proactively minimizing the possibility of a major disruption.
Renewable energy (RE) technologies have increased the focus of SOs on risk management. SOs are concerned with the emerging threats from these technologies. For example, Wang, Rousis, and Strbac’s [4] study on improving power system resilience using distributed energy resources (DERs) found that interconnectivity with DERs creates new challenges for restoring power to an area after an outage.
Changes in the natural environment have also increased SOs’ focus on risk management [5,6,7,8]. In Qui et al.’s [7] work on water reservoirs, the authors showed that the effects of the warming climate led to greater uncertainty of the hydrological state of water. The uncertainties created new challenges for the existing manner in which water resources are managed for power generation, flood management, and environmental protection.
The discipline of power supply tends to focus on residual risks, but this accounts for only a subset of risk [9]. In contrast, inherent risk encapsulates the amount of risk that exists prior to the implementation of routine controls [9,10]. Residual risk controls are protective, while inherent risk controls are preventative [11]. The distinction between residual and inherent risks remains largely unaddressed in power supply management. Consequently, an abundance of methodologies and tools, such as unit commitment (UC) optimization [1,12], has emerged to target residual risks and influenced a bias of SOs towards protective controls.
Researchers in other technical fields have highlighted similar shortcomings. In Bachev’s [13] analysis of risk management in the agri-food industry, the author identified that a predominant focus on technological tools in technical industries have limited the scope of risk analyses. Technical industries have largely ignored risk based on managerial decision-making. In practice, managerial decisions that depend on factors like the regulatory condition, mode of transaction (via markets, public resources. etc.), and human aspects (resource mismanagement, ignorance) carry highly consequential risks [13]. Understanding inherent risks would help SOs to extend their approaches to preventative controls [11]. However, the lack of research on inherent risks associated with power supply management has created a critical gap in this field.
The primary goal of SOs is to ensure the availability of sufficient quantities of supply to meet demand [14]. However, layered on this fundamental goal (to match power supply with demand) are sub-objectives to allocate and schedule power supply to achieve the lowest possible cost, maintain high power quality, and prioritize renewable or clean energy sources [15]. In addition, power supply sources vary in technology type. This means that SOs must remain attentive to how the respective constraints of the differing sources interact with each other [12]. Ultimately, the decisions of SOs to reduce events of unmet demand and unwanted consequences associated with daily scheduling and allocation evolved primarily from managing residual risk. Together, inherent and residual risk form the SO’s complete risk profile; however, based on the literature reviewed, inherent risk has assumed a secondary status in power supply risk management.
While this study focused on SOs, it recognized that much of an SO’s operation relies on third parties. SOs procure power that is generated by various external suppliers. This is a critical transaction that has introduced a highly interconnected power input–output relationship between SOs and third-party suppliers [10]. This means that SOs also must be attentive to the inherent risks faced by third-party suppliers in addition to the SO’s inherent risks. SOs should decide whether the combined inherent risks of their operation and that of relevant third parties are material to warrant mitigating actions. To do so, SOs require reliable information and effective tools to identify threats and evaluate the levels of exposure which offer insights on preventative control.
This study aimed to fill the identified gap by developing a methodology based on a novel conceptual framework to investigate inherent risks associated with power supply management based on the operations of the SO and relevant third parties. The conceptual framework was developed to offer a methodological approach for SOs to identify, quantify, and approximate the inherent-type risks via processes of qualitative and quantitative synthesis. Two primary objectives were defined, namely to (i) identify inherent risk factors and variables to appropriately represent power supply-related exposures and to (ii) evaluate the SO’s level of exposure from these risk factors. Additionally, the conceptual framework offers a universal methodology, which can be adjusted to different jurisdictions, and has been examined in this paper through a case study of Belize.
To achieve objective (i), inherent risk factors were qualitatively synthesized based on SO and relevant third-party operations. To achieve objective (ii), a multivariate analysis was undertaken to measure the exposure level of power supply management in Belize. Variables were selected to represent risk factors. Descriptive statistics were calculated to highlight variability and distribution frequency. Univariate distribution models were developed for each risk factor. Lastly, the copula method was adopted to build multivariate risk distributions per season for four scenarios. A joint exposure level was calculated at varying percentiles for each scenario, allowing for a comparison of exposure under both conditions.
The remainder of this research paper is organized into a literature review with the background of the study problem, the related literature and this study’s conceptual framework, the methodology, the results and discussion, and lastly, the conclusion outlining the study’s limitations and practical implications.
2. Literature Review
2.1. Background of the Case Study
Research in power supply risk management often focuses on residual risks, neglecting inherent risks. This results in methodologies focusing on protective controls and largely ignoring preventative controls. This study used the case of Belize, a country that exhibits a scarcity in the published literature, to assess the problem.
At the centre of power supply management is the power mix system, which comprises the collection of sources used to generate electricity [16]. Figure 1 maps Belize’s power mix system by technology type and estimated average percentage supply contribution to the power grid. Peak demand was roughly 107 MW, while the total installed capacity was at 172.8 MW [17].
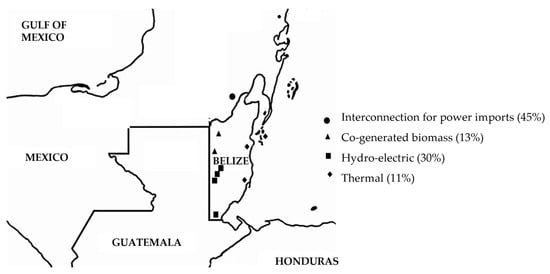
Figure 1.
This figure provides a map of Belize’s power mix system by technology type and their average percentage supply to the power grid, calculated based on the data provided for the analysis of this study, as outlined in Section 3.2. Adopted from [18].
Belize’s SO oversees the management of all supply sources, with the principal ones being hydroelectricity and co-generated biomass (30% and 13% aggregated average per annum, respectively). Hydroelectricity and co-generated biomass supplies are centralized, privately owned facilities located in the west and north of the country. Belize’s revised nationally determined contributions (NDCs) aim to increase the RE share of electricity supply to 85% by 2030 [18]. Currently, local supply from these renewables was supplemented by Mexican electricity imports with purchases on an hourly basis [19]. Electricity supply imports account for a relatively large portion of Belize’s average annual supply (45%), as it presents a competitive least-cost option with respect to local supply options. Lastly, thermal sources are integrated in the central and southern region of the country, accounting for 11%, on average, of total electricity supply. In early 2024, consumer demand for electricity exceeded power supply capability, so the SO in Belize performed a series of rotating outages from one area to the next to reduce demand on the power grid. Rotating outages were used to purposively balance power demand with supply to avoid system overload, which would lead to an uncontrollable outage. Rotating outages were also implemented in early 2011. Essentially, rotating outages could signal unexpected shifts in the managed levels of residual risks and necessitate a deeper evaluation of the inherent risks to warrant a useful tool, as proposed in this study.
2.2. Residual Versus Inherent Risk Contextualized for the Operations of an SO
The SO’s primary goal is to ensure adequate quantities of electricity supply to meet demand. SOs purchase power from a number of suppliers on an hourly basis and schedule an allocated quantity per supplier each hour [15]. To achieve their goal, SOs set operational objectives, summarized as follows:
- The most widely discussed is to schedule and allocate at the lowest possible cost and maintain the affordability of power for consumers. The energy industry uses the term ‘merit order’ [12] to describe the sequence by which power supply is allocated and scheduled on an economic basis like lowest cost.
- Scheduling and allocating to achieve high power quality [3]. High power quality means the combined supply remains steady and within prescribed voltage, frequency, and waveform standards [20]. By maintaining high power quality, SOs also ascertain compatibility with the electrical devices of consumers. Poor power quality can cause devices to malfunction.
- The most novel is to prioritize renewable and clean energy sources. SOs incorporate climate goals to reduce sources, like fossil fuels and coal, which contribute to greenhouse gasses (GHGs) or other major pollutants. Notably, variable renewable energy (VRE) is prioritized in the merit order, having zero marginal cost [21].
Supply sources have varying constraints, and SOs must manage a mix of technologies simultaneously. For example, solar power supply is subject to weather disruption [22]. Assuming no or limited storage, cloudy periods reduce the amount of electricity solar facilities can supply. Similarly, hydropower is constrained by weather conditions, though on a longer timescale. During periods of low rainfall or drought, power supply can significantly decrease [6]. In turn, during periods of heavy rainfall, SOs can be required to maximize hydropower output to avoid reservoir spillage. Thermal facilities are flexible in that they can be turned on and off when required [22]. However, if the heat rate of thermal power plants decreases below its optimal operating range, the cost to generate electricity increases below a specified output [23]. SOs remain attentive to how constraints of the various sources interact. For example, power generated from biomass can experience large fluctuations due to natural inconsistencies in its feedstock—the organic material used as fuel. SOs can utilize a flexible alternative source, like thermal or large hydro, in conjunction with biomass supply to counter the effect of fluctuations on the power grid.
SOs seek to reduce chances of unmet demand and unwanted consequences on affordability, quality, and the environment. However, the daily scheduling and allocation of power supply is a form of residual risk management that ignores inherent risks. As shown in the biomass example immediately above, SOs can respond to threats (like fluctuations) using in-place measures (such as supplementary flexible generation) in an established process (day-to-day scheduling and allocation). Simply put, each hour, the SO engages in a repetitive, ongoing process of identifying, assessing, and controlling the threats to power supply. Unit commitment (UC) optimization techniques [12,24,25] have been developed to address the day-to-day residual risks of supply management. These deterministic techniques model a system of various suppliers, the technical and economic constraints, and define either a single or multiple objectives to solve for an optimal solution. Such a solution, or model output, is an optimized scheduled allocation of power supply for each supplier.
SOs often focus on residual risk because corresponding measures can readily be established in daily routine. For example, SOs can regularly adjust the spinning reserve (the amount of extra power supply held to respond quickly when another supplier fails unexpectedly) [1]. In modern power systems, SOs rely on predictive models to determine possible shortfalls from VRE, like solar power supply, to proactively adjust spinning reserves [1,12]. This is yet another control response around the residual risk of VRE supply shortfalls, with no obvious consideration to inherent risk.
This study recognizes the importance of residual risk management. The SO’s responses during the scheduling and allocation process represent a robust residual risk management mechanism. In this light, because residual risk management has the benefit of routine controls, residual risk is less likely to create severe problems. However, residual risk accounts for only a subset of risk [26,27].
Unlike residual risk, inherent risk reflects the level of risk prior to implementing routine controls [27]. Inherent risk influences effective control measures for SOs to achieve its primary goal. The SO’s fundamental goal is ensuring sufficient quantities of supply to meet electricity demand. SOs devise controls, like scheduling and allocation and spinning reserves, to minimize the possibility of not achieving this goal. Therefore, SOs are simply left with residual risk to manage day-to-day.
Together, inherent and residual risk form the SO’s complete risk profile. Yet, based on the availability of the literature, inherent risk is treated as secondary in power supply risk management. SOs might assert that evidencing stable, quality, and affordable supply equates to low inherent risk. However, disruption occurs, and power outages are recorded in advanced systems when residual risk is managed effectively. Consequently, in the current study, the focus was on developing a tool to strengthen the management of inherent risk, which appeared to receive much less focus than residual risk in power supply systems in developing economies.
Another support for additional studies on inherent risk is that residual risk controls are protective, while inherent risk controls are preventative [27], and the two sets of controls can serve complementary roles. For example, hydropower is the largest and most mature source of renewable electricity [6]. SOs harness power by managing the flow of water that passes through hydroelectric turbines from a river. During seasons with low precipitation, SOs can regulate the flow of water such that a stable stream is maintained upstream and downstream of the powerhouse. This response presents a temporary protective control to safeguard against dangerously low stream levels.
In contrast, the warming climate increases extreme weather events [28]. Higher frequencies of droughts, dry spells, and high temperatures affect the basic hydrology of rivers [6]. If the amount of water in the stream is significantly reduced due to the impact of the warming climate, simply regulating flow will not be sufficiently effective. Instead, SOs can decide on preventative controls that could better serve power supply. For instance, existing hydropower infrastructure can largely be utilized for pumped storage services to capture surplus electricity from VRE [1,29]. This response serves two controls. First, hydropower’s main role is converted from power supply to power storage. This means that while warming climate impacts on hydrology will persist, its ability to influence supply will significantly lessen. Second, SOs reduce the amount of power supply surplus from VRE that would have otherwise been wasted.
SOs need to decide if the inherent risks are substantial enough to warrant their attention. SOs can properly address the uniqueness of inherent risks by implementing preventative controls. Therefore, a tool or methodology, as formulated in this study, to identify threats and evaluate the levels of exposure can be valuable to SOs. Research [2,30] has also demonstrated instances where inherent risk controls require more time and resources to implement than residual risk controls, thereby emphasizing a need for a tool that can identify varying levels of risks for SOs to more appropriately direct the efficient use of resources.
Interestingly, SOs procure power supply and become reliant on third parties. Essentially, the generation of power is outsourced. Therefore, SOs must understand the inherent risks of third parties. For example, through a physical interconnection between the power grids of two or more countries, electricity can be procured from foreign power suppliers [31]. If a foreign power market lacks sufficient controls to manage spikes [32] in electricity prices, a price spike can create unwanted consequences on affordability locally.
As such, it is important for SOs to have a methodology that facilitates evaluating the inherent risks of SOs and their third parties to gain a comprehensive understanding of potentially adverse situations. This current research developed a tool to investigate inherent risks associated with power supply management based on the operations of the SO and relevant third parties. A conceptual framework was devised to develop an appropriate method, as presented in the next section.
2.3. Conceptual Framework
Figure 2 provides a depiction of the conceptual framework applied in this study. The SO was the main actor of the framework. The study conceived that risk which threatens the SO from achieving their objectives is categorized into two types, namely inherent and residual. Risk types were distinguished based on the absence/presence of protective controls. While inherent and residual risk form the complete risk profile of the SO, this work focused on the assessment of inherent risk. Hence, risk in the absence of protective controls represented the study’s independent variable, and the exposure level represented the study’s dependent variable.
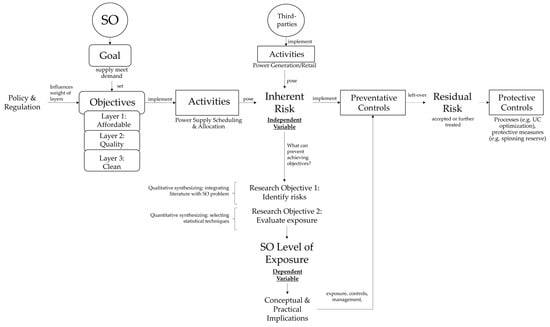
Figure 2.
This figure provides the conceptual framework devised and utilized in this study.
The goal and objectives of the SO represented control variables that remained constant. However, policy and regulation could influence the weighting of the importance placed on each objective layer. For example, recently, the Government of Belize committed to an increased share of 85% RE in electricity supply by 2030 in the nationally determined contributions (NDCs) [33]. While Belize’s SO prioritized affordability (layer 1) and quality (layer 2) ahead of environmental friendliness (layer 3), this hierarchy is prone to changes in the future to meet the NDC goal. For the purpose of simplicity, the methodology was not concerned with the weighting of each objective. Rather, risks that could possibly prevent the SO from achieving all objectives were equally considered.
Activities represented moderating variables that could influence the relationship between the inherent risk (independent variable) and exposure level (dependent variable). Based on the reviewed literature, the activities of third parties relevant to the inherent risk of the SO were also identified as moderating variables. Relevant third-party activities included power generation or the re-selling of power through retail markets to the SO.
This study used qualitative and quantitative synthesis to establish the relationship between inherent risk and the exposure level. In qualitative synthesis, inherent risk factors were identified. Appropriate variables were selected as indicators that can predict changes in exposure for the SO. In quantitative synthesis, the study selected statistical techniques fit to measure the level of exposure. Synthesizing relied on lessons acquired from the literature and an understanding of the activities of the SO and third parties.
Statistical findings were internally validated based on model validation. Their extended conceptual and practical implications were externally validated by comparing findings with information available on the practical setting from case-specific documentation, including power purchase agreements (PPAs) [34,35,36,37] and SO annual reports [17,38,39,40,41]. As prior discussed, the main outcomes of the study supplied implications on preventative control measures.
3. Materials and Methods
Exposure level, this study’s dependent variable, is a measure of how vulnerable the SO’s system is to the inherent risk factors. As with traditional risk analyses, the exposure level thus contends with the probability and potential severity of the risk event occurring. Prior risk analyses on management in energy-related sectors provided theoretical support [7,8,12]. One key insight highlighted the exposure level as a time-dependent variable. Consequently, this study reviewed and established a study design that used probability-based methods to examine seasonal scenarios for the risk factors that influenced the exposure level.
The following sections outline (i) the raw data collected that were used to develop the variables representing inherent risk factors, (ii) the qualitative and quantitative synthesis process used to identify, quantify, and represent the inherent risks appropriate for the real-world conditions of Belize’s SO, and (iii) the statistical techniques, primarily various forms of probability distribution modelling, applied to assess the relationship between the inherent risk factors and degree of exposure.
3.1. Data
The study utilized five time-series datasets from 1 January 2018 to 31 December 2022, each presented in hourly time steps, as detailed in Table 1.

Table 1.
This table contains the list and descriptions of datasets that were collected and utilized in the analysis of this study.
The study collected forecasted (DFi) and actual (DAi) aggregate grid supply for 43,824 hourly intervals of the sample period, as well as hourly electricity supplied by hydroelectric and biomass co-generation facilities (SPi). Secondary data on the maximum rated capacities of these facilities were also collected. The study also collected the price for purchasing electricity imports from the day-ahead forward market (FPi) and the spot market (SPi) for real-time purchase. The forward and spot pricing of power imports accounted for unit cost variability of the system’s power supply, as local power supply was regulated by annualized fixed-cost pricing.
Datasets were shared by Belize Electricity Limited (the utility) after receiving a comprehensive description of the quantitative assessment for this research (data not publicly available). The collected data were analyzed for gaps and irregularities; however, no gaps or abnormalities were found.
3.2. Study Design
3.2.1. Objective 1—Qualitative Synthesis of Inherent Risk Factors
A total of four risk factors were considered in relation to its effect on the vulnerability of the power supply. A variable was assigned and defined for each risk factor, as per Table 2.
Table 2.
This table contains the definition of the variables that was used to assess each supply management risk factor and their generalized inferences as applied by this study.
A factor (prediction error, ‘PE’) was included to account for the quantity and pricing uncertainties that occur as a result of the manager’s capacity to predict exactly what the total supply requirements will be hour-by-hour. Understanding the importance of forecasting accuracy [42,43], this study used the difference between the predicted and actual total grid power supply requirement to calculate this risk.
The warming climate presented a significant risk to water availability for hydropower production and crop availability for co-generated biomass. This analysis used the inverse of renewable energy plant availability, focusing on the variability of supply output. This approach holistically captures ex ante ecological conditions, enacted management protocols for renewable energy facilities, and the scheduling and allocation decisions by the SO manager, unlike previous studies that primarily focused on purely ecological or commodity variables [5,7].
Thirdly, the study looked at risk of total power demand possibly exceeding the capacity limits of power supply (peaking, ‘PK’). Extreme demand conditions tend to reflect concerns of a quantity shortage of supply, as well as potential price spikes or fluctuations in price [44,45] as less efficient or costly generation is operated to meet the supply requirement and the congestion of the physical infrastructure increases [46]. To measure PK, the study relied on the difference between the actual total grid power supply and peak supply.
Finally, a factor (FP) was incorporated to reflect a major concern of an SO manager, which is that the cost of sourcing power may exceed their ability to recoup costs. Economic risk is extensively addressed by scholars that specialize on trading in liberalized power markets [47,48,49]. To measure the potential severity of this risk, the study relied on the difference between the spot and forward price of electricity imports to reflect the most significant cost uncertainty tied to power supply.
Risk factors were addressed using four seasonal categories, namely early dry (December–February), late dry (March–May), early wet (June–August), and late wet (September–November) seasons. The seasonal allocation served to take into consideration the different characteristics of inflow and discharge associated with hydropower, as carried out by past authors who focused on power–water–ecology interdependencies, like those of [7]. In this study, the seasonal allocation was also applicable for differentiating between in-crop and out-of-crop periods for the biomass sources.
3.2.2. Object 2—Quantitative Assessment of Exposure Level
Figure 3 provides a depiction of the quantitative assessment synthesized to measure the exposure level.
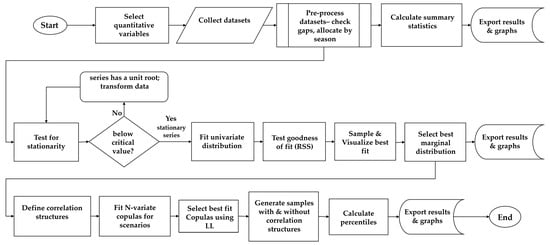
Figure 3.
This figure depicts the steps of the quantitative assessment synthesized in this study to measure the exposure level of Belize’s SO.
Time-series datasets were collected and pre-processed per season for each variable. Data were categorized into four seasons, which were early dry (December–February), late dry (March–May), early wet (June–August), and late wet (September–November). Descriptive statistics were calculated to highlight the variability and distribution frequency of the datasets for each variable per season.
Parametric estimation was used to fit theoretical distributions. This process used the datasets of variables outlined in Table 2 to approximate the parameters of a pre-defined probability distribution function. This study used probability distribution functions as the primary mathematical expressions to describe the probability of the inherent risk factor taking on a specific set of variable values. Based on the continuity of the data type explored in this study, distribution functions which have been applied to model a wide range of risk phenomena involving continuous variables were selected to provide pre-defined functions for parameter fitting (Appendix A, Table A1). Each variable was modelled per season, relying on the optimal marginal distributions to draw data-driven conclusions on individual variables. Parameter estimations were validated by statistical bootstrapping. The bootstrapping procedure generated 10,000 iterative re-samples of the original variable dataset and compared the bootstrapped samples and empirical data using an RSS score (residual sum of squares). The marginal distribution of each variable was selected based on the lowest RSS score, as detailed in the subsequent section.
Variables were analyzed using univariate (each variable described individually within its own probability space) and joint distribution (statistical description of two or more risk variables within a single probability space) sampling to compute the relative exposure based on percentiles. A total of 10,000 random re-samples were generated from each variable’s optimal marginal distributions. Theoretical Gaussian and t-copulas were used to define a correlation structure for multivariate distributions. Joint distributions were fitted and assessed per season. The copula that best modelled the multivariate distribution was determined using log-likelihood as a fitness measure.
Random samples (10,000) were generated from the copula and re-transformed. The normalized risk index was calculated at varying percentiles of the re-transformed data, thereby incorporating correlation structures between variables. For comparison, percentiles were similarly computed for samples from the marginal distributions. Equal weightings were assumed for each variable in the ‘n’-dimension distribution. Findings on the exposure level were compared for each season.
3.3. Description of Statistical Analyses Applied in This Study
3.3.1. Summary Statistics and Marginal Distribution
A few commonly utilized descriptive statistics were generated for the seasonal datasets, including the mean, minimum, maximum, skew and standard deviation. Prior to developing the distribution models, datasets were examined for stationarity using the augmented Dickey–Fuller (ADF) test [38] to determine if there was a unit root, based on likelihood ratio statistics to reject the null hypothesis of non-stationarity in time-series [39].
The study used a probability distribution to describe each variable for a specific season, hence repeating the process 16 times (4 variables for 4 seasons). This research examined a variety of variables and their interdependencies. Previous studies have used distribution types like GEV and log-normal for hydrological evaluations [7,50]. In Ji et al.’s [51] study involving agricultural commodities, the authors applied skewed Student-t density distributions to account for asymmetric features in comparable data. This research built on previous studies that have used similar distributions for ecological assessments, agricultural commodities, and power markets.
The study selected 11 commonly applied density distributions (Appendix A Table A1). Optimal parameters were determined by minimizing the residual sum of squares (RSS). The RSS represented the deviation between predicted and empirical data values, as defined in Equation (1).
where yi is the value of the variable to be predicted, xi is the explanatory variable, and f(xi) is the predicted value of yi.
The RSS was used as the main score to rank the best theoretical distribution for empirical variables. To validate the ranking, bootstrapping was applied to resample the fitted distribution and compare with the empirical values. This step was repeated 10,000 times, and computations were performed in Python using the ‘distfit’ version 1.8 [52] package for the probability density fitting of univariate distributions. Since a greater quantity of samples (>10,000) did not show better optimal log-likelihoods (LLs), this was regarded as the minimum sample.
3.3.2. Joint Distributions Based on Copula Technique
To support specific insights as it relates to the overview of supply management, we considered the following bi-variate, tri-variate, and multivariate cases. The variables modelled in each case, their expected insights on supply management, and the level of dimension of the required joint distribution model (‘n’) are outlined in Table 3.
Table 3.
This table outlines the interdependencies that were analyzed using the copula technique in this study to support various inferences on the management of Belize’s power supply.
Gaussian and t-copula were used to generate multivariate distributions for each season, demonstrating their ease of application in describing multivariate dependency among variables. This proved useful as the cases increased in dimensions, with the ‘n’-dimension as large as 4, as was in the case in case 4. According to Sklar’s theorem [53], multivariate distributions can be expressed in terms of their univariate marginal functions. In -dimensions, for , an n-dimensional distribution function for n-variates, , with marginal , there exists an n-copula, , such that [54]
For the Gaussian copula, , the main parameter is a covariance matrix, , that defines the model’s dependence structure between variables. Its theoretical probability density function is defined by Equation (3) [55].
where represents the mean and denotes the number of variables (rank of model). For t-copula, CT, the main parameter is a covariance matrix, also referred to as a shape matrix, , and the degrees of freedom, . Its theoretical probability density function is defined by Equation (4) [56].
where represents the mean, denotes the number of variables, and denotes Euler’s gamma function.
A theoretical Gaussian and t-copula was fitted to each case per season, and the model which best represented the data was selected based on the estimated log-likelihood (LL). Random variate samples of 10,000 were generated from the selected copula and transformed from uniform variables to their prior defined optimal marginals using the inverse of their respective cumulative density functions (CDFs). All computations were carried-out in Python using scipy.stats version 1.14.0 [57].
Each case was scored based on varying percentiles of the distribution, estimated in increments of 5 from 70th to 95th. Percentiles provided a widely understood statistical metric for scoring the distributions. The percentile at a level of a cumulative distribution function of the probability measure was defined by the value x that met the conditions in Equation (5) [58].
A similar principle is the traditional value at risk (VaR) used in financial applications, which is a typical percentile-based score generated over a given period and for a given probability level [59,60,61]. For example, a generalized inference of the VaR at the 95th percentile models the possible loss or deficits that may occur in a 1 in 20 worst-case scenario. However, in this analysis, the percentile returns a multivariate risk index between 0 and 1. As its variables, this score was dimensionless, and percentiles were computed under the assumption that the variables were of equal weighting.
Percentile scores were used to compare case-by-case risk and its variation across seasons, with and without incorporating the correlation structure between variables. The copula technique was used to calculate percentiles for case variables, allowing for a comparison of perceived risk increases or decreases when considering the interdependencies of variables. The analysis relied on sets of contour plots to assist with the visualization of the bi-variate and multivariate cases in 2-dimensional space.
4. Results and Discussion
4.1. Summary Statistics
The time-series datasets for each variable were pre-processed and allocated seasonally, as presented in Figure 4a–d. Due to the use of previously unassessed data, it was challenging to compare numerical findings with prior studies. However, data patterns and descriptive statistics were compared with expected behaviour across different seasonal conditions, as per the literature.
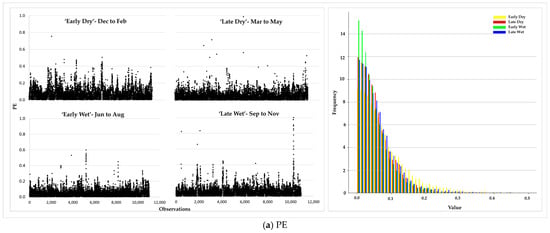
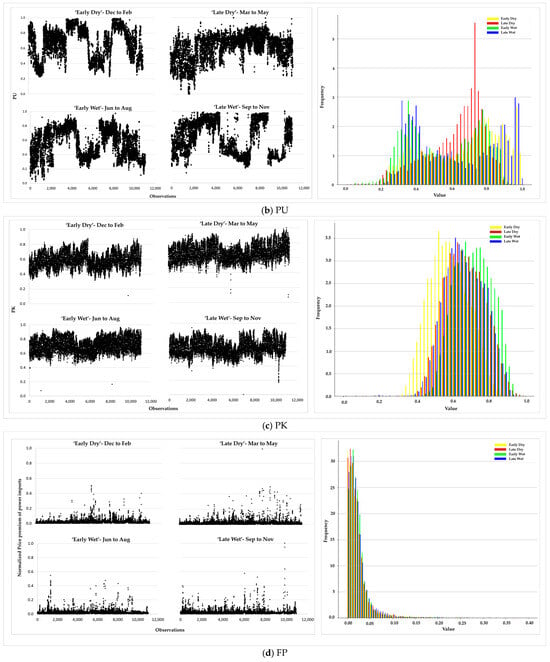
Figure 4.
This figure depicts the scatter plots for each risk variable per season. The sample includes hourly observations for each variable from 2018 to 2022. Risk variables are expressed in percentages.
The data showed varying shapes per variable, suggesting different optimal probability distributions. However, the shape per season was relatively consistent, except for the unavailability factor of local renewable plants (PU). This inconsistency in intra-seasonal patterns suggested that PU can account for the greatest shifts in risk across seasons in supply management. PU skewed towards the right end of the normalized scale, indicating that it can also account for larger effects on the system.
Overall, none of the variables exhibited symmetry in these preliminary visualizations, suggesting that the optimal distributions possessed asymmetric properties. This suggested that simple normal distributions may not be suitable for marginal distributions. Table 4a–d provides further insight into individual risk factors.
Table 4.
This table provides the summary statistics for each risk variable per season. The sample includes hourly observations for each variable from 2018 to 2022. Risk variables are expressed in percentages.
The system’s supply requirement (PE) forecasting accuracy was highest during the early dry season (0.077), with the highest absolute error occurring in the late wet season, followed by the late dry season (0.985). The distribution of PE showed right skewness and kurtosis, with the late wet season showing the highest positive skewness (3.977) and the largest kurtosis (36.528), suggesting higher probabilities of large prediction inaccuracies during the late dry period.
The study found that PE’s intra-seasonal variations were high, amounting to as high as 93% of the corresponding seasonal mean value during the dry season and exceeding the mean value during wet seasons, indicating a volatile accuracy in predicting demand requirements and, in turn, the quantity and price risks tied to this factor.
The risks associated with supply shortages due to ecological and commodity interdependencies (PU) were highest during the dry seasons (0.677 and 0.624 for early and late seasons, respectively). Surprisingly, the risk level was similar in the late wet season, despite hydroelectric facilities’ anticipated higher capacity reducing this risk factor during the out-of-crop season for lesser capacity biomass supply.
The distribution of PU showed greater symmetry and thinner tails than PE, with low intra-seasonal variation across all seasons. The lowest deviation was observed in the late dry season (0.161), likely due to supply constraints tied to ecological management reflecting a management protocol to conserve water for availability during the driest period of the year.
This study found that the late dry season had the highest peak supply requirement, while the early wet season had the highest average requirement. The PK variable showed the least skew and asymmetry, suggesting the lowest probability of extreme lows or highs. Intra-seasonal variations were relatively consistent across all four seasons, indicating that a single theoretical distribution may be suitable for this variable across all seasons.
The mean values of seasonal premiums were fairly similar (between 0.023 and 0.025), with the largest premiums observed in the late wet season and the late dry season (0.989). The skew and kurtosis of the FP were larger in the late dry and wet seasons, suggesting that extreme price spikes associated with FP were more likely to occur during these periods. Overall, FP showed high positive skewness and heavy asymmetric tailing, indicating that spot or real-time purchase prices were generally larger than forward prices. This finding held economic implications, as any unforeseen adjustments to supply requirements were subject to more expensive real-time pricing.
4.2. Marginal Distributions—Parameter Estimation and Fitting
The ADF test was applied to test for randomness and stationarity. The results are summarized in Table 5.
Table 5.
This table provides the summarized results of the augmented Dickey–Fuller (ADF) test performed on each dataset prior to distribution fitting to determine randomness and stationarity, where (**) and (*) highlight that the test statistic had an observed significance at the 1% and 5% level based on critical values.
The datasets were found to be random and stationary, making them suitable for statistical analysis and fitting of probability distributions. A process of curve fitting, parameter estimation, and scoring was conducted for each variable per season.
Appendix A Table A2 presents the scores and ranking of marginal distribution models for each variable per season, with probability density functions and cumulative distribution functions plotted alongside empirical data provided in Figure 5a–d. Based on scoring and visualization, the selected marginal distribution models and their parameters were identified, as summarized in Table 6.
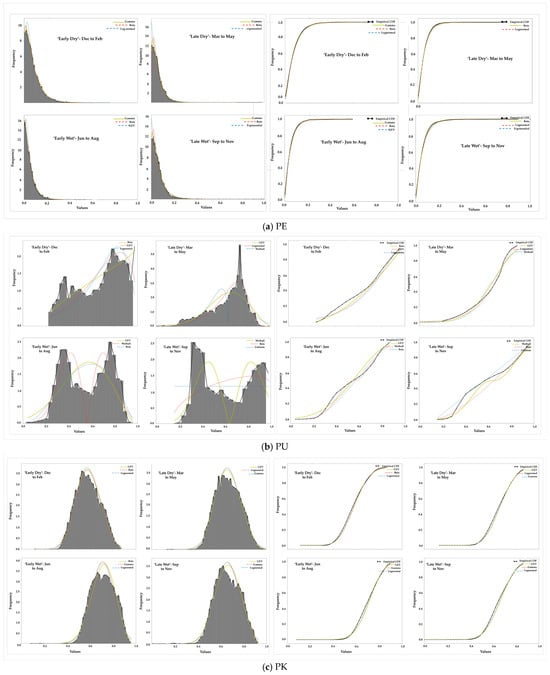
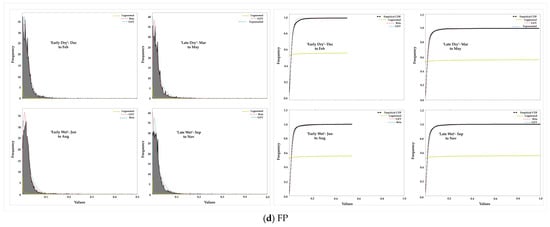
Figure 5.
This figure depicts the PDF and CDF plots of the top ranked distribution fits with the histogram (in bars) of the empirical data for each risk variable per season, based on RSS scoring. The yellow line plots the top ranked fit, the dotted-red line plots the second top ranked fit, and the dotted-blue line plots the third top ranked fit.
Table 6.
This table provides the results of parameter estimation of the selected marginal distributions for each variable per season, where ‘a’ and ‘b’ reflect the shape parameters of beta distributions, ‘c’ reflects the shape parameter of all other distribution types, ‘loc’ is the locational parameter, and ‘scale’ is the scale of the fit.
The study found that a single distribution was not the best fit for all variables. Though preliminary visualizations suggested that a single distribution could describe PE, PK, and FP, only PE was best described by a single marginal distribution (beta).
The distributions of PU reflecting the level of unavailability of Belize’s renewable power supply showed the greatest variability, with a beta profile best describing its behaviour during the early dry season, log-gamma during the late dry season, and Weibull during the wet seasons. This was somewhat expected, as seasonality significantly impacts the hydropower-generating capacity in river basins, requiring the consideration of temperature, rainfall, evaporation, soil moisture, and runoff under changing conditions [6].
The relationship between optimal marginal distribution and data properties was not clear. GEV distributions were well suited for higher asymmetries and heavy tailing, suggesting its appropriateness for data with greater extremities [5]. However, GEV also best described three of the four seasons of PK with low skew and light negative tailing. Similarly, log-normal distributions that are known to be more suitable for positive values of kurtosis and skewness performed poorly for all seasons of FP and received an average ranking for PE.
In contrast, the optimal marginal distribution of a risk factor was influenced by the nature of the risk factor. For instance, PE, an actor-related variable, was best modelled by a beta distribution. FP, an economic variable [47,62,63], and PK, a market variable reflecting Belize’s grid power consumption pattern, were largely described by GEV. On the other hand, the main generalization we were able to draw on seasonal conditions, including ecological and commodity shifts, was that these variables can result in vastly different distributions across time intervals as short as 3 months.
Seasonal behaviour variability among variables offered insights into individual variables and had quantitative implications for risk interdependencies, suggesting the presence of similar shifts in their dependence structures. For example, the likelihood of heavy positive tailing of FP and PE is higher during the late wet season (kurtosis 131.3 and 35.1, respectively) compared to the early dry season (kurtosis 59.7 and 4.3, respectively). By considering the dependence structure of these variables and allowing seasonal conditions to switch, estimation and expectations on tail risk can be improved [7], allowing risk managers to adjust the probabilities and extremities of variables’ effects periodically.
4.3. Joint Distribution Parameter Estimation and Fitting
The copula technique was used to analyze the dependency structure between samples, developing a multivariate probability distribution with uniform marginal probability distributions. The theoretical Gaussian or t-copula was selected based on the LL criterion. The evaluation results are presented in Appendix A Table A3. Below, Table 7 summarizes the selected theoretical copula, correlation matrix, and degrees of freedom for the t-copula.
Table 7.
This table provides a summary of the selected theoretical copula, the correlation matrix, and in the case of the t-copula, degrees of freedom.
The Gaussian copula was found to be the most suitable for 9 out of 16 models, while the t-copula was best for the remaining cases. This was surprising given its limitations in modelling tails and extreme observations [53,54]. The Gaussian performance indicated that dependencies were concentrated in the centre of joint distributions, and extreme values were mostly independent [49]. The t-copula, on the other hand, best defined the multivariate distribution of case 1 during most seasons, indicating significant tail dependencies.
Case 1 found a positive relationship between PE and FP during early dry and late wet seasons (0.008972 and 0.0220, respectively) but an inverse relationship during late dry and early wet seasons (−0.0121 and −0.0087, respectively). The late wet season showed the strongest correlation (0.022082), followed by the late dry season, both exhibiting the heaviest tailing and positive skew. These findings suggested that while the indicated linkages were fairly weak, there was a tendency for the extreme values of PE and FP to occur together. These results hold financial implications, as forecasting inaccuracies were subject to higher spot prices as a result of real-time supply adjustments. However, the inverse correlation of the late dry season revealed that there was a possibility that the resultant exposure reduced as the risk in one variable offsets the risk in the other.
In contrast, PU and PK revealed a positive relationship in all seasons of case 2, indicating a dependence on the degree of unavailability of local renewable supply as the system’s supply requirement increased. This dependency is likely due to the link between electricity supply and demand, where high demand can strain supply resources [42,64].
Yet, the strongest dependency (0.1268) was seen during the late wet season. As per Table 4, the mean values of PK and PU were near average (0.662 and 0.622, respectively). The risk factors were not significantly high during this period, suggesting a possible individual dependence on environmental factors. The previous literature identified that increases in temperature and humidity are linked to peaking [42] and decreases in ecological resources needed for renewable power production [6,65]. Therefore, PU and PK may not be related. Instead, their dependency was defined by environmental conditions—a confounding variable.
Environmental conditions may play a role in confounding variables, as evidenced by the ranking of local renewable energy resources in the merit order of supply. The SO must prioritize scheduling and allocating available resources to minimize waste or the mismanagement of water and biomass [34,36]. This is assuming that RE supply is mainly responsible for the grid’s base load requirement, as it cannot fully meet the grid’s supply requirement (43% on average, see Figure 1). Peaking is less likely to affect supply sources like hydropower and biomass, which are primarily satisfying the grid’s base load. Instead, peaking may influence the utilization of sources used as supply reserves, such as thermal supply (11% on average, see Figure 1) in Belize.
In case 3, PK and PU maintained positive relationships of similar strengths as in case 2 (for example, early dry case 2 was 0.003132, while case 3 was 0.003237) across all seasons except the late wet season, which was defined by an inverse relationship (−0.005044) of considerably lower strength than the late wet season of case 2 (0.1268).
This structure of dependencies presented an interesting potential correlated offset, seeing as PK and FP also exhibited an inverse relationship (−0.003733), while FP positively reinforced PU during the late wet season (0.003792). In contrast, during the late dry season, PK shared a positive association with PU and FP (0.003517 and 0.010746, respectively). Meanwhile, the dependence between PU and FP was negative (−0.010254).
Case 4 expanded the joint distribution model by incorporating all study variables. It revealed a mix of relationships between variables, with positive and negative types varying across seasons. For instance, the early dry season showed the strongest positive linkage between PU and FP (0.021241), changing to an inverse relationship in the late dry (−0.010186) and early wet (−0.011523) seasons before reverting to a weaker positive relationship in the late wet season (0.003792).
This study found that high-dimensional distributions have a complex dependence structure, with intra-seasonal variations in relationship types and strength. Based on the variations observed across the strengths and type of correlation between risk factors from season to season, the dependence structure of high-dimension distributions were complex. This observation highlighted a few key insights about the behaviour of exposure levels. First, the varying relationship types meant that one risk factor might sometimes reinforce or counteract another. In effect, reinforcement can increase the overall degree of exposure. In such instances, the SO’s chances of meeting an undesired occurrence grew when risk variables converged. In contrast, counteractions resulted in the offsetting of risk factors. Offsets showed that the degree of exposure may be reduced. As a result of offsets, the SO’s likelihood of experiencing an undesired occurrence decreased as risk variables coincided.
Second, the resultant level of exposure depended on the strength of the individual factors and their relationship. This meant that while a risk factor can reinforce another risk factor, lower-strength relationships during periods where the risk of an unwanted event occurring for each risk factor is medium-to-low resulted in insignificant shifts to the exposure level. In turn, the SO may deem the result as inconsequential, although their overall exposure to unwanted events increased as a result of the correlation. In such cases, SOs may respond by building on protective controls. In contrast, significant correlations might lead to considerable reinforcing of risk variables. As a consequence, the SO’s exposure level exceeds the calculated combined exposure to risk variables. If the likelihood of undesirable outcomes is substantial, the SO may regard the resulting exposure as significant and choose to take preventative actions. The final steps of the analysis gained a deeper understanding of these interpretations.
4.4. Relative Levels of Exposure per Season and Inferences on Preventative Controls
The analysis used contour plots to visually compare multivariate distributions, presenting the relationship between samples from marginal distributions and those from re-transformed marginal distributions that included copula-modelled dependencies, as shown in Figure 6a–d.
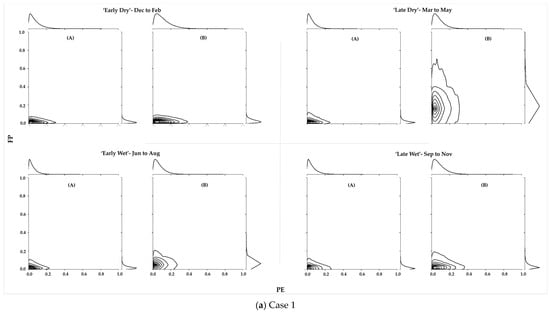
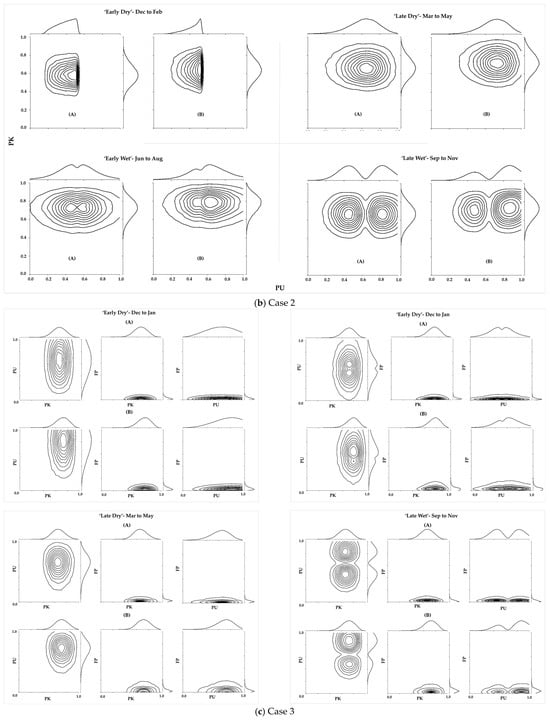
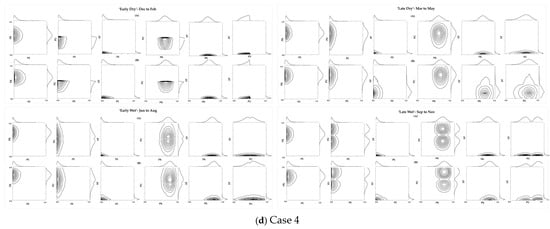
Figure 6.
This figure provides contour plots comparing the multivariate joint distributions, where the correlation structures between variables are (A) not included in the joint modelling and (B) included in the joint modelling for cases 1–4 per season.
Figure 6a provides a visual representation of the relationship between PE and FP, showing side-by-side results with and without the copula-modelled correlation structure. In contrast to the plots without the copula-modelled dependencies, the elongated tailing perpendicular to the x-axis (higher exposure occurrence due to FP) in the case of the copula-modelled late dry season and parallel to the x-axis (higher exposure occurrence due to PE) in the case of the late wet season is shown.
This result suggested that although most likelihoods of incidents were centrally concentrated, extreme values of PE and FP can occur together, especially when reinforcing dependencies are accounted for. The contour planes also showed that the area of exposure widened towards the upper and right end of the plot when interdependencies were considered, indicating that despite the presence of offsets in relationships between variables, the correlated dependencies were generally positive when the copula-modelled interdependencies were considered, thereby reinforcing supply management risk.
The study found that models without copula-modelled dependencies had slightly smaller distances between outer contour spacing, indicating that while copula-modelled interdependencies captured higher exposure levels, their unit likelihoods were less than those in models without interdependencies. As such, an SO manager can interpret the latter as a less conservative representation of the risk level.
Table 8 presents the relative exposure results based on sampled data from marginal distributions and re-transformed marginal distributions of copula modelled dependencies. The measure denotes the exposure not exceeded by levels below the value presented in the chart, allowing for a better comparison of various bounds of risk exposure levels per case and per season.
Table 8.
This table presents the relative exposure effect of systemic risks per case (‘C1’–‘C4’) per season, based on joint distribution percentiles. The copula-modelled correlation structure between variables is not included in the estimations denoted by ‘nc’. Variables were assumed to have equal weighting. Higher levels of exposure are denoted in ‘red’ in the colour gradient, while lower levels are highlighted in ‘green’.
The study compared cases across seasons, based on the 95th and 90th percentiles (representing the exposure level that could arise in the worst 1 in 20 and 1 in 10 situations across a given season); case 1 had the highest exposure level during the early dry season (0.237 and 0.179) and case 2 had the highest exposure level during the late wet season (1.009 and 0.948), along with cases 3 (0.977 and 0.908) and 4 (0.950 and 0.879).
The overall implications for management were that joint exposure due to a lack of local RE and high supply requirement during the wet season were the highest inherent risk, followed by early wet and late dry seasons due to the joint distribution of PU and PK. The early dry season had the lowest inherent risk for supply management. The conceptual and practical implications of the main findings were reinterpreted back to the study’s conceptual framework.
Conceptually, the maximum joint exposure of PK and PU suggested that the greatest inherent risk was posed by shared SO and third-party activity. The practical implication of the share of exposure posed by PK is that there is a lack of implemented control to reduce the electricity consumed during peak demand. This implication proved consistent with the existing operation of Belize’s SO. The SO had not implemented preventative control measures for demand-side management (DSM), such as demand response or energy efficiency (EE) strategies [66]. Thermal generation or additional power imports were used to meet sharp increases in demand by local agriculture and aquaculture industries. Relying on additional power generation in this situation represented a protective control, implying that only the residual risk of peaking was managed.
The share of exposure posed by PU was largely third party-related. The possible unavailability of power generation by local RE suppliers significantly contributed to the inherent risk of the SO. Similarly to PK, the protective controls of PU, including protocols for water management of the existing PPAs, were inadequate in mitigating the inherent risk impact. As previously reviewed, Belize’s SO can decide on preventative control like re-purposing the RE asset [1,29] to reduce the effect climate warming has on third-party RE supply.
Initially, the study predicted the late dry season to have the highest inherent risk. This was because Belize experienced a series of planned load shedding due to supply shortages during the most recent late dry season. This inconsistency was likely due to the challenge of isolating preventative from protective controls in the quantitative synthesis.
The study conceived that risk which threatens the SO from achieving their objectives is categorized into two types, namely inherent and residual. Risk types were distinguished based on the absence/presence of protective controls. From a practical modelling perspective, accounting for the actor response was a challenge. This was because the actor response resulted in tangible controls, as well as intangible controls. For example, the scheduling decisions of hydropower could be influenced by the SO manager’s favourable or unfavourable outlook on the season’s weather conditions, which is an intangible factor that goes beyond the standard management protocols of reservoirs.
The literature has previously highlighted the challenge of quantifying aspects like mismanagement or optimism [13]. Furthermore, while our models neatly categorize management into seasonal groups, it was acknowledged that the actor response may not always align with these boundaries. For example, supply decisions made during the early parts of the year can impact the inherent risks of the late wet season, which contractually occurs at the end of an annual cycle. The methodological approach can be improved by introducing a time-varying supply expectation variable to capture the actor response.
Conversely, including variable dependency in the quantitative synthesis proved valuable. This study found that modelled interdependencies led to higher exposure levels in different seasons. The largest difference was observed in case 4 during the late wet season (0.103), while the smallest difference was observed in case 1 during the late dry season (0.012). This confirms the reinforcing effect of risk factors due to their dependency structures. At the same time, the analysis showed that negative relationships between variables can reduce risk, as seen with case 4’s four-variable model resulting in a lower exposure level than the bi-variate case 2 for all seasons.
It was evident that identifying and selecting risk factors was crucial for quantifying interdependencies. The previous literature suggested that risks can be underestimated due to ignorance of systemic interdependencies. Our results also showed that if risk factors are not comprehensively identified and their dependencies not adequately captured, exposure level can result in overly conservative estimates, resulting in inconsistencies between empirical estimations and field evidence.
5. Conclusions
This study examined inherent risks associated with power supply management based on the operations of the SO and relevant third parties. Two primary objectives were defined, namely to (i) identify inherent risk factors and variables to appropriately represent power supply-related exposures and to (ii) evaluate the SO’s level of exposure from these risk factors.
Its findings aimed to enhance the awareness of interdependence, leading to more informed decisions and investments in preventative risk management control, particularly among small emerging economies. We proposed that by considering interdependencies and the possible coincidences of risk variables, the quantification of risk may reveal a larger potential impact on the power sector.
To fulfil the research objectives, the study developed a seasonal multivariate approach identifying risk factors and selecting variables, developing univariate distribution models for each risk factor, and generating multivariate distributions using the copula method to define the dependency structures for four scenarios. Joint risk exposure was computed based on varied percentile measures for each scenario, allowing for a comparison of exposure levels.
Beta distributions were the most effective way to model the actor-related variable. GEV largely provided suitable descriptions of economic and market characteristics. Meanwhile, the variable extensively impacted by seasonal factors, including ecological and commodity variations, resulted in greatly varying distributions between seasons.
The Gaussian copula was determined to be the best fit for the majority of the models, demonstrating that dependencies were concentrated in the centre of joint distributions and extreme values were mostly independent. However, the t-copula best described case 1’s multivariate distribution during most seasons, showing that the PE-FP joint distribution had large tail dependencies. Joint distributions showed that despite the weak links, extreme values might occur simultaneously.
Essential findings showed that risk factors can sometimes reinforce or offset each other, influencing the behaviour of exposure. In case 1, early dry and late wet seasons showed a reinforcing relationship (PE: 0.008972, FP: 0.0220), while late dry and early wet seasons exhibited an inverse relationship (PE: −0.0121, FP: −0.0087). Case 2 demonstrated the strongest dependency (0.1268) between PK and PU during the late wet season. Case 3 revealed a negative correlation between PK and FP (−0.003733), but FP positively reinforced PU (0.003792). A late dry season saw positive associations of PK with PU (0.003517) and FP (0.010746), while PU and FP were negatively correlated (−0.010254). Case 4 illustrated a complex dependence structure among all variables, with varied intra-seasonal relationships.
This dynamic was observed in exposure levels, revealing periods of increased or decreased exposure to risk factors. Case 1 exhibited the highest exposure levels in the early dry season (0.237 and 0.179), while case 2 showed peak exposure levels in the late wet season (1.009 and 0.948), along with cases 3 (0.977 and 0.908) and 4 (0.950 and 0.879). Copula-modelled interdependencies capture higher exposure levels but have less unit likelihoods, making them a more conservative representation of risk levels for SO managers.
Furthermore, findings suggested that the inherent risk posed by the joint distribution of PK and PU presented the highest inherent risk. These results implied that protective measures were no longer sufficient in mitigating the threats associated with peaking and climate impact on RE power generation. PK mitigation can be considered with a particular focus on the demand-side potential for load shifting or overall load reduction. PU, on the other hand, requires consideration of the supply-side infrastructure investment and maintenance and operation strategies, including excess capacity. Practical implications highlight that preventative controls should be prioritized in the areas such as demand-side management through strategies including smart buildings and energy storage systems and incremental re-purposing of RE infrastructure. However, practical implementation and policy implementation to facilitate such strategies are greatly influenced by context, necessitating further research.
A limitation of the methodology was incorporating intangible aspects of the actor response, like optimism or making management decisions under varying levels of information. Moreover, the limitation extended to accounting for intangible factors varying the SO response over time. For example, hydropower scheduling decisions may be influenced by the SO manager’s favourable or negative outlook on weather conditions, as well as how this outlook evolves over time. Future studies can enhance this methodological approach by using a time-varying supply expectation variable to capture cross-seasonal exposure.
Author Contributions
K.S.U.: conceptualization, methodology, formal analysis, data curation, writing—original draft preparation; B.C.M.: writing—review and editing, supervision. All authors have read and agreed to the published version of the manuscript.
Funding
This research received no external funding.
Data Availability Statement
The raw data are unavailable due to institutional privacy restrictions.
Acknowledgments
The authors gratefully acknowledge the local stakeholders of Belize, including Belize Electricity Limited, the Public Utilities Commission, and the Ministerial Energy Unit.
Conflicts of Interest
The authors declare no conflicts of interest.
Appendix A
Table A1.
This table provides a list of distribution PDFs used in this study.
Table A1.
This table provides a list of distribution PDFs used in this study.
| Distribution | Probability Density Function | Parameter |
|---|---|---|
| normal | μ—mean σ—standard deviation | |
| exponential | λ—rate parameter | |
| Pareto | xm—minimum possible value of x α—shape parameter/tail index | |
| Weibull | k—shape parameter λ—scale of distribution | |
| t | ν—degrees of freedom Γ—gamma function | |
| GEV | —shape parameter s—location parameter | |
| gamma | α,β—shape parameters Γ—gamma function | |
| log-normal | μ—natural log mean σ—natural log standard deviation | |
| beta | α,β—shape parameters B—normalization constant | |
| uniform | a,b—minimum and maximum bounds | |
| log-gamma | α—shape parameters λ—scale of distribution Γ—gamma function |
Table A2.
This table provides the results of parameter estimation of the distribution fitting process and scoring of fits using RSS in order to rank the fits.
Table A2.
This table provides the results of parameter estimation of the distribution fitting process and scoring of fits using RSS in order to rank the fits.
| (a) PE | |||
| Season | Distribution | RSS | Rank |
| Early Dry | normal | 174.135 | 9 |
| exponential | 24.234 | 3 | |
| Pareto | 24.234 | 3 | |
| Weibull | 125.247 | 8 | |
| t | 119.414 | 7 | |
| GEV | 38.240 | 6 | |
| gamma | 3.475 | 2 | |
| log-normal | 25.570 | 5 | |
| beta | 2.831 | 1 | |
| uniform | 664.120 | 11 | |
| log-gamma | 178.426 | 10 | |
| Late Dry | normal | 299.378 | 9 |
| exponential | 71.087 | 3 | |
| Pareto | 71.087 | 3 | |
| Weibull | 213.689 | 7 | |
| t | 203.947 | 6 | |
| GEV | 81.456 | 5 | |
| gamma | 697.393 | 10 | |
| log-normal | 61.608 | 2 | |
| beta | 16.399 | 1 | |
| uniform | 1447.070 | 11 | |
| log-gamma | 296.963 | 8 | |
| Early Wet | normal | 492.381 | 9 |
| exponential | 29.889 | 3 | |
| Pareto | 29.889 | 3 | |
| Weibull | 347.407 | 8 | |
| t | 323.893 | 7 | |
| GEV | 108.585 | 6 | |
| gamma | 6.221 | 2 | |
| log-normal | 66.800 | 5 | |
| beta | 6.095 | 1 | |
| uniform | 1681.720 | 11 | |
| log-gamma | 503.463 | 10 | |
| Late Wet | normal | 327.835 | 8 |
| exponential | 40.318 | 2 | |
| Pareto | 42.010 | 3 | |
| Weibull | 215.910 | 7 | |
| t | 190.403 | 6 | |
| GEV | 68.808 | 5 | |
| gamma | 531.113 | 10 | |
| log-normal | 47.286 | 4 | |
| beta | 11.206 | 1 | |
| uniform | 1227.130 | 11 | |
| log-gamma | 354.224 | 9 | |
| (b) PU | |||
| Season | Distribution | RSS | Rank |
| Early Dry | normal | 9.467 | 6 |
| exponential | 23.191 | 10 | |
| Pareto | 23.191 | 10 | |
| Weibull | 8.410 | 5 | |
| t | 9.467 | 7 | |
| GEV | 4.385 | 2 | |
| gamma | 10.011 | 9 | |
| log-normal | 9.467 | 8 | |
| beta | 2.485 | 1 | |
| uniform | 6.220 | 4 | |
| log-gamma | 5.590 | 3 | |
| Late Dry | normal | 26.650 | 6 |
| exponential | 96.983 | 10 | |
| Pareto | 96.983 | 10 | |
| Weibull | 24.676 | 3 | |
| t | 25.688 | 4 | |
| GEV | 21.623 | 2 | |
| gamma | 29.540 | 7 | |
| log-normal | 26.471 | 5 | |
| beta | 37.028 | 8 | |
| uniform | 67.458 | 9 | |
| log-gamma | 9.888 | 1 | |
| Early Wet | normal | 13.158 | 6 |
| exponential | 32.313 | 10 | |
| Pareto | 32.313 | 10 | |
| Weibull | 5.434 | 1 | |
| t | 13.158 | 8 | |
| GEV | 11.274 | 3 | |
| gamma | 13.139 | 4 | |
| log-normal | 13.158 | 6 | |
| beta | 9.351 | 2 | |
| uniform | 17.440 | 9 | |
| log-gamma | 13.145 | 5 | |
| Late Wet | normal | 14.676 | 8 |
| exponential | 21.628 | 10 | |
| Pareto | 21.628 | 10 | |
| Weibull | 7.861 | 1 | |
| t | 14.676 | 8 | |
| GEV | 13.691 | 5 | |
| gamma | 14.610 | 7 | |
| log-normal | 13.383 | 4 | |
| beta | 9.031 | 2 | |
| uniform | 10.495 | 3 | |
| log-gamma | 14.589 | 6 | |
| (c) PK | |||
| Season | Distribution | RSS | Rank |
| Early Dry | normal | 3.429 | 6 |
| exponential | 144.361 | 10 | |
| Pareto | 144.361 | 10 | |
| Weibull | 10.965 | 8 | |
| t | 3.429 | 7 | |
| GEV | 2.040 | 1 | |
| gamma | 2.586 | 4 | |
| log-normal | 2.581 | 3 | |
| beta | 2.331 | 2 | |
| uniform | 92.019 | 9 | |
| log-gamma | 3.389 | 5 | |
| Late Dry | normal | 3.384 | 5 |
| exponential | 138.269 | 10 | |
| Pareto | 138.269 | 10 | |
| Weibull | 5.557 | 8 | |
| t | 3.384 | 6 | |
| GEV | 2.100 | 1 | |
| gamma | 3.019 | 3 | |
| log-normal | 2.997 | 2 | |
| beta | 4.235 | 7 | |
| uniform | 94.236 | 9 | |
| log-gamma | 3.321 | 4 | |
| Early Wet | normal | 5.373 | 4 |
| exponential | 161.130 | 10 | |
| Pareto | 161.130 | 10 | |
| Weibull | 7.091 | 7 | |
| t | 5.373 | 5 | |
| GEV | 125.856 | 9 | |
| gamma | 5.299 | 2 | |
| log-normal | 5.373 | 3 | |
| beta | 4.894 | 1 | |
| uniform | 111.461 | 8 | |
| log-gamma | 5.509 | 6 | |
| Late Wet | normal | 4.556 | 5 |
| exponential | 145.056 | 10 | |
| Pareto | 145.056 | 10 | |
| Weibull | 6.535 | 8 | |
| t | 4.556 | 4 | |
| GEV | 3.657 | 1 | |
| gamma | 4.315 | 2 | |
| log-normal | 4.449 | 3 | |
| beta | 4.705 | 6 | |
| uniform | 100.576 | 9 | |
| log-gamma | 4.866 | 7 | |
| (d) FP | |||
| Season | Distribution | RSS | Rank |
| Early Dry | normal | 4275.100 | 7 |
| exponential | 563.132 | 1 | |
| Pareto | 775.352 | 3 | |
| Weibull | 2180.030 | 6 | |
| t | 1583.700 | 5 | |
| GEV | 965.400 | 4 | |
| gamma | 5923.220 | 9 | |
| log-normal | 11,555.600 | 11 | |
| beta | 593.196 | 2 | |
| uniform | 11,349.300 | 10 | |
| log-gamma | 4491.330 | 8 | |
| Late Dry | normal | 5035.380 | 7 |
| exponential | 555.753 | 1 | |
| Pareto | 855.044 | 3 | |
| Weibull | 3050.850 | 6 | |
| t | 1488.620 | 5 | |
| GEV | 836.784 | 2 | |
| gamma | 6770.940 | 9 | |
| log-normal | 11,551.600 | 10 | |
| beta | 1259.270 | 4 | |
| uniform | 11,904.600 | 11 | |
| log-gamma | 5636.840 | 8 | |
| Early Wet | normal | 4648.500 | 7 |
| exponential | 1331.130 | 4 | |
| Pareto | 1781.760 | 5 | |
| Weibull | 3169.760 | 6 | |
| t | 857.826 | 3 | |
| GEV | 452.987 | 1 | |
| gamma | 8813.020 | 9 | |
| log-normal | 12,178.800 | 11 | |
| beta | 736.449 | 2 | |
| uniform | 11,979.900 | 10 | |
| log-gamma | 5163.200 | 8 | |
| Late Wet | normal | 5262.680 | 7 |
| exponential | 713.711 | 2 | |
| Pareto | 1065.730 | 4 | |
| Weibull | 1895.200 | 6 | |
| t | 1192.070 | 5 | |
| GEV | 687.460 | 1 | |
| gamma | 7716.980 | 9 | |
| log-normal | 11,686.800 | 10 | |
| beta | 762.518 | 3 | |
| uniform | 12,064.100 | 11 | |
| log-gamma | 5648.630 | 8 | |
Table A3.
This table provides the evaluation results of the joint distributions using the theoretical Gaussian and t-copulas based on LLs for each case.
Table A3.
This table provides the evaluation results of the joint distributions using the theoretical Gaussian and t-copulas based on LLs for each case.
| Case | Variables | Season | LL | |
|---|---|---|---|---|
| Gaussian | t | |||
| 1 | [PE, FP] | Early dry | 0.4012 | −0.3928 |
| Late dry | 0.7780 | 0.8374 | ||
| Early wet | 0.3306 | 1.5575 | ||
| Late wet | 2.4448 | 3.0894 | ||
| 2 | [PU, PK] | Early dry | 0.0489 | −0.8444 |
| Late dry | 0.0616 | −0.7765 | ||
| Early wet | 0.1490 | 1.4114 | ||
| Late wet | −0.0050 | −0.1373 | ||
| 3 | [PK, PU, FP] | Early dry | 5.7091 | 5.1105 |
| Late dry | 1.1653 | −0.6835 | ||
| Early wet | 0.8230 | 1.2862 | ||
| Late wet | 0.2672 | −2.4446 | ||
| 4 | All | Early dry | 6.8772 | 3.4665 |
| Late dry | 3.6390 | −1.3443 | ||
| Early wet | 1.5505 | 2.7388 | ||
| Late wet | 3.5941 | 1.9977 | ||
References
- Hong, Y.Y.; Apolinario, G.F.D.; Lu, T.K.; Chu, C.C. Chance-constrained unit commitment with energy storage systems in electric power systems. Energy Rep. 2022, 8, 1067–1090. [Google Scholar] [CrossRef]
- Kadir, K.; Mehdi Salehi Dezfouli, M.; Gabrielli, L.; Greta Ruggeri, A.; Scarpa, M. Roadmap to a Sustainable Energy System: Is Uncertainty a Major Barrier to Investments for Building Energy Retrofit Projects in Wide City Compartments? Energies 2023, 16, 4261. [Google Scholar] [CrossRef]
- Tehero, R.; Aka, E.B.; Çokgezen, M. Drivers of the quality of electricity supply. Int. J. Energy Econ. Policy 2020, 10, 183–195. [Google Scholar] [CrossRef]
- Wang, Y.; Rousis, A.O.; Strbac, G. On microgrids and resilience: A comprehensive review on modeling and operational strategies. Renew. Sustain. Energy Rev. 2020, 134, 110313. [Google Scholar] [CrossRef]
- Huang, J.; Tan, Q.; Zhang, T.; Wang, S. Energy-water nexus in low-carbon electric power systems: A simulation-based inexact optimization model. J. Environ. Manag. 2023, 338, 117744. [Google Scholar] [CrossRef]
- Zhong, W.; Guo, J.; Chen, L.; Zhou, J.; Zhang, J.; Wang, D. Future hydropower generation prediction of large-scale reservoirs in the upper Yangtze River basin under climate change. J. Hydrol. 2020, 588, 125013. [Google Scholar] [CrossRef]
- Qiu, H.; Chen, L.; Zhou, J.; He, Z.; Zhang, H. Risk analysis of water supply-hydropower generation-environment nexus in the cascade reservoir operation. J. Clean. Prod. 2021, 283, 124239. [Google Scholar] [CrossRef]
- Chen, L.; Huang, K.; Zhou, J.; Duan, H.F.; Zhang, J.; Wang, D.; Qiu, H. Multiple-risk assessment of water supply, hydropower and environment nexus in the water resources system. J. Clean. Prod. 2020, 268, 122057. [Google Scholar] [CrossRef]
- Miller, T.C.; Cipriano, M.; Ramsay, R.J. Do auditors assess inherent risk as if there are no controls? Manag. Audit. J. 2012, 27, 448–461. [Google Scholar] [CrossRef]
- Gupta, C.; Bhatia, S. The inherent risk of climate change becoming a hindrance in a business supply chain. In Contemporary Studies of Risks in Emerging Technology, Part A (Emerald Studies in Finance, Insurance, and Risk Management); Emerald Publishing Limited: Leeds, UK, 2023; pp. 127–137. [Google Scholar] [CrossRef]
- IRCG. Involving Stakeholders in the Risk Governance Process; EPFL International Risk Governance Center: Lausanne, Switzerland, 2020; p. 8. [Google Scholar] [CrossRef]
- Buraimoh, E.; Park, H. A Unit Commitment Model Considering Feasibility of Operating Reserves under Stochastic Optimization Framework. Energies 2022, 15, 6221. [Google Scholar] [CrossRef]
- Bachev, H. Risk Management in the Agri-Food Sector. Contemp. Econ. 2013, 7, 45–62. [Google Scholar] [CrossRef]
- Zambrano, A. An Overview of Application of Optimization Models Under Uncertainty to the Unit Commitment Problem. arXiv 2022, arXiv:2203.16883v1. [Google Scholar]
- Yang, N.; Dong, Z.; Wu, L.; Zhang, L.; Shen, X.; Chen, D.; Zhu, B.; Liu, Y. A Comprehensive Review of Security-constrained Unit Commitment. J. Mod. Power Syst. Clean Energy 2022, 10, 562–576. [Google Scholar] [CrossRef]
- Burke, P.J. Income, resources, and electricity mix. Energy Econ. 2010, 32, 616–626. [Google Scholar] [CrossRef]
- Belize Electricity Limited. Belize Electricity Limited Annual Report 2022. Belize, 2022. Available online: https://indd.adobe.com/view/8fd0b2f4-532b-4a25-b5e8-478794c11a0b (accessed on 10 June 2023).
- Usher, K.S.; McLellan, B.C. Managing power supply in small nations: A case on Belize’s Idiosyncratic system. Energy Sustain. Dev. 2024, 83, 101548. [Google Scholar] [CrossRef]
- Tillett, A.; Locke, J.; Mencias, J. Belize National Energy Policy Framework. 2011. Available online: https://www.publicservice.gov.bz/index.php/medias/news-and-events/item/56-belize-national-energy-policy-framework (accessed on 1 June 2023).
- Al-Shetwi, A.Q.; Hannan, M.A.; Jern, K.P.; Alkahtani, A.A.; Abas, A.E.P.G. Power Quality Assessment of Grid-Connected PV System in Compliance with the Recent Integration Requirements. Electronics 2020, 9, 366. [Google Scholar] [CrossRef]
- Barrera-Zapata, M.; Zuñiga-Cortes, F.; Caicedo-Bravo, E. A Framework for Evaluating Renewable Energy for Decision-Making Integrating a Hybrid FAHP-TOPSIS Approach: A Case Study in Valle del Cauca, Colombia. Data 2023, 8, 137. [Google Scholar] [CrossRef]
- Guerra, K.; Haro, P.; Gutiérrez, R.E.; Gómez-Barea, A. Facing the high share of variable renewable energy in the power system: Flexibility and stability requirements. Appl. Energy 2022, 310, 118561. [Google Scholar] [CrossRef]
- Jian, P.; Hu, W.; Valipour, E.; Nojavan, S. Risk analysis of integrated biomass and concentrated solar system using downside risk constraint procedure. Sol. Energy 2022, 238, 44–59. [Google Scholar] [CrossRef]
- Guy, J.D. Security constrained unit commitment. IEEE Trans. Power Appar. Syst. 1971, PAS-90, 1385–1390. [Google Scholar] [CrossRef]
- Abdi, H. Profit-based unit commitment problem: A review of models, methods, challenges, and future directions. Renew. Sustain. Energy Rev. 2021, 138, 110504. [Google Scholar] [CrossRef]
- IRGC. Introduction to the IRGC Risk Governance Framework, revised version; EPFL International Risk Governance Center: Lausanne, Switzerland, 2017; pp. 1–52. [Google Scholar] [CrossRef]
- Ewertowski, T.; Butlewski, M. Development of a Pandemic Residual Risk Assessment Tool for Building Organizational Resilience within Polish Enterprises. Int. J. Environ. Res. Public Health 2021, 18, 6948. [Google Scholar] [CrossRef] [PubMed]
- Val, D.V.; Yurchenko, D.; Nogal, M.; O’Connor, A. Climate Change-Related Risks and Adaptation of Interdependent Infrastructure Systems. In Climate Adaptation Engineering: Risks and Economics for Infrastructure Decision-Making; Butterworth-Heinemann: Oxford, UK, 2019; pp. 207–242. [Google Scholar] [CrossRef]
- Nasab, M.A.; Zand, M.; Padmanaban, S.; Bhaskar, M.S.; Guerrero, J.M. An efficient, robust optimization model for the unit commitment considering renewable uncertainty and pumped-storage hydropower. Comput. Electr. Eng. 2022, 100, 107846. [Google Scholar] [CrossRef]
- Sambo, B.; Bonato, M.; Sperotto, A.; Torresan, S.; Furlan, E.; Lambert, J.H.; Linkov, I.; Critto, A. Framework for multirisk climate scenarios across system receptors with application to the Metropolitan City of Venice. Risk Anal. 2023, 43, 2241–2261. [Google Scholar] [CrossRef]
- Oseni, M.O.; Pollitt, M.G. The promotion of regional integration of electricity markets: Lessons for developing countries. Energy Policy 2016, 88, 628–638. [Google Scholar] [CrossRef]
- Uniejewski, B.; Weron, R.; Ziel, F. Variance Stabilizing Transformations for Electricity Spot Price Forecasting. IEEE Trans. Power Syst. 2018, 33, 2219–2229. [Google Scholar] [CrossRef]
- UNFCCC. Belize’s Updated Nationally Determined Contribution. 2021. Available online: https://unfccc.int/sites/default/files/NDC/2022-06/BelizeUpdatedNDC.pdf (accessed on 6 September 2023).
- BELCOGEN/BEL. Power Purchase Agreement—BELCOGEN/BEL. Belize, 2007. Available online: https://www.puc.bz/belcogen-agreement-february-2007/ (accessed on 5 June 2022).
- BECOL/BEL. Power Purchase Agreement—BECOL VACA/BEL. Belize, 2007. Available online: https://www.puc.bz/vaca-power-purchase-agreement/ (accessed on 5 June 2022).
- BECOL/BEL. Amended and Restated Power Purchase Agreement—BECOL Mollejon/BEL. Belize, 1991. Available online: https://www.puc.bz/mollejon-power-purchase-agreement/ (accessed on 5 June 2022).
- CFE Calificados. S.A.D.C./B. Power Purchase Agreement—CFE Calificados, S.A. DE CV/BEL. Belize, 2016. Available online: https://www.puc.bz/bel-cfe-power-purchase-agreement/ (accessed on 5 June 2022).
- Belize Electricity Limited. Belize Electricity Limited Annual Report 2021. Belize, 2021. Available online: https://acrobat.adobe.com/link/track?uri=urn:aaid:scds:US:30043d8f-21f3-3100-8c47-a8d6d20c66e5 (accessed on 6 June 2022).
- Belize Electricity Limited. Belize Electricity Limited Annual Report 2020. Belize, 2020. Available online: https://www.bel.com.bz/annual_reports.aspx (accessed on 6 June 2022).
- Belize Electricity Limited. Belize Electricity Limited Annual Report 2019. Belize, 2019. Available online: https://www.bel.com.bz/annual_reports.aspx (accessed on 6 June 2022).
- Belize Electricity Limited. Belize Electricity Limited Annual Report 2018. Belize, 2018. Available online: https://www.bel.com.bz/annual_reports.aspx (accessed on 6 June 2022).
- Mir, A.A.; Alghassab, M.; Ullah, K.; Khan, Z.A.; Lu, Y.; Imran, M. A Review of Electricity Demand Forecasting in Low and Middle Income Countries: The Demand Determinants and Horizons. Sustainability 2020, 12, 5931. [Google Scholar] [CrossRef]
- Nti, I.K.; Teimeh, M.; Nyarko-Boateng, O.; Adekoya, A.F. Electricity load forecasting: A systematic review. J. Electr. Syst. Inf. Technol. 2020, 7, 13. [Google Scholar] [CrossRef]
- Jabir, H.J.; Teh, J.; Ishak, D.; Abunima, H. Impacts of Demand-Side Management on Electrical Power Systems: A Review. Energies 2018, 11, 1050. [Google Scholar] [CrossRef]
- Janczura, J.; Puć, A. ARX-GARCH Probabilistic Price Forecasts for Diversification of Trade in Electricity Markets—Variance Stabilizing Transformation and Financial Risk-Minimizing Portfolio Allocation. Energies 2023, 16, 807. [Google Scholar] [CrossRef]
- Torriti, J.; Zhao, X.; Yuan, Y. The Risk of Residential Peak Electricity Demand: A Comparison of Five European Countries. Energies 2017, 10, 385. [Google Scholar] [CrossRef]
- Van Koten, S. Forward premia in electricity markets: A replication study. Energy Econ. 2020, 89, 104812. [Google Scholar] [CrossRef]
- Çanakoglu, E.; Adıyeke, E. Comparison of Electricity Spot Price Modelling and Risk Management Applications. Energies 2020, 13, 4698. [Google Scholar] [CrossRef]
- Wei, W.; Lunde, A. Identifying Risk Factors and Their Premia: A Study on Electricity Prices. J. Financ. Econom. 2023, 21, 1647–1679. [Google Scholar] [CrossRef]
- Kousar, S.; Khan, A.R.; Ul Hassan, M.; Noreen, Z.; Bhatti, S.H. Some best-fit probability distributions for at-site flood frequency analysis of the Ume River. J. Flood Risk Manag. 2020, 13, e12640. [Google Scholar] [CrossRef]
- Ji, Q.; Bouri, E.; Roubaud, D.; Shahzad, S.J.H. Risk spillover between energy and agricultural commodity markets: A dependence-switching CoVaR-copula model. Energy Econ. 2018, 75, 14–27. [Google Scholar] [CrossRef]
- distfit·PyPI. Available online: https://pypi.org/project/distfit/ (accessed on 5 May 2023).
- Durante, F.; Fernández-Sánchez, J.; Sempi, C. A topological proof of Sklar’s theorem. Appl. Math. Lett. 2013, 26, 945–948. [Google Scholar] [CrossRef]
- Nelson, R.B. Multivariate Copulas. In An Introduction to Copulas; Springer: New York, NY, USA, 2006; pp. 42–47. [Google Scholar]
- Genz, A.; Bretz, F. Computation of Multivariate Normal and t Probabilities; Lecture Notes in Statistics; Springer: Berlin/Heidelberg, Germany, 2009; Volume 195, ISBN 978-3-642-01688-2. [Google Scholar]
- Arellano-Valle, R.B.; Contreras-Reyes, J.E.; Genton, M.G. Shannon Entropy and Mutual Information for Multivariate Skew-Elliptical Distributions. Scand. J. Stat. 2013, 40, 42–62. [Google Scholar] [CrossRef]
- SciPy. Statistical Functions (scipy.stats)—SciPy v1.14.0 Manual. Available online: https://docs.scipy.org/doc/scipy/reference/stats.html#module-scipy.stats (accessed on 8 August 2024).
- Numpy Statisticstics. API Reference numpy.percentile—NumPy v2.0 Manual. Available online: https://numpy.org/doc/stable/reference/generated/numpy.percentile.html (accessed on 8 August 2024).
- Burchi, A.; Martelli, D. Chapter 7—Measuring Market Risk in the Light of Basel III: New Evidence From Frontier Markets. In Handbook of Frontier Markets: Evidence from Asia and International Comparative Studies; Academic Press: New York, NY, USA, 2016; pp. 99–122. [Google Scholar] [CrossRef]
- Mensi, W.; Hammoudeh, S.; Shahzad, S.J.H.; Shahbaz, M. Modeling systemic risk and dependence structure between oil and stock markets using a variational mode decomposition-based copula method. J. Bank. Financ. 2017, 75, 258–279. [Google Scholar] [CrossRef]
- Zhang, W.; Zhuang, X.; Wang, J.; Lu, Y. Connectedness and systemic risk spillovers analysis of Chinese sectors based on tail risk network. N. Am. J. Econ. Financ. 2020, 54, 101248. [Google Scholar] [CrossRef]
- Bessembinder, H.; Lemmon, M.L. Equilibrium Pricing and Optimal Hedging in Electricity Forward Markets. J. Financ. 2002, 57, 1347–1382. [Google Scholar] [CrossRef]
- Usher, K.S.; Mclellan, B.C. Price Risk Exposure of Small Participants in Liberalized Multi-National Power Markets: A Case Study on the Belize–Mexico Interconnection. Energies 2024, 17, 3464. [Google Scholar] [CrossRef]
- Longstaff, F.A.; Wang, A.W. Electricity Forward Prices: A High-Frequency Empirical Analysis. J. Financ. 2004, 59, 1877–1900. [Google Scholar] [CrossRef]
- Sridharan, V.; Broad, O.; Shivakumar, A.; Howells, M.; Boehlert, B.; Groves, D.G.; Rogner, H.H.; Taliotis, C.; Neumann, J.E.; Strzepek, K.M.; et al. Resilience of the Eastern African electricity sector to climate driven changes in hydropower generation. Nat. Commun. 2019, 10, 302. [Google Scholar] [CrossRef]
- Bakare, M.S.; Abdulkarim, A.; Zeeshan, M.; Shuaibu, A.N. A comprehensive overview on demand side energy management towards smart grids: Challenges, solutions, and future direction. Energy Inform. 2023, 6, 4. [Google Scholar] [CrossRef]
Disclaimer/Publisher’s Note: The statements, opinions and data contained in all publications are solely those of the individual author(s) and contributor(s) and not of MDPI and/or the editor(s). MDPI and/or the editor(s) disclaim responsibility for any injury to people or property resulting from any ideas, methods, instructions or products referred to in the content. |
© 2024 by the authors. Licensee MDPI, Basel, Switzerland. This article is an open access article distributed under the terms and conditions of the Creative Commons Attribution (CC BY) license (https://creativecommons.org/licenses/by/4.0/).