


Abstract
The migration system, as the primary medium linking source rocks and traps, plays a vital role in studying hydrocarbon migration, accumulation, and reservoir formation. This study focuses on Late Paleozoic source rock (mudstone and coal rock) and sandstone samples from the Ordos Basin. By analyzing permeability, porosity, and their ratios under various conditions, this study evaluates the quality of hydrocarbon migration pathways across different lithologic strata, identifies optimal migration routes, and offers new insights for identifying favorable hydrocarbon exploration areas in the Late Paleozoic of the Ordos Basin. The findings indicate that the permeability ratio between parallel and vertical bedding planes in source rock and sandstone samples ranges from 1 to 4. Post-fracturing, permeability increases by over twofold. On average, sandstone permeability is approximately 0.1 × 10⁻3 μm2, while source rock permeability is about 0.03 × 10⁻3 μm2. Key conclusions include that without fracture development, permeability, and porosity parallel to bedding planes outperform those perpendicular to bedding planes, with sandstone showing better properties than source rocks. When fractures are present, permeability and porosity along the fracture direction are highest, followed by sandstone, with source rocks showing the lowest values. These results advance the theoretical understanding of hydrocarbon migration systems and provide significant guidance for hydrocarbon reservoir exploration and development.
1. Introduction
The study of migration systems has long been a challenging aspect of hydrocarbon accumulation research [1,2,3,4,5,6,7,8]. Earlier investigations primarily concentrated on the processes occurring after hydrocarbons are expelled from source rocks during primary migration and before they reach traps, focusing predominantly on secondary migration stages [9,10]. However, the primary migration of hydrocarbons within source rocks has received comparatively little attention [11,12,13,14]. Secondary migration has often been deemed sufficient to describe hydrocarbon pathways leading to accumulation. Nonetheless, recent findings, particularly in light of concepts like shale gas, indicate that hydrocarbon accumulation processes begin within source rocks themselves [15,16,17,18,19,20]. Hence, to thoroughly understand the impact of migration systems on hydrocarbon accumulation, studies must encompass pathways within source rocks.
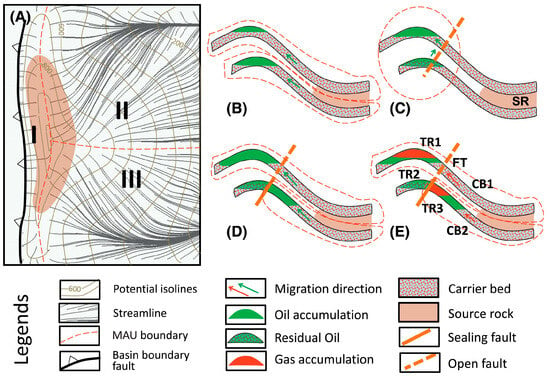
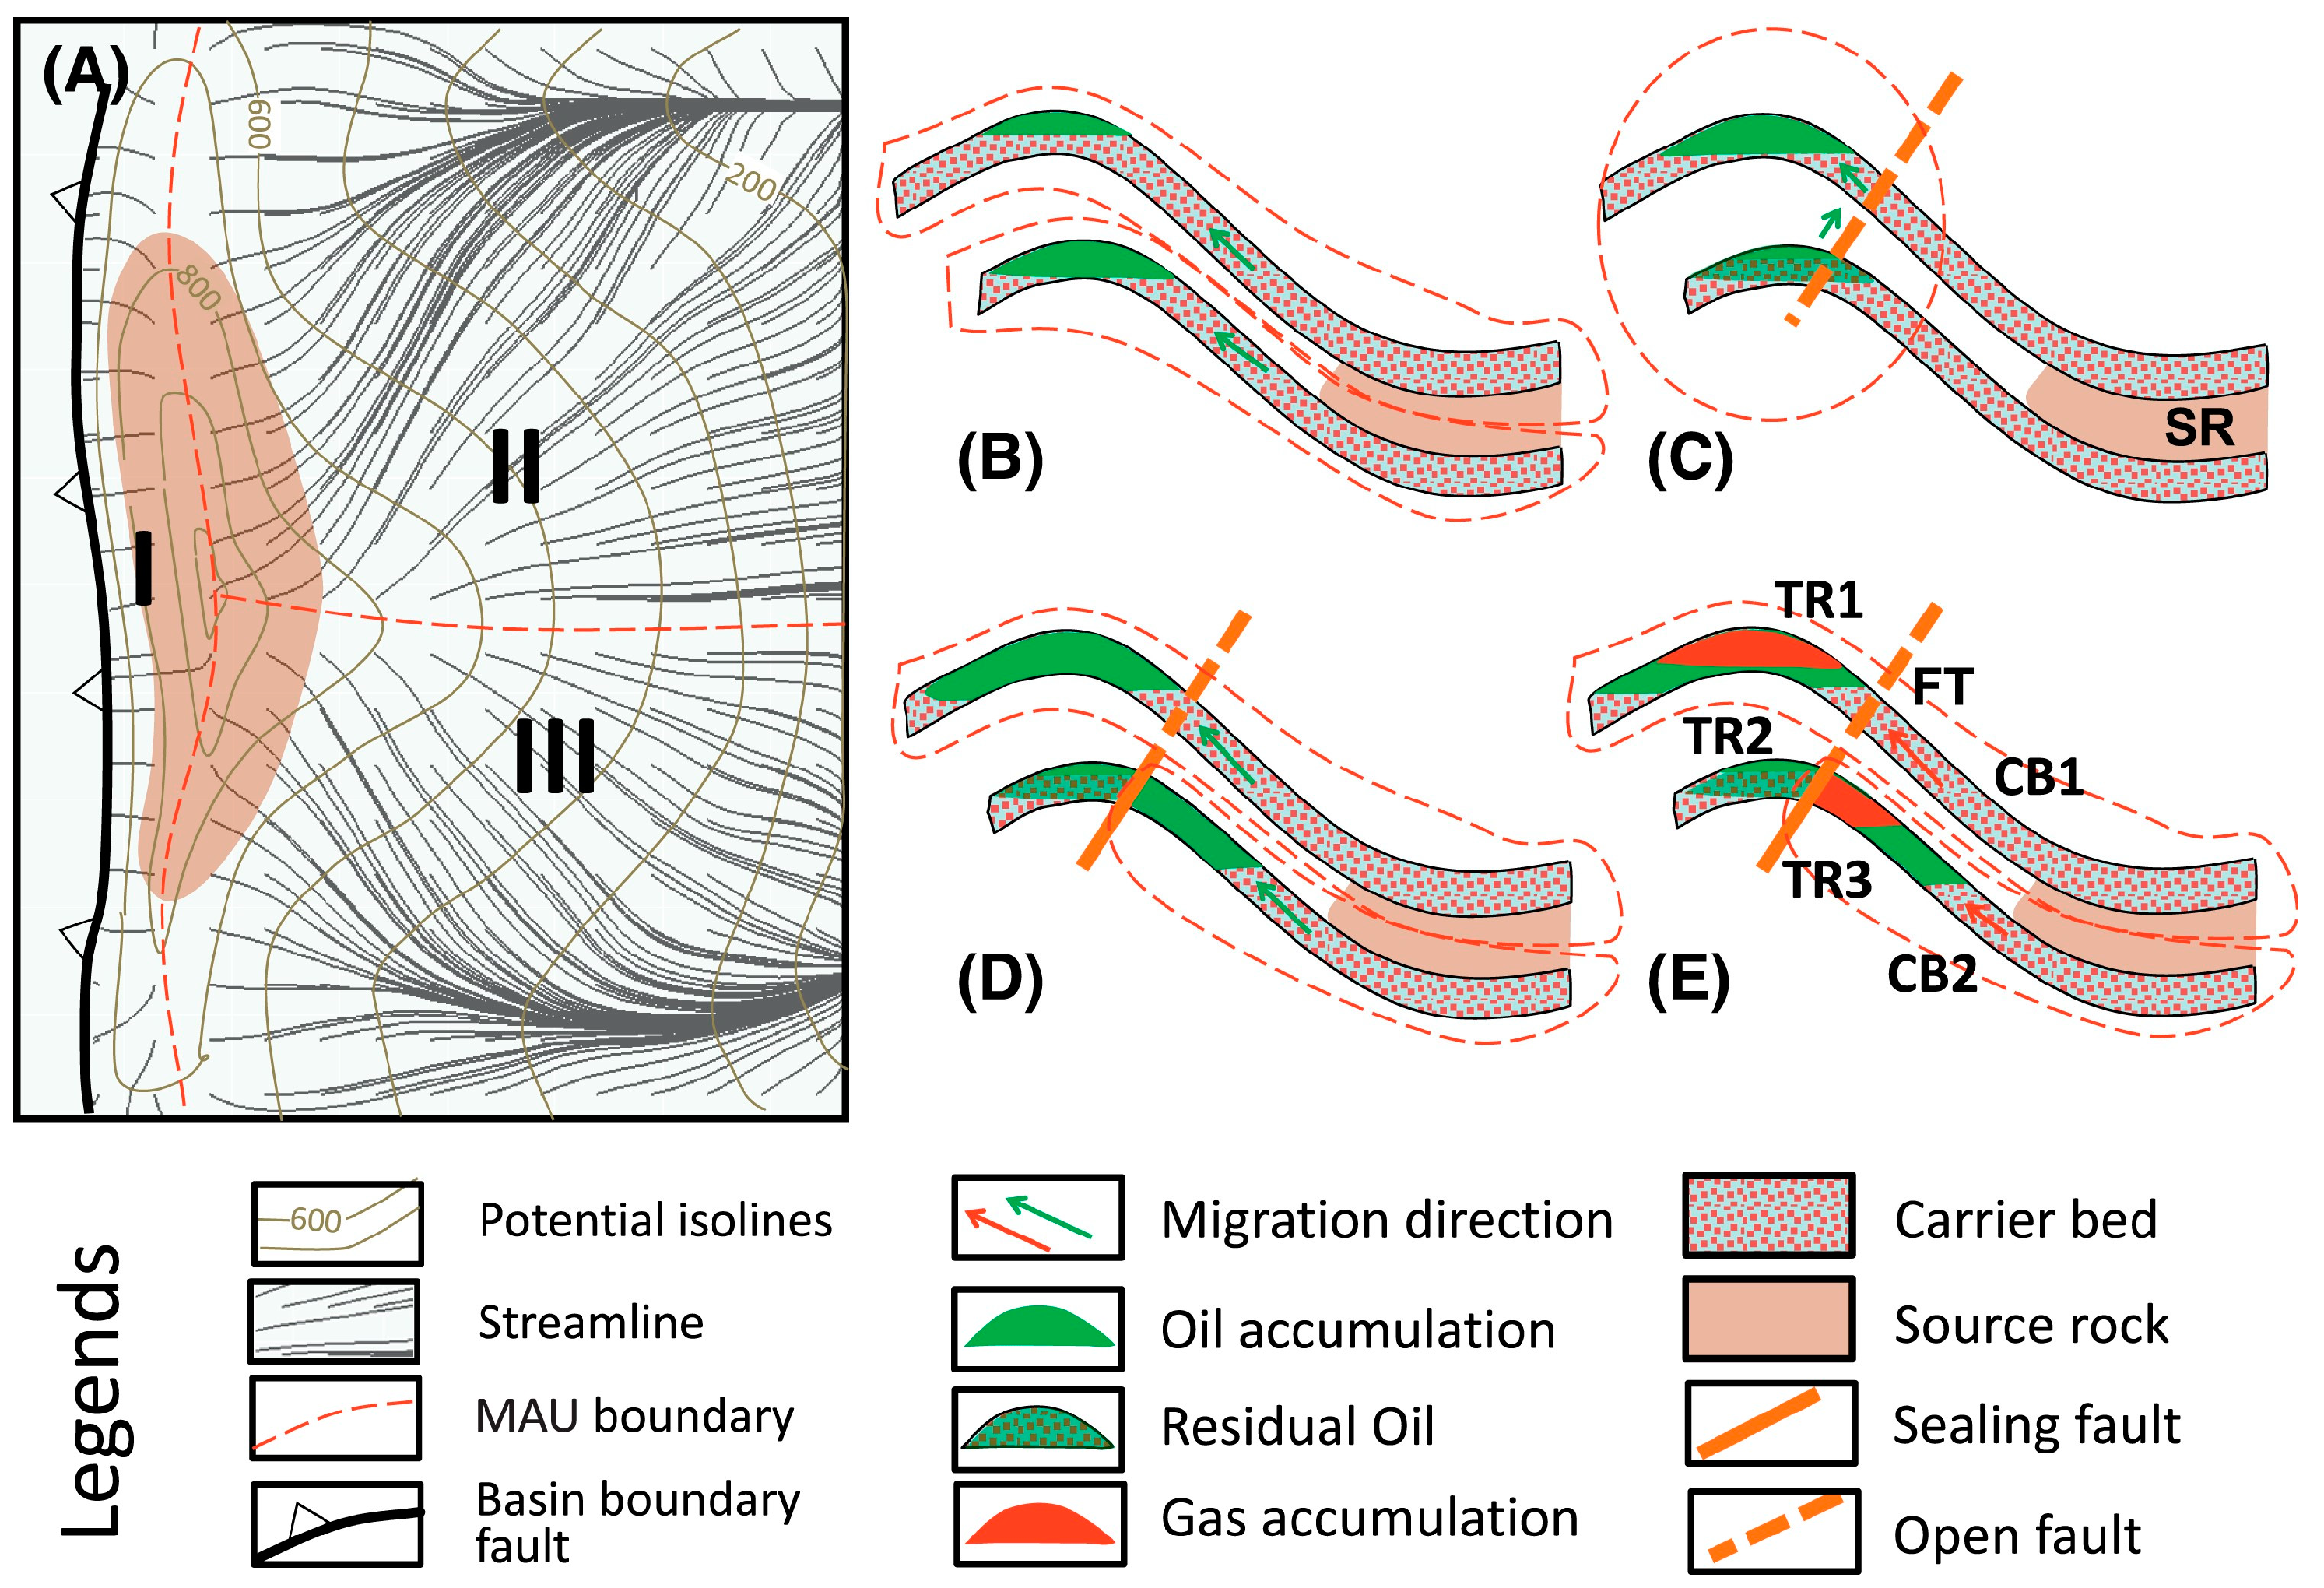
Porosity and permeability measurements are key to characterizing hydrocarbon migration pathways in both source rocks and sandstone reservoirs. The quality of these pathways significantly influences the selection of migration routes, which in turn affects the localization of hydrocarbon accumulation regions [21,22,23,24]. Consequently, the assessment of migration pathway quality is a central focus in migration system research (Figure 1). Current research on migration pathways primarily addresses two components: source rock pathways during primary migration and sandstone pathways during secondary migration [25,26,27]. Detailed analysis of these components is essential for understanding their role in hydrocarbon migration and accumulation.
Figure 1.
Concept of a hydrocarbon migration and accumulation unit (MAU). (A) A map illustrating the extent of three MAUs (I, II, and III) formed during a single migration–accumulation event. (B–E) Cross-sectional views displaying the distribution of seven MAUs within a petroleum system across four migration–accumulation events. The migration direction is indicated by green arrows for oil and red arrows for gas. Individual MAUs are outlined with dashed red lines. Abbreviations: CB = carrier bed, FT = fault, SR = source rock, TR = trap [28].
The quality of hydrocarbon migration pathways is primarily determined by porosity and permeability. Previous research has often focused solely on pathways either parallel or perpendicular to bedding planes, neglecting a comparative analysis of the two [1,5,6,7,8,13,15,16,17,29]. Additionally, increasing burial depth intensifies formation pressure, causing rock strata to fracture and generate cracks [11,14,30]. However, the impact of these cracks on migration pathway quality has not been thoroughly investigated, nor has a detailed comparison been made between conditions with and without fractures [14]. Thus, exploring migration pathway quality under diverse conditions is crucial to advancing hydrocarbon migration system theories.
The Late Paleozoic strata of the Ordos Basin, China, host significant shale gas resources and represent a key area for shale gas exploration and development [31,32,33]. Thick coal and mud shale deposits are prevalent in the Benxi–Taiyuan Formation [34,35,36], while the overlying Shanxi, Shihezi, and Shiqianfeng Formations consist primarily of thick sandstone layers [37,38,39]. These formations provide abundant sample data for investigating the migration pathway characteristics of source rocks (coal and mud rocks) and sandstones.
This study employed permeability measurement techniques for full-diameter coal and argillaceous rocks, as well as for porous and fractured mudstones and sandstones, to evaluate permeability values and ratios parallel and perpendicular to bedding planes. It also examined changes in permeability and porosity of various lithological pathways under increasing formation pressure until cracks formed, assessing the resulting migration pathway quality. Using the Late Paleozoic strata of the Ordos Basin as a case study, this paper discusses the implications of these findings for identifying favorable hydrocarbon target areas.
2. Geological Setting
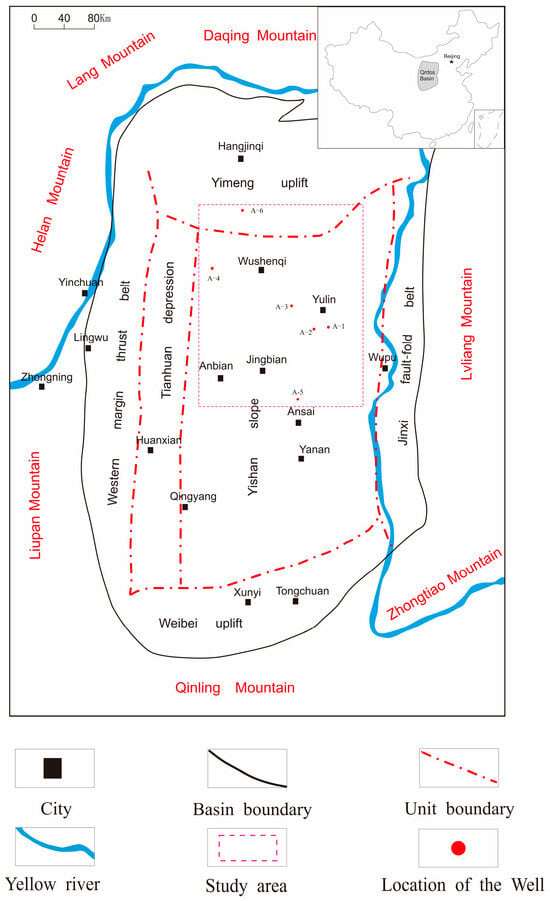
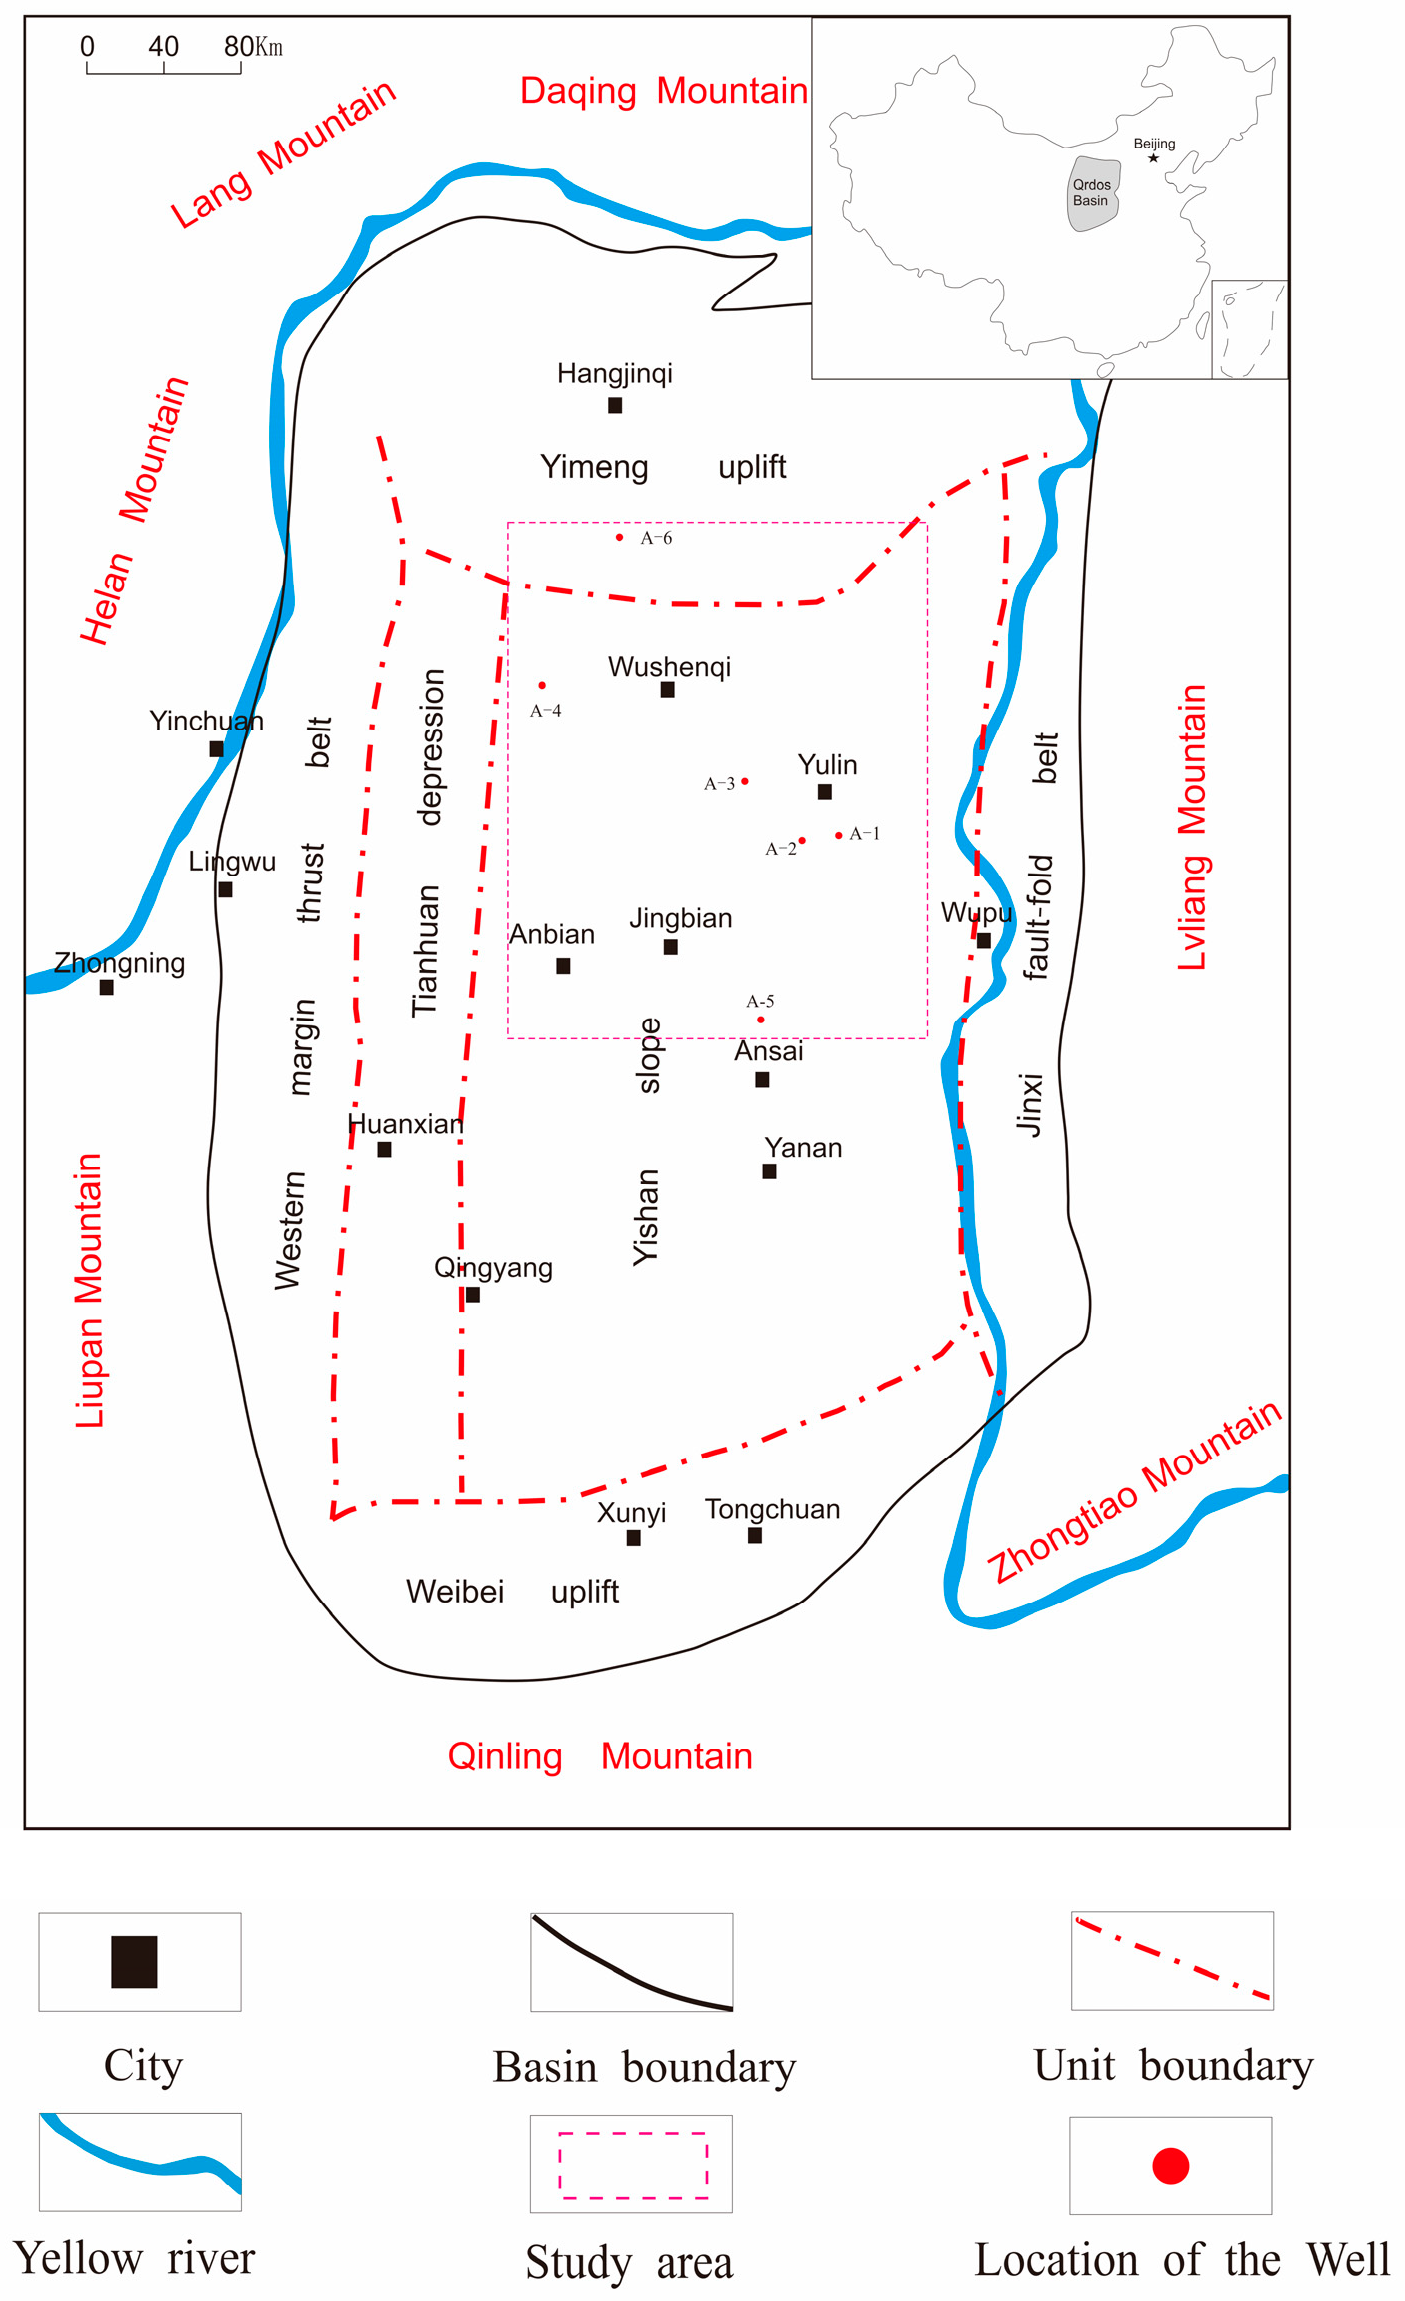
The Upper Paleozoic strata of the Ordos Basin, situated in the western region of the North China Plate, represent a critical oil and gas basin in China. Its geological evolution has been shaped by multiple tectonic events, including the Caledonian, Hercynian, Indosinian, and Yanshan movements (Figure 2), resulting in a complex structural framework conducive to hydrocarbon generation [40,41,42]. Key tectonic units include the Yimeng Uplift, Weibei Uplift, Tianhuan Depression, and Shanbei Slope, each with distinct features. The Yimeng Uplift has thin strata and simple structures, offering untapped potential; the Weibei Uplift is characterized by structural complexity and significant hydrocarbon indications; the Tianhuan Depression features thick sedimentary layers and well-developed source rocks, serving as a major hydrocarbon generation zone; and the Shanbei Slope, with its gentle structure and well-matched reservoirs and source rocks, has become a prime exploration target, hosting several large gas fields [43,44,45].
Figure 2.
Location distribution map of well sites for Late Paleozoic samples in the Ordos Basin [46].
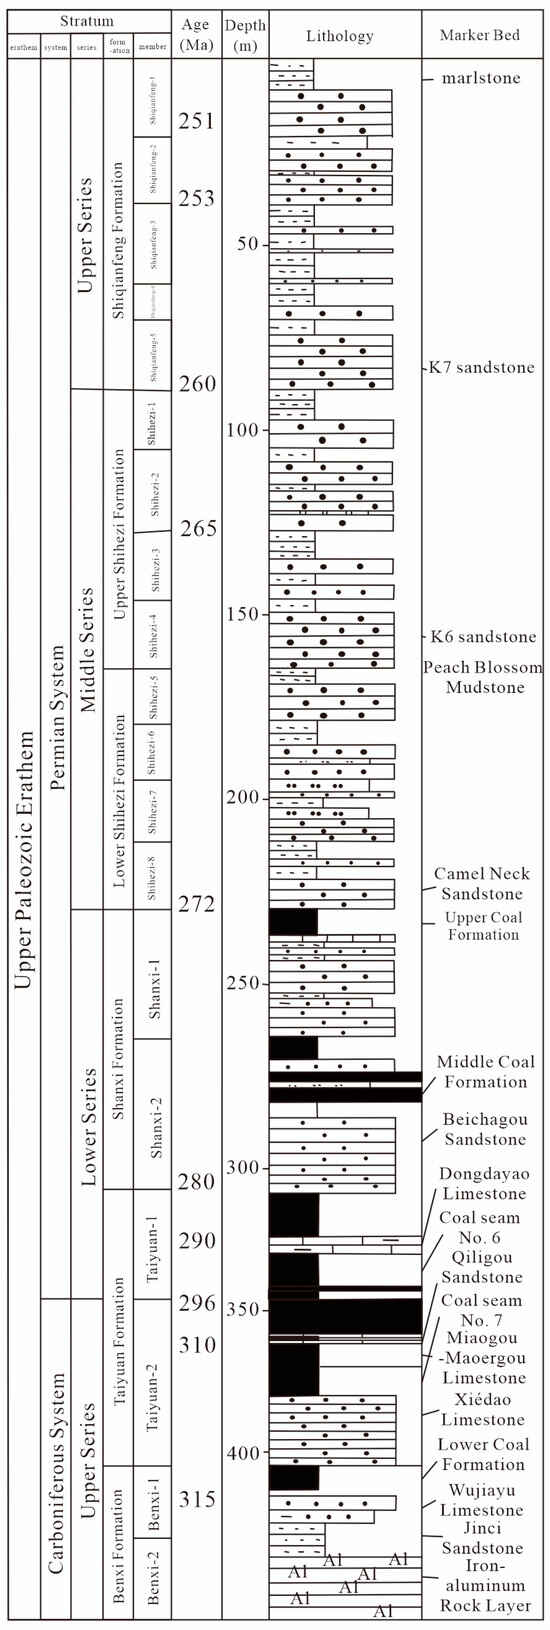
This study focuses on the Paleozoic strata of the Ordos Basin, which include key formations such as the Benxi, Taiyuan, and Shanxi Formations (Figure 3). The Benxi Formation comprises marine–terrestrial transitional deposits, featuring coal seams, dark mudstones, and sandstones. It serves as both a source rock layer and, in some cases, a potential reservoir [34,35,36]. The Taiyuan Formation, similarly characterized by marine–continental transitional sediments, contains extensive coal seams and dark mudstones as source rocks, with diverse sandstones providing favorable conditions for hydrocarbon accumulation [34,35,36]. The Shanxi Formation mainly consists of terrestrial clastic rocks, with well-developed sandstone reservoirs [37,38]. These sandstones, combined with source rocks, create an effective source–reservoir–cap rock system, making the formation a critical target for hydrocarbon exploration. Additionally, the favorable reservoir properties and stable distribution of certain sandstones in the Shanxi Formation play a pivotal role in the development of Paleozoic oil and gas reservoirs [39].
Figure 3.
Lithological column chart of the Late Paleozoic in the Ordos Basin [47].
3. Experimental Methods
3.1. Experimental Sampling
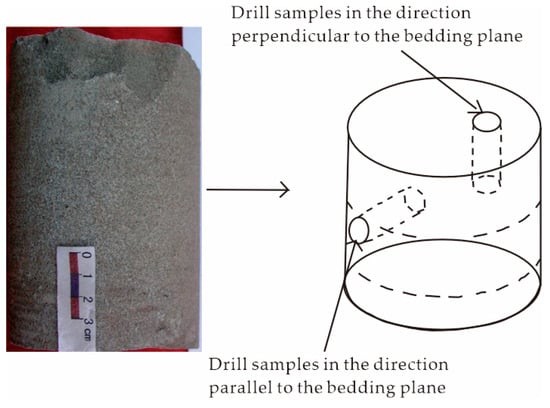
This study mainly carried out core sampling from the Late Paleozoic strata in the Ordos Basin. Because the Ordos Basin was rich in oil and gas resources during the Late Paleozoic period and contained various types of source rocks (mudstone and coal rock) and sandstone, it was possible to comprehensively study the role of oil and gas migration channels in different rock types in oil and gas migration. Taking six wells in the Late Paleozoic of the Ordos Basin as the research area, they were named A-1 to A-6, respectively (see Figure 2 above). Three groups of representative non-fractured mudstone with a total of 12 samples were selected from them and named starting with B, D, and J, respectively. Three groups of non-fractured sandstone with a total of 12 samples were selected and named starting with E, K, and N, respectively. Then, 6 groups of fractured sandstone with a total of 18 samples were selected and named starting with G, I, M, O, P, and Q, respectively. One group of full-diameter coal rock with a total of two samples was named starting with L. The basic characteristics of the experimental samples are shown in Table 1. Then, the permeability tests in the directions parallel and perpendicular to the bedding plane and the observation and analysis of the pore structure of cast thin sections were carried out, respectively (Figure 4). Through the comparative analysis of permeability and porosity in the cases of non-fracturing and fracturing, the changes in oil and gas migration channels during the process of strata burial depth were obtained, and then the path selection of oil and gas migration was deduced.
Table 1.
Summary of sample sampling.
Figure 4.
Diagram of sample sampling methods.
3.2. Experimental Principles for Characterizing Full-Diameter Permeability
Permeability tests on full-diameter samples were conducted in accordance with the petroleum and natural gas industry standard of the People’s Republic of China, SY-T5336-1996, Conventional Core Analysis Method. The tests measured permeability in both parallel and perpendicular directions to bedding planes in heterogeneous rocks, including fractured argillaceous and coal rocks, to analyze differences in their conductivity. The measurement process included principles, instruments, equipment, and procedural steps as detailed below.
- (1)
- Measurement Principle
When gas flows through a rock sample, the permeability can be calculated using the following formula derived from Darcy’s law for one-dimensional steady-state gas filtration:
In the formula:
- ka represents the permeability of the rock, with the unit of μm2;
- Pa represents the applied pressure, with the unit of Pa;
- Qo represents the flow rate of air passing through the rock per unit time, with the unit of cm3/s;
- μ represents the viscosity of the fluid, with the unit of 10⁻3 Pa·s;
- L represents the length of the rock, with the unit of cm;
- p1 and p2 represent the pressure differences before and after the fluid passes through the rock, with the unit of MPa;
- A represents the cross-sectional area through which the air passes through the rock, with the unit of cm2.
- (2)
- Instruments and Equipment
The instruments used in the experiment are as follows:
- ①
- Permeameter;
- ②
- Full-diameter core holder;
- ③
- Vacuum pump;
- ④
- Pressure pump;
- ⑤
- High-pressure gas cylinder;
- ⑥
- Air compressor.
- (3)
- Experimental Steps
- ①
- After removing oil (salt) from the samples to be tested, dry them and place them in a desiccator for standby.
- ②
- Use 2–3 standard blocks to test the instrument’s reliability. That is, compare the measured values with the calibrated values. If the relative error does not exceed 5%, the instrument is considered qualified.
- ③
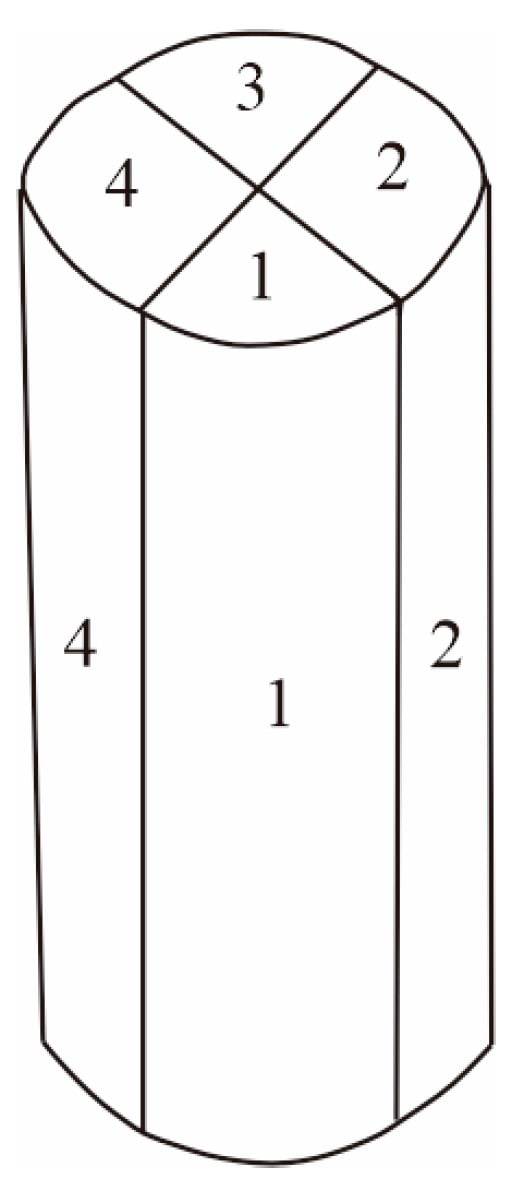
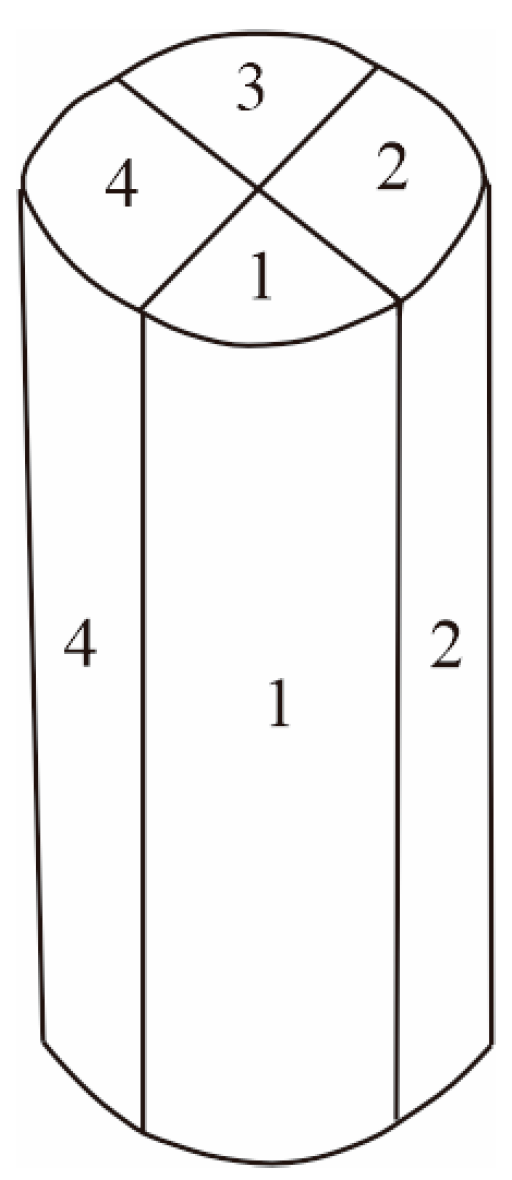
- The cylindrical rock sample’s side surface is divided into four equal sections (as shown in Figure 5). Surfaces 1 and 3 form one pair of air inlet and outlet surfaces, while surfaces 2 and 4 form another pair. One pair of surfaces (1, 3) is selected as the measurement direction, with surfaces 2 and 4, which are perpendicular to surfaces 1 and 3, representing the alternative measurement direction. In the report, the permeability value measured along the middle direction is labeled as Rmax, and the two other measured values are denoted as R90.Figure 5. Equal division diagram of the side surface of the rock sample.
- ④
- Cover surfaces 1 and 3 with two metal meshes of corresponding sizes, and then cover the meshes with two smooth metal arc plates of the same size.
- ⑤
- Place the metal mesh and the arc plate on one pair of surfaces of the core, and fix them with rubber bands. Evacuate the air and send the core into the holder, ensuring that the rock sample and the upper and lower plungers are on the same central line. Push a pressure 0.05 MPa higher than the confining pressure into the top of the core, and then add a confining pressure of 1.4–2.8 MPa. To avoid turbulence, the flow velocity of the test gas should be less than 8 cm3/s. After the flow velocity becomes stable, record the upstream and downstream pressures (C value, hw) and the value of the restrictor.
- ⑥
- For vertical permeability measurement, place a sieve of appropriate size on both the upper and lower end surfaces of the rock sample. After evacuating the air, insert the core into the core holder and release the air. Apply an upward pressure of 0.05 MPa higher than the confining pressure, followed by adding a confining pressure between 1.4 and 2.8 MPa. Begin measuring the flow velocity. Once the flow velocity stabilizes, record the upstream and downstream pressures as well as the flow value of the restrictor.
- ⑦
- After a batch of samples has been measured, it is necessary to use 2–3 standard samples to measure their values to verify the reliability of the instrument throughout the entire testing process.
By analyzing the permeability measurements along the directions parallel and perpendicular to the bedding planes, along with the pore structure observations from casting thin sections, the conductive properties of full-diameter argillaceous and coal rocks in different directions are compared and evaluated. Based on these findings, the natural gas charging direction in the full-diameter argillaceous and coal rocks is determined.
3.3. Experimental Principles for Characterizing Porosity and Permeability
In accordance with the petroleum and natural gas industry standard SY-T5336-1996 Conventional Core Analysis Method, permeability tests were conducted on the collected sandstone and mudstone samples [11]. The principles, instruments, equipment, and measurement procedures are outlined as follows:
- (1)
- Measurement Principle
The experimental principle is the same as that in Section 3.2.
- (2)
- Instruments and Equipment
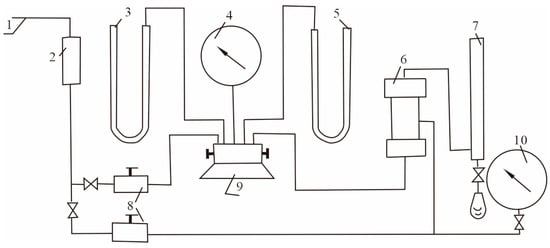
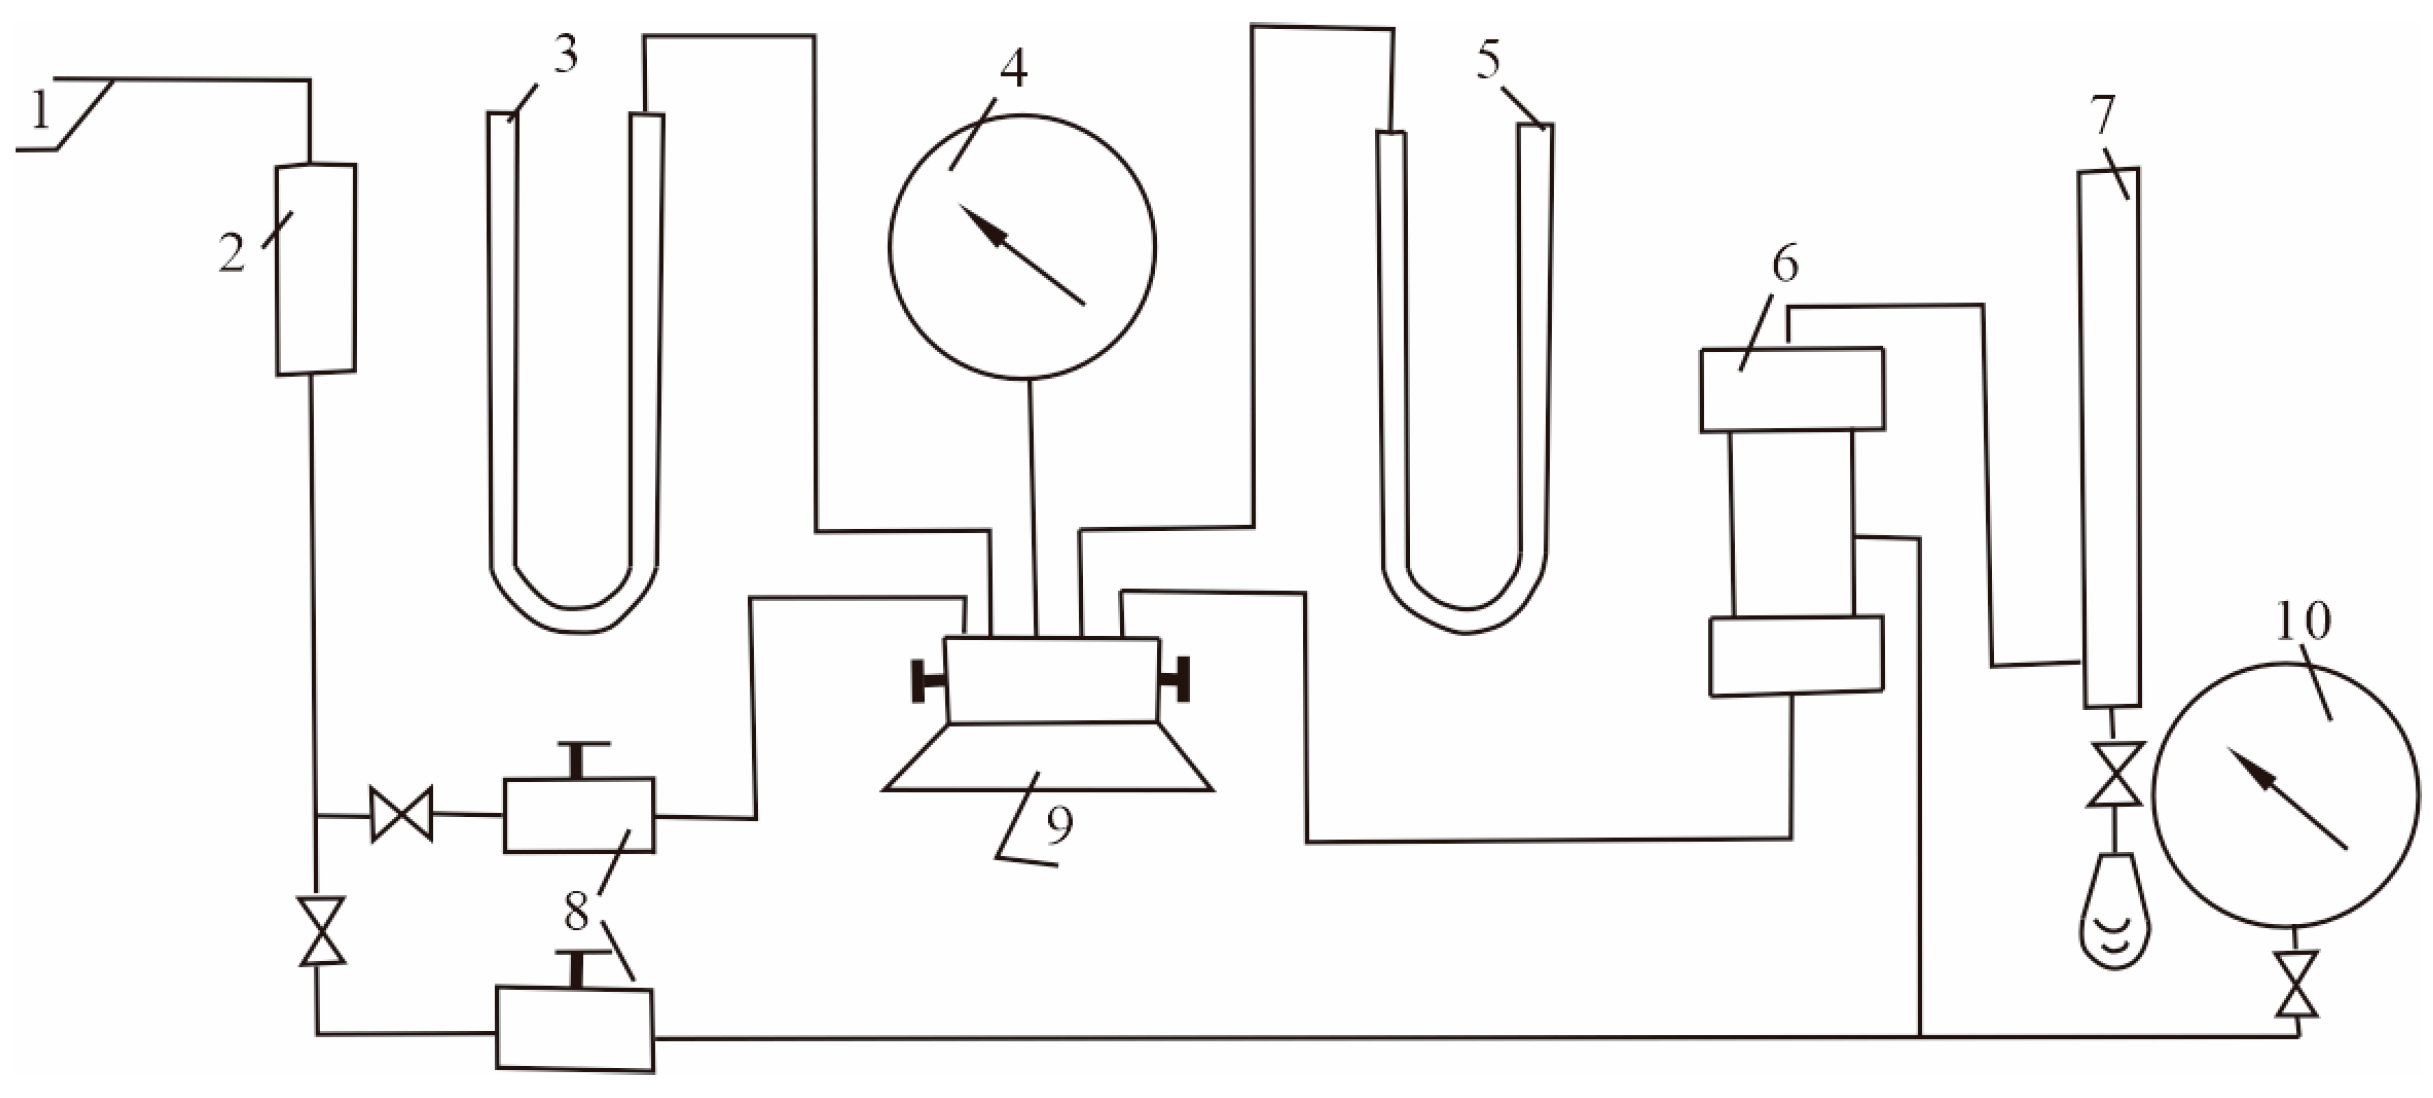
The schematic diagram of the permeameter, which is one of the processes for measuring gas permeability, is shown in Figure 6. It specifically includes the following:
Figure 6.
Schematic diagram of the permeameter. 1—gas source; 2—drying tower; 3—mercury manometer; 4—standard pressure gauge; 5—water column manometer; 6—core holder; 7—soap film flowmeter; 8—regulating valve; 9—six-way valve seat; 10—pressure gauge.
- ①
- Pressure gauges, mercury manometers, and water column manometers;
- ②
- Soap film flow meters or restrictors;
- ③
- Hassler-type core holders are designed for cylindrical rock samples. To ensure a proper seal, the rubber sleeves in the holders must have good elasticity and the confining pressure should be set between 1.4 and 2.8 MPa.
- (3)
- Experimental Steps
- ①
- Use 3–5 standard blocks to check the instrument’s reliability. Compare the measured values of the standard blocks with their calibrated values. If the relative error is within 5%, the instrument used is considered qualified.
- ②
- For the measurement of core dimensions, vernier calipers can be used to measure regularly shaped rock samples. If the rock samples need to be encapsulated with other materials, use calipers to measure their lengths, and use other methods to measure their volumes. Then, divide the total volume by the length to obtain the average cross-sectional area of the rock samples.
- ③
- Load the rock samples to be tested into the appropriate core holders and apply the sealing pressure.
- ④
- When dry gas flows through the rock samples, measure the gas flow velocity and adjust the pressure difference across the sample by controlling the gas flow rate. Record both the inlet and outlet pressures, as well as the gas flow velocity.
- ⑤
- After a batch (one time) of samples has been measured, re-measure the standard blocks according to the requirements in the first step of this procedure. Compare the measured values with the standard values to check whether they meet the requirements. If they do not meet the requirements, find out the reasons and re-measure the samples.
Based on the permeability measurements in both parallel and perpendicular directions to the bedding planes, along with the pore structure observations from casting thin sections, the differences in conductive performance across various directions of porous and fractured mudstone and sandstone samples are compared and analyzed. From these results, the charging direction of natural gas in the permeable and fractured mudstone and sandstone is determined.
4. Results Analysis
4.1. Bedding Plane Impact on Mudstone Pore Network Distribution
Conventional permeability tests were conducted on 12 mudstone samples in 3 groups, with the results shown in Table 2. For sample D, the porosities measured in the parallel direction to the bedding plane were 10.2% and 9.1%, while the permeabilities were 0.0802 × 10⁻3 μm2 and 130.0 × 10⁻3 μm2, respectively (sample B-H2 contains fractures). In the perpendicular direction, the porosities were 10.4% and 9.9%, with permeabilities of 0.0440 × 10⁻3 μm2 and 0.0618 × 10⁻3 μm2, respectively, giving an average value of 0.0529 × 10⁻3 μm2. For sample B, the porosities in the parallel direction were 1.4% and 1.6%, with permeabilities of 0.0194 × 10⁻3 μm2 and 0.0189 × 10⁻3 μm2, yielding an average of 0.0192 × 10⁻3 μm2. In the perpendicular direction, the porosities were 0.7% and 0.8%, with permeabilities of 0.0216 × 10⁻3 μm2 and 0.0162 × 10⁻3 μm2, respectively, averaging 0.0189 × 10⁻3 μm2. For sample J, the porosities in the parallel direction were 1.4% and 1.5%, with permeabilities of 0.0551 × 10⁻3 μm2 and 0.1080 × 10⁻3 μm2, respectively, resulting in an average of 0.0816 × 10⁻3 μm2. In the perpendicular direction, the porosities were 2.2% and 1.1%, with permeabilities of 0.0223 × 10⁻3 μm2 and 0.0205 × 10⁻3 μm2, respectively, averaging 0.0214 × 10⁻3 μm2.
Table 2.
Comparison of permeability between the parallel and perpendicular directions to the bedding plane for mudstone samples.
The difference in porosity between the parallel and perpendicular directions to the bedding plane of mudstone is not significant. The permeabilities generally range from 0.0162 to 0.108 × 10⁻3 μm2. The average permeability in the parallel direction is 0.0603 × 10⁻3 μm2, while in the perpendicular direction, it is 0.03107 × 10⁻3 μm2. The permeability is higher in the parallel direction than in the perpendicular direction to the bedding plane.
As shown above, the permeability in the parallel direction to the bedding plane of mudstone is higher than in the perpendicular direction. The ratio of permeability in the parallel direction to that in the perpendicular direction generally ranges from 1.013 to 3.811.
4.2. Variation in Porosity and Permeability in Mudstone Under Pressure Changes
To simulate the burial and uplift processes of hydrocarbon source rocks under real underground conditions as much as possible, based on the above experiments, some mudstone samples were selected and vertically pressurized. During the pressurization process, the changes in their permeability with the variation in pressure were measured. After the pressurization measurement was completed, the samples were depressurized, and the changes in the samples’ permeability as the pressure decreased were measured simultaneously.
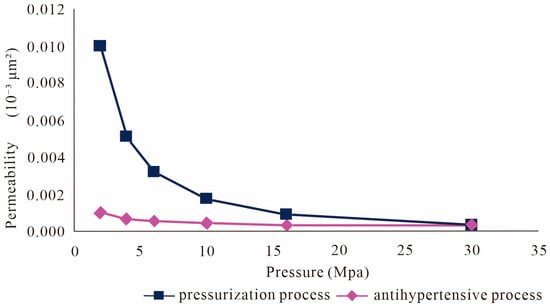
Figure 7 presents two permeability variation curves for a sample during the pressurization and depressurization processes. As shown, during pressurization from the initial state to 10 MPa, the permeability rapidly decreased by 80%. From 10 MPa to 30 MPa, the permeability dropped more slowly. After completing the pressurization, the permeability of the mudstone sample was only about 3% of its original value. During depressurization, the permeability gradually recovered, increasing by approximately 75%.
Figure 7.
The variation law of permeability of mudstone samples under two conditions.
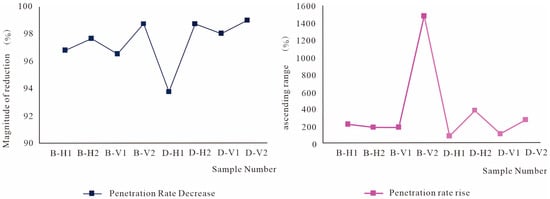
As shown in Figure 8, the experimental results of multiple sample groups were analyzed to determine the reduction and increase ranges of permeability during pressurization and depressurization. During pressurization, the permeability reduction for several groups ranged from 93.72% to 98.96%, with an average reduction of 97.38%. At a pressure of 30 MPa, the permeability was only 3% of the original value.
Figure 8.
The variation law of permeability of mudstone samples under two conditions (pressurization on the left and depressurization on the right).
During depressurization, the permeability increase for several sample groups ranged from 75.51% to 1472.65%, with an average increase of 357.63%. This shows that the permeability of mudstone increased significantly during the depressurization process.
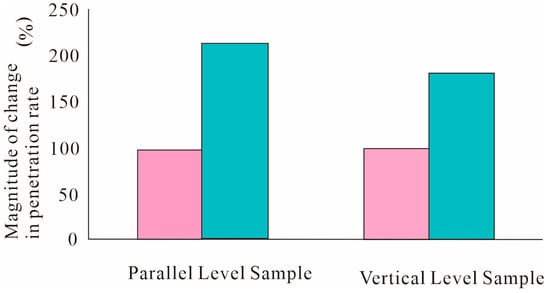
As shown in Figure 8 and Figure 9, the permeability variations in mudstone samples in both directions were measured during the pressurization and depressurization experiments. During pressurization, the permeabilities in both the parallel and perpendicular directions to the bedding plane decreased. The average reduction rate of permeability in the parallel direction was 96.72%, and in the perpendicular direction, it was 98.04%. This indicates that during the burial process, the permeability of the mudstone samples decreased rapidly, with significant reductions in both directions.
Figure 9.
Comparison of the average reduction and increase ranges of permeability for mudstone samples (Red represents the pressurization process, and blue represents the depressurization process).
During depressurization, the increase in permeability was notably smaller in the direction perpendicular to the bedding plane compared to the direction parallel to the bedding plane. The average increase in the perpendicular direction was 211.80%, while in the parallel direction, it was 180.39%. This suggests that in an underground uplift environment, the permeability in the direction parallel to the bedding plane is superior to that in the perpendicular direction.
4.3. Permeability and Fracturing in Mudstone Samples
In actual underground conditions, as burial depth increases, mudstone develops fractures, leading to significant changes in its permeability. The aim of this experiment is to study the permeability variation before and after fracturing.
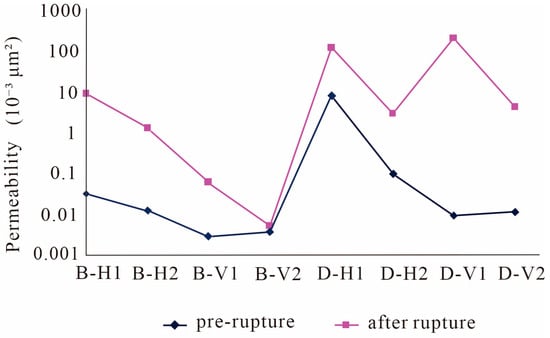
Figure 10 shows a comparison of the permeability data of mudstone samples before and after fracturing. We can see that the permeability of mudstone has been significantly improved after fracturing. The average permeability after fracturing is about 41 times that before fracturing, and at its highest, the ratio of permeability before and after fracturing even reached 21,000.
Figure 10.
Comparison of the permeability of mudstone samples before and after rupture.
The sample data above show that fractures in mudstone significantly enhance its permeability. The experiment further demonstrates that mudstone and its fractures can act as a migration system, influencing the movement of oil and gas.
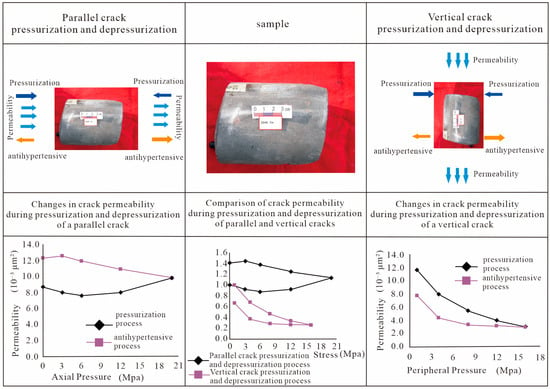
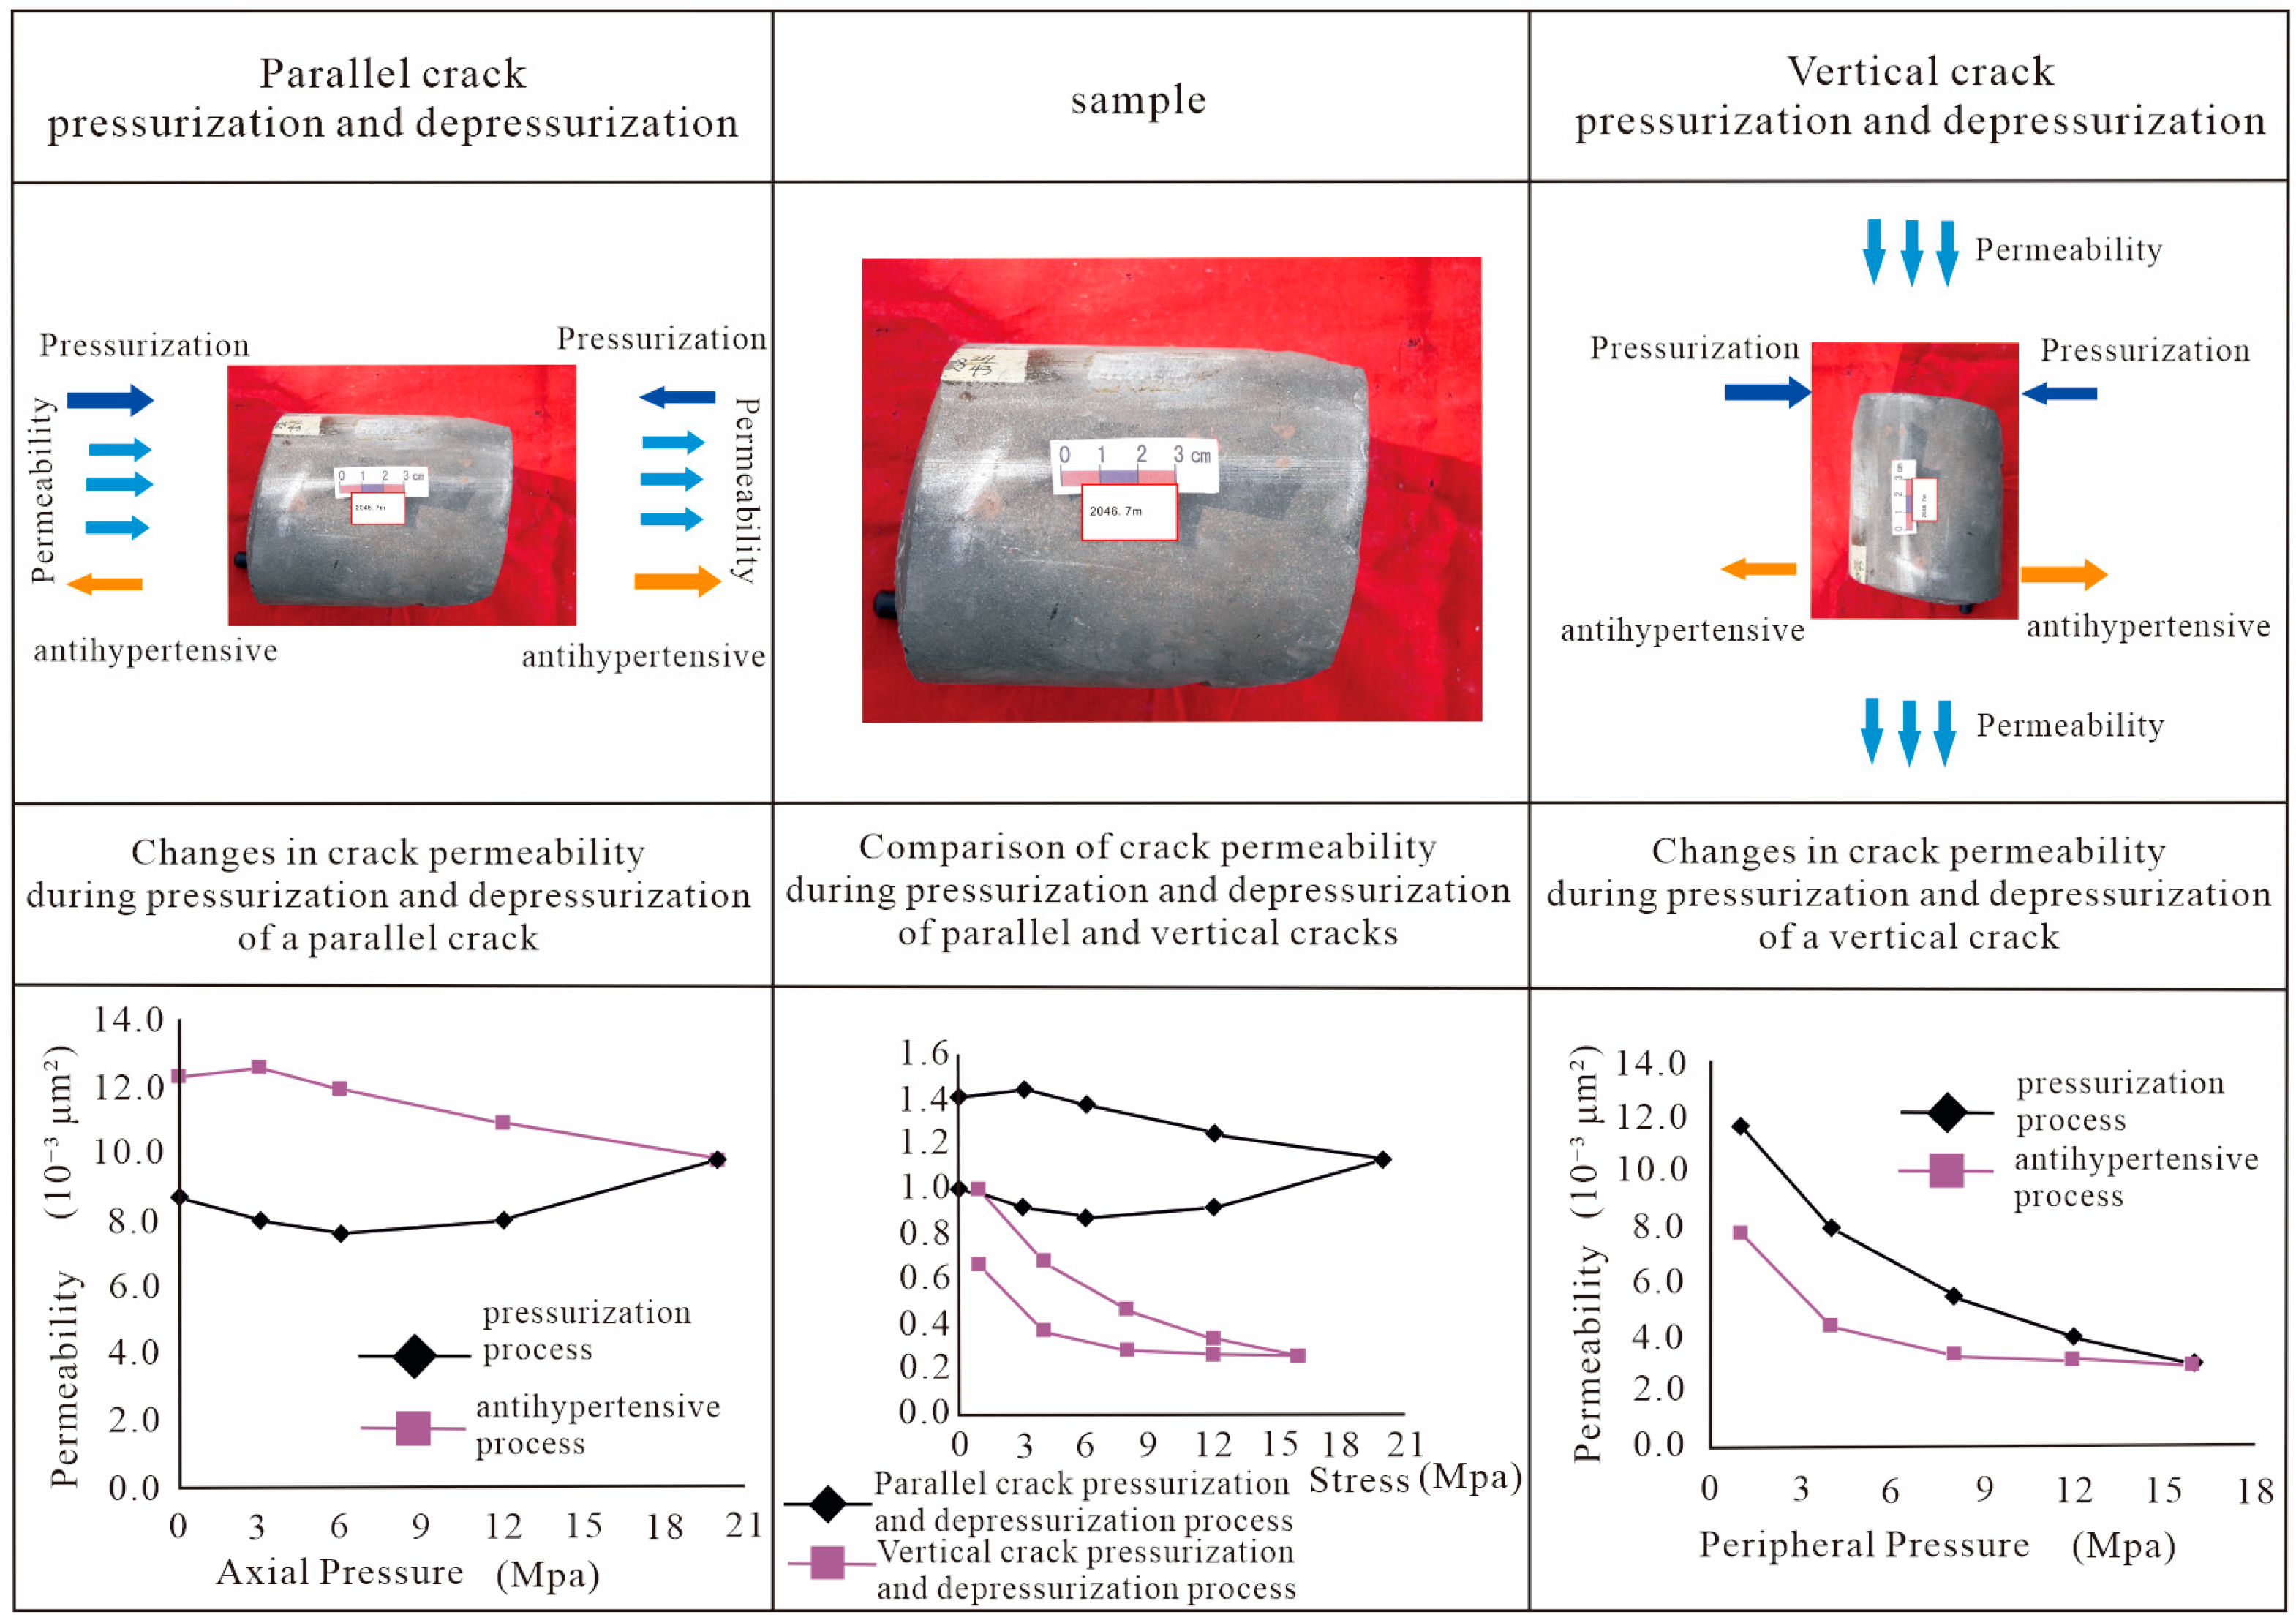
Further experiments on the permeability changes during pressurization and depressurization were conducted on fractured mudstone samples. The results varied among the samples. For some, permeability decreased significantly with further pressurization and depressurization, while for others, permeability increased. In some cases, there was little change in permeability. As the mudstone’s permeability had been nearly compacted to its limit, its impact on the results was minimal. During further pressurization, the fractures created after fracturing had the greatest influence on the permeability. Differences in fracture directions and numbers caused variations in permeability test results. It is speculated that the direction and number of fractures in the mudstone are responsible for this phenomenon. To investigate this, additional experiments were conducted to explore the impact of fracture extension direction on permeability during pressurization.
Based on the test results shown in Figure 11, when the pressure is applied parallel to the fractures, the permeability increases as pressure increases. During depressurization, the permeability further increases and exceeds the initial value. However, when pressure is applied perpendicular to the fractures, the permeability decreases sharply with the increase in pressure. During depressurization, the permeability gradually recovers but remains lower than the initial value. This indicates that after mudstone fractures, changes in its permeability during further burial or uplift depend on the direction and number of fractures. If most fractures are perpendicular to the bedding plane, permeability decreases significantly with further pressurization. If most fractures are parallel to the bedding plane, permeability may increase slightly with pressure. Generally, fractures parallel to the bedding plane have better conductivity than those perpendicular to it. In summary, any fractures generated in mudstone will lead to significant changes in its permeability.
Figure 11.
Changes in the permeability of mudstone fractures during the pressurization and depressurization processes with fractures in different directions.
4.4. Bedding Plane Impact on Sandstone Pore Network Distribution
The permeability results measured in different directions for three groups of samples are shown in Table 3. For fine sandstone, the porosities in the direction parallel to the bedding plane are 1.3% and 1.3%, with permeabilities of 0.0486 × 10⁻3 μm2 and 0.0492 × 10⁻3 μm2, respectively. The average permeability is 0.0489 × 10⁻3 μm2. In the direction perpendicular to the bedding plane, the porosities are 1.9% and 2.4%, and the permeabilities are 0.0391 × 10⁻3 μm2 and 0.0317 × 10⁻3 μm2, respectively, with an average permeability of 0.0354 × 10⁻3 μm2. For medium sandstone, the porosities in the parallel direction are 7.3% and 7.7%, and the permeabilities are 0.182 × 10⁻3 μm2 and 0.181 × 10⁻3 μm2, with an average permeability of 0.182 × 10⁻3 μm2. In the perpendicular direction, the porosities are 5.2% and 6.1%, and the permeabilities are 0.072 × 10⁻3 μm2 and 0.073 × 10⁻3 μm2, with an average permeability of 0.072 × 10⁻3 μm2. For coarse sandstone, the porosities in the parallel direction are 9.8% and 10.2%, with permeabilities of 4.540 × 10⁻3 μm2 and 3.150 × 10⁻3 μm2, respectively. The average permeability is 3.845 × 10⁻3 μm2. In the perpendicular direction, the porosities are 10.3% and 9.7%, and the permeabilities are 1.170 × 10⁻3 μm2 and 1.580 × 10⁻3 μm2, respectively, with an average permeability of 1.375 × 10⁻3 μm2.
Table 3.
Comparing the permeability of sandstone in the directions parallel and perpendicular to the bedding plane.
As observed from above, for porous sandstone, there is little difference in porosity between the direction parallel to the bedding plane and the direction perpendicular to it. However, there is a significant difference in permeability, with the permeability parallel to the bedding plane being higher than that perpendicular to it. The permeability ratio between the two directions typically ranges from 1.38 to 2.80.
4.5. Variation in Porosity and Permeability in Sandstone Under Pressure Changes
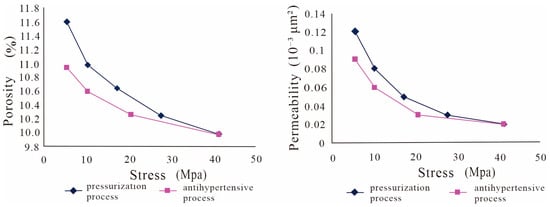
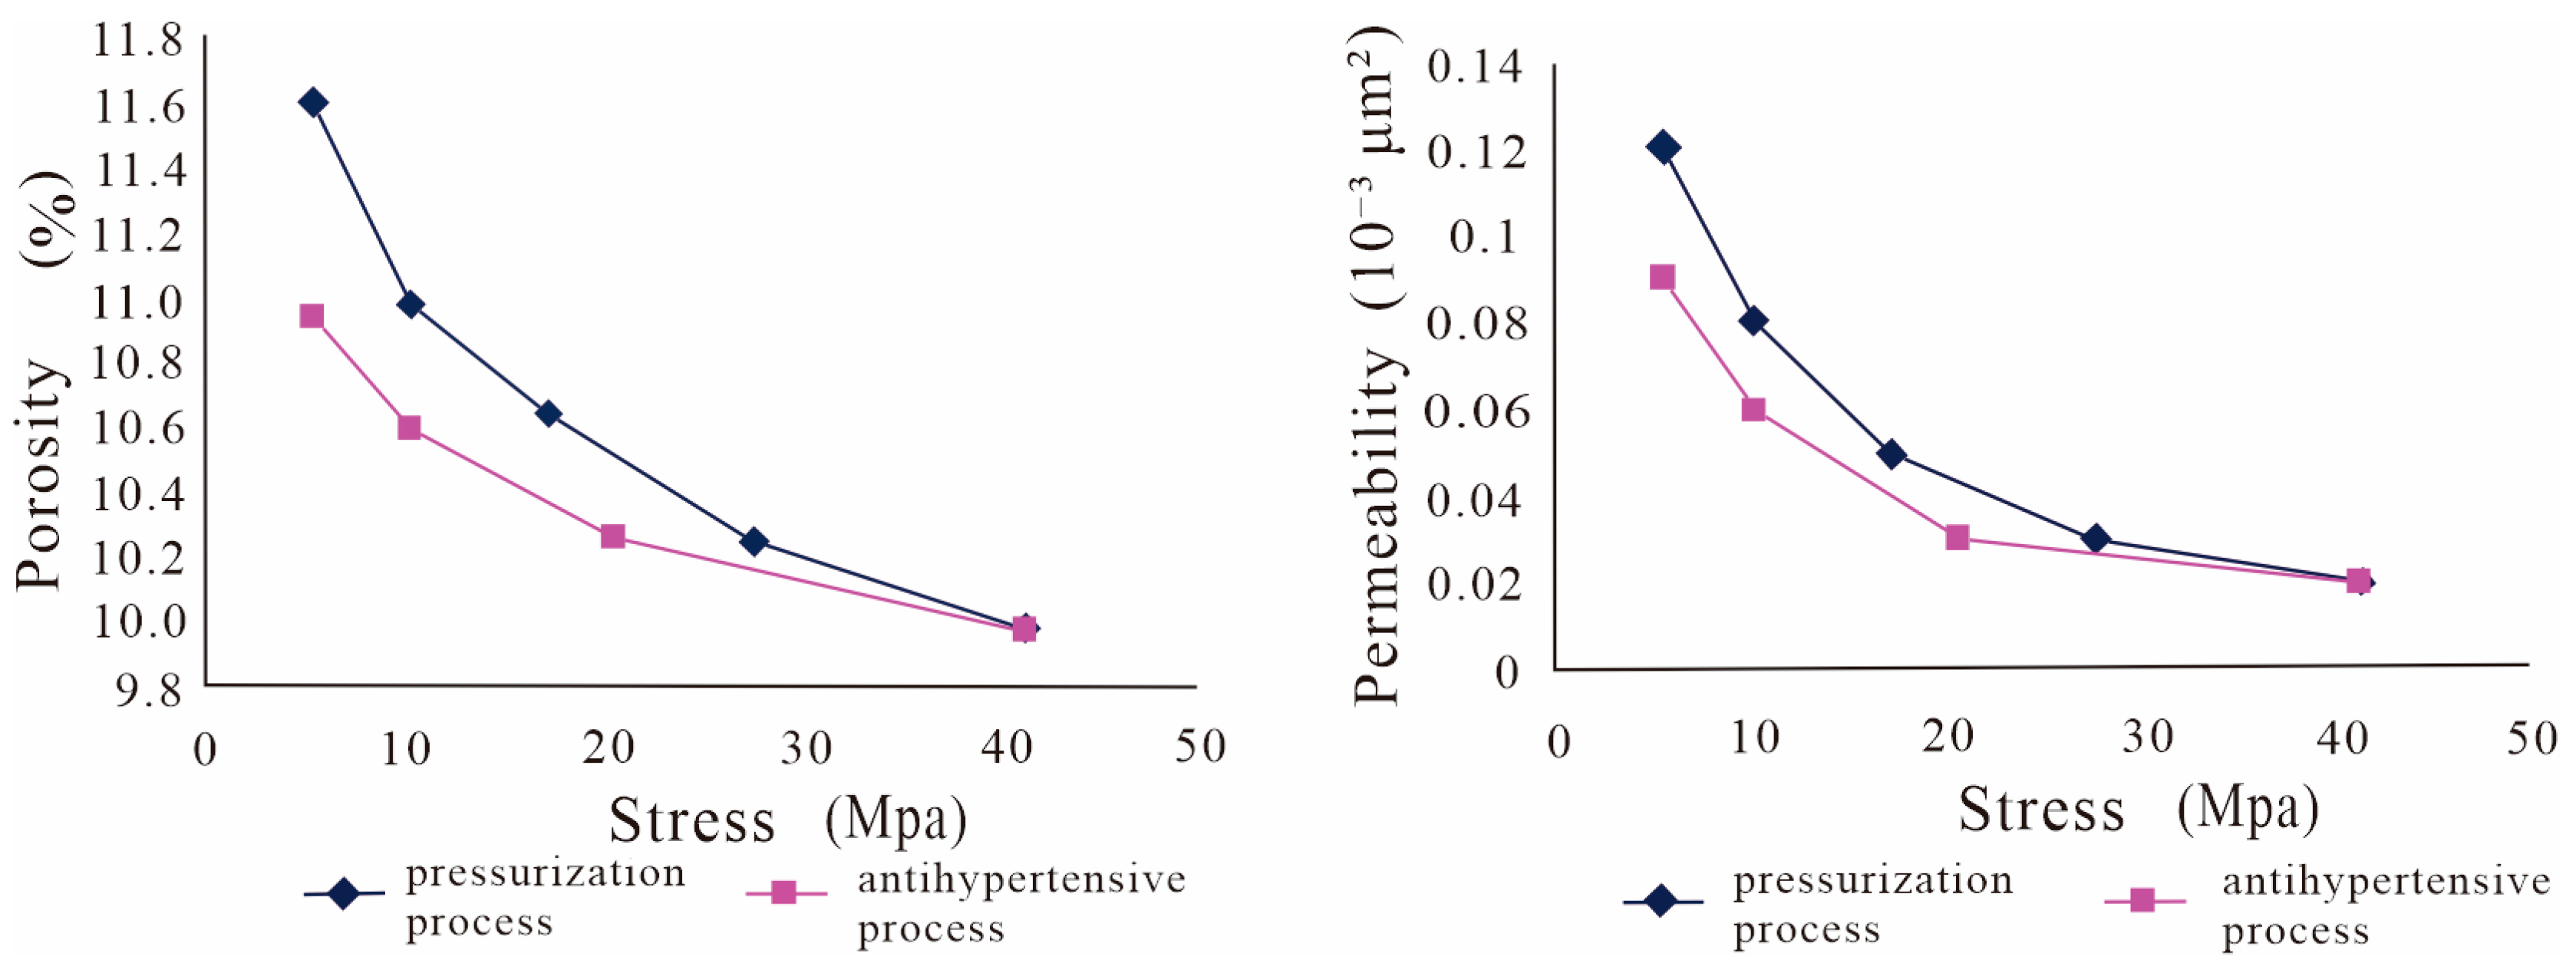
Figure 12 shows two curves of porosity and permeability changes in a certain sample during the pressurization process and the depressurization process. As shown in the figure, during the process when the pressure increased from the initial state to 42 MPa, the permeability of this sample dropped rapidly by 83%. Eventually, after the pressurization process ended, the permeability of the sandstone sample was only about 17% of the original value. During the depressurization process, the permeability of the sample gradually recovered, and the growth rate of the permeability was approximately 78%. However, during these two processes, the porosity of the sample did not change significantly, and its variation range was roughly around 10%.
Figure 12.
The variation in porosity and permeability of sandstone under different conditions.
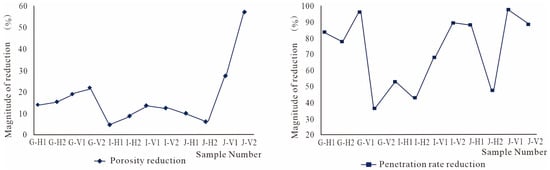
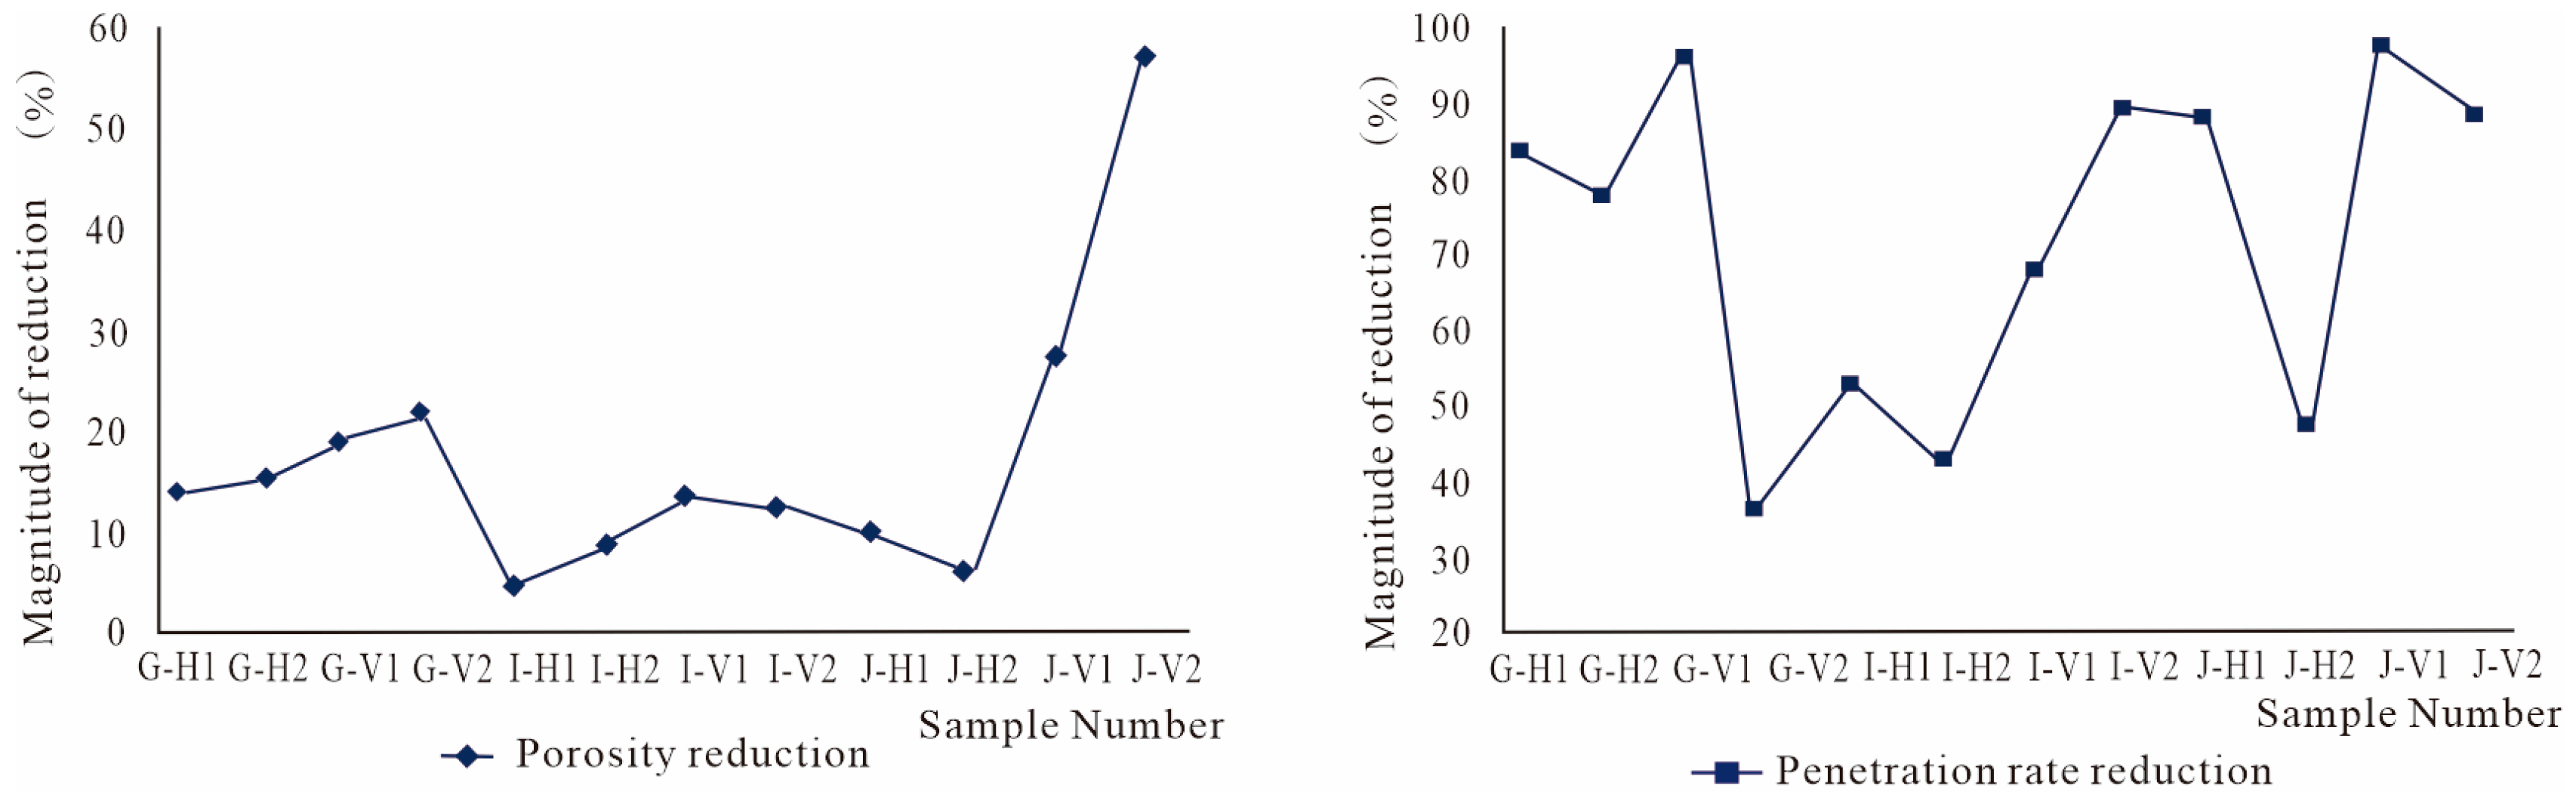
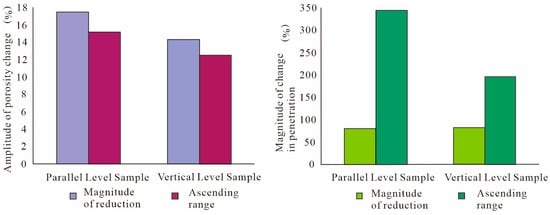
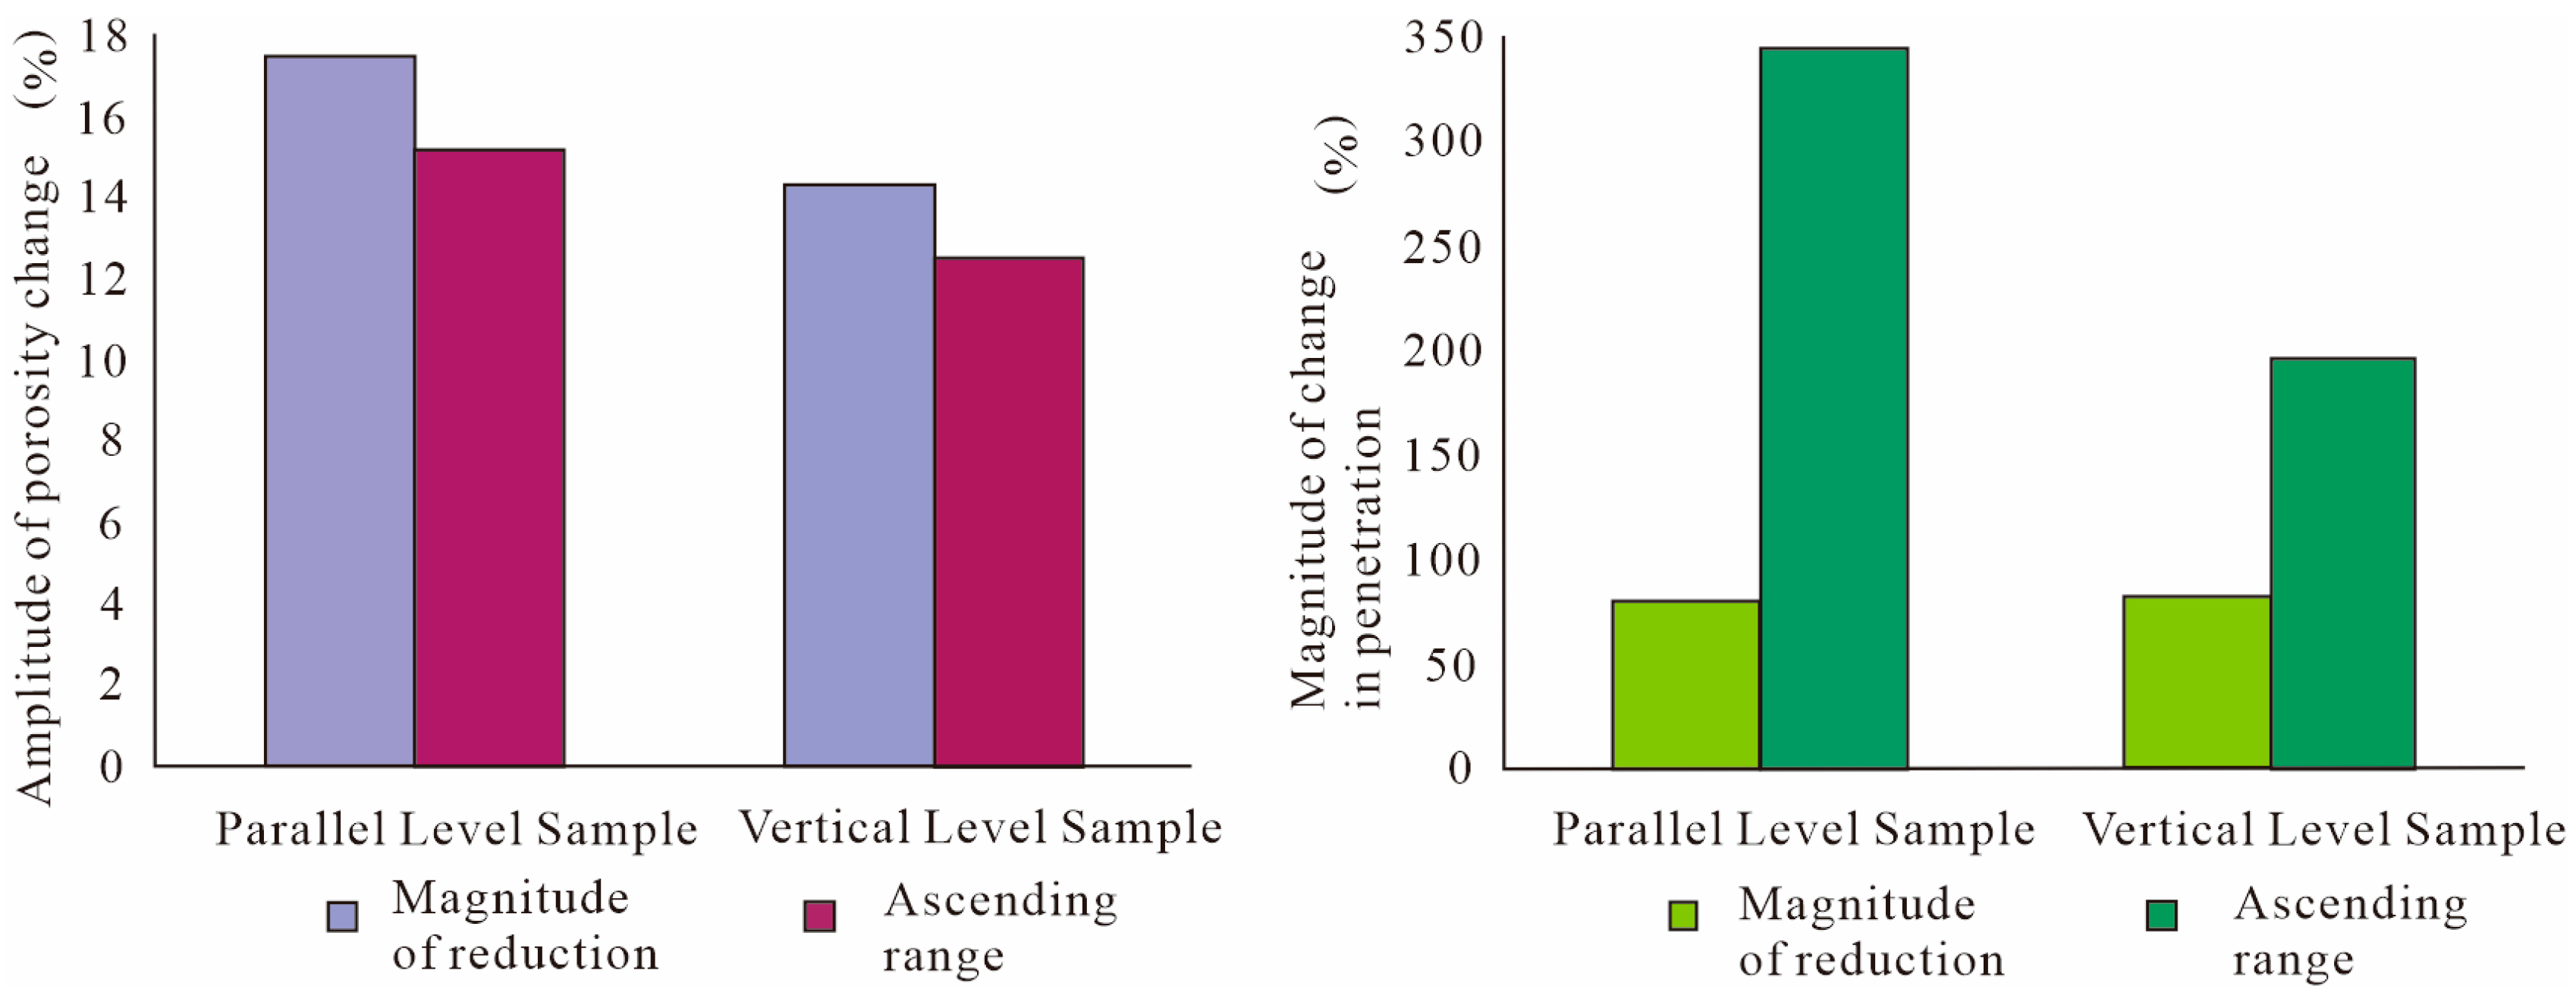
The final results after pressurization, as shown in Figure 13, Figure 14 and Figure 15, reveal a decrease in the porosity of each sample. The sample with the smallest decrease in porosity exhibited a reduction of 4.51%, while the highest decrease reached 56.65%, with an average reduction of approximately 16.03%. The decrease in permeability was more pronounced, with the sample showing the smallest decrease at 35.93%, and the largest at 98.27%, averaging around 81.22%. Additionally, it is evident that the extent of permeability reduction is linked to the shale content in the sandstone: the higher the shale content, the greater the decrease in permeability.
Figure 13.
The reduction amplitudes of the two kinds of data under the pressurization condition of the samples.
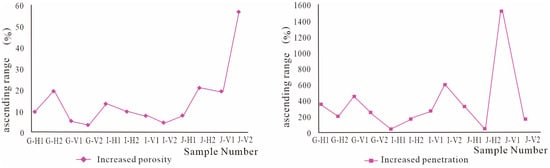
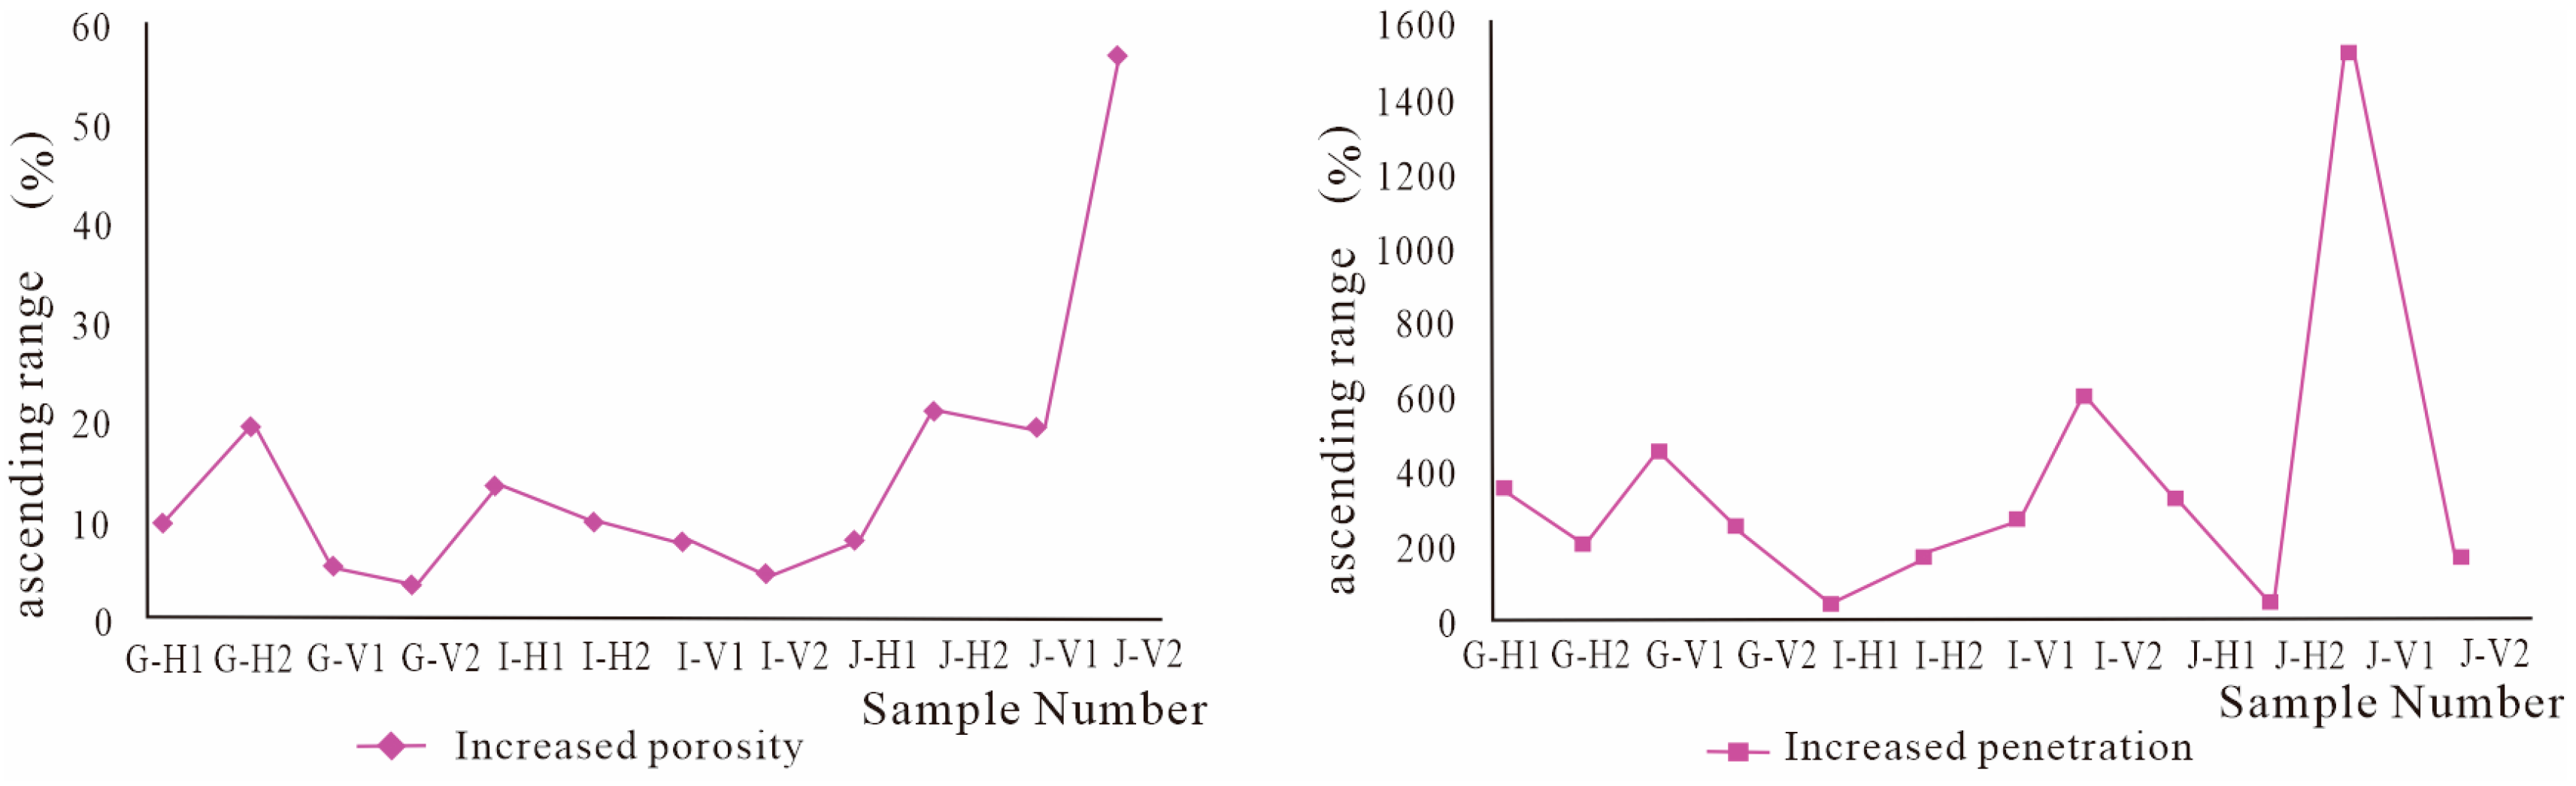
Figure 14.
The increased amplitudes of the two kinds of data under the depressurization condition of the samples.
Figure 15.
The comparison chart of the average values of the variation amplitudes of porosity and permeability of sandstone samples.
During the depressurization process, the porosity of each sample also showed an increasing phenomenon. The lowest increase amplitude was 3.66%, the highest reached 56.82%, and its average value was about 13.88. The lowest increase amplitude of the permeability was 31.79%, the highest was 1520%, and its average value was about 271.06%.
4.6. Permeability and Fracturing in Sandstone Samples
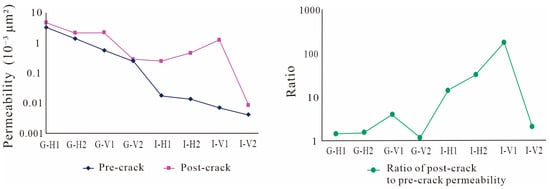
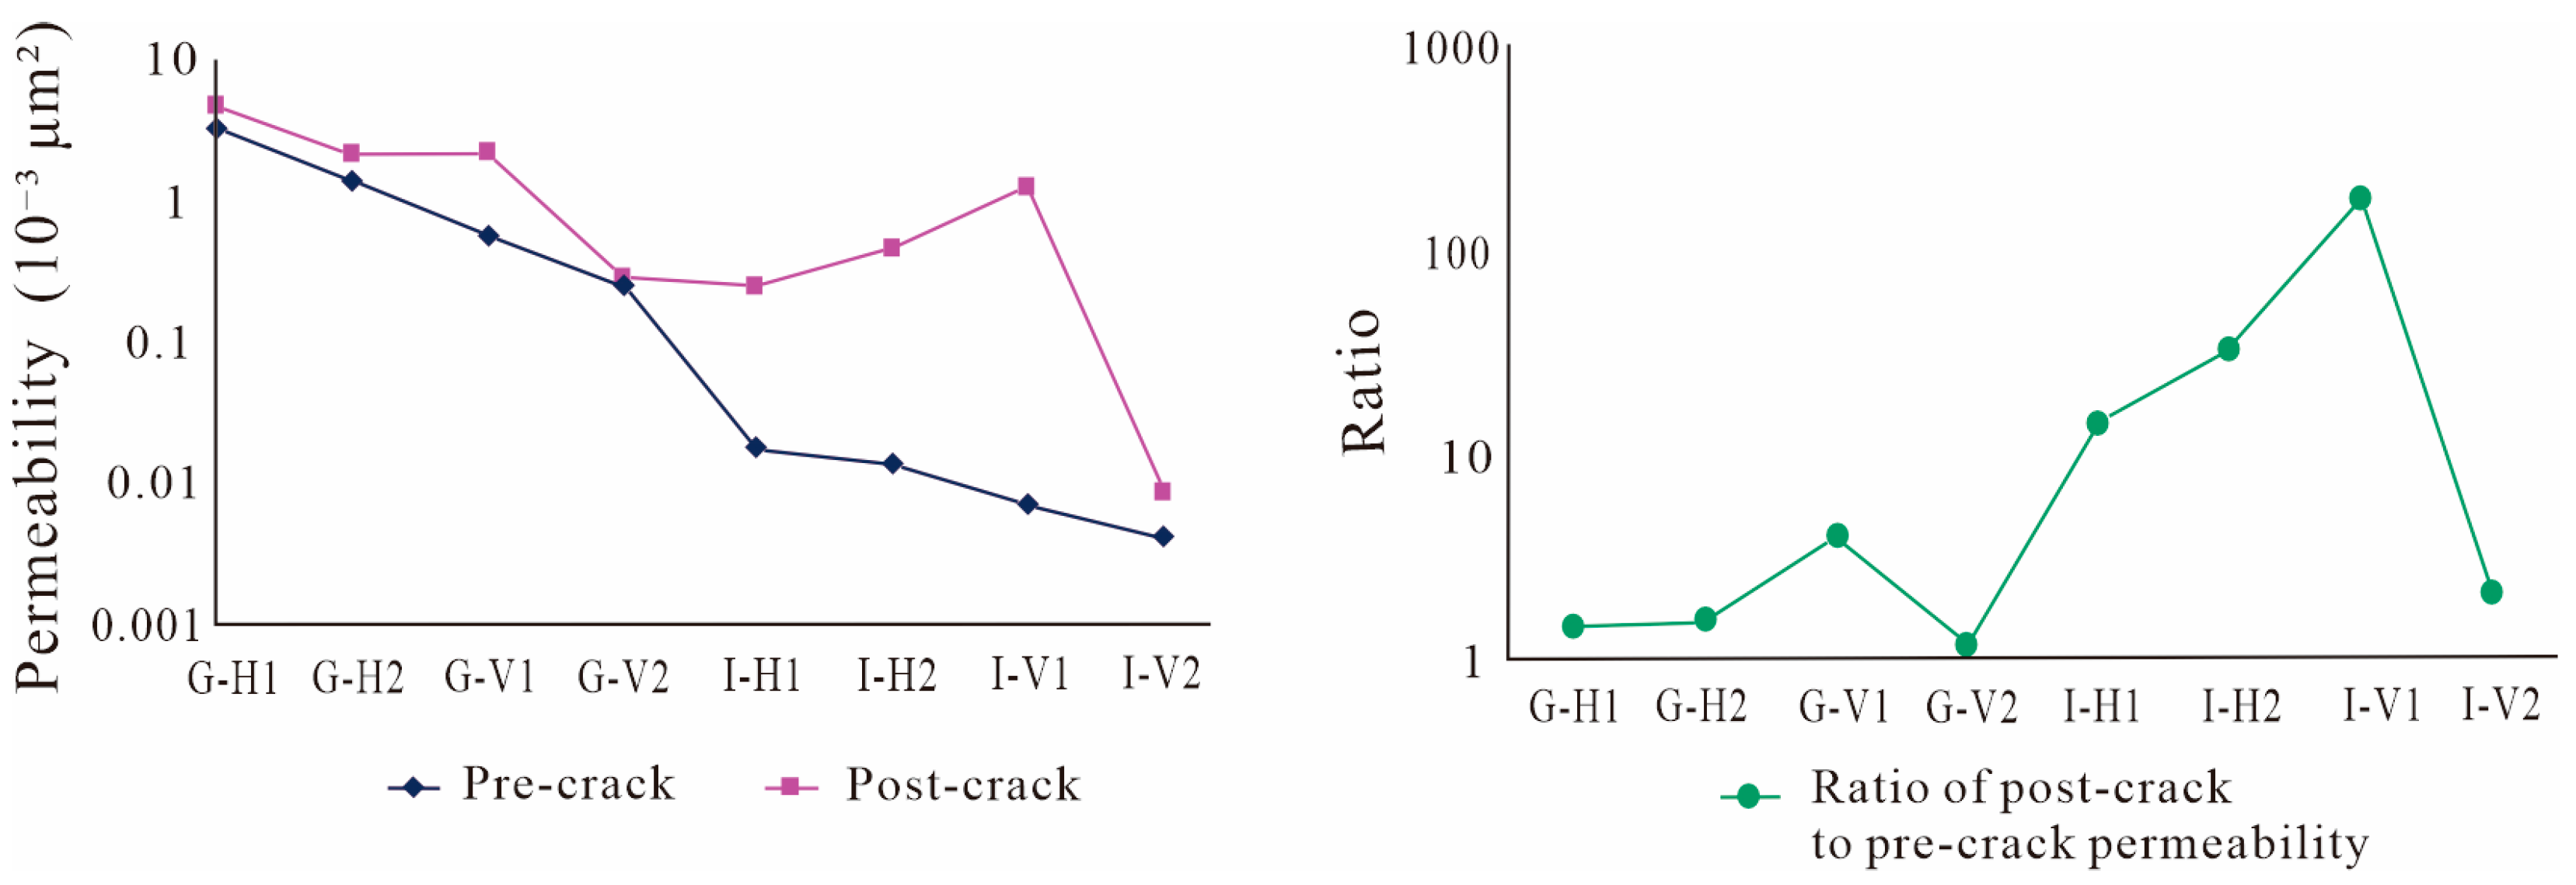
Figure 16 shows the permeability data of sandstone samples before and after fracturing. It can be seen from the figure that the permeability of sandstone has been improved to a certain extent after fracturing. The average ratio of the permeability after fracturing to that before fracturing is above 1, and at its highest, the ratio of the permeability before and after fracturing even reaches 178.57.
Figure 16.
The comparison chart of the permeability of sandstone before and after fracturing.
The sample data above suggest that fractures in sandstone have a positive effect on its permeability. The experiment further demonstrates that sandstone, along with the fractures it forms, can act as a migration pathway, influencing the movement of oil and gas.
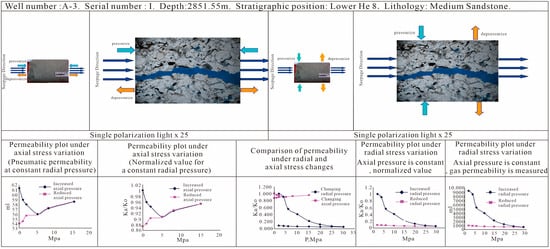
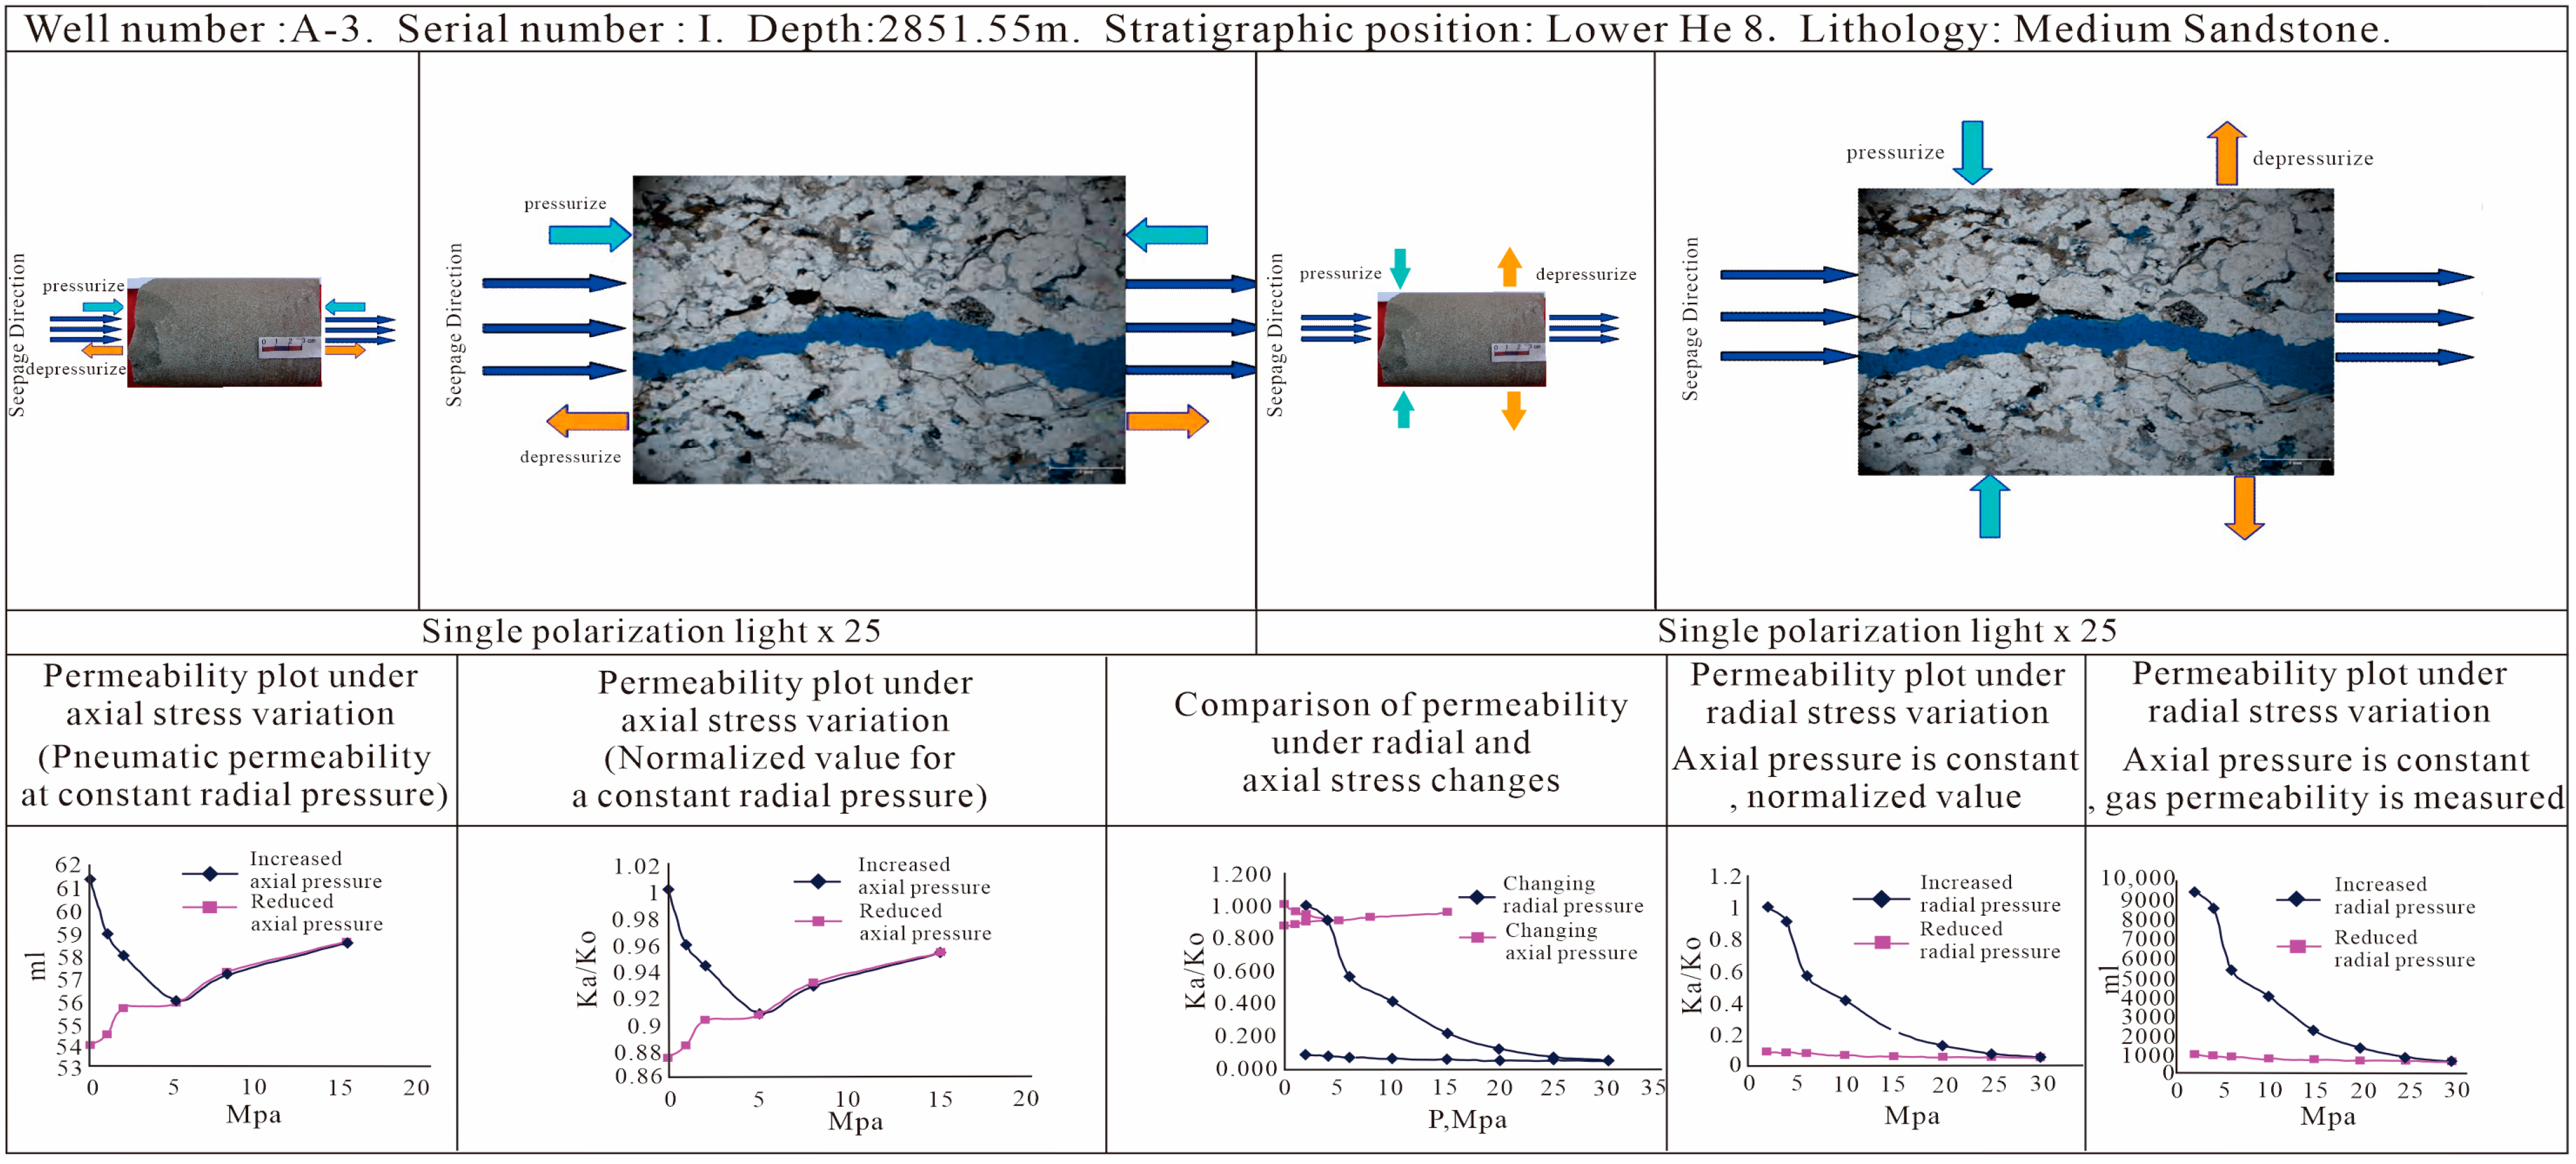
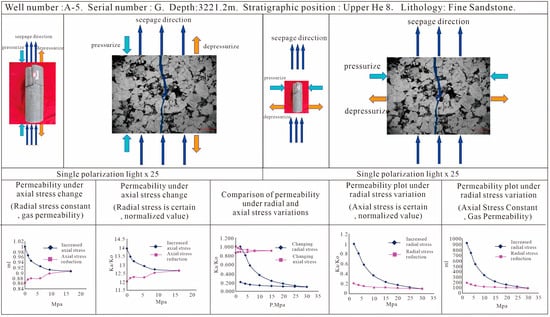
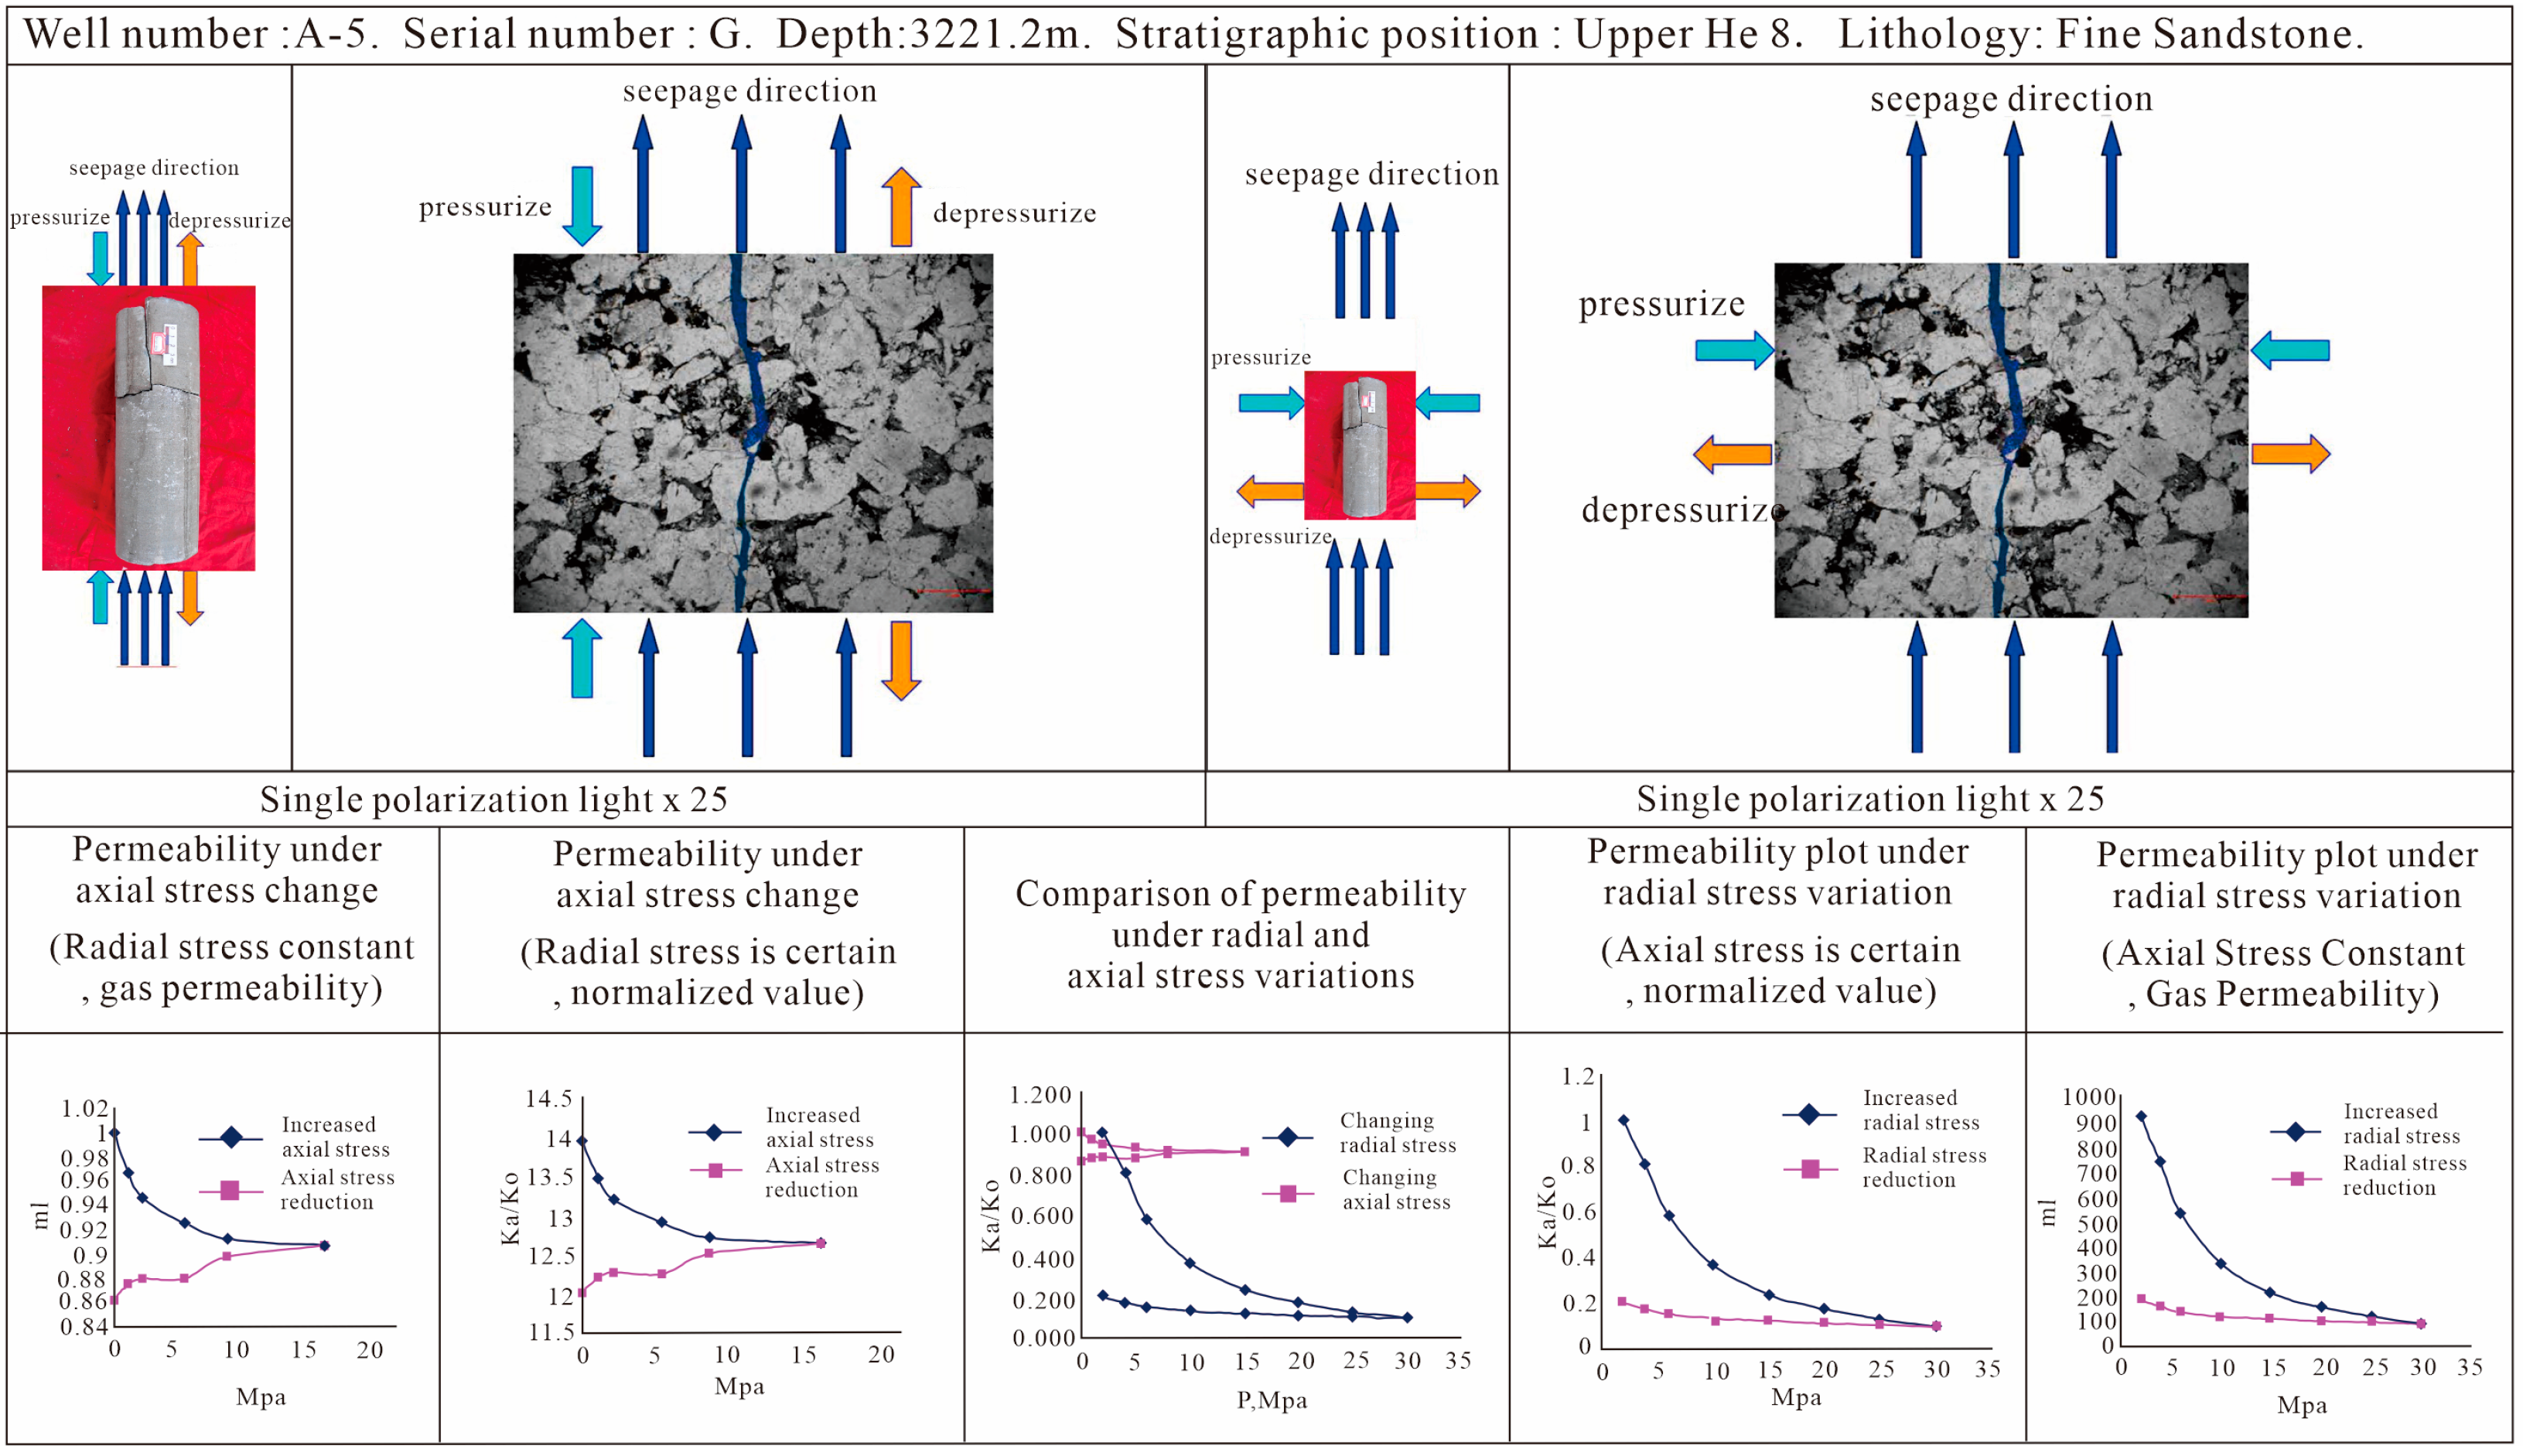
As illustrated in Figure 17 and Figure 18, analogous to the observations made in the mudstone samples, the subsequent pressurization and depressurization experiments on fractured sandstone samples revealed a notable decline in permeability in some samples, whereas, in other samples, permeability exhibited a marked increase under either pressurization or depressurization. Additionally, some samples demonstrated minimal alterations in permeability.
Figure 17.
The diagram of permeability changes in parallel bedding plane fractures in sandstone samples under different stress conditions.
Figure 18.
The diagram illustrating the changes in permeability of fractures perpendicular to the bedding plane in sandstone samples under varying stress conditions.
The experimental results shown in Figure 17 and Figure 18 confirm that the behavior of fractures in sandstone is similar to that in mudstone samples. Under pressurization, where the pressure is applied parallel to the fractures, fracture permeability increases with pressure. During depressurization, permeability continues to rise, exceeding its initial value. In contrast, when the pressure is applied perpendicular to the fractures, fracture permeability decreases rapidly as pressure increases. During depressurization, permeability gradually recovers but remains lower than the initial value. Overall, these experiments demonstrate that the permeability of fractured sandstone is influenced by the direction and number of fractures, especially when the rock is subjected to further burial or uplift.
5. Discussion
5.1. Analysis of Differences in Transport Properties of Source Rocks (Mudstone and Coal Rock)
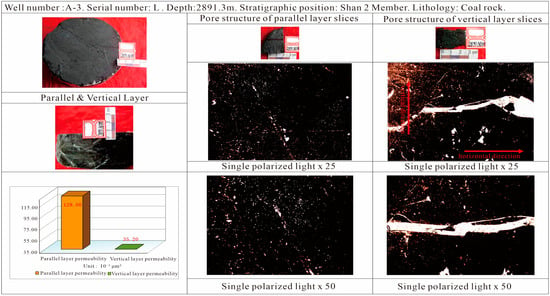
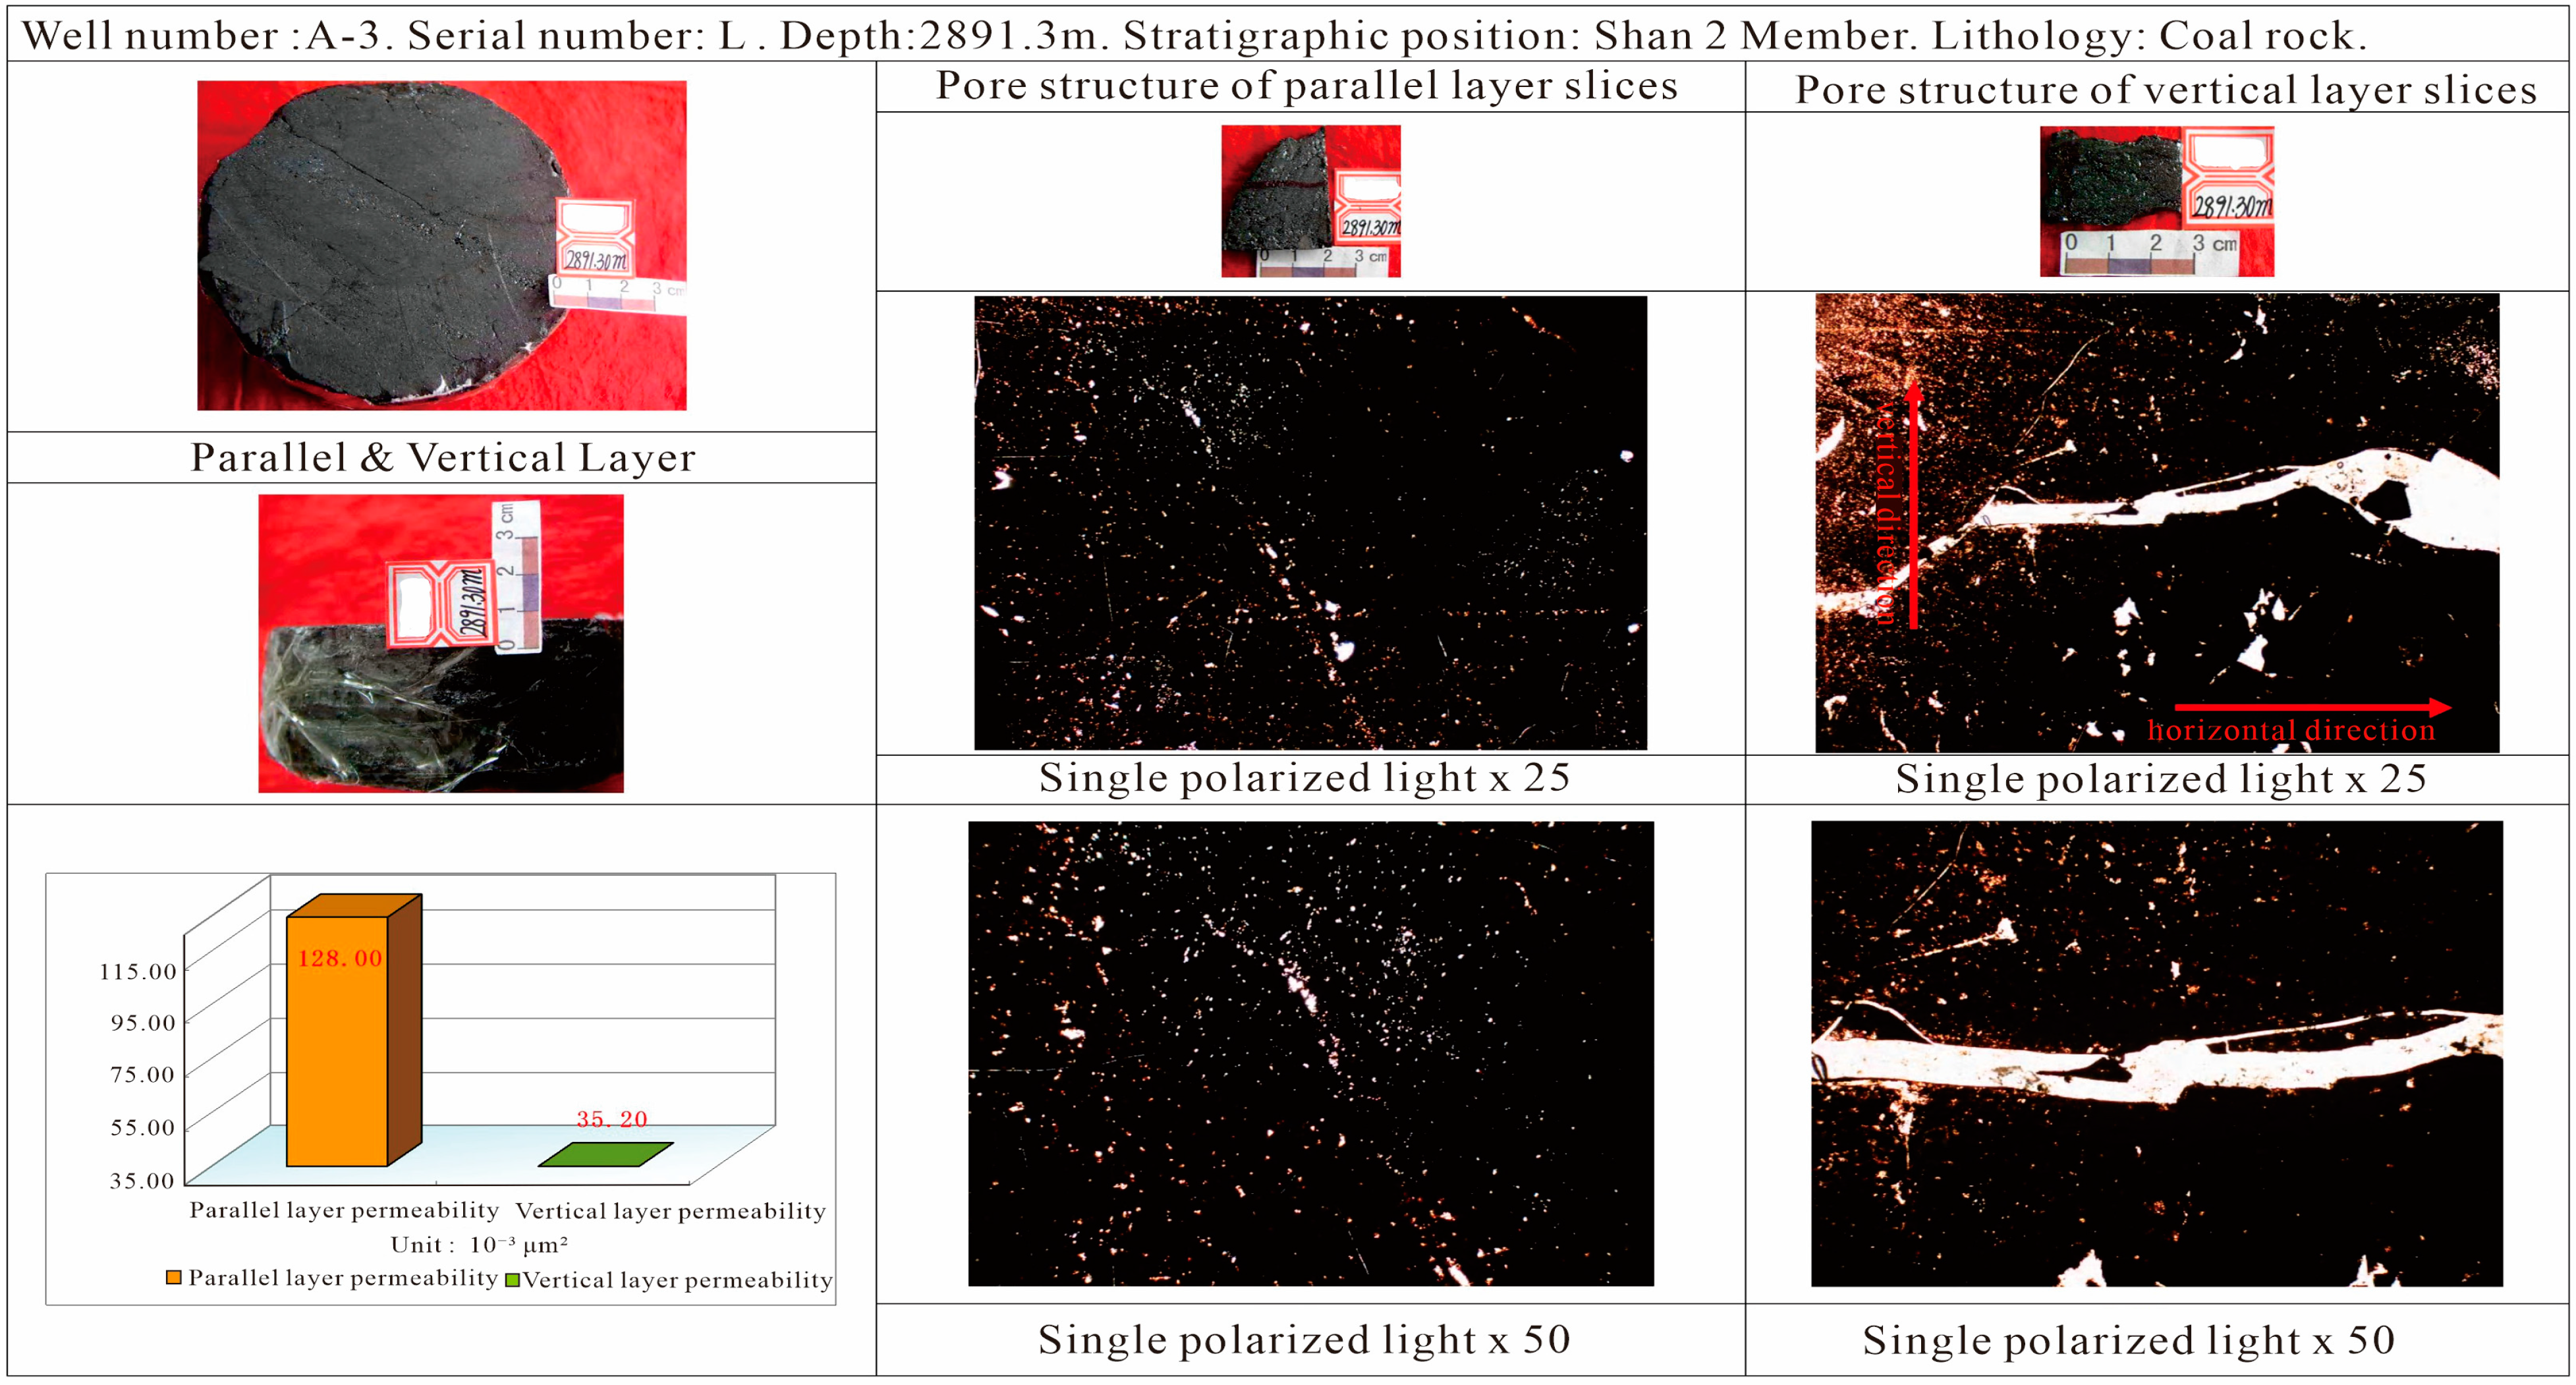
Based on the results of porosity and permeability measurements, it was found that both mudstone and coal rock exhibit significantly higher permeability in the direction parallel to the bedding plane compared to the direction perpendicular to it. Furthermore, the connectivity parallel to the bedding plane is also superior to that perpendicular to the bedding plane. These results indicate a clear correlation between permeability in different directions and the pore structure of the rock: the direction with higher permeability tends to have better pore connectivity.
Microscopic observations of cast thin sections reveal that full-diameter coal rock develops microfractures in the direction parallel to the bedding plane (Figure 19). Experimental results show that coal rock samples with fractures exhibit much higher permeability and connectivity than those without fractures.
Figure 19.
Comparison chart of the permeability and pore structure of full-diameter coal rock.
In summary, both mudstone and coal rock samples demonstrate the best connectivity along the fracture direction, followed by the direction parallel to the bedding plane, with the poorest connectivity in the direction perpendicular to the bedding plane. Therefore, during the primary migration of oil and gas in source rocks, if fractures are present, the migration will preferentially occur along the fracture direction. In the absence of fractures, migration pathways parallel to the bedding plane will serve as the dominant channels for the primary migration of oil and gas.
5.2. Analysis of Differences in Transport Properties of Sandstone
Based on experimental results, it can be observed that in sandstone samples, the permeability parallel to the bedding plane is greater than that perpendicular to the bedding plane, and the connectivity follows the same pattern. This indicates that, like source rocks (mudstone and coal), the direction of high permeability in sandstone corresponds to better connectivity of the pore structure.
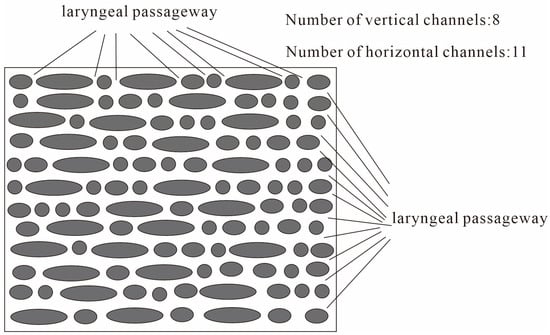
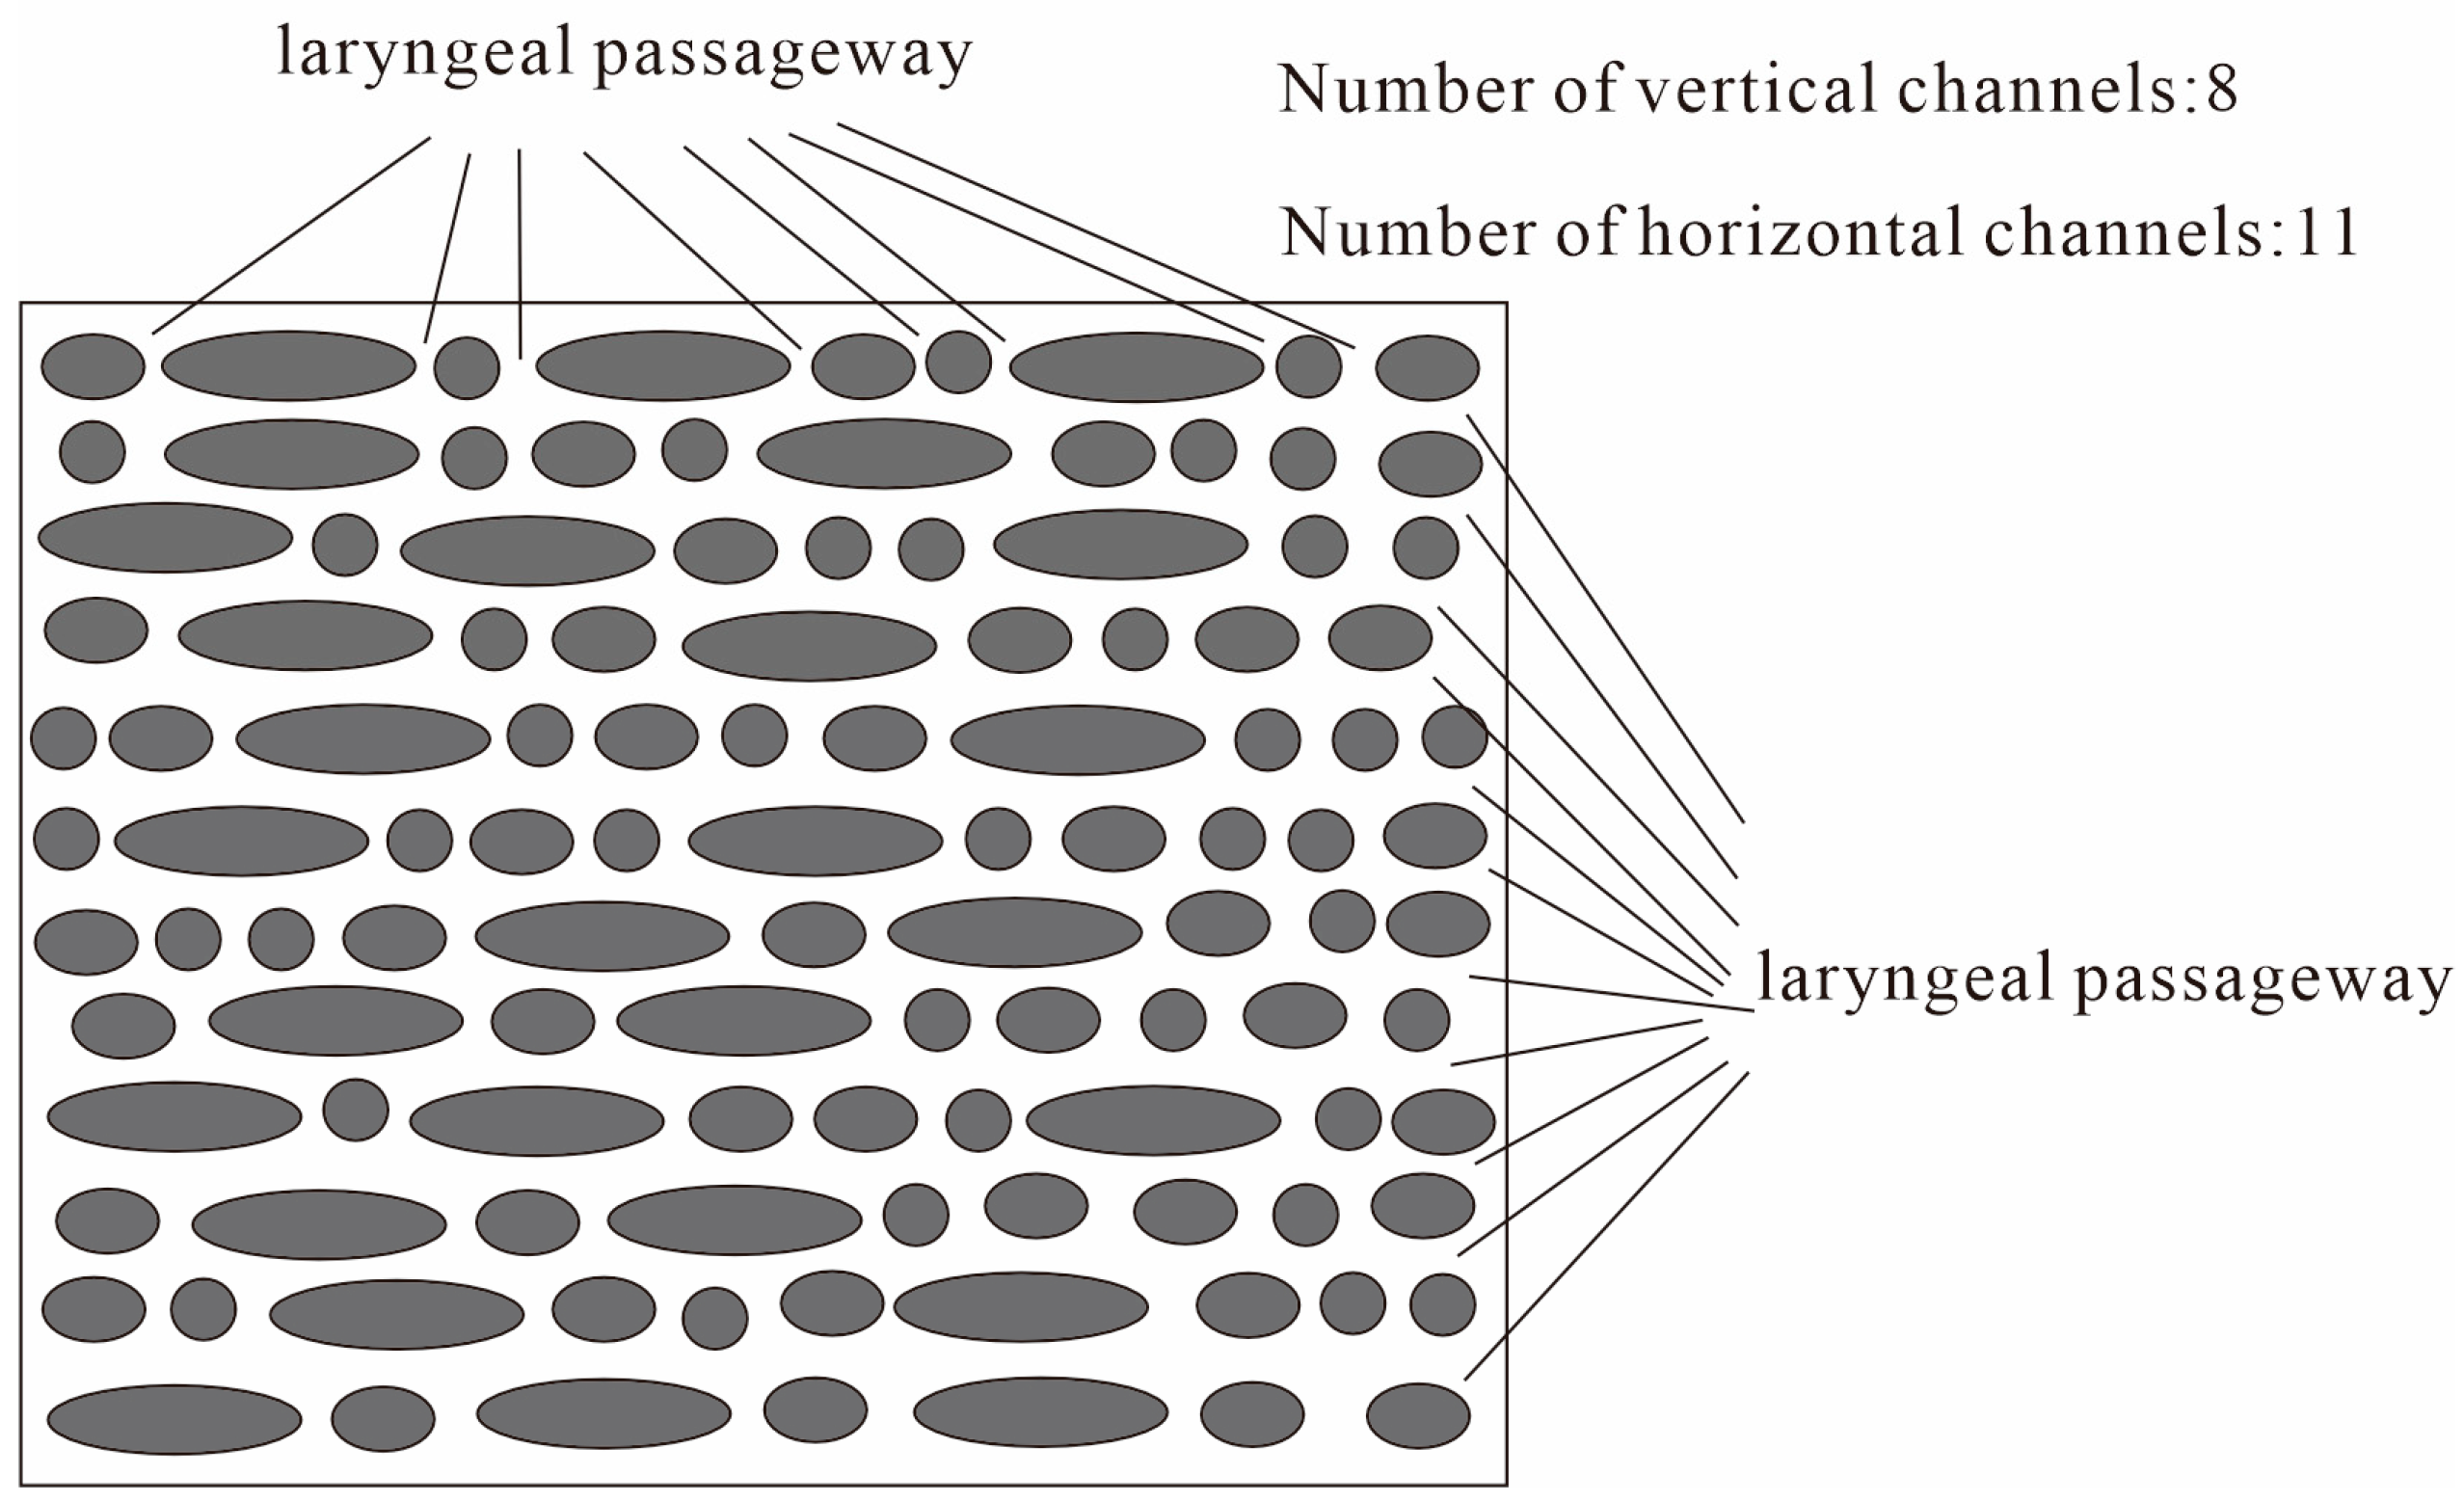
Through conventional permeability measurements and cast thin section observations, the shape of particles in porous clastic sandstone is determined by the relative sizes of the long, medium, and short axes of the clasts. Based on the ratios of these three axes, clastic particles can be categorized into four shapes: spherical, ellipsoidal, prolate spheroidal, and oblate spheroidal. During deposition, the long axis of the particles tends to align horizontally, resulting in a higher number of throat openings in the horizontal direction per unit area, while the number of throat openings in the vertical direction is relatively lower. This means that in the direction parallel to the bedding plane, there are more channels available for oil and gas migration, whereas fewer channels are present in the vertical direction (Figure 20). As a result, oil and gas are more likely to migrate along the direction parallel to the bedding plane under the same driving force. Furthermore, porous sandstone tends to form intragranular and intergranular cracks parallel to the bedding plane, which improves pore connectivity. In contrast, microcracks do not form in the perpendicular direction, leading to poorer pore connectivity.
Figure 20.
A comparison of the number of pore throats in the directions parallel and perpendicular to the bedding plane.
Cast thin section observations reveal that in samples containing fractures, the fractures are predominantly flat and unevenly opened, with the best pore connectivity along the fracture direction. In fractured sandstone samples, whether the fractures are parallel to the bedding or nearly vertical, the permeability along the fracture direction is the highest, followed by the permeability in the direction parallel to the bedding plane, and the lowest permeability is found perpendicular to the bedding plane. Additionally, the coarser the grain size of the sandstone, the higher the permeability (Table 4).
Table 4.
Comparison of permeability in the directions parallel and perpendicular to the bedding plane between fractured sandstone and porous sandstone.
In conclusion, during the secondary migration of oil and gas in sandstone reservoirs, fractures will preferentially direct the migration if they are present. In the absence of fractures, migration will primarily occur along the direction parallel to the bedding plane.
6. Conclusions
- This experimental study demonstrates that, across different rock types, the permeability parallel to the bedding plane is greater than that perpendicular to it. This is primarily due to the higher number of throat channels parallel to the bedding plane compared to those perpendicular.
- As burial depth increases, formation pressure also rises, leading to a decline in the connectivity of various rock types. However, when the pressure reaches a level sufficient to induce fractures, the permeability of the rock increases more than onefold compared to its pre-fracture state. This indicates that rocks exhibit better connectivity when fractures are present.
- Since the connectivity parallel to the bedding plane is superior to that perpendicular to it, migration pathways parallel to the bedding plane will become the dominant channels for both primary and secondary oil and gas migration. In the context of shale gas exploration in the Late Paleozoic of the Ordos Basin, greater attention should be given to studying migration pathways parallel to the bedding plane. This approach will offer new research perspectives for oil and gas migration and contribute to further exploration of potential shale gas resources in the Late Paleozoic of the Ordos Basin.
Author Contributions
Conceptualization, Q.G. and J.Z.; methodology, Q.G.; software, Q.G.; validation, Q.G. and J.Z.; formal analysis, Q.G.; investigation, Q.G.; data curation, Q.G.; writing—original draft preparation, Q.G.; writing—review and editing, J.Z.; supervision, J.Z.; project administration, J.Z. All authors have read and agreed to the published version of the manuscript.
Funding
This study was supported by The “14th Five Year Plan” Prospective Basic Science and Technology Project, China National Petroleum Corporation (Grant No. 2021DJ2101).
Data Availability Statement
No new data were created or analyzed in this study. Data sharing is not applicable to this article.
Acknowledgments
We would like to thank the reviewers for their professional review work, constructive comments, and valuable suggestions on our manuscript.
Conflicts of Interest
The authors declare no conflicts of interest.
References
- Fu, G.; Meng, Q. Migration translocationsystem and its controlling to reservoir forming and distribution of natural gas in deep strata of Xujia weizi region. Pet. Geol. Recovery Effic. 2004, 11, 18–20. [Google Scholar]
- Guo, Q.; Li, S.; Jin, Z.; Zhou, X.; Liu, C. Characteristics and exploration targets of Chang 7 shale oil in Triassic Yanchang Formation, Ordos Basin, NW China. Pet. Explor. Dev. 2023, 50, 878–893. [Google Scholar] [CrossRef] [Scilit]
- Hu, D.; Wei, Z.; Liu, R.; Wei, X.; Chen, F.; Liu, Z. Enrichment control factors and exploration potential of lacustrine shale oil and gas: A case study of Jurassic in the Fuling area of the Sichuan Basin. Nat. Gas Ind. B 2021, 41, 113–120. [Google Scholar] [CrossRef] [Scilit]
- Jiang, F.; Hu, M.; Hu, T.; Lyu, J.; Huang, L.; Liu, C.; Jiang, Z.; Huang, R.; Zhang, C.; Wu, G.; et al. Controlling factors and models of shale oil enrichment in Lower Permian Fengcheng Formation, Mahu Sag, Junggar Basin, NW China. Pet. Explor. Dev. 2023, 50, 812–825. [Google Scholar] [CrossRef] [Scilit]
- Jia, J.; Yi, W.; Qiu, N.; Chen, C.; Zhou, M.; Miao, W. Petroleum carrier systems and migration and accumulation patterns in Chang8 member of Yanchang Formation in Honghe oilfield. Oil Gas Geol. Recovery 2016, 23, 9–15. [Google Scholar]
- Ju, J. Hydrocarbon Transmission System Characteristics of Buried Hills in West Sag, Liaohe of Depression. Spec. Oil Gas Reserv. 2022, 29, 55–61. [Google Scholar]
- Liu, C.; Chen, S.; Zhao, J.; Chen, G.; Gao, Q. Hydrocarbon transportation system and accumulation simulation of Mesozoic-Cenozoic in south slope of Kuqa foreland basin. Nat. Gas Geosci. 2021, 32, 1450–1462. [Google Scholar]
- Liu, H.; Zhao, S.; Liang, S.; Guo, Q.; Zhu, Y.; Han, X. Hydrocarbon transportation system and reservoir forming model of Es3 in slope belt of Chezhen depression. J. China Univ. Pet. (Ed. Nat. Sci.) 2021, 45, 42–53. [Google Scholar]
- Jin, Z.; Zhang, J.; Tang, X. Unconventional natural gas accumulation system. Nat. Gas Ind. B 2021, 41, 58–68. [Google Scholar] [CrossRef] [Scilit]
- Li, Y.; Xu, K.; Yan, S.; Lin, Y. Study on hydrocarbon carrier system in petroliferous basins. Pet. Geol. Recovery Effic. 2015, 22, 32–36. [Google Scholar]
- Liu, Z. Research on Type Division and Distribution of the Gas Passage Systems in Upper Paleozoic of Ordos Basin. Master’s Thesis, Northwest University, Xi’an, China, 2013. [Google Scholar]
- Shi, X.; Wu, W.; Wu, Q.; Zhong, K.; Jiang, Z.; Miao, H. Controlling Factors and Forming Types of Deep Shale Gas Enrichment in Sichuan Basin, China. Energies 2022, 15, 7023. [Google Scholar] [CrossRef] [Scilit]
- Wang, Y.; Liu, L.; Ji, H.; Song, G.; Wang, X.; Sheng, Y. Structure of a pre-Triassic unconformity and its hydrocarbon transporting characteristics, Wuerhe-Fengnan area, Junggar Basin, China. J. Pet. Sci. Eng. 2019, 173, 820–834. [Google Scholar] [CrossRef] [Scilit]
- Liu, Y. Study on Reservoir Transportation System and Caprock Characteristics of Mesozoic Yanchang Formation in Ordos Basin. Master’s Thesis, Northwest University, Xi’an, China, 2022. [Google Scholar]
- Xu, S.; Hao, F.; Xu, C.; Zou, H.; Zhang, X.; Zong, Y.; Zhang, Y.; Cong, F. Hydrocarbon migration and accumulation in the northwestern Bozhong subbasin, Bohai Bay Basin, China. J. Pet. Sci. Eng. 2019, 172, 477–488. [Google Scholar] [CrossRef] [Scilit]
- Zhang, H.; Zhao, X.; Wang, J.; Jin, F.; Liu, H.; Pu, X.; Dong, X.; Zhao, C.; Wu, F.; Dong, X. Hydrocarbon Migration Pathways and Its Control on Accumulation in Chengbei Fault Zone of Qikou Sag, Bohai Bay Basin, East China. Earth Sci. 2023, 48, 3053–3067. [Google Scholar]
- Zhang, H.; Wang, X.; Jia, C.; Li, J.; Meng, Q.; Jiang, L.; Wang, Y.; Bai, X.; Zheng, Q. Whole petroleum system and hydrocarbon accumulation model in shallow and medium strata in northern Songliao Basin, NE China. Pet. Explor. Dev. 2023, 50, 784–797. [Google Scholar] [CrossRef] [Scilit]
- Yang, G.; Zheng, R.; Zhao, Y.; Wang, Z.; Xie, C.; Wu, Y.; Wang, C. New understanding of petroleum migration and accumulation law in Kendong area, Jiyang depression. Pet. Geol. Recovery Effic. 2015, 22, 10–15. [Google Scholar]
- Zhang, P.; Zhang, Z.; Jiang, S.; Zhou, D.; Wan, J.; Sun, B.; Zhou, C.; Wang, Z. Geological characteristics and enrichment model of Permian Mao 1 Member shale gas reservoirs in Nanchuan area. Nat. Gas Ind. B 2022, 9, 96–105. [Google Scholar] [CrossRef] [Scilit]
- Zhang, J.; Shi, M.; Wang, D.; Tong, Z.; Hou, X.; Niu, J.; Li, X.; Li, Z.; Zhang, P.; Huang, Y. Fields and directions for shale gas exploration in China. Nat. Gas Ind. B 2022, 9, 20–32. [Google Scholar] [CrossRef] [Scilit]
- Wang, W.; Pang, X.; Chen, Z.; Chen, D.; Wang, Y.; Yang, X.; Luo, B.; Zhang, W.; Zhang, X.; Li, C.; et al. Quantitative evaluation of transport efficiency of fault-reservoir composite migration pathway systems in carbonate petroliferous basins. Energy 2021, 222, 119983. [Google Scholar] [CrossRef] [Scilit]
- Zumberge, J.E.; Curtis, J.B.; Reed, J.D.; Brown, S.W. Migration happens: Geochemical evidence for movement of hydrocarbons in unconventional petroleum systems. In Proceedings of the SPE/AAPG/SEG Unconventional Resources Technology Conference, San Antonio, TX, USA, 1–3 August 2016. [Google Scholar]
- Luo, X.; Hu, C.; Xiao, Z.; Zhao, J.; Zhang, B.; Yang, W.; Zhao, H.; Zhao, F.; Lei, Y.; Zhang, L. Effects of carrier bed heterogeneity on hydrocarbon migration. Mar. Pet. Geol. 2015, 68, 120–131. [Google Scholar] [CrossRef] [Scilit]
- Song, X.; Lü, X.; Shen, Y.; Guo, S. Hydrocarbon migration and accumulation history in deep reservoirs: A case study of Mesozoic sandstone gas reservoirs in the Kelasu-Yiqikelike structural belt of the Kuqa Depression, Tarim Basin. Geosci. J. 2019, 23, 69–86. [Google Scholar] [CrossRef] [Scilit]
- Zeng, X.; Li, J.; Tian, J.; Wang, B.; Guo, J.; Sha, W. Physical simulation experimental study on gas accumulation in the late tectonic belts of the northern border of Qaidam Basin. Nat. Gas Geosci. 2018, 29, 1301–1309. [Google Scholar]
- Zhang, W.; Jiang, Y.; Hou, S.; Jing, A.; Sun, C. Characteristics of the Paleocene Oil and Gas Transmission System in North Kengdong Area. Spec. Reserv. 2023, 30, 31–39. [Google Scholar]
- Wu, Y.; Zhang, J. Geochemical characteristics and identification criteria of effective source rock in Mesozoic Yanchang Formation, southern margin of Ordos Basin. Int. J. Oil Gas Coal Technol. 2018, 19, 379–395. [Google Scholar] [CrossRef] [Scilit]
- Luo, X.; Zhang, L.; Lei, Y.; Yang, W. Petroleum migration and accumulation: Modeling and applications. AAPG Bull. 2020, 104, 2247–2265. [Google Scholar] [CrossRef] [Scilit]
- Zhang, Z.; Wang, H.; Yang, H. Study on passage system of petroliferous basins. Oil Gas Geol. 2000, 21, 133–135. [Google Scholar]
- Zhou, X.; Wang, D.; Yu, H.; Yang, H.; Li, L. Major controlling factors and hydrocarbon accumulation models of large-scale lithologic reservoirs in shallow strata around the Bozhong sag, Bohai Bay Basin, China. Pet. Explor. Dev. 2022, 49, 758–769. [Google Scholar] [CrossRef] [Scilit]
- Liu, M.; Zhang, H.; Guo, H.; Zhao, W.; Wang, Y.; Shi, S.; Wang, Q.; Liu, J. The impact of marine influence on the hydrocarbon generation potential and process of Upper Paleozoic coal in the eastern Ordos Basin, China: Implications for unconventional gas exploration of coal measures. Energy Fuels 2024, 38, 12700–12717. [Google Scholar] [CrossRef] [Scilit]
- Xiao, X.M.; Zhao, B.Q.; Thu, Z.L.; Song, Z.G.; Wilkins, R.W.T. Upper Paleozoic petroleum system, Ordos Basin, China. Mar. Pet. Geol. 2005, 22, 945–963. [Google Scholar] [CrossRef] [Scilit]
- Yang, H.; Fu, J.; Liu, X.; Meng, P. Accumulation conditions and exploration and development of tight gas in the Upper Paleozoic of the Ordos Basin. Pet. Explor. Dev. 2012, 39, 315–324. [Google Scholar] [CrossRef] [Scilit]
- Liu, M.; Kong, Q.; Wang, H.; Zhang, H.; Guo, H.; Wang, Y.; Shi, S.; Wang, Q.; Liu, J.; Peng, P.A. Generation Potential and Kinetics of Gaseous Hydrocarbons from Upper Paleozoic Carboniferous Benxi Formation Mudstone in Ordos Basin, China. ACS Omega 2024, 9, 39088–39099. [Google Scholar] [CrossRef] [Scilit]
- Wu, M.; Qin, Y.; Zhang, G.; Shen, J.; Yu, J.; Ji, X.; Zhu, S.; Wang, W.; Wan, Y.; Liu, Y.; et al. Geochemistry and Mineralogy of Upper Paleozoic Coal in the Renjiazhuang Mining District, Northwest Ordos Basin, China: Evidence for Sediment Sources, Depositional Environment, and Elemental Occurrence. Minerals 2024, 14, 1045. [Google Scholar] [CrossRef] [Scilit]
- Yuan, Y.; Fu, H.; Yan, D.; Wang, X. The constraints of the sedimentary environment on the evolution of bauxite reservoir characteristics within the benxi formation in the Linxing area, Ordos Basin, China. Energy Sci. Eng. 2024, 12, 5520–5541. [Google Scholar] [CrossRef] [Scilit]
- Sun, F.; Qu, C.; Cao, G.; Xie, L.; Shi, X.; Luo, S.; Liu, Z.; Zhang, L.; Ma, X.; Zhou, X.; et al. Oolitic Sedimentary Characteristics of the Upper Paleozoic Bauxite Series in the Eastern Ordos Basin and Its Significance for Oil and Gas Reservoirs. Processes 2024, 12, 2123. [Google Scholar] [CrossRef] [Scilit]
- Liu, G.; Sun, Z.; Luo, D.; Ding, Y.; Liu, W.; Yang, D. Critical review on microscopic differences of rock characteristics and flow behaviour for tight sandstone reservoirs in Ordos Basin, China. J. Pet. Sci. Eng. 2022, 218, 110669. [Google Scholar] [CrossRef] [Scilit]
- Wang, J.; Wang, J.; Zhang, Y.; Zhang, D.; Sun, L.; Luo, J.; Wang, W.; Gong, L.; Liu, Z.; Gao, S. Multi-scale fracture patterns and their effects on gas enrichment in tight sandstones: A case study of the Upper Paleozoic in the Qingshimao gas field, Ordos Basin, China. Front. Earth Sci. 2024, 12, 1448238. [Google Scholar] [CrossRef] [Scilit]
- Bai, Y.; Ma, L.; Wu, W.; Ma, Y. Geological characteristics and resource potential of oil shale in Ordos basin. Geol. China 2009, 36, 1123–1137. [Google Scholar]
- Yang, Y.; Li, W.; Ma, L. Tectonic and stratigraphic controls of hydrocarbon systems in the Ordos basin: A multicycle cratonic basin in central China. AAPG Bull. 2005, 89, 255–269. [Google Scholar] [CrossRef] [Scilit]
- Du, J.; Li, X.; Bao, H.; Xu, W.; Wang, Y.; Huang, J.; Wang, H.; Wanyan, R.; Wang, J. Geological conditions of natural gas accumulation and new exploration areas in the Mesoproterozoic to Lower Paleozoic of Ordos Basin, NW China. Pet. Explor. Dev. 2019, 46, 866–882. [Google Scholar] [CrossRef] [Scilit]
- Wang, M.; He, D.; Bao, H.; Lu, R.; Gui, B. Upper Palaeozoic gas accumulations of the Yimeng uplift, Ordos Basin. Pet. Explor. Dev. 2011, 38, 30–39. [Google Scholar]
- Yan, T.; Yao, Y.; Liu, D. Critical tectonic events and their geological controls on gas generation, migration, and accumulation in the Weibei coalbed methane field, southeast Ordos basin. J. Nat. Gas Sci. Eng. 2015, 27, 1367–1380. [Google Scholar] [CrossRef] [Scilit]
- Liu, X.; Pan, X.; Zhao, H.; Wang, Z.; Meng, P.; Zheng, D.; Hu, J.; Yan, X. Control of differential diagenesis of tight sandstone reservoirs on the gas–water distribution: A case study on the Upper Paleozoic He 8 Member in the northern Tianhuan depression of the Ordos Basin. Energy Explor. Exploit. 2022, 40, 302–327. [Google Scholar] [CrossRef] [Scilit]
- Ma, S.; Li, J.; Wang, L.; Gao, H.; Zhang, J. Provenance, tectonic setting and source-area paleoweathering of the Upper Paleozoic sandstones in the northwestern Ordos Basin, China: Evidence from whole-rock geochemistry. Carbonates Evaporites 2021, 36, 64. [Google Scholar] [CrossRef] [Scilit]
- Zhao, X.; Pang, J.; Zhao, L.; Liu, X. Characteristics of the Upper Paleozoic marker layers and their formation mechanism in the Ordos Basin. J. Geol. 2024, 48, 49–58. [Google Scholar]

Disclaimer/Publisher’s Note: The statements, opinions and data contained in all publications are solely those of the individual author(s) and contributor(s) and not of MDPI and/or the editor(s). MDPI and/or the editor(s) disclaim responsibility for any injury to people or property resulting from any ideas, methods, instructions or products referred to in the content. |
© 2025 by the authors. Licensee MDPI, Basel, Switzerland. This article is an open access article distributed under the terms and conditions of the Creative Commons Attribution (CC BY) license (https://creativecommons.org/licenses/by/4.0/).