Article

Optimization Study of Photovoltaic Cell Arrangement Strategies in Greenhouses

School of Energy Science and Engineering, Nanjing Tech University, Nanjing 211816, China
*
Author to whom correspondence should be addressed.
Energies 2025, 18(1), 135; https://doi.org/10.3390/en18010135
Submission received: 14 November 2024 / Revised: 20 December 2024 / Accepted: 27 December 2024 / Published: 1 January 2025
(This article belongs to the Section A2: Solar Energy and Photovoltaic Systems)

Abstract

:
The replacement of greenhouse surfaces with photovoltaic cells currently presents issues with internal shading and uneven illumination, which adversely affect crop growth and yield. Therefore, in order to improve greenhouse lighting by altering the arrangement of photovoltaic cells for greater economic and environmental benefits, four cities (Harbin, Shenyang, Nanjing, and Guangzhou) were selected for this study. Greenhouse models were established using the DesignBuilder software tool, focusing on the summer and winter growth stages of cherry tomatoes and strawberries. Two arrangements were employed—compact (CR) and checkerboard (BR)—to evaluate 18 scenarios based on power generation, illuminance uniformity, and temperature. Analysis revealed that, among the four cities, the checkerboard arrangement improved average illumination uniformity by 37.34%, 37.9%, 38.2%, and 35.8%, respectively, compared with the compact arrangement. Except for nine rows of photovoltaic cells in Guangzhou, the unit of area power generation of the schemes exceeded 80 kWh/m2 in summer, with excellent power generation efficiency. In winter, there was a relative decrease. Among the four cities, only Harbin reached seven rows of photovoltaic cells which produced more than 80 kWh/m2 under the unit of area of photovoltaic cells, while the other three cities achieved five rows. Strawberries are not suitable for growing in Harbin and Shenyang in winter. In addition to this, cherry tomatoes and strawberries in different regions and at different stages have the best arrangements for growth and for maximizing cost efficiency.

1. Introduction

In the modern world, energy demand continues to rise, while the use of traditional fossil fuels brings about problems such as environmental pollution and resource depletion. China has become the world’s largest energy consumer, with carbon emissions being particularly severe, accounting for 27.9% of total global emissions [1]. Seeking clean and renewable energy solutions has become the prevailing current and future development trend. Solar energy [2] is the safest, most reliable, and cleanest natural energy source available. Solar resources are widely distributed across various regions on Earth, are unaffected by geographical limitations, and do not deplete any finite resources. This holds significant importance for reducing environmental pollution and addressing energy crises. Furthermore, solar energy utilization reduces reliance on traditional energy sources, lowering the impact of energy price fluctuations [3] on the socio-economic landscape. Therefore, solar power is considered one of the most promising alternative energy choices [4].
Solar photovoltaic (PV) technology [5] has rapidly become one of the most cost-effective power generation methods. Large-scale PV power plants [6] play a crucial role in national and regional energy supply. Especially in areas with abundant sunlight, such as deserts and arid regions, the construction of large-scale PV power stations can effectively convert solar energy from these regions into electricity, providing stable power to the grid. Furthermore, solar PV technology has a wide range of applications in various fields, including transportation [7], heat pump systems [8], and electronic devices [9]. For instance, solar-powered electric vehicle charging stations [10] and solar thermal pumps [11] play significant roles in improving energy efficiency and promoting sustainable development.
In this context, the concept of building-integrated photovoltaics (BIPV) has been proposed and gradually put into practice. It involves directly embedding photovoltaic cells into building materials, enabling structures to not only serve traditional building functions but also to effectively convert solar energy into electricity. BIPV has found wide application across various areas, such as building rooftops [12,13], shading systems [14], facades [15,16], skylights [17], and balconies [18]. These versatile photovoltaic products not only meet the energy needs of buildings but also integrate multiple functions, including architectural design, lighting, thermal insulation, and soundproofing, significantly enhancing overall building performance. The core of BIPV products is their photovoltaic cells. Presently, scholars are conducting in-depth research into photovoltaic cells, mainly regarding their optimal power-generating angles [19,20], module materials [21] and other aspects, greatly enhancing power generation efficiency and output. Furthermore, advancements in photovoltaic cell cooling technology [22] have emerged, effectively reducing cell heating temperatures, extending lifespan, and consequently lowering energy production costs.
The successful application of building-integrated photovoltaics (BIPV) has sparked interest in the agricultural sector towards photovoltaic technology. Agrivoltaics [23,24] combines photovoltaic power generation technology with facility agriculture by installing photovoltaic panels around agricultural facilities or on their roofs to convert solar energy into electricity. This approach drives green energy transformation in facility agriculture and can be applied to agricultural production processes such as irrigation, lighting, heating, and ventilation, achieving significant energy savings and carbon reduction benefits. Zhang [25] designed an agricultural photovoltaic system capable of efficiently collecting excess light energy from photosynthesis that would otherwise be wasted and converting it into electricity. Field trial results indicate that the system not only increases crop yield by 13%, but also reduces plant heat dissipation by 50%, while achieving a photovoltaic conversion efficiency of 9.9%. Campana [26] evaluated the performance of an agrivoltaic system in Sweden and compared the profitability of agrivoltaic power generation with traditional ground-mounted photovoltaic systems. The results demonstrated that the net present value (NPV) profitability of the Swedish agrivoltaic system is 30 times higher than that of conventional crop rotation. Pande [27] designed a photovoltaic pump-driven drip irrigation system for orchard planting in arid regions, with results showing that the system’s benefit–cost ratio exceeds 2, generating substantial economic value. Hsu [28] explored the symbiotic relationship between solar energy and crops, considering government subsidies and farmers’ income. The results showed that installing solar panels on 10% to 30% of land could maintain 70% of crop yields while significantly enhancing solar power generation capacity and reducing carbon emissions. The integration of agricultural greenhouses with photovoltaic (PV) modules has emerged as a novel architectural form to meet the growing demands for food and energy. Notte [29] conducted a comprehensive analysis of the latest photovoltaic systems applied in greenhouses, revealing that organic photovoltaic cells, abundant in photoactive materials, offer significant advantages by allowing spectral adjustments based on the characteristics of crops grown within greenhouses. Wang [30] carried out a life cycle carbon emission intensity assessment of photovoltaic greenhouses in Beijing, demonstrating that incorporating as many photovoltaic components as possible in greenhouse structures can effectively reduce carbon emissions. Kumar [31] indicated that the adoption of solar energy technologies in greenhouses can enhance crop yield and quality while ensuring sustainable and environmentally friendly energy production. Jiang [32] combined passive insulation measures with roof-integrated flexible photovoltaic technologies to transform photovoltaic greenhouses into net-zero energy structures, with the photovoltaic systems providing over 20,000 kWh of energy. Jin [33] evaluated and analyzed the performance of rooftop photovoltaic systems in a new Finlo-type photovoltaic greenhouse in frigid regions of China, offering an objective and scientifically grounded theoretical basis for the integration of photovoltaic systems into greenhouses. It is evident that photovoltaic greenhouse integration promotes agricultural modernization and sustainable development, offering employment opportunities, raising farmers’ income levels, and delivering significant economic and social benefits.
However, scholars also found in subsequent studies that if photovoltaic cells are arranged above the greenhouse, then the shadows of the components may have a certain impact on crop growth. This shadow effect will lead to the reduction of light received by crops, which will affect their photosynthesis and growth, causing a “competition for light” phenomenon in photovoltaic power generation and plant growth. Yano [34] studied the solar radiation reception, photovoltaic power generation and spatial distribution of sunlight in two geometric arrangements (one a straight line arrangement and the other a checkerboard arrangement) of a photovoltaic array with an installation area ratio of 12.9%, and the study showed that the checkerboard arrangement slightly reduced solar irradiance with the same coverage, but was more suitable for crop growth. Kadowaki [35] studied the effect of the geometric arrangement of photovoltaic arrays on plant shading, and the study showed that a checkerboard photovoltaic greenhouse had a lower yield of green onions than a linear photovoltaic greenhouse. Castellano [36] investigated the effect of shading and energy efficiency through different configurations of photovoltaic (PV) panels on a single-span, double-slope roof greenhouse cover at different times of the year. K. Ezzaeri [37] studied the effect of flexible photovoltaic panels, installed in a checkerboard form in a horizontal roof area of a greenhouse, on tomato yields in summer and winter. Alvaro Marucci [38] analyzed the effect of a checkerboard arrangement of photovoltaic panels on the shading rate in a shed, and the study showed that, in the case of a photovoltaic arrangement, the proportion of shading never exceeded 40% during the year. Therefore, how to change the arrangement of photovoltaic cells to improve the uniformity of indoor light intensity and achieve reasonable control of radiation intensity has become an important research direction.
The impact of photovoltaic cells in greenhouses is not limited to shading and light distribution, they also affect the thermal performance of the greenhouse. Photovoltaic cells installed on the roof of a greenhouse alter the dynamics of energy transfer between temperature, humidity, and indoor–outdoor environments. Additionally, the temperature of the cells and the electricity generation of the photovoltaic cells are influenced by the greenhouse covering materials and climatic conditions [39]. Chen [40] conducted a study investigating the effects of photovoltaic cell temperature variations on solar panel electricity generation while considering thermal modeling of a greenhouse and sunlight distribution across three different photovoltaic layouts.
Typically, the reviewed studies heavily rely on experimental techniques to evaluate photovoltaic greenhouse performance. Furthermore, there is a lack of comprehensive research that simultaneously considers key factors such as electricity generation, crop production, and greenhouse thermodynamics to study the optimal installation layout. The novelty of this study lies in using modeling and simulation [41] to test designs and develop a comprehensive evaluation metric for assessing thermodynamic behavior [42,43] and electricity generation in photovoltaic greenhouses. By altering the layout of photovoltaic components in greenhouses to accommodate both plant production and electricity generation, this research aims to determine the most suitable configuration of placing solar panels on greenhouse roofs for different plants in various cities.
In this study, two representative greenhouse plants (cherry tomato and strawberry) were selected, and a photovoltaic greenhouse facility model was built using DesignBuilder energy simulation software to simulate and evaluate the light and power behaviors of greenhouses in four cities (Harbin, Shenyang, Nanjing, and Guangzhou) at different latitudes by dividing the time into two growth phases, summer and winter, and using evaluation criteria including power generation, light intensity, and lighting uniformity. The optimization study aims to provide insights into the design, installation, and production of future PV agricultural greenhouse systems.

2. Materials and Methods

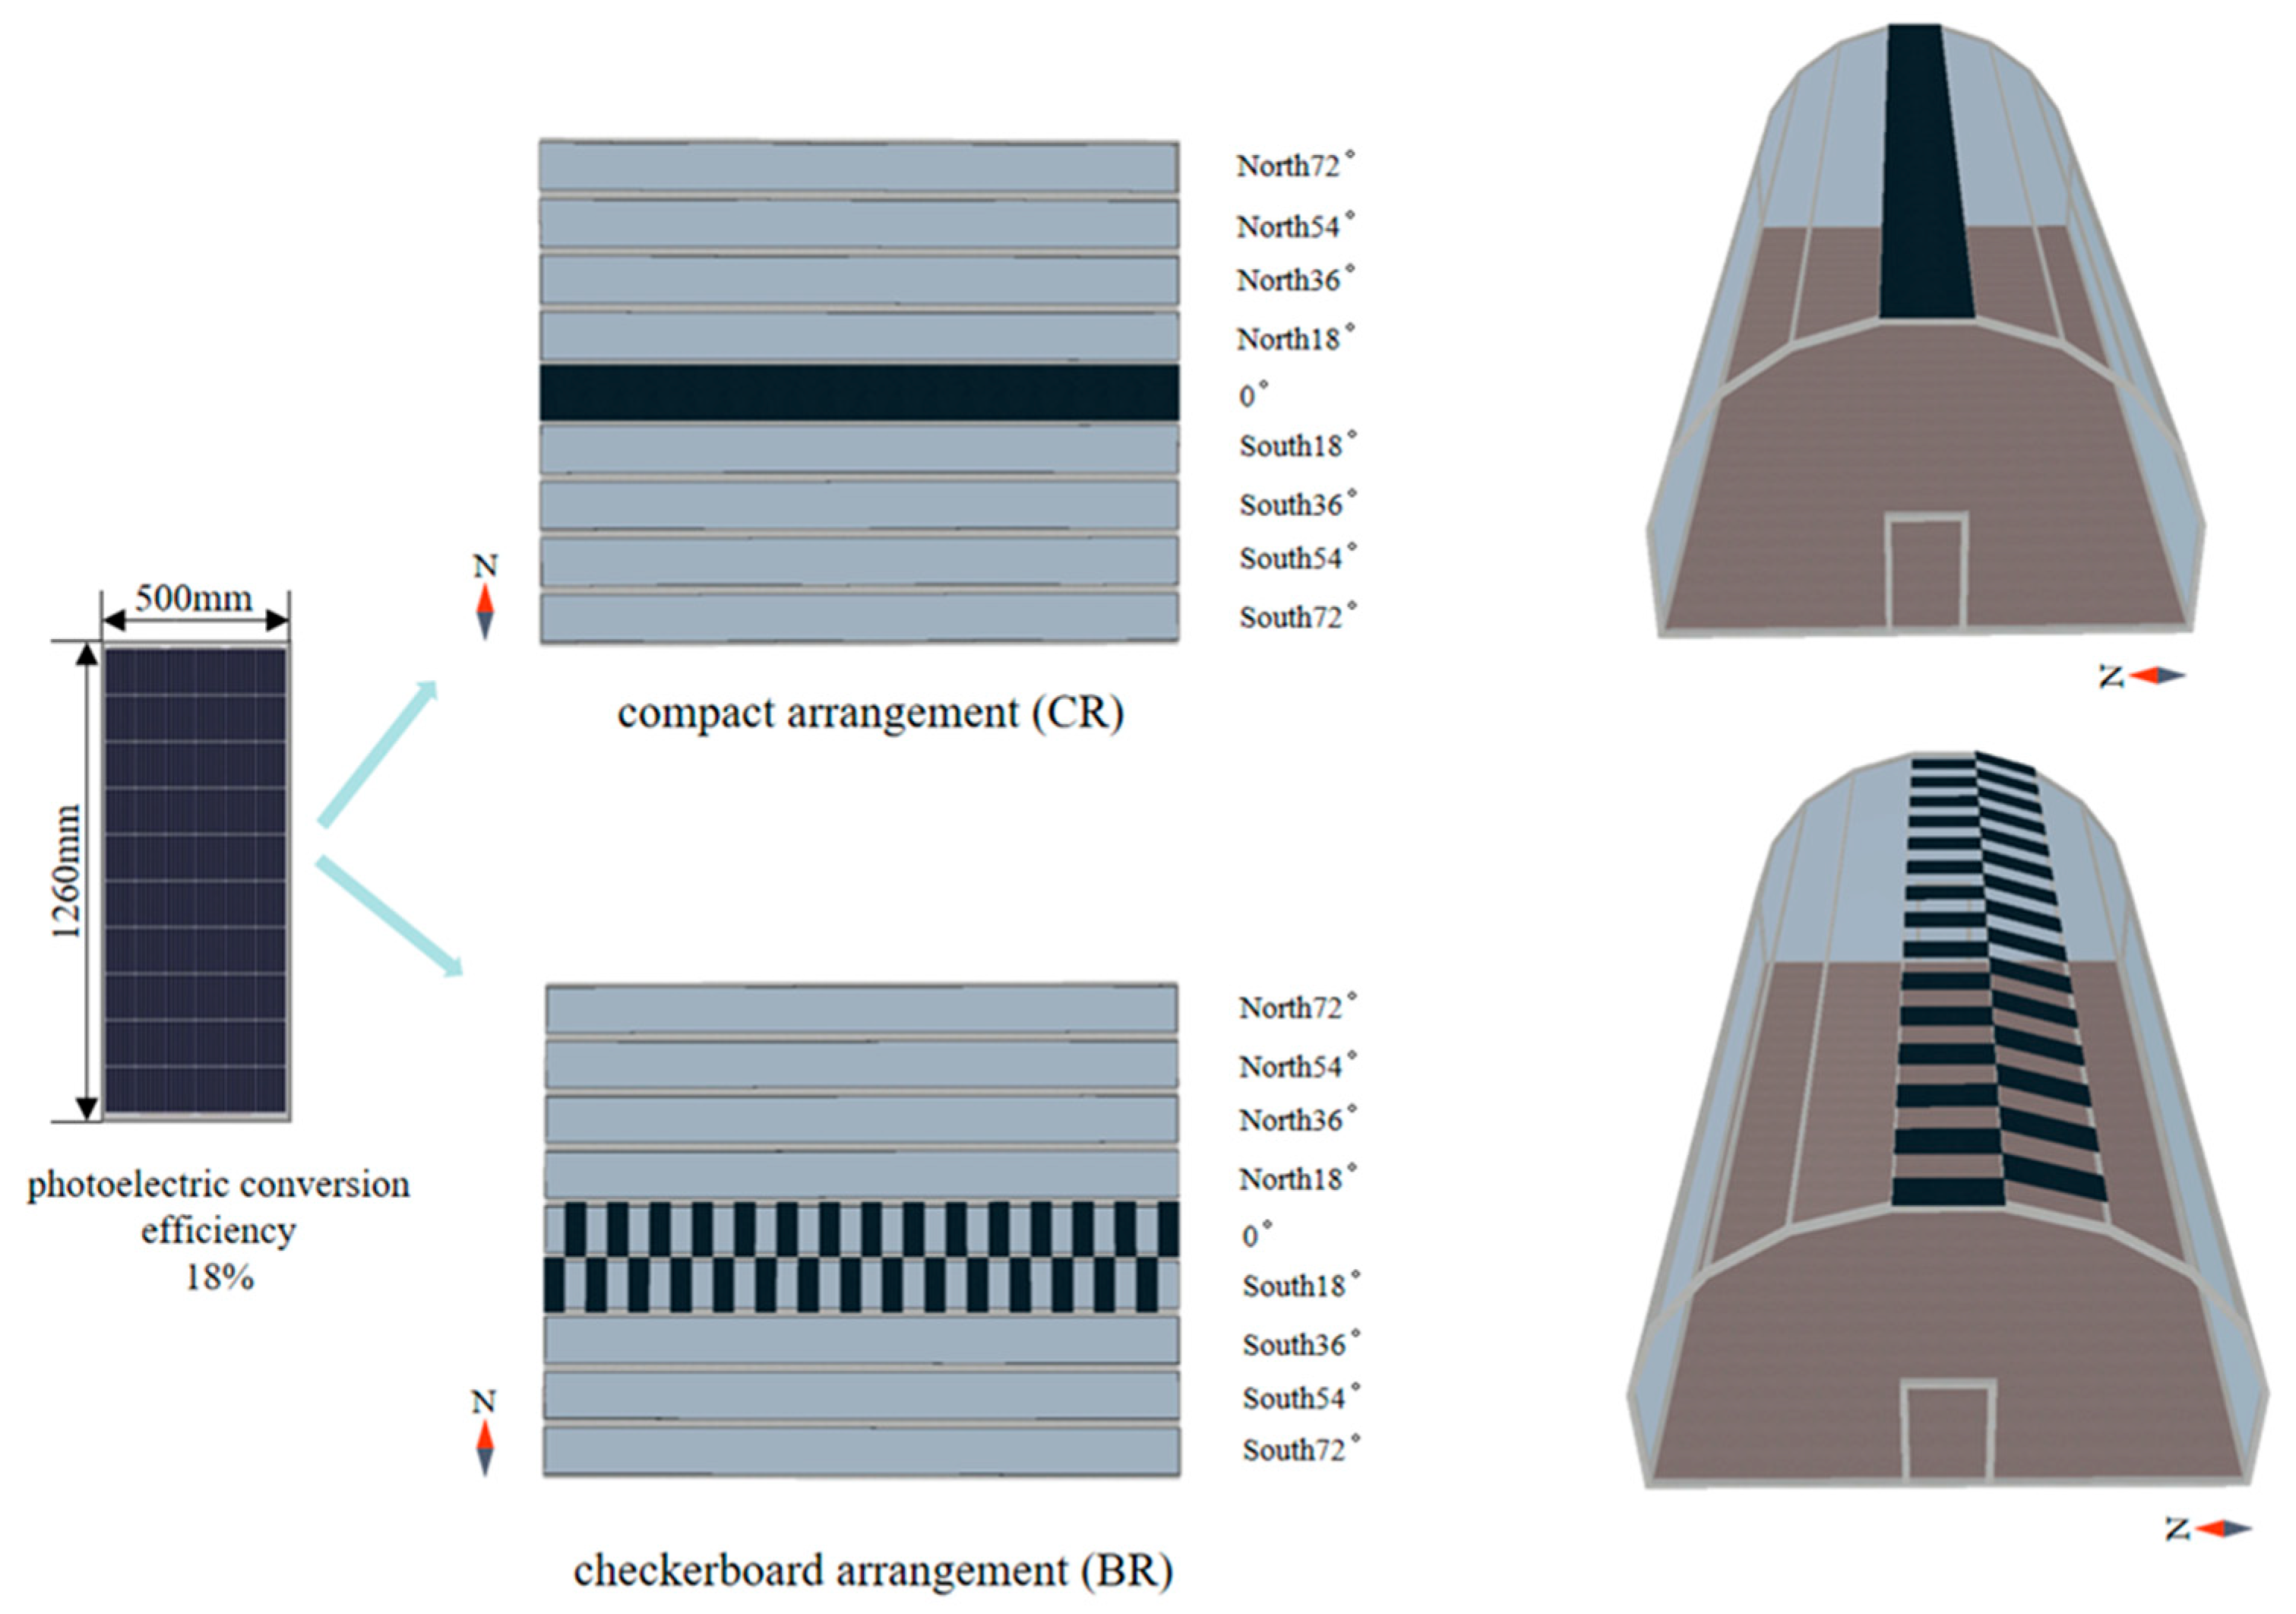
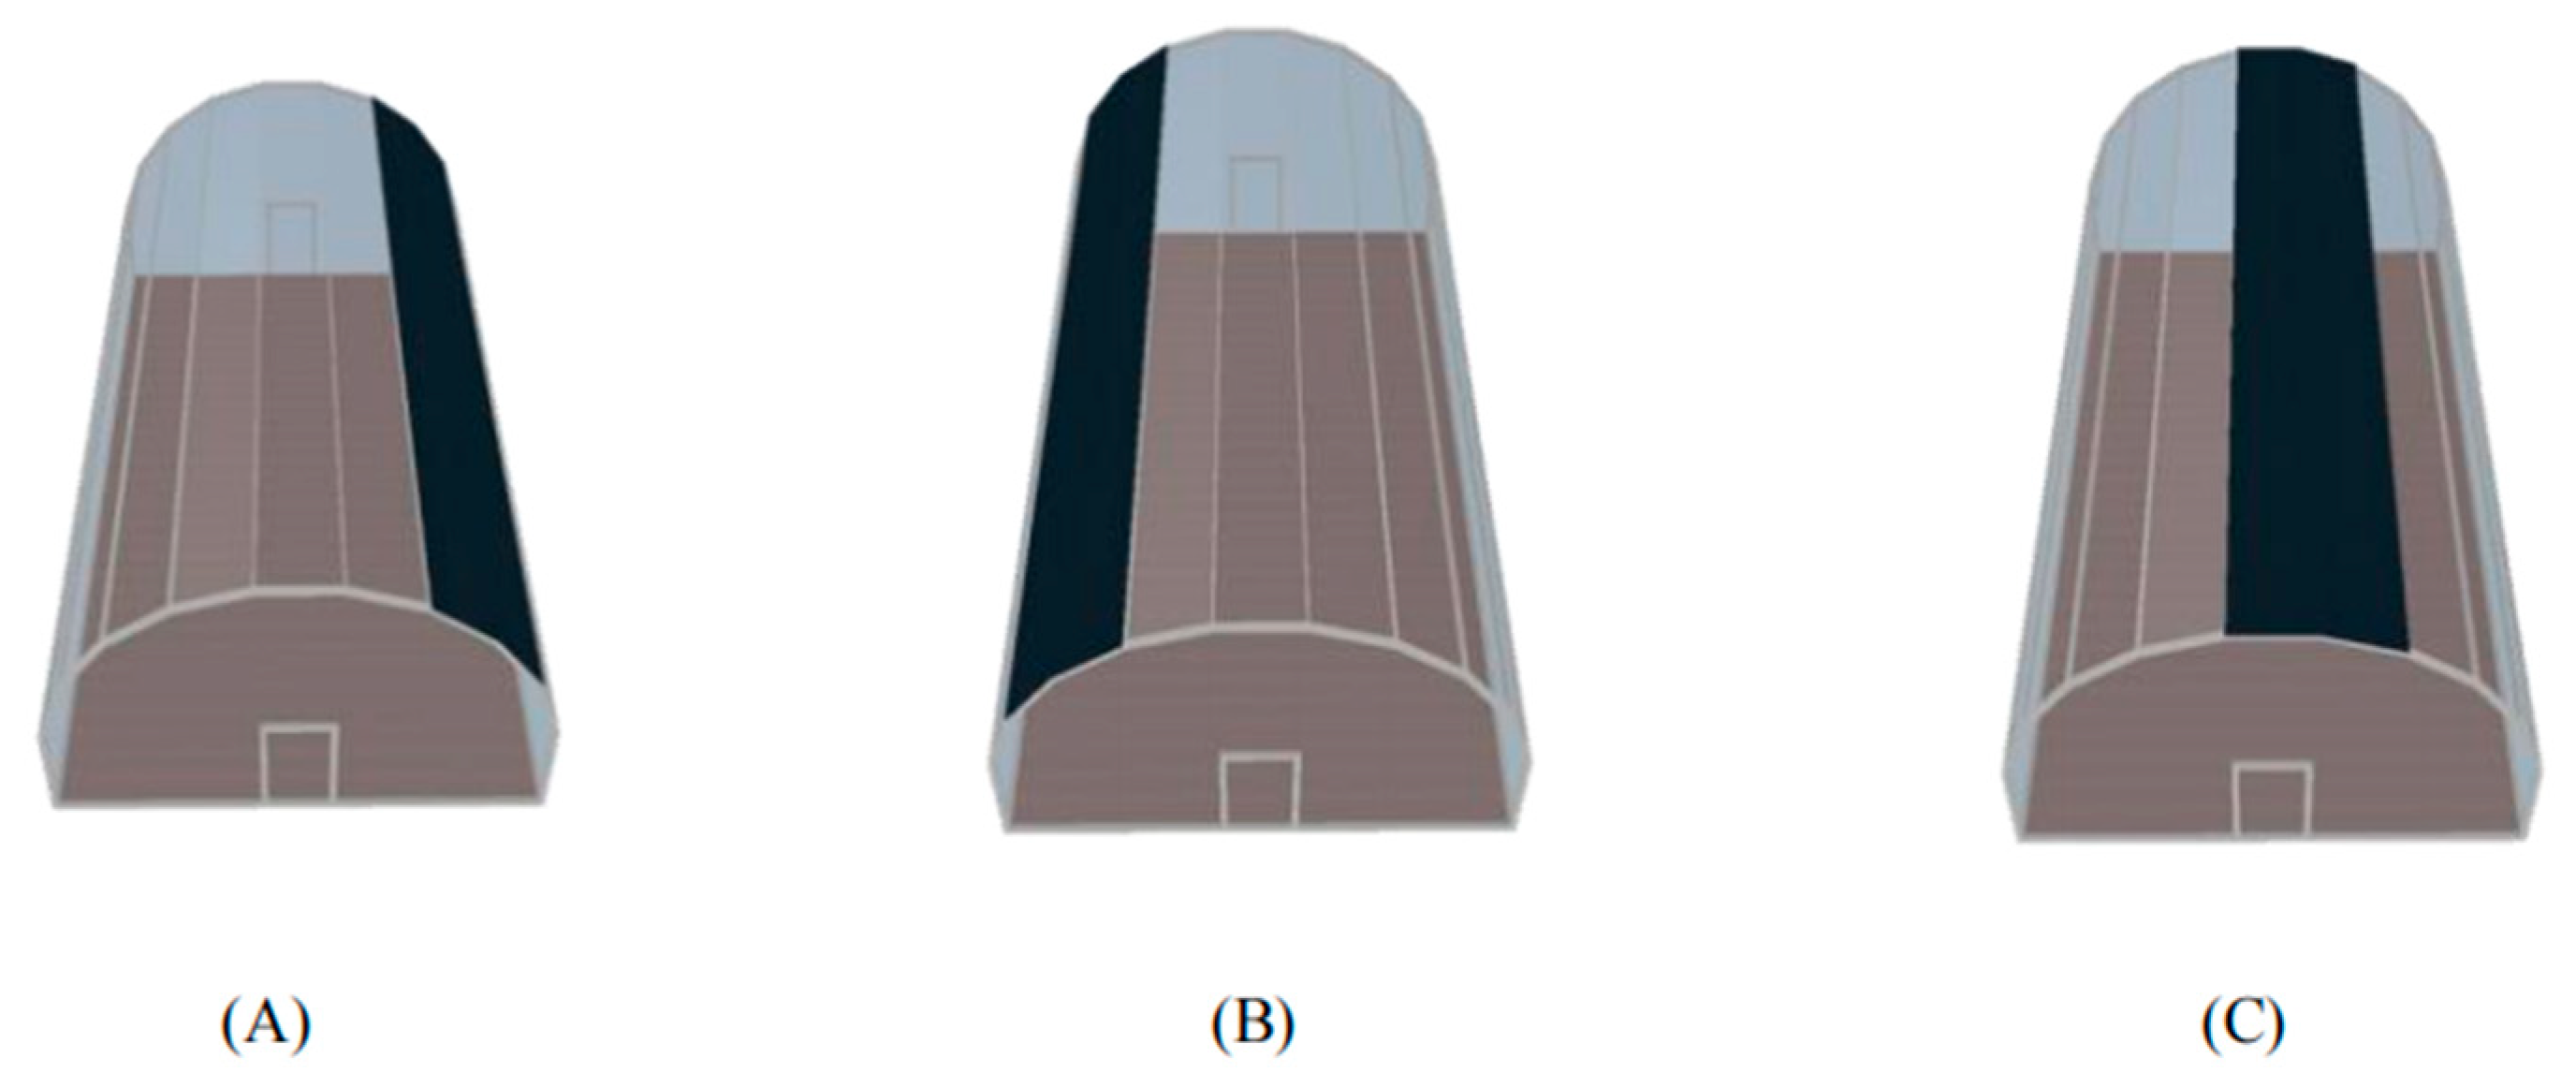
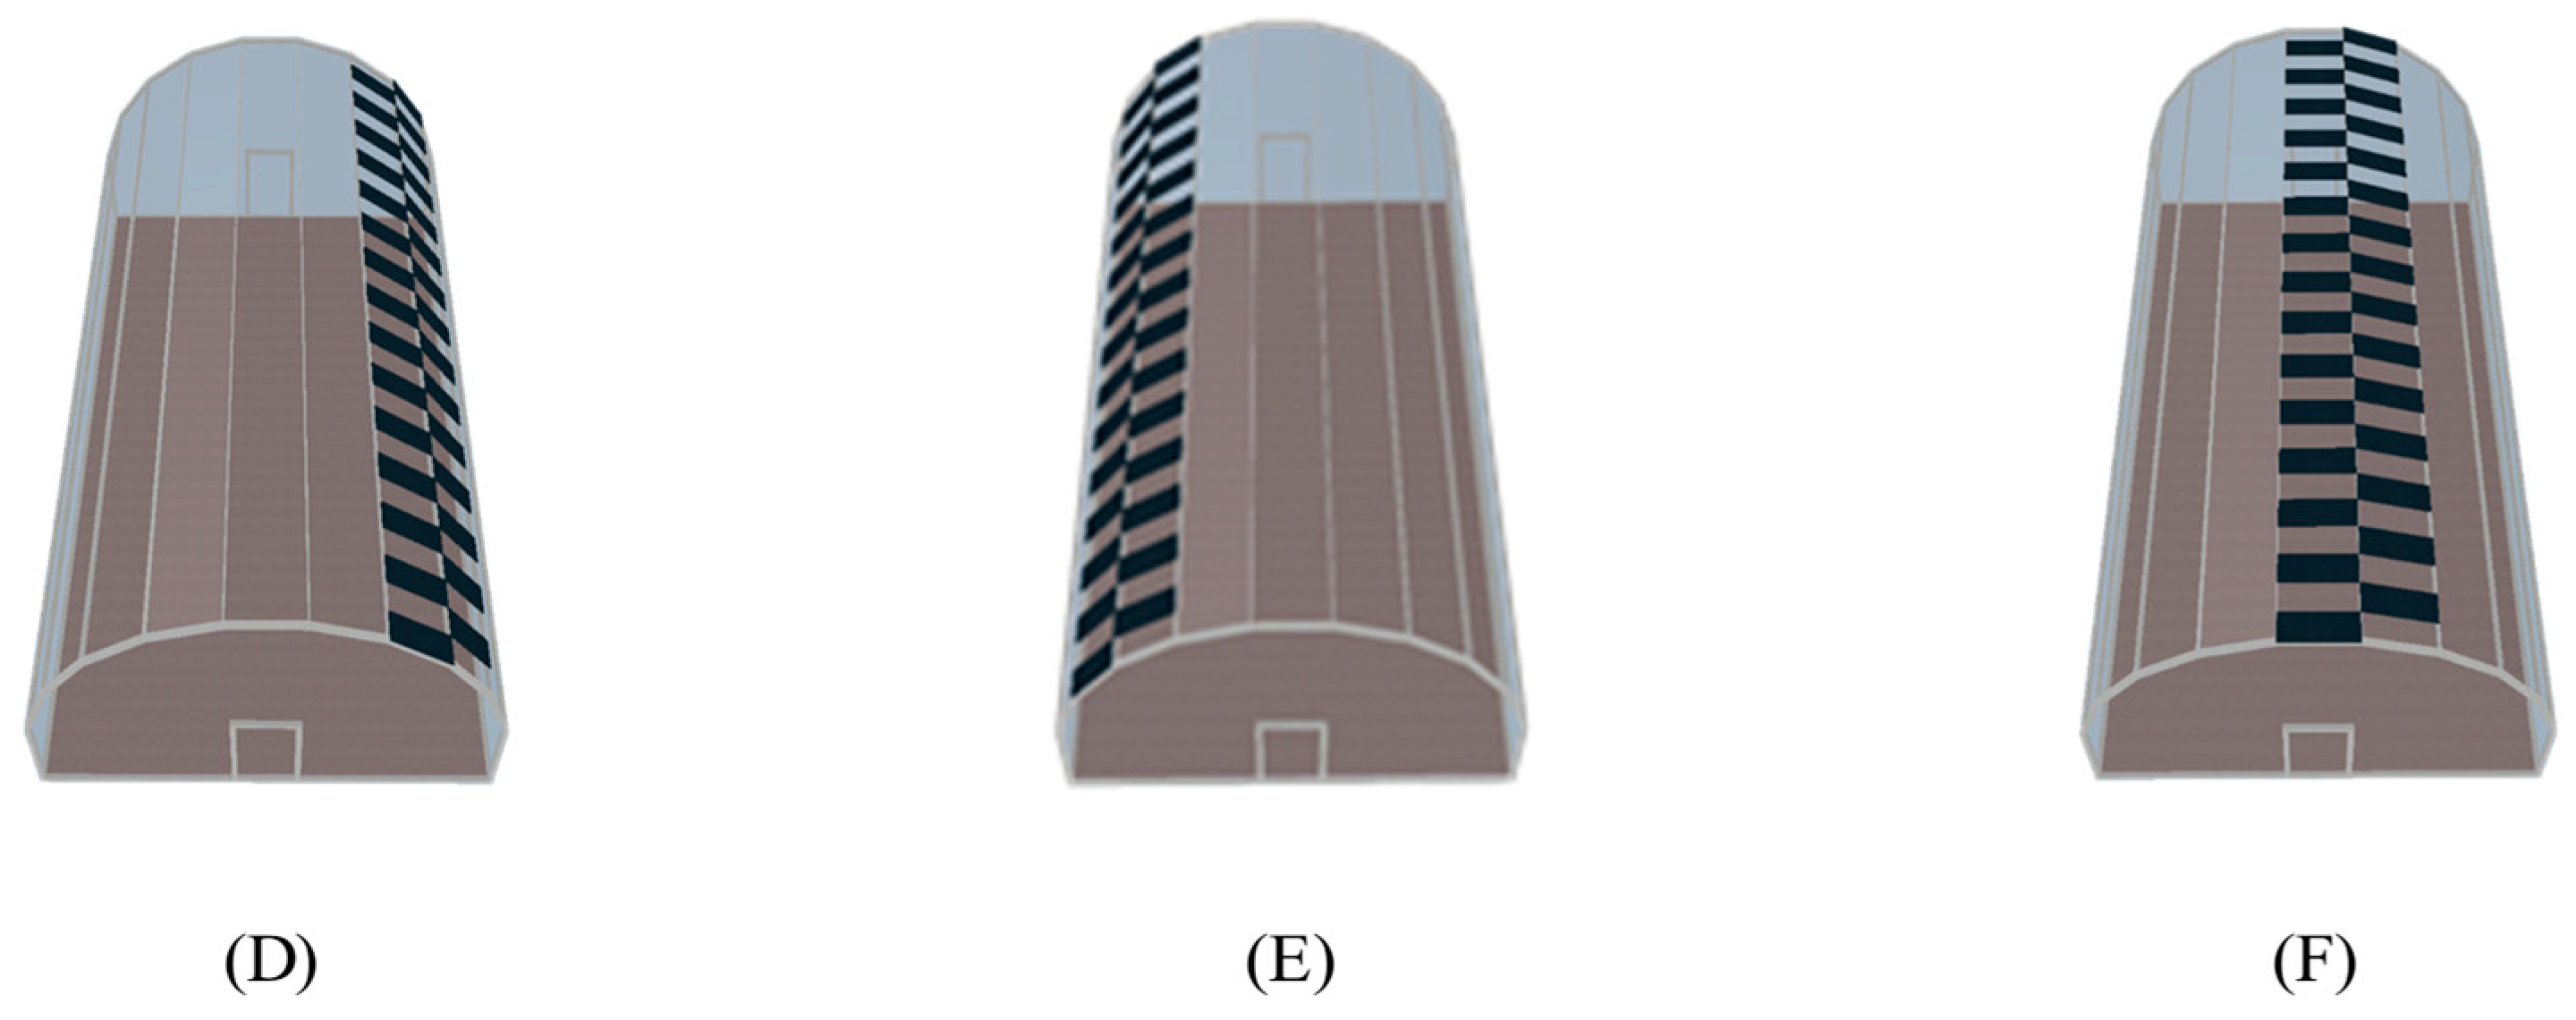
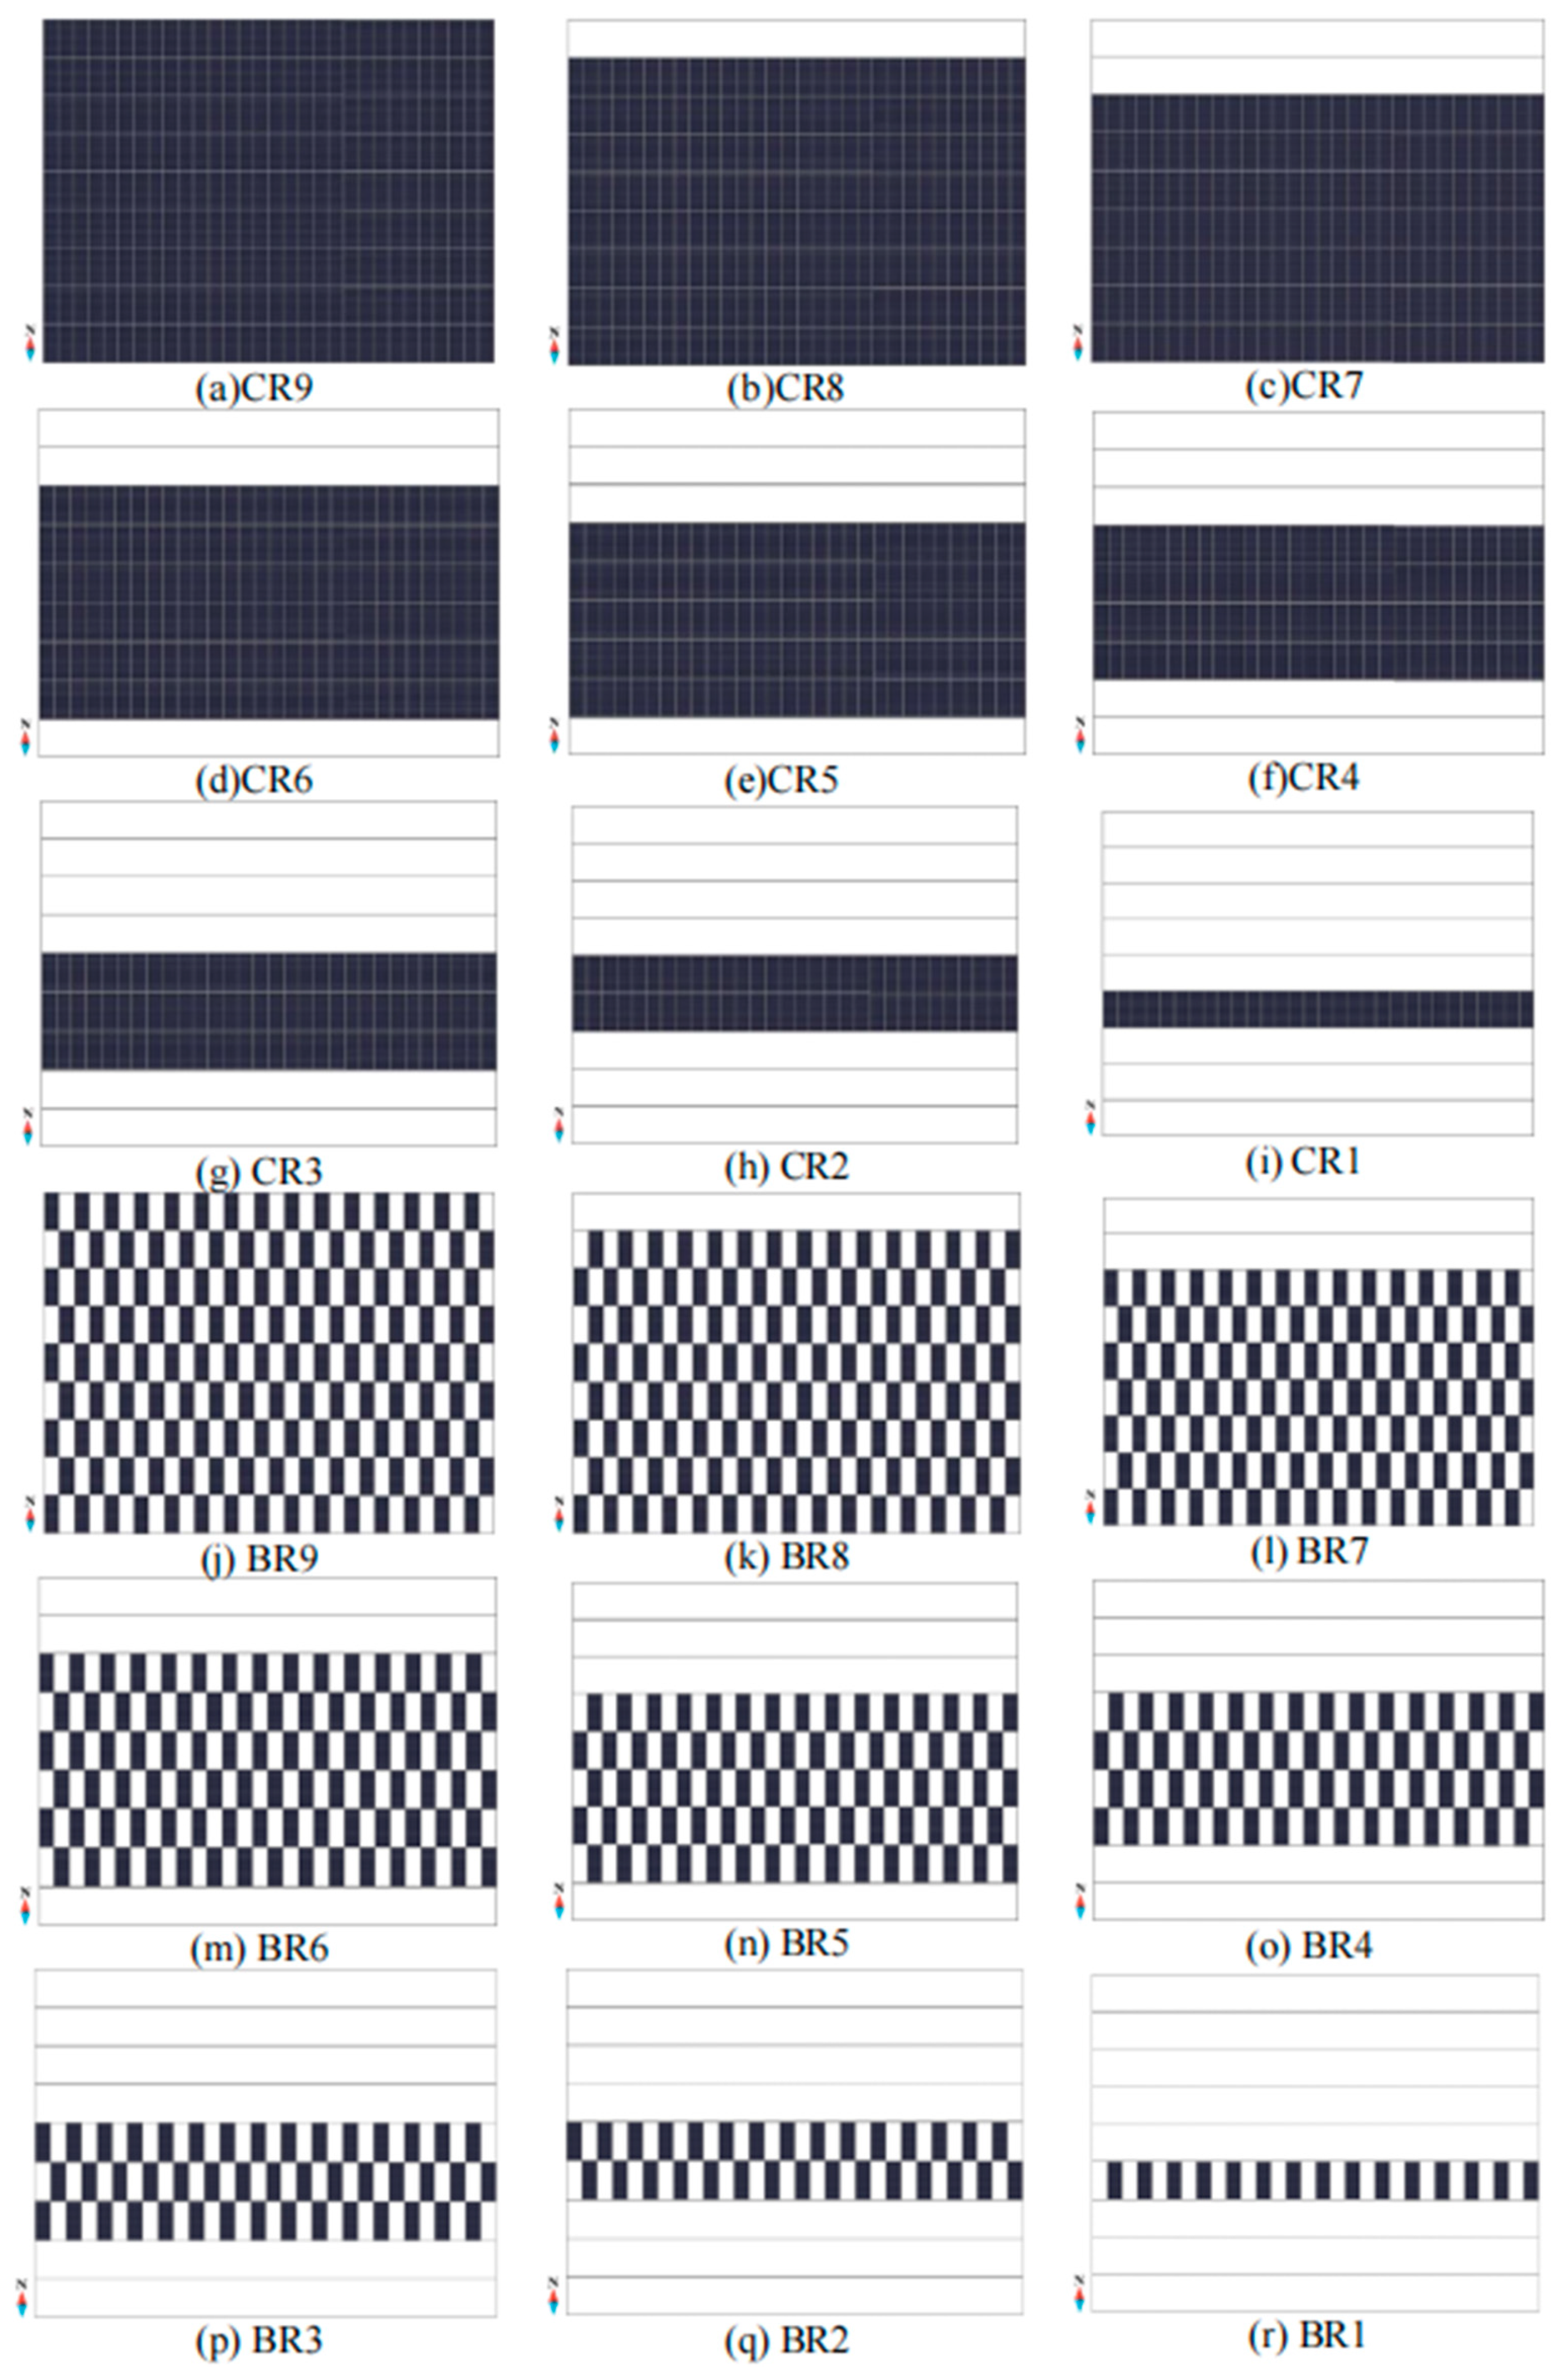
2.1. Greenhouse Physical Model and Arrangement Mode

According to the designed greenhouse light transmittance, thermal insulation parameters, and technical requirements, a round-arched greenhouse with a length, width, and height of 15 m × 8 m × 5.37 m was built on the DesignBuilder software. The shoulder height is 2 m and the materials are a plastic film and an aluminum steel frame. The slope of the greenhouse runs north–south and is evenly divided into nine plates. The tilt angle of each panel increases by 18 degrees, starting from 0 degrees at the center. Photovoltaic cells are arranged in the east–west direction. Given that the key parameters of the photovoltaic cells remain constant, the arrangement of the photovoltaic cells is divided into a compact arrangement (CR) and a checkerboard arrangement (BR) to analyze the impact of different photovoltaic cell arrangements on the distribution of light inside the greenhouse. The greenhouse model established is shown in Figure 1.
In order to determine the layout scheme for each city, two groups of different layout schemes with the same coverage and layout mode were first selected for simulation, as shown in Figure 2 and Figure 3. The simulation period was from 7:00 to 17:00 on September 30. As can be seen from Figure 4 and Figure 5, under the same coverage area and layout pattern, different layout schemes had minimal impact on the average irradiance intensity. Additionally, the angle of each row was different, resulting in variations in power generation. Therefore, the selection of the row plan adjusts the number of rows of photovoltaic cells according to the size of power generation per unit of area. The scheduling scheme includes two scheduling methods of PV cell coverage under different numbers of rows, named by the scheduling method plus the number of rows, respectively (CR9, CR8, CR7, CR6, CR5, CR4, CR3, CR2, CR1, BR9, BR8, BR7, BR6, BR5, BR4, BR3, BR2, and BR1), with a total of 18 scheduling schemes, as shown in Figure 6.
The simulation model needs to comprehensively consider the characteristics of the photovoltaic (PV) panels, their quantity, inverters, and their impact on solar radiation. To ensure the reliability of the model, the optical characteristic parameters of the equipment were set in DesignBuilder. The model in this study uses semi-transparent solar cells and selects the “Simple” PV cell performance type provided by DesignBuilder. The specifications of the PV cell outer frame are 1260 mm × 500 mm × 25 mm, with a conversion efficiency of 18%. The detailed parameters are shown in Table 1.
Due to differences in geographical latitude, the incident angle of sunlight for photovoltaic cells installed in different regions will change accordingly, resulting in differences in the annual power generation of photovoltaic cells installed in different regions and the optimal inclination angle of photovoltaic cells. Four cities with different latitudes were simulated: Harbin (latitude: 45.75°, longitude: 126.77°), Shenyang (latitude: 41.73°, longitude: 123.52°), Nanjing (latitude: 31.93°, longitude: 118.9°), and Guangzhou (latitude: 23.22°, longitude: 113.48°). All model development and simulation processes were conducted using the DesignBuilder 6.1.0 energy simulation software, which is based on the EnergyPlus 8.9 calculation engine. The meteorological data used are derived from a typical meteorological year (TMY) obtained from Chinese Standard Weather Data (CSWD), which includes annual design data, typical year data, and extreme year data, such as maximum enthalpy, highest and lowest temperatures, and solar radiation. This study utilizes hourly meteorological data to calculate and simulate the power generation, illumination, and temperature conditions of the building under real-world conditions.

2.2. Mathematical Model

The power generation model and temperature field model used in this study are based on EnergyPlus calculations. The photovoltaic generation model in EnergyPlus primarily uses the single diode model to simulate the power generation performance of solar panels. The temperature field model mainly considers the building’s thermal load, heat flow, temperature distribution, and various heat transfer processes, such as convection, radiation, and conduction. Many researchers have used EnergyPlus to predict the annual power generation of solar panels [44,45,46,47], and indoor temperatures [48,49], which have been validated against field measurement data [47,48,49,50,51].

2.2.1. Solar Radiation Model

On any external surface, the total solar gain results primarily from a combination of direct solar radiation and diffuse solar radiation absorption, as shown in Equation (1):
Q S O = α ( I b cos θ s s s + I s F s s + I g F s g )
where α is the solar absorptivity of the surface; I b is the intensity of beam (direct) radiation; θ is the angle of incidence of the sun’s rays, °; Ss is the area exposed to direct sunlight, m2; I s is the intensity of sky diffuse radiation; F s s is the angle factor between the surface and the sky; I g is the intensity of ground-reflected diffuse radiation; and F s g is the angle factor between the surface and the ground.
The factor number by which sky radiation is reflected from the ground to the receiving surface is shown in Equation (2):
F r s r g = 1 N r e c 1 N r e c i = 1 N r a y ( H i t g n d , i d Ω i cos α i / π ) j ( i ) N r a y H i t s k y , j ( i ) cos α j ( i ) d Ω j ( i ) / π
where N r e c is the number of receiving points; N r a y is the number of rays; H i t g n d , i is 1 if ray j(i) hits the sky, = 0 otherwise; α j ( i ) is the angle of incidence of ray j(i) with respect to the ground plane, °; and d Ω j ( i ) is the solid angle element associated with ray j(i).
The factor by which sky radiation is reflected from an obstruction onto the receiving surface is shown in Equation (3):
F r s r o = 1 N r e c 1 N r e c i = 1 N r a y H i t o b s , i 1 + cos t i l t o b s 2 m n
where H i t o b s , i is 1 if ray j(i) hits an obstruction, = 0 otherwise; m is the obstructed sky irradiance on obstruction; n is the unobstructed sky irradiance on obstruction.
The model used by EnergyPlus to calculate the electrical power generated by a photovoltaic system is shown in Equation (4):
P = A f a c t G t η
where A is the net area of surface, m2; f a c t is the fraction of surface area with active solar cells; G t is the total solar radiation incident on photovoltaic array, W/m2; and η is the photovoltaic cell conversion efficiency.

2.2.2. Indoor Temperature Model

The indoor temperature model adopts the method of thermal balance, where the core of the thermal equilibrium method involves the internal heat balance of the surfaces within the relevant area. This thermal balance is typically modeled by four coupled heat transfer components: (1) conduction through building elements, (2) convection to the air, (3) absorption and reflection of shortwave radiation, and (4) longwave radiation exchange. Incoming shortwave radiation comes from solar radiation entering the area through windows and emissions from internal light sources (such as lamps). Longwave radiation exchange includes absorption and emission from low-temperature radiation sources, such as all other area surfaces, equipment, and individuals.
The heat balance of the inner surface is shown in Equation (5):
q L W X + q S W + q L W S + q k i + q s o l + q c o n v = 0
where q L W X is the net longwave radiation exchange flux between surfaces in one or a group of regions (enclosures); q S W is the net shortwave radiation flux of light to the surface; q L W S is the longwave radiant flux of a device in one or a group of areas (enclosures); q k i is the conduction flux through the wall; q s o l is the transmitted solar radiation flux absorbed by the Earth’s surface; and q c o n v is the convective heat flux to the regional air.
The radiation exchange between surfaces is simplified by using a single average radiation temperature node, Tr, which acts as a switching center for the radiation heat exchange between surfaces. The average radiation temperature can be calculated using a single equation. The average radiation temperature is calculated in three steps.
F i is the average radiation temperature “view factor”. These view factors represent the “view” of each surface to the average radiation temperature node, as if all surfaces were part of a spherical shell, as shown in Equation (6):
F i = 1 1 A i F i Σ 1 n A j F j
where A i is the area of surface i, m2, and A j is the area of surface j, m2.
F i is gray body radiation resistance, as shown in Equation (7):
F i = σ ε i ε i F i + 1 ε i
where σ is the Stefan–Boltzmann constant and ε i is the longwave emittance of the surface i.
T r is the mean radiant temperature, as shown in Equation (8):
T r = Σ 1 n A i F i T i Σ 1 n A i F i
q is the net radiation heat transfer for each surface, as shown in Equation (9):
q = F i A i ( T r 4 T i 4 )

2.3. Model Validation

To ensure the reliability of the model, model validation is required. This section presents a simulation validation of photovoltaic cells at different tilt angles in Yinchuan. Subsequently, the simulation results were compared with the measured data to validate the effectiveness of the established model. The simulated data for the photovoltaic cells were compared with the measured data, as shown in Table 2. The observed photovoltaic power generation showed a strong consistency between the simulation values and data from the literature. To ensure the accuracy of the validation, two indicators, RMSE and CVRMSE [52], are presented as follows:
R M S E = 1 n t = 1 n M t S t 2
C V ( R M S E ) = R M S E M t ¯ × 100 %
where Mt and St are the respective measured and simulated data at each month; n is the total number of months; and Mt is the average measured data.
The calculations show that the RMSE and CVRMSE of the photovoltaic cells are 1.037 kWh and 7.7%, respectively. The CVRMSE meets the standard of being below 30% (ASHRAE, 2014). Therefore, it is concluded that the model is suitable for the dynamic simulation of photovoltaic cells in greenhouse applications.

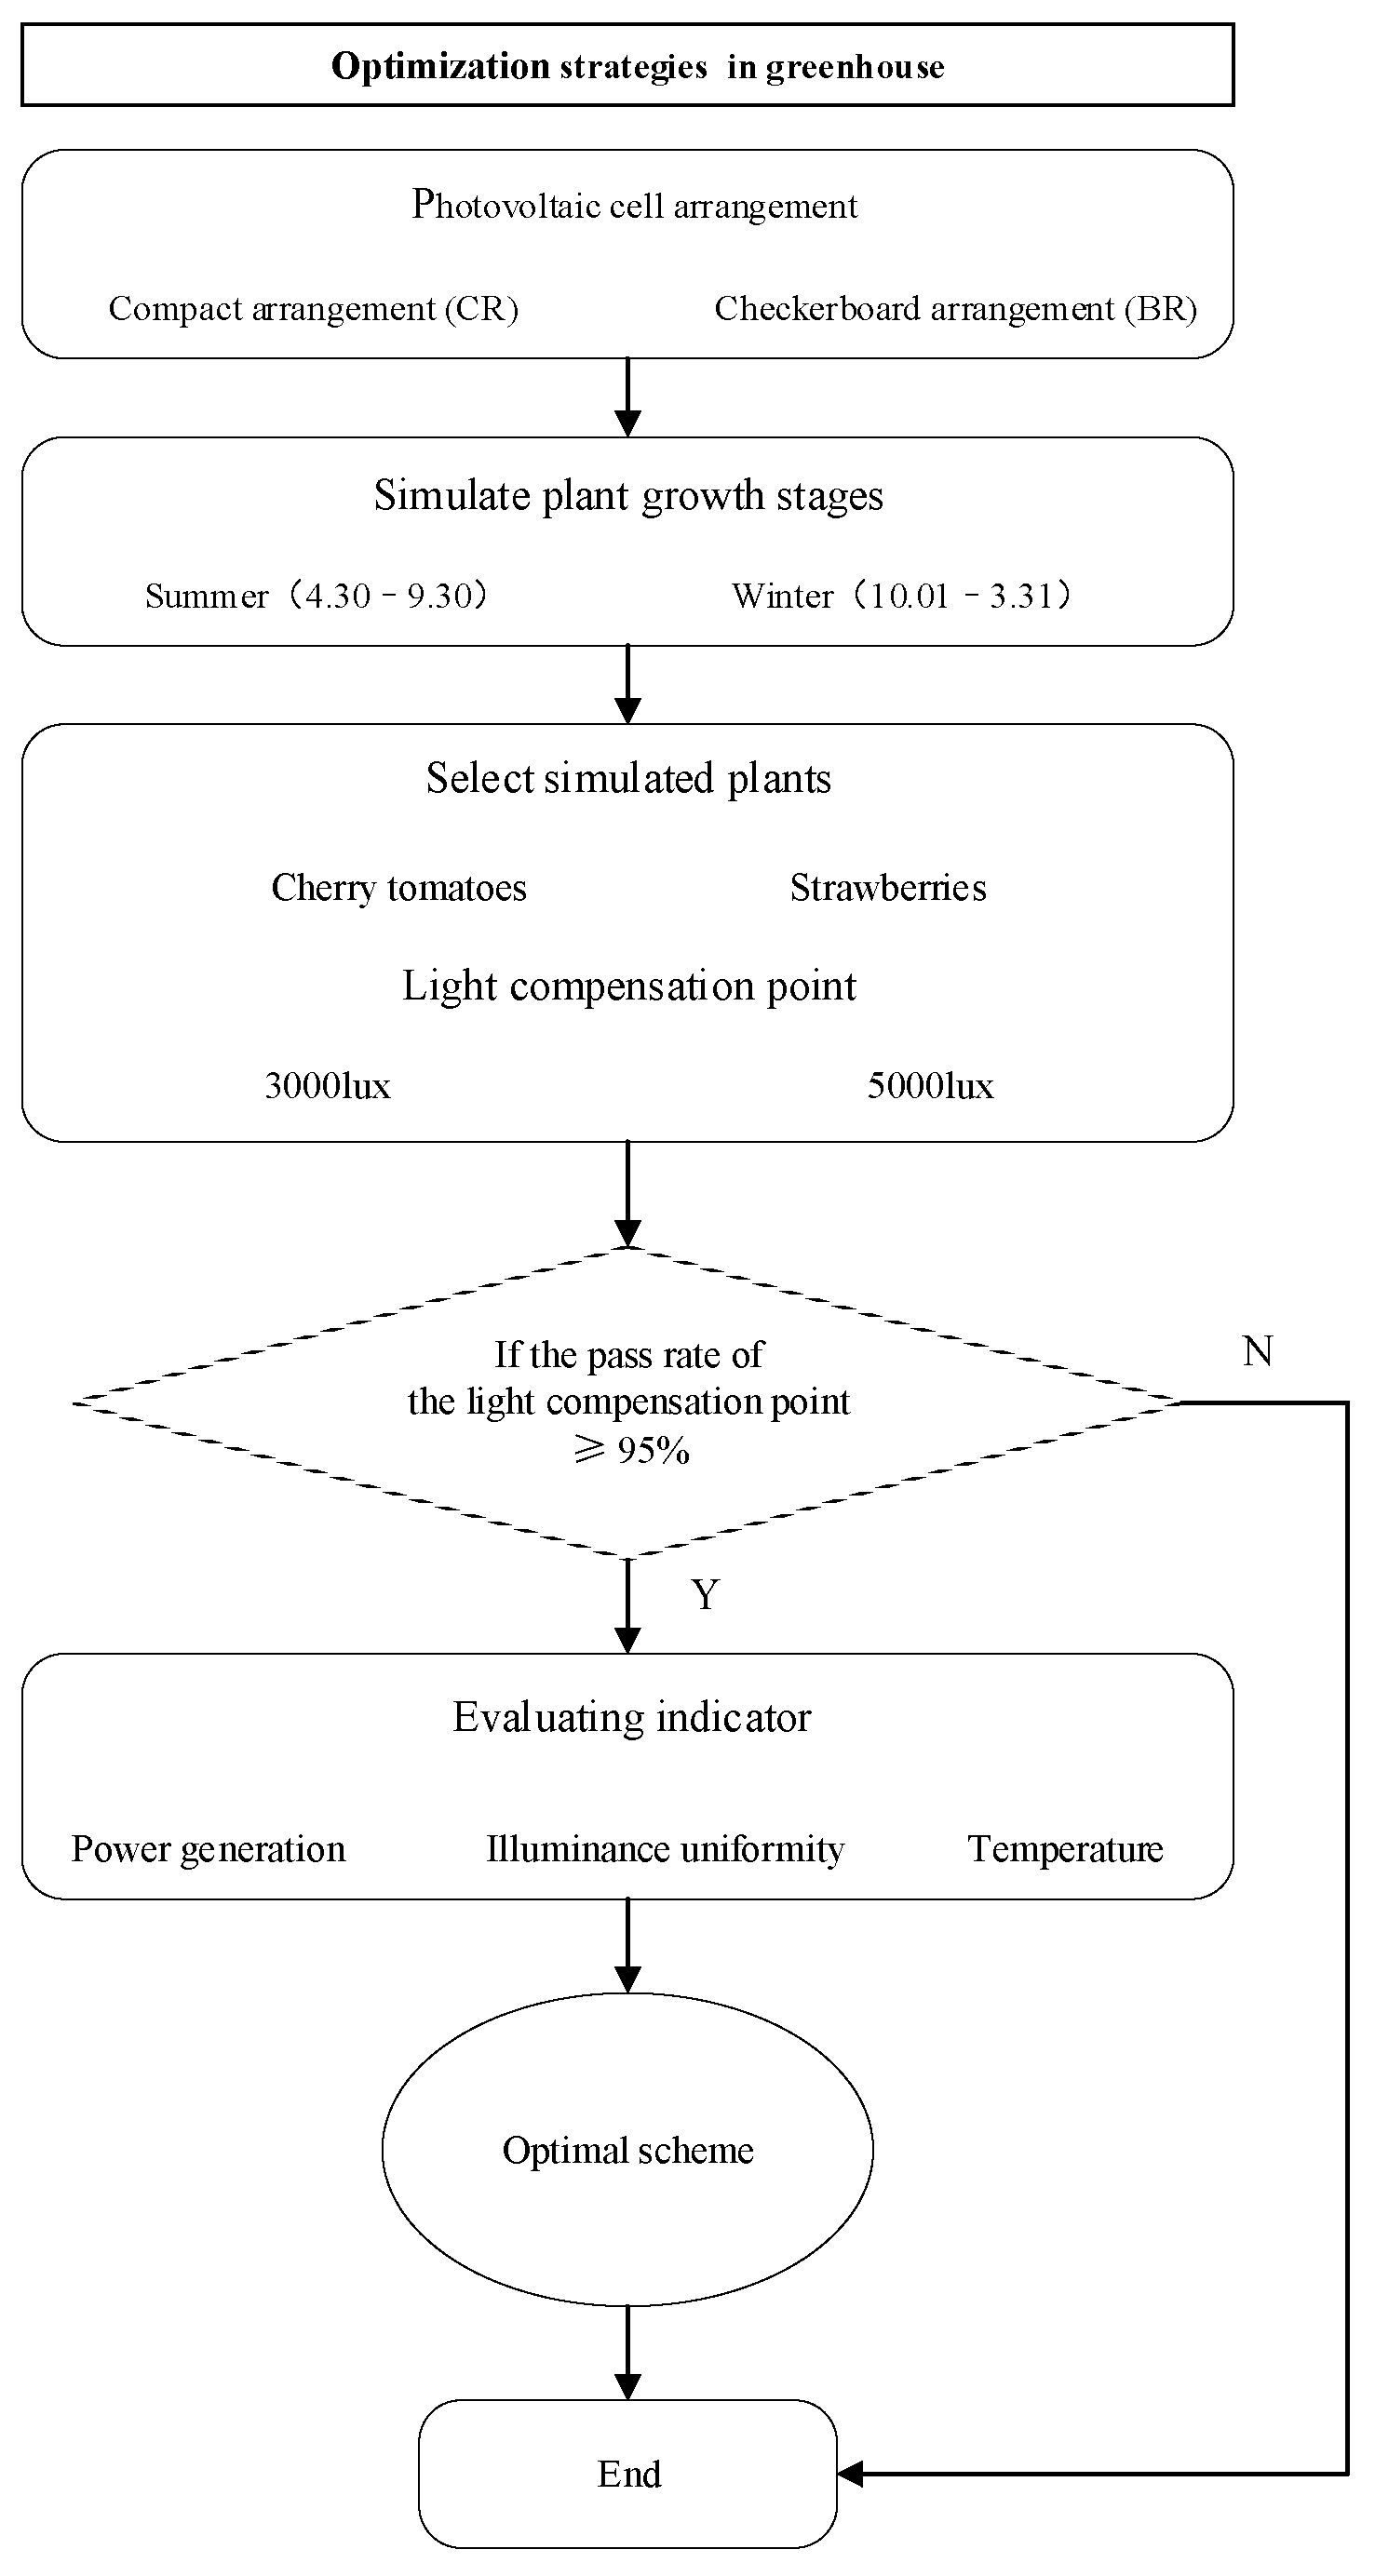
2.4. Optimization Strategy

The purpose of this study was to analyze the light and electrical behavior of greenhouses. With regard to the light behavior of greenhouses, the cultivation of cherry tomatoes and strawberries has been considered because of their excellent environmental adaptability and the advantages of greenhouse cultivation, which can significantly increase yield and sweetness. In accordance with studies by Zhong [53] and Guo [54], the light saturation points for cherry tomatoes and strawberries are set at 10,000 lux and 30,000 lux, respectively. The light compensation points for cherry tomatoes and strawberries are set at 3000 lux and 5000 lux, respectively. The light compensation points of cherry tomatoes and strawberries are 3000 lux and 5000 lux, respectively. The period is divided into two growth stages, from April 1 to September 30 for summer, and from October 1 to March 31 for winter. In summer, September 30 is the typical day, in winter, December 22 is the typical day, and the lighting mode is for an overcast day.
In order to compare and analyze the most suitable photovoltaic greenhouse arrangement schemes, it is necessary to formulate a suitable control index strategy, as shown in Figure 7. The optimization approach begins by selecting the layout that meets the basic light requirements for plant growth, ensuring that the minimum illuminance in the greenhouse is above the light compensation point of the plants and the pass rate to meet the requirements is set to 95%. Next, we selected one layout with better illuminance uniformity from each of the two arrangement types to conduct a comparison of its power output, illuminance uniformity, and temperature, ultimately determining the optimal solution. A control index of illuminance uniformity, temperature, and power generation is introduced. The illuminance uniformity range was divided into three ranges, and the two crops were the same. Less than 50% illuminance uniformity indicates poor light quality, 50–85% illuminance uniformity indicates general light quality, and 85–100% illuminance uniformity shows the best light quality. For power generation, the unit of area power generation exceeding 80 kWh/m2 at each stage indicates high efficiency. For temperature, a moderate temperature difference promotes photosynthesis and metabolic activity, and an excessive temperature difference may also harm the plant. The three indicators were compared and analyzed respectively to select the schemes with the best comprehensive performance to provide a theoretical basis for the design of a photovoltaic greenhouse.
The following is an explanation of the evaluation indicators. Illumination intensity has a great impact on biological photosynthesis. Illumination intensity refers to the luminous flux of visible light received per unit of area, referred to as illuminance, in lux (lux or lx). It is used to indicate the intensity of light and the amount of illumination of the surface area of an object, as shown in Equation (10):
E = d φ d s
where d φ is the total luminous flux, d s is the total area receiving illumination.
Light compensation point and light saturation point are two important indicators for measuring the photosynthetic efficiency of plants under different light intensities. The light compensation point refers to the illumination intensity levels at which plants absorb light energy and release oxygen are equal during photosynthesis. The light saturation point refers to the illumination intensity level at which the photosynthesis rate reaches maximum, and thereafter increasing the illumination intensity no longer increases the photosynthesis rate.
Illumination uniformity refers to the consistency or evenness of the illumination distribution over a specific area or surface. It is used to describe whether the distribution of light on a space or surface is uniform, that is, whether the light hits all parts of the target area or surface evenly. Uniform illumination distribution provides a more comfortable and consistent lighting environment and ensures that plants on target areas or surfaces receive adequate light. The value range of illumination uniformity is generally 0~1. The closer the value is to 1, the more uniform the illumination distribution is, and vice versa, as shown in Equation (11):
U = E m i n E a v
where E m i n is the minimum illumination intensity, lux; E a v is the average illumination intensity, lux.

3. Results

This study aims to achieve compatibility between plant cultivation and power generation in photovoltaic greenhouses by altering the arrangement of photovoltaic components. It investigates power generation, illuminance uniformity, and temperature to identify the optimal combination scheme.

3.1. Electricity Production Analysis

As can be observed in Figure 8 and Figure 9, the unit of area power generation of all photovoltaic cells in summer ranges between 40.55 kWh/m2 and 149.98 kWh/m2, while in winter, it varies between 19.59 kWh/m2 and 120.16 kWh/m2. From the perspective of photovoltaic cell orientation, in both summer and winter, the unit of area power generation of photovoltaic cells in all regions follows the pattern of “south greater than north”, especially during winter. This phenomenon is primarily influenced by the varying solar angles in different seasons and regions. In summer, the cities north of Nanjing achieve maximum unit of area power generation when facing south at 18°, with outputs of 149.98 kWh/m2, 130.15 kWh/m2, and 112.55 kWh/m2, respectively. While the city south of Nanjing reaches its peak at 0°, with an output of 95.74 kWh/m2. In winter, the cities north of Nanjing achieve maximum unit of area power generation at 54° south-facing orientation, with outputs of 120.16 kWh/m2, 96.31 kWh/m2, and 88.86 kWh/m2, respectively, whereas the cities south of Nanjing peak at 36° south-facing orientation, with an output of 86.89 kWh/m2. From the perspective of the regions, due to Harbin’s ample sunlight exposure, cities in the vicinity of Harbin exhibit the highest electricity generation per unit of area. Based on the electricity generation per unit of area, four cities have been identified as requiring simulated photovoltaic cell layout schemes.
Figure 10 and Figure 11 show the total power generation and unit of area power generation of the four regions under different arrangements in summer and winter. It can be observed from the figures that, due to factors such as solar irradiance, the electricity generated under the same arrangements varies across the four regions. From the perspective of region, in summer, the total power generation in the same arrangement decreases with decreasing latitude. The unit of area power generation of photovoltaic cells ranges from 77.57 kWh/m2 to 149.97 kWh/m2 across all arrangements. In winter, the total power generation initially decreases with decreasing latitude under the same arrangement, then increases with further decreases in latitude, which can be attributed to factors such as direct sunlight and weather conditions. The unit of area power generation of photovoltaic cells across all arrangements ranges from 58.46 kWh/m2 to 120.16 kWh/m2. From the perspective of the seasons, among the four cities, except for CR9 and BR9 in Guangzhou, the unit of area power generation of the other schemes exceeds 80 kWh/m2, with excellent power generation efficiency in summer. In winter, there is a relative decrease. Among the four cities, only Harbin reached seven rows of photovoltaic cells under the unit of area of photovoltaic cells with more than 80 kWh/m2, while the other three cities had five rows.

3.2. Illuminance Analysis

This section utilizes the Daylighting module in DesignBuilder for daylighting analysis. The module’s functionality includes the analysis of light levels for different time periods and seasons, enabling the calculation of illuminance intensity for specific areas. The detailed parameters are shown in Table 3.
Figure 12 and Figure 13 show the illumination distribution of the four regions under different arrangements in summer and winter. Different colored blocks correspond to different levels of illumination. Orange represents areas with an illumination ranging from 0 to 3000 lux, green represents areas with an illumination ranging from 3000 to 5000 lux, purple represents areas with an illumination ranging from 5000 to 7000 lux, yellow represents areas with an illumination ranging from 7000 to 9000 lux, and blue represents areas with an illumination ranging from 9000 to 11,000 lux. It can be seen that the variation trends of light intensity in the four cities under different photovoltaic cell arrangements are basically similar. As the number of photovoltaic cells decreases, the light intensity becomes higher and higher. From the point of view of the cities, under the same arrangement, the light intensity increases with the increase in latitude, and the light in Guangzhou is the most abundant, with the maximum light reaching 11,000 lux. From the perspective of the seasons, under the same arrangement, the light intensity of the four cities in summer is significantly higher than that in winter.
The minimum illumination of the greenhouse cannot be lower than the light compensation point of the plant, and the pass rate to meet the requirement is set to 95%, so it is necessary to select the arrangement that meets the minimum growth requirements of the plant. When the color blocks above 3000/5000 lux are more than 95%, the minimum growth requirements of cherry tomatoes/strawberries are met. Table 4 shows the arrangement of photovoltaic cells to meet the minimum growth requirements of plants. It can be seen that Harbin and Shenyang are not suitable for growing strawberries in winter.
Figure 14 and Figure 15 show the illuminance uniformity of the four regions under different arrangements in summer and winter. It can be seen that the variation trends of illuminance uniformity in the four cities under different photovoltaic cell arrangements are generally similar. In the case of the compact arrangement, the illuminance uniformity increases as the number of rows decreases and there is a large increase in CR4, while for the checkerboard arrangement, the illuminance uniformity initially decreases and then increases as the number of rows decreases. The fluctuations are very small, and the fluctuation changes are close to 0.85. Whether in summer or winter, CR7, CR8, and CR9 illuminance uniformities are lower than 0.5, and the light quality is very poor. Under the same coverage, the checkerboard arrangement sacrifices a little light compared to the compact arrangement, but the quality of the illuminance uniformity is significantly improved. Among the four cities, the average illumination uniformity of the checkerboard arrangement was improved by 37.34%, 37.9%, 38.2%, and 35.8%, respectively, compared with the compact arrangement.

3.3. Temperature Analysis

As shown in Figure 16, the typical daily temperature variation in summer for the four cities follows a “single peak” curve. In regions north of Nanjing, the maximum temperature is reached at around 13:00, while in regions south of Nanjing, the maximum occurs around 15:00, with the minimum temperature occurring at around 6:00. However, the rates of temperature rises and falls vary at different times of the day in the four cities. The temperature variations in the regions north of Nanjing are larger, while the variations in the regions south of Nanjing are smaller. From the perspective of photovoltaic (PV) cell coverage, among the four cities, CR9 exhibits the smallest temperature difference and the best thermal insulation performance. During the day, the highest temperatures inside the greenhouse are 19.56 °C, 20.92 °C, 23.1 °C, and 30.12 °C, respectively, while at night, the lowest temperatures are 6.32 °C, 12.44 °C, 19.26 °C, and 23.56 °C, resulting in temperature differences of 13.24 °C, 8.48 °C, 3.84 °C, and 6.56 °C, respectively. On the other hand, BR1 has the largest temperature difference and the poorest thermal insulation performance. The highest temperatures during the day are 26.83 °C, 27.47 °C, 23.72 °C, and 33.19 °C, while the lowest temperatures at night are 5.07 °C, 11.42 °C, 17.83 °C, and 22.81 °C, leading to temperature differences of 21.76 °C, 16.05 °C, 5.89 °C, and 10.38 °C, respectively. Compared to BR1, the temperature differences in the four cities for CR9 have decreased by 38.6%, 47.1%, 34.8%, and 36.8%, respectively. It can be observed that the more PV cells cover the area, the smaller the temperature difference inside the greenhouse. This is due to the fact that the more PV cells there are, the less heat accumulates inside the greenhouse, reducing heat absorption. The indoor temperatures in the four cities remain within the range of 10 °C to 30 °C, which is generally suitable for the growth of strawberries and cherry tomatoes.
As shown in Figure 17, the typical daily temperature variation in winter for the four cities follows a “single peak” curve. The temperature changes are delayed by about one hour compared to summer. In regions north of Nanjing, the maximum temperature is reached at around 14:00, while in cities south of Nanjing, it peaks at around 16:00. However, the rates of temperature rises and falls vary across the four cities at different times of the day. From the perspective of photovoltaic (PV) cell coverage, it is evident that CR9 has the smallest temperature difference and the best insulation performance. The maximum daytime temperatures in the greenhouse are −2.49 °C, 7.58 °C, 15.59 °C, and 23.73 °C, while the minimum night-time temperatures are −6.75 °C, 0.58 °C, 6.84 °C, and 10.53 °C, with corresponding temperature differences of 4.26 °C, 7 °C, 8.75 °C, and 13.2 °C. On the other hand, BR1 has the largest temperature difference and the poorest insulation performance. The maximum daytime temperatures are −2.65 °C, 11.2 °C, 18.28 °C, and 30 °C, while the minimum night-time temperatures are −8.21 °C, −0.35 °C, 5.2 °C, and 9.82 °C, resulting in temperature differences of 5.56 °C, 11.55 °C, 13.08 °C, and 20.18 °C, respectively. As the coverage of photovoltaic cells increases, the temperature difference within the greenhouse decreases, leading to significant improvement in insulation performance. This is because a greater number of photovoltaic cells reduces the accumulation of heat within the greenhouse, thereby decreasing heat absorption. Compared to BR1, the temperature differences in the four cities for CR9 have decreased by 23.38%, 39.3%, 33.1%, and 34.6%, respectively. The indoor temperatures in regions south of Nanjing generally remain within the range of 10 °C to 30 °C, which is suitable for the growth of strawberries and cherry tomatoes. In contrast, the temperatures in regions north of Nanjing are relatively lower, and heating may be required when necessary.

3.4. Selection of the Optimal Arrangement Scheme

In the previous section, a comparison was made of the electricity generation, light intensity, illuminance uniformity, and temperature field distribution under eighteen different layout schemes. The analysis results indicate that the indoor environments of the photovoltaic greenhouses exhibit significant differences under different PV cell arrangements. To more intuitively describe these differences, one layout scheme from each of the two arrangements, which provides better illuminance uniformity and meets the basic growth requirements of plants, was selected. The relationship between the parameters of different layout schemes and electricity generation, illuminance uniformity, and temperature field distribution was then established, as shown in Table 5, Table 6, Table 7 and Table 8. The optimal arrangement of photovoltaic cells is shown in Table 9.
As shown in Table 5 and Table 6, for cherry tomatoes, in Harbin, Shenyang, and Nanjing, there is little difference between CR2 and BR9 in terms of illuminance uniformity and temperature field. However, the temperature difference in BR9 is reduced by 6.9%, 8.3%, and 10% compared to CR1. The most significant difference is in electricity generation. Due to the higher coverage of photovoltaic cells, BR9 generates significantly more electricity than CR1, making BR9 the better choice when considering overall performance. For Guangzhou, there is little difference between CR2 and BR7 in terms of illuminance uniformity and temperature field. BR7 reduces the temperature difference by 10% compared to CR1. The main difference again lies in electricity generation. With a higher PV cell coverage, BR7 generates much more electricity than CR1, and when considering all factors, BR7 offers better performance. For strawberry, in Harbin, CR1 slightly outperforms BR2 in terms of electricity generation and illuminance uniformity, with little difference in temperature variation. When considering all factors, CR1 is the better choice. In Shenyang, BR4 is slightly lower than CR1 in terms of illuminance uniformity, but the temperature difference is reduced by 8.8%. The major difference is in electricity generation, where BR4, with its higher PV cell coverage, generates much more electricity than CR1. Overall, BR4 provides better performance. In Nanjing, BR6 outperforms CR2 in electricity generation, illuminance uniformity, and temperature field distribution. In Guangzhou, CR2 has slightly better illuminance uniformity than BR7, but BR7 reduces the temperature difference by 10.1% compared to CR2 and generates much more electricity. Taking all factors into account, BR7 offers superior performance.
As shown in Table 7 and Table 8, for cherry tomatoes, in Harbin and Shenyang, there is little difference between CR1 and BR2 in terms of electricity generation, illuminance uniformity, and temperature field distribution, with CR1 slightly outperforming BR2. In Nanjing, CR2 has slightly lower illuminance uniformity than BR2, but the temperature difference in CR2 is reduced by 8.03% compared to BR2. When considering all factors, CR2 provides better overall performance. In Guangzhou, CR2 has slightly lower illuminance uniformity than BR3, but the temperature difference in CR2 is reduced by 5.4% compared to BR3. Overall, CR2 offers better performance. For strawberries, in Harbin and Shenyang, conditions are not suitable for strawberry cultivation. In Nanjing, only BR1 meets the basic growth requirements for strawberries. In Guangzhou, CR2 has slightly lower illuminance uniformity than BR3, but the temperature difference in CR2 is reduced by 5.4% compared to BR3. When considering all factors, CR2 provides better overall performance.

4. Discussion

This study employs modeling and simulation to test designs and develops a comprehensive evaluation metric to assess the light, thermal, and electrical behavior in a photovoltaic (PV) greenhouse. By altering the arrangement of PV cells in the greenhouse, we aim to achieve compatibility between plant production and power generation. The study identifies the optimal configuration for placing PV cells on greenhouse rooftops for different plants in various cities. The limitation of this study lies in its current focus on regions within China. To enhance the generalization capability of the model, in future research, we will explore optimization algorithms to further expand the scope, systematically investigating the optimal parameter configurations. Additionally, a series of experiments can be conducted to compare the effectiveness of different optimization algorithms in order to identify the most suitable approach for our model. This will not only improve the existing research but also provide valuable insights for other researchers in related fields.

5. Conclusions

This study is based on the EnergyPlus 8.9 simulation engine and uses DesignBuilder 6.1.0 energy simulation software for simulation modeling. By altering the arrangement of the greenhouse photovoltaic panels, the study aims to enhance the compatibility between plant production and electricity generation in photovoltaic greenhouses. The illumination intensity, illumination uniformity, and power generation of different photovoltaic cell arrangements in different cities are compared. The analysis results show that the environment inside the photovoltaic greenhouse has obvious differences under different photovoltaic cell arrangement schemes. The main results of this study are as follows:
(1)
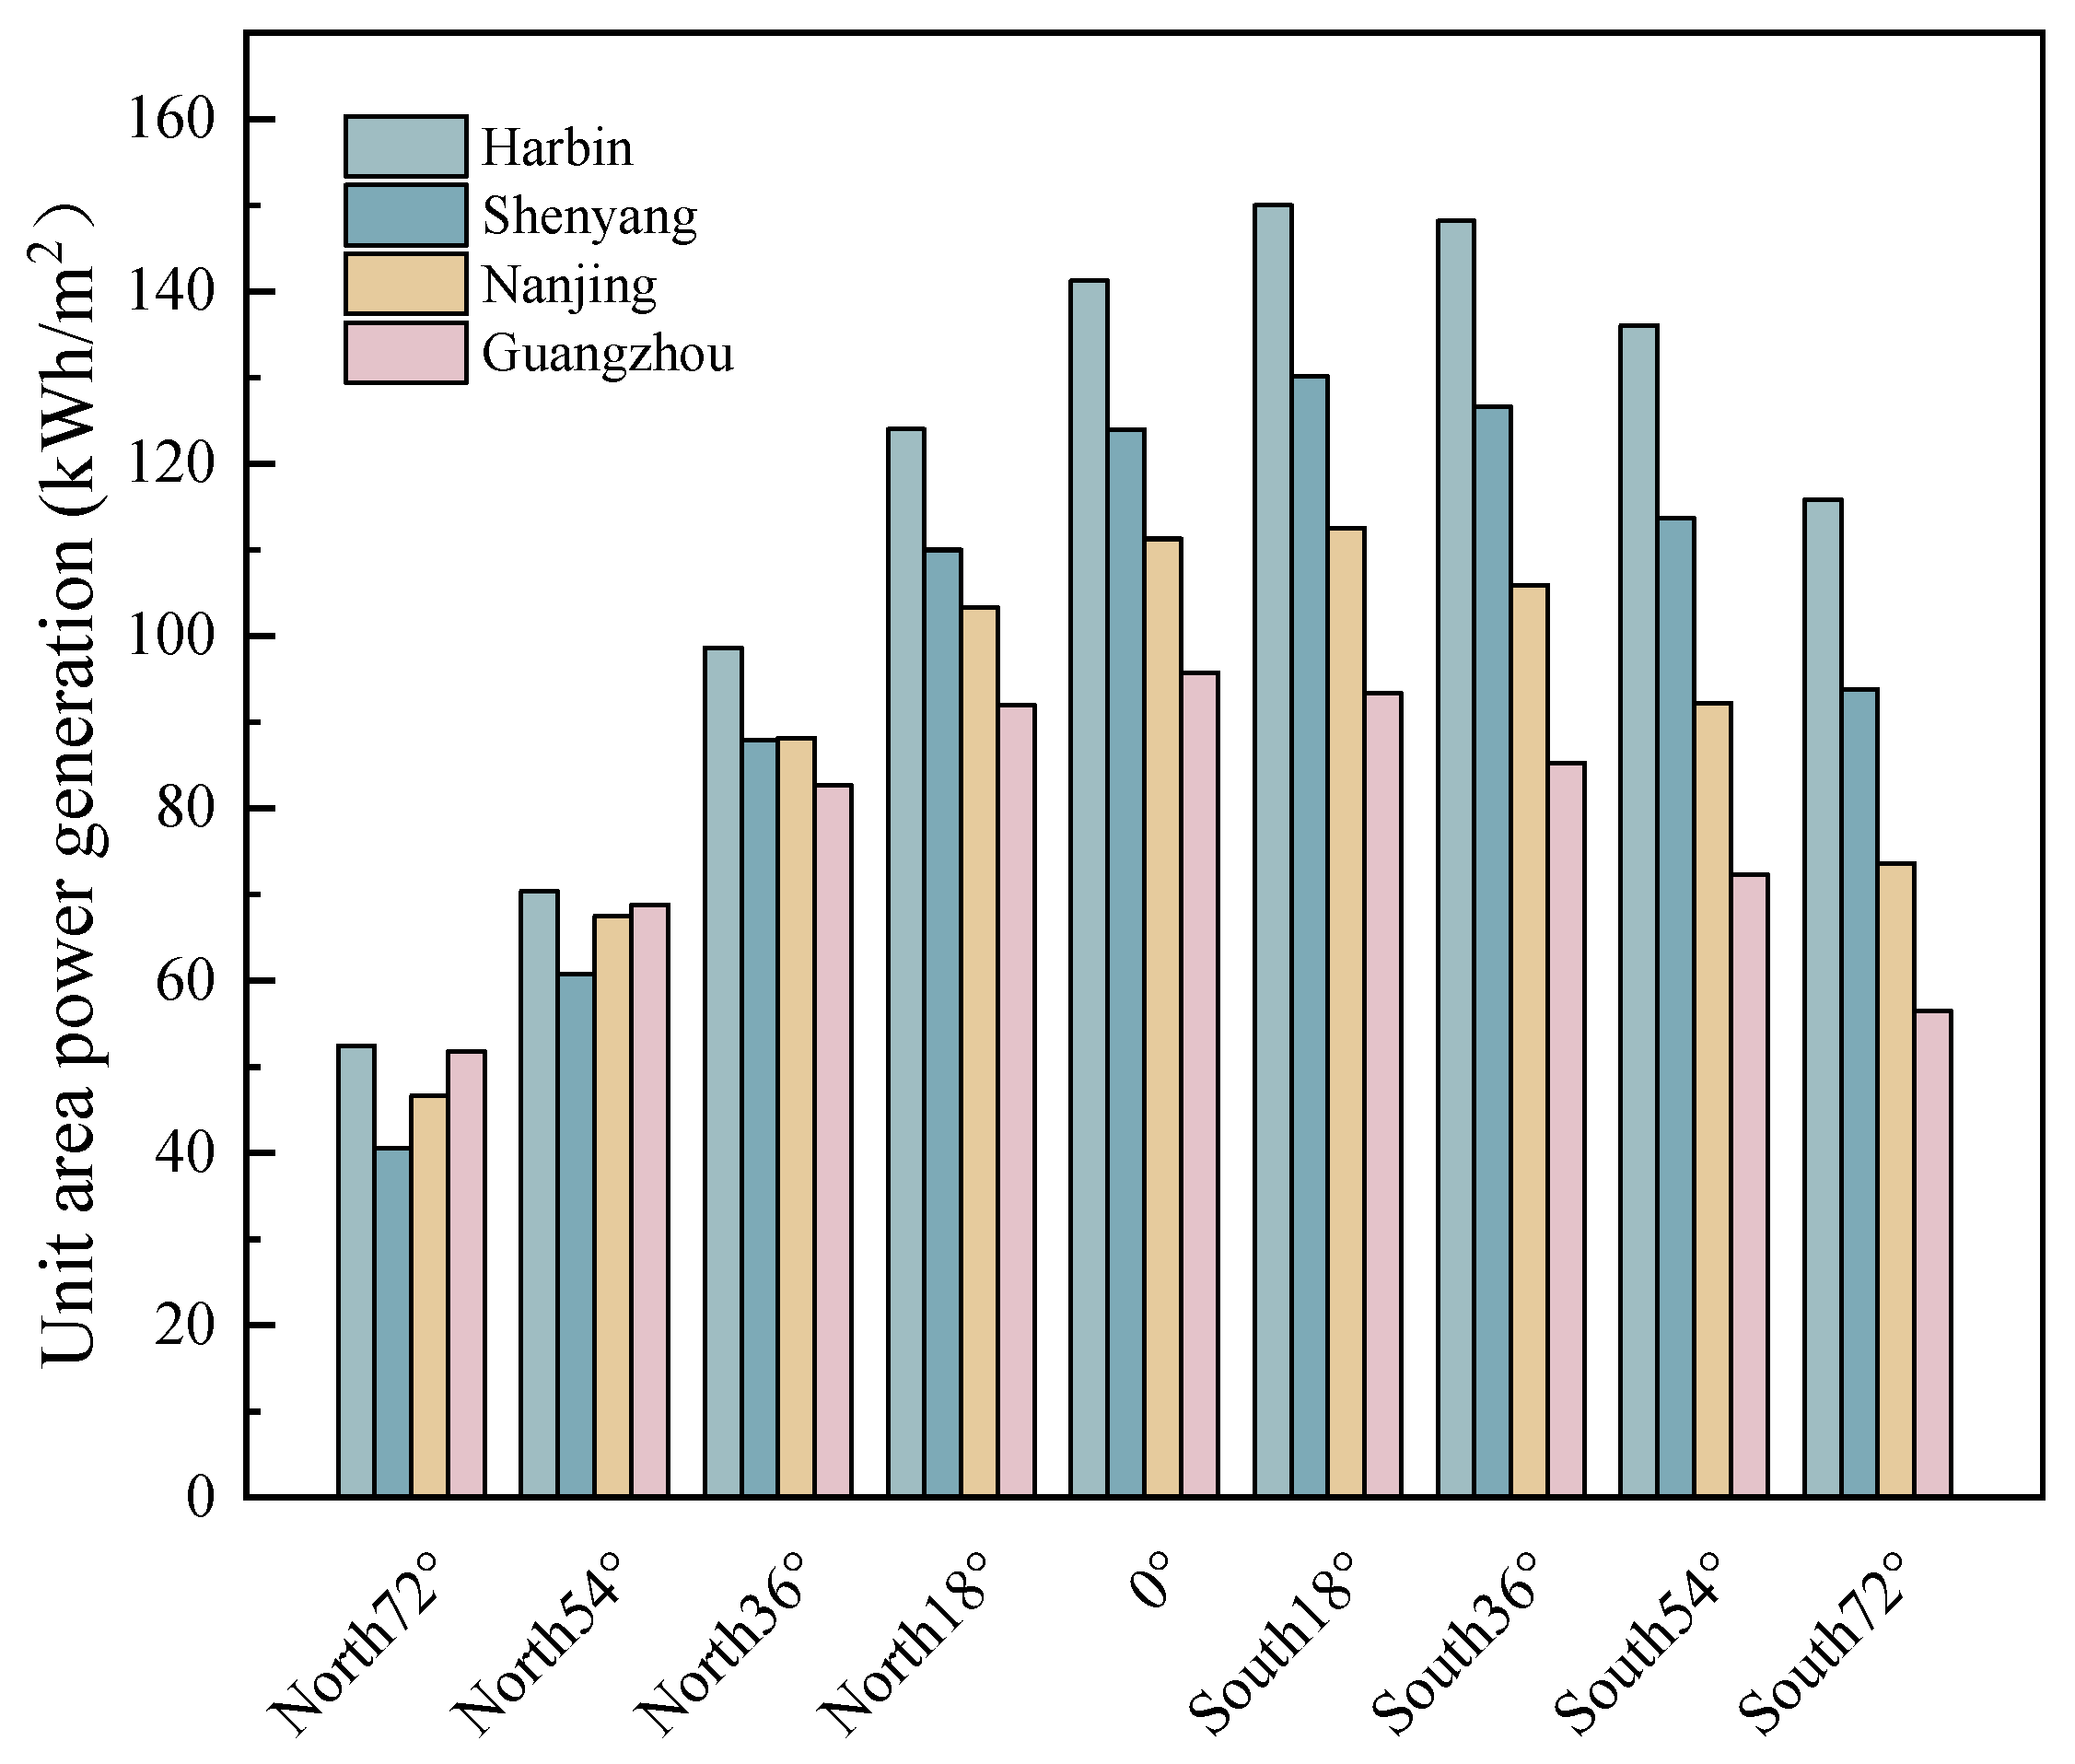
In summer, cities north of Nanjing achieve maximum unit of area power generation when facing south at 18°, with outputs of 149.98 kWh/m2, 130.15 kWh/m2, and 112.55 kWh/m2, respectively, while the cities south of Nanjing reach their peak at 0°, with an output of 95.74 kWh/m2. In winter, cities north of Nanjing achieve maximum unit of area power generation at 54° south-facing orientation, with outputs of 120.16 kWh/m2, 96.31 kWh/m2, and 88.86 kWh/m2, respectively, whereas cities south of Nanjing peak at 36° south-facing orientation, with an output of 86.89 kWh/m2.
(2)
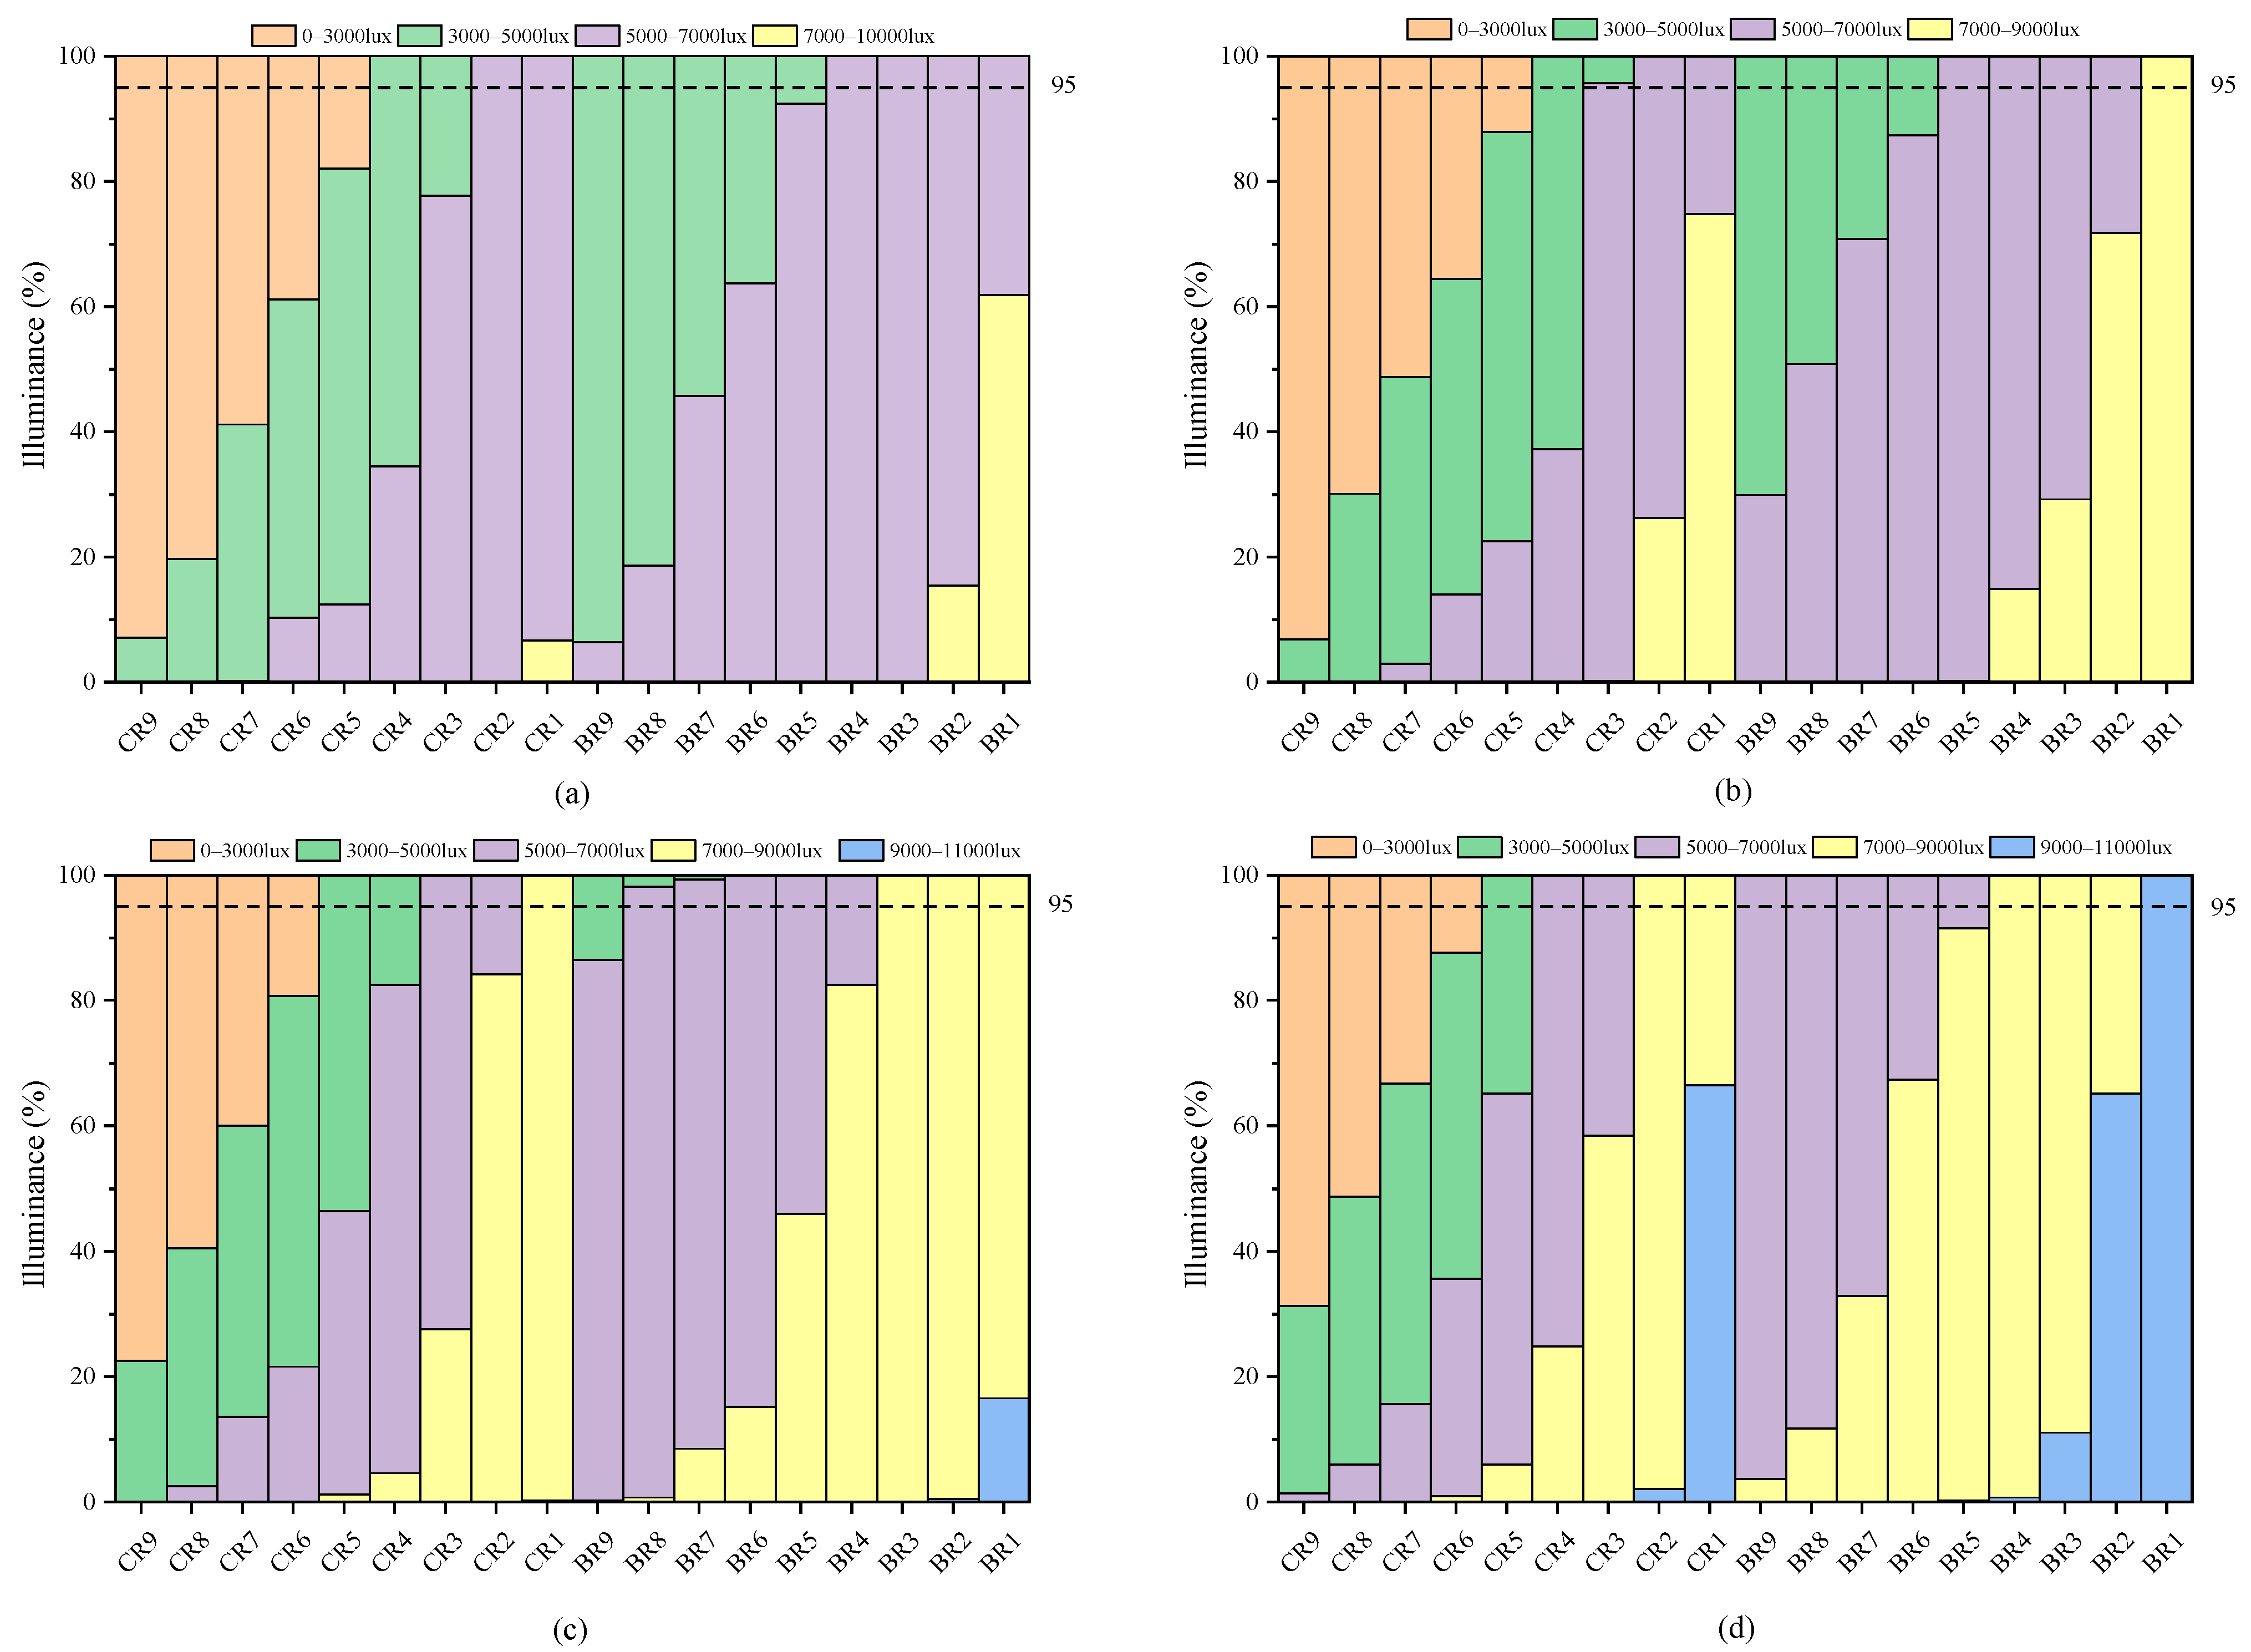
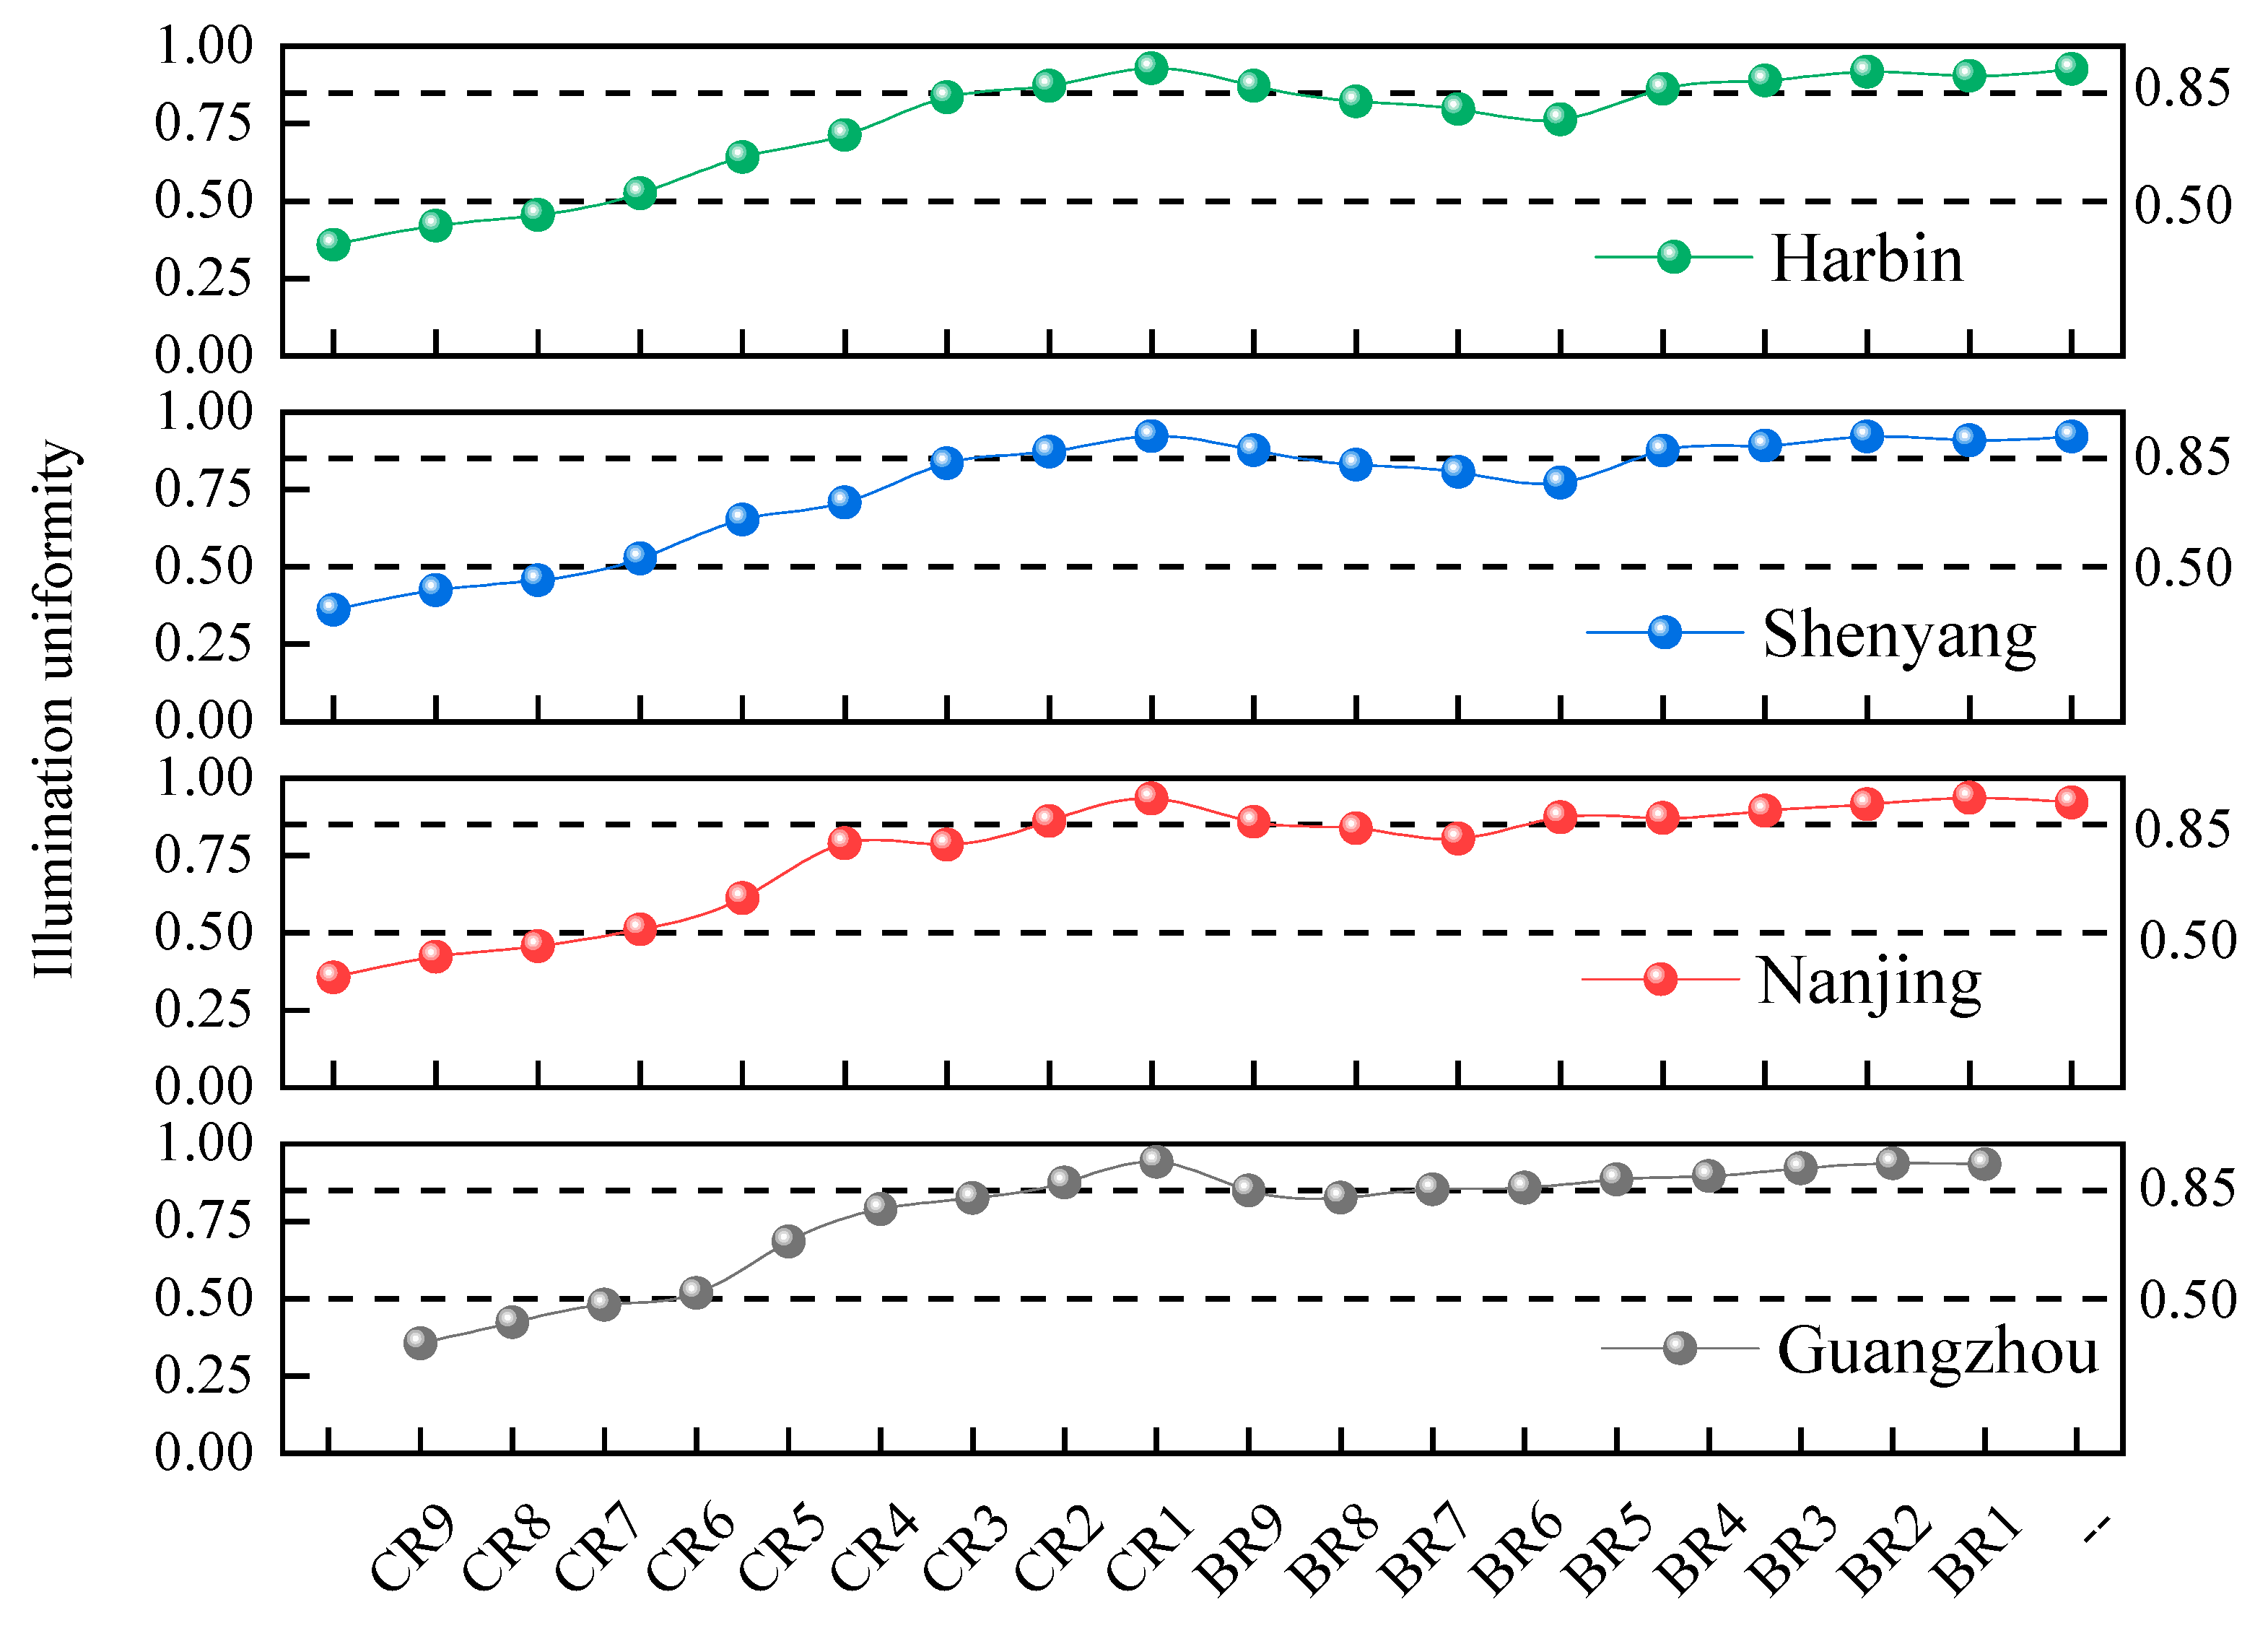
As the number of photovoltaic cells decreases, the illumination intensity becomes higher and higher. The illumination uniformity of the compact arrangement increases as the number of rows decreases, while the illumination uniformity of the checkerboard arrangement shows a trend of initially decreasing and then increasing as the number of rows decreases.
(3)
Under the same coverage rate, the checkerboard arrangement sacrifices a little light compared to the tight arrangement, but the quality of illumination uniformity is significantly improved. Among the four cities, the average illumination uniformity of the checkerboard arrangement was improved by 37.34%, 37.9%, 38.2% and 35.8%, respectively, compared with the compact arrangement.
(4)
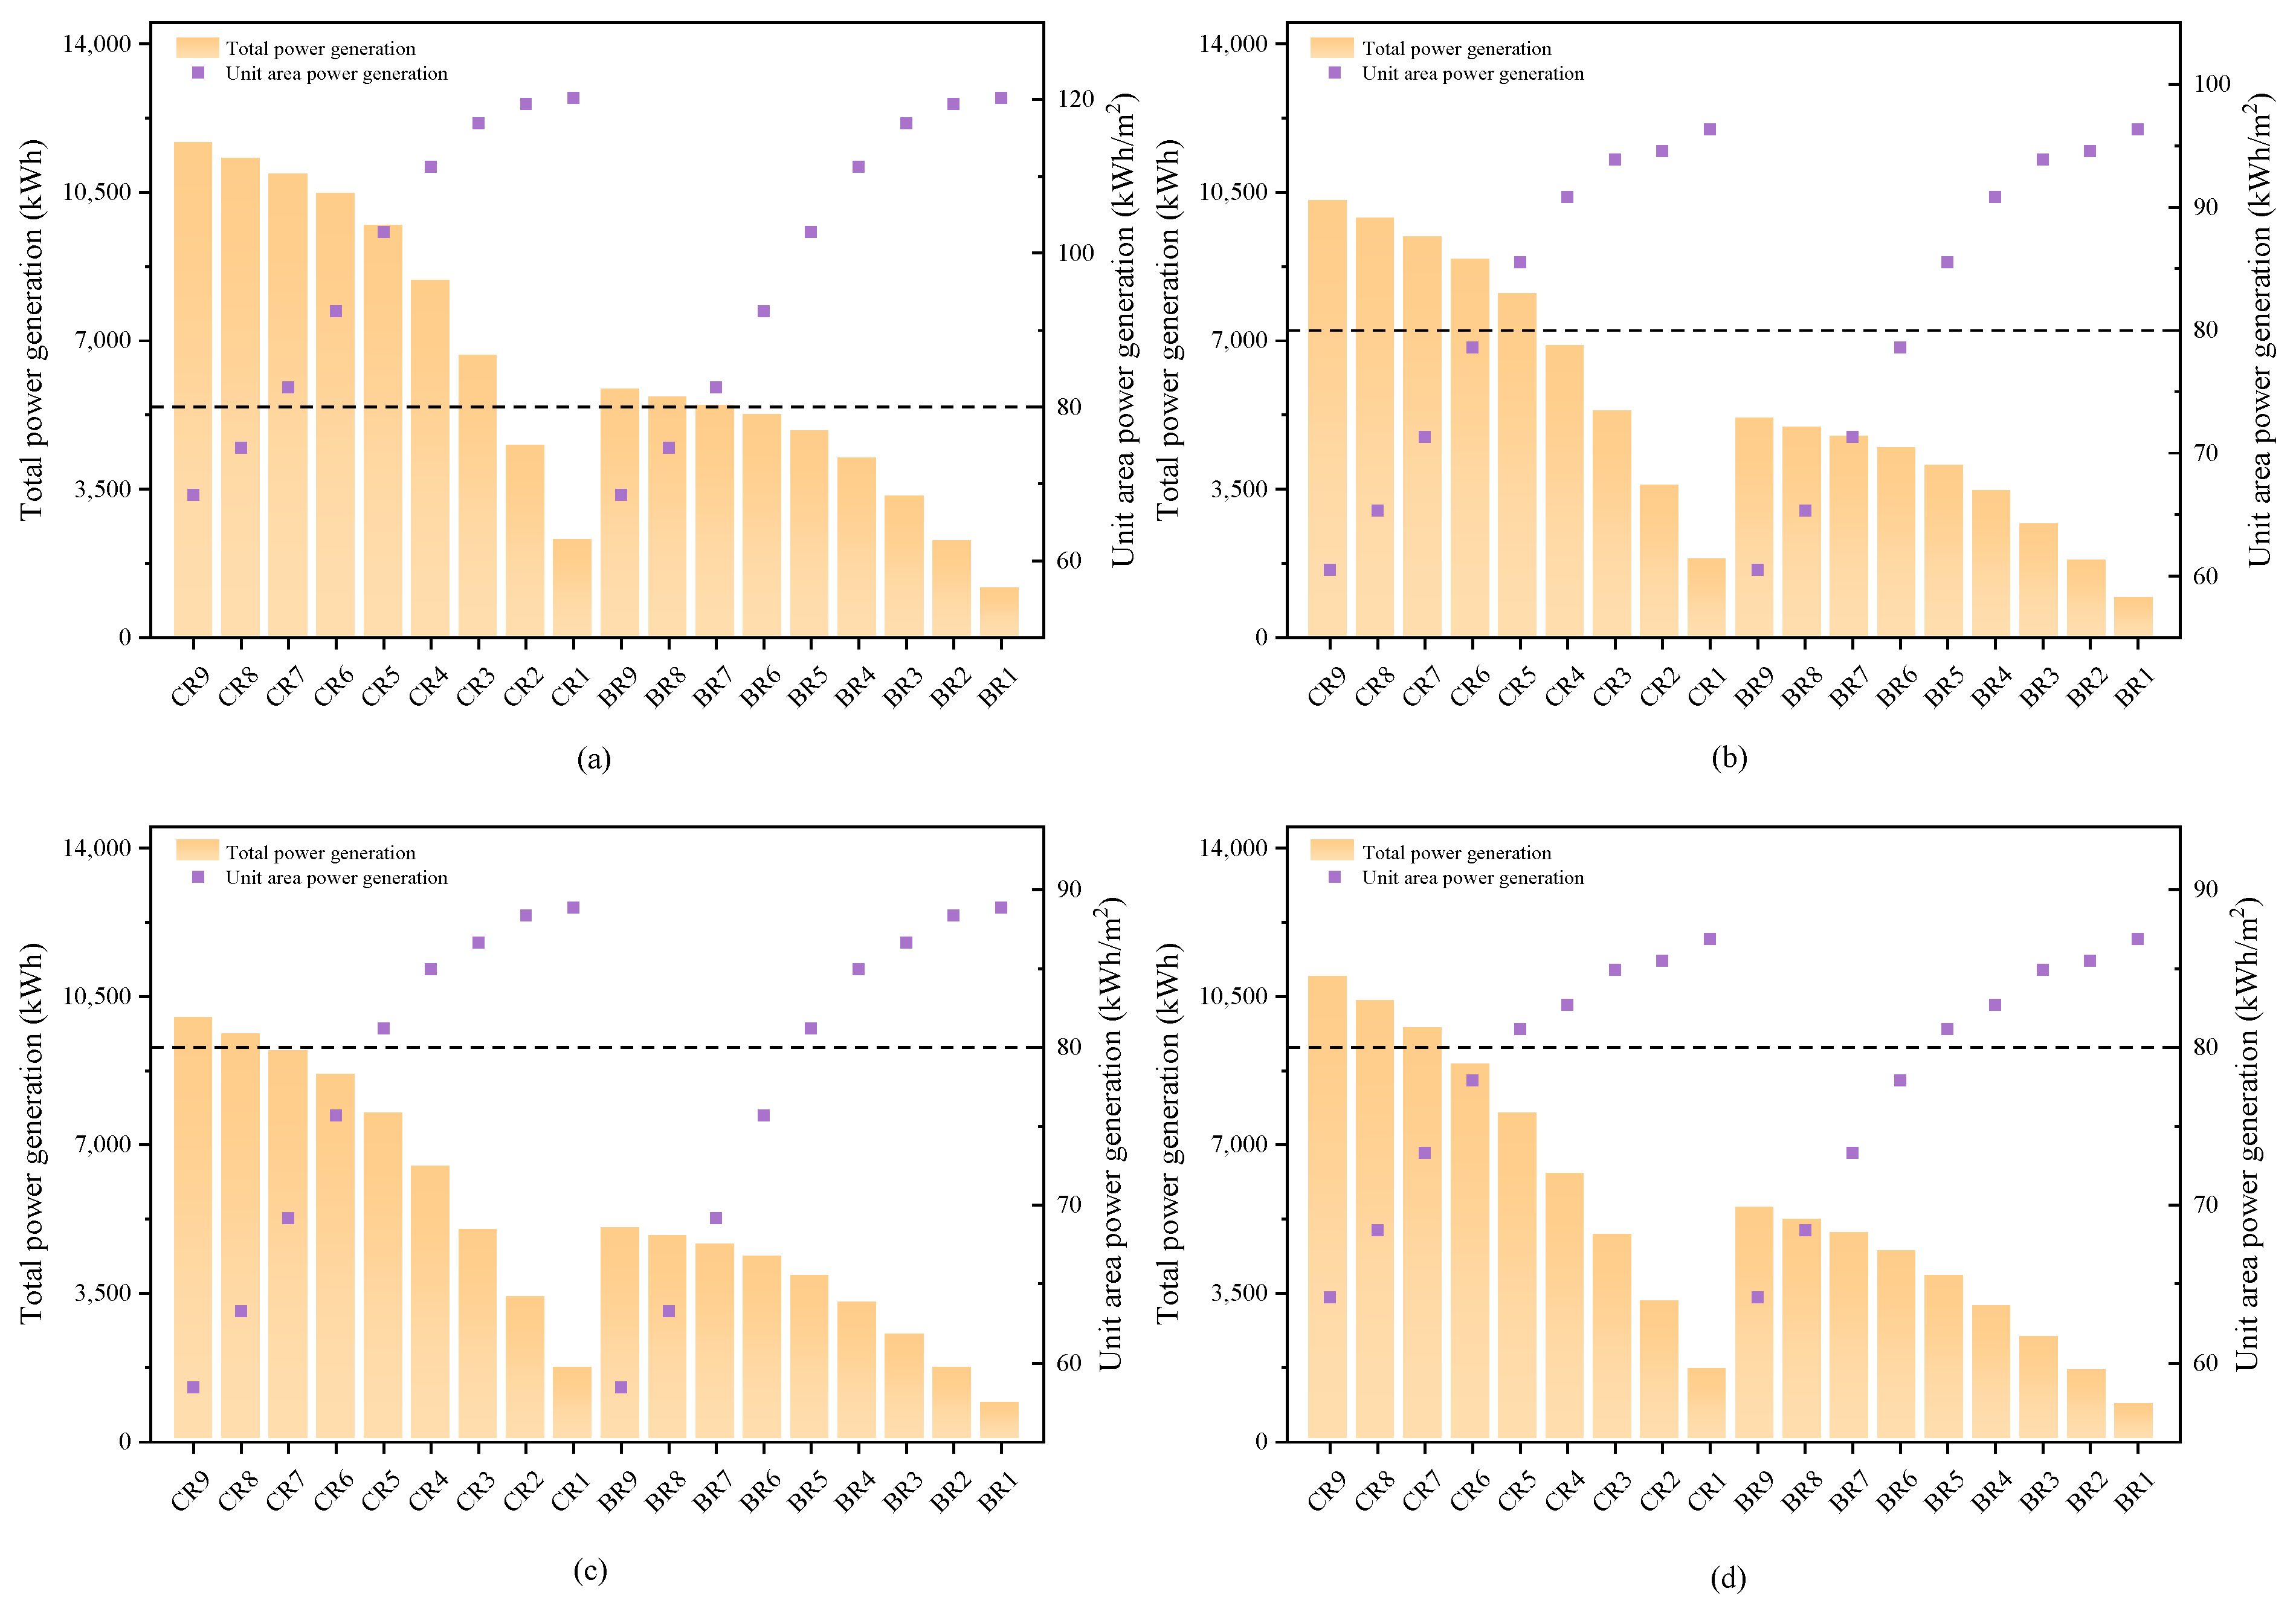
Among the four cities, except for CR9 and BR9 in Guangzhou, the unit of area power generation of other schemes exceeds 80 kWh/m2, with excellent power generation efficiency in summer. In winter, there is a relative decrease. Among the four cities, only Harbin reached seven rows of photovoltaic cells under the unit of area of photovoltaic cells greater than 80 kWh/m2, while the other three cities achieved five rows.
(5)
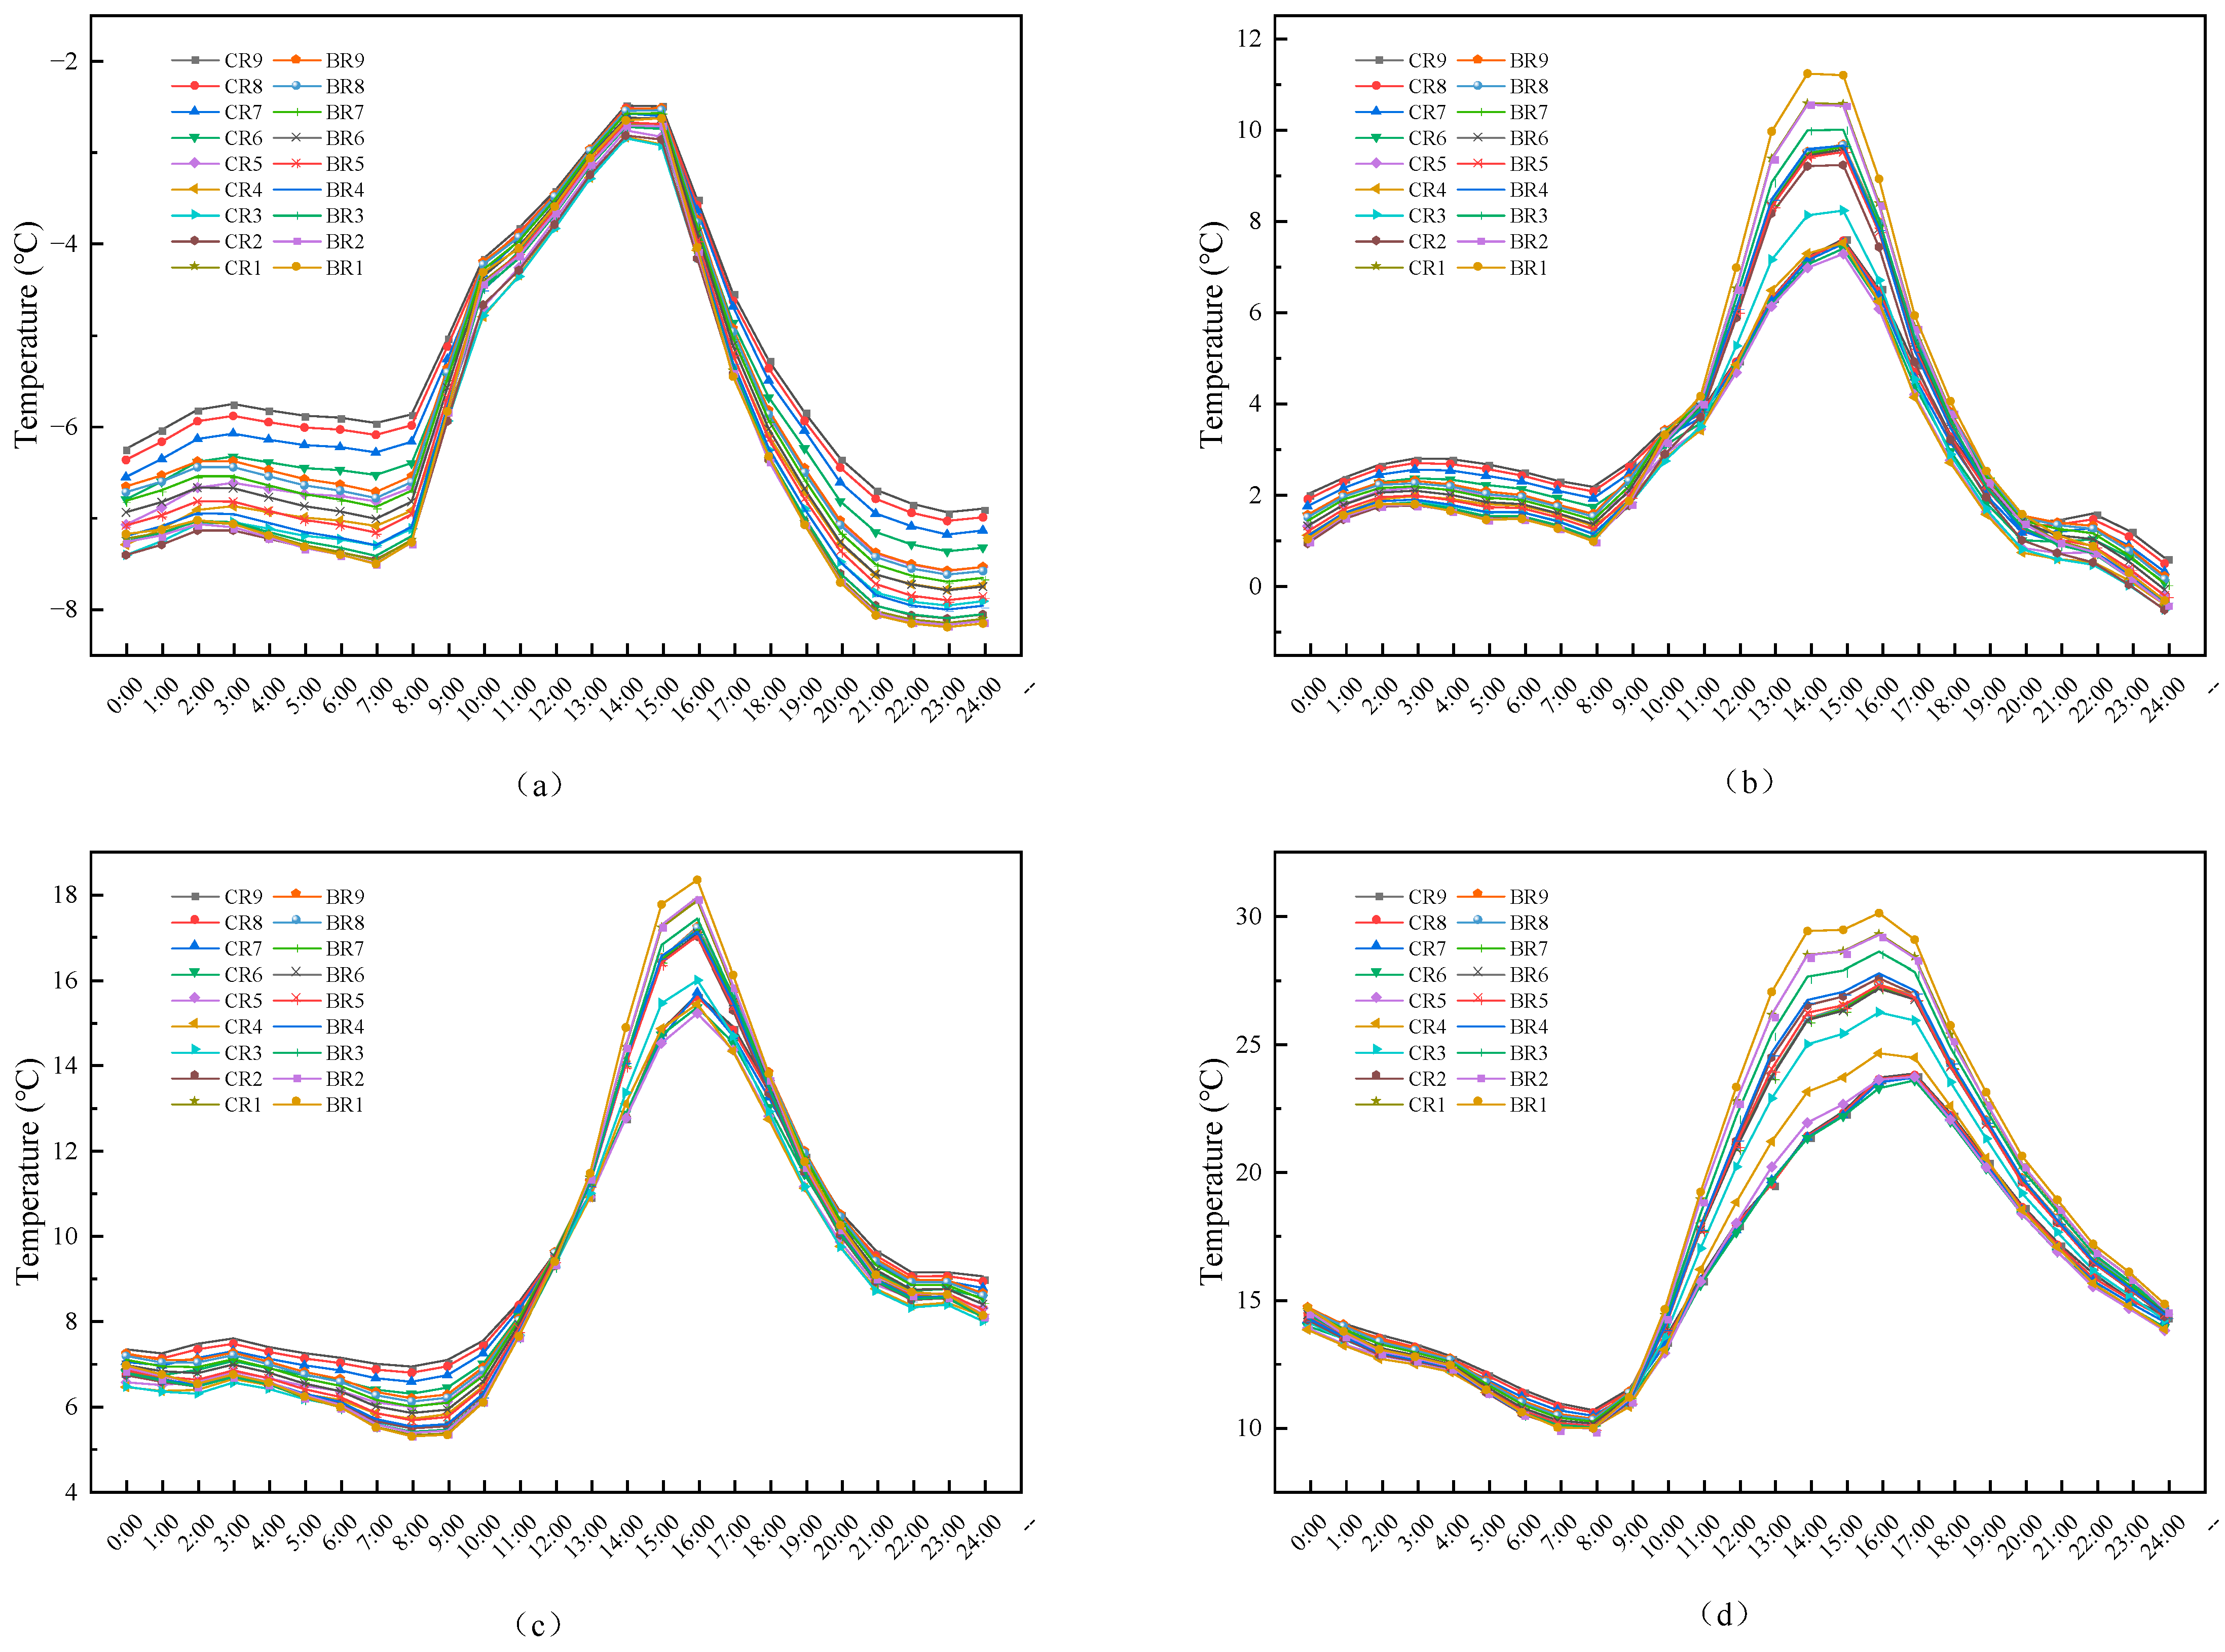
From the perspective of photovoltaic (PV) cell coverage, it can be observed that the greater the coverage of PV cells, the smaller the temperature difference within the greenhouse. In summer, the temperature differences for CR9 are reduced by 38.6%, 47.1%, 34.8%, and 36.8%, respectively, compared to BR1 in the four cities. In winter, the temperature differences for CR9 are reduced by 23.38%, 39.3%, 33.1%, and 34.6%, respectively, compared to BR1 in the four cities.
(6)
Compared to BR1, the temperature differences in the four cities for CR9 have decreased by 38.6%, 47.1%, 34.8%, and 36.8% in summer, respectively. And in winter, the temperature differences in the four cities for CR9 have decreased by 23.38%, 39.3%, 33.1%, and 34.6%, respectively.
(7)
Under the comprehensive evaluation indicator, the optimal arrangement schemes for cherry tomatoes in the four cities (Harbin, Shenyang, Nanjing, and Guangzhou) during the summer are BR9, BR9, BR9, and BR7, with total electricity generation of 9798.95635 kWh, 8386.7678 kWh, 7573.29706 kWh, and 5574.84325 kWh, respectively. Northern cities perform better in electricity generation. In winter, the schemes are CR1, CR1, CR2, and CR2, with total electricity generation of 2271.0722 kWh, 1820.3322 kWh, 3340.4114 kWh, and 3231.6826 kWh, with southern cities performing better. For strawberries in the summer, the optimal arrangement schemes for the four cities are CR1, BR4, BR6, and BR7, with total electricity generation of 2834.56 kWh, 4671.96 kwh kWh, 5798.697 kWh, and 5574.84325 kWh, respectively, showing a similar total electricity generation. In winter, the schemes are none, none, BR1, and CR2, with total electricity generation of 839.8006 kWh and 3231.68kWh. This indicates that, in winter, the environment of northern cities (such as Harbin and Shenyang) is not very suitable for strawberry growth.
These research results provide an objective and scientific theoretical basis for the combination of photovoltaics and greenhouses in different latitudes. This research can promote the development of photovoltaic greenhouse construction, reduce fossil energy consumption and carbon emissions of conventional greenhouses, and contribute to the carbon neutrality of facility agriculture and the lives of local farmers.

Author Contributions

Conceptualization, Q.C.; methodology, Q.C.; software, Y.Q.; validation, Y.Q.; formal analysis, Y.Q.; investigation, Y.Q.; writing—original draft preparation, Y.Q.; writing—review and editing, Q.C.; supervision, Q.C.; project administration, Q.C. All authors have read and agreed to the published version of the manuscript.

Funding

This research received no external funding.

Data Availability Statement

The original contributions presented in the study are included in the article, further inquiries can be directed to the corresponding author.

Acknowledgments

Thanks to all those who contributed to the article.

Conflicts of Interest

The authors declare that they have no known competing financial interests or personal relationships that could have appeared to influence the work reported in this paper.

References

  1. Liu, K.; Zhu, B.; Chen, J. Low-Carbon Design Path of Building Integrated Photovoltaics: A Comparative Study Based on Green Building Rating Systems. Buildings 2021, 11, 469. [Google Scholar] [CrossRef]
  2. Pourasl, H.H.; Barenji, R.V.; Khojastehnezhad, V.M. Solar energy status in the world: A comprehensive review. Energy Rep. 2023, 10, 3474–3493. [Google Scholar] [CrossRef]
  3. Yang, K.; Chen, Y.; Li, C.; Wang, J.; Lund, P.D. Dynamic price optimization of a solar integrated cogeneration system considering uncertainties of building demands. Renew. Energy 2024, 223, 120074. [Google Scholar] [CrossRef]
  4. Singh, G.K. Solar power generation by PV (photovoltaic) technology: A review. Energy 2013, 53, 1–13. [Google Scholar] [CrossRef]
  5. Zisos, A.; Chatzopoulos, D.; Efstratiadis, A. The Concept of Spatial Reliability Across Renewable Energy Systems—An Application to Decentralized Solar PV Energy. Energies 2024, 17, 5900. [Google Scholar] [CrossRef]
  6. Tejero-Gómez, J.A.; Bayod-Rújula, Á.A. Analysis of Grid-Scale Photovoltaic Plants Incorporating Battery Storage with Daily Constant Setpoints. Energies 2024, 17, 6117. [Google Scholar] [CrossRef]
  7. Jiang, W.; Wang, T.; Yuan, D.; Sha, A.; Zhang, S.; Zhang, Y.; Xiao, J.; Xing, C. Available solar resources and photovoltaic system planning strategy for highway. Renew. Sustain. Energy Rev. 2024, 203, 114765. [Google Scholar] [CrossRef]
  8. Mi, P.; Zhang, J.; Gao, J.; Han, Y. Study on optimal allocation of solar photovoltaic thermal heat pump integrated energy system for domestic hot water. Renew. Energy 2023, 219, 119433. [Google Scholar] [CrossRef]
  9. Kunatsa, T.; Myburgh, H.C.; De Freitas, A. Efficient Charging Prioritisation and Optimisation of Solar PV-Powered Portable Electronic Devices. Energies 2024, 17, 6039. [Google Scholar] [CrossRef]
  10. Nandini, K.K.; Jayalakshmi, N.S.; Jadoun, V.K. A combined approach to evaluate power quality and grid dependency by solar photovoltaic based electric vehicle charging station using hybrid optimization. J. Energy Storage 2024, 84, 110967. [Google Scholar]
  11. Ren, C.; Lin, J.; Guo, N. Performance and Optimization of Novel Solar-Assisted Heat Pump System with Hybrid Thermal Energy Storage. Energies 2024, 17, 5944. [Google Scholar] [CrossRef]
  12. Cao, Z.; Liu, Y.; Bai, Y.; Wang, Y.; Ye, S.; Cao, H. Study on the optimal layout of roof vents and rooftop photovoltaic of the industrial workshop. Build. Environ. 2024, 260, 111624. [Google Scholar] [CrossRef]
  13. Chen, T.; Zhang, N.; Ye, Z.; Jiang, K.; Lin, Z.; Zhang, H.; Xu, Y.; Liu, Q.; Huang, H. Carbon Reduction Benefits of Photovoltaic-Green Roofs and Their Climate Change Mitigation Potential: A Case Study of Xiamen City. Sustain. Cities Soc. 2024, 114, 105760. [Google Scholar] [CrossRef]
  14. Ito, R.; Lee, S. Performance enhancement of photovoltaic integrated shading devices with flexible solar panel using multi-objective optimization. Appl. Energy 2024, 373, 123866. [Google Scholar] [CrossRef]
  15. Zhao, R.; Zhang, W.; Huang, F.; Yao, L. Coupled optical-thermal-electrical modelling of translucent photovoltaic curtain wall considering indoor lighting. Sol. Energy 2024, 272, 112481. [Google Scholar] [CrossRef]
  16. Yao, L.; Zhang, W.; Huang, F.; Zhao, R.; Tang, K. Experimental and simulation study on the thermoelectric performance of semi-transparent crystalline silicon photovoltaic curtain walls. J. Build. Eng. 2024, 90, 109421. [Google Scholar] [CrossRef]
  17. Valencia-Caballero, D.; Assoa, Y.-B.; Cambarau, W.; Therme, D.; Sanz, A.; Burgun, F.; Flores-Abascal, I.; Román-Medina, E. Performance analysis of a novel building integrated low concentration photovoltaic skylight with seasonal solar control. J. Build. Eng. 2022, 54, 104687. [Google Scholar] [CrossRef]
  18. Tian, X.; Wang, J.; Ji, J. Performance prediction of a curved-type solar balcony combined with the flexible PV/T system during the non-heating season. Energy Convers. Manag. 2023, 292, 117402. [Google Scholar] [CrossRef]
  19. Arslan, M.; Çunkaş, M. An experimental study on determination of optimal tilt and orientation angles in photovoltaic systems. J. Eng. Res. 2024, in press. [Google Scholar] [CrossRef]
  20. Sonneveld, P.J.; Swinkels, G.L.A.M.; Campen, J.; Van Tuijl, B.A.J.; Janssen, H.J.J.; Bot, G.P.A. Performance results of a solar greenhouse combining electrical and thermal energy production. Biosyst. Eng. 2010, 106, 48–57. [Google Scholar] [CrossRef]
  21. Cossu, M.; Yano, A.; Li, Z.; Onoe, M.; Nakamura, H.; Matsumoto, T.; Nakata, J. Advances on the semi-transparent modules based on micro solar cells: First integration in a greenhouse system. Appl. Energy 2016, 162, 1042–1051. [Google Scholar] [CrossRef]
  22. Harmailil, I.O.; Sultan, S.M.; Tso, C.P.; Fudholi, A.; Mohammad, M.; Ibrahim, A. A review on recent photovoltaic module cooling techniques: Types and assessment methods. Results Eng. 2024, 22, 102225. [Google Scholar] [CrossRef]
  23. Coşgun, A.E.; Endiz, M.S.; Demir, H.; Özcan, M. Agrivoltaic systems for sustainable energy and agriculture integration in Turkey. Heliyon 2024, 10, e32300. [Google Scholar] [CrossRef]
  24. Coşgun, A.E. The potential of Agrivoltaic systems in TURKEY. Energy Rep. 2021, 7, 105–111. [Google Scholar] [CrossRef]
  25. Zhang, Z.; Zhang, F.; Zhang, W.; Li, M.; Liu, W.; Ali Abaker Omer, A.; Zheng, J.; Zhang, X.; Liu, W. Spectral-splitting concentrator agrivoltaics for higher hybrid solar energy conversion efficiency. Energy Convers. Manag. 2023, 276, 116567. [Google Scholar] [CrossRef]
  26. Campana, P.E.; Stridh, B.; Hörndahl, T.; Svensson, S.-E.; Zainali, S.; Lu, S.M.; Zidane, T.E.K.; De Luca, P.; Amaducci, S.; Colauzzi, M. Experimental results, integrated model validation, and economic aspects of agrivoltaic systems at northern latitudes. J. Clean. Prod. 2024, 437, 140235. [Google Scholar] [CrossRef]
  27. Pande, P.C.; Singh, A.K.; Ansari, S.; Vyas, S.K.; Dave, B.K. Design development and testing of a solar PV pump based drip system for orchards. Renew. Energy 2003, 28, 385–396. [Google Scholar] [CrossRef]
  28. Hsu, H.-W.; Yang, C.-C. Assessing land resource planning for agrivoltaics development: Examining synergies approaches between government and farmers. Energy 2024, 298, 131363. [Google Scholar] [CrossRef]
  29. La Notte, L.; Giordano, L.; Calabrò, E.; Bedini, R.; Colla, G.; Puglisi, G.; Reale, A. Hybrid and organic photovoltaics for greenhouse applications. Appl. Energy 2020, 278, 115582. [Google Scholar] [CrossRef]
  30. Wang, L.; Mao, Y.; Li, Z.; Yi, X.; Ma, Y.; Zhang, Y.; Li, M. Life cycle carbon emission intensity assessment for photovoltaic greenhouses: A case study of Beijing City, China. Renew. Energy 2024, 230, 120775. [Google Scholar] [CrossRef]
  31. Kumar, M.; Haillot, D.; Gibout, S. Survey and evaluation of solar technologies for agricultural greenhouse application. Sol. Energy 2022, 232, 18–34. [Google Scholar] [CrossRef]
  32. Jiang, W.; Jin, Y.; Liu, G.; Ju, Z.; Arıcı, M.; Li, D.; Guo, W. Net-zero energy optimization of solar greenhouses in severe cold climate using passive insulation and photovoltaic. J. Clean. Prod. 2023, 402, 136770. [Google Scholar] [CrossRef]
  33. Jin, Y.; Jiang, W.; Han, Y.; Nan, S.; Liu, G.; Guo, W.; Zhang, K.; Li, Q.; Li, D. Comprehensive optimization of shading and electrical performance of roof-mounted photovoltaic system of Venlo-type greenhouse in the severe cold region. Energy 2024, 296, 131125. [Google Scholar] [CrossRef]
  34. Yano, A.; Furue, A.; Kadowaki, M.; Tanaka, T.; Hiraki, E.; Miyamoto, M.; Ishizu, F.; Noda, S. Electrical energy generated by photovoltaic modules mounted inside the roof of a north–south oriented greenhouse. Biosyst. Eng. 2009, 103, 228–238. [Google Scholar] [CrossRef]
  35. Kadowaki, M.; Yano, A.; Ishizu, F.; Tanaka, T.; Noda, S. Effects of greenhouse photovoltaic array shading on Welsh onion growth. Biosyst. Eng. 2012, 111, 290–297. [Google Scholar] [CrossRef]
  36. Castellano, S. Photovoltaic greenhouses: Evaluation of shading effect and its influence on agricultural performances. J Agric. Eng. 2014, 45, 168. [Google Scholar] [CrossRef]
  37. Ezzaeri, K.; Fatnassi, H.; Wifaya, A.; Bazgaou, A.; Aharoune, A.; Poncet, C.; Bekkaoui, A.; Bouirden, L. Performance of photovoltaic canarian greenhouse: A comparison study between summer and winter seasons. Sol. Energy 2020, 198, 275–282. [Google Scholar] [CrossRef]
  38. Marucci, A.; Zambon, I.; Colantoni, A.; Monarca, D. A combination of agricultural and energy purposes: Evaluation of a prototype of photovoltaic greenhouse tunnel. Renew. Sustain. Energy Rev. 2018, 82, 1178–1186. [Google Scholar] [CrossRef]
  39. Peng, Y.; Ma, X.; Wang, Y.; Li, M.; Gao, F.; Zhou, K.; Aemixay, V. Energy performance assessment of photovoltaic greenhouses in summer based on coupled optical-electrical-thermal models and plant growth requirements. Energy Convers. Manag. 2023, 287, 117086. [Google Scholar] [CrossRef]
  40. Chen, J.; Xu, F.; Ding, B.; Wu, N.; Shen, Z.; Zhang, L. Performance analysis of radiation and electricity yield in a photovoltaic panel integrated greenhouse using the radiation and thermal models. Comput. Electron. Agric. 2019, 164, 104904. [Google Scholar] [CrossRef]
  41. Aruta, G.; Ascione, F.; Bianco, N.; Mauro, G.M. Sustainability and energy communities: Assessing the potential of building energy retrofit and renewables to lead the local energy transition. Energy 2023, 282, 128377. [Google Scholar] [CrossRef]
  42. Bazarbayev, R.B.; Yakubov, K.R.; Kurbanov, D.S.; Allaniyazov, A.I.; Balakumar, S.; Kamalov, A.B.; Janabergenova, G.; Wei, Q.; Qian, H.; Polvonnazirov, I.; et al. Performance of crystalline Si solar cells and module on temperature and illumination intensity. Mater. Today Proc. 2022, 64, 1661–1665. [Google Scholar] [CrossRef]
  43. Wang, X. LED ring array light source design and uniform illumination properties analysis. Optik 2017, 140, 273–281. [Google Scholar] [CrossRef]
  44. Čurpek, J.; Čekon, M. Building performance simulation of a photovoltaic façade enhanced with latent heat storage: Model validation and power generation prediction. J. Energy Storage 2022, 56, 106143. [Google Scholar] [CrossRef]
  45. Al-Absi, Z.A.; Mohd Isa, M.H.; Ismail, M. Phase Change Materials (PCMs) and Their Optimum Position in Building Walls. Sustainability 2020, 12, 1294. [Google Scholar] [CrossRef]
  46. Uddin, M.M.; Ji, J.; Wang, C.; Zhang, C. Building energy conservation potentials of semi-transparent CdTe integrated photovoltaic window systems in Bangladesh context. Renew. Energy 2023, 207, 512–530. [Google Scholar] [CrossRef]
  47. Crawley, D.B.; Lawrie, L.K.; Winkelmann, F.C.; Buhl, W.F.; Huang, Y.J.; Pedersen, C.O.; Strand, R.K.; Liesen, R.J.; Fisher, D.E.; Witte, M.J.; et al. EnergyPlus: Creating a new-generation building energy simulation program. Energy Build. 2001, 33, 319–331. [Google Scholar] [CrossRef]
  48. Xia, Y.; Xu, T.; Shi, C.; Tian, L.; Zhang, T.; Fukuda, H. Research on indoor thermal comfort of traditional dwellings in Northeast Sichuan based on the thermal comfort evaluation model and EnergyPlus. Energy Rep. 2024, 12, 5234–5248. [Google Scholar] [CrossRef]
  49. Anđelković, A.S.; Mujan, I.; Dakić, S. Experimental validation of a EnergyPlus model: Application of a multi-storey naturally ventilated double skin façade. Energy Build. 2016, 118, 27–36. [Google Scholar] [CrossRef]
  50. Cameron, C.P.; Boyson, W.E.; Riley, D.M. Comparison of PV system performance-model predictions with measured PV system performance. In Proceedings of the 2008 33rd IEEE Photovolatic Specialists Conference, San Diego, CA, USA, 11–16 May 2018; IEEE: Piscataway, NJ, USA, 2008; pp. 1–6. [Google Scholar]
  51. Saber, E.M.; Lee, S.E.; Manthapuri, S.; Yi, W.; Deb, C. PV (photovoltaics) performance evaluation and simulation-based energy yield prediction for tropical buildings. Energy 2014, 71, 588–595. [Google Scholar] [CrossRef]
  52. Wang, C.; Deng, S.; Niu, J.; Long, E. A numerical study on optimizing the designs of applying PCMs to a disaster-relief prefabricated temporary-house (PTH) to improve its summer daytime indoor thermal environment. Energy 2019, 181, 239–249. [Google Scholar] [CrossRef]
  53. Zhong, P.; Yang, S.; Qiao, R.; Wang, T. Effect of light intensity on main quality of strawberry. Southwest China J. Agric. Sci 2011, 24, 1219–1221. [Google Scholar]
  54. Yong, G.; Tianlai, L.; Guangxue, H.; Hui, X. Effect of environment factors on the net photosynthesis rate of tomato leaf blade. Yournal Shenyang Agric. Univ. 1998, 29, 127–131. [Google Scholar]
Figure 1. Greenhouse model.
Energies 18 00135 g001
Figure 2. Different compact arrangements with the same coverage. (A) Two rows of compact arrangement facing south, (B) Two rows of compact arrangement facing north, (C) Two rows of compact arrangement positioned centrally.
Energies 18 00135 g002
Figure 3. Different checkerboard arrangements with the same coverage. (D) Two rows of checkerboard arrangement facing south, (E) Two rows of checkerboard arrangement facing north, (F) Two rows of checkerboard arrangement positioned centrally.
Energies 18 00135 g003
Figure 4. Changes in light intensity under different compact arrangements with the same coverage on 30 September, 7:00–17:00.
Energies 18 00135 g004
Figure 5. Changes in light intensity under different checkerboard arrangements with the same coverage on 30 September, 7:00–17:00.
Energies 18 00135 g005
Figure 6. Photovoltaic cell arrangement schemes.
Energies 18 00135 g006
Figure 7. Flow chart of photovoltaic cell arrangement optimization strategy.
Energies 18 00135 g007
Figure 8. Unit of area power generation of photovoltaic cells by different angles in various regions in summer.
Energies 18 00135 g008
Figure 9. Unit of area power generation of photovoltaic cells by different angles in various regions in winter.
Energies 18 00135 g009
Figure 10. Total power generation and unit of area power generation in summer, considering different photovoltaic cell arrangement schemes for the greenhouse covering. (a) Harbin, (b) Shenyang, (c) Nanjing, and (d) Guangzhou.
Energies 18 00135 g010
Figure 11. Total power generation and unit of area power generation in winter, considering different photovoltaic cell arrangement schemes for the greenhouse covering. (a) Harbin, (b) Shenyang, (c) Nanjing, and (d) Guangzhou.
Energies 18 00135 g011
Figure 12. Illumination distribution in summer, considering different photovoltaic cell arrangement schemes for the greenhouse covering. (a) Harbin, (b) Shenyang, (c) Nanjing, and (d) Guangzhou.
Energies 18 00135 g012
Figure 13. Illumination distribution in winter, considering different photovoltaic cell arrangement schemes for the greenhouse covering. (a) Harbin, (b) Shenyang, (c) Nanjing, and (d) Guangzhou.
Energies 18 00135 g013
Figure 14. Illumination uniformity in summer (Harbin; Shenyang; Nanjing; and Guangzhou), considering different photovoltaic cell arrangement schemes for the greenhouse covering.
Energies 18 00135 g014
Figure 15. Illumination uniformity in winter (Harbin; Shenyang; Nanjing; and Guangzhou), considering different photovoltaic cell arrangement scheme for the greenhouse covering.
Energies 18 00135 g015
Figure 16. Greenhouse indoor temperature in summer, considering different photovoltaic cell arrangement schemes for the greenhouse covering. (a) Harbin, (b) Shenyang, (c) Nanjing, and (d) Guangzhou.
Energies 18 00135 g016
Figure 17. Greenhouse indoor temperatures in winter, considering different photovoltaic cell arrangement schemes for the greenhouse covering. (a) Harbin, (b) Shenyang, (c) Nanjing, and (d) Guangzhou.
Energies 18 00135 g017
Table 1. Characteristics of the photovoltaic panels.
NameParameter
Dimensions (mm)1260 × 500 × 25
Module numberCR 30 per row
BR 15 per row
Module efficiency0.18
Thermal absorptance (emissivity)0.9
MaterialBitumen Felt
Solar absorptance0.87
Visible absorptance0.87
Inverter efficiency0.95
Inverter rated maximum continuous output power (W)14,000
Inverter nominal voltage (V)368
Inverter night tare loss power (W)200
Table 2. Comparison of the literature and simulated monthly power generation of photovoltaic cells with different angles (on the left side are simulation data, and on the right side are data from the literature, the photovoltaic cell area is 1 m2).
Month15°30°45°60°75°
Jan6.64 7.07 8.97 9.56 10.80 11.33 11.98 11.76 12.45 12.52 12.16 11.97
Feb7.93 8.40 9.72 10.20 11.01 11.30 11.68 11.54 11.69 11.46 11.04 10.55
Mar12.17 13.38 13.90 15.23 14.87 16.06 15.01 16.13 14.31 14.84 12.83 12.89
Apr14.98 16.27 16.04 17.16 16.24 16.95 15.58 16.68 14.11 13.82 11.91 11.09
May16.80 18.98 17.11 19.20 16.55 18.26 15.17 17.72 13.06 13.51 10.38 10.14
Jun17.37 18.84 17.30 18.64 16.45 17.47 14.84 16.84 12.58 12.68 9.85 9.48
Jul16.82 18.87 16.93 18.76 16.22 17.65 14.74 17.04 12.58 12.78 9.92 9.52
Aug14.95 16.77 15.65 17.35 15.53 16.82 14.62 16.45 12.97 13.14 10.71 10.20
Sep12.18 13.52 13.66 14.91 14.39 15.31 14.31 15.26 13.43 13.41 11.80 11.19
Oct10.21 11.12 12.23 13.17 13.59 14.31 14.18 14.51 13.96 13.97 12.95 12.59
Nov7.13 7.51 9.46 10.03 11.25 11.77 12.38 12.22 12.76 12.88 12.38 12.21
Dec6.13 6.31 8.57 8.84 10.53 10.72 11.87 11.23 12.49 12.21 12.34 11.83
Table 3. Illuminance analysis setting parameters.
NameParameter
Simulation typeGeneral
Detail template Good
Working plane height (m)0.5
Sky methodStandard sky
Sky modelCIE overcast day
Ambient bounces4
Ambient accuracy0.22
Ambient resolution512
Ambient divisions1024
Table 4. Photovoltaic cells arrangement schemes meeting minimum plant growth requirements.
CityCherry Tomatoes
in Summer
Cherry Tomatoes
in Winter
Strawberries
in Summer
Strawberries
in Winter
HarbinCR1-CR4, all BR(CR1, BR1-BR2)(CR1, BR1-BR2)None
ShenyangCR1-CR4, all BR(CR1, BR1-BR4)(CR1, BR1-BR4)None
NanjingCR1-CR5, all BR(CR1-CR3, BR1-BR8)(CR1-CR3, BR1-BR8)BR1
GuangzhouCR1-CR5, all BR(CR1-CR3, all BR)(CR1-CR4, all BR)(CR1-CR2, BR1-BR3)
Table 5. Cherry tomatoes: a comprehensive comparison of the arrangement of photovoltaic cells in summer.
CitySchemeTotal
Electricity Generation
(kWh)
Unit of Area Power
Generation (kWh/m2)
Illumination UniformityAverage Daily
Temperature
(°C)
Average Daily
Temperature Difference
(°C)
HarbinCR25634.79149.070.87113.8319.11
BR99798.95115.210.87113.817.78
ShenyangCR24851.9128.350.87117.5313.58
BR98386.7698.610.87617.4412.44
NanjingCR24231.16111.940.8620.55.5
BR97573.2989.040.85720.74.95
GuangzhouCR23574.994.570.87526.659.15
BR76597.8884.270.85326.68.22
Table 6. Strawberries: a comprehensive comparison of the arrangement of photovoltaic cells in summer.
CitySchemeTotal
Electricity Generation
(kWh)
Unit of Area Power Generation (kWh/m2)Illumination UniformityAverage Daily
Temperature
(°C)
Average Daily
Temperature Difference
(°C)
HarbinCR12834.56149.970.92914.4420.91
BR22817.4149.070.90314.3820.79
ShenyangCR12459.8130.150.92317.8115.39
BR44671.96123.60.89117.5814.03
NanjingCR24231.1111.940.8620.55.5
BR65798.7102.270.87120.625.22
GuangzhouCR23574.994.570.87526.659.15
BR76597.8884.270.85326.68.22
Table 7. Cherry tomatoes: a comprehensive comparison of the arrangement of photovoltaic cells in winter.
CitySchemeTotal
Electricity Generation
(kWh)
Unit of Area Power Generation (kWh/m2)Illumination UniformityAverage Daily
Temperature
(°C)
Average Daily
Temperature Difference
(°C)
HarbinCR12271.07120.160.89−6.195.43
BR22256.38119.380.86−6.225.43
ShenyangCR11820.3396.310.893.2710.96
BR21786.9794.550.873.2510.97
NanjingCR23340.488.370.869.0511.56
BR21670.288.370.99.2212.57
GuangzhouCR23231.6885.490.86317.2217.66
BR32407.1984.90.89417.6618.62
Table 8. Strawberries: a comprehensive comparison of the arrangement of photovoltaic cells in winter.
CitySchemeTotal
Electricity Generation
(kWh)
Unit of Area Power Generation (kWh/m2)Illumination UniformityAverage Daily
Temperature
(°C)
Average Daily
Temperature Difference
(°C)
HarbinNoneNoneNoneNoneNoneNone
NoneNoneNoneNone NoneNone
ShenyangNoneNoneNoneNoneNoneNone
NoneNoneNoneNone NoneNone
NanjingNoneNoneNoneNoneNoneNone
BR1839.888.870.9079.2813.08
GuangzhouCR23231.6885.490.86312.2217.66
BR32407.1984.90.89417.6618.62
Table 9. Optimal arrangement scheme of photovoltaic cells.
CityCherry Tomatoes
in Summer
Cherry Tomatoes
in Winter
Strawberries
in Summer
Strawberries
in Winter
HarbinBR9CR1CR1None
ShenyangBR9CR1BR4None
NanjingBR9CR2BR6BR1
GuangzhouBR7CR2BR7CR2
Disclaimer/Publisher’s Note: The statements, opinions and data contained in all publications are solely those of the individual author(s) and contributor(s) and not of MDPI and/or the editor(s). MDPI and/or the editor(s) disclaim responsibility for any injury to people or property resulting from any ideas, methods, instructions or products referred to in the content.

