Abstract
Energy production from coal combustion is responsible for nearly 40% of global CO2 emissions including SOx and NOx. This study aims to produce solid biomass fuels from oil-palm residues by torrefaction, having a high heating value (HHV) equivalent to fossil coals. The experiments were designed using Design Expert version 13 software to optimize the conditions affecting the fuel characteristics of the torrefied products. The statistical analysis suggested that the optimal conditions to achieve a high HHV and fixed carbon content while retaining the mass yield of biomass mainly depended on the temperature and torrefying time, while the size played a less important role in affecting the properties. The optimal conditions were observed to be at 283 °C (120 min) for EFBs, 301 °C (111 min) for PF, and 285 °C (120 min) for PKSs. The maximum HHV of 5229, 5969, and 5265 kcal/kg were achieved for the torrefied EFBs, PF, and PKSs, respectively. The energy efficiency of torrefied biomass was increased to 1.25–1.35. Ecoefficiency analysis suggested that torrefaction should be carried out at high temperatures with a short torrefying time. This low-cost bio-circular torrefied biomass showed promising fuel characteristics that could be potentially used as an alternative to coals.
1. Introduction
After the COVID-19 pandemic, global demand for coal, as a major source of cheap energy for industries, has been expected to rebound and drive an increase in global CO2 emissions [1]. According to reports, CO2 emissions from coal combustion increased by 1.6%, or 243 Mt, in 2022—a significant increase over the growth rate of the previous ten years—and hit a new record of over 15.5 Gt [2]. After rising by 5.4% and 1.9% in 2021 and 2022, respectively, global CO2 emissions grew by just 0.1% in 2023 to reach 35.8 Gt CO2. [3]. Due to the high energy demand, many countries, including Thailand, have relied on a mix of sources of fuel, including natural gas, coal, and petroleum oil, for electricity production to feed their growing economies. Coals are considered the primary choice for their good cost-effectiveness [4]. In Thailand, the nation’s substantial coal reserve of 2197 Mt is mostly in sub-bituminous and lignite classifications, distributed across regions [5]. Coal prices vary by region, mining method, and coal type. There are four main coal categories: lignite, sub-bituminous, bituminous, and anthracite, based on carbon content and heat energy. In 2022, average yearly sale prices per short ton of coal were approximately USD 80–USD 500 [6].
According to a study, emissions from coal combustion may decrease human lifespans by an average of 11 years [7]. These poisons include mercury, lead, cadmium, sulfur, and nitrate compounds which can impair brain function and pass through the nasal mucosa and into the lungs. Burning coal from power plants also poses a threat to public health. Additionally, it is the main source of CO2 emissions, a significant factor causing climate change. Nevertheless, the supply of fossil fuels, coal, natural gas, and nuclear power is currently decreasing. Thus, there has been a significant increase in renewable energy sources like wind, solar, biomass, and geothermal energy [8]. By using renewable non-fossil raw materials that are CO2-neutral in the production of energy, environmental goals can be met. Due to its potential to circulate CO2 in a closed-loop and renewable manner, biomass is a very viable raw material to be considered as one important source of renewable energy [9].
Palm oil, an essential worldwide product, is vital to Southeast Asia’s economy [10]. The world’s two biggest producers of palm oil are Malaysia and Indonesia [11]. However, Thailand ranks third in the world for producing palm oil. Of the vegetable oil consumed worldwide, palm oil supplies around 40% of the demand [12]. For this reason, the oil palm is regarded as one of the most significant crops for the production of vegetable oil. In the palm oil industry, fresh fruit bunches (FFBs) are transported to the crude palm oil (CPO) mill. In the process of extracting palm oil, various types of biomass wastes are generated, such as palm fibers (PFs), empty fruit bunches (EFBs), and palm kernel shells (PKSs). There are substantial amounts of EFBs from palm oil production, potentially leading to numerous pileups [13]. FFBs typically contain about 21% CPO, 22–23% EFBs, 13.5–15% PFs, and 5.5–7% PKSs [14]. A plentiful amount of solid biomass waste, consisting mainly of EFBs, PF, and PKSs, is generated after the palm oil extraction process. Approximately 1.8 t of solid biomass waste is produced for every ton of CPO extracted for a typical oil palm plant [15].
When compared to fossil fuel resources, raw biomass materials have some intrinsic disadvantages, such as low bulk density, high moisture content, hydrophilic character, and low calorific value (CV) [16]. One inferior characteristic is the high moisture content of raw biomass, which lowers processing efficiency and raises the price of fuel production. Biomass has a high moisture content leading to natural decay which causes the quality to deteriorate [17]. Torrefaction is one of the pretreatment procedures that have been suggested in the literature since it can improve biomass properties and increase its efficiency during thermal conversion [9]. As a thermal pretreatment method for improving the physical characteristics and chemical makeup of biomass for recycling, torrefaction is gaining popularity. Torrefaction is the process of gently heating biomass to a temperature in the range of 200–300 °C in an inert or oxygen-deficient environment. The raw biomass is transformed throughout the torrefaction process into a solid, homogenous product with a higher energy content and less moisture. Moisture and several volatile organic molecules evaporate from the biomass during torrefaction [18]. The main product is a solid substance known as torrefied biomass, biochar, or charcoal [19]. Wooden biomass loses moisture content during the torrefaction process, which takes place at temperatures of 200–300 °C, going from 30–60% to roughly 1–5%. The volatile matter content drops from 70–80% to roughly 55–65%. In addition, the amount of fixed carbon, which formerly ranged from 15 to 25%, now contains between 28 and 35% [20].
To produce torrefied biomass with improved calorific heating values, biomass residues such as PFs, EFBs, and PKSs were chosen as the feedstocks for the torrefaction process in this study. We thoroughly examined the variables that affected the fuel qualities of the torrefied samples, such as sample sizes, torrefying temperature and time, and biomass type. With the use of the Design Expert program, a methodical statistical and eco-efficiency analysis was conducted to determine the proper processing conditions for producing torrefied biomass products with the desired HHV, FC, and mass yield. To provide the best circumstances concerning energy and environmental considerations, energy efficiency and ecoefficiency were assessed.
2. Materials and Methods
2.1. Materials
PF, EFB, and PKS residues used in this study were obtained from Palm D Sri Nakhon, Ltd. Company, Hua Sai, Nakhon Si Thammarat, Thailand. The biomass was ground and sieved using the number 30 sieve with 0.5 mm aperture, number 20 sieve with 0.85 mm aperture, and number 18 sieve with 1.0 mm aperture according to ASTM E11 and the International ISO 565 scale [21]. The ground fibers that passed through were collected. This ground material was dried in a hot-air oven (Memmert, model UM-500; Schwabach, Germany) at 105 °C for 24 h, then kept in a desiccator (model RT-48C; Eureka Design Co., Ltd., Pathum Thani, Thailand) at room temperature (35 °C ± 3 °C) until used. The following chemicals for lignocellulosic content analysis were used: acetone (AR grade, 99.5% pure), sodium hydroxide (AR grade, 99% pure), and sulfuric acid (AR grade, 98% pure). All chemicals were purchased from RCI Labs (Bangkok, Thailand).
2.2. Preparation of High Energy-Density Biomass
For the torrefaction process, 100 g of dried biomass, as described above, was placed in the ceramic reactor with a closed lid. As illustrated in Figure 1, the reactor was placed in a furnace (model AAF11/3; Carbolite Gero Ltd., Parsons Lane, Hope, UK) in which the temperature was set to the desired processing torrefaction conditions (200, 250, 275, 300, and 350 °C). The torrefaction process underwent a constant processing temperature for a duration of studying torrefaction time (30, 75, and 120 min) and a heating rate (<40 °C/min). The samples were then removed from the oven and cooled to room temperature before being kept in a desiccator (model RT-48C; Eureka Design Co., Ltd., Pathum Thani, Thailand).
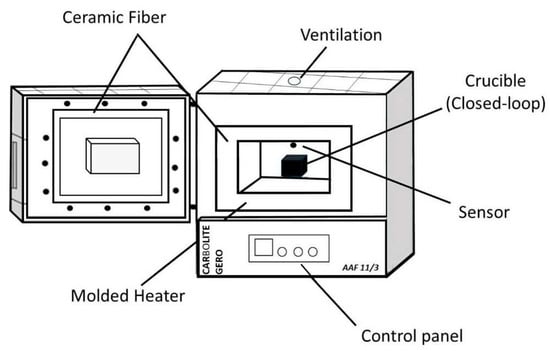
Figure 1.
Equipment set-up for the torrefaction process.
2.3. Characterization
2.3.1. Thermogravimetric Analysis (TGA)
TGA was used to investigate the thermal degradation of the lignocellulose components of the biomass samples. 10 g of EFB, PF, and PKS dried samples were examined in a TGA/GCMS. Weight loss as a function of temperature was recorded in a thermobalance (Perkin Elmer PYRIS 1 TGA, Watham, MA, USA) from 25 °C to 800 °C at 10 °C/min under a nitrogen atmosphere (20 mL/min).
2.3.2. Lignocellulose Analysis
Lignocellulose analysis is a crucial step in understanding the composition of the biomass, consisting of cellulose, lignin, and hemicellulose that collectively form the complex structure of lignocellulosic materials. 5 g of dried samples were put in 80 cm3 of acetone. The acetone extraction using a Soxhlet extractor (Foss SoxtecTM 2050, Hillerød, Denmark) was carried on at 90 °C for 1 h, followed by rinsing with the acetone for 30 min at room temperature. Consequently, the insoluble solids were collected and dried in a hot-air oven at 105 °C for 24 h, left to cool in a desiccator, and then weighed. The acetone-extractable contents E (%) of torrefied biomass were calculated using the following equation [22].
where W0 and W1 is the dry weight of torrefied biomass before and after extraction, respectively.
To calculate the hemicellulose content, 0.3 g of pre-extracted sample of torrefied biomass was put in a 15 cm3 test tube, then 3 cm3 of sodium hydroxide (0.5 mol dm−3) was added. The mixture was boiled at 80 °C for 3.5 h. The mixture was then cooled to room temperature and filtered (Whatman no. 1 filter paper) under vacuum. The solid residue was washed with distilled water until the pH of 7 of the wash was reached. The residue was then dried to a constant weight at 105 °C, cooled in a desiccator, and weighed. The hemicellulose content H (%) was determined as follows:
where W2 is the dry weight after the alkali treatment.
For lignin content calculation, 0.2 g of torrefied biomass was placed in a pre-weighed flask. Sulfuric acid (200 cm3, 720 g H2SO4 dm−3) was slowly poured into the flask at 30 °C for 1 h. Then, 56 cm3 of distilled water was added, and the mixture was autoclaved at 121 °C for 1 h. The resulting solution was filtered using Whatman papers and dried at 80 °C for 3 h. The acid-insoluble lignin content, L (%), of the sample was calculated as follows:
where W3 is the weight of the sample before treatment and W4 is the weight of the solids recovered after the above treatment.
Based on the acetone-extracted torrefied biomass, the cellulose content, C (%), was calculated from the previously obtained values as follows:
C (%) = 100 − H (%) − L (%)
2.3.3. Fourier Transform Infrared (FTIR) Analysis
FTIR spectra of the samples were analyzed to get a better understanding of the thermal process of the torrefaction that affects the chemical structure. For this, 1 g of dried sample was used to prepare a KBr disk for the test. The FTIR spectra of the samples were examined in an ATR-FTIR spectrometer (model Tensor 27; Bruker, Munich, Germany) under the wavelength range of 530–4000 cm−1.
2.3.4. Scanning Electron Microscopy (SEM)/EDX
An SEM (Model Merlin Compact, Carl Zeiss Co., Ltd., Bangkok, Thailand) was used to study the morphological structure, potentially conveying insights into how the torrefaction process influences the structural alterations of the biomass at varying temperatures. The images obtained from the SEM were analyzed with Micro Sun 2000/s image analysis software to gather data on the nanostructure of the torrefied biomass. The image analysis magnification was 10,000× at 5 kVs.
2.3.5. Production Yield Analysis
Energy yield reflects the energy conversion of the stored energy of the raw biomass to the retained energy of the sample after torrefaction. After torrefaction, mass loss occurs due to the thermal degradation process of the lignocellulose materials. As a result, energy-lean components are generated and left out from the biomass, while energy-high constituents remain within the material contributing to an increase in the energy density. Mass and energy yields and energy efficiency can be evaluated using Equations (5)–(7) [23].
where HHV is the high heating value of the sample
2.3.6. Proximate Analysis
The proximate analysis was performed to determine moisture (ASTM E871), volatile matter (ASTM E872), ash (ASTM E1755), and fixed carbon contents of the samples. The moisture content (%), mass loss (%), ash content (AC) (%), volatile matter (VM) (%), and fixed carbon (FC) content (%) were calculated from Equations (8)–(12).
Volatile Matter (VM) (%) = Mass loss (%) − Moisture content (%)
Fixed Carbon (FC) (%) = 100 − VM (%) − AC (%) – MC (%)
Note here that the percentage of moisture content was measured at 105 °C while the percentage of mass loss was analyzed at various torrefying temperatures and times.
2.3.7. High Heating Value (HHV)
HHV was analyzed using a calorimeter: Bomb Calorimeter (model LECO AC500). Benzoic acid was first used to calibrate the bomb calorimeter. Then 1 g of dried sample was placed in the apparatus. The test was undertaken under an O2 environment. The length of the ignition wire was measured. The solution was then titrated with sodium carbonate solution (10.45 g/500 mL DI water) having methyl orange as the indicator until the color of the mixture changed from pink to pale orange. The amount of the titrant and the length of the wire used were input into the Tesco AC500 program to obtain the measured calorific value of the sample.
2.4. Ecoefficiency Analysis
Ecoefficiency is a comprehensive metric for evaluating the performance of product, process, and service (PPS) systems that consider environmental effects, resource utilization, and economic development [24]. Because it complies with the ISO 14045 standard for Environmental Management’s Ecoefficiency assessment of product systems [25], it can be a helpful tool in promoting sustainable development [26]. Ecoefficiency is defined as the ratio of a product’s or service’s value to its environmental impacts, which includes aspects such as energy, material, and water consumption, as well as greenhouse gasses and carbon dioxide emissions. The ecoefficiency value can be utilized as a guide for a thorough analysis that considers environmental and economic factors, offering a holistic perspective on sustainability. The conceptual equation for calculating ecoefficiency is represented as Equation (13) [27].
The combination of sustainability and ecoefficiency ideas in this study required a modification of the ecoefficiency Equation (14). HHV was used to represent the PPS value in this context. The fixed operating costs were calculated using the cost of biomass and grinding biomass. The whole operational cost of the procedure for producing high energy density torrefied biomass, including chemical and electrical costs, was determined using the following equation:
where Ed is HHV, and Ec is the cost of high energy density torrefied biomass production.
2.5. Experimental Design
The design of experiments (DOE) method using the Design-Expert® program version 13 (Stat-Ease, Inc., Minneapolis, MN, USA) was performed to design the experimental runs by designating the range of affecting parameters. In this study, the range of three effecting parameters including torrefying temperature and time, and biomass size, as suggested by [28], were applied to the software. The responses of this study are triple parameters including the maximum HHV, % mass yield, and % FC. After running the Design Expert program, thirty runs of experiments were obtained for each type of biomass.
3. Results
3.1. Preparation of Torrefied Biomass
Torrefaction was conducted at the temperature range of 200 °C to 350 °C at a given duration time, and the physical appearance of the torrefied samples underwent noticeable changes. As seen in Figure 2, the original color of the raw material was in light shades, either brown, orange, or yellow. However, the material’s coloration changed to darker tones as the temperature of the torrefaction process increased. It went from light brown to deep brown to black in the end. Remarkably, leftover biomass from the processes of extracting palm oil showed a characteristic black color when it was torrefied at 350 °C, resembling fine coal. The color change was consistently noted in all types of materials that were examined.
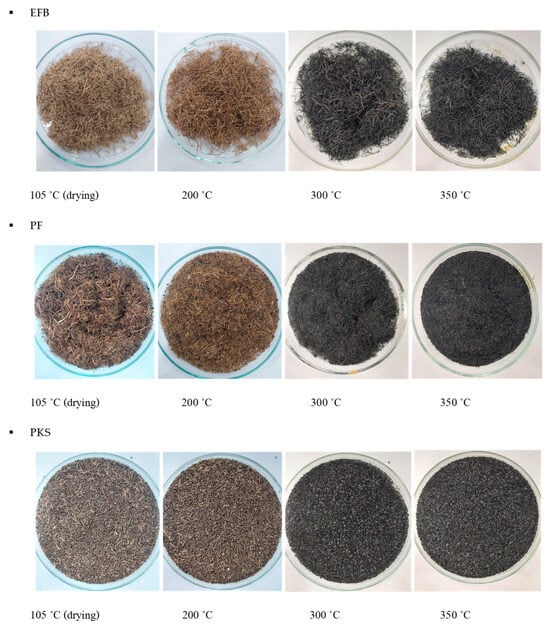
Figure 2.
The physical appearance in color changes of the torrefied samples at different temperatures.
3.2. Structure Analysis
3.2.1. Thermogravimetric Analysis (TGA)
TGA analysis was carried out to investigate the thermal decomposition of the biomass, in which the temperature was raised from room temperature to 700 °C at a heating rate of 10 °C/min under a N2 atmosphere. As depicted in Figure 3, the mass of EFBs, PF, and PKSs steadily decreased with the increasing temperature until it reached a certain temperature when a sharp reduction in sample mass was observed, indicating the decomposition temperature of the materials. The initial weight loss was caused by the elimination of moisture and volatile compounds. However, the major weight loss was mostly due to the devolatilization process and decomposition of hemicelluloses, cellulose, and lignin constituents [29]. The derivative mass loss (%) could reveal more details on the thermal degradation temperature of individual composing components [30]. From the results, two major decomposition temperatures could be determined at around the temperature of 277 °C and 363 °C for PFs, and 315 °C and 372 °C for EFBs. However, one broad single decomposition peak at around 380 °C was observed in the case of PKSs. Above the onset of the decomposition temperature, the thermal degradation of hemicellulose which contains mostly amorphous-like structures could take place at a certain rate at a given temperature. The decomposition caused by possible thermochemical reactions became more extensive with higher kinetics at higher temperatures. However, the thermal degradation of cellulose and lignin, having a higher degree of crystallinity, shows distinct decomposition temperatures depending on its corresponding type and crystalline structure. Typically, the thermal decompositions of hemicelluloses, cellulose, and lignin could take place under elevated temperatures in the range of 225–300 °C, 305–375 °C, and 250–500 °C, respectively [31]. At maximum torrefaction of 350 °C, devolatilization of hemicellulose was believed to occur at a high extent, giving by-products such as H2O, CO2, CO, and other trace amounts of organic compounds. On the other hand, the cellulose constituent decomposed more slowly at temperatures below 250 °C but became extensively decomposed under extreme torrefaction (290–300 °C) [32]. Raising the temperature greatly accelerated the rate of thermal degradation of hemicellulose and cellulose, but had less of an impact on lignin, whose degradation temperature is higher than 350 °C [29].
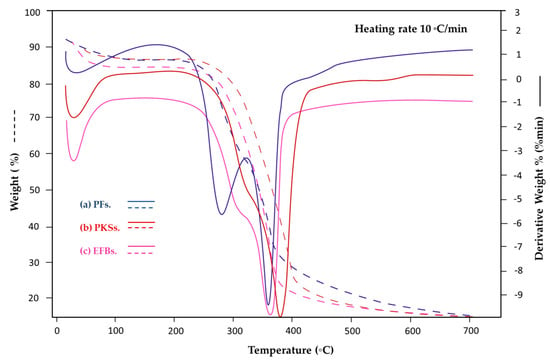
Figure 3.
TGA results of the (a) PF, (b) EFB, and (c) PKS samples.
3.2.2. Lignocellulose Content Analysis
The oil palm biomass is considered a lignocellulosic material composed of cellulose, hemicellulose, and lignin components in which their simplified chemical structures are illustrated in Figure 4. Cellulose is a long linear polymer made by the polymerization of β-glucose molecules, providing rigidity and strength to plant cells by forming parallel-aligned microfibers being held together by hydrogen bridges [30], while hemicellulose is a xylose-based crosslinked polymer that forms a complex network of bonds, intersecting with both cellulose and lignin [33]. On the other hand, lignin is a phenolic-based compound linked together to form rigid 3D networks, providing plants with strength and resistance to decay [34]. Thus, hemicellulose is considered less stable against thermal treatment than cellulose and lignin, respectively [35].

Figure 4.
Simplified chemical structure of (a) cellulose, (b) hemicellulose, and (c) lignin.
Figure 5 shows the results of lignocellulosic content analysis for the torrefied EFB, PF, and PKS samples. After torrefaction, the lignocellulose compositions of all torrefied samples were shifted, indicating that thermochemical reactions occurred to some extent. When compared to the untreated samples, the hemicellulose content of torrefied samples treated at 350 °C significantly decreased by approximately 75% for EFBs, 65% for PF, and 64% for PKSs, respectively. Similar trends were also observed in the cellulose compositions, although the decline in values was less pronounced. After being treated at 350 °C, the cellulose compositions decreased by about 32% for EFBs, 39% for PF, and 14% for PKSs. On the other hand, lignin compositions of all torrefied samples were observed to be increased by approximately 50–100%, possibly due to the formation of pseudo-lignin-like compounds [36]. Hemicellulose showed the highest percentage reduction compared to cellulose and lignin, indicating that the material was thermally degraded and transformed into other light hydrocarbon species at a higher conversion than the cellulose and lignin constituents. The amorphous cellulose degrades at a slower rate against hemicellulose decomposition due to a higher degree of polymerization [37]. The thermal degradation temperature of hemicelluloses is low because of the short chains between the bond and amorphous structure while the thermal cracking of cellulose is difficult due to its long chains and crystalline structure [38].
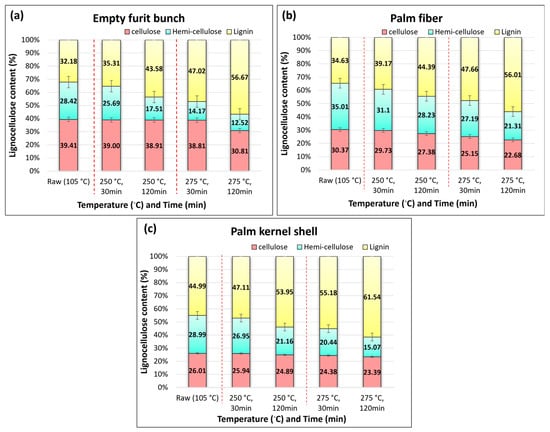
Figure 5.
Lignocellulose analysis results of samples: (a) EFB, (b) PF, and (c) PKS.
3.2.3. Fourier Transform Infrared Spectroscopy (FTIR) Analysis
Several studies suggest that torrefaction can significantly alter the physical and chemical properties of biomass, improving its characteristics for use as a fuel [18]. Following torrefaction, the biomass’s characteristics have changed significantly, mostly as a result of the physical removal of moisture and modifications to its chemical structure brought about by thermochemical breakdowns [23]. The FTIR analysis was performed to investigate those mentioned alterations. Figure 6 shows the FTIR spectra of the EFB, PF, and PKS samples before and after being torrefied at 350 °C for 120 min. When compared with the samples before treatment, the main unique FTIR spectra characteristics of the torrefied biomass, the indication of the chemical changes that occur during the torrefaction process, involved the reduction in hydroxyl groups. The FTIR spectra showed a reduction in the peaks corresponding to hydroxyl groups (e.g., O-H stretching at around 3200–3400 cm−1), indicating the removal of moisture and volatile compounds. The peak reduced drastically and disappeared with increasing torrefaction temperature due to partial dehydration and carbohydrate decomposition with the increasing severity of torrefaction conditions [39]. In addition, a decrease in hemicellulose content was observed from a notable decrease in the absorption bands associated with hemicellulose, which is consistent with lignocellulose analysis results showing the reduction in hemicellulose content after being torrefied. The band at around 1730 cm−1 in both precursors and torrefied biomass samples could be attributed to the carbonyl stretching (C=O) of acetyl, carboxylic acid, aldehyde, or ketone groups in hemicellulose [40]. The peak at around 1730 cm−1 was eliminated owing to the complete decomposition of the carbonyl groups in hemicellulose present in the torrefied biomass samples. This shows that the breaking down of long-chain polysaccharides and the breakdown of hemicellulose in the investigated samples resulted in a chemical change. [41]. Furthermore, cellulose decomposition was also taking place to some degree of extent in which the peaks associated with cellulose components weakened (1630–900 cm−1), particularly at high torrefying temperatures [42]. Finally, the lignin structure was also influenced by the torrefaction process. Modifications in the lignin structure were reflected by alterations in the aromatic skeletal vibrations and C-H deformation in the FTIR spectra. The ether and C–C linkages of lignin in the torrefied biomass which consists of higher energy than other bonding show an increase in heating value and energy density after torrefaction [43].
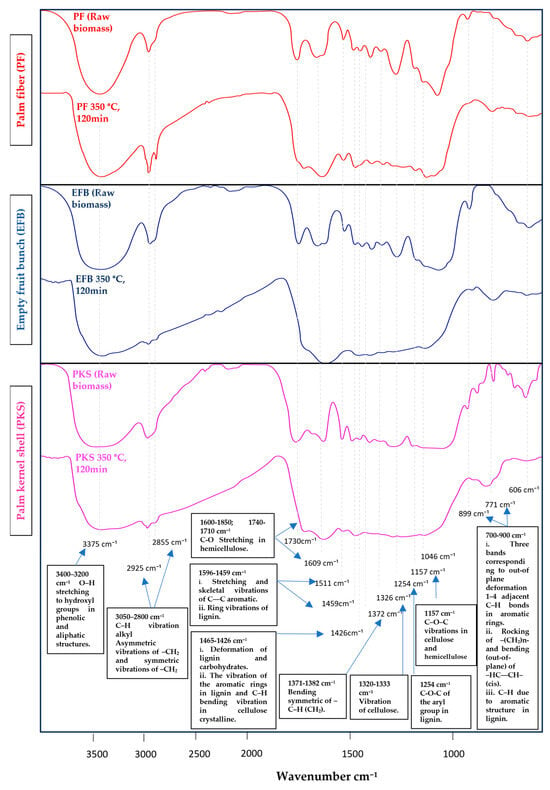
Figure 6.
FTIR transmittance spectra of the torrefied EFBs, PFs, and PKSs.
3.2.4. SEM and EDX Analysis
SEM results can reveal the surface morphology of the biomass, showing changes in texture and structure due to the torrefaction process. Figure 7 shows the SEM images of the biomass (EFBs, PF, and PKSs) before and after torrefaction at temperatures of 200–350 °C. After torrefaction, a certain degree of damage to the fractured surface consisting of connected cell walls in the tubular porous structure was observed. The pore size and volume of the pores noticeably increased due to the thermochemical degradation of lignocellulose components occurring during the torrefying process.
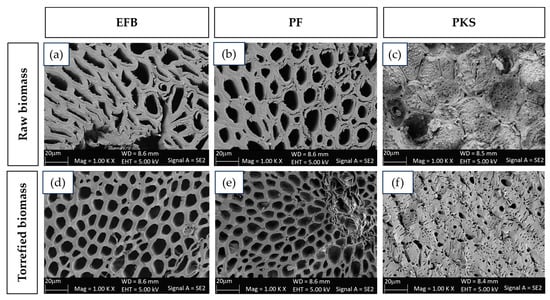
Figure 7.
SEM results of the samples: (a) EFBs, (b) PFs, and (c) PKSs before torrefaction, and (d) EFBs, (e) PFs, and (f) PKSs after torrefaction at 350 °C for 120 min.
Coupled with SEM, the elemental compositions of the samples were measured with energy-dispersive X-ray spectroscopy (EDX). The amount of carbon (C) and oxygen (O), which are the main components of the hydrocarbon lignocellulose, in terms of the atomic O/C ratio was investigated. Changes in the O/C composition ratio, as a result of in situ thermochemical reactions taking place in torrefaction, would directly affect the fuel properties of the biomass [44]. The preferred O/C ratios for the torrefied biomass for solid fuel applications should be in the range of 0.1–0.7, with comparable values of 0.38 to 0.91 for the fossil coal [23]. Figure 8 illustrates the effects of temperature and torrefying time on the atomic O/C ratio of the EFBs, PFs, and PKSs samples, compared to those of pristine materials. Torrefaction temperature greatly affected the degradation of the lignocellulosic biomass compounds into volatile compounds, as discussed earlier. The O/C ratios of the samples decreased by only about 6% for EFBs, 3% for PFs, and 6% for PKSs after being torrefied at 200 °C for 120 min. However, when the temperature was increased to 350 °C, the values significantly decreased by approximately 75% for EFBs, 65% for PFs, and 70% for PKSs, indicating drastic composition changes of the materials as the result of greater extent in the thermochemical degradation process. The torrefying time also influenced the degree of degradation conversion, resulting in the shifts in the O/C ratio toward the lower values with increasing time. At the same torrefying temperature (350 °C), the O/C ratio reduced by approximately 51% for EFBs, 42% for PFs, and 38% for PKSs when the duration was increased from 30 to 120 min.
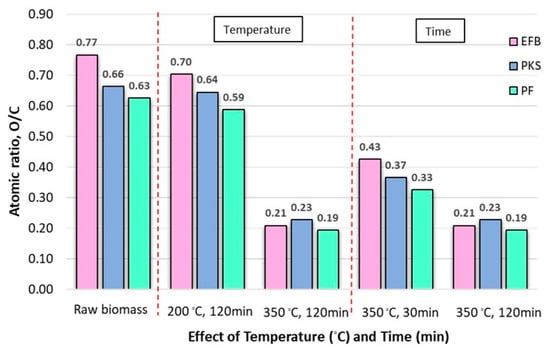
Figure 8.
Atomic O/C ratio of EFB, PF, and PKS torrefied samples.
3.3. Characterization Analysis
3.3.1. Production Yield Analysis
The production yield of the torrefied biomass can be measured in terms of the mass yield of the products, calculated from Equation (5). Figure 9 shows the effect of temperature on the mass yield (%) of the torrefied samples. During the ongoing torrefaction, the decomposition of lignocellulosic structures of the biomass due to in situ thermochemical reactions took place to some degree. Besides the torrefied biomass consisting primarily of high fixed carbon constituents, smaller hydrocarbon molecules (i.e., gaseous and liquid) were simultaneously generated as by-products, particularly at higher temperatures [45]. The decrease in mass after torrefaction is linked to the removal of moisture content and the thermal decomposition of hemicellulose, cellulose, and lignin [46]. The extent and type of component that decomposes thermally in biomass during torrefaction is dependent on the severity of torrefaction. These alterations in chemical structure and compositions of the biomass occurring during the torrefaction should also strongly affect the calorific heating values of the torrefied materials, reflecting the energy efficiency values defined in Equation (6). The energy efficiency of the torrefied biomass can be measured in terms of the overall restored HHV of the samples compared to those of the raw materials before being processed, as shown in Equation (7). Figure 9 also illustrates the energy efficiency values of the samples, prepared from various temperatures. The energy density in terms of the energy efficiency of the torrefied products increased with increasing torrefying temperature, while the mass yield decreased with increasing torrefying temperature. The results were in good agreement with the other study [47]. Thus, from an economic point of view, optimal temperatures should be taken into consideration for large-scale production to achieve not only the desired energy efficiency but also a high mass yield of the torrefied products.
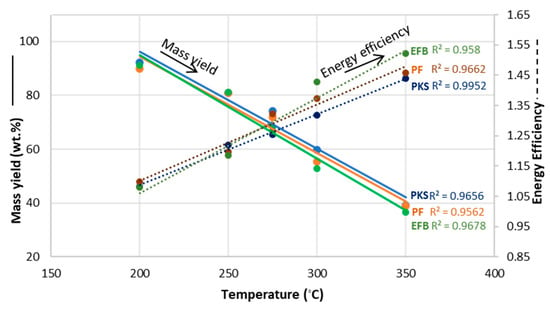
Figure 9.
The effect of temperature on mass yield (%) of the torrefied biomass.
3.3.2. Proximate Analysis
The ash content (AC) can be considered as a loss for the torrefaction process. The ash content of the torrefied biomass varies mostly depending on the types of biomass, and processing conditions (e.g., temperature and time) of the torrefaction process. As shown in Figure 10, the measured AC in the samples ranged from 1.01% to 17.13%, depending on the type of biomass and processing conditions. With the temperature of the torrefaction process rising, the AC was probably going to rise linearly as the amount of lignocellulose degradation brought on by thermochemical reactions happened [48]. From the results, the torrefied PKSs showed the lowest ash concentrations ranging from 1.01% at 105 °C to 13.58% at 350 °C, whereas the EFBs samples gave higher values of AC varying from 3.43% at 105 °C to 17.13% at 350 °C. Lignin is more stable against temperature changes than hemicellulose and cellulose constituents [35]. Thus, the torrefied EFBs exhibited the largest change in AC increase over the range of increasing temperature, particularly at higher temperatures (e.g., 350 °C), compared to the PFs and PKSs, respectively.
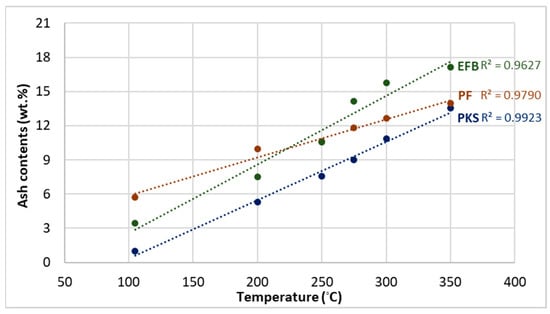
Figure 10.
Ash contents (%) in the raw and torrefied biomass.
Figure 11a depicts the effect of the temperature of the fixed carbon (% FC) content of the torrefied biomass in which the amount of FC increases with the temperature of the torrefaction process. The FC contents increase with the increasing temperature, caused by the reduction in the volatile matter (% VM) content together with the possible thermochemical changes in lignocellulose constituents, as discussed earlier [49]. As the torrefaction proceeded, the drying period was likely to take place at the beginning stage in which the free moisture was likely to diffuse out of the biomass sample. Simultaneously, the heat was transferred towards the inside of the matrix causing the rise in temperature inside the matrix. The volatile matter was then changed into a gaseous state depending on its volatility and was able to transport to the outer shells, resulting in a reduction in the VM content. The higher the torrefaction temperature, the lower the VM values of the torrefied samples that were observed, as seen in Figure 11b. The loss of volatile matter, primarily consisting of light hydrocarbons and small molecules with hydrogen and oxygen, was responsible for the increase in the fixed carbon content of the torrefied samples. At a given condition, most of the fixed carbons in the biomass remain while the volatile matter is removed [45]. As the temperature increased, the higher FC but lower VM content of the torrefied samples were obtained. High FC samples would exhibit high calorific values. On the other hand, solid fuels with high VM content would have good burning characteristics (e.g., ease of burning). Thus, the torrefaction should be carried out at the optimal temperature at which the torrefied product with high heating value and good VM content can be achieved.
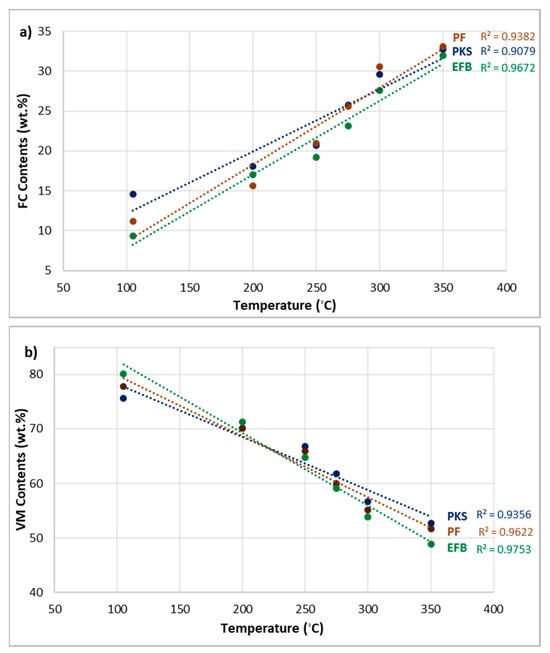
Figure 11.
Fixed carbon (% FC) (a) and volatile matter (% VM) (b) in the torrefied biomass.
3.3.3. High Heating Value (HHV) Analysis
Figure 12 shows the energy density in terms of the ratio of HHV of the torrefied biomass prepared at different conditions within the range of torrefaction temperature (200–350 °C) and HHV of raw biomass. The HHV of the biomass can be significantly improved because of dehydration and carbonization taking place in torrefaction, particularly at higher temperatures with long duration time [38]. Compared with dried biomass, the HHV of the torrefied EFBs increased from 3998 kcal/kg to 6086 kcal/kg after torrefaction at 350 °C. Similarly, the HHV increased from 4445 kcal/kg to 6483 kcal/kg for PFs, and from 4384 kcal/kg to 6283 kcal/kg for PKSs. In this study, the HHV of all torrefied samples prepared at a temperature above 300 °C surpassed the average HHV of fossil coals (4700–5500 kcal/kg) [50].
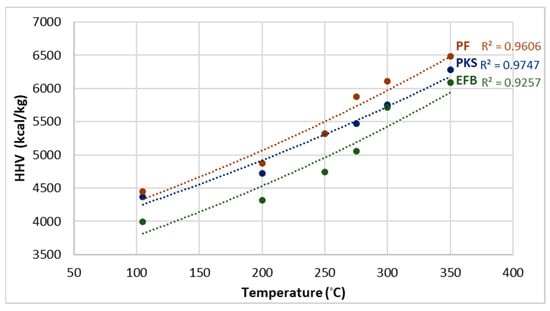
Figure 12.
The high heating value (HHV) of torrefied biomass.
3.4. Design Expert Program
3.4.1. Experimental Design and Statistical Analysis
Model statistics for HHV, % mass yield, and % FC of EFBs, PFs, and PKSs are listed in Table 1. The predicted R2 of HHV, % mass yield, and % FC of EFBs, PFs, and PKSs, were in reasonable agreement with the adjusted R2. This model can be used to navigate the design space.

Table 1.
Experimental design and results for respond surface methodology (RSM) for the torrefaction process.
Table 1 presents the design matrix and the corresponding results of RSM experiments conducted to determine the effects of three independent variables: torrefying temperature (°C), torrefying time (min), and biomass size (mm). By performing multiple regression analysis on the experimental data, the predicted linear and 2FI equation response of HHV, % mass yield, and % FC can be expressed using Equations (15)–(23) in terms of coded values:
HHVEFB = 7218.90 − 13.65A − 4.63B − 5543.61C + 0.041AB + 0.031AC − 0.056BC + 0.041A2 − 0.009B2 + 3447.18C2
HHVPF = 3878.32 + 4.89A + 1.15B –2161.19C + 0.029AB − 0.034AC –0.139BC + 0.007A2 − 0.018B2 + 1339.40C2
HHVPKS = 2322.61 + 12.996A + 1.87B − 1109.33C + 0.02AB -0.553AC + 0.50BC -0.007A2 − 0.017B2 + 717.90C2
%Mass yieldEFB = −45.22 + 0.81A + 0.19B + 151.35C − 0.002AB + 0.019AC + 0.048BC − 0.002A2 + 0.0006B2 − 97.16C2
%Mass yieldPF = −19.01 + 0.743A + 0.222B + 116.02C − 0.002AB + 0.08AC + 0.015BC − 0.0019A2 + 0.0004B2 − 84.12C2
%Mass yieldPKS = −42.44 + 1.07A + 0.22B + 72.23C − 0.002AB + 0.018AC − 0.0044BC − 0.002A2 + 0.0008B2 − 46.49C2
%FCEFB = 39.91 − 0.165A − 0.051B − 20.73C + 0.0006AB − 0.0024AC − 0.0001BC + 0.0004A2 − 0.0004B2 + 13.03C2
%FCPF = 3.81 − 0.052A + 0.10B + 10.76C + 0.0003AB − 0.0237AC − 0.0375BC + 0.0003A2 − 0.0006B2 − 1.94C2
%FCPKS = 20.65 − 0.079A − 0.024B − 2.99C + 0.0004AB + 0.0007AC − 0.0118BC + 0.0003A2 − 0.0002B2 + 1.96C2
The suggested model’s dependability was confirmed by a comparison of the experimental with the outcomes of the mathematical model data. An analysis of the experimental results and the data from the mathematical model validates the reliability of the proposed model. Figure 13 unequivocally shows that the outcomes of the mathematical model and the experimental data coincide extremely well. As a result, the suggested models are regarded as appropriate.
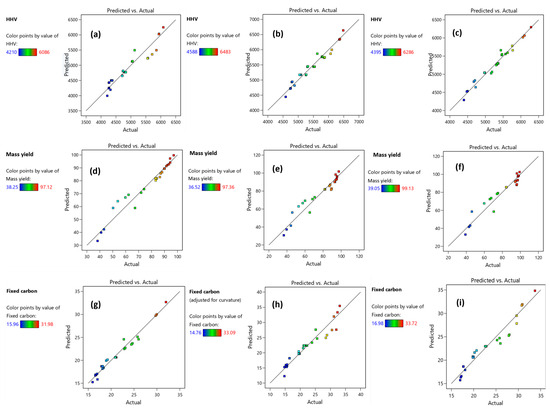
Figure 13.
The relationship between experimental values (actual) and predicted values (predicted) of HHV (a–c), % mass yield (d–f), and % FC (g–i) for EFBs, PFs, and PKSs, respectively.
This study clarified the effects of temperature, length of torrefaction, and biomass size on the properties of torrefied biomass, including HHV, mass yield, and % FC. Three-dimensional RSM plots and contour plots showing the simultaneous effects of several factors on all triple-respondents are shown in Figure 14.
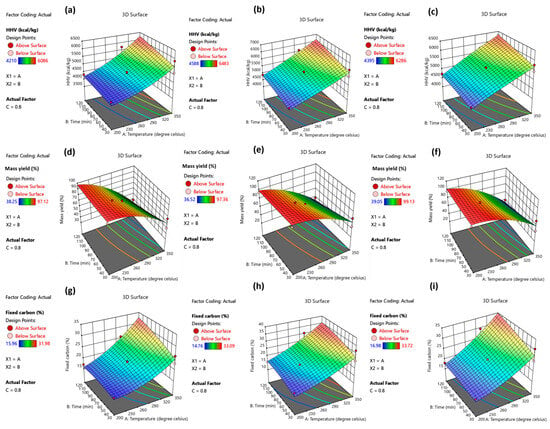
Figure 14.
3D response surface methodology (RSM) plots and contour plots displaying the impact of the different factors HHV (a–c), % mass yield (d–f), and % FC (g–i) on the EFBs, PFs, and PKSs, respectively, during the torrefaction process.
To evaluate the relationship and suitability of the mathematical model, an analysis of variance (ANOVA) was performed on the model equations, lack of fit values, determination of the coefficient of determination (R2), and adjusted R2 values. Table 2, Table 3 and Table 4 summarize the results of the ANOVA analysis for EFBs, PF, and PKSs, respectively.

Table 2.
Analysis of variance (ANOVA) for HHV, % FC, and % mass yield of EFB.

Table 3.
Analysis of variance (ANOVA) for HHV, % FC, and % mass yield of PF.

Table 4.
Analysis of variance (ANOVA) for HHV, % FC, and % mass yield of PKS.
3.4.2. Optimal Conditions
The investigation into optimal conditions for producing torrefied biomass was conducted by utilizing the response optimizer function within the statistical package. The optimal condition was determined based on the maximization of the HHV, % mass yield, and % FC, simultaneously. The results indicate that the optimal conditions for producing high-quality torrefied biomass from EFBs were achieved at 282.48 °C, 120 min torrefying time, and biomass size of 1 mm. At these conditions, the desirable high values of HHV, % mass yield, and % FC (5228.96 kcal/kg, 70.26%, and 23.35%, respectively) were achieved, as seen in Figure 15a, while the most suitable condition for producing torrefied biomass from PF was at 301.53 °C, 111.67 min, and 0.79 mm biomass, resulting in 5968.77 kcal/kg, 63.52%, and 27.58% of HHV, % mass yield, and % FC, respectively (Figure 15b). For PKSs, the optimal condition was at 285.22 °C, 120 min, and biomass size of 0.77 mm, yielding HHV, % mass yield, and % FC of 5625 kcal/kg, 75.62%, and 25.89%, respectively (Figure 15c).
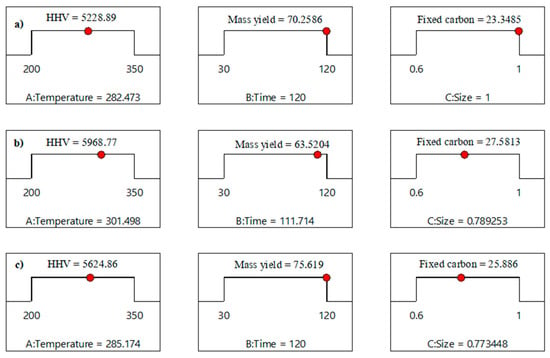
Figure 15.
Desirability ramps of optimal conditions for (a) EFBs, (b) PF, and (c) PKSs.
3.4.3. Confirmation of Conditional Optimizations
To validate the model equations for predicting triple response values, experiments were performed on the suitable torrefaction process. The accuracy of the CCD-derived model in predicting HHV, % FC, and % mass yield was validated by the correlation between the predicted and experimental values. To verify the models as indicated in Table 5, six experiments were conducted for four levels of torrefying conditions (higher, center, lower, and ideal from the predictive model). The reliability of the model was validated by the ratio between the predicted values and the actual experimental values. The ratios ranged from 0.9 to 1.0 indicating that they were well within the acceptable deviation threshold (less than 10%).

Table 5.
Verification of predicted values and repeated experimental values of torrefying conditions for EFBs, PF, and PKSs, respectively.
3.5. Ecoefficiency Analysis
Figure 16 shows the relationship between the ecoefficiency of torrefied biomass and torrefied conditions. Ecoefficiency values and temperature exhibit a direct variation relationship, while eco-efficiency and time have a reverse variation relationship. It was discovered that time and temperature are important model factors, but size has no bearing on the ecoefficiency value. Since ecoefficiency was calculated using fixed and operating costs, the ecoefficiency decreased with the length of the torrefied period. Figure 17 illustrates the effect of torrefying time on HHV and ecoefficiency altogether. Based on the data, it was concluded that 75 min was the ideal length for the torrefaction to obtain significantly high HHV and ecoefficiency values. With a fixed torrefying period of 75 min, it was found that the temperature of 350 °C provided the maximum HHV and ecoefficiency for all three types of biomass, as depicted in Figure 18. Though the optimum conditions suggested from the DE optimization for EFBs, PF, and PKSs (280 °C, 120 min, size 1.0 mm for EFBs, 300 °C, 111 min, size 0.79 mm for PF, and 285 °C, time 121 min, size 0.77 mm for PKSs) were different from that of the ecoefficiency analysis, (350 °C and 75 min), the optimal conditions from both analyses were in agreeable ranges yielding the desirable HHV, % FC, % mass yield, and ecoefficiency.

Figure 16.
Effect of temperature, time, and size on ecoefficiency values of the torrefied biomass; (a) EFBs, (b) PFs, and (c) PKSs.

Figure 17.
Effect of time on ecoefficiency and HHV values of the torrefied biomass; (a) EFBs, (b) PFs, and (c) PKSs.

Figure 18.
Effect of temperature on the ecoefficiency and HHV values of the torrefied biomass at a fixed torrefying time of 75 min; (a) EFBs, (b) PFs, and (c) PKSs.
4. Conclusions
In bioenergy applications, the torrefied oil palm biomass (EFBs, PF, and PKSs) has demonstrated enhanced qualities that may make it a viable solid fuel alternative to coal. After torrefaction, HHV and the energy efficiency values of the biomass considerably increased; however, mass loss inevitably occurred due to thermochemical conversions of its lignocellulose components. The results show that temperature has the highest impact on the desired high HHV and energy efficiency of the torrefied oil palm biomass, followed by the residence time, and particle size, respectively. The three-parameter optimization suggested that temperatures in the range of 282–300 °C with a torrefying time of about 110–120 min were optimal for the torrefaction of EFBs, PFs, and PKSs. At optimal conditions, enhanced torrefied products with high HHV (5220–5970 kcal/kg), high energy efficiency (1.25–1.35), and acceptable mass yield (63–75%) could be achieved. To reduce the necessary energy expenses for heating while keeping the desired high HHV and energy density of the products, the ecoefficiency analysis recommended that the torrefaction process be carried out for a shorter time (e.g., 75 min). In summary, the properties of torrefied oil palm biomass have demonstrated remarkable promise and are comparable to or superior to those of fossil coal. The design and operation for the scale-up production, which might yield the improved qualities of the torrefied biomass at reasonable costs, may benefit from the optimal operating conditions resulting from this study.
Author Contributions
A.K. and W.D.: conceptualized and supervised the study, designed methodology and validated the experiments, analyzed and interpreted the results, wrote, reviewed, and edited the manuscript; J.K.: performed the experiments, analyzed and visualized the experimental results, prepared the original draft, wrote the manuscript; N.S.: coordinated with the industrial partners, wrote and reviewed the manuscript. All authors have read and agreed to the published version of the manuscript.
Funding
This research was funded by The Ph.D. Excellence Scholarship, Walailak University, Contract No. 18/2022.
Data Availability Statement
The data and code supporting the results presented in this paper, as well as additional findings from this study, are accessible from the corresponding author upon reasonable request.
Acknowledgments
The authors would like to thank the Biomass and Oil Palm Center of Excellence (BoP-CoE), Walailak University, for facilitating laboratory support. We gratefully thank Palm-D-Sri Nakhon, Ltd. company for providing biomass raw materials for this study.
Conflicts of Interest
The authors declare no conflicts of interest.
References
- Zhang, F.; Lu, J.; Chen, L. When green recovery fails to consider coal pushback: Exploring global coal rebounds, production, and policy retrenchment post COVID-19. Energy Res. Soc. Sci. 2023, 101, 103142. [Google Scholar] [CrossRef]
- Mišík, M.; Nosko, A. Post-pandemic lessons for EU energy and climate policy after the Russian invasion of Ukraine: Introduction to a special issue on EU green recovery in the post-COVID-19 period. Energy Policy 2023, 177, 113546. [Google Scholar] [CrossRef]
- Liu, Z.; Deng, Z.; Davis, S.J.; Ciais, P. Global carbon emissions in 2023. Nat. Rev. Earth Environ. 2024, 5, 253–254. [Google Scholar] [CrossRef]
- Pattanapongchai, A.; Limmeechokchai, B. CO2 mitigation model of future power plants with integrated carbon capture and storage in Thailand. Int. J. Sustain. Energy 2011, 30, S155–S174. [Google Scholar] [CrossRef]
- Chen, X.; Mauzerall, D.L. The Expanding Coal Power Fleet in Southeast Asia: Implications for Future CO2 Emissions and Electricity Generation. Earth’s Futur. 2021, 9, e2021EF002257. [Google Scholar] [CrossRef]
- Simshauser, P. Fuel Poverty and the 2022 Energy Crisis. Aust. Econ. Rev. 2022, 55, 503–514. [Google Scholar] [CrossRef]
- Mao, Z.; Zhang, L.; Zhu, X.; Zheng, C. Experimental Study of Coal MILD Combustion at a Pilot-Scale Furnace. In Clean Coal Technology and Sustainable Development; Springer: Singapore, 2016; pp. 173–181. [Google Scholar] [CrossRef]
- Gasparotto, J.; Martinello, K.D.B. Coal as an energy source and its impacts on human health. Energy Geosci. 2020, 2, 113–120. [Google Scholar] [CrossRef]
- Cahyanti, M.N.; Doddapaneni, T.R.K.C.; Kikas, T. Biomass torrefaction: An overview on process parameters, economic and environmental aspects and recent advancements. Bioresour. Technol. 2020, 301, 122737. [Google Scholar] [CrossRef]
- Maluin, F.N.; Hussein, M.Z.; Idris, A.S. An Overview of the Oil Palm Industry: Challenges and Some Emerging Opportunities for Nanotechnology Development. Agronomy 2020, 10, 356. [Google Scholar] [CrossRef]
- Mukherjee, I.; Sovacool, B.K. Palm oil-based biofuels and sustainability in southeast Asia: A review of Indonesia, Malaysia, and Thailand. Renew. Sustain. Energy Rev. 2014, 37, 1–12. [Google Scholar] [CrossRef]
- Nupueng, S.; Oosterveer, P.; Mol, A.P.J. Governing sustainability in the Thai palm oil-supply chain: The role of private actors. Sustain. Sci. Pr. Policy 2022, 18, 37–54. [Google Scholar] [CrossRef]
- E Anyaoha, K.; Sakrabani, R.; Patchigolla, K.; Mouazen, A.M. Evaluating oil palm fresh fruit bunch processing in Nigeria. Waste Manag. Res. J. Sustain. Circ. Econ. 2018, 36, 236–246. [Google Scholar] [CrossRef] [PubMed]
- Poh, P.E.; Wu, T.Y.; Lam, W.H.; Poon, W.C.; Lim, C.S. Waste Management in the Palm Oil Industry; Springer International Publishing: Cham, Switzerland, 2020. [Google Scholar] [CrossRef]
- Supriatna, J.; Setiawati, M.R.; Sudirja, R.; Suherman, C.; Bonneau, X. Composting for a More Sustainable Palm Oil Waste Management: A Systematic Literature Review. Sci. World J. 2022, 2022, 5073059. [Google Scholar] [CrossRef] [PubMed]
- Nunes, L.; Matias, J.; Catalão, J. A review on torrefied biomass pellets as a sustainable alternative to coal in power generation. Renew. Sustain. Energy Rev. 2014, 40, 153–160. [Google Scholar] [CrossRef]
- Williams, C.L.; Emerson, R.M.; Tumuluru, J.S. Biomass Compositional Analysis for Conversion to Renewable Fuels and Chem-icals. In Biomass Volume Estimation and Valorization for Energy; InTech: Houston, TX, USA, 2017. [Google Scholar] [CrossRef]
- Tumuluru, J.S.; Ghiasi, B.; Soelberg, N.R.; Sokhansanj, S. Biomass Torrefaction Process, Product Properties, Reactor Types, and Moving Bed Reactor Design Concepts. Front. Energy Res. 2021, 9, 728140. [Google Scholar] [CrossRef]
- Kota, K.B.; Shenbagaraj, S.; Sharma, P.K.; Sharma, A.K.; Ghodke, P.K.; Chen, W.-H. Biomass torrefaction: An overview of process and technology assessment based on global readiness level. Fuel 2022, 324, 124663. [Google Scholar] [CrossRef]
- Thengane, S.K.; Kung, K.S.; Gomez-Barea, A.; Ghoniem, A.F. Advances in biomass torrefaction: Parameters, models, reactors, applications, deployment, and market. Prog. Energy Combust. Sci. 2022, 93, 101040. [Google Scholar] [CrossRef]
- ISO 565:1990; Test Sieves. International Organization for Standardization: Geneva, Switzerland, 1990. Available online: https://www.iso.org/obp/ui/#iso:std:iso:565:ed-3:v1:en (accessed on 20 April 2024).
- Li, S.; Xu, S.; Liu, S.; Yang, C.; Lu, Q. Fast pyrolysis of biomass in free-fall reactor for hydrogen-rich gas. Fuel Process. Technol. 2004, 85, 1201–1211. [Google Scholar] [CrossRef]
- Niu, Y.; Lv, Y.; Lei, Y.; Liu, S.; Liang, Y.; Wang, D.; Hui, S. Biomass torrefaction: Properties, applications, challenges, and economy. Renew. Sustain. Energy Rev. 2019, 115, 109395. [Google Scholar] [CrossRef]
- Liu, K.; Catchmark, J.M. Bacterial cellulose/hyaluronic acid nanocomposites production through co-culturing Gluconacetobacter hansenii and Lactococcus lactis under different initial pH values of fermentation media. Cellulose 2020, 27, 2529–2540. [Google Scholar] [CrossRef]
- ISO 14045:2012; Environmental Management. International Organization for Standardization: Geneva, Switzerland, 2012. Available online: https://www.iso.org/obp/ui/#iso:std:iso:14045:ed-1:v2:en (accessed on 20 April 2024).
- Changwichan, K.; Silalertruksa, T.; Gheewala, S.H. Eco-Efficiency Assessment of Bioplastics Production Systems and End-of-Life Options. Sustainability 2018, 10, 952. [Google Scholar] [CrossRef]
- Heilala, J.; Ruusu, R.; Montonen, J.; Vatanen, S.; Kavka, C.; Asnicar, F.; Scholze, S.; Armiojo, A.; Insunza, M. Eco-process Engineering System for Collaborative Product Process System Optimisation. In Proceedings of the IFIP International Conference on Advances in Production Management Systems, Ajaccio, France, 20–24 September 2014; pp. 634–641. [Google Scholar] [CrossRef]
- Yu, K.L.; Lau, B.F.; Show, P.L.; Ong, H.C.; Ling, T.C.; Chen, W.-H.; Ng, E.P.; Chang, J.-S. Recent developments on algal biochar production and characterization. Bioresour. Technol. 2017, 246, 2–11. [Google Scholar] [CrossRef] [PubMed]
- Chen, W.-H.; Kuo, P.-C. Isothermal torrefaction kinetics of hemicellulose, cellulose, lignin and xylan using thermogravimetric analysis. Energy 2011, 36, 6451–6460. [Google Scholar] [CrossRef]
- Zhang, S.; Li, R.; Zhang, Y.; Zhao, M. The effect of solvents on the thermal degradation products of two Amadori derivatives. RSC Adv. 2020, 10, 9309–9317. [Google Scholar] [CrossRef]
- Werner, K.; Pommer, L.; Broström, M. Thermal decomposition of hemicelluloses. J. Anal. Appl. Pyrolysis 2014, 110, 130–137. [Google Scholar] [CrossRef]
- Patai, S.; Halpern, Y. Pyrolytic Reaction of Carbohydrates. Part IX the Effect of Additives on the Thermal Behavior of Cellulose Samples of Different Crystallinity. Isr. J. Chem. 1970, 8, 655–662. [Google Scholar] [CrossRef]
- Rao, J.; Lv, Z.; Chen, G.; Peng, F. Hemicellulose: Structure, chemical modification, and application. Prog. Polym. Sci. 2023, 140, 101675. [Google Scholar] [CrossRef]
- Gellerstedt, G.; Henriksson, G. Lignins: Major Sources, Structure and Properties. In Monomers, Polymers and Composites from Renewable Resources; Elsevier: Amsterdam, The Netherlands, 2008; pp. 201–224. [Google Scholar] [CrossRef]
- Senneca, O.; Cerciello, F.; Russo, C.; Wütscher, A.; Muhler, M.; Apicella, B. Thermal treatment of lignin, cellulose and hemicellulose in nitrogen and carbon dioxide. Fuel 2020, 271, 117656. [Google Scholar] [CrossRef]
- Sarker, T.R.; Nanda, S.; Dalai, A.K.; Meda, V. A Review of Torrefaction Technology for Upgrading Lignocellulosic Biomass to Solid Biofuels. BioEnergy Res. 2021, 14, 645–669. [Google Scholar] [CrossRef]
- Ong, H.C.; Yu, K.L.; Chen, W.-H.; Pillejera, M.K.; Bi, X.; Tran, K.-Q.; Pétrissans, A.; Pétrissans, M. Variation of lignocellulosic biomass structure from torrefaction: A critical review. Renew. Sustain. Energy Rev. 2021, 152, 111698. [Google Scholar] [CrossRef]
- Tumuluru, J.S. Effect of Deep Drying and Torrefaction Temperature on Proximate, Ultimate Composition, and Heating Value of 2-mm Lodgepole Pine (Pinus contorta) Grind. Bioengineering 2016, 3, 16. [Google Scholar] [CrossRef] [PubMed]
- Azargohar, R.; Nanda, S.; Kang, K.; Bond, T.; Karunakaran, C.; Dalai, A.K.; Kozinski, J.A. Effects of bio-additives on the physicochemical properties and mechanical behavior of canola hull fuel pellets. Renew. Energy 2018, 132, 296–307. [Google Scholar] [CrossRef]
- Chen, Y.-C.; Chen, W.-H.; Lin, B.-J.; Chang, J.-S.; Ong, H.C. Impact of torrefaction on the composition, structure and reactivity of a microalga residue. Appl. Energy 2016, 181, 110–119. [Google Scholar] [CrossRef]
- Okolie, J.A.; Nanda, S.; Dalai, A.K.; Kozinski, J.A. Chemistry and Specialty Industrial Applications of Lignocellulosic Biomass. Waste Biomass- Valorization 2020, 12, 2145–2169. [Google Scholar] [CrossRef]
- Basu, P. Torrefaction, in: Biomass Gasification, Pyrolysis and Torrefaction; Elsevier: Amsterdam, The Netherlands, 2013; pp. 87–145. [Google Scholar] [CrossRef]
- Nam, H.; Capareda, S. Experimental investigation of torrefaction of two agricultural wastes of different composition using RSM (response surface methodology). Energy 2015, 91, 507–516. [Google Scholar] [CrossRef]
- Waheed, A.; Naqvi, S.R.; Ali, I. Co-Torrefaction Progress of Biomass Residue/Waste Obtained for High-Value Bio-Solid Products. Energies 2022, 15, 8297. [Google Scholar] [CrossRef]
- Lau, H.S.; Ng, H.K.; Gan, S.; Jourabchi, S.A. Torrefaction of oil palm fronds for co-firing in coal power plants. Energy Procedia 2018, 144, 75–81. [Google Scholar] [CrossRef]
- Chen, W.-H.; Kuo, P.-C. A study on torrefaction of various biomass materials and its impact on lignocellulosic structure simulated by a thermogravimetry. Energy 2010, 35, 2580–2586. [Google Scholar] [CrossRef]
- Ivanovski, M.; Goričanec, D.; Urbancl, D. The Evaluation of Torrefaction Efficiency for Lignocellulosic Materials Combined with Mixed Solid Wastes. Energies 2023, 16, 3694. [Google Scholar] [CrossRef]
- Mohammad, I.N.; Ongkudon, C.M.; Misson, M. Physicochemical Properties and Lignin Degradation of Thermal-Pretreated Oil Palm Empty Fruit Bunch. Energies 2020, 13, 5966. [Google Scholar] [CrossRef]
- Premchand, P.; Demichelis, F.; Chiaramonti, D.; Bensaid, S.; Fino, D. Study on the effects of carbon dioxide atmosphere on the production of biochar derived from slow pyrolysis of organic agro-urban waste. Waste Manag. 2023, 172, 308–319. [Google Scholar] [CrossRef] [PubMed]
- Wolela, A. Fossil fuel energy resources of Ethiopia: Coal deposits. Int. J. Coal Geol. 2007, 72, 293–314. [Google Scholar] [CrossRef]
Disclaimer/Publisher’s Note: The statements, opinions and data contained in all publications are solely those of the individual author(s) and contributor(s) and not of MDPI and/or the editor(s). MDPI and/or the editor(s) disclaim responsibility for any injury to people or property resulting from any ideas, methods, instructions or products referred to in the content. |
© 2024 by the authors. Licensee MDPI, Basel, Switzerland. This article is an open access article distributed under the terms and conditions of the Creative Commons Attribution (CC BY) license (https://creativecommons.org/licenses/by/4.0/).