
The Effect of Information and Communication Technology on Electricity Intensity in Korea


Abstract
1. Introduction
2. Materials and Methods
3. Results
3.1. Unit Root Test
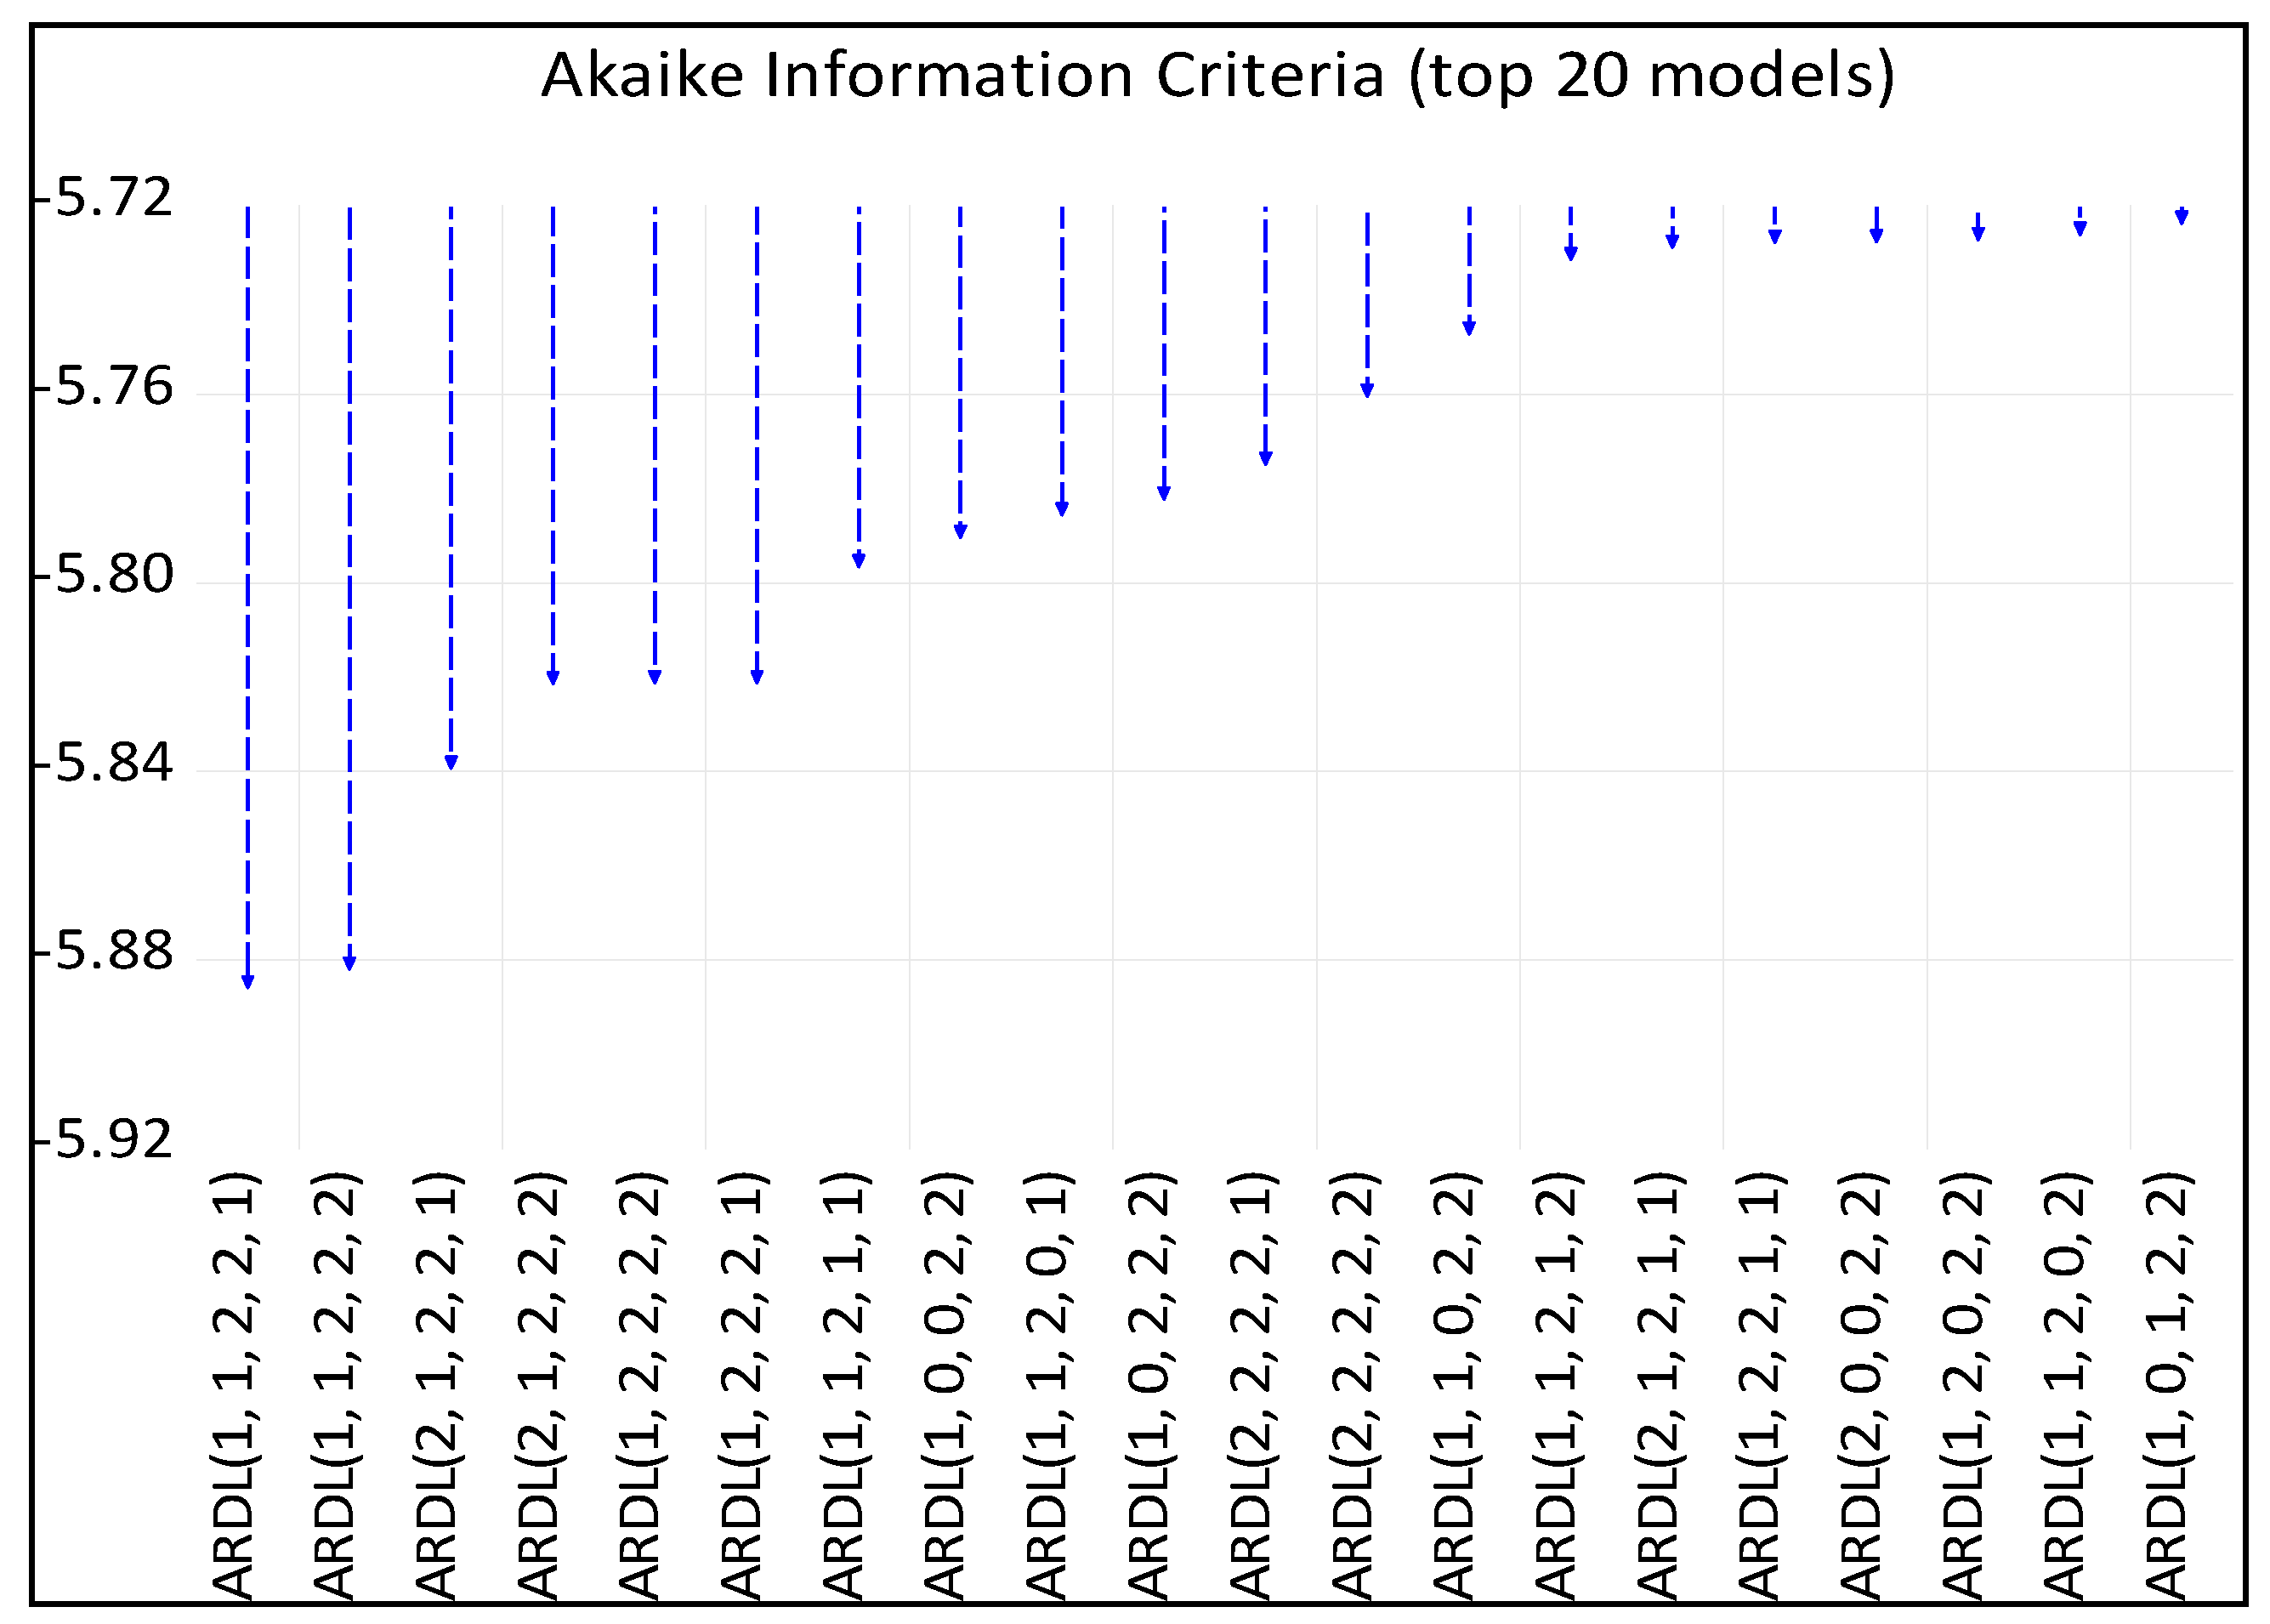
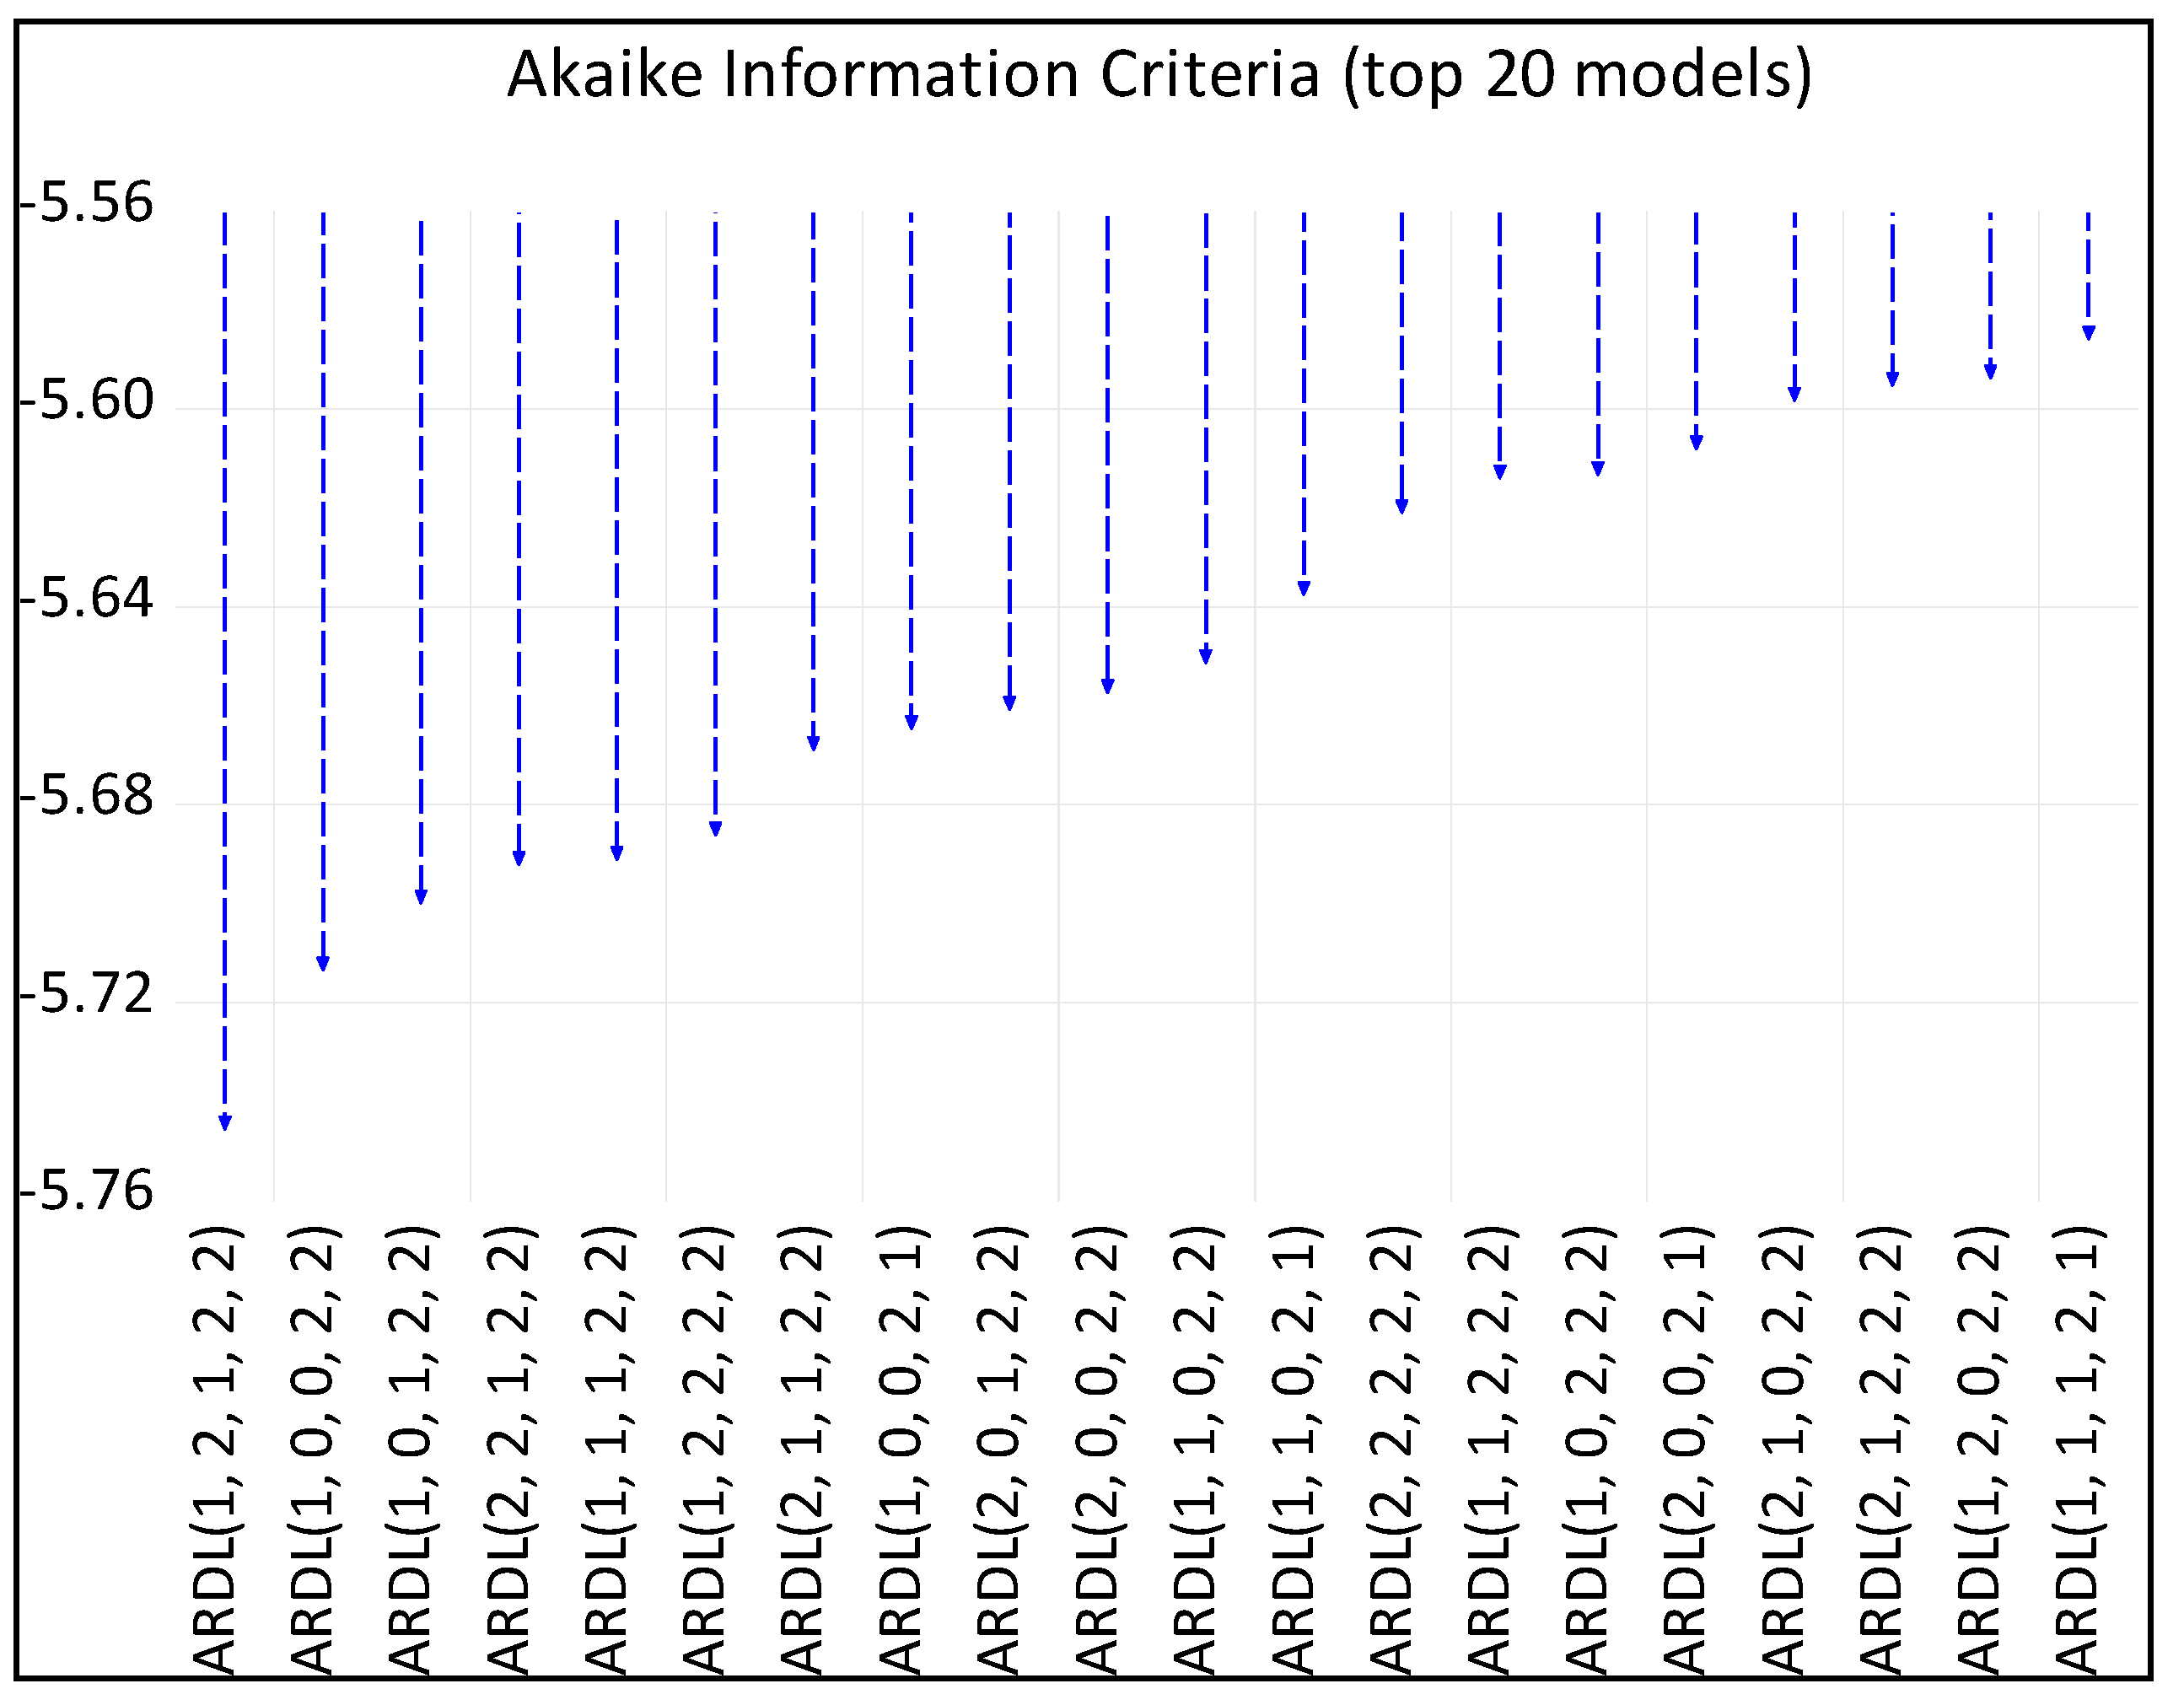
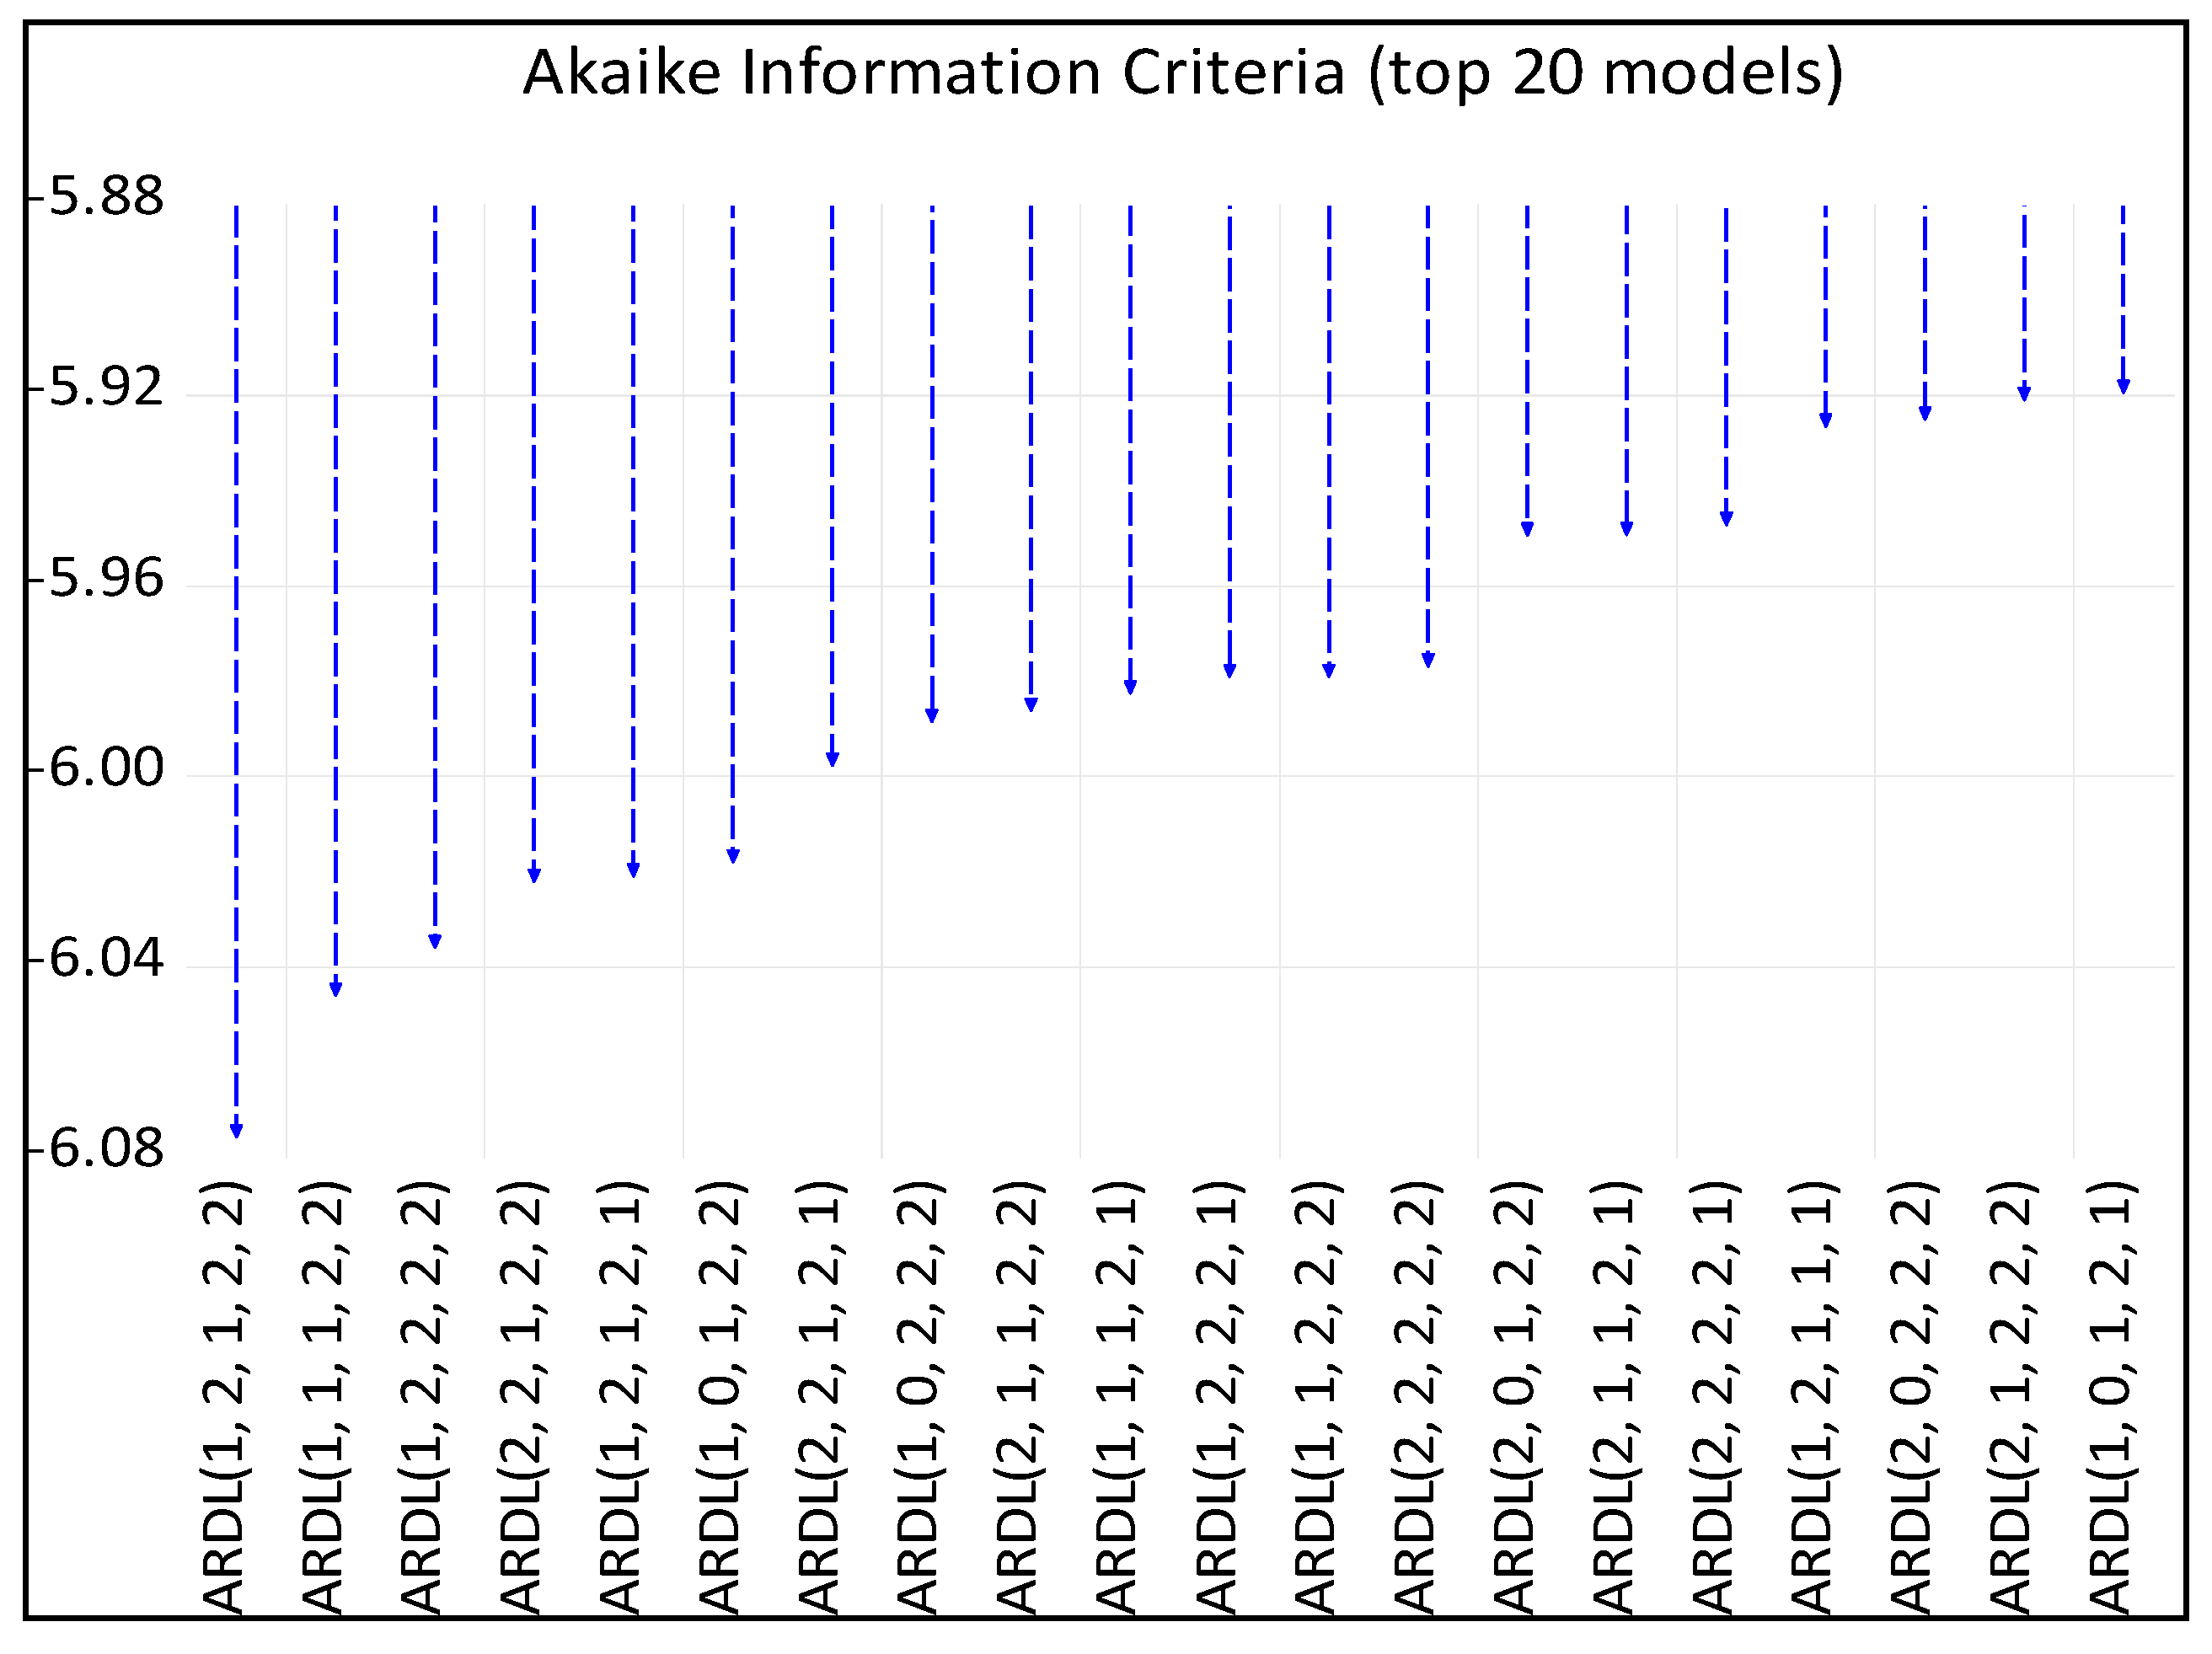
3.2. Model Selection Criterion and ARDL Bounds Test
3.3. Long-Run Equilibrium Relationship
3.4. Short-Run Dynamics
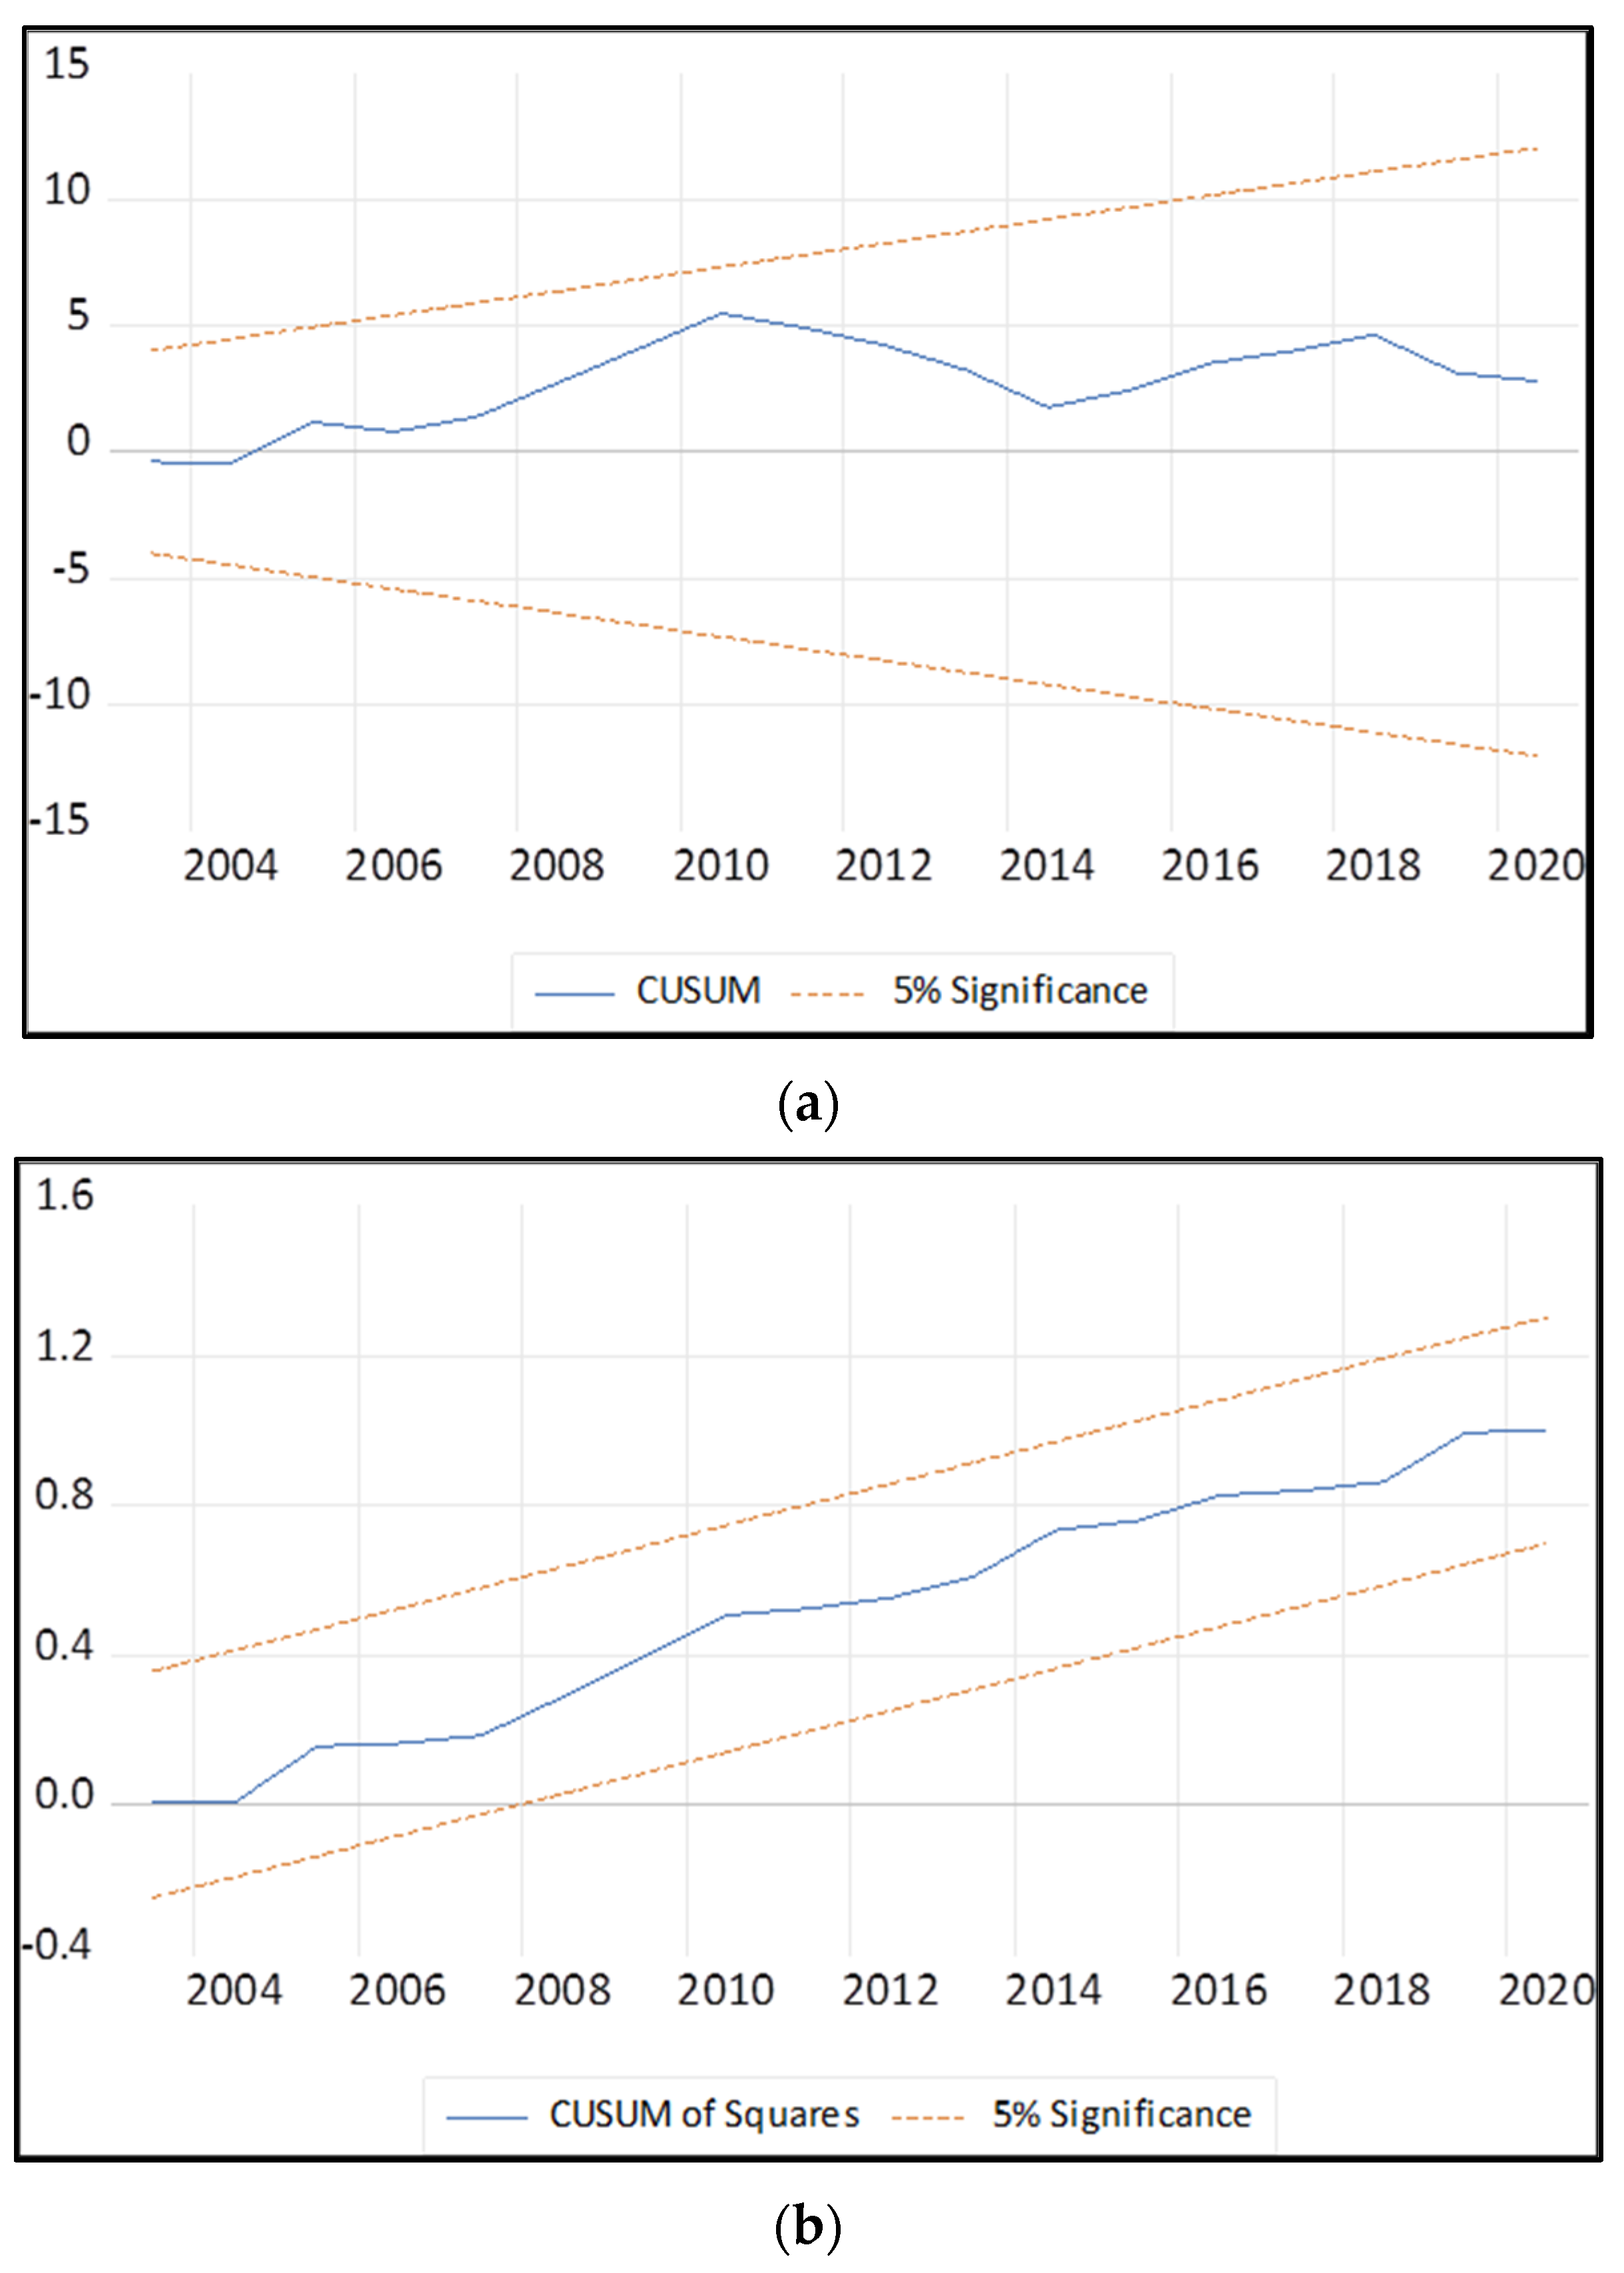
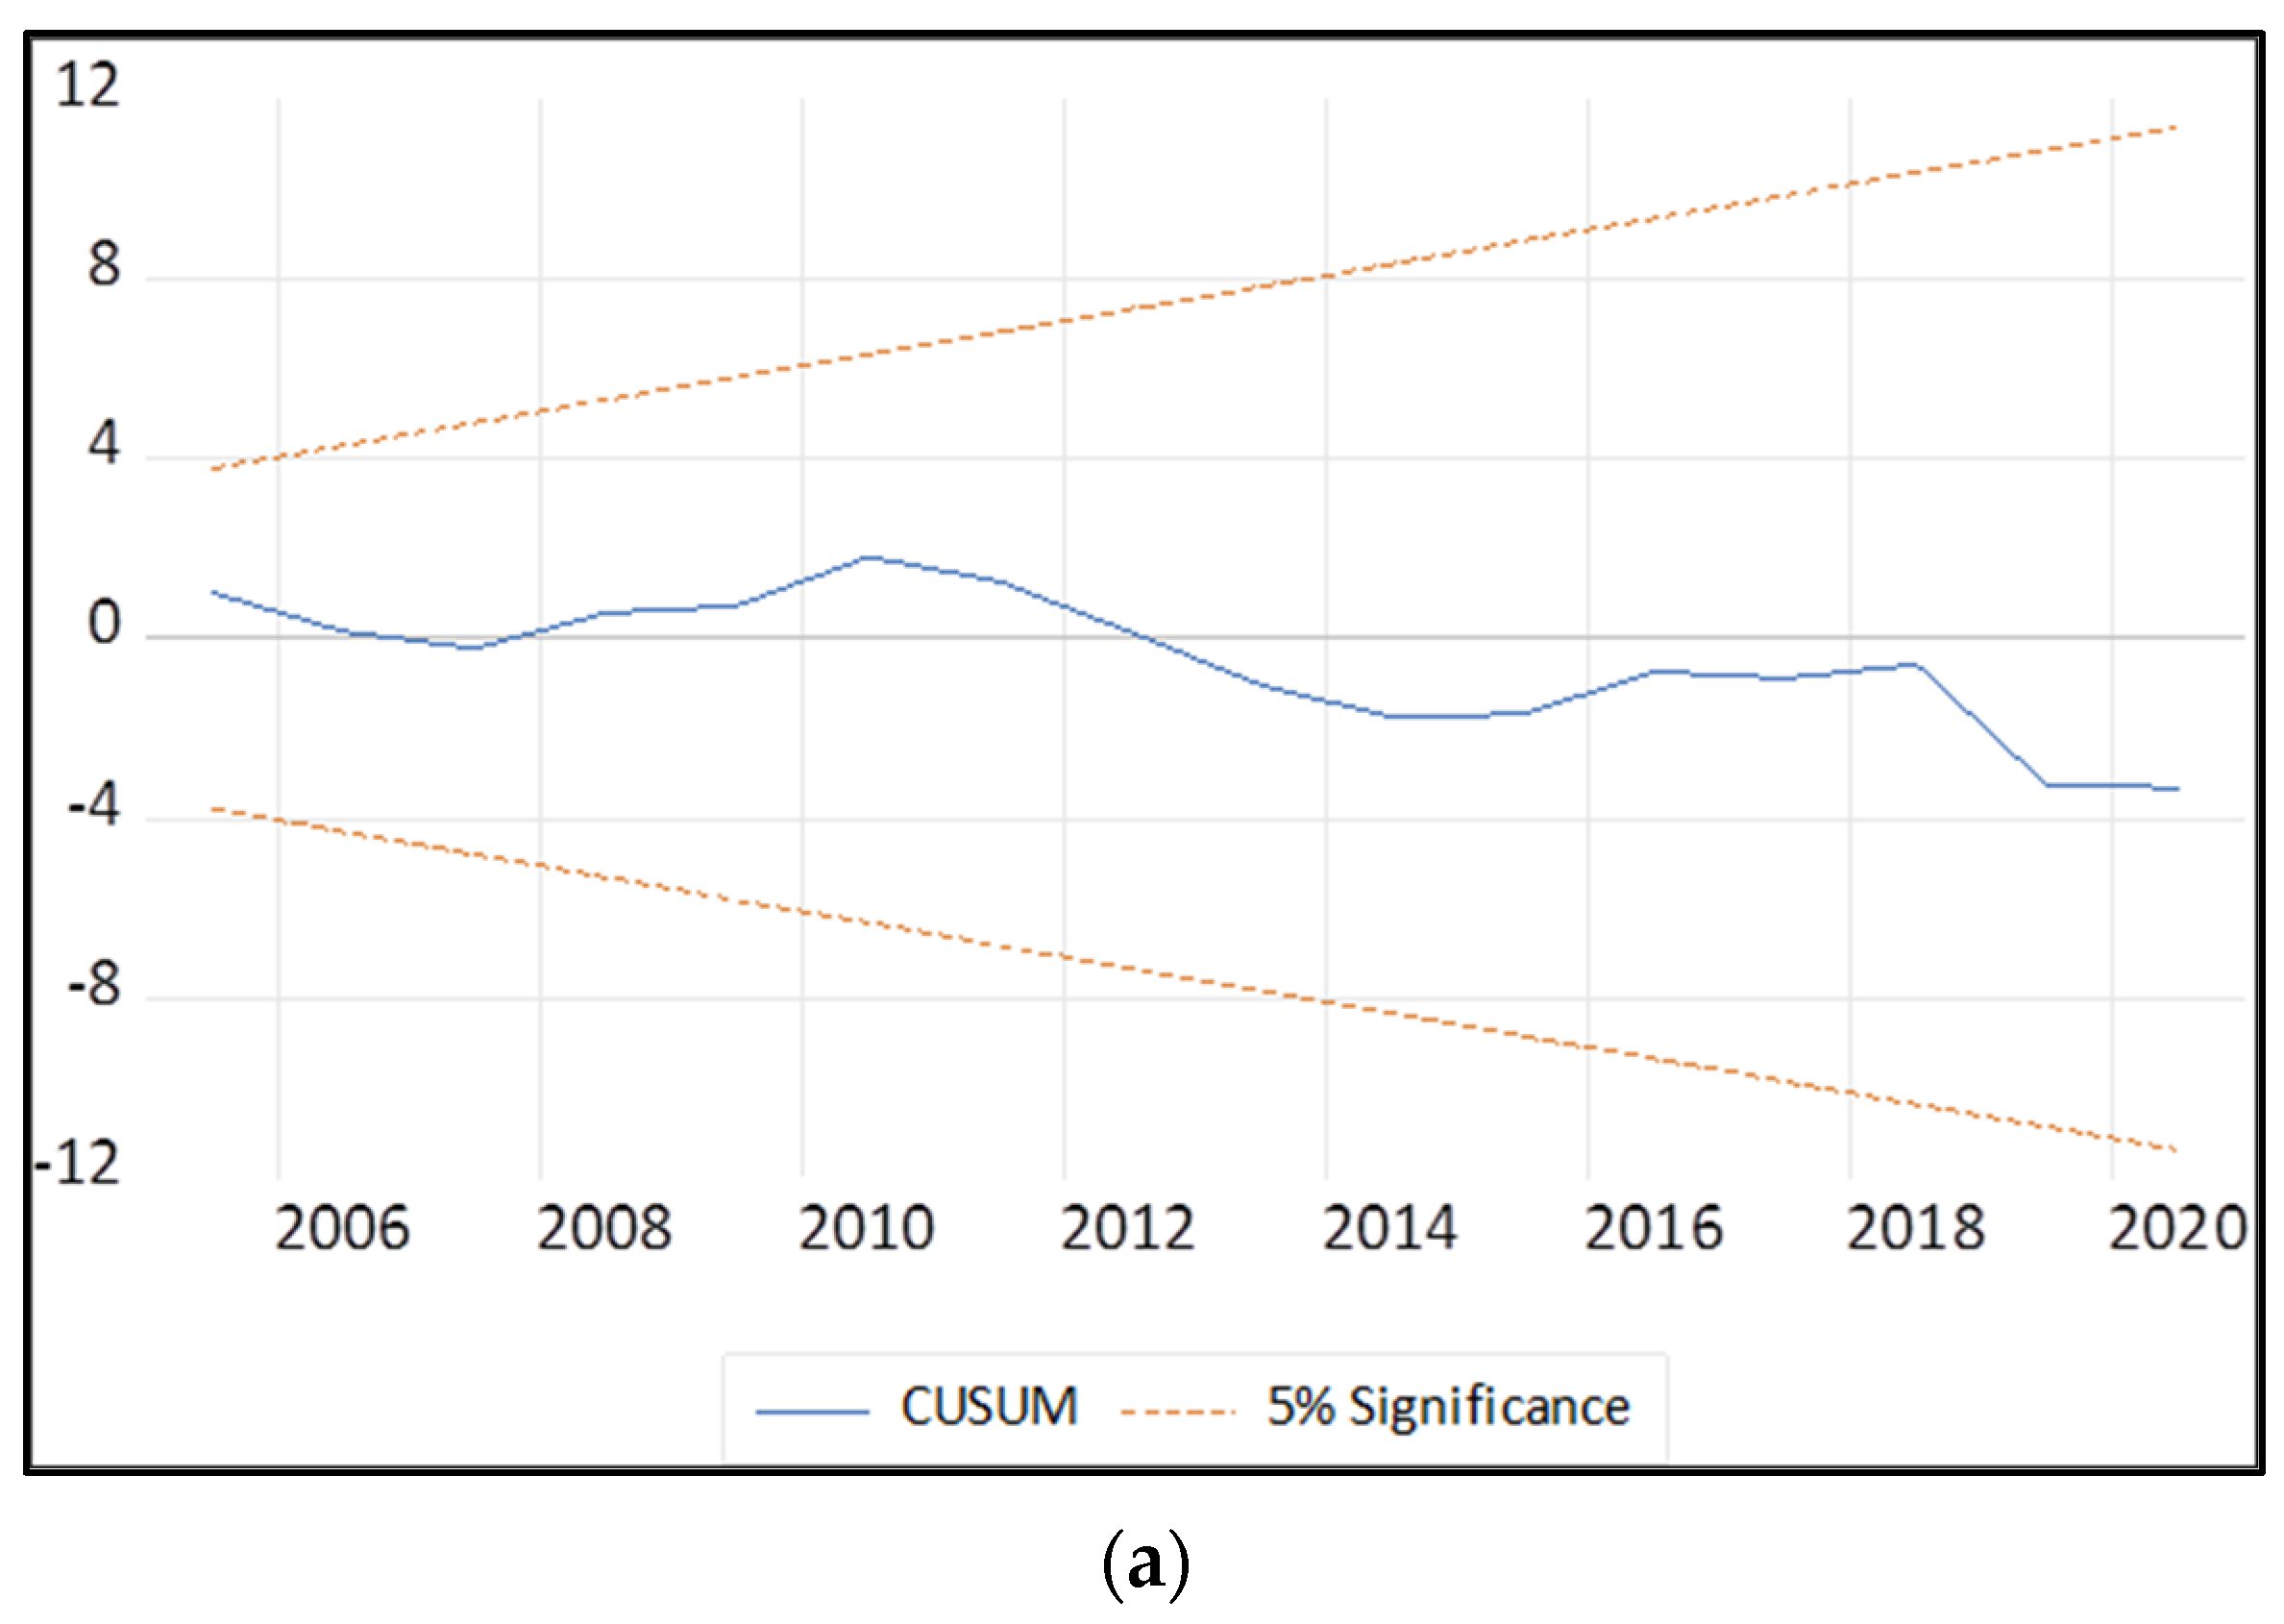
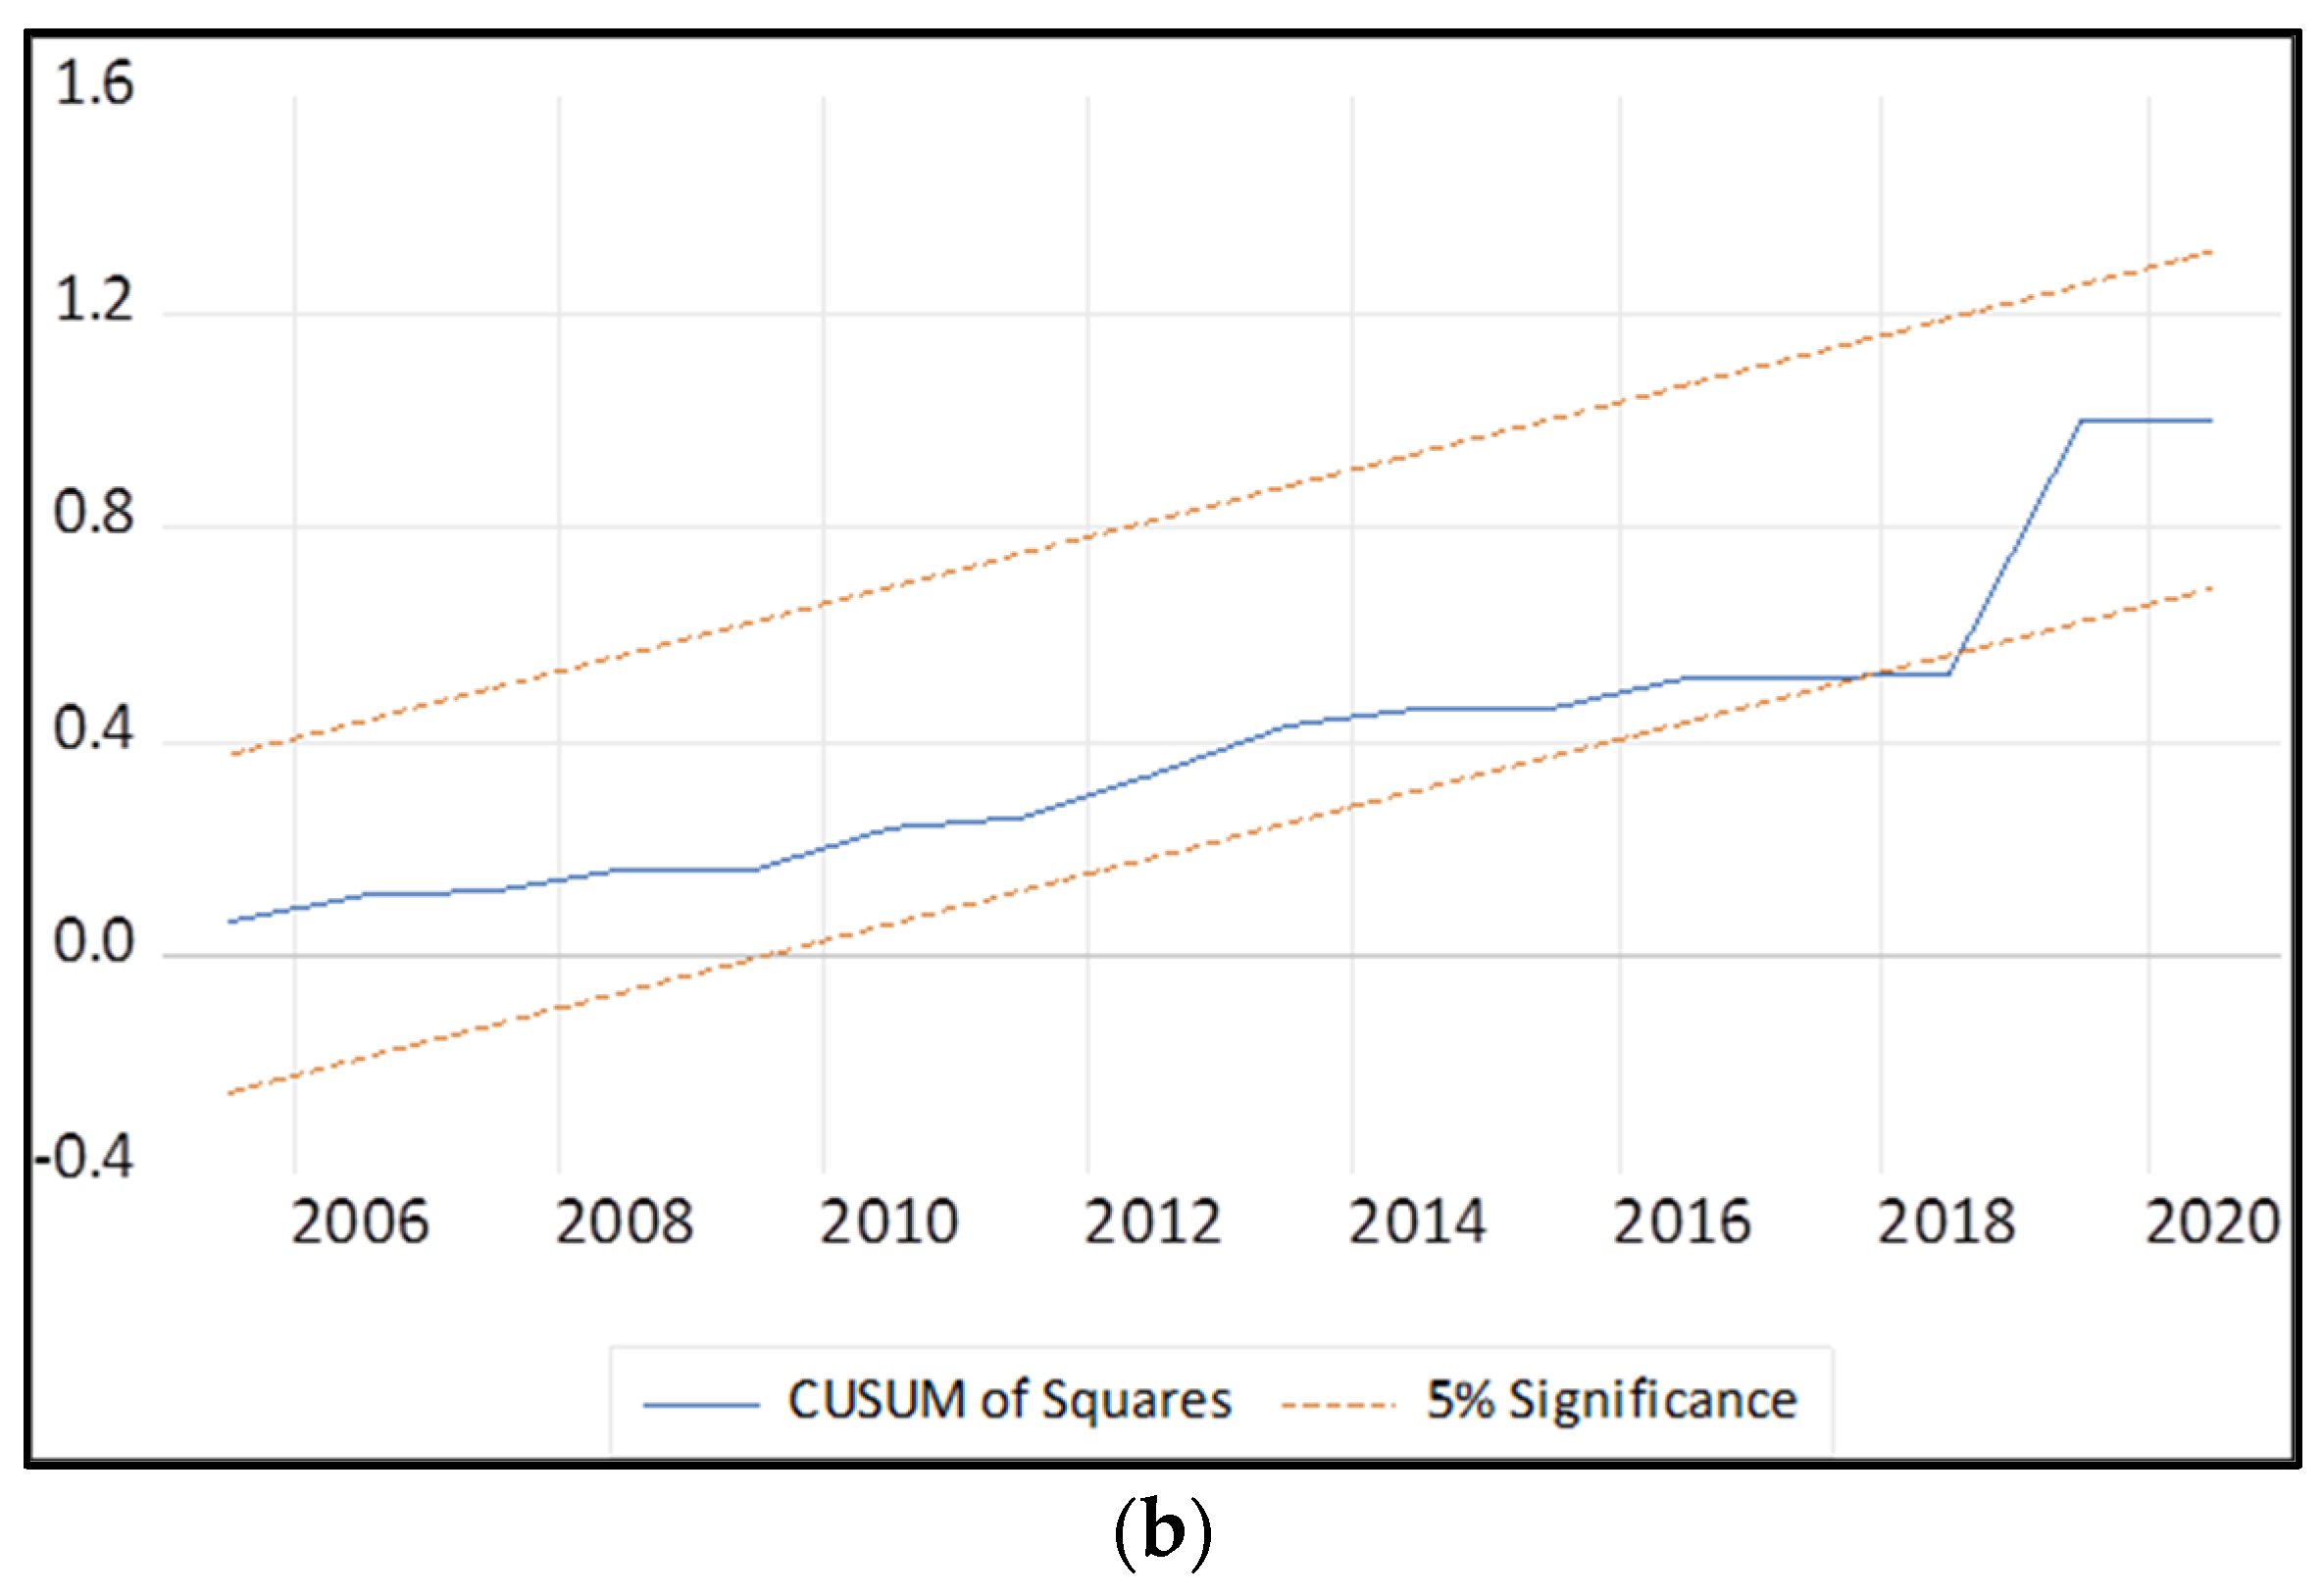
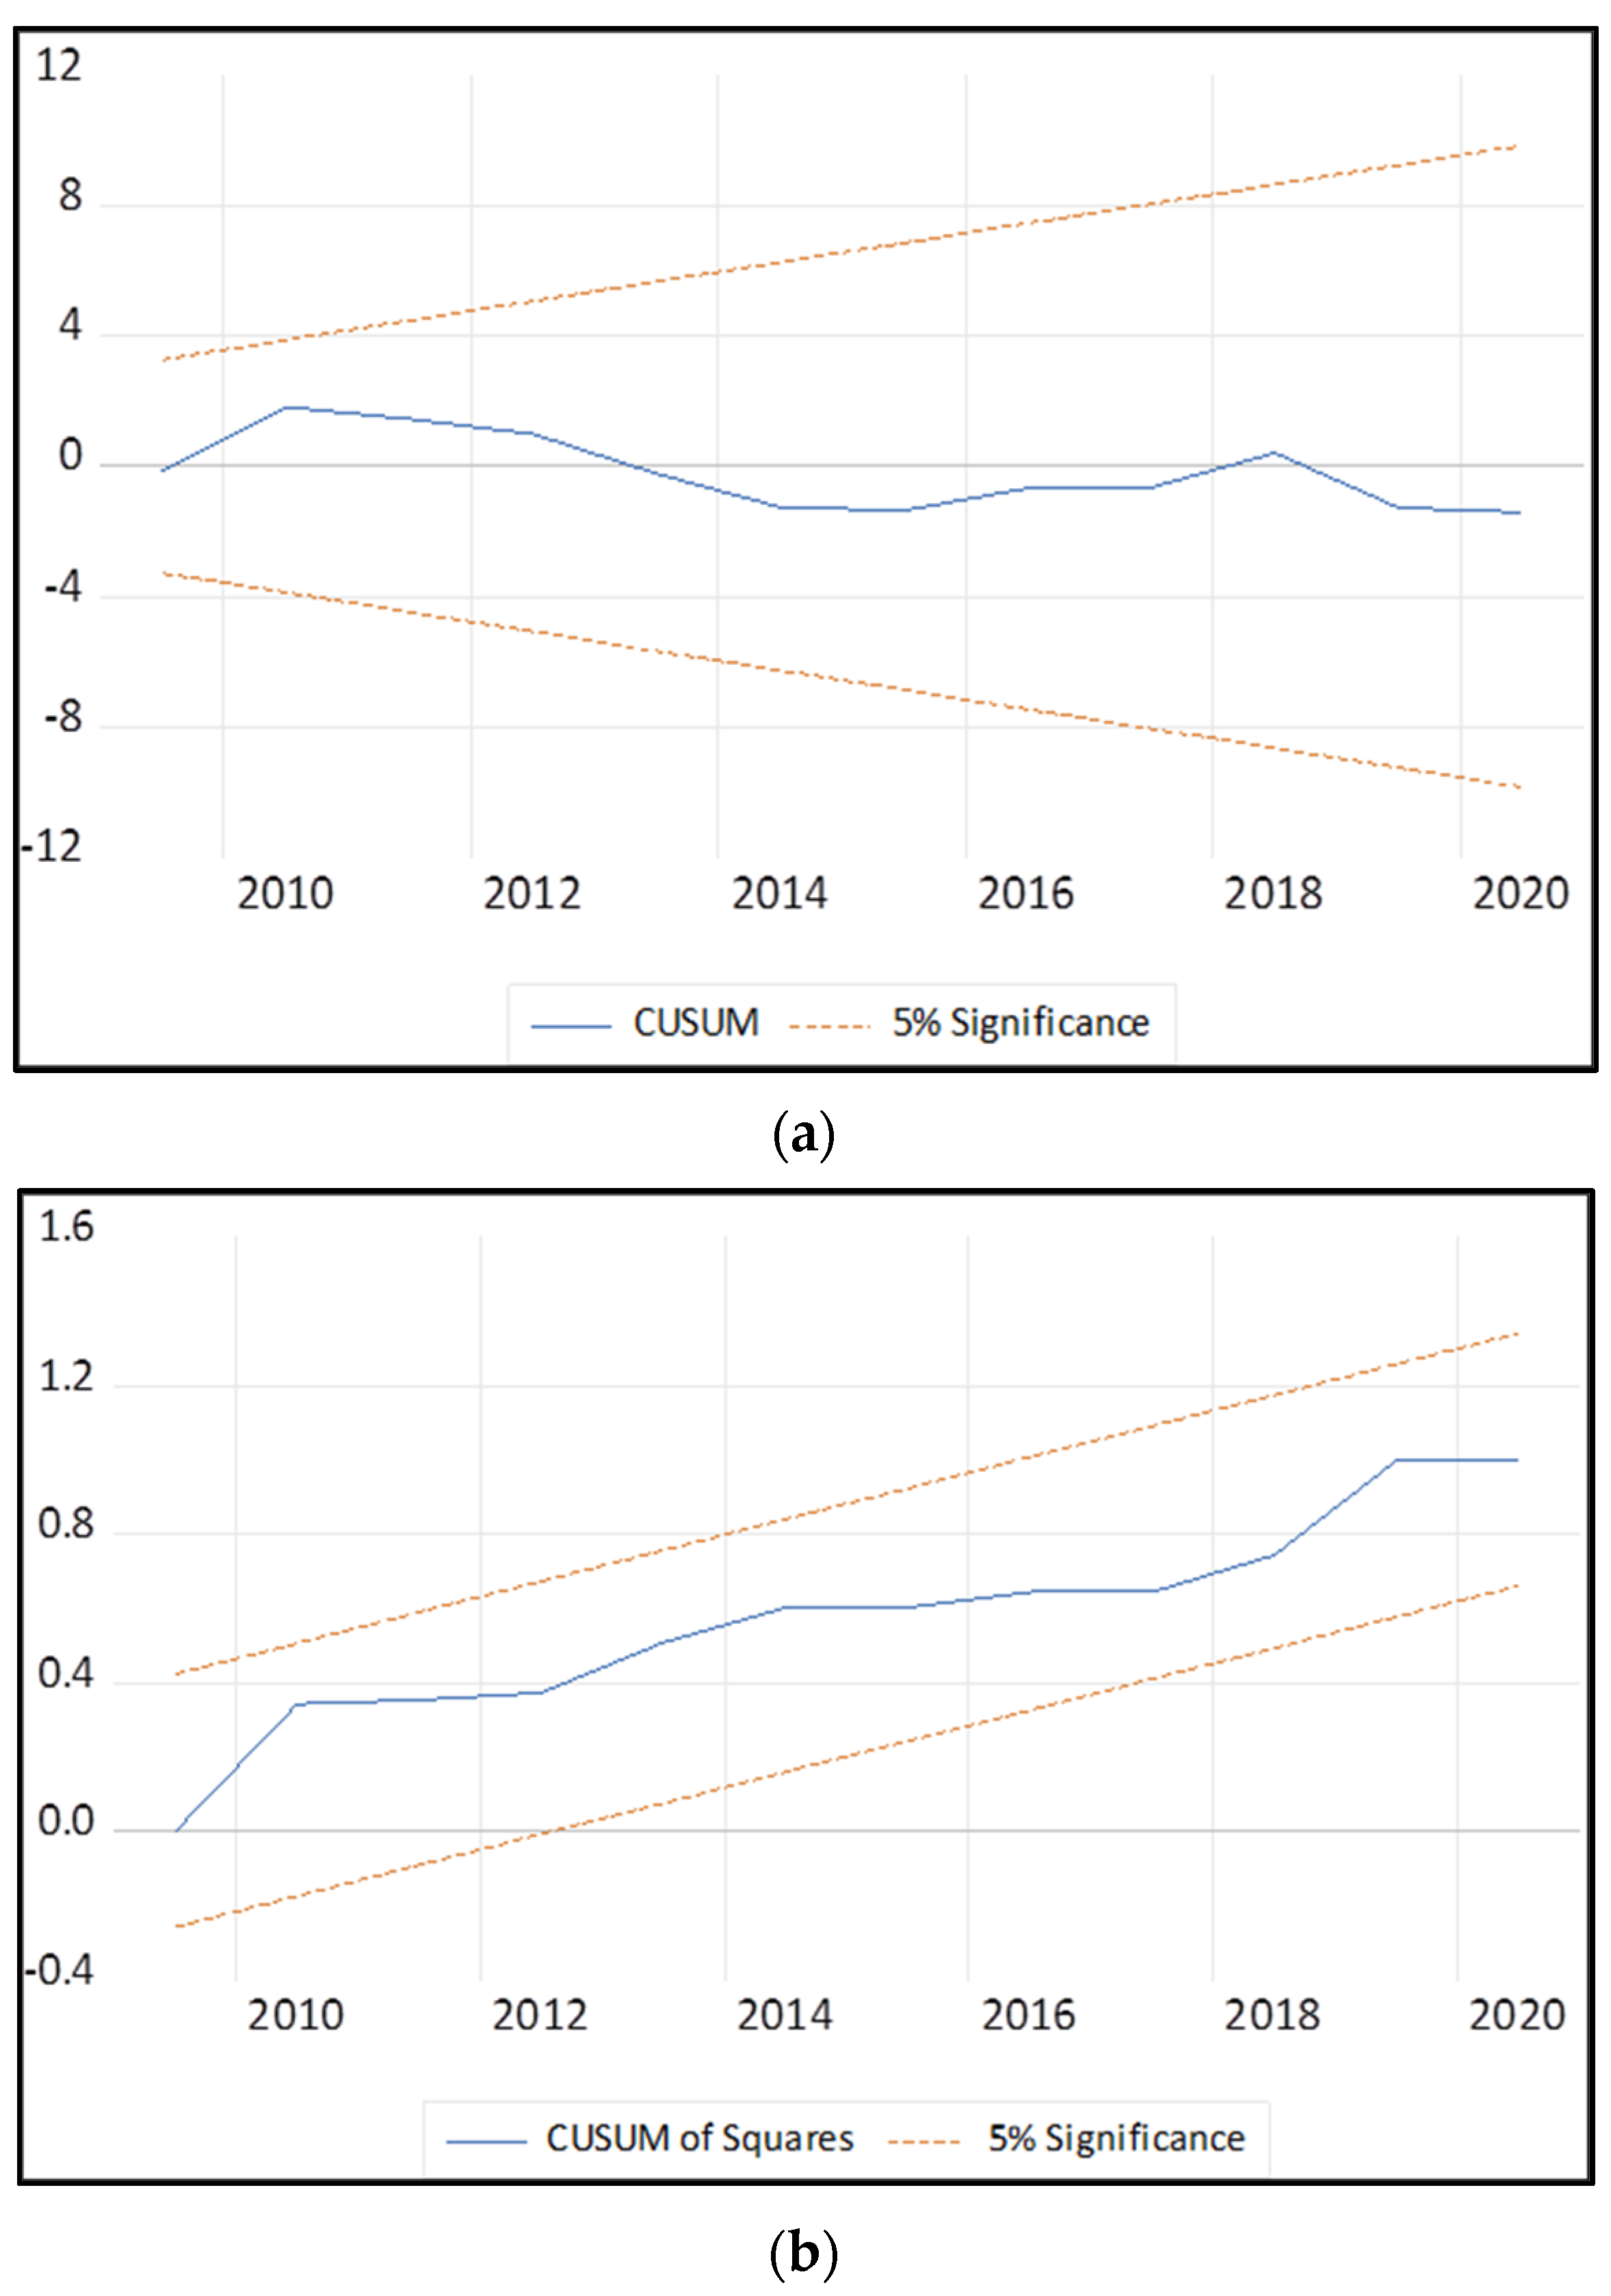
3.5. Model Stability
4. Discussion and Conclusions
5. Policy Implications
Funding
Data Availability Statement
Conflicts of Interest
Appendix A


References
- Thirring, H. Energy for Man: Windmills to Nuclear Power; Indiana University Press: Bloomington, IN, USA, 1958. [Google Scholar]
- Walker, W. Information technology and the use of energy. Energy Policy 1985, 13, 458–476. [Google Scholar] [CrossRef]
- Walker, W. Information technology and energy supply. Energy Policy 1986, 14, 466–488. [Google Scholar] [CrossRef]
- World Bank World Development Indicators (WDI) Database. Available online: http://data.worldbank.org (accessed on 1 March 2022).
- Cardoso, A.; Camarasa Hernando, C.; Køien, G.M.; Wang, X.; Deschamps, S.; Data Centers. Digitalisation Powerhouse and Energy Efficiency Potential; DTU Library. 2020. Available online: https://backend.orbit.dtu.dk/ws/files/222047537/2020_10_IssueBrief_Datacenter_v2_EN_endors2.pdf (accessed on 1 March 2022).
- Bastida, L.; Cohen, J.J.; Kollmann, A.; Moya, A.; Reichl, J. Exploring the role of ICT on household behavioural energy efficiency to mitigate global warming. Renew. Sustain. Energy Rev. 2019, 103, 455–462. [Google Scholar] [CrossRef]
- Salahuddin, M.; Alam, K.; Ozturk, I. The effects of Internet usage and economic growth on CO2 emissions in OECD countries: A panel investigation. Renew. Sustain. Energy Rev. 2016, 62, 1226–1235. [Google Scholar] [CrossRef]
- Magazzino, C.; Porrini, D.; Fusco, G.; Schneider, N. Investigating the link among ICT, electricity consumption, air pollution, and economic growth in EU countries. Energy Sources B 2021, 16, 976–998. [Google Scholar] [CrossRef]
- Sadorsky, P. Information communication technology and electricity consumption in emerging economies. Energy Policy 2012, 48, 130–136. [Google Scholar] [CrossRef]
- Afzel, M.N.I.; Gow, J. Electricity consumption and information and communication technology in the next eleven emerging economies. Int. J. Energy Econ. Policy 2016, 6, 381–388. [Google Scholar]
- Saidi, K.; Toumi, H.; Zaidi, S. Impact of information communication technology and economic growth on the electricity consumption: Empirical evidence from 67 countries. J. Knowl. Econ. 2017, 8, 789–803. [Google Scholar] [CrossRef]
- Saidi, K.; Mbarek, M.B.; Amamri, M. Causal dynamics between energy consumption, ICT, FDI, and economic growth: Case study of 13 MENA countries. J. Knowl. Econ. 2018, 9, 228–238. [Google Scholar] [CrossRef]
- Zhao, S.; Hafeez, M.; Faisal, C.M.N. Does ICT diffusion lead to energy efficiency and environmental sustainability in emerging Asian economies? Environ. Sci. Pollut. Res. Int. 2022, 29, 12198–12207. [Google Scholar] [CrossRef] [PubMed]
- Collard, F.; Fe`veb, P.; Portierc, F. Electricity consumption and ICT in the French service sector. Energy Econ. 2005, 27, 541–550. [Google Scholar] [CrossRef]
- Ishida, H. The effect of ICT development on economic growth and energy consumption in Japan. Telemat. Inform. 2015, 32, 79–88. [Google Scholar] [CrossRef]
- Shahbaz, M.; Rehman, I.; Sbia, R.; Hamdi, H.S. The Role of Information Communication Technology and Economic Growth in Recent Electricity Demand: Fresh Evidence from Combine Cointegration Approach in UAE. J. Knowl. Econ. 2016, 7, 797–818. [Google Scholar] [CrossRef]
- Solarin, S.A.; Shahbaz, M.; Khan, H.N.; Razali, R.B. ICT, financial development, economic growth and electricity consumption: New evidence from Malaysia. Glob. Bus. Rev. 2021, 22, 941–962. [Google Scholar] [CrossRef]
- Pesaran, M.H.; Pesaran, B. Working with Microfit 4.0: Interactive Econometric Analysis; Oxford University Press: Oxford, UK, 1997. [Google Scholar]
- Pesaran, M.H.; Shin, Y. An autoregressive distributed lag modelling approach to cointegration analysis. In Econometrics and Economic Theory in the 20th Century: The Ragner Frisch Centennial Symposium; Strom, S., Holly, A., Diamond, P., Eds.; Cambridge University Press: Cambridge, UK, 1999; pp. 1–33. [Google Scholar]
- Pesaran, M.H.; Shin, Y.; Smith, R.J. Bounds testing approaches to the analysis of level relationships. J. Appl. Econ. 2001, 16, 289–326. [Google Scholar] [CrossRef]
- Engle, R.F.; Granger, C.W.J. Co-integration and error correction: Representation, estimation, and testing. Econometrica 1987, 55, 251–276. [Google Scholar] [CrossRef]
- Amri, F. Carbon dioxide emissions, total factor productivity, ICT, trade, financial development, and energy consumption: Testing environmental Kuznets curve hypothesis for Tunisia. Environ. Sci. Pollut. Res. Int. 2018, 25, 33691–33701. [Google Scholar] [CrossRef] [PubMed]
- Korea Energy Economics Institute (KEEI). KESIS Database. Available online: https://www.kesis.net/main/main.jsp (accessed on 1 March 2022).
- Statistics Korea. (KOSTAT). Korean Statistical Information Service (KOSIS). Available online: https://kosis.kr/index/index.do (accessed on 1 March 2022).
- Dickey, D.A.; Fuller, W.A. Distribution of the estimators for autoregressive time series with a unit root. J. Am. Stat. Assoc. 1979, 74, 427–431. [Google Scholar]
- Narayan, P.K. The saving and investment nexus for China: Evidence from cointegration tests. Appl. Econ. 2005, 37, 1979–1990. [Google Scholar] [CrossRef]
- Bahmani-Oskooee, M.; Nasir, A.B.M. ARDL approach to test the productivity bias hypothesis. Rev. Dev. Econ. 2004, 8, 483–488. [Google Scholar] [CrossRef]


| Subjects | Regions | Periods | Methods | Main Results | |
|---|---|---|---|---|---|
| Afzel and Gow [10] | The effect of ICT on electricity consumption | Eleven emerging economics (1) | 1990–2014 | Mean group and pooled mean group | There is a positive and statistically significant relationship between ICT and electricity consumption. |
| Collard et al. [14] | The effect of ICT on electricity consumption in the service sector | France | 1978–1999 | Non-linear least squares method | ICT capital increased electricity efficiency and contributed to a reduction in electricity intensity in the service sector. |
| Ishida [15] | The effect of ICT development on energy consumption | Japan | 1980–2010 | ARDL bounds test | The long-term elasticity of the effect of ICT investment on energy consumption was 0.155, while ICT investment moderately reduced energy consumption. |
| Magazzino et al. [8] | The links between ICT, electricity consumption, air pollution, and economic growth in EU countries | 16 EU countries | 1990–2017 | Dumitrescu–Hurlin panel causality tests, panel mean-group regression | There is a one-way causality running from ICT usage to electricity consumption. |
| Sadorsky [9] | The impact of ICT on electricity consumption in emerging economies | Emerging economies (2) | 1993–2008 | GMM estimation | There is a positive and statistically significant relationship between ICT and electricity consumption. |
| Saidi et al. [11] | Impact of ICT and economic growth on electricity consumption | 67 countries | 1990–2012 | GMM, AR (2) | ICT exerts a positive and statistically significant effect on electricity consumption. |
| Saidi et al. [12] | Causal dynamics between energy consumption, ICT, FDI and economic growth | 13 MENA countries (3) | 1990–2012 | Granger causality test | There is a bidirectional relationship between energy consumption and economic growth and between ICT and economic growth. |
| Salahuddin et al. [7] | The short- and long-run effects of ICT use and economic growth on electricity consumption | OECD countries | 1985–2012 | PMG estimation and Dumitrescu–Hurlin causality test. | ICT stimulates electricity consumption in both the short and long term; mobile and Internet use cause an increase in electricity consumption. |
| Shahbaz et al. [16] | The role of ICT in electricity demand: | UAE | 1975–2011 | VECM | ICT increased electricity demand. ICT and electricity price granger cause electricity demand. |
| Solarin et al. [17] | The impact of ICT, financial development and economic growth on electricity consumption | Malaysia | 1990–2015 | Toda–Yamamoto Granger causality approach | ICT has a positive effect on electricity consumption; financial development increases electricity consumption. |
| Zhao et al. [13] | The effect of ICT on energy efficiency and environmental sustainability | Asian economies | 1990–2019 | ARDL–PMG | Use of the Internet and mobile phones increases energy efficiency in the long run. |
| Variables | Unit | Sources |
|---|---|---|
| EE | Electricity consumption (MWh)/GDP (constant 2015 USD) | KEEI, KESIS |
| EP | Electricity price (won/kWh) | KEEI, KESIS |
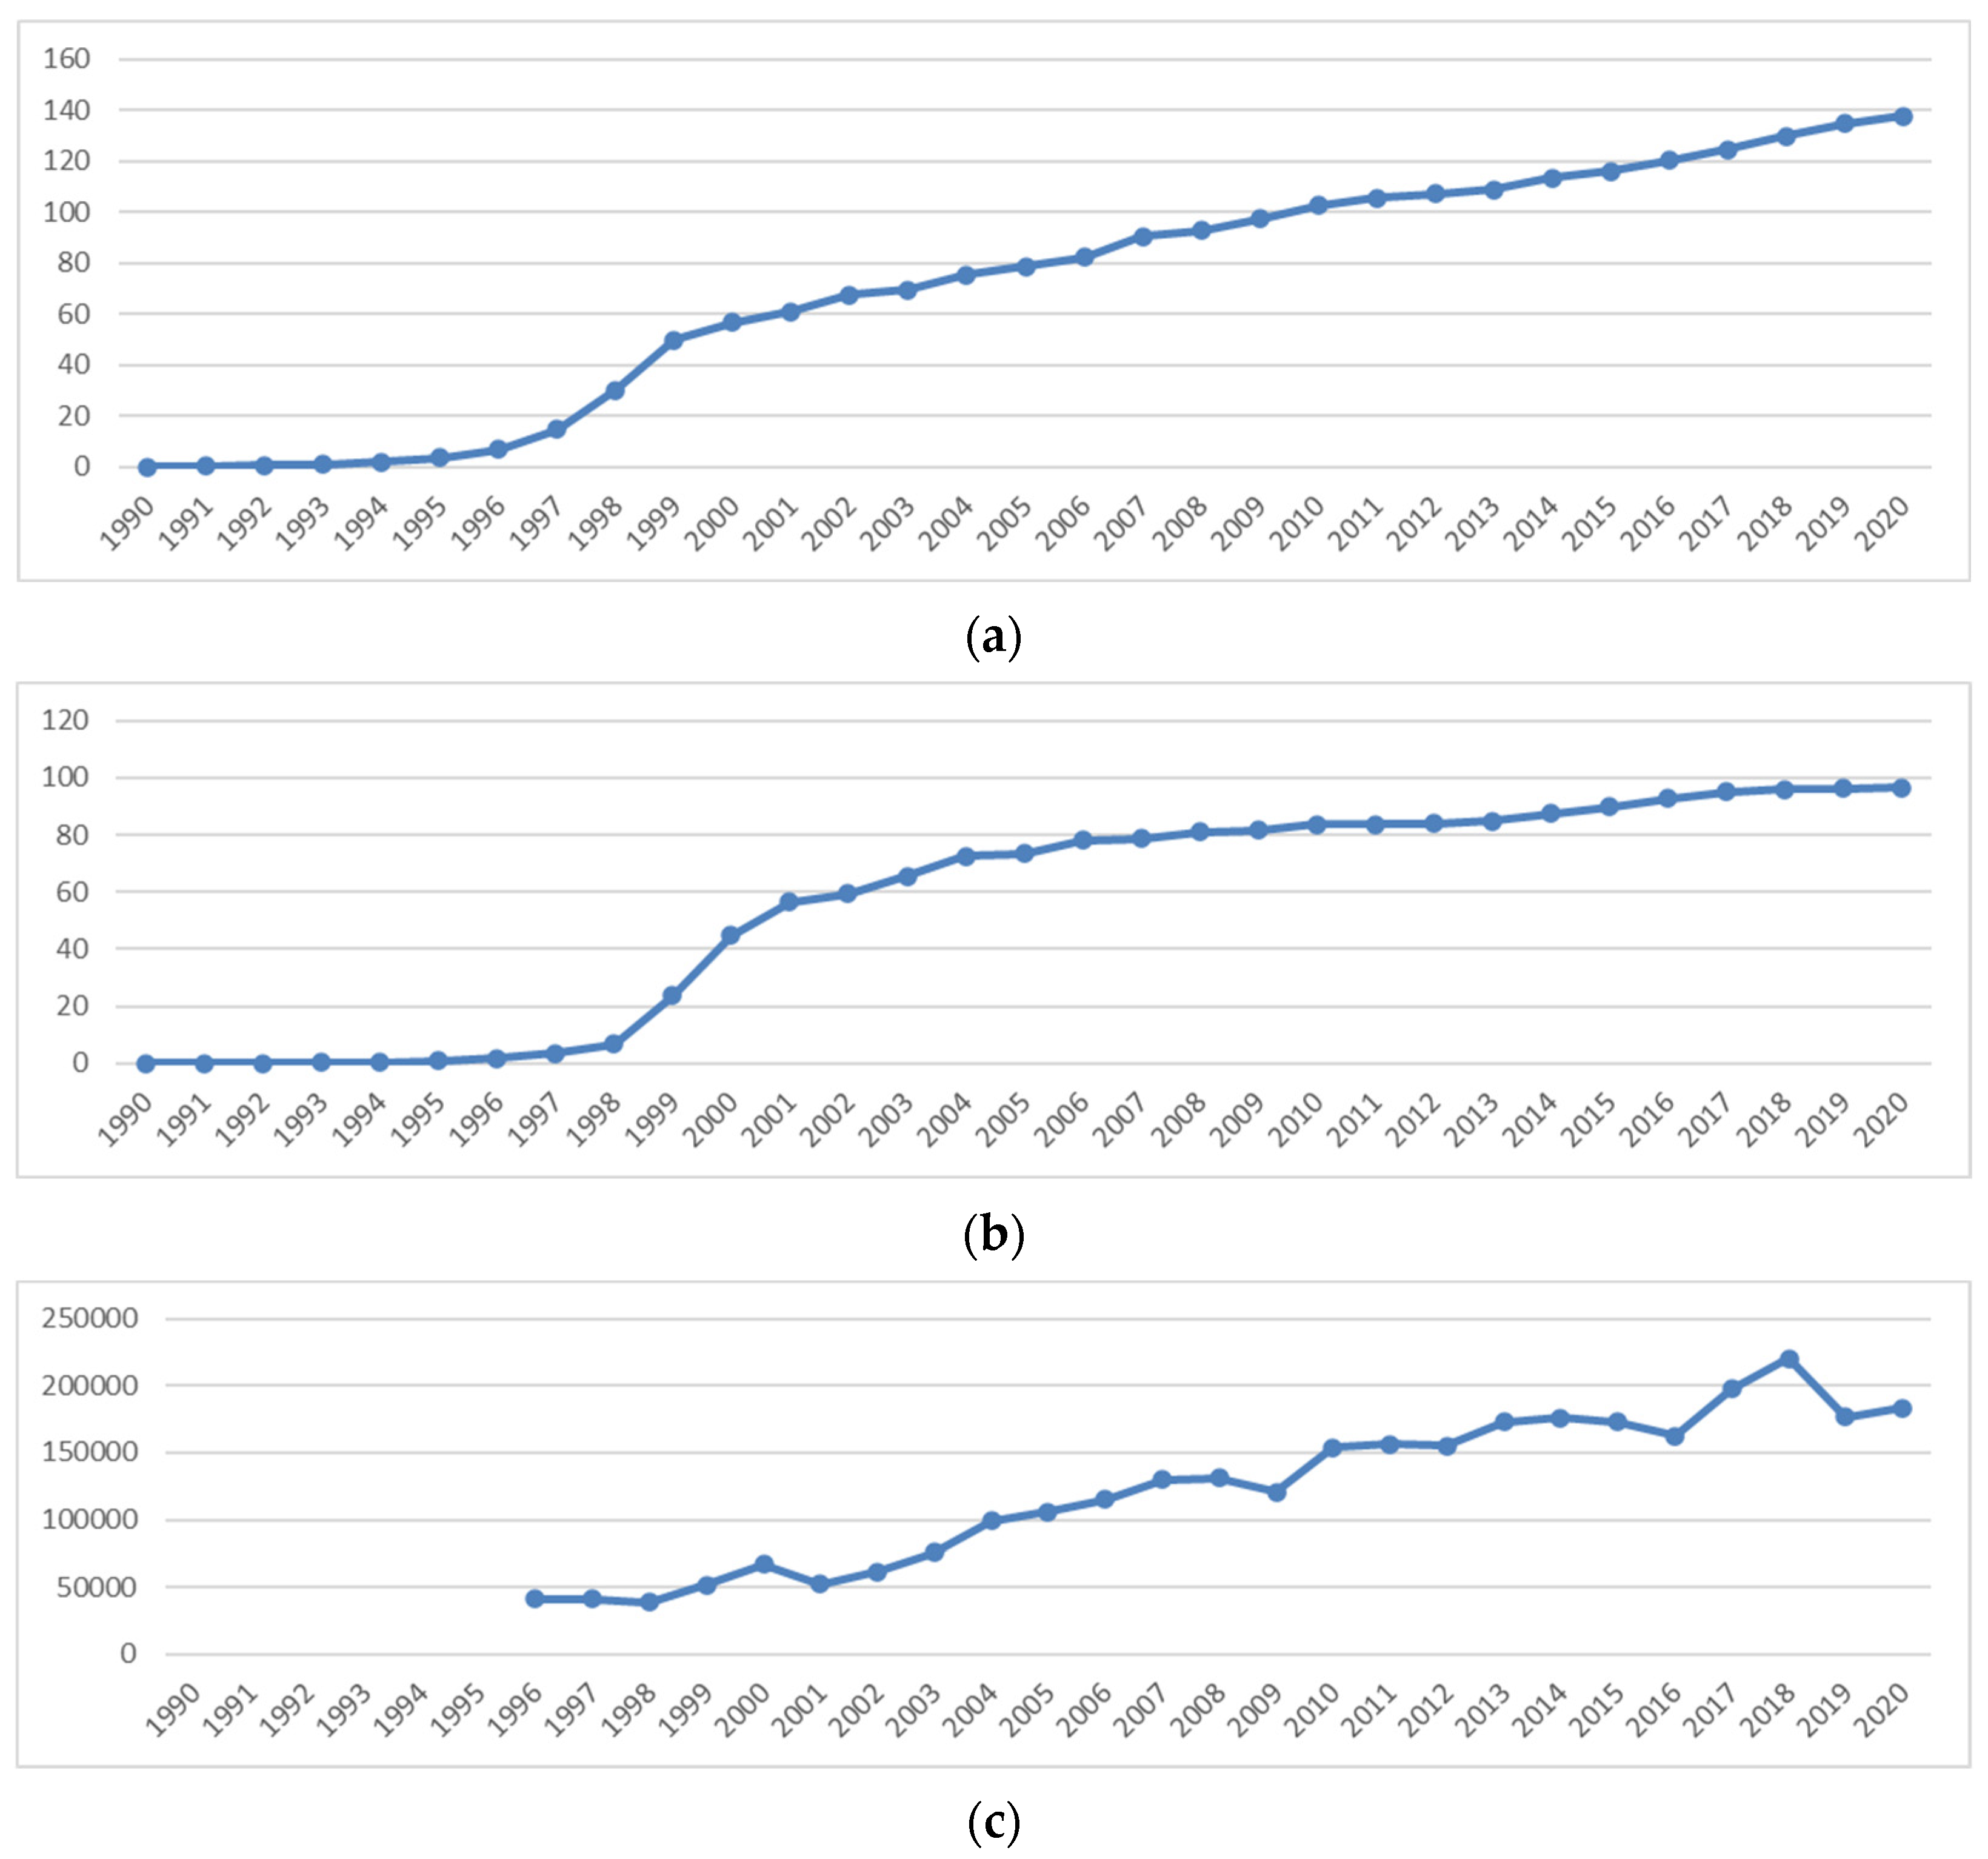
| MO | Mobile cellular subscriptions (per 100 people) | World Bank, DataBank |
| INT | Individuals using the Internet (% of the population) | World Bank, DataBank |
| EX | Exports of ICT-related products (in millions of USD) | Statistics Korea, KOSIS |
| FD | Domestic credit to private sector (% of GDP) | World Bank, DataBank |
| PO | Population | World Bank, DataBank |
| EE | EP | MO | INT | EX | FD | PO | |
|---|---|---|---|---|---|---|---|
| Mean | 0.000307 | 81.82 | 70.33 | 55.46 | 122,463 | 103.04 | 48,046,696 |
| Median | 0.000318 | 76.43 | 78.73 | 73.50 | 130,098 | 112.65 | 48,184,561 |
| Maximum | 0.000348 | 111.57 | 137.54 | 96.51 | 220,340 | 164.78 | 51,780,579 |
| Minimum | 0.000235 | 52.94 | 0.19 | 0.02 | 38,888 | 48.61 | 42,869,283 |
| Std. dev. | 3.32 × 10⁻⁵ | 19.42629 | 47.06264 | 38.27662 | 55,764.7 | 38.46759 | 2,690,337 |
| Skewness | −0.8657 | 0.3468 | −0.3308 | −0.5426 | −0.1290 | −0.3415 | −0.3227 |
| Kurtosis | 2.6936 | 1.8100 | 1.7167 | 1.5653 | 1.7312 | 1.5571 | 1.9975 |
| Jarque–Bera | 3.9934 | 2.4507 | 2.6925 | 4.1802 | 1.7464 | 3.2919 | 1.8363 |
| (0.1358) 1 | (0.2937) | (0.2602) | (0.1237) | (0.4176) | (0.1928) | (0.3992) | |
| Observations | 31 | 31 | 31 | 31 | 25 | 31 | 31 |
| ADF-Test, t Statistics | p-Value | |
|---|---|---|
| −3.9445 *** | 0.0052 | |
| −1.1763 | 0.6707 | |
| −8.4852 *** | 0.0000 | |
| −0.7233 | 0.8258 | |
| −8.1974 *** | 0.0000 | |
| −2.9903 * | 0.0496 | |
| −1.5422 | 0.4956 |
| ADF-Test, t Statistics | p-Value | |
|---|---|---|
| −2.7576 | 0.0769 | |
| −3.6994 *** | 0.0095 | |
| −1.3913 | 0.5726 | |
| −3.6684 *** | 0.0103 | |
| −6.2354 *** | 0.0000 | |
| −2.7849 | 0.0767 | |
| −5.1682 *** | 0.0004 |
| Case 1: ARDL (1,1,2,2,1) | Case 2: ARDL (1,2,1,2,2) | Case 3: ARDL (1,2,1,2,2) | ||||
|---|---|---|---|---|---|---|
| F-Statistic | 8.177 *** | 7.936 *** | 5.317 *** | |||
| I(0) | I(1) | I(0) | I(1) | I(0) | I(1) | |
| 10% | 1.9 | 3.01 | 2.52 | 3.56 | 3.43 | 4.62 |
| 5% | 2.26 | 3.48 | 3.06 | 4.22 | 4.15 | 5.54 |
| 1% | 3.07 | 4.44 | 4.28 | 5.84 | 5.86 | 7.58 |
| Case 1: ARDL (1,1,2,2,1) | Case 2: ARDL (1,2,1,2,2) | Case 3: ARDL (1,2,1,2,2) | ||||
|---|---|---|---|---|---|---|
| Coefficient | Standard Error | Coefficient | Standard Error | Coefficient | Standard Error | |
| −0.405 | 0.136 | −0.082 | 0.071 | −0.153 | 0.195 | |
| 0.041 *** | 0.006 | |||||
| 0.063 *** | 0.008 | |||||
| 0.001 | 0.119 | |||||
| 0.110 | 0.062 | 0.039 | 0.063 | 0.315 * | 0.169 | |
| 2.307 *** | 0.877 | −0.461 *** | 0.022 | −0.510 *** | 0.124 | |
| Variable | Coefficient | Standard Error | t-Statistics [p-Value] |
|---|---|---|---|
| 0.1362 | 0.0674 | 2.0218 [0.0583] | |
| 0.0644 *** | 0.0189 | 3.3997 [0.0032] | |
| −0.0798 *** | 0.0210 | −3.7991 [0.0013] | |
| −0.0611 ** | 0.0267 | −2.2876 [0.0345] | |
| −0.0856 *** | 0.0263 | −3.2526 [0.0044] | |
| 4.4176 *** | 0.7222 | 6.1165 [0.0000] | |
| −0.4343 *** | 0.0614 | −7.0689 [0.0000] | |
| R-squared | 0.8168 | ||
| Adjusted R-squared | 0.7669 | ||
| Durbin–Watson statistics | 2.1214 | ||
| Serial correlation ( | 0.5229 [0.4108] | ||
| Normality ( | 0.6049 [0.7390] | ||
| Heteroskedasticity ( | 0.0188 [0.4007] | ||
| Variable | Coefficient | Standard Error | t-Statistics [p-Value] |
|---|---|---|---|
| −0.0336 | 0.0599 | −0.5607 [0.5828] | |
| 0.1516 * | 0.0759 | 1.9962 [0.0632] | |
| −0.0297 *** | 0.0078 | −3.8303 [0.0015] | |
| −0.0972 *** | 0.0252 | −3.8554 [0.0014] | |
| −0.0742 *** | 0.0246 | −3.0172 [0.0082] | |
| 4.4426 *** | 1.1776 | 3.7727 [0.0017] | |
| 2.6202 * | 1.1706 | 2.2384 [0.0398] | |
| −0.4582 *** | 0.0580 | −7.9055 [0.0000] | |
| R-squared | 0.8637 | ||
| Adjusted R-squared | 0.8183 | ||
| Durbin–Watson statistics | 2.1607 | ||
| Serial correlation ( | 0.6241 [0.3051] | ||
| Normality ( | 0.8553 [0.6520] | ||
| Heteroskedasticity ( | 0.7038 [0.6143] | ||
| Variable | Coefficient | Standard Error | t-Statistics [p-Value] |
|---|---|---|---|
| 0.0574 | 0.0826 | 0.6951 [0.5003] | |
| −0.1273 | 0.0718 | 1.7728 [0.1016] | |
| 0.0505 ** | 0.0205 | 2.4664 [0.0297] | |
| 0.0795 | 0.0368 | 2.1633 [0.0514] | |
| −0.1281 *** | 0.0361 | 3.5495 [0.0040] | |
| 2.2597 | 1.5697 | 1.4396 [0.1756] | |
| 5.5582 *** | 1.6339 | 3.4017 [0.0053] | |
| −0.2479 *** | 0.0424 | 5.8470 [0.0001] | |
| R-squared | 0.7782 | ||
| Adjusted R-squared | 0.6812 | ||
| Durbin–Watson statistics | 2.3357 | ||
| Serial correlation ( | 1.4428 [0.0681] | ||
| Normality ( | 0.5801 [0.7482] | ||
| Heteroskedasticity ( | 0.7787 [0.5268] | ||
Disclaimer/Publisher’s Note: The statements, opinions and data contained in all publications are solely those of the individual author(s) and contributor(s) and not of MDPI and/or the editor(s). MDPI and/or the editor(s) disclaim responsibility for any injury to people or property resulting from any ideas, methods, instructions or products referred to in the content. |
© 2024 by the author. Licensee MDPI, Basel, Switzerland. This article is an open access article distributed under the terms and conditions of the Creative Commons Attribution (CC BY) license (https://creativecommons.org/licenses/by/4.0/).
Share and Cite
Kim, S. The Effect of Information and Communication Technology on Electricity Intensity in Korea. Energies 2024, 17, 1906. https://doi.org/10.3390/en17081906
Kim S. The Effect of Information and Communication Technology on Electricity Intensity in Korea. Energies. 2024; 17(8):1906. https://doi.org/10.3390/en17081906
Chicago/Turabian StyleKim, Suyi. 2024. "The Effect of Information and Communication Technology on Electricity Intensity in Korea" Energies 17, no. 8: 1906. https://doi.org/10.3390/en17081906
APA StyleKim, S. (2024). The Effect of Information and Communication Technology on Electricity Intensity in Korea. Energies, 17(8), 1906. https://doi.org/10.3390/en17081906