Article

Analysis of Sediment Erosion in Pelton Nozzles and Needles Affected by Particle Size

1
China Three Gorges Construction Engineering Corporation, Chengdu 610095, China
2
State Key Laboratory of Hydroscience and Engineering & Department of Energy and Power Engineering, Tsinghua University, Beijing 100084, China
3
Dongfang Electric Machinery Co., Ltd., Deyang 618000, China
4
China Three Gorges Tibet Energy Investment Corporation, Chengdu 610095, China
*
Author to whom correspondence should be addressed.
Energies 2024, 17(7), 1635; https://doi.org/10.3390/en17071635
Submission received: 25 December 2023 / Revised: 21 March 2024 / Accepted: 22 March 2024 / Published: 28 March 2024
(This article belongs to the Special Issue Recent Advances in Hydro-Mechanical Turbines: Powering the Future)

Abstract

:
The sediment erosion of Pelton turbine components is a major challenge in the operation and development of high-head water resources, especially in mountainous areas with high sediment yield. In this paper, a study using numerical simulation was conducted with different sediment particle sizes in the fine sand range. And the erosion mechanism of the Pelton turbine injector was analyzed. The Eulerian Lagrange method was adopted to simulate the gas–liquid–solid flow. The Mansouri’s model was applied to estimate the injector erosion. The predicted erosion results were in accord with field erosion photographs. In particular, the asymmetrical erosion distribution on the needle surface was physically reproduced. With the sediment particle size increasing from 0.05 mm, the needle erosion rate decreased, while the nozzle casing erosion rate increased dramatically. In order to clarify this tendency, the characteristics of the three-phase flow were analyzed. Interestingly, the results show that with the rise in particle size, the separation of particles and water streamlines became more serious in the contraction section of the nozzle mouth. Consequently, it caused the enhancement of erosion of the nozzle surfaces and weakened the erosion of the needle surfaces. Significant engineering insights may be provided for weakening Pelton injector erosion with needle guides in the current study.

1. Introduction

Hydraulic turbines operating on rivers with heavy sediment, especially Pelton turbines, are subject to sediment erosion and cavitation erosion, which leads to deformation and damage of flow components and induces problems such as efficiency loss and vibration, which will threaten the safe operation of the turbines and cause huge economic losses [1,2,3]. Pelton turbines have the advantages of simple structure, high efficiency and a wide range of applicable head, so they are widely applied in the development of high-head and low flow rate hydropower resources. Suitable for super high water head and wide range applications (30–3000 m), Pelton turbines are deemed to play a crucial part in exploiting untapped potentials [4]. At the same time, Pelton turbines can be used in the application of ternary units, such as the Kops II HPP in Austria, in which Pelton turbines enable the optimal control range to be between zero and full load without major loss of efficiency. The ternary units can be widely employed in super-high-head pumped storage units [5]. One of the major challenges in employing Pelton turbines in heavy sediment regions is the sediment erosion of the hydraulic flow components, which often leads to efficiency loss and results in lower electricity generation [6,7]. The nozzle and needle are the core components of the injector. Although their structures are simple, they are the main devices used to control the Pelton turbine flow rate [8]. When the flow channel contracts, the accelerated high-velocity jet will allow sediment erosion to occur easily, making it one of the most severe erosion parts in the unit [9,10]. Due to the complex flow behaviors in a Pelton turbine, when the flow contains sediment particles, it is difficult to carry out experiments to observe the motion of particles with small diameters and low concentrations [11]. At present, there are several scholars adopting indirect methods to study particle flow behavior by studying erosion characteristics. The more common methods include suspension testing [12], erosion measurement [13,14,15] and the establishment of erosion prediction models [16].
The early studies on sediment erosion in Pelton turbines were mainly experimental. Bajracharya et al. [17] presented the profile of an eroded injector and analyzed the needle surface erosion distribution in detail. Padhy et al. [7] studied the influence of particles’ physical parameters on the Pelton turbine sediment erosion experimentally and found that the increase in particle size and concentration would increase erosion. Rai et al. [3,16] expanded Padhy et al.’s experimental research and studied the influence of particle size and other factors on Pelton turbine components’ erosion. It was found that a rise in particle diameter did not always increase the erosion rate, and when the particle size was larger than the critical value, the erosion rate would decrease, as shown in Figure 1, but there was still no reasonable explanation. Moreover, in this sediment particle size range, the erosion law is also the most controversial.
With the development of CFD, great progress has been made in the sediment-carrying flow simulation method of Pelton turbines. For the nozzle and needle of Pelton turbines, the VOF and Lagrange methods have been successfully applied to their internal flow with sediment simulation and erosion prediction [22,23]. Bajracharya et al. [17] conducted a long-term tracking measurement and analysis of sediment erosion in Chilime HPP and presented the quantitative relationship between the erosion amount of the flow components and the turbine efficiency decline. Ge et al. [24] analyzed sediment erosion characteristics of a Pelton turbine numerically and experimentally. Xiao et al. [25,26,27,28] studied the three-phase flow behaviors in a Pelton turbine and analyzed the motion process of sediment particles in it separately. Leguizamon et al. [29] developed a three-phase flow simulation for Pelton turbines based on the Lagrange method and indirectly verified the calculated results with measured erosion values. Tarodiya et al. [30,31] conducted erosion simulations of a Pelton turbine injector using CFD-DEM. Liu et al. [32] analyzed sediment erosion using numerical simulations.
Sediment erosion in turbines is an instantaneous and multiphase complex phenomenon, which is affected by the interaction of various parameters, such as particle size, density, hardness, shape, fluid viscosity and density [33,34,35,36,37], as well as the particle impact properties on the surface, that is, the impact angle, impact velocity and particle impact number [38,39,40]. Due to the difference in inertia force and drag force, particles with different sizes have different performances when exchanging momentum with the carrier fluid, resulting in differences in particle distribution, trajectory, impact angle and impact velocity, which thereby affect the erosion behaviors [41].
In this paper, the Eulerian Lagrange method combined with the VOF model was adopted to simulate the three-phase flow behaviors and erosion patterns for the Pelton nozzle and needle. Three typical medium particle sizes were selected in Figure 1 for numerical calculation and analysis, focusing on the influence of sediment particle size on the nozzle and needle erosion characteristics. Finally, through comprehensive analysis of the change in impact angle, impact number and impact velocity, the sediment erosion patterns of the nozzle and needle were quantitatively predicted and compared with the measured results. Interestingly, the results show that the opposite erosion variation law appears on the surface of the needle and nozzle casing with a rise in particle size. The novelty of this paper is that through the study of the three-phase flow behaviors in a Pelton turbine injector, the effect of sediment particle size on the nozzle and needle is disclosed. With the rise in particle size in the range (0.05, 0.25) mm, the average erosion rate of the needle gradually declines, while the average erosion rate of the nozzle casing gradually increases, which is significantly different from the previous general understanding. It is significant to study the sediment erosion characteristics of Pelton turbines to improve the turbine efficiency and operating stability of the units.

2. Numerical Model and Mathematical Model

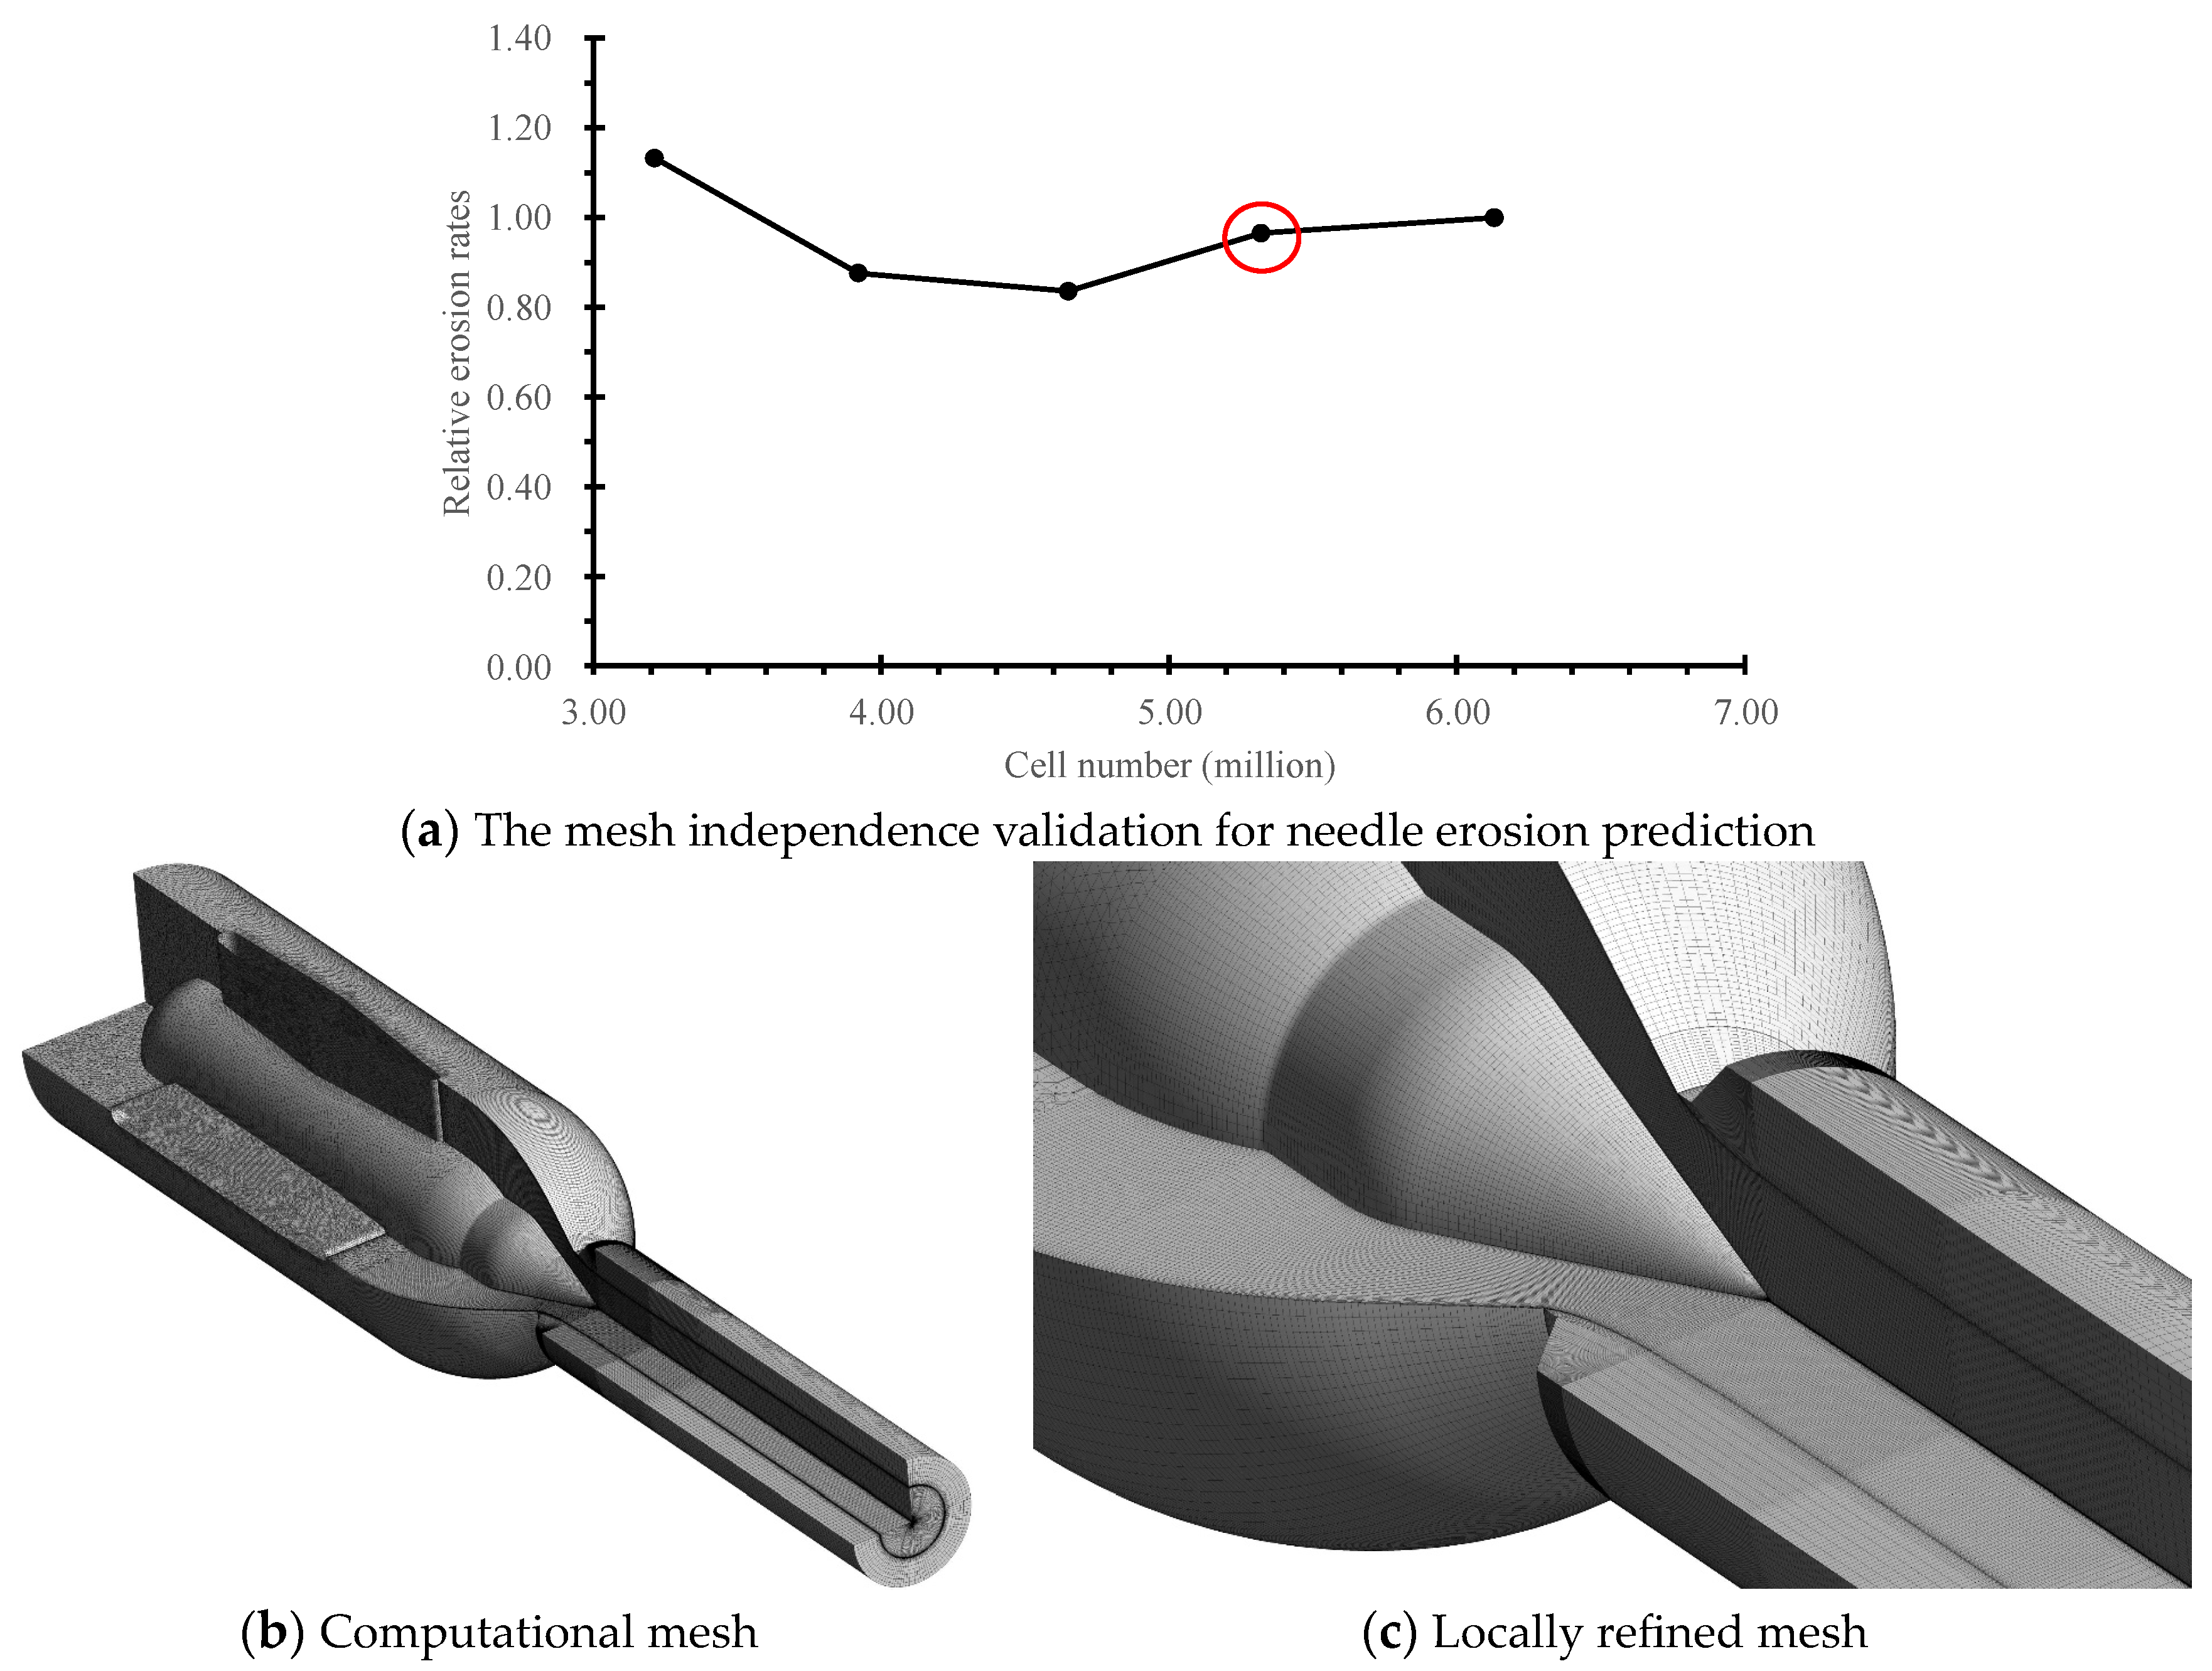
2.1. Computational Domain and Mesh

A Pelton injector with an additional blunt body was investigated in this paper, and its parameters are shown in Figure 2 and Table 1. The computational domains including the inlet pipe, injector and air domain are shown in Figure 2a. The diameter of the nozzle outlet is defined as d0. The length of the inlet pipe was extended to 15 d0 to make the water flow rate of the inlet stable. The length of the air domain located downstream of the nozzle outlet is 6 d0. The air domain only needs to capture the jet flow pattern, and the diameter value of 1.4 d0 is sufficient for this purpose. Moreover, 2 profiles of the needle surface and nozzle surface are labeled as “BS” and “CS”, respectively, as shown in Figure 2a. Two profiles in the potential erosion regions are applied in the quantitative analysis. To describe the injector opening, the stroke ratio (sn) defined as SN/d0 is often used, as presented in Figure 2b, where SN is the needle travel distance.

2.2. Numerical Mesh

In order to verify the mesh independence of sediment erosion prediction, this study generated four different sets of mesh. Mansouri’s erosion model [42] was adopted to estimate the erosion rate of the injector. As shown in Figure 3a, a mesh independence study is conducted. Its y-ordinate is the relative erosion rate, defined as the erosion rate divided by that of 5.32 million. It shows that the relative erosion rate of the needle does not change significantly beyond 5.32 million cells (circled in red). Consequently, the mesh number of 5.32 million was adopted in Figure 3b. Structured mesh is used in the nozzle regions that are near the outlet. To perform better measurements at the air–water interface, structured mesh is used in the air domain. Local mesh refinement was used in the area close to the needle tip and at the air–water interface, which allowed a more accurate prediction at the water–air interface before entering the rotating bucket domain, as shown in Figure 3c. The y+ of the nozzle and needle walls we are interested in is less than 40.

2.3. Sediment Particle Diameter and Concentration

According to the relation between the relative erosion rate and the particle diameter in Figure 1, the particle sizes Dp of 0.05 mm, 0.15 mm and 0.25 mm were chosen for the CFD simulations. Based on general observation data, this paper selected the average sediment concentration of a hydropower station in Southwest China for numerical simulation. The value of sediment concentration was 0.2 kg/m3, which was the arithmetical mean value during the three-month monitoring period. The sediment particle material is quartz with a density of 2650 kg/m3 and a Mohs hardness of 7.

2.4. Boundary Conditions and Erosion Model

The solver we used was the commercial code Fluent. The SIMPLE algorithm was adopted to couple the velocity and pressure fields. According to the reference [43,44], the turbulence model SST k-ω can be used to simulate the water and air flow in the Pelton turbine more accurately. Therefore, the SST k-ω turbulence model was adopted. Adopting the Eulerian Lagrange method, three-phase gas–liquid–solid flow and erosion simulations for a Pelton turbine injector were carried out. The VOF model was used to simulate water and air two-phase flow. As for boundary conditions, the outlet condition was set as a “pressure outlet” on the surface of the air domain. The inlet condition was set as “total pressure”, which had a value equal to the 1000 m operating water head. The volume fraction of air was 0 near the inlet. As for the walls of the injector, the non-slip condition was applied. Steady-state simulations were conducted.
The discrete phase model (DPM) was adopted to track particles. Particles entered the computational domain from the inlet, and the velocity of particles in the inlet was set to be consistent with the velocity of water flow. The sediment mass flow rate of particles was obtained from the sediment concentration mentioned in Section 2.3.
Based on Mansouri’s erosion model, the erosion rates on the needle and nozzle were obtained. The formulas for calculating the erosion rate are as follows [40]. And the impact angle is calculated by Formula (4). The numerical methods are consistent with those in our previous literature [25].
E r o s i o n   R a t e = C H B 0.59 F s v p 2.41 f ( θ )
f θ = A sin θ n 1 1 + H v n 3 ( 1 s i n ( θ n 2
H B = H v ( G P a ) + 0.1023 0.0108
θ = | a r c c o s n × u p n | u p | π 2 |

3. Analysis of the Three-Phase Flow Behavior and Erosion

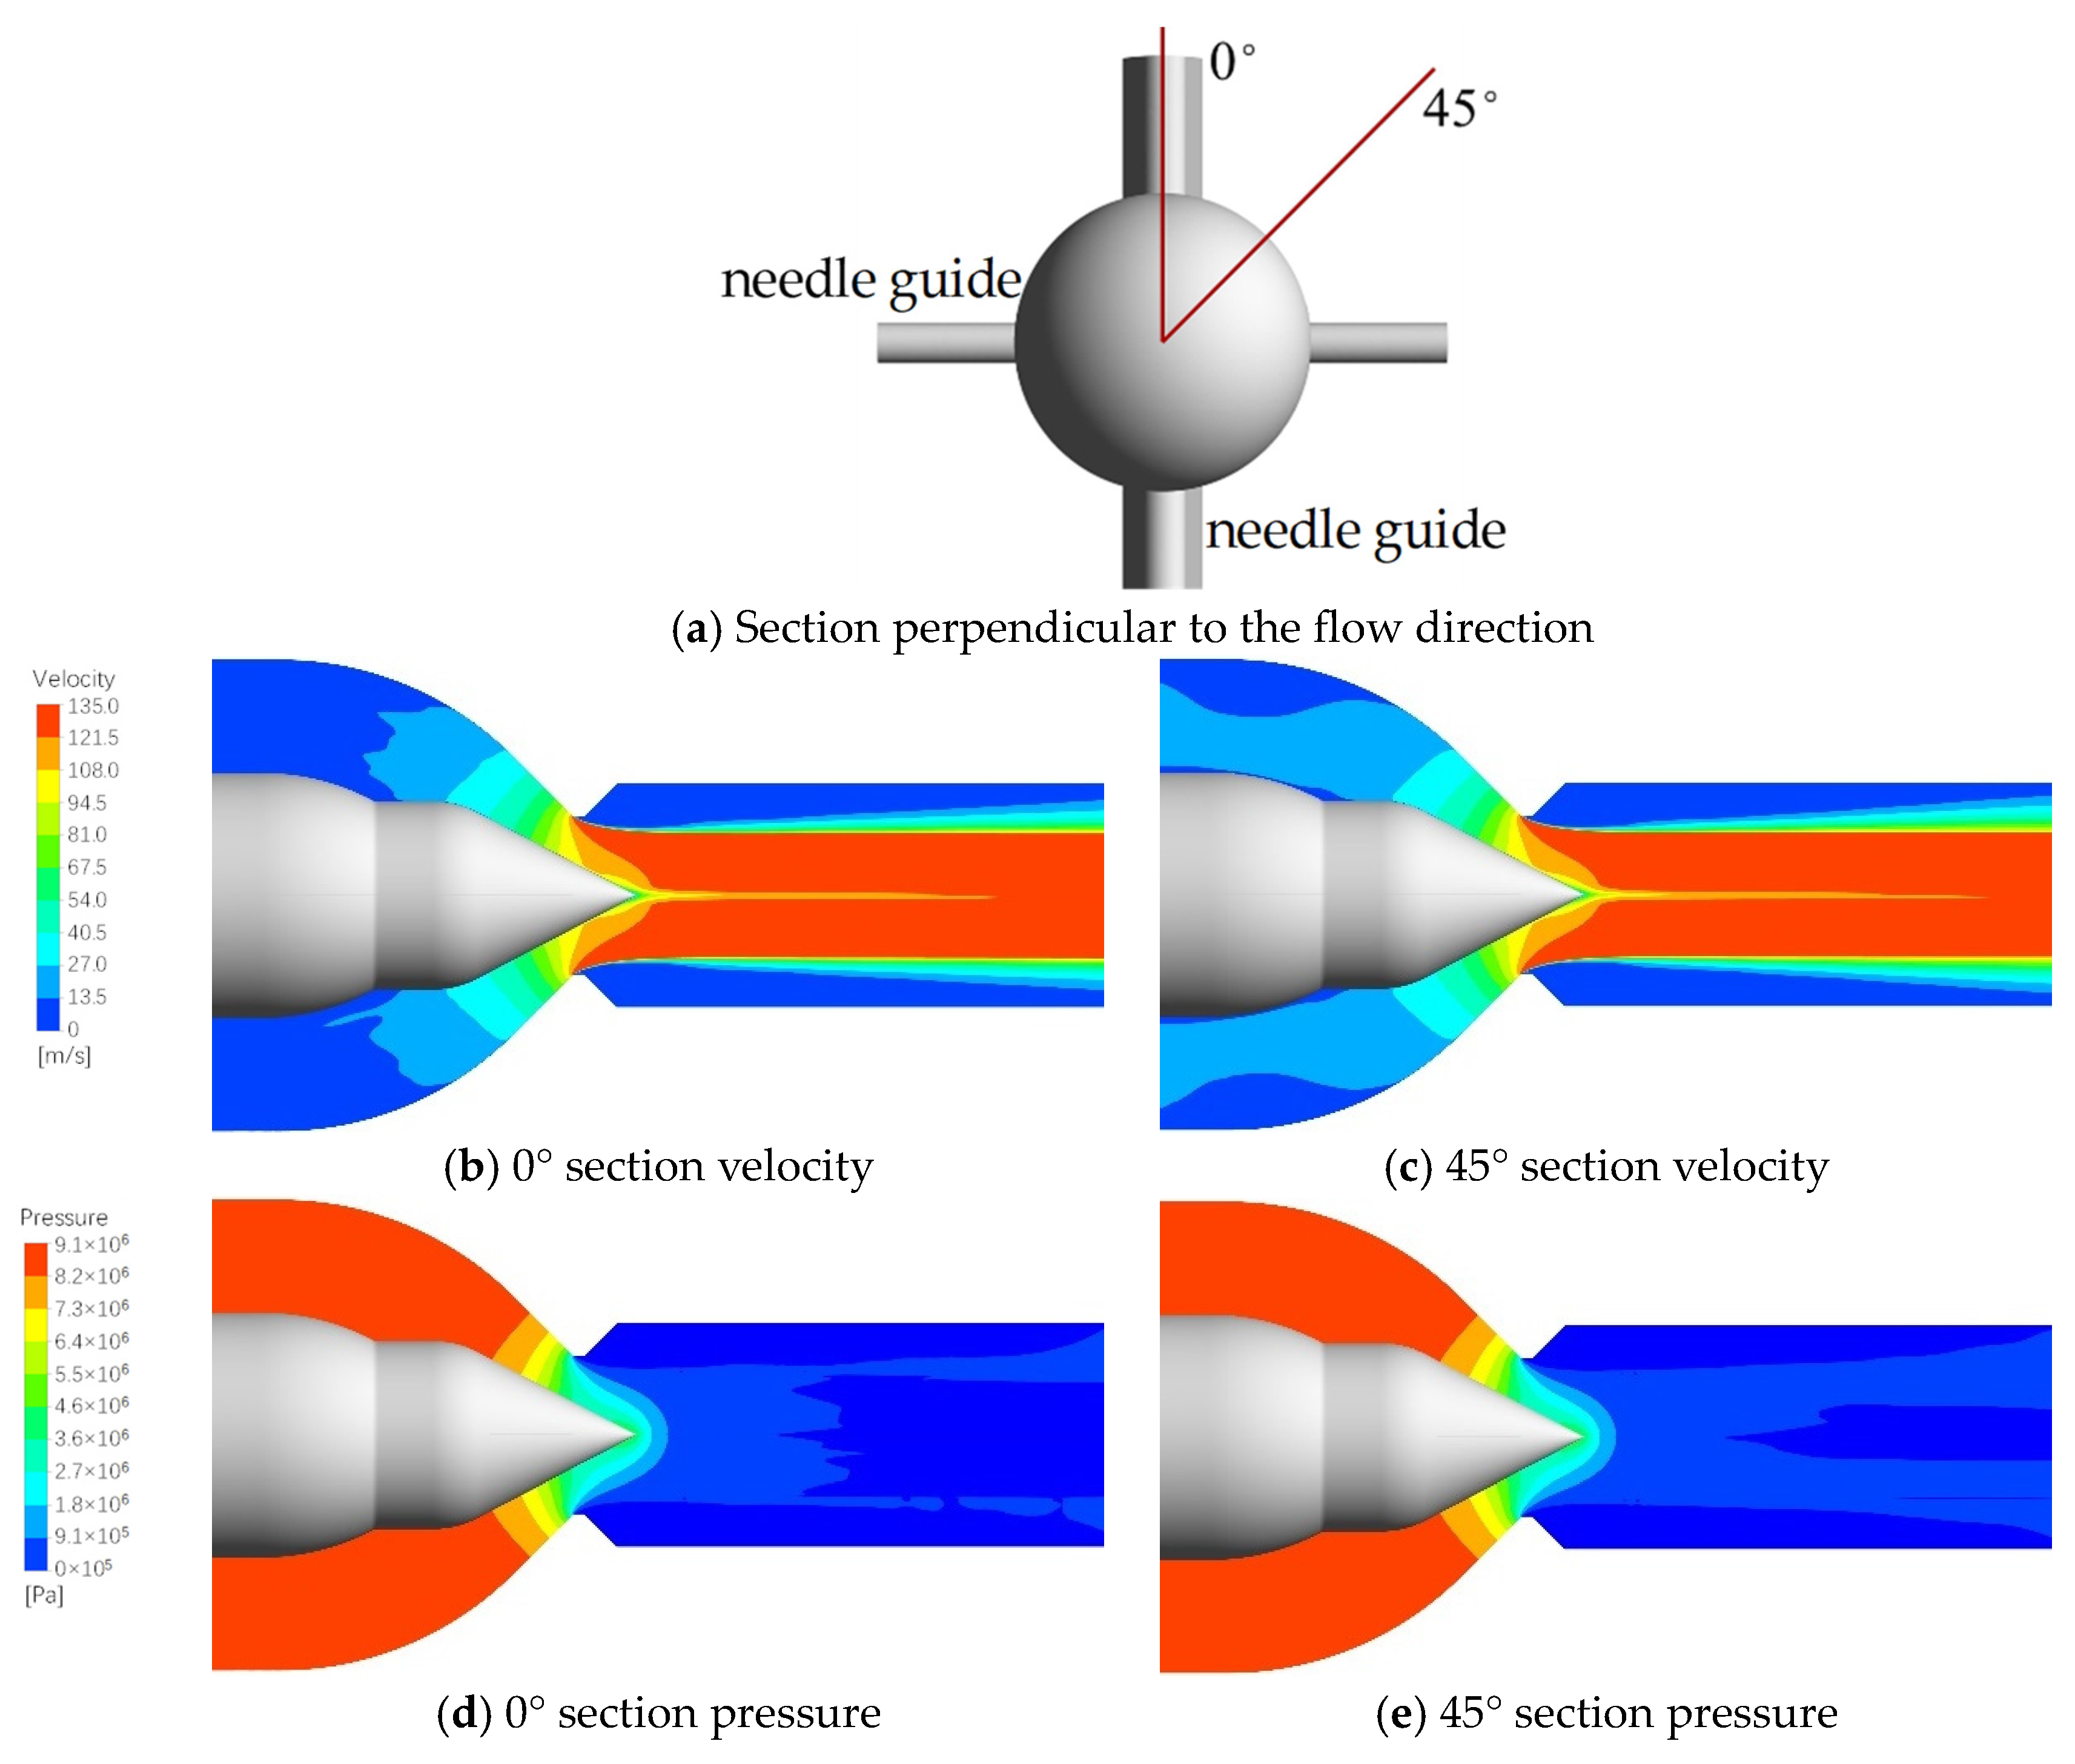
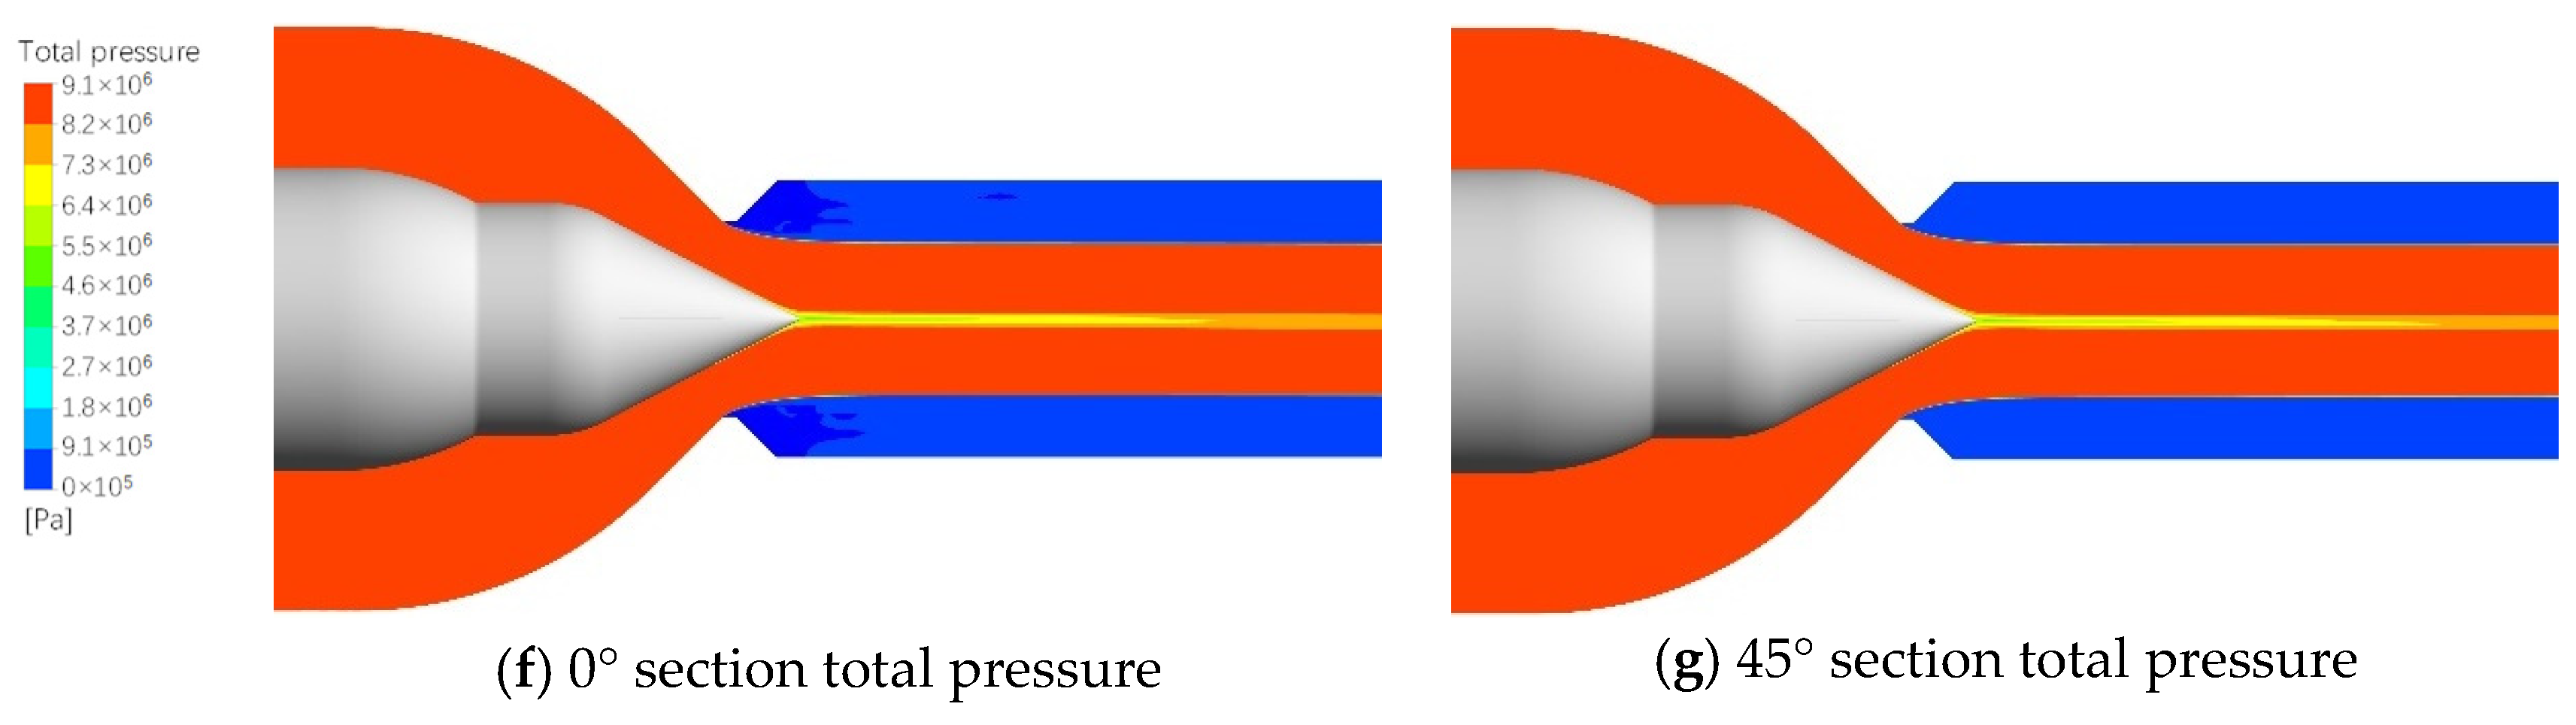
3.1. Three-Phase Flow Behaviors

The analysis of flow patterns was first carried out for different sediment particle sizes with the same needle stroke. Two axial planes at the position of 0° and 45° from the needle body were selected as the analysis sections, as shown in Figure 4a. Under the design operating head, the flow behaviors from the tube to the jet are shown in Figure 4b–g, which are the velocity, pressure and total pressure contours, respectively. The water flows from the inlet into the injector and then flows along the flow channel, passing by the needle guides. Near the injector outlet, the flow channel contracts; therefore, the water accelerates here and then becomes a free jet. After leaving the injector, the water flow begins to expand.
The velocity distribution contours of the 0° and 45° sections are given in Figure 4b,c. Affected by the needle guides, the water flow velocity distributions of the two sections in the injector are quite different. With the accelerated flow of water from the nozzle, an obvious low-velocity zone appears in the needle tip downstream because the boundary layer continuously develops on the needle surface. According to the static pressure results distributed in the two sections, there is a high-pressure region in the needle tip downstream due to the low-velocity region, as shown in Figure 4d,e. The low-velocity region of the tip also has an effect on the velocity of the jet domain, that is, the velocity distributed near the jet center is also lower. However, along the flow direction, this influence is gradually weakened, and the velocity of the jet center far away from the needle tip becomes more uniform. The low-velocity region in the needle tip downstream also significantly reduces the total pressure in the central region of the jet, as shown in Figure 4f,g.
In order to analyze the motion law of sediment particles, four sections were selected at four positions along the axis direction, as can be seen in Figure 5a. The coordinate point 0 of this figure is the exit position of the injector. Figure 5b–d shows the velocity and particle distribution contours of four sections with different particle sizes, respectively. The left side of each figure is the projected velocity in this section, and the right side is the particle distribution in this section.
The projected velocity shows that, in the −2d0 section, the secondary flow occurs positively downstream of each needle guide due to the presence of the needle guides. And there are two opposite vortexes at corresponding positions downstream of the needle guides. In the −d0 section, the flow velocity component perpendicular to the axis direction is the largest, which is mainly because the section is in the shrinking channel. The contraction of the flow channel will not only accelerate the main stream but also increase the perpendicular direction flow velocity significantly. And the vortex flow at the corresponding position downstream of the needle guides is no longer obvious. As can be seen from the sections of d0 and 2d0, the effect of needle guides increases on the free jet flow, and the secondary flows caused by vortexes around the four needle guides develop significantly in the downstream jet flow, causing multiple large-scale vortexes to appear in the corresponding region of each jet section. The vortexes near the outer edge of the jet interact with the air, thus affecting the shape of the water–air interface. Further downstream of the 2d0 section, the maximum velocity of the secondary flow gradually decreases, but the shape change of the water-air interface increases gradually.
The right sides of Figure 5b–d show the particle distribution with different particle sizes in four sections. Along the flow direction, with the change in particle size, the particle distribution in each section will also change. In the −2d0 section, the particle distribution is relatively uniform, and it is mainly different in the corresponding positions downstream of the needle guides. There is a narrow particle-sparse zone close to the blunt body, and with the particle size increasing, the needle guides will have a greater effect on the particle distributions. In the −d0 section, the particle distribution difference is significant, and the particle-sparse zone near the blunt body also increases significantly. With the rise in particle size, the particle-sparse zone is larger. In the d0 section, there is a particle-dense zone in the corresponding position downstream of the needle guides, while the particle-sparse zone near the blunt body is isolated into two sparse zones. With the rise in particle size, the areas of these two sparse zones gradually decrease. In the 2d0 section, the particle concentration area in the corresponding position downstream of the needle guides becomes larger, and the two sparse zones with sparse particle density are larger than in the previous section. With the particle size increasing, the particles tend to converge to the section center gradually, and the number of particles close to the jet surface decreases significantly. Compared with the projected velocity distribution, it is observed that the change in particle distribution is mainly influenced by the secondary flow.

3.2. Predicted Erosion Distribution and Comparison

According to the simulated results of the sediment impact angle, impact number and impact velocity on the surfaces of the injector, the final erosion patterns on the injector surfaces were estimated. The typical erosion patterns are shown in Figure 6, where Dp = 0.05 mm. Figure 7 shows the comparison of the predicted erosion results with the measured results from the literature. The photographs show the erosion patterns of the needle and nozzle of the Khimti Power Station (KHP-1) in the Himalayas area. Figure 7a shows the erosion of the needle, while Figure 7b shows the nozzle casing erosion. The predicted erosion distributions of the needle and nozzle show that the erosion of the needle mainly occurs on the needle tip, and severe erosion areas appear in corresponding positions downstream of the needle guides. As for the nozzle, the erosion of the contracting surface near the outlet is severe, but the erosion of the expanding surface is not severe. In general, the main erosion areas of the needle and nozzle are both near the outlet. It is interesting that the erosion distribution of the needle tip is asymmetrical. Xiao et al. and Thapa et al. [12,23,40] believe that the formation of severe erosion areas on needle tips was because of the shedding of von Kármán vortexes. The number of severe erosion areas on the needle tip is consistent with that of the needle guides, and Xiao et al. [27] explain the mechanism in detail.
There is a good consistency of sediment erosion patterns between the results predicted by simulations and the field observations. The numerical simulation also reproduces the phenomenon of asymmetrical erosion of the needle tip. Severe erosion areas appearing in corresponding positions downstream of the needle guides are consistent, circled in red in Figure 7. The good agreement between the numerical results and observations provides confidence in the numerical methods used in this paper.

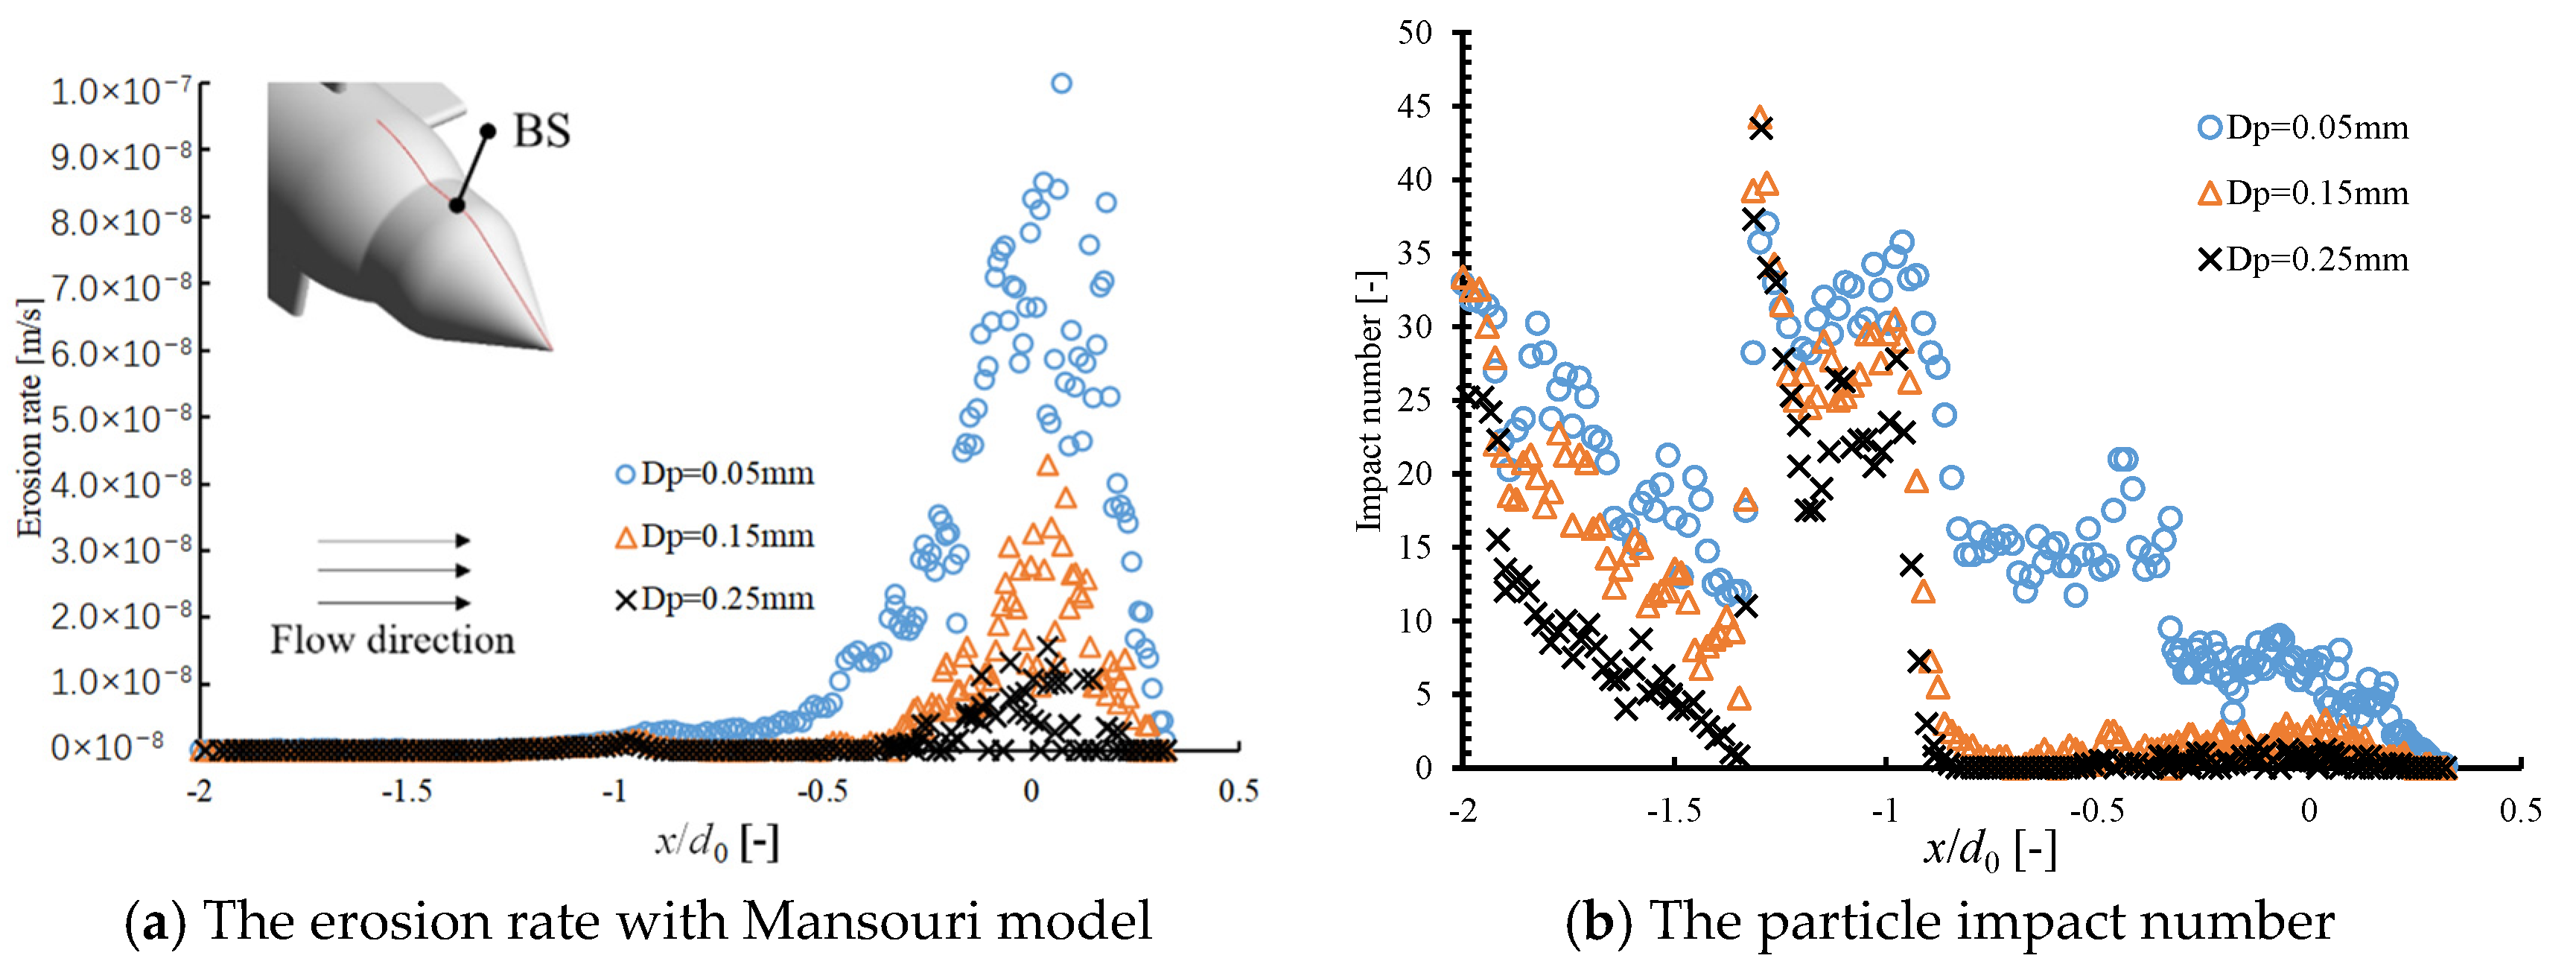
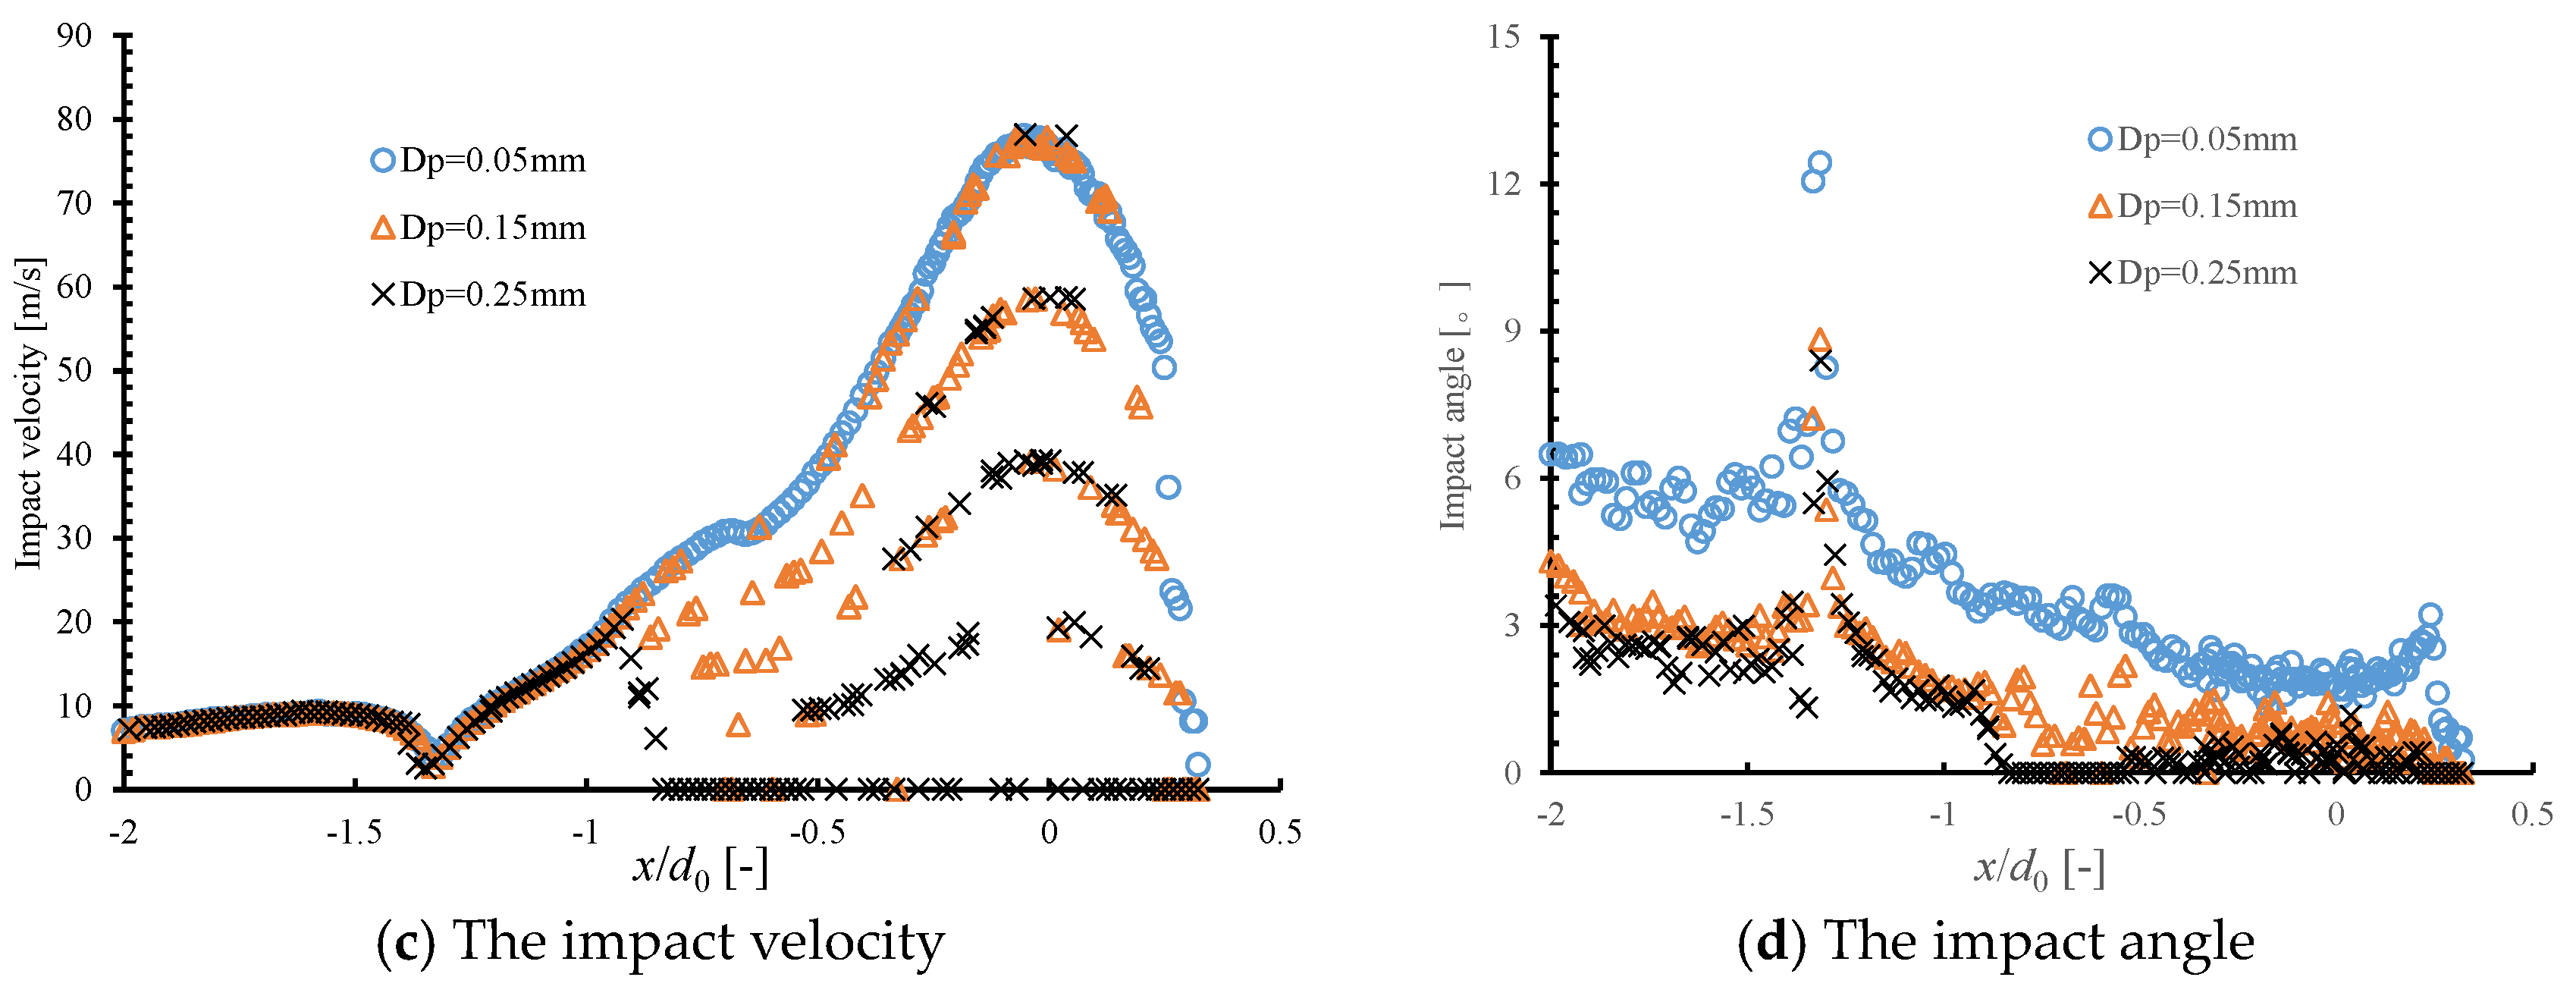
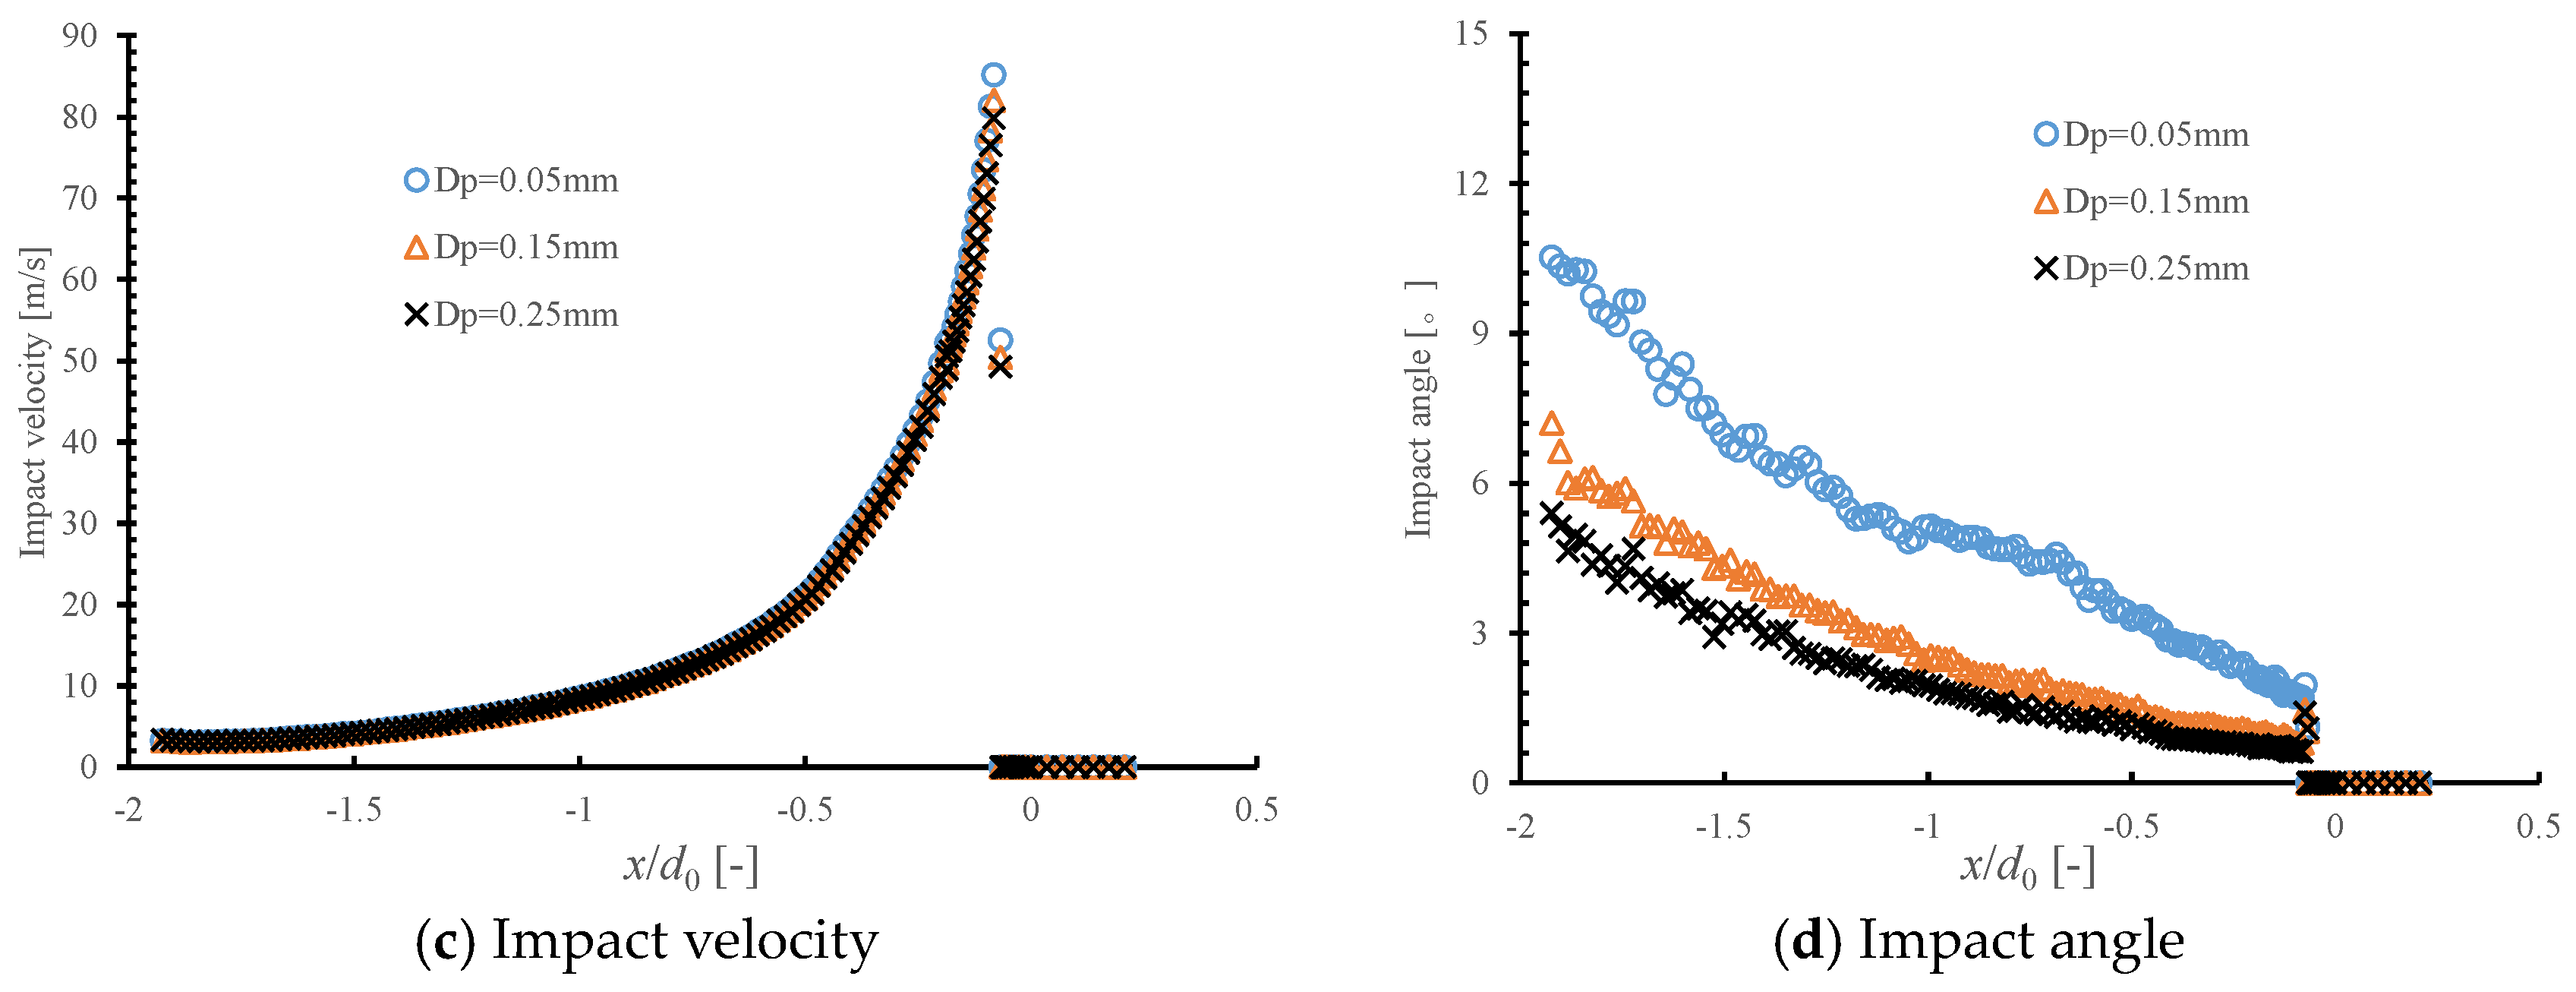
3.3. The Effect of Particle Size on Injector Erosion

When the particle size is different, the movement of particles in the injector is also affected differently by the water flow, so the motion trajectory of particles is different, which leads to the surface erosion patterns also changing. The erosion distributions of the nozzle and needle surfaces with different particle sizes are shown in Figure 8. Figure 8a–c show that the main severe erosion regions are distributed on the contracting surface, needle tip and nozzle mouth ring. More interestingly, with the particle size increasing, the erosion rate of the needle tip decreases rapidly, while the erosion rate of the nozzle casing increases rapidly, which is different from the conventional understanding.
By means of a quantitative method, the analysis of erosion rates on the needle and the nozzle casing surfaces with different particle sizes was conducted. Then, the analysis of impact properties including the impact number nimp, impact angle θ and impact velocity vp was carried out, which was used to show the erosion mechanism of the injector with different particle sizes. Figure 2a shows two profiles of the needle surface and nozzle surface labeled as “BS” and “CS”, respectively, which were selected for analysis. For convenience of description, a coordinate system is established with the position of the injector outlet as the origin, and the coordinates are dimensionless by the nozzle diameter d0, as shown in Figure 2b. The erosion was mainly located in the range of x ≈ −2d0 to 0.4d0. In Figure 9a and Figure 10a, erosion rates with different particle sizes along these profiles are shown, respectively. Clearly, the maximal erosion rates on the nozzle casing are higher than those on the needle. To analyze the erosion distributions, the erosion-related variables of vp, θ and nimp were shown and analyzed in Figure 9b–d and Figure 10b–d.
In Figure 9a, the tendency of erosion rate along the BS with different particle sizes is almost the same, firstly increasing and then decreasing. Furthermore, the impact properties in Figure 9b–d suggest that more particles impact with higher impact velocity and impact angle along the BS when Dp = 0.05 mm. Because the erosion rate is in proportion to vp and nimp, a larger impact number and impact velocity result in a higher erosion rate along the BS using the smallest particle size. When the sediment size Dp = 0.05 mm, the erosion rate increases slowly in the range of x (−2, −1) d0 and then increases sharply, reaching a peak value at the position x ≈ −0.07d0 and then falling down rapidly. For Dp = 0.15 mm and 0.25 mm, the erosion rate increases slowly in the range of x (−2, −0.3) d0 and then increases sharply, reaching a peak value at x ≈ −0.04d0 and then falling down rapidly. It can be seen by comparing the results of using different particle sizes that with sediment particle size increasing, the overall erosion rate and its maximum value decrease gradually.
In Figure 10a, the tendency of erosion rate along the CS is almost the same with different particle sizes; firstly, it is almost zero, then increases rapidly and, finally, decreases sharply to 0 along the flow direction, which is in good agreement with the field photograph in Figure 7b. As for the particle impact number, the trend of different particle sizes is similar, generally increasing first and then decreasing. With sediment particle size increasing, the particle impact number generally increases gradually. As for the impact velocity, the trend of different particle sizes is nearly the same, generally increasing first and then decreasing sharply to 0, and with different sediment particle sizes, the impact velocities are almost the same. As for the impact angle, the trend of different particle sizes is almost the same, generally decreasing to 0. With sediment particle size increasing, particle impact angle generally decreases gradually. Figure 10b–d show that during flow channel expansion, particle impact number, impact velocity and impact angle drop to nearly 0, therefore reducing the erosion significantly. When the sediment size Dp = 0.25 mm, the erosion rate increases slowly in the range of x (−2, −0.5) d0 and then increases sharply, reaching a peak value at x ≈ −0.08d0 and then falling down rapidly. For Dp = 0.05 mm and 0.15 mm, the erosion rate increases slowly in the range of x (−2, −0.0.5) d0 and then increases sharply, reaching a peak value at x ≈ −0.04d0 and then falling down rapidly. With sediment particle size increasing, the overall erosion rate and its maximum value increase gradually.
Table 2 shows the average erosion rate, vp, nimp and θ of the needle surface and nozzle casing with different particle sizes, respectively.
The averaged erosion rates of the nozzle casing are about ten times those of the needle surface, except for the case where Dp = 0.05 mm. With the rise in sediment size, the average erosion rate on the needle tip will gradually decrease, while the nozzle casing’s rate will gradually increase. It is interesting that, for the Pelton injector, the erosion variation law on the needle surface and nozzle casing is opposite to the rise in particle size, which is different from the previous general understanding, as shown in Figure 1. With the rise in sediment size, the impact number on the needle surface decreases gradually, while on the nozzle casing, it increases significantly. The impact number on the nozzle casing is about five times that of the needle surface at Dp = 0.05 mm and increases to more than 20 times at Dp = 0.25 mm, while their impact angles are almost the same. Furthermore, Figure 10b–d suggest that more particles impact with a higher impact angle along the CS when the Dp = 0.25 mm. Because the erosion rate is in proportion to θ and nimp, when the value of θ is small, a larger impact number and impact angle result in a higher erosion rate along the CS with the largest particle size. As shown in Table 2, average erosion rates along the CS are bigger than those along the BS. In addition, since severe erosion regions on the nozzle casing surface are mainly located in a small area whose range is x (−0.2, 0) d0, it is harder to visualize the asymmetrical erosion of the nozzle casing surface.

4. Conclusions

The erosion simulation for a Pelton turbine injector has been carried out, and the influence of sediment size on erosion characteristics of the nozzle and needle was discussed in detail. Meanwhile, the flow process of water and the influence of secondary flow on the distribution of particles were analyzed, respectively.
In the sediment size range (0.05, 0.25) mm, as the particle size increases, the surfaces of the needle and nozzle casing show opposite variation trends in erosion rate. With the rise in particle size, the average erosion rate of the needle gradually declines, while the average erosion rate of the nozzle casing gradually increases. Interesting results show that, as for the Pelton injector, the opposite result appears in the erosion variation law on the surface of the needle and nozzle casing with the rise in particle size, which is significantly different from the previous general understanding. The increase in particle size would strengthen the tendency of particle separation in the internal flow of the injector mechanism, which dramatically enhances the impact frequency on the nozzle casing and reduces the impact frequency on the needle surface. Thus, the erosion rate of the nozzle casing and needle is lifted and lowered, respectively.
The sediment particle size varies among different river basins, and sediment erosion of the injector of the Pelton turbine is commonly observed. Sediment erosion causes damage to the surface structure of flowing components and deteriorates the jet quality, affecting the overall efficiency of the unit. Aiming at the goal of reducing the efficiency loss caused by erosion, the results of this study may provide a reference for further methods to be conducted to alleviate sediment erosion, such as focusing on suppressing the erosion caused by particles with smaller sizes, as well as applying surface coatings to areas with severe sand erosion.

Author Contributions

J.L. conceived the idea and study design, Y.Z. performed the simulations and prepared the manuscript; Q.L. was in charge of data analysis and supervision; Y.X. conceived the idea and took part in the study design and supervision; Z.L. and H.L. performed the literature review and wrote the manuscript; J.Y. and N.Y. provided some funding and data analysis; H.D. and Q.D. searched the literature, collected data and wrote the manuscript. All authors have read and agreed to the published version of the manuscript.

Funding

The National Natural Science Foundation of China (No. 52279088), the China Three Gorges Corporation Science and Technology Project (No. SXXZ/0416) and the Research Fund Program of State Key Laboratory of Hydroscience and Engineering (sklhse-2022-KY-06, sklhse-2023-E-04) are gratefully acknowledged for supporting the present work.

Data Availability Statement

Data are contained within the article.

Conflicts of Interest

J.L., H.L., N.Y., H.D. and Q.D. were employed by China Three Gorges Construction Engineering Corporation. Q.L. was employed by Dongfang Electric Machinery Co., Ltd. Z.L. and J.Y. were employed by China Three Gorges Tibet Energy Investment Corporation. The remaining authors declare that the research was conducted in the absence of any commercial or financial relationships that could be construed as a potential conflict of interest. The authors declare that this study received funding from China Three Gorges Corporation. The funder was not involved in the study design, collection, analysis, interpretation of data, the writing of this article or the decision to submit it for publication.

References

  1. Sun, J.; Ge, X.F.; Zhou, Y.; Liu, D.; Liu, J.; Li, G.; Zheng, Y. Research on synergistic erosion by cavitation and sediment: A review. Ultrason. Sonochem. 2023, 95, 106399. [Google Scholar] [CrossRef] [PubMed]
  2. Wang, Y.; Wu, J.; Ma, F. Cavitation–silt erosion in sand suspensions. J. Mech. Sci. Technol. 2018, 32, 5697–5702. [Google Scholar] [CrossRef]
  3. Rai, A.K.; Kumar, A.; Staubli, T. Analytical modelling and mechanism of hydro-abrasive erosion in Pelton buckets. Wear 2019, 436, 203003. [Google Scholar] [CrossRef]
  4. Zhang, Z. Pelton Turbine; Springer: Berlin/Heidelberg, Germany, 2016. [Google Scholar]
  5. Nag, S.; Lee, K.Y. Network and Reserve Constrained Economic Analysis of Conventional, Adjustable-Speed and Ternary Pumped-Storage Hydropower. Energies 2020, 13, 4140. [Google Scholar] [CrossRef]
  6. Rai, A.K.; Kumar, A.; Staubli, T. Hydro-abrasive erosion in Pelton buckets: Classification and field study. Wear 2017, 392–393, 8–20. [Google Scholar] [CrossRef]
  7. Padhy, M.K.; Saini, R.P. Study of silt erosion on performance of a Pelton turbine. Energy 2011, 36, 141–147. [Google Scholar] [CrossRef]
  8. Morales, A.M.B.; Pachón, I.F.; Loboguerrero, J.U.; Medina, J.A.; Escobar, J.A.G. Development of a test rig to evaluate abrasive wear on Pelton turbine nozzles. A case study of Chivor hydropower. Wear 2017, 372–373, 208–215. [Google Scholar] [CrossRef]
  9. Din, U.D.; Mohammad, Z.; Harmain, G.A. Assessment of erosive wear of Pelton turbine injector: Nozzle and spear combination—A study of Chenani hydro-power plant. Eng. Fail. Anal. 2020, 116, 104695. [Google Scholar] [CrossRef]
  10. Sangal, S.; Singhal, M.K.; Saini, R.P. Hydro-abrasive erosion in hydro turbines: A review. Int. J. Green Energy 2018, 15, 232–253. [Google Scholar] [CrossRef]
  11. Abgottspon, A.; Staubli, T.; Felix, D. Erosion of Pelton buckets and changes in turbine efficiency measured in the HPP Fieschertal. IOP Conf. Ser. Earth Environ. Sci. 2016, 49, 122008. [Google Scholar] [CrossRef]
  12. Felix, D.; Albayrak, I.; Abgottspon, A.; Boes, R.M. Hydro-abrasive erosion of hydraulic turbines caused by sediment—A century of research and development. IOP Conf. Ser. Earth Environ. Sci. 2016, 49, 122001. [Google Scholar] [CrossRef]
  13. Felix, D. Experimental Investigation on Suspended Sediment, Hydro-Abrasive Erosion and Efficiency Reductions of Coated Pelton Turbines. Ph.D. Thesis, ETH Zurich, Zürich, Switzerland, 2017. [Google Scholar]
  14. Rai, A.K.; Kumar, A. Continuous measurement of suspended sediment concentration: Technological advancement and future outlook. Measurement 2015, 76, 209–227. [Google Scholar] [CrossRef]
  15. Thapa, B. Sand Erosion in Hydraulic Machinery. Ph.D. Thesis, Norwegian University of Science and Technology (NTNU), Trondheim, Norway, 2004. [Google Scholar]
  16. Rai, A.K.; Kumar, A.; Staubli, T.; Xiao, Y. Interpretation and application of the hydro-abrasive erosion model from IEC 62364 (2013) for Pelton turbines. Renew. Energy 2020, 160, 396–408. [Google Scholar] [CrossRef]
  17. Bajracharya, T.; Acharya, B.; Joshi, C.; Saini, R.; Dahlhaug, O. Sand erosion of Pelton turbine nozzles and buckets: A case study of Chilime Hydropower Plant. Wear 2008, 264, 177–184. [Google Scholar] [CrossRef]
  18. Nozaki, T. Estimation of Repair Cycle of Turbine Due to Abrasion Caused by Suspended Sand and Determination of Desilting Basin Capacity; Japan International Cooperation Agency: Tokyo, Japan, 1990. [Google Scholar]
  19. Sulzer Hydro. Ein Semi-Empirisches Abrasionsmodell zur Vorhersage von Hydro-Abrasivem Verschleiß an X5 CrNi 13/4 Stahl (a Semi-empirical Model to Predict Hydro-Abrasive Wear on Strainless Turbine Steel); Bericht Nr. STT.TB94.020; partially published in 2006; DWA: Hennef, Germany, 1996. (In German) [Google Scholar]
  20. Winkler, K.; Parkinson, E.; Dekumbis, R.; Rentschler, M.; Garcin, H. Understanding Hydro-Abrasive Erosion. In Proceedings of the Hydro Conference, Prague, Czech Republic, 17–19 October 2011. [Google Scholar]
  21. Padhy, M.K.; Saini, R.P. Effect of size and concentration of silt particles on erosion of Pelton turbine buckets. Energy 2009, 34, 1477–1483. [Google Scholar] [CrossRef]
  22. Zeng, C.J.; Xiao, Y.X.; Zhu, W.; Yao YYCal, L.; Wang, Z.W. Pelton turbine Needle erosion prediction based on 3D three- phase flow simulation. IOP Conf. Ser. Earth Environ. Sci. 2014, 22, 052019. [Google Scholar]
  23. Messa, G.V.; Mandelli, S.; Malavasi, S. Hydro-abrasive erosion in Pelton turbine injectors: A numerical study. Renew. Energy 2019, 130, 474–488. [Google Scholar] [CrossRef]
  24. Ge, X.F.; Sun, J.; Li, Y.; Wu, D.; Zhang, L.; Hua, H. Numerical simulation of silt erosion characteristics of an injector of Pelton turbine. J. Hydraul. Eng. 2020, 51, 1486–1494. [Google Scholar]
  25. Guo, B.; Xiao, Y.X.; Rai, A.K.; Zhang, J.; Liang, Q. Sediment-laden flow and erosion modeling in a Pelton turbine injector. Renew. Energy 2020, 162, 30–42. [Google Scholar] [CrossRef]
  26. Guo, B.; Xiao, Y.; Rai, A.K.; Liang, Q.; Liu, J. Analysis of the air-water-sediment flow behavior in Pelton buckets using a Eulerian-Lagrangian approach. Energy 2021, 218, 119522. [Google Scholar] [CrossRef]
  27. Xiao, Y.X.; Guo, B.; Rai, A.K.; Liang, Q.W.; Liu, J.; Zhang, J. Analysis of hydro-abrasive erosion in Pelton buckets using a Eulerian-Lagrangian approach. Renew. Energy 2022, 197, 472–485. [Google Scholar] [CrossRef]
  28. Shrivastava, N.; Rai, A.K.; Abbas, A.; Xiao, Y. Analysis of hydro-abrasive erosion in a high-head Pelton turbine injector using a Eulerian-Lagrangian approach. Proc. Inst. Mech. Eng. Part A J. Power Energy 2024. [Google Scholar] [CrossRef]
  29. Leguizamón, S.; Alimirzazadeh, S.; Jahanbakhsh, E.; Avellan, F. Multiscale simulation of erosive wear in a prototype-scale Pelton runner. Renew. Energy 2020, 151, 204–215. [Google Scholar] [CrossRef]
  30. Tarodiya, R.; Khullar, S.; Levy, A. Particulate flow and erosion modeling of a Pelton turbine injector using CFD-DEM simulations. Powder Technol. 2022, 399, 117168. [Google Scholar] [CrossRef]
  31. Tarodiya, R.; Khullar, S.; Levy, A. Assessment of erosive wear performance of Pelton turbine injectors using CFD-DEM simulations. Powder Technol. 2022, 408, 117763. [Google Scholar] [CrossRef]
  32. Liu, J.; Pang, J.; Liu, X.; Huang, Y.; Deng, H. Analysis of Sediment and Water Flow and Erosion Characteristics of Large Pelton Turbine Injector. Processes 2023, 11, 1011. [Google Scholar] [CrossRef]
  33. IEC 62364:2013; Hydraulic Turbines-Guide for Dealing with Hydro-Abrsive Erosion in Kaplan, Francis and Pelton Turbines. International Electrotechnical Commission: Geneva, Switzerland, 2013.
  34. Finnie, I. Erosion of surfaces by solid particles. Wear 1960, 3, 87–103. [Google Scholar] [CrossRef]
  35. Grant, G.; Tabakoff, W. Erosion Prediction in Turbomachinery Resulting from Environmental Solid Particles. J. Aircr. 1975, 12, 471–478. [Google Scholar] [CrossRef]
  36. Zhang, J.; Darihaki, F.; Shirazi, S.A. A comprehensive CFD-based erosion prediction for sharp bend geometry with examination of grid effect. Wear 2019, 430–431, 191–201. [Google Scholar] [CrossRef]
  37. Zhang, J.; McLaury, B.S.; Shirazi, S.A. Modeling sand fines erosion in elbows mounted in series. Wear 2018, 402–403, 196–206. [Google Scholar] [CrossRef]
  38. Padhy, M.K.; Saini, R.P. Study of silt erosion mechanism in Pelton turbine buckets. Energy 2012, 39, 286–293. [Google Scholar] [CrossRef]
  39. Oka, Y.I.; Okamura, K.; Yoshida, T. Practical estimation of erosion damage caused by solid particle impact. Wear 2005, 259, 95–101. [Google Scholar] [CrossRef]
  40. Vieira, R.E.; Mansouri, A.; McLaury, B.S.; Shirazi, S.A. Experimental and computational study of erosion in elbows due to sand particles in air flow. Powder Technol. 2016, 288, 339–353. [Google Scholar] [CrossRef]
  41. Nguyen, V.; Nguyen, Q.; Zhang, Y.; Lim, C.; Khoo, B. Effect of particle size on erosion characteristics. Wear 2016, 348–349, 126–137. [Google Scholar] [CrossRef]
  42. Zhao, X.; Luo, Y.; Wang, Z.; Xiao, Y.; Avellan, F. Unsteady Flow Numerical Simulations on Internal Energy Dissipation for a Low-Head Centrifugal Pump at Part-Load Operating Conditions. Energies 2019, 12, 2013. [Google Scholar] [CrossRef]
  43. Benzon, D.; Židonis, A.; Panagiotopoulos, A.; Aggidis, G.A.; Anagnostopoulos, J.S.; Papantonis, D.E. Impulse Turbine Injector Design Improvement Using Computational Fluid Dynamics. J. Fluids Eng. 2015, 137, 041106. [Google Scholar] [CrossRef]
  44. Semlitsch, B. Effect of inflow disturbances in Pelton turbine distributor lines on the water jet quality. Int. J. Multiph. Flow 2024, 174, 104786. [Google Scholar] [CrossRef]
Figure 1. Turbine relative erosion rate (RER) as a function of the particle diameter [16,17,18,19,20,21]. (a) RER (Nozaki 1990); (b) RER (Rai 2020); (c) RER (Sulzer Hydro 1996); (d) RER (Winkler 2011); (e) RER (Bajracharya 2008); (f) RER (Padhy 2009).
Energies 17 01635 g001
Figure 2. Schematic diagrams of a Pelton turbine injector and the simulation domain.
Energies 17 01635 g002
Figure 3. Mesh for the computational domain.
Energies 17 01635 g003
Figure 4. Distribution of the flow from the tube to the jet.
Energies 17 01635 g004aEnergies 17 01635 g004b
Figure 5. Flow and particle distribution of the injector and jet sections for different particle sizes.
Energies 17 01635 g005
Figure 6. Sediment erosion distribution at needle tip and nozzle, where Dp = 0.05 mm.
Energies 17 01635 g006
Figure 7. Numerical results and observations of injector sediment erosion [15].
Energies 17 01635 g007
Figure 8. Erosion distributions of the needle and nozzle casing with different particle sizes.
Energies 17 01635 g008aEnergies 17 01635 g008b
Figure 9. Erosion-related variables with different particle sizes on needle surfaces.
Energies 17 01635 g009aEnergies 17 01635 g009b
Figure 10. Erosion-related variables with different particle sizes on nozzle casing.
Energies 17 01635 g010aEnergies 17 01635 g010b
Table 1. Parameters of the injector and Pelton turbine.
ParameterDescription (Unit)
Injector number6 (-)
Angle of injector casing90 (°)
Output power900 MW
Bucket number22 (-)
Rotational speed214.3 (rpm)
Operating head1000 (m)
Unit speed39.86 (rpm)
MaterialStainless steel (-)
Table 2. The average erosion rate, vp, nimp and θ with different particle sizes.
Average ValueNeedle SurfaceNozzle Casing
Particles size0.05 mm0.15 mm0.25 mm0.05 mm0.15 mm0.25 mm
Erosion rate (m/s)2.09 × 10−85.68 × 10−91.47 × 10−91.65 × 10−82.47 × 10−83.51 × 10−8
Impact velocity vp (m/s)37.528.013.419.318.918.6
Impact number nimp14.98.625.4575.8108121
Impact angle θ (°)3.491.621.074.262.321.75
Disclaimer/Publisher’s Note: The statements, opinions and data contained in all publications are solely those of the individual author(s) and contributor(s) and not of MDPI and/or the editor(s). MDPI and/or the editor(s) disclaim responsibility for any injury to people or property resulting from any ideas, methods, instructions or products referred to in the content.

