1. Introduction
Electric drive systems have been used in transportation for almost 200 years. However, these systems were not always popular among designers. The over-100-year period of dominance of heat engines has resulted in sidelining many issues related to the operation of electric drive systems. Optimizing the energy consumption of a vehicle with an electric drive is an issue that makes the operation of this kind of transport even more attractive and enhances the advantages of this type of drive, such as no emissions of pollution gases at the place of vehicle operation, no oxygen consumption, no noise emission, reduction of dust from the mechanical braking system, high energy conversion efficiency, low operating costs, high drive dynamics due to high torque and low time constant of the electric motor, and reducing dependence on the availability of petroleum products and manipulation of their market prices.
Compromise solutions have been sought during design of electric vehicle drive systems. The trade-offs concern the costs of using a given technology related to the electric drive system and vehicle structure and the energy consumption necessary to move the vehicle. An important issue related to obtaining optimal energy consumption results during vehicle operation is the process of integration of the elements of the electric drive system, including the design stage [
1,
2,
3], selection of components [
4,
5,
6], construction of the vehicle’s supporting structure, and verification of vehicle parameters and operation [
7,
8,
9,
10]. Activities related to the optimization of energy consumption by an electric vehicle can be implemented by optimizing the weight of the vehicle’s supporting structure, reducing the aerodynamic resistance of the vehicle, reducing the rolling resistance of the vehicle, development of control algorithms for the electric drive system, the use of a gearbox with additional gears, the employment of a direct in-wheel drive, thermal conditioning of components of the vehicle’s electric drive system operation (heating/cooling of the energy store) [
11,
12], optimization of electric drive system components (minimizing weight, maximizing efficiency) [
13], and optimization of batteries used in the vehicle energy store by maximizing the energy density obtained from a given type of batteries [
14]. Driving and maintenance also has a significant impact on the consumption of electricity during vehicle operation, through the control of the vehicle cabin heating system or elements of the electric drive system [
15,
16], tire pressure, acts of lowering side windows and using other structural elements of the vehicle while driving, the driver’s driving style, which should be consistent with the principles of eco-driving techniques [
17,
18,
19], and in relation to other aspects such as, for example, artificial intelligence methods [
20,
21].
In order to reduce the vehicle’s energy consumption during operation, it is possible to use advisory systems whose task is to support the driver’s decisions while driving the vehicle. Previous work [
22] has included a method for determining the optimal driving route for an electric car using an inversion-based approach. Optimal vehicle speed changes determined using a sequential quadratic programming algorithm were presented [
23]. Similarly, in [
24,
25] it was proposed to use a wireless communication system between vehicles and the road infrastructure in a given area, and between the vehicles themselves, in order to exchange information and notify the drivers about the speed at which they should move on a given section of the route, so that energy consumption would be as small as possible. An advisory system for drivers using economic driving techniques, formulated as an optimization problem consisting of minimizing energy consumption related to the operation of the vehicle over a time and distance horizon, was discussed [
26]. A predictive vehicle reference model used to determine the optimal speed while traveling along a specific route was proposed [
27,
28,
29]. A system teaching the driver the rules of economic driving was presented [
30]. In other work [
31], a mobile phone with the Android system was used to analyze and display information for the driver about their current driving style, including whether it complied with the principles of economic driving, based on information read by the vehicle’s OBD diagnostic interface. A similar solution using information from the CAN bus through the OBD diagnostic interface was discussed [
32]. In other research, [
33] an energy management system in a hybrid vehicle using a supercapacitor was presented, the application of which allowed a reduction in fuel consumption by approximately 24% compared with an internal combustion engine vehicle. Research was also conducted on a fuzzy system for managing energy consumption from fuel cells and supercapacitors, using a self-learning neural network to recognize drivers’ driving styles [
34]. In the same solution, an algorithm for recognizing the driver’s driving style and assigning it to one of three available driver profiles was tested using unsupervised machine learning, which allowed its implementation and experimental verification in real vehicles.
An advisory system for predicting vehicle speed, based on a self-learning neural network that remembers driving routes and the driver’s style, was presented [
35]. Strategies for ecological driving of autonomous vehicles aimed at increasing the efficiency of energy consumption have been discussed [
36]. Similar topics were presented in [
37], with a system that warns the driver in real time about maintaining the optimal speed, which should be maintained on each section of the road in order to optimize the energy consumption of the vehicle. In another solution [
38], dynamic programming methods were used to develop a predictive driver assistance system for a hybrid electric vehicle, the task of which is to suggest the optimal speed. A more extensive solution based on road information systems was also presented [
39]. In [
40], a driver assistance system using non-linear predictive control was presented, for which penalty functions were developed in order to optimally maintain the vehicle speed depending on road conditions. The method of selecting the optimal route through advisory systems for electric vehicles is discussed in [
41,
42,
43].
A separate group of solutions related to minimizing energy consumption are solutions using gearbox control systems. The benefits of using a multi-speed gearbox for the electric drive system are presented in [
44,
45,
46,
47]. In recent years, due to the possibility of increasing the efficiency of the drive system, designers have increasingly used gearboxes for electric drive systems. There are one, two, or three-stage gearboxes with electronic control systems that use artificial intelligence methods [
48,
49,
50,
51].
This work presents the construction of a motion Energy Consumption Optimizer (ECO) for an electric delivery vehicle equipped with a gearbox. The operating rules of the optimizer and example results of simulation tests are presented. The use of an optimizer, especially for an electric drive system with a gearbox, also contributes to the possibility of reducing the components of the electric drive system, which has a positive effect on reducing the weight of the vehicle, allowing it to achieve better performance—mainly the vehicle’s range. The conducted research showed that thanks to the use of the energy consumption optimizer, energy consumption was reduced by up to 9.9% compared with a vehicle running under identical conditions without the use of the ECO.
2. Energy Consumption Optimizer—ECO
The level of energy consumption in an electric vehicle depends on a number of factors related to the design properties of the elements from which the vehicle has been built, the climatic conditions in which it is operated (hot/cold, road conditions), as well as the driver’s driving style. An important aspect is also the technical condition of the vehicle and the way it has been used (level of charging/discharging the energy store). The energy consumption of a vehicle also depends on the design features of the vehicle itself, such as vehicle weight, aerodynamic drag coefficient, elements of the electric drive system (efficiency of the drive system elements, resultant energy density of the energy store taking into account the mass of its housing), how the vehicle is used (tire pressure, suspension condition, cargo load, technical condition of the vehicle body), and the driver’s driving style.
The primary element influencing the vehicle’s range is the driver’s driving style. If the driver uses the accelerator and brake pedal frequently and heavily, the vehicle’s energy consumption can be very high. However, if the driver tries to smoothly cover the given route, using economic driving techniques (eco-driving), the vehicle’s energy consumption may be correspondingly lower. Choosing the right driving style for the driver is an individual issue and depends largely on the driver’s experience, gender, age, character traits, education, and place of employment, the location in which the vehicle is driven (built-up areas vs. undeveloped areas), road conditions, knowledge related to the operation of the drive system, and the technical properties of the vehicle. The energy consumption of a vehicle translates directly into its parameters, of which the range is most important in the case of electric vehicles. The lower the energy consumption, the greater the vehicle’s range. In order for the vehicle’s energy consumption to be optimal, the range of the vehicle obtained during operation must be as large as possible. To obtain optimal results related to minimizing energy consumption, systems or devices called energy consumption optimizers or power consumption optimizers are used [
51]. The task of the energy consumption optimizer is to force the electric drive system to operate at an operating point at which the drive system achieves maximum efficiency for given road conditions. In the literature, there are various examples of devices and systems that advise the driver at what speed or in which gear to operate the vehicle. There are also solutions that directly control the operation of the vehicle’s electric drive system, depending on current road conditions, in order to achieve the lowest possible energy consumption [
52,
53,
54,
55,
56,
57].
Figure 1 shows the concept of an electric drive consisting of a gearbox and a synchronous motor system control, using an energy consumption optimizer. The task of the energy consumption optimizer is to minimize the energy consumption of the electric vehicle while it moves along a given route, taking into account the operational parameters of the main elements of the electric drive system, which are the PMSM electric motor, the inverter, and the energy store.
To control the energy consumption of the vehicle during operation, the energy consumption optimizer uses information obtained from data on the planned route, satellite geopositioning systems (GPS, GLONASS, Galileo, or Beidou), digital road maps, and electric motor efficiency maps, as well as information from the BMS system supervising the operation of the energy store. During the control, the values of the currents controlling the PMSM motor
Iq and
Id, the motor speed
ωA, and the linear speed of the vehicle from the ABS (antilock braking system) are also taken into account. Depending on the set speed for the vehicle
Vzad and the current speed
V, the position on the given route, and the current slope of the route, on the basis of rules stored in the cognitive knowledge base, using the rules of fuzzy logic and the predictive reference model, the value of the current gear ratio in the gearbox
Gi and the motor current components
Iq and
Id are controlled. The developed simulation model of the delivery vehicle was implemented based on a system of differential state equations
x(
k + 1) and output equations
y(
k):
where:
x—vector of state variables,
u—vector of control inputs,
z—vector of disturbing inputs,
y—vector of controlled outputs,
Am—state matrix,
Bmu—control input matrix,
Bmz—interference input matrix,
Cm—matrix of controlled outputs,
Dm—transfer matrix (transmission),
SOC—energy store state of charge (%),
α—inclination of the terrain (°),
V—vehicle speed (km/h),
MON—torque driving the vehicle’s wheels (Nm),
TB—energy store temperature (°C),
Gi—gear (-), (Gi + switch to higher, Gi—switch to lower),
Id—current in the d axis (A), (Id > 0—excitation; Id < 0—de-excitation),
Iq—current in the q axis (A), (Iq > 0—normal operation; Iq < 0—regenerative braking),
ωA—motor speed (rad/s),
QB—charge released by the battery pack (energy store) (J).
The aim of the energy consumption optimizer is to control the available control variables: the number of the current gear
Gi, the components of the motor excitation current
Id and
Iq, as well as the motor rotational speed
ωA, to minimize the objective function developed for the consumed energy
J in the period of time
<t0,
tk>:
where:
t0—starting time [s],
tk—end time [s],
IB—current from energy store [A].
The components of the objective function are the current drawn from the
IB battery bank and the difference between the battery charge state at the start of operation
SOC(
t0) and the current consumption
SOC(
t). The scope of possible optimizer actions is subject to following limitations:
where:
IqMIN—minimum current value in the q axis (A),
IqMAX—maximum current value in the q axis (A),
IdMIN—minimum current value in the d axis (A),
IdMAX—maximum current value in the d axis (A),
ωAMIN—minimum motor speed value (RPM),
ωAMAX—maximum motor speed value (RPM),
SOC—state of charge of the energy store (%),
UBnom—nominal voltage of the energy store (V),
IB—electricity from energy store (A),
RW—internal resistance of the energy store (Ω),
UBmin—minimum voltage of the energy store (V),
Gi—current gear ratio in the gearbox (–),
Gm—number of gear ratios in the gearbox (–).
The adopted limitations for the electric motor result mainly from its efficiency map and include the ranges of permissible torque produced by the electric motor and the ranges of permissible rotational speeds. The limitations regarding the energy store are defined as the range of the state of charge between 0% and 100% SOC, and as the minimum voltage at the output of the energy store defined as the difference between the rated voltage of the store
UBnom and the voltage drop in the internal resistance
RW caused by the flow of current
IB. The limitations imposed on the optimizer itself result from the number of gear ratios
Gm available in the gearbox in the vehicle, and from the permissible range of excitation current values
Id [
51]. The above theoretical assumptions were used to develop simulation models of the electric drive system.
3. Modeling a Delivery Vehicle with an Electric Drive
Modeling the parameters of a delivery vehicle (van) with an electric drive system is a process currently used in the automotive industry. Faithful development of models of individual elements of the electric drive system is a difficult task due to the complexity of its individual elements as well as changing parameters depending on operating conditions. Thanks to models with an appropriate level of compliance with reality, it is possible to reduce the costs that would be incurred to verify a given element or control method under real operating conditions. Using data recorded by the author during the operation of electric delivery vehicles, a mathematical traction model was developed. This model was then used for verification tests of electric drive system control algorithms, using artificial intelligence technologies such as fuzzy control, predictive control, and cognitive databases. The simulation model of the delivery vehicle was developed in the Modelica simulation environment [
58].
3.1. Simulation Model of an Electric Delivery Vehicle
The simulation model of the electric drive system of a delivery vehicle was developed based on the parameters of a real delivery vehicle marked by manufacturers as L2H2, the basic parameters of which are listed in
Table 1.
The vehicle simulation model was developed on the basis of a real electric delivery vehicle. The developed elements of the drive system reflect the operation of subsystems and modules that make up the vehicle in question as a whole: the vehicle body along with the forces acting on it; the electric drive system consisting of a permanent magnet synchronous motor, inverter, and electricity store; the drive transmission system; a thermal conditioning system for the vehicle cabin and energy store; and on-board auxiliary devices (low-voltage vehicle circuits).
Figure 2 shows a view of the simulation model of the electric drive system of the delivery vehicle.
The model includes blocks related to the elements of the drive system synchronous motor with permanent magnets (2), voltage inverter (3), electricity store (4), gearbox (5), differential (6), vehicle drive wheels (7), and the movement resistance of the delivery vehicle (1). Additionally, the model includes auxiliary blocks such as a block modeling the power consumption of the 12VDC on-board installation (8), a block for the vehicle cabin heating installation and an energy store block (9). A block was also developed for measuring the electricity consumed (10) and setting the route (11). The main element controlling the operation of the gearbox and motor excitation is the energy consumption optimizer (12).
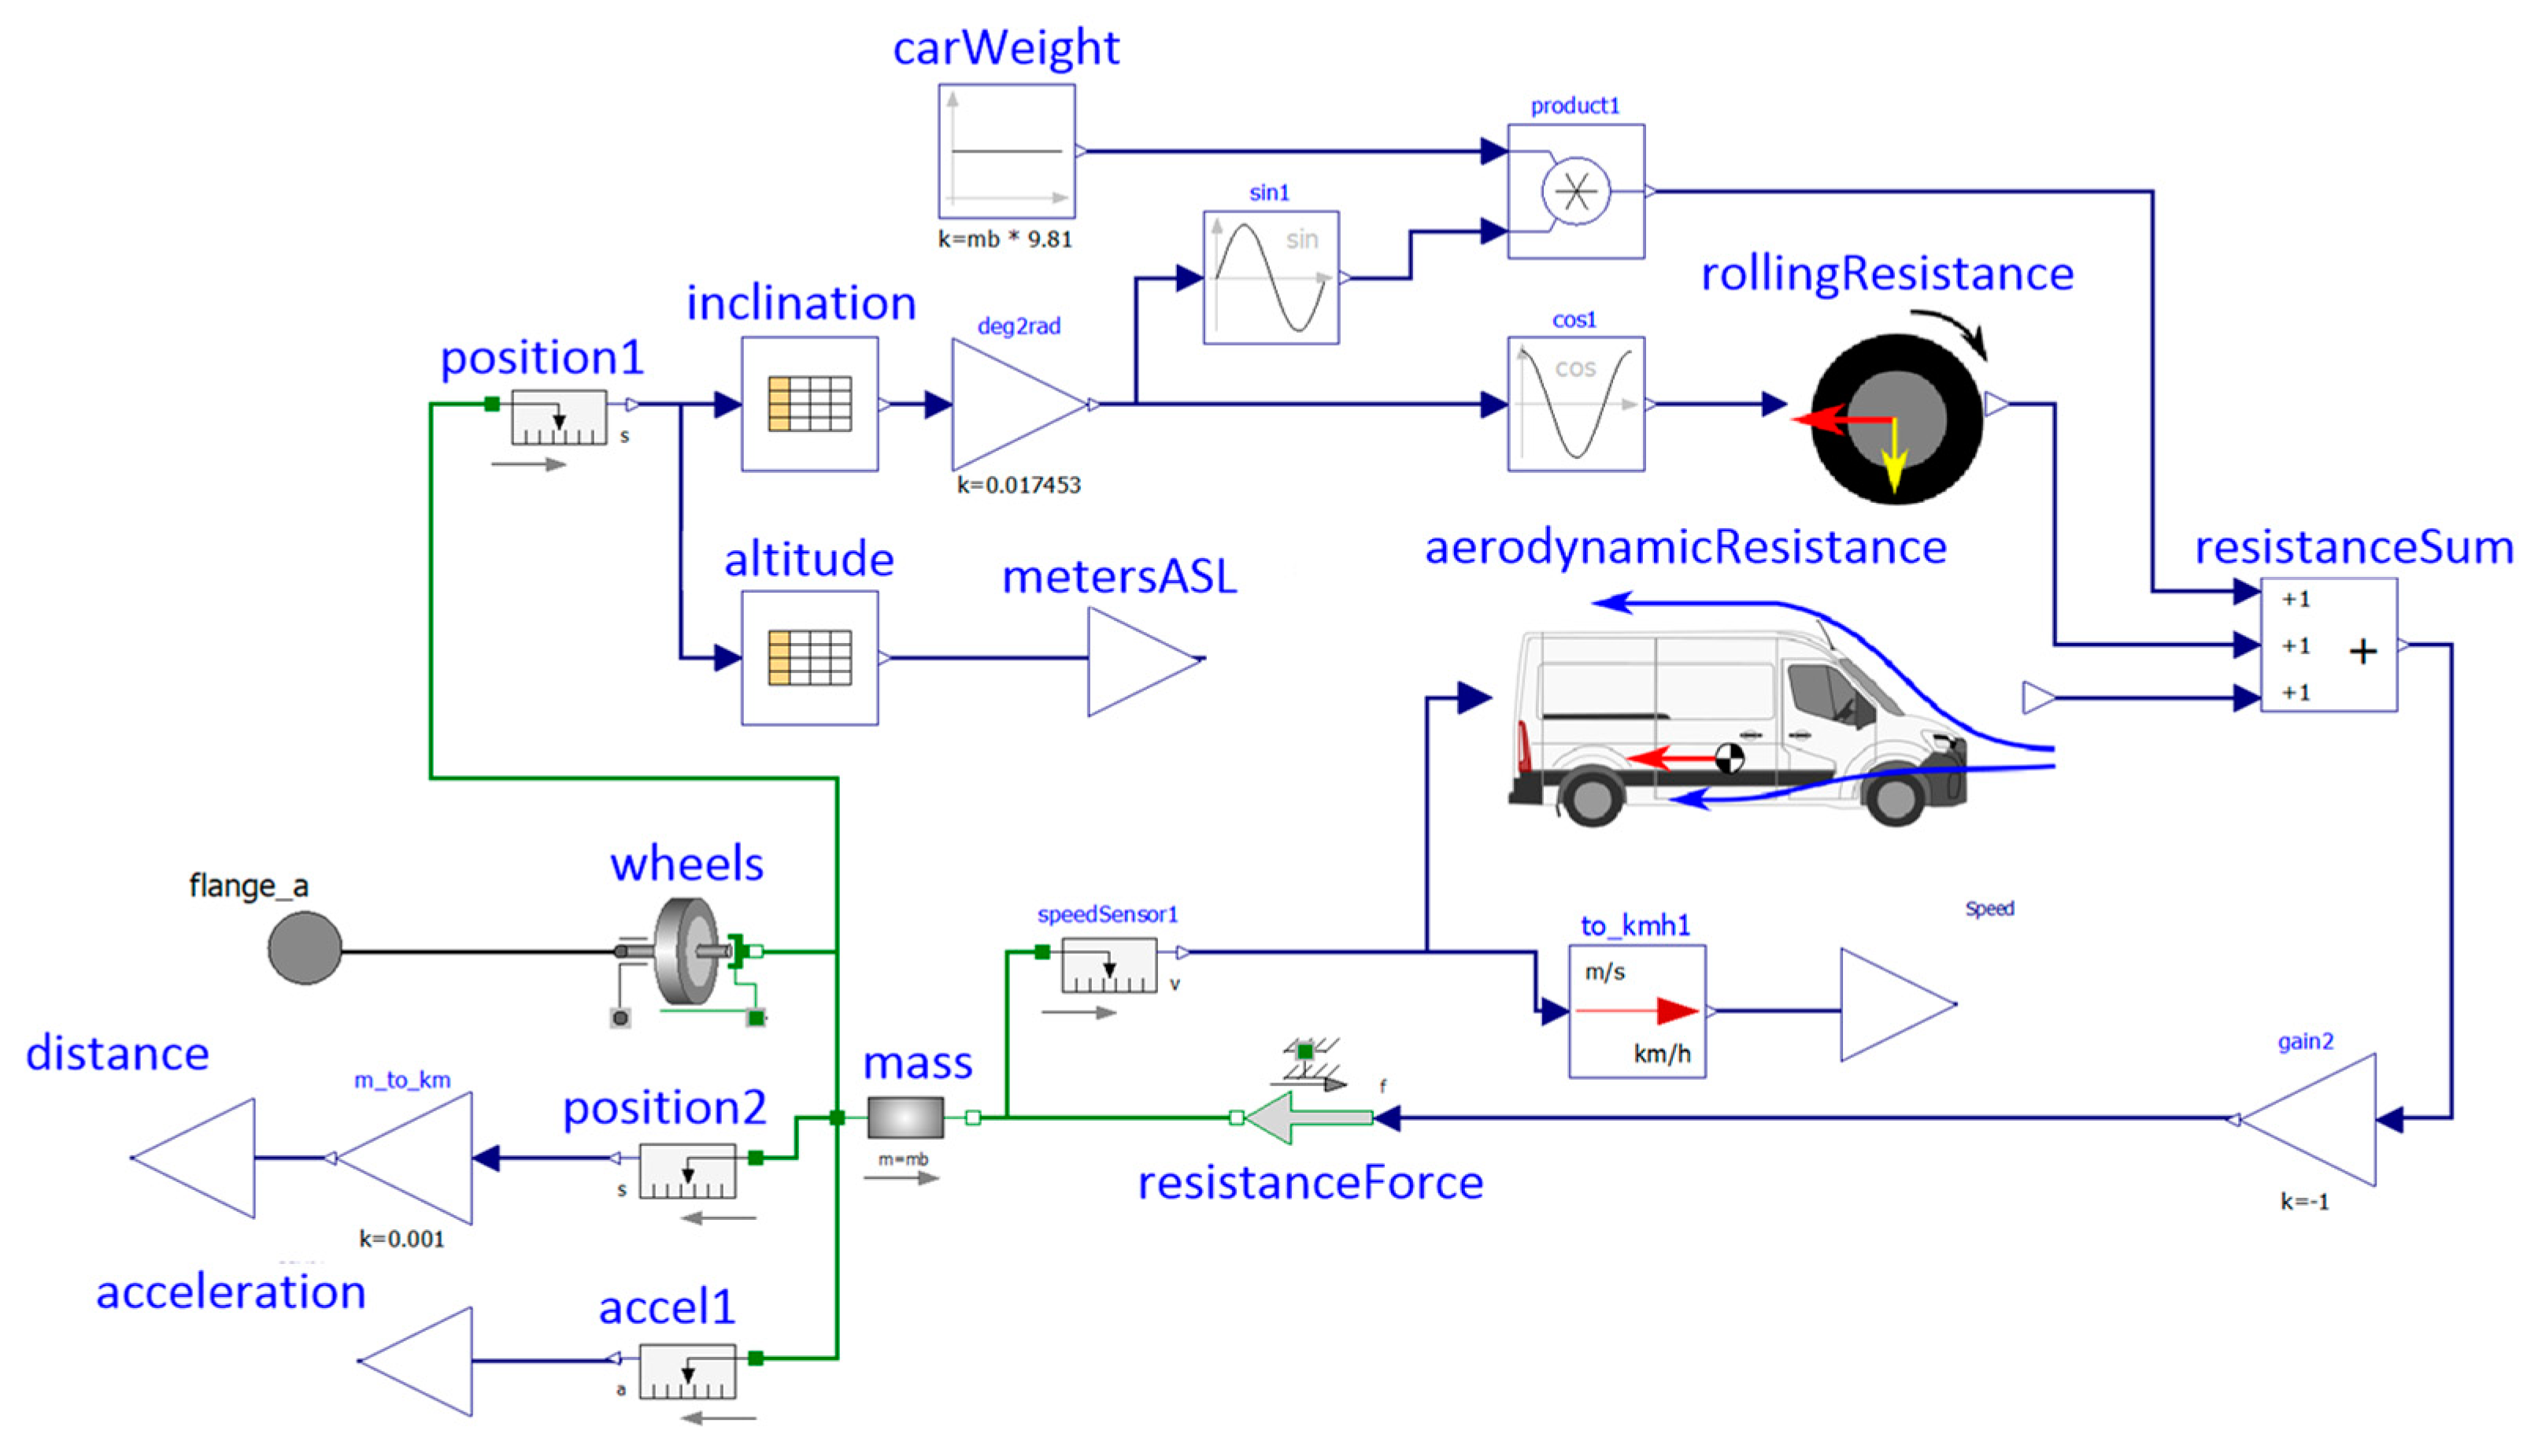
3.2. Vehicle Motion Resistance Block
The basis for the simulation research was the development of a block of movement resistances (1 in
Figure 2).
Figure 3 shows a view of the simulation block concerning the movement resistance of the electric delivery vehicle.
This block describes a lumped model of the total mass of the vehicle, with one degree of freedom, which can move along one spatial dimension. Additionally, a simplification was adopted, consisting in reducing the speed to the permissible value in a given area when cornering with an angle greater than 90°. For the vehicle model developed in this way, taking into account its mass and dimensions, there are drag forces as follows: aerodynamic
FA, rolling wheels
FR, and those resulting from driving on a slope
FS, as well as the driving force generated by the vehicle wheels
FN and the drag force
FD acting on the vehicle as a result of drag moments present in drive transmission mechanisms (
Figure 4). Additionally, changes in the speed of the moving mass of the vehicle are counteracted by the inertia force
FIN.
According to Newton’s laws of dynamics, for a moving delivery vehicle, the forces acting on its body must be balanced:
The aerodynamic drag force is given by the equation:
Rolling resistance can be determined based on the relationship:
The force of sliding resistance arising as a result of the vehicle moving on slopes can be determined using:
The force associated with the inertial forces caused by vehicle acceleration and braking can be determined from:
Additionally, the vehicle structure is also affected by forces related to the transmission of torque to the wheels and the losses associated with it:
The driving force
FM transmitted by the differential to the vehicle wheels can be described by:
where Cd—dimensionless vehicle aspect ratio (–), A—frontal area of the vehicle (m
2), ρ—air density (kg/m
3), V—vehicle speed (m/s), m—vehicle mass (kg), g—acceleration due to gravity (m/s
2), a—vehicle acceleration (m/s
2), µR—coefficient of rolling resistance of wheels on the road surface (m), α—road surface slope (°).
Cd is the electric vehicle drag coefficient (–);
A is the frontal area of the electric vehicle (m
2);
is the ambient air density (kg/m
3); and
is the electric vehicle speed (m/s).
—Torque produced by the electric motor (Nm);
—differential gear ratio (-); T
DS—torque on the wheel drive shaft at rated speed (Nm), ω
DS—average rotational speed on the wheel drive shaft (rad/s), ω
nDS—rated rotational speed on the wheel drive shaft (rad/s).
The route profile is generated in the form of a digital file based on electronic maps, containing information about the height above sea level, the slope of a given route section and the permissible speed on a given route section, ensuring the vehicle’s movement in accordance with road traffic regulations. The slope of the route is determined by the height difference between subsequent sections of the route. The slope of the route is positive (uphill) when the difference in altitude above sea level between subsequent points of the route is positive and negative (downhill) when the difference is less than zero.
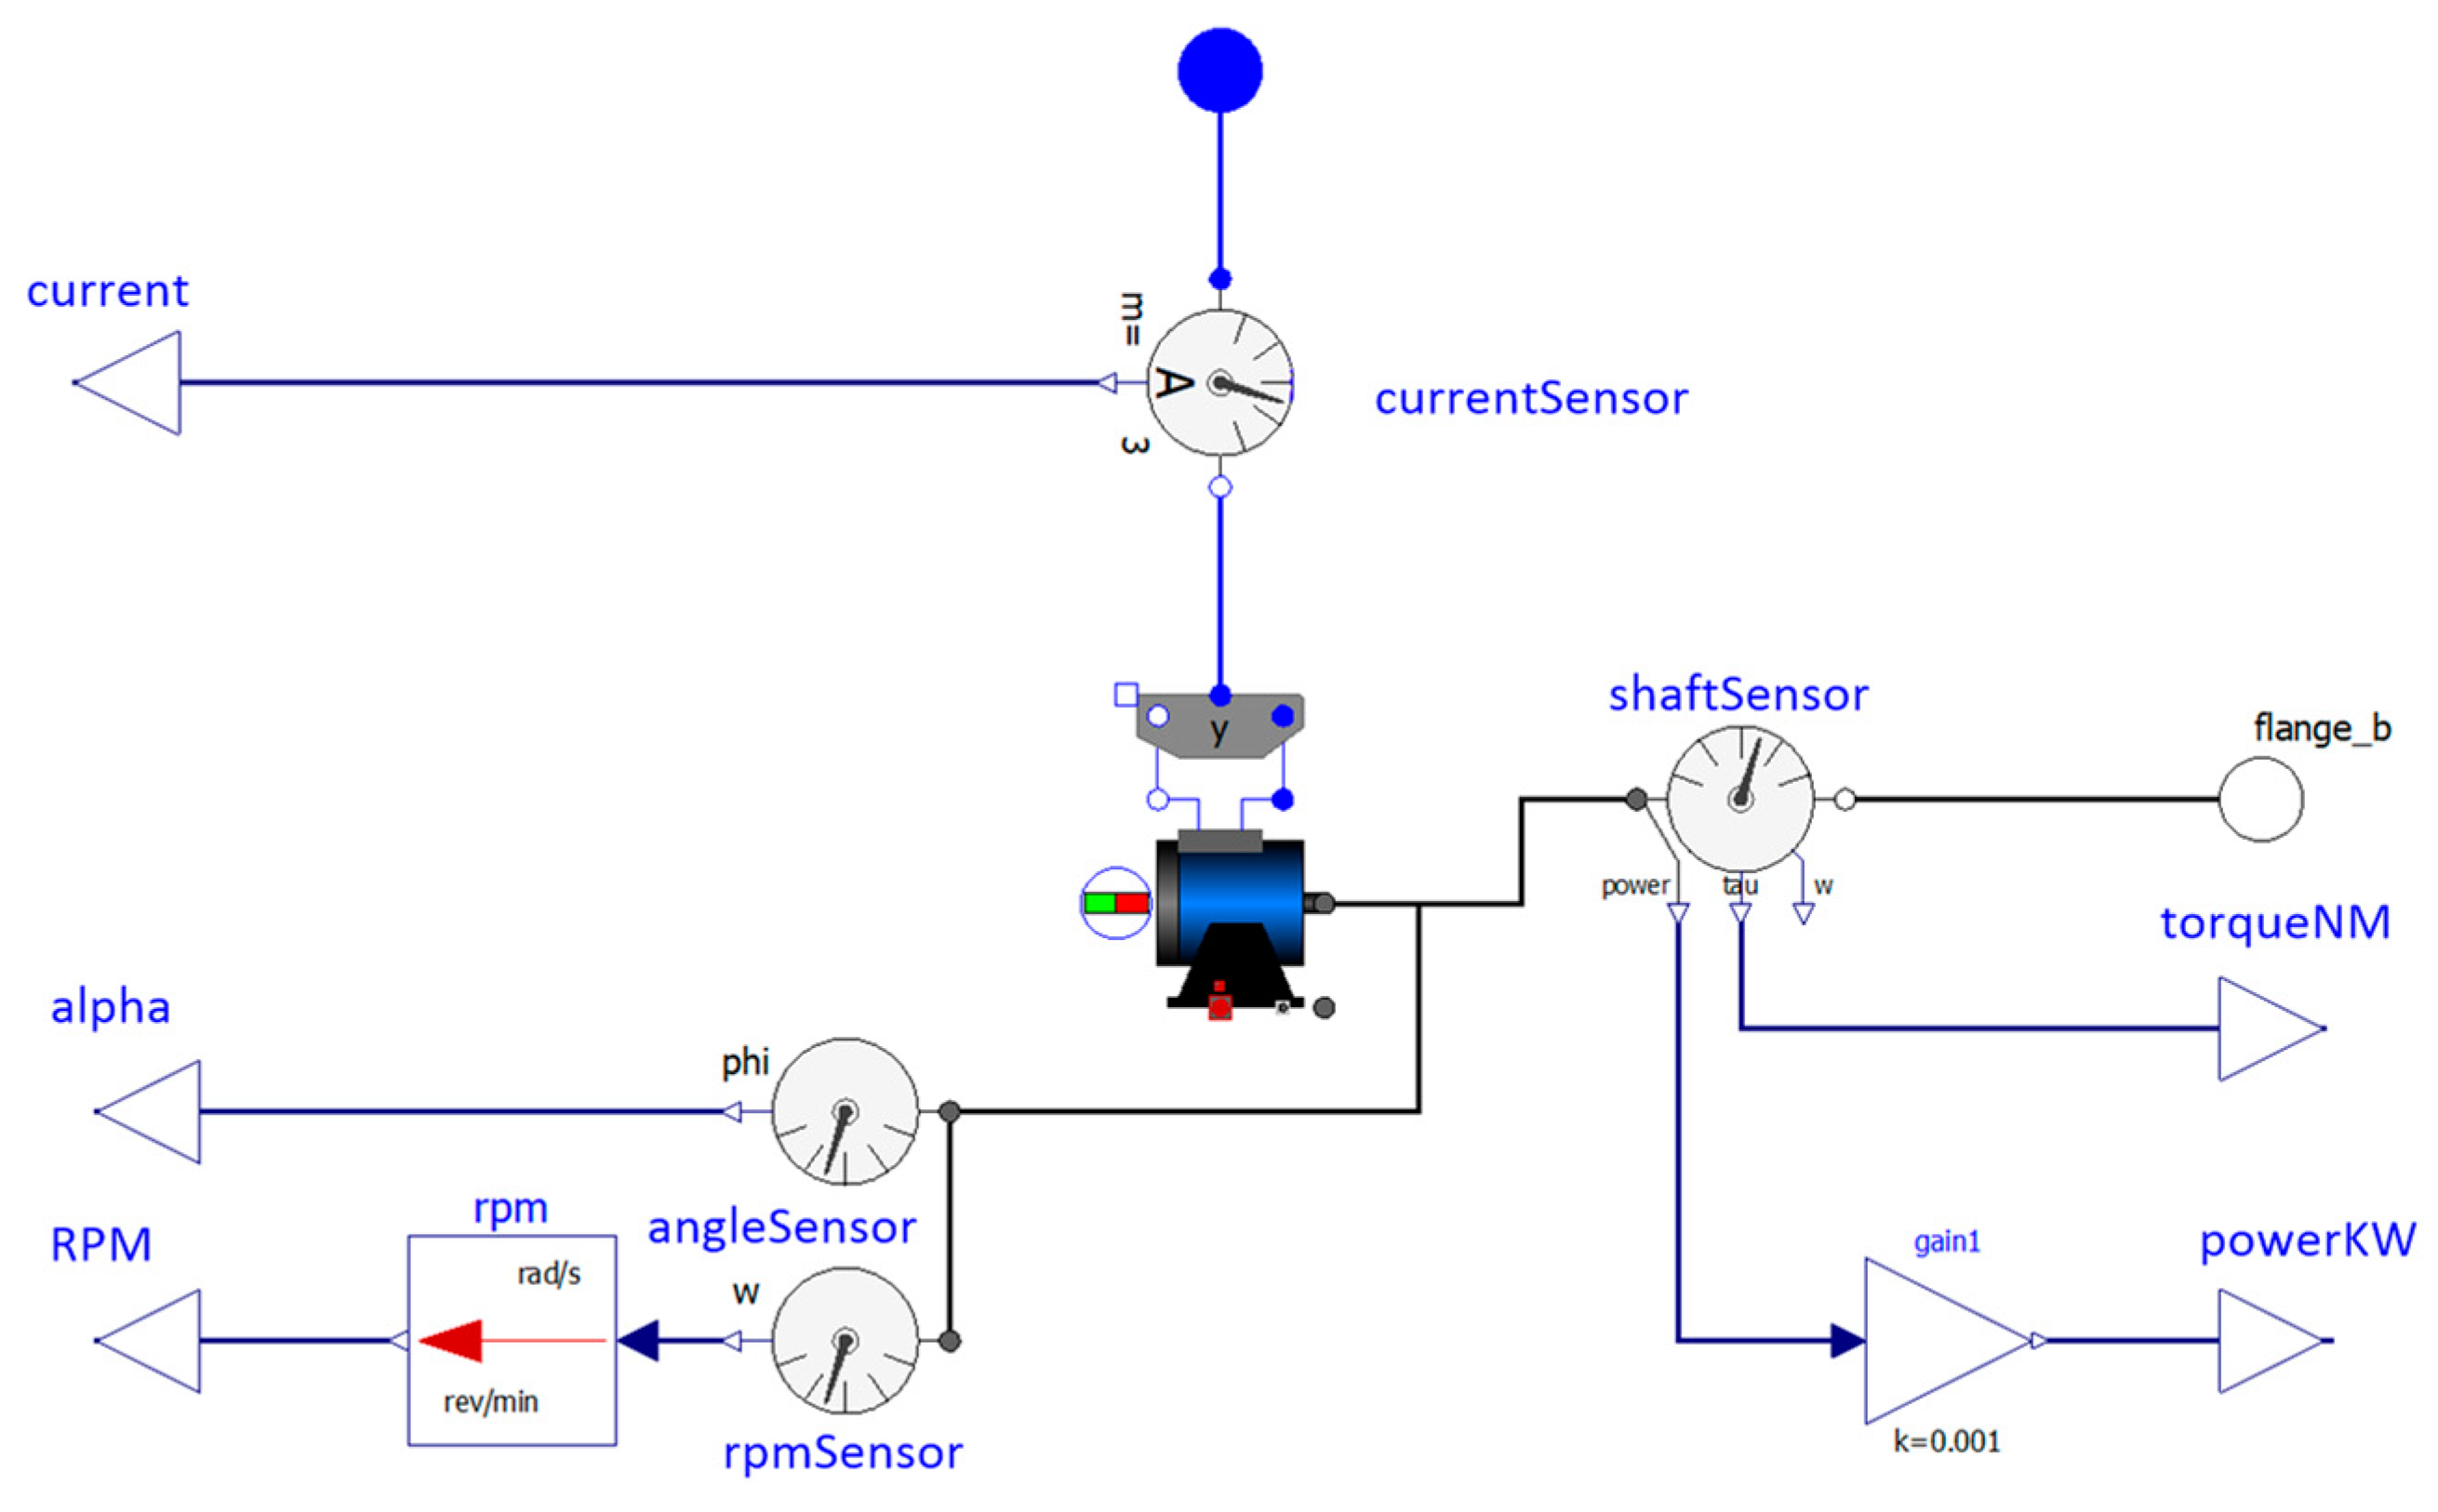
3.3. PMSM Motor Block
The model of a synchronous machine with permanent magnets shown in
Figure 5 reproduces the behavior of the motor together with the necessary sensors. This model was developed based on the Standard Library from the Modelica environment and it reflects the parameters of a real synchronous motor with permanent magnets.
Between the PM motor model block and the flange_b output modeling the motor shaft, there is a torque and mechanical power sensor block, used to monitor the values of these parameters. Additionally, shaft rotation angle and shaft speed sensors are connected to the motor shaft. The angular measurement of the shaft position is used by the motor current regulator block located in the voltage inverter model with FOC, working based on the Field Oriented Control (vector control) algorithm. The rotational speed value is transferred to the efficiency determination block, also located in the inverter block, and to the optimizer block controlling the operation of the gearbox and motor excitation. The electric machine model was developed based on actual measurement values of a synchronous motor with permanent magnets.
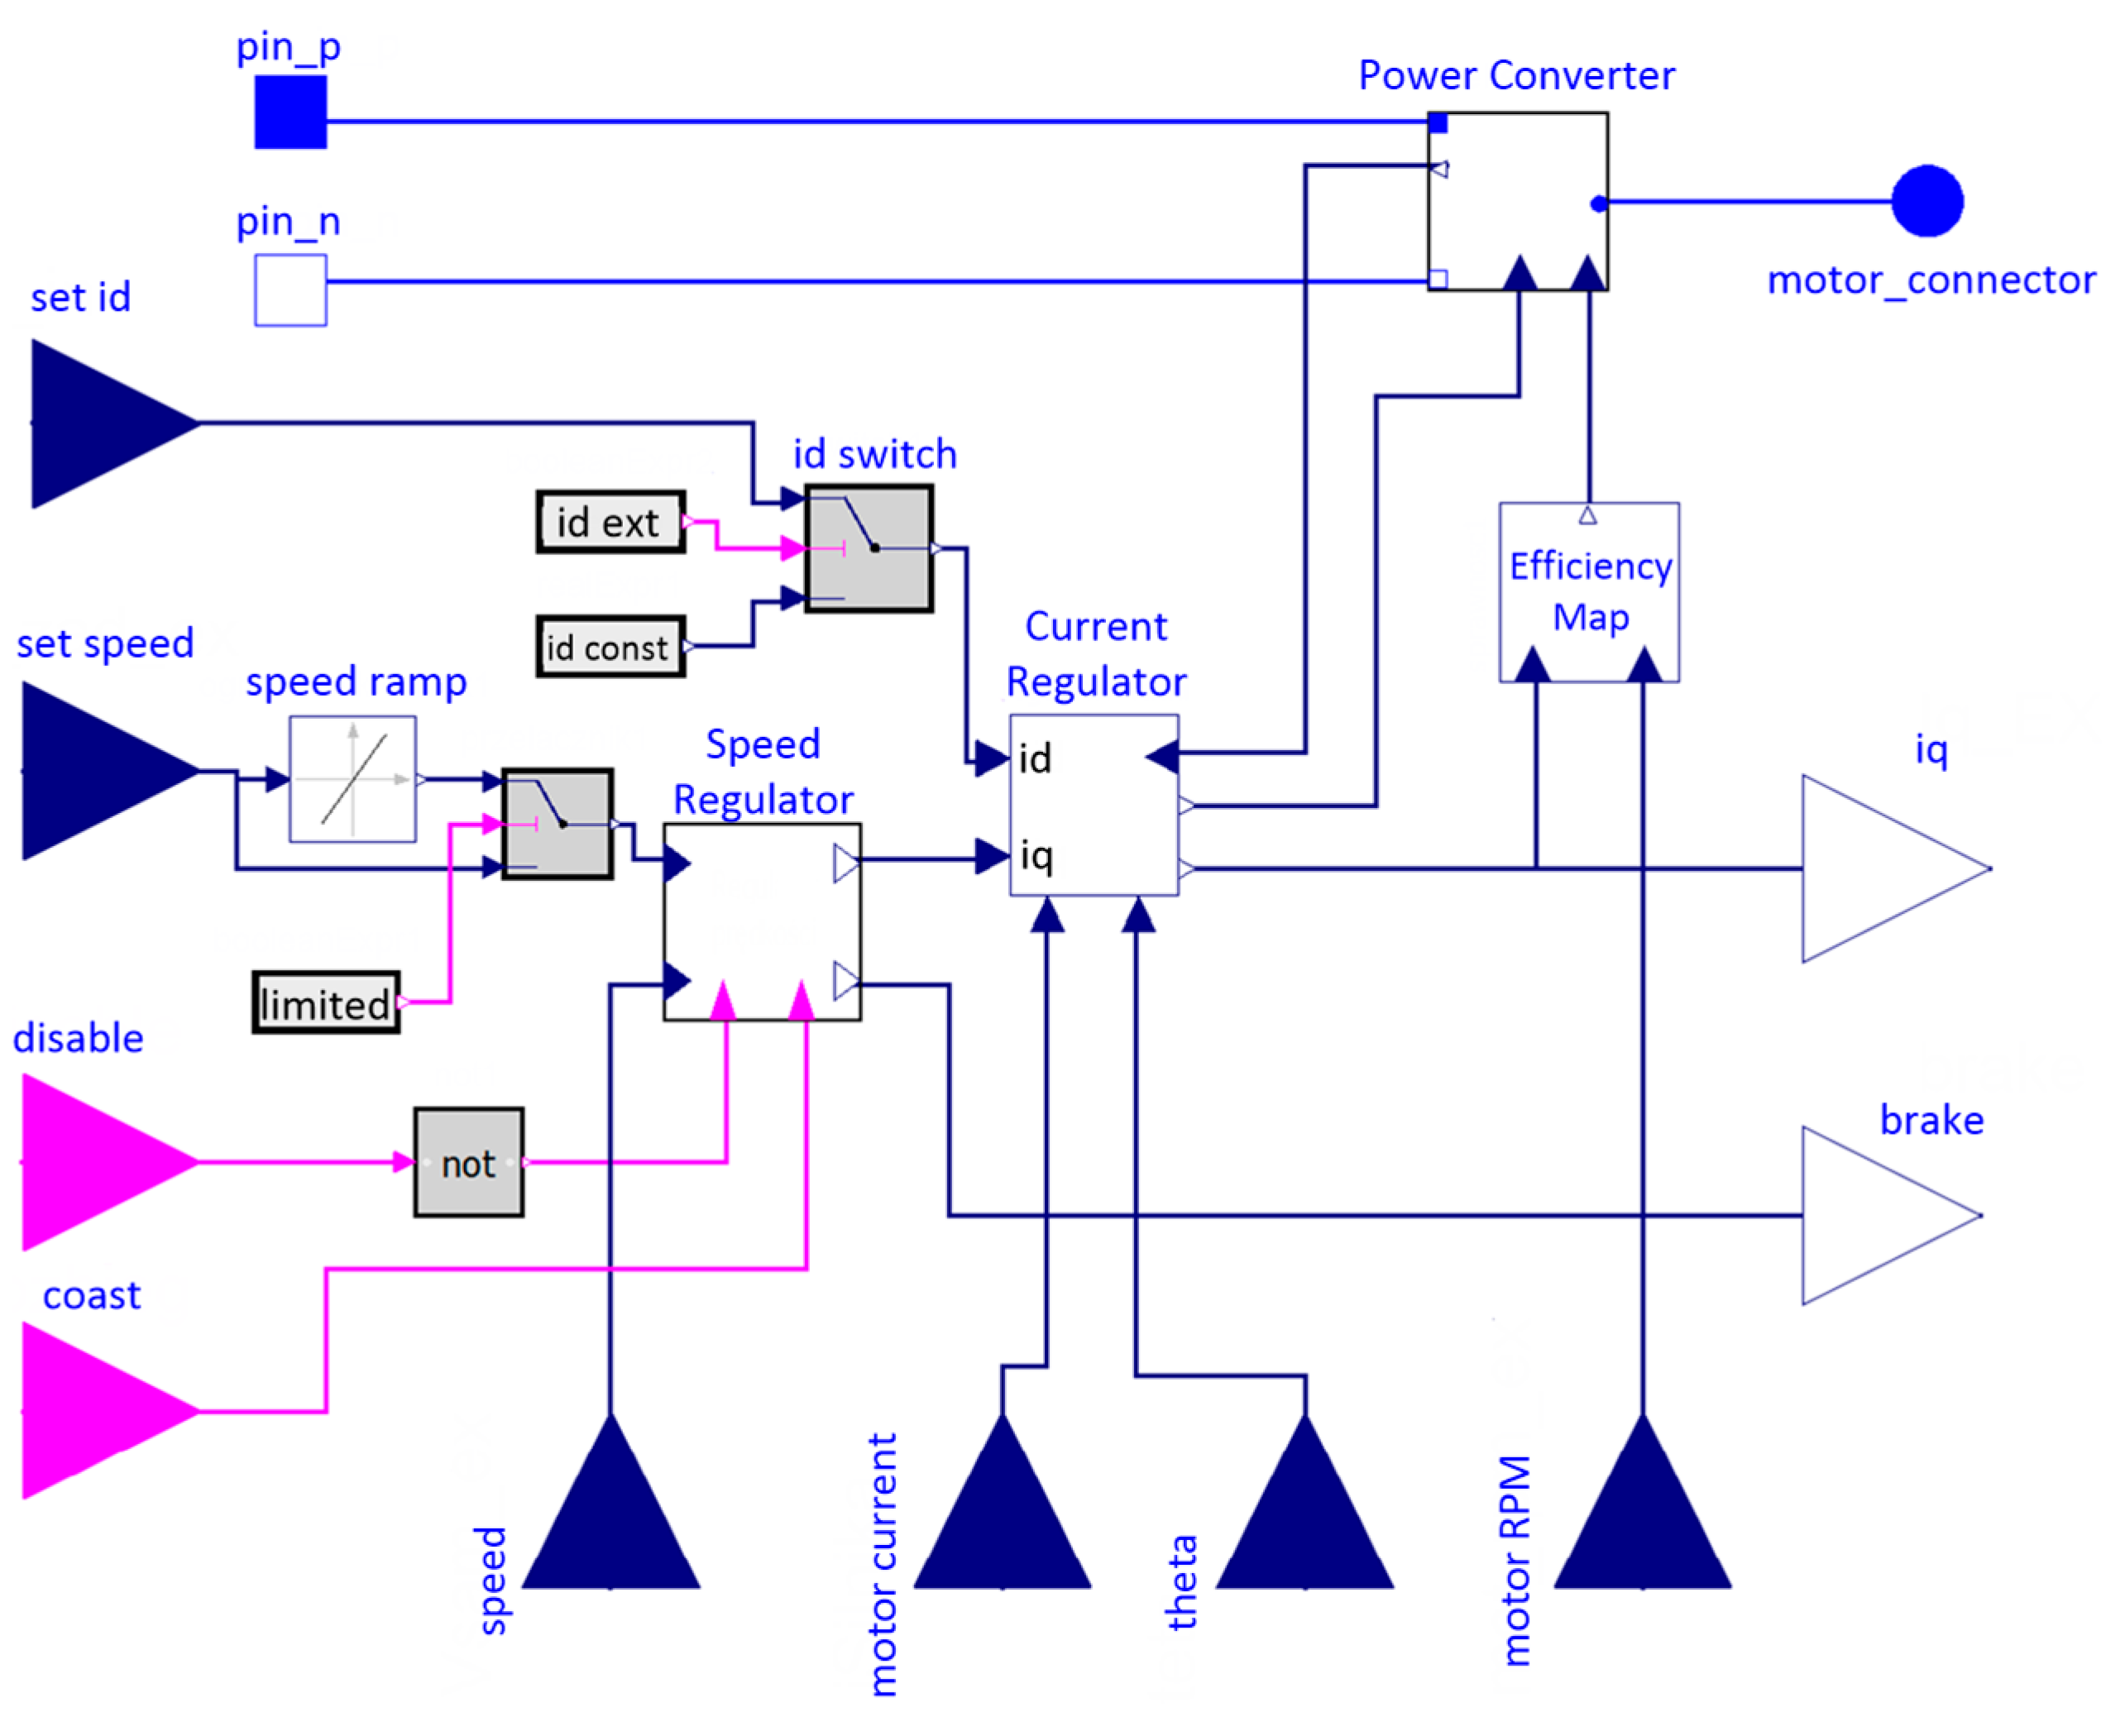
3.4. Inverter Block
The inverter model block includes both the power converter model, i.e., the voltage inverter, and the FOC system. The inverter block is one of the most important elements of the modeled electric drive system of a delivery vehicle due to the fact that the adopted control method has a significant impact on the parameters obtained by the vehicle.
Figure 6 shows the structure of the developed voltage inverter block, which includes the vehicle linear speed regulator, motor current regulator, power electronic converter regulator, set current value ramp limiter, excitation control source selection block, and a block determining the total efficiency of the motor–inverter system.
3.5. Energy Store Block
The energy store and the type of cells used in its construction have a significant impact on the operational parameters obtained by the vehicle. The energy store model was developed based on the Modelica Energy Stores library. Within the structure presented in
Figure 7, phenomena occurring in the store during its operation were reproduced, such as the variable electromotive force of the cells, the amount of electric charge in the cells and the associated state of charge (SOC), variable internal resistance depending on the temperature of the cells and their state of charge, and cell temperature, influenced by energy lost on internal resistance, heat flow between the energy store and the environment, and heat flow (cooling or heating) from the thermal conditioning system of the energy store.
The basic elements of the energy store block are a controlled voltage source, a variable resistance resistor, a current sensor, and a heat capacity block. Thanks to the cooperation of the current sensor block with the recording and calculator block, it is possible to record the flow of charge from/to the cells. In the recording and calculation block, computations related to the level of charge of the cell (SOC) are made, based on changes in energy store current and cell parameters. These calculations are performed for a single cell and then recalculated depending on the type and number of cell connections. The model also uses a variable-resistance resistor to represent the internal resistance of the cells and the release of thermal energy lost as a result of the flow of electric current. The thermal capacity block cooperates with the variable-resistance resistor and reproduces the actually occurring accumulation of thermal energy the store lost via its internal resistance. As a result of the flow of current through the energy store, heat QT is released on internal resistance, and there is a phenomenon of its exchange with the environment.
The energy store model also takes into account the possibility of cooperation with the thermal conditioning system, in the form of supplying or draining the appropriate amount of heat. This is an important phenomenon because it takes into account such operational conditions as a drop in ambient temperature below a set value when the energy store is connected to the power grid. In such a situation, the energy store is heated by a thermal conditioning system that uses heater boards made of standard printed circuit board. It is also possible to model heat removal from the energy store when its temperature rises above 50 °C. This phenomenon may occur when the ambient temperature exceeds 35 °C and the drive system itself is used very extensively. The energy store model also has the ability to simulate heat exchange with the environment, depending on the vehicle speed. The resultant value of the energy store temperature can be determined based on the quotient of the resultant sum of heat released on the internal resistance, heat exchanged with the environment and heat from the thermal conditioning system, to the total thermal capacity of the battery pack. The value of the internal resistance of the energy store device depends on its temperature and state of charge and takes into account the characteristics of the specifically used cell model provided by the manufacturer.
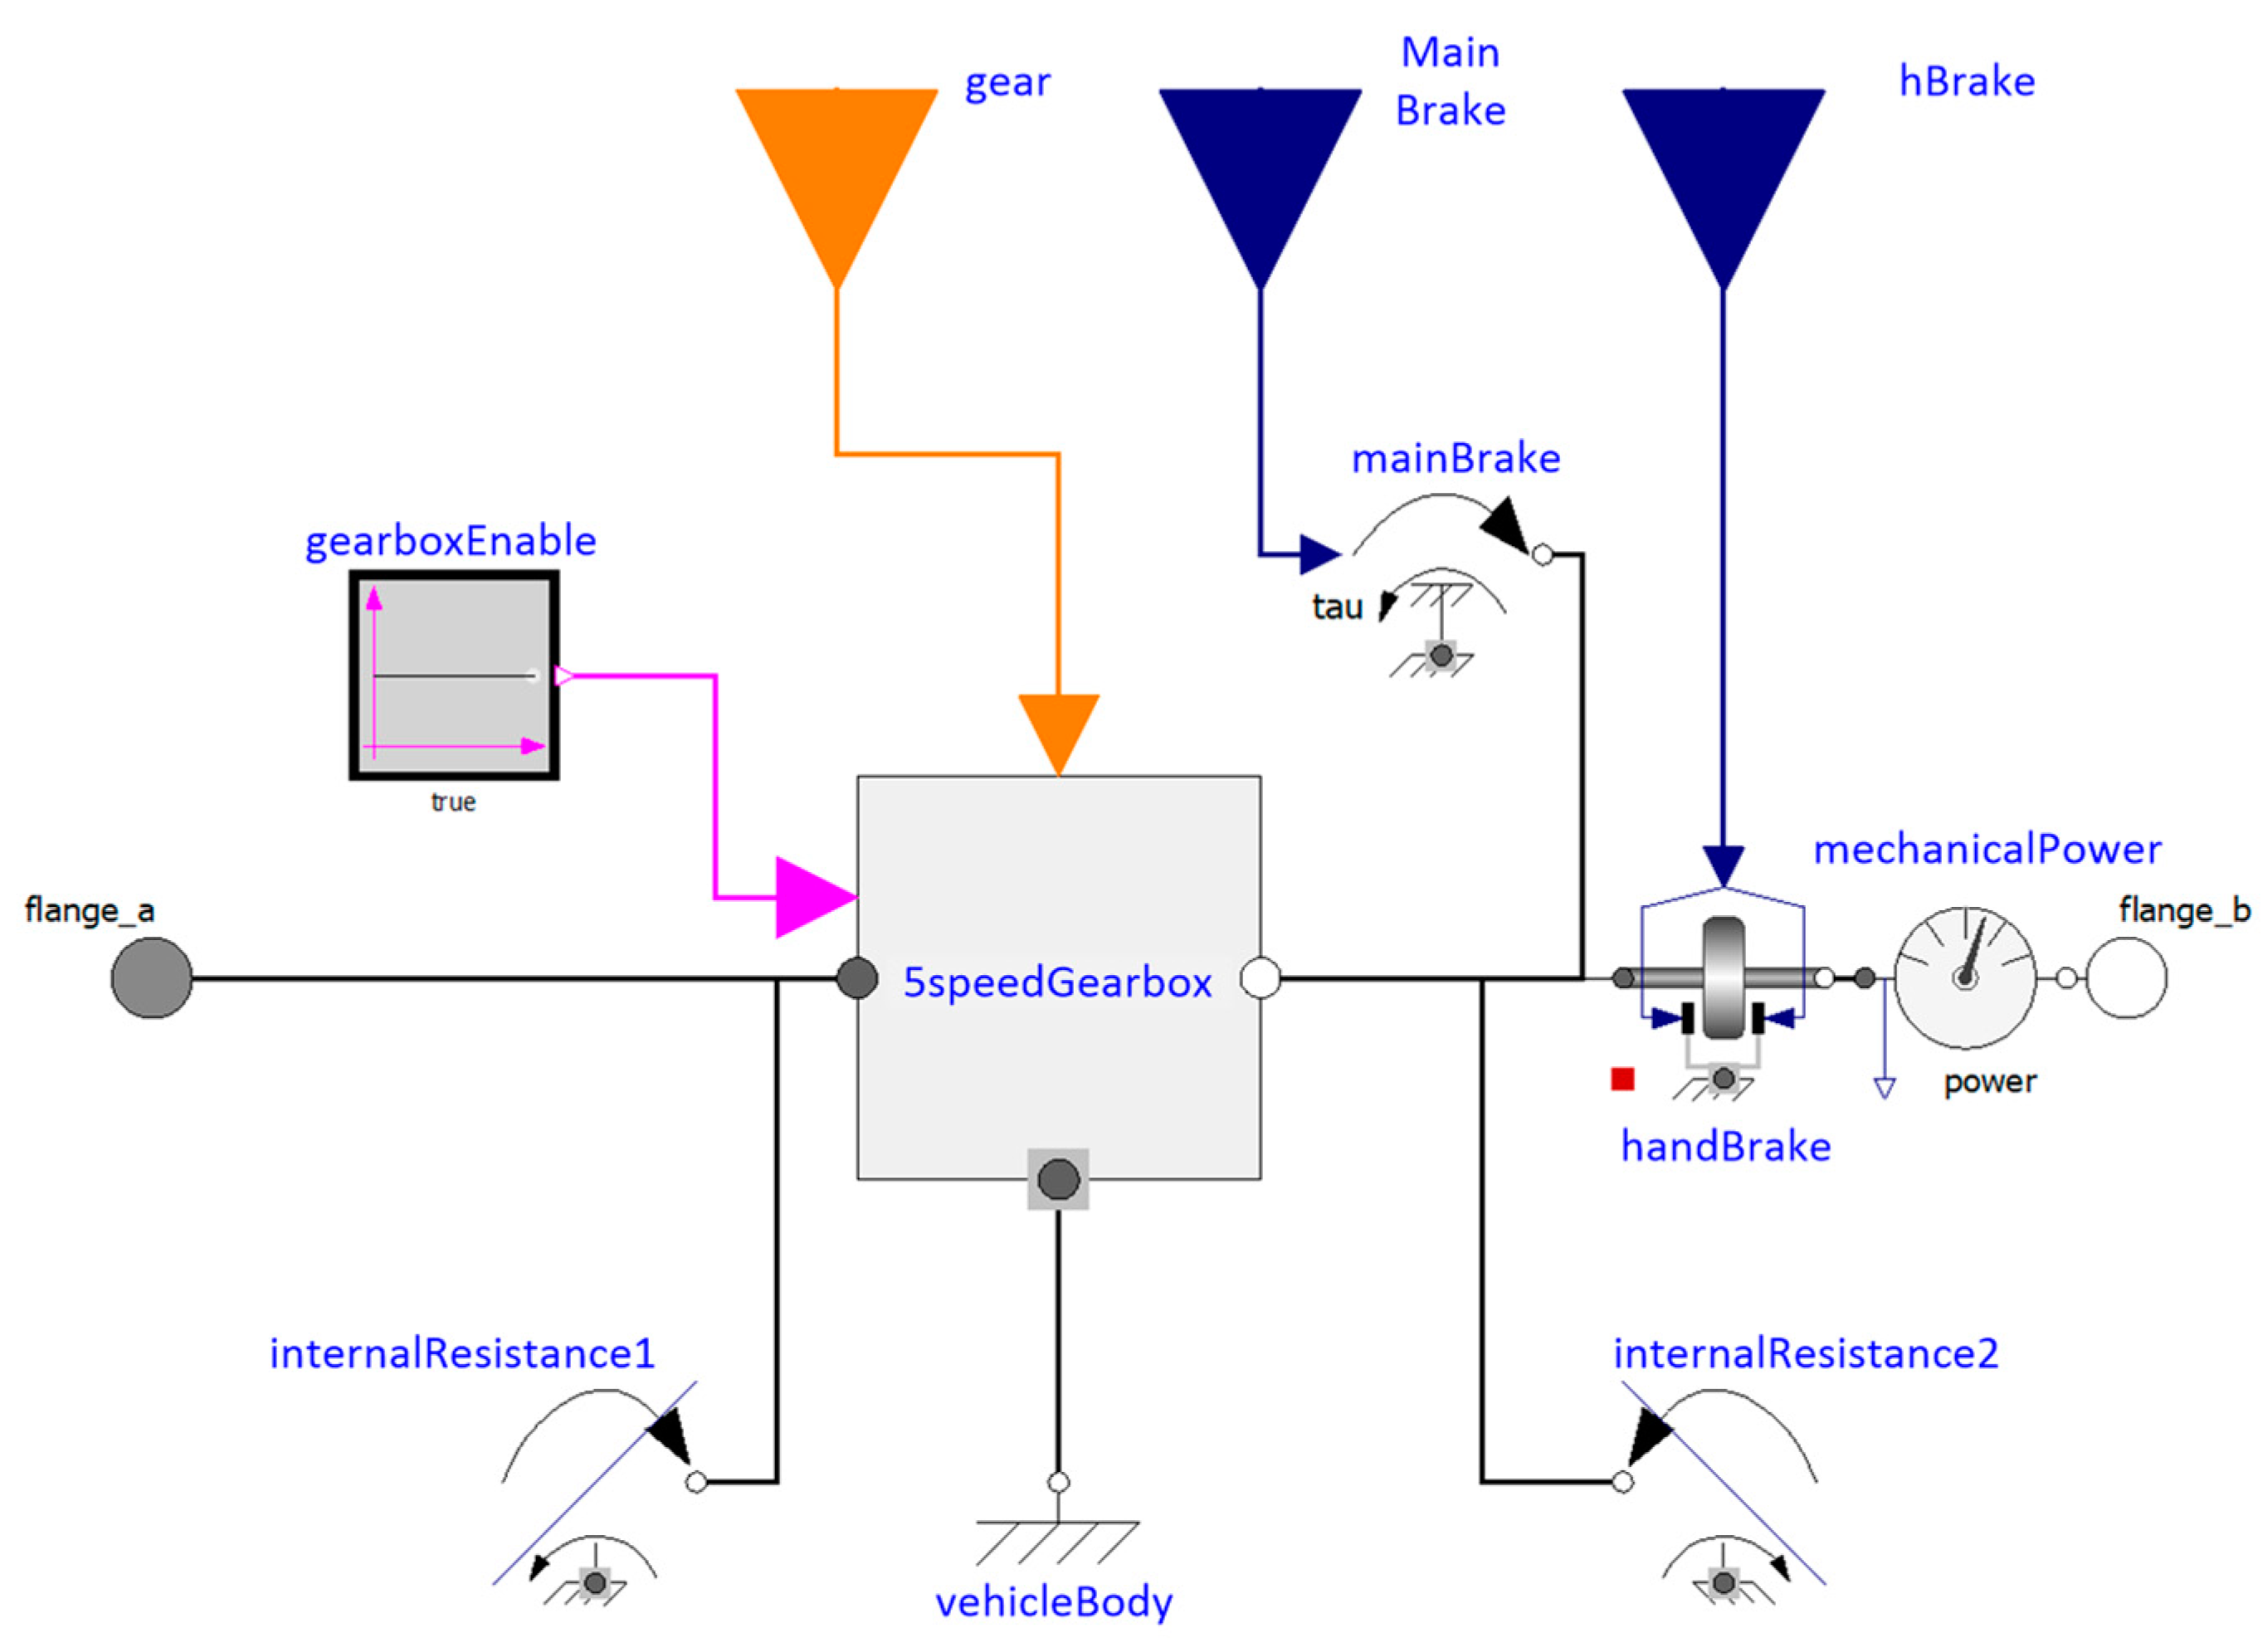
3.6. Gearbox Block
Figure 8 shows the developed gearbox model implemented using elements taken from the Kinematics library. The model enables simulation of gearbox operation modes in automatic or manual mode, including configuration of the number of gears, their values and change times between individual gears related to the clutch engagement and disengagement times. The number of the desired gear ratio is set according to the energy consumption optimizer block, which also has the function of emulating manual gearbox control by the vehicle driver. For the shafts located in the gearbox, the rotation resistances were modeled, linearly increasing from zero with the increase in rotational speed. These elements are sources of resistance in the drive system. On the receiving shaft side, the main and parking brake models are also provided. The main brake is activated by the vehicle speed controller, located in the voltage inverter block, when the action regenerative braking is not sufficient to reduce the vehicle speed quickly enough. The kinetic energy released on the main brake is lost irretrievably.
3.7. Route Block
The route setting block, shown in
Figure 9, is responsible for controlling the vehicle speed while covering the route and for providing data on the current slope of the road on which the vehicle is traveling. The source of data on speed and inclination are text files that, in the case of inclination, contain data on the absolute height in meters above sea level (masl) and slope in degrees at given points on the route, determined by the distance from the starting point.
Intermediate values between points of the given route are subject to linear interpolation in such a way that the functions of absolute height and road slope are continuous. Thanks to this, information about the distance traveled can be obtained from the vehicle motion resistance block. The speed at which the vehicle is required to move on a given road section is also defined in the form of a text file. The file describing the vehicle’s speed as a function of time contains pairs of points in the format (time [s], speed [km/h]), at one-second intervals. This is a common format for synthetic description of road tests used to assess vehicle energy consumption, used by e.g., the United States Environmental Protection Agency [
59].
3.8. Energy Consumption Optimizer Block
The energy consumption optimizer block (
Figure 10), which mainly uses fuzzy logic methods in the form of a cognitive knowledge base, is responsible for controlling the operation of the gearbox and the excitation of the synchronous motor. The initial set of rules in the knowledge base was developed based on the author’s many years of experience in the operation of electric drive systems in vehicles. Next, the initial set of rules was subjected to an iterative optimization process that involved conducting simulations and determining quality indicators, which were assumed to be the consumption of electric energy during the study. Then, based on the quality indicators and the observation of the operation of the fuzzy optimizer, the knowledge base was appropriately modified by adding new rules, removing or changing existing rules, or by modifying the parameters of the membership function used in the fuzzing process. Cognitive inference rules for controlling the gear ratio change of the gearbox were recorded using 24 inference rules. Meanwhile, the cognitive knowledge base for controlling the excitation of the engine is based on 13 inference rules. The gearbox operation is controlled by indicating the appropriate gear ratio depending on the prevailing road conditions. The situation is similar in the case of controlling the motor excitation current. The input variables of the optimizer block are the vehicle’s linear speed, the inclination of the road on which the vehicle is traveling, the rotational speed of the electric motor, and the motor current component (Iq). The value of the linear velocity is additionally differentiated to determine the vehicle’s acceleration value. The optimizer block can be configured to work in a mode that emulates the driver’s control of the gearbox. In this operating mode (MANUAL), the gear selection is made by the classic gearbox controller block and the control is based solely on the vehicle’s speed and a table containing the parameters of the switching points of individual gear ratios. The gear control source selector allows a signal to be sent from the classic controller block to the gear number output. When the optimizer is operated in AUTOMATIC mode, the input values are subjected to a small delay of 0.1 s to avoid unnecessary initiation of the optimizer operation, which could result in cyclic changes from a lower to a higher gear or vice versa.
There are two inference blocks in the optimizer block. The first one is based on fuzzy signals derived from the vehicle’s speed, the road slope, the motor speed, and the motor current component Iq, and it makes conclusions about whether the current gear ratio is appropriate or whether it should be changed to lower or higher. The second inference block uses fuzzy values of the signals of the vehicle’s linear speed, the motor rotational speed, and the motor current component Iq to determine the value of the current component Id, which puts the motor into the field weakening or field enhancement state.
When changing the gear ratio, the inference block uses three outputs which are commands to change gear to a higher gear (s + 1), remain in the current gear (s0), or change to a lower gear (s − 1). These signals are directed to the gear value sharpening block, where the three signals are transformed into a single-element set (singleton), the gear shift index b, which can take the range b ∈ <−1, 1>.
The value of the current gear Gi is fed to the gear control source selector, from where, if the gear number control source is set to fuzzy control, it is transferred to the output.
The operation of the motor excitation inference block is similar to operation of the gear inference block. This block has three outputs in the form of a single-element set (singleton), carrying the values of the need to over excite the motor (w + 1), not to use additional excitation (w
0), and to de-excite (field weaken) the motor (w − 1). The values of the excitation control signals are then sent to the excitation sharpening block, where they are sharpened to a given current value
Id in the range
Id ∈ <Iwzb−, Iwzb+>. The signal of the set current value
Id, before being fed to the output, is subjected to a slew rate limitation in order to filter out quick changes that may disturb the cooperation of other elements of the model [
51].
5. Discussion
The results obtained for the WLTP test cycle showed the largest difference in energy consumption (−14.3%) and range achieved (−14.2%) of all the tests conducted. It should be noted that the parameters of the WLTP test cycle differed from the actual test conditions in which the vehicle moved in accordance with the given speed profile, but also overcame hills, which were absent in the considered test cycle. It was observed that the energy consumption optimizer, despite tuning its parameters to road conditions, performed exceptionally well in the zero-slope test cycle. It can be said that the adopted standardized test cycles, due to the fact that they did not contain altitude profiles for the route, only a speed profile, were not a reliable tool for assessing the actual energy consumption of vehicles. The presented test results indicate that the average value related to the reduction of energy consumption thanks to the use of the optimizer for the considered real test cycles was 5.4%, while for the WLTP test cycle, it was 14.3%. On this basis, it can be concluded that the developed standardized test cycles related to vehicle energy consumption do not fully reflect real road conditions. The above information is confirmed by vehicle operational data collected by many independent users around the world [
60]. A better reflection of real road conditions are test routes developed on the basis of recorded measurements in real road conditions. Currently available chassis dynamometers for testing vehicle drive systems offer, in addition to the ability to read parameters for each wheel, the ability to set any test cycle as well as routes developed on the basis of recorded parameters of real road conditions, with the possibility of simulating vehicle movement on hills by employing magnetic eddy current brakes.
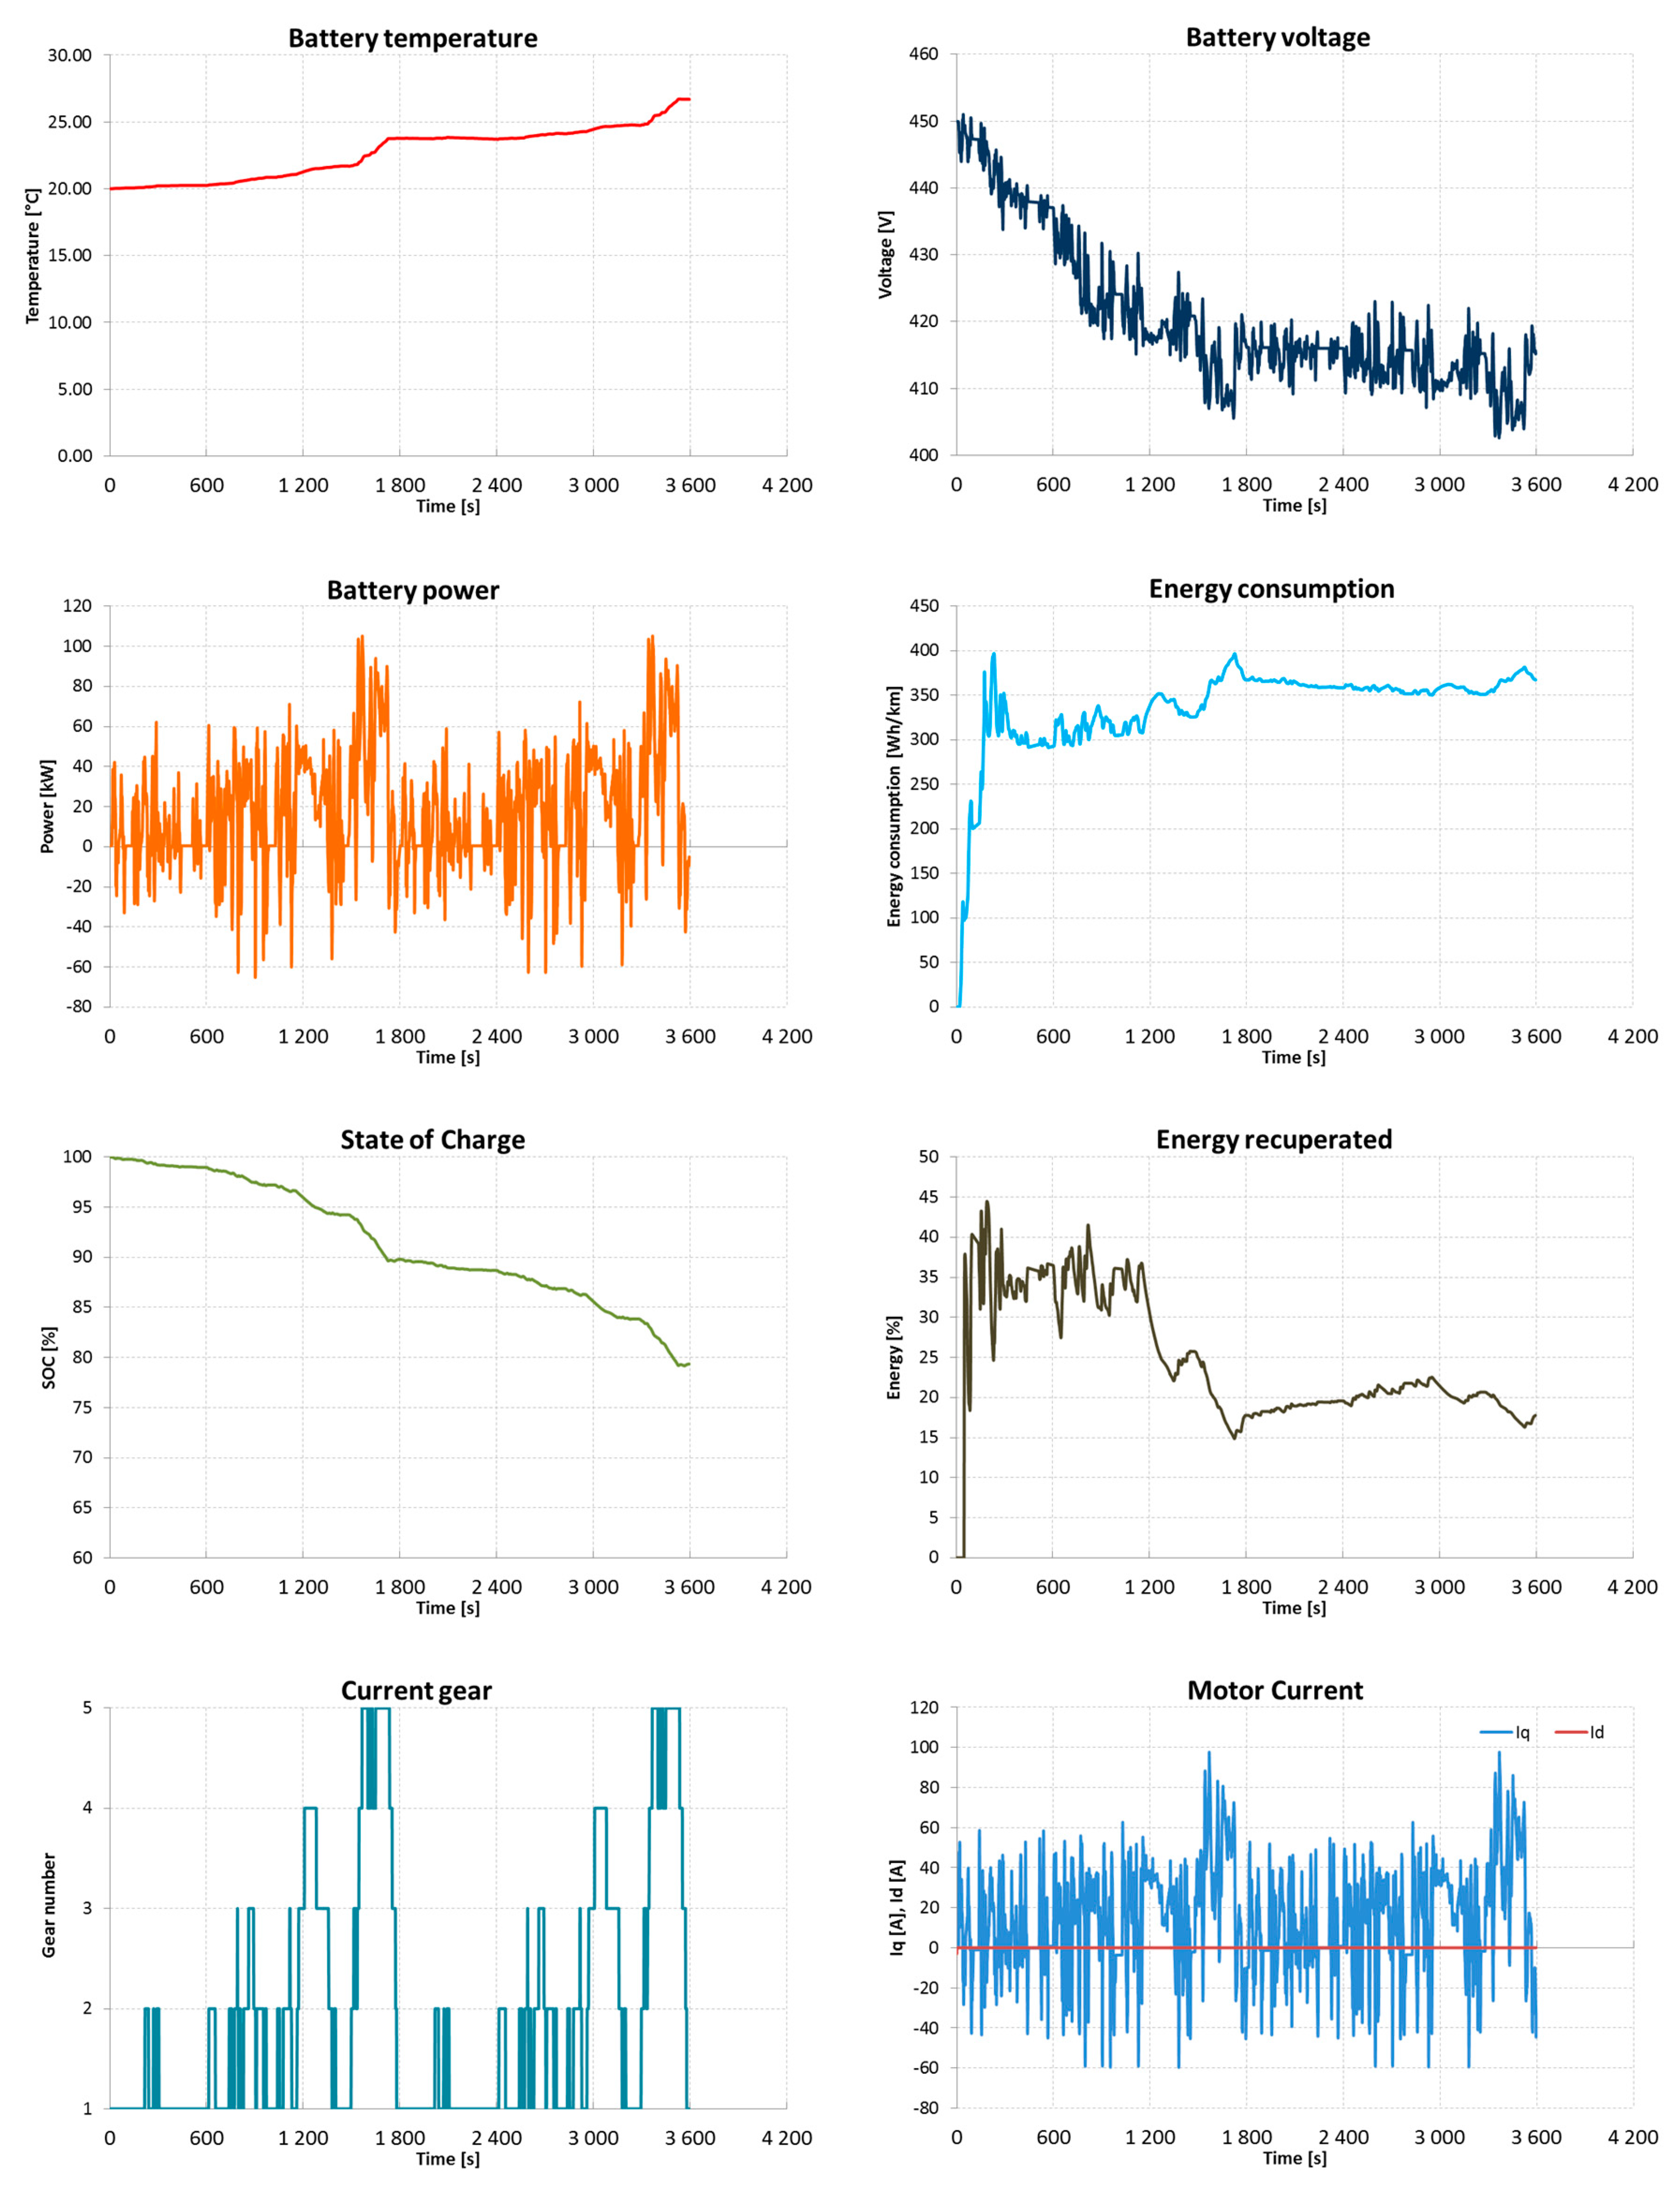
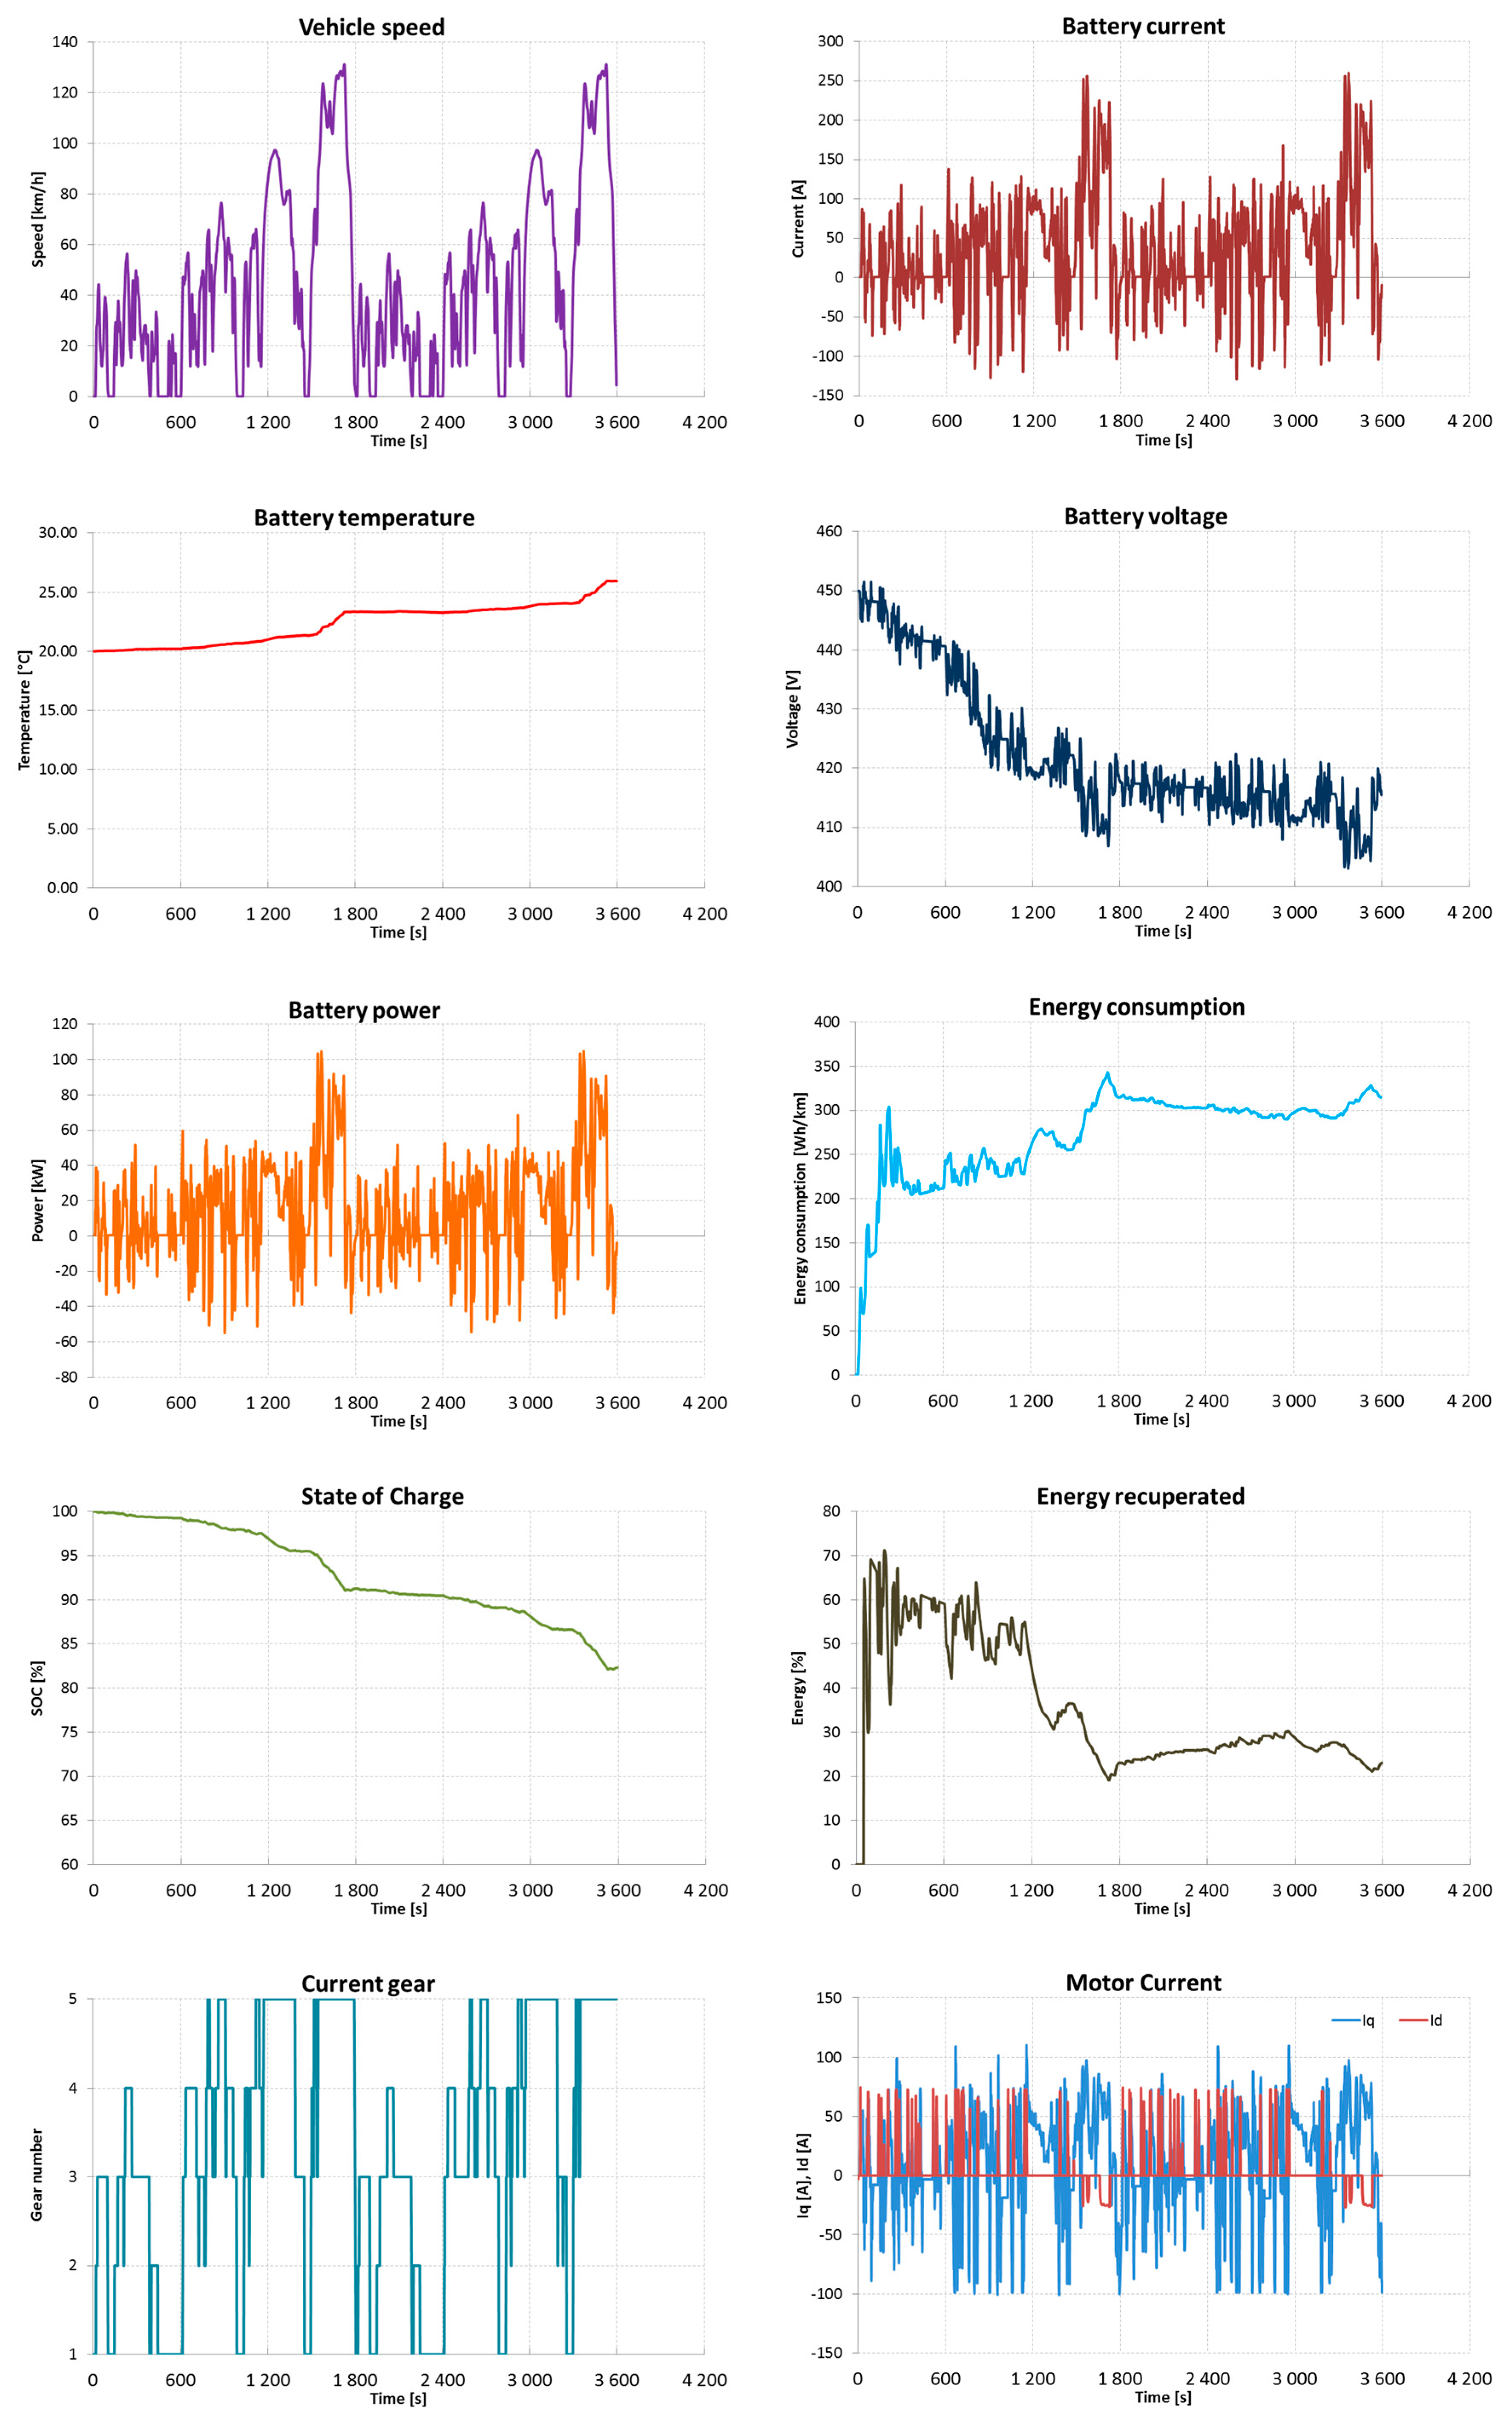
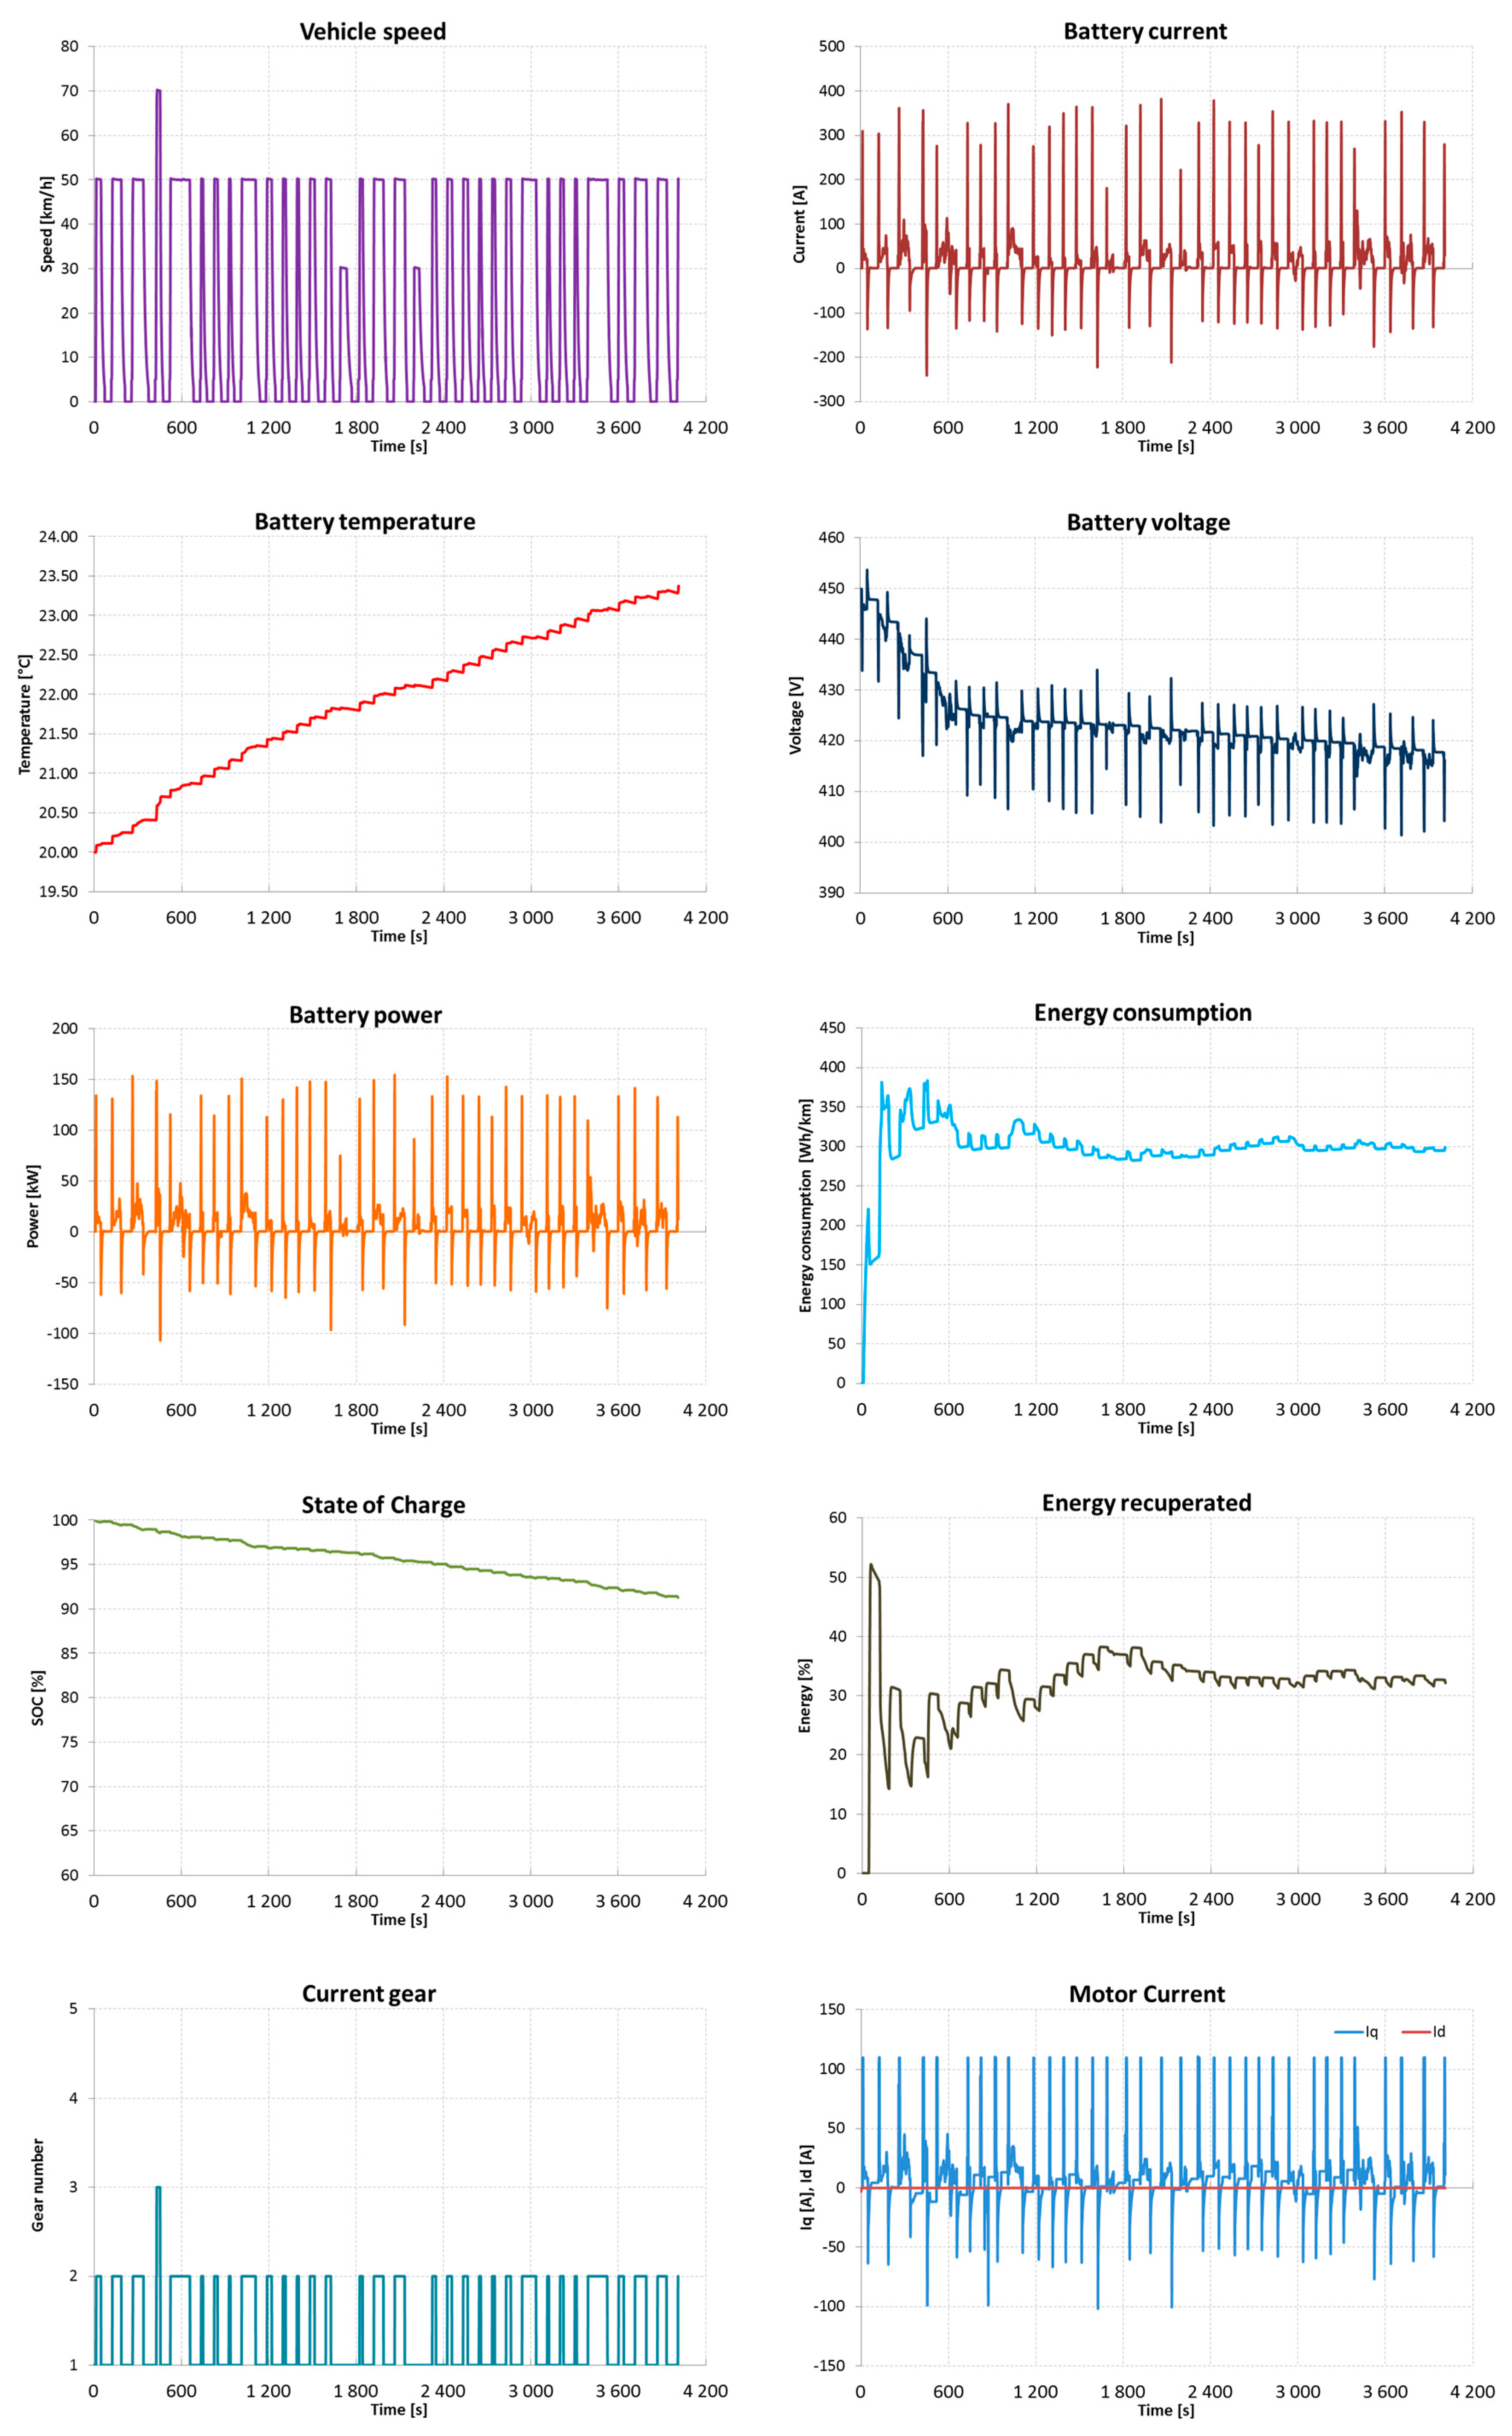
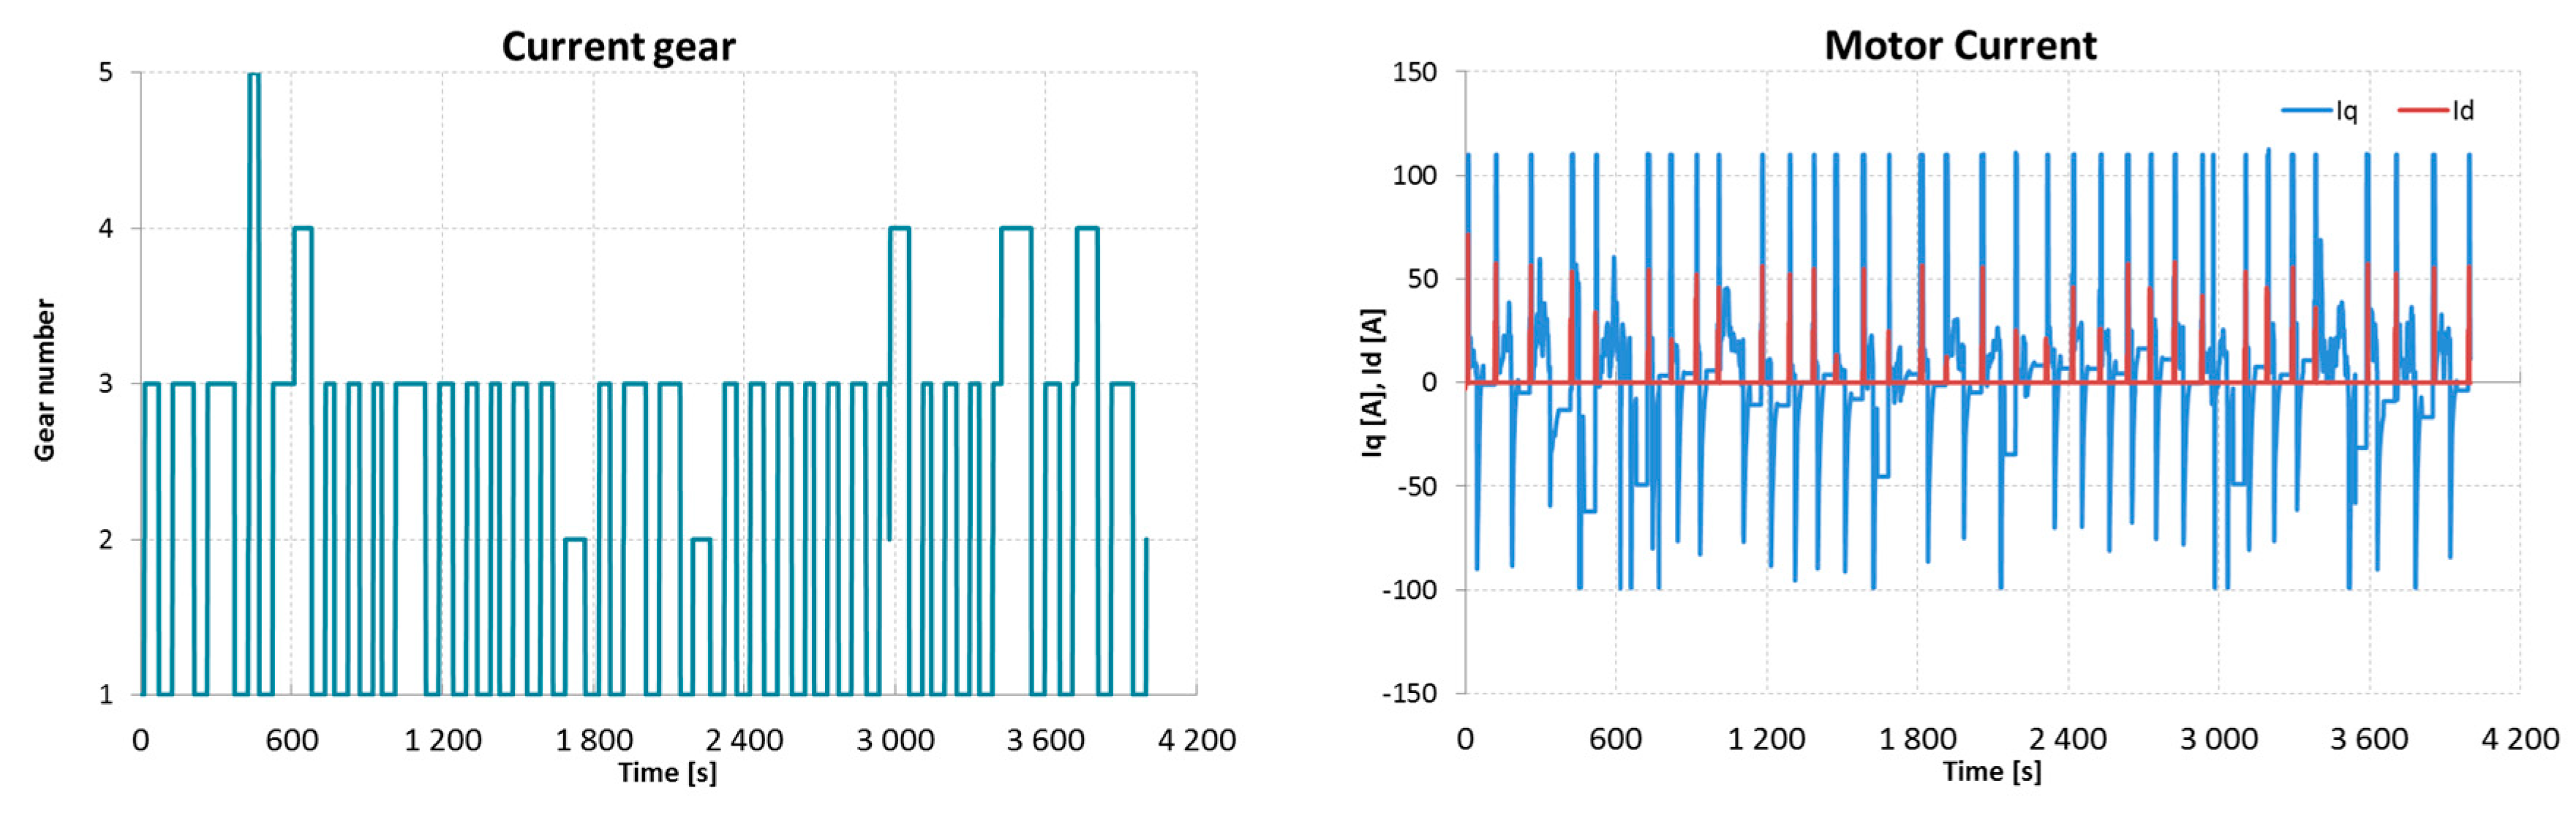
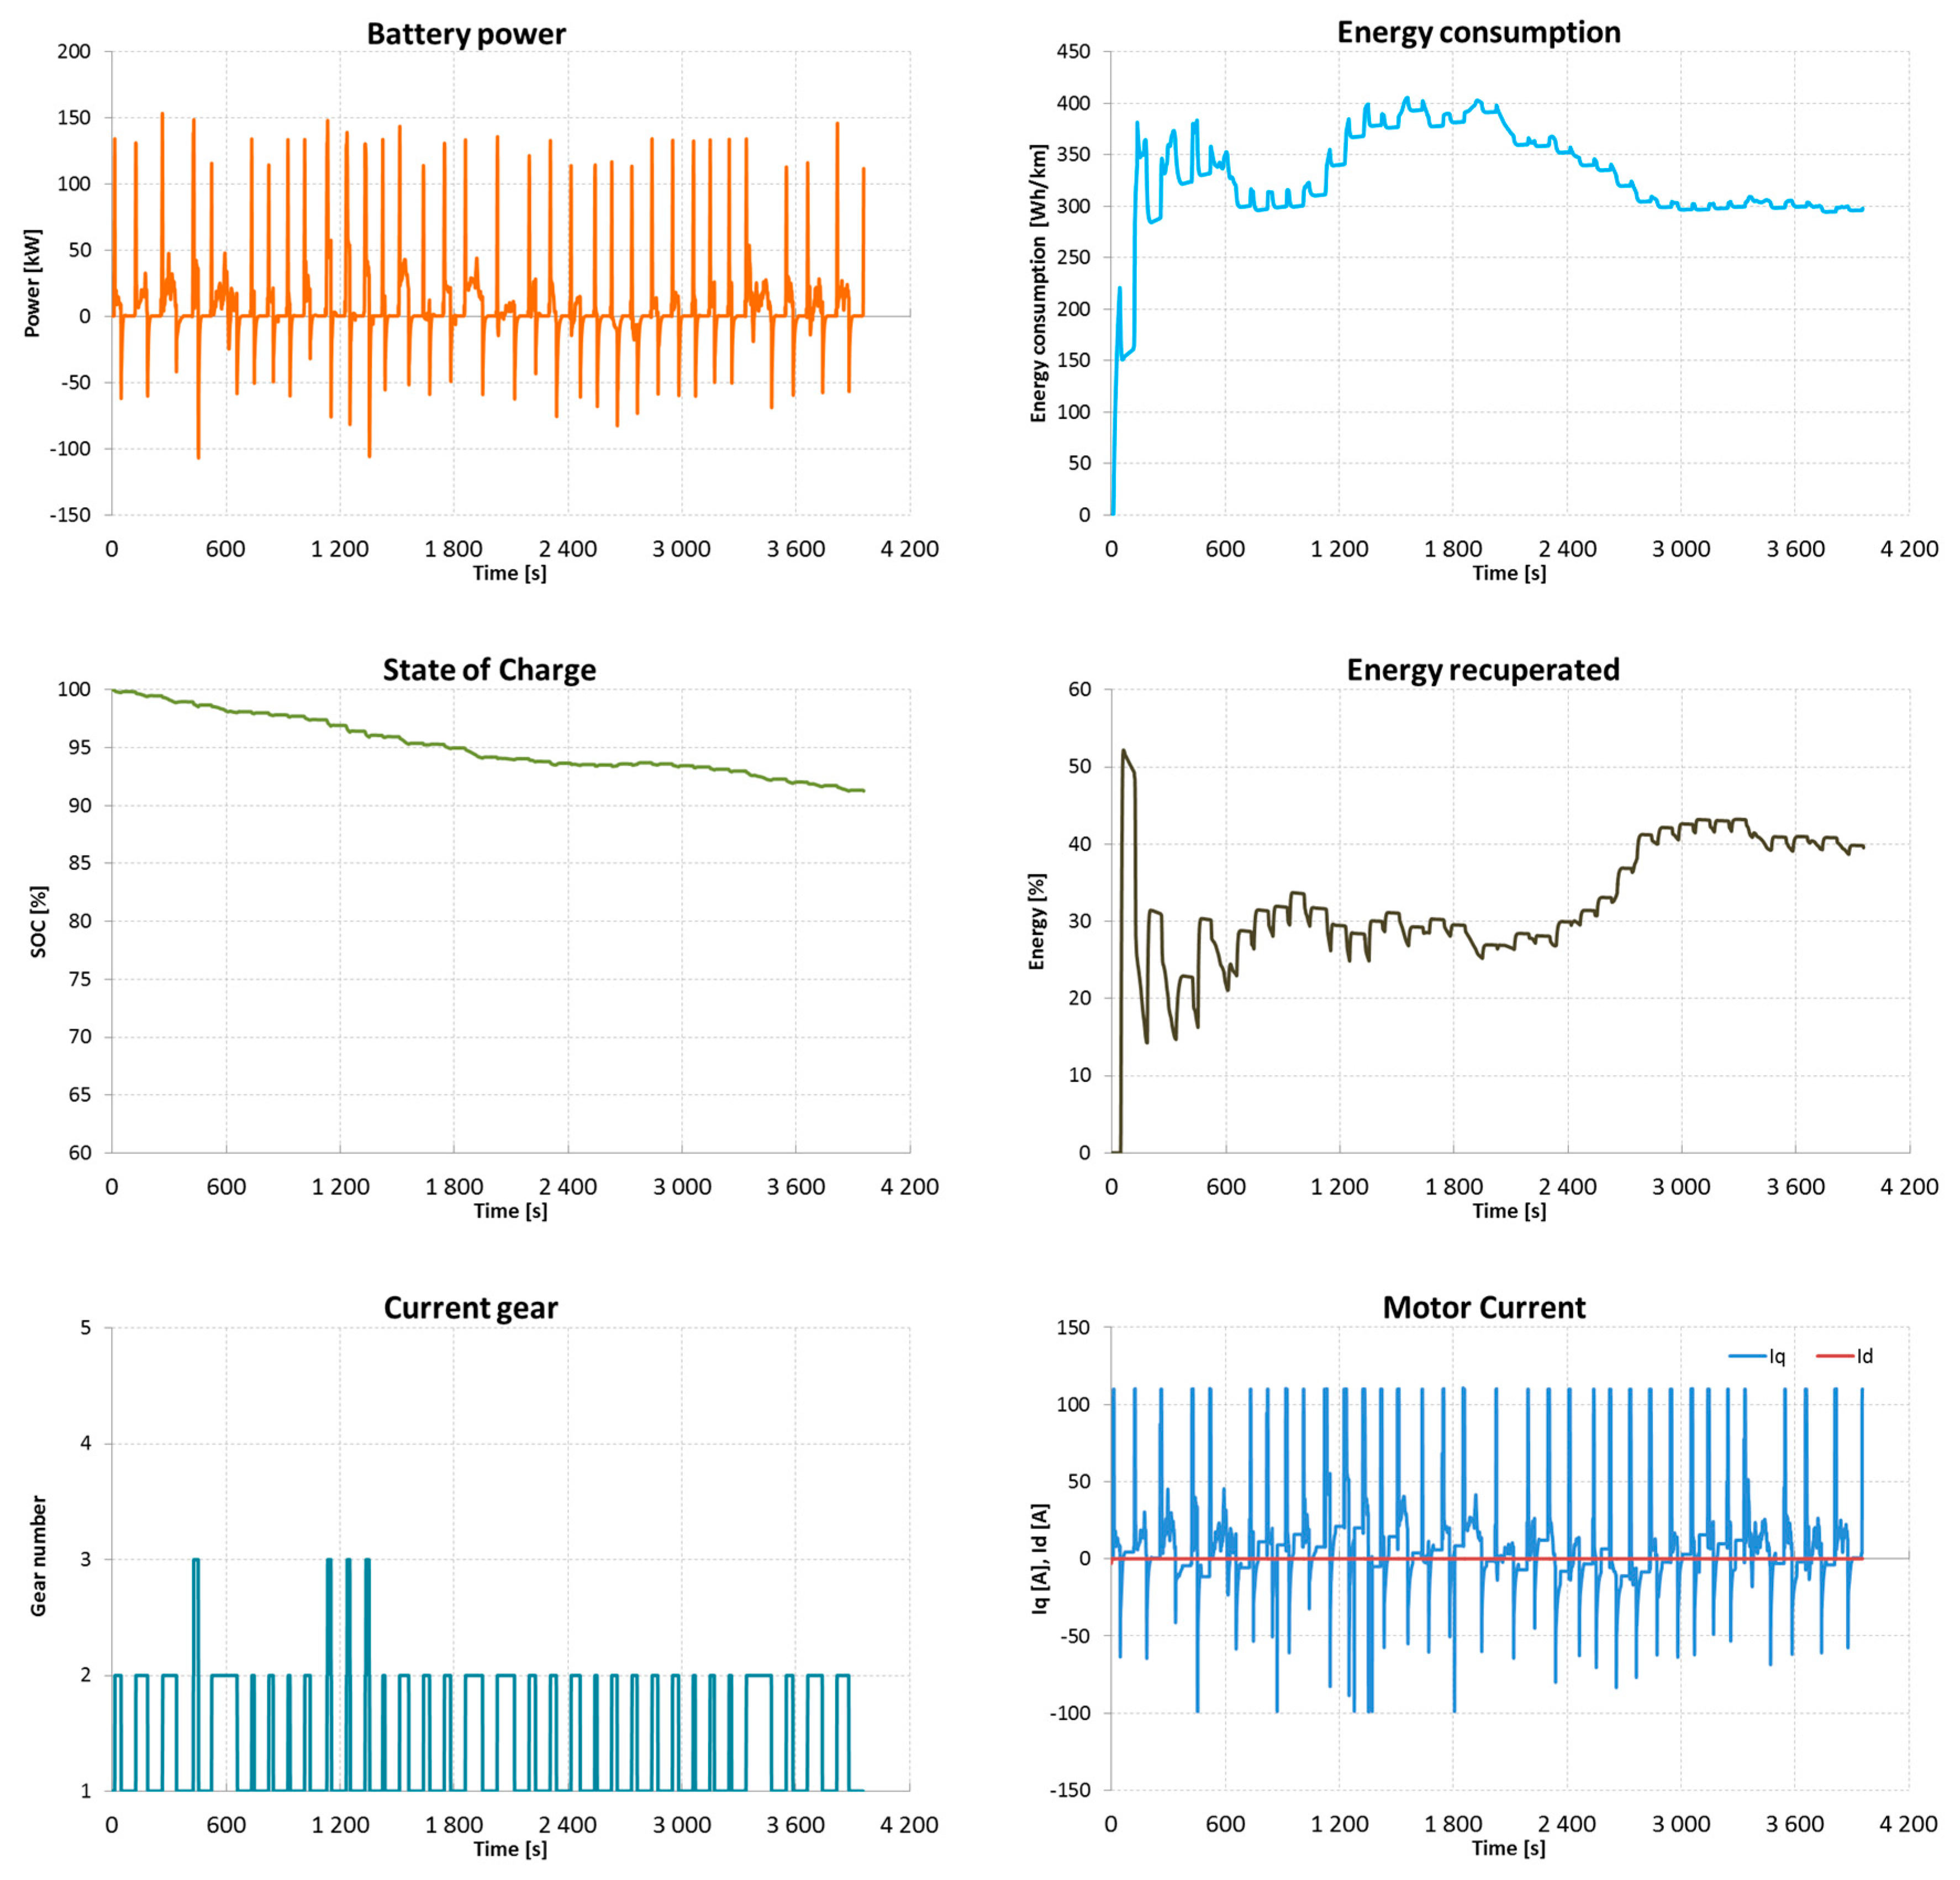
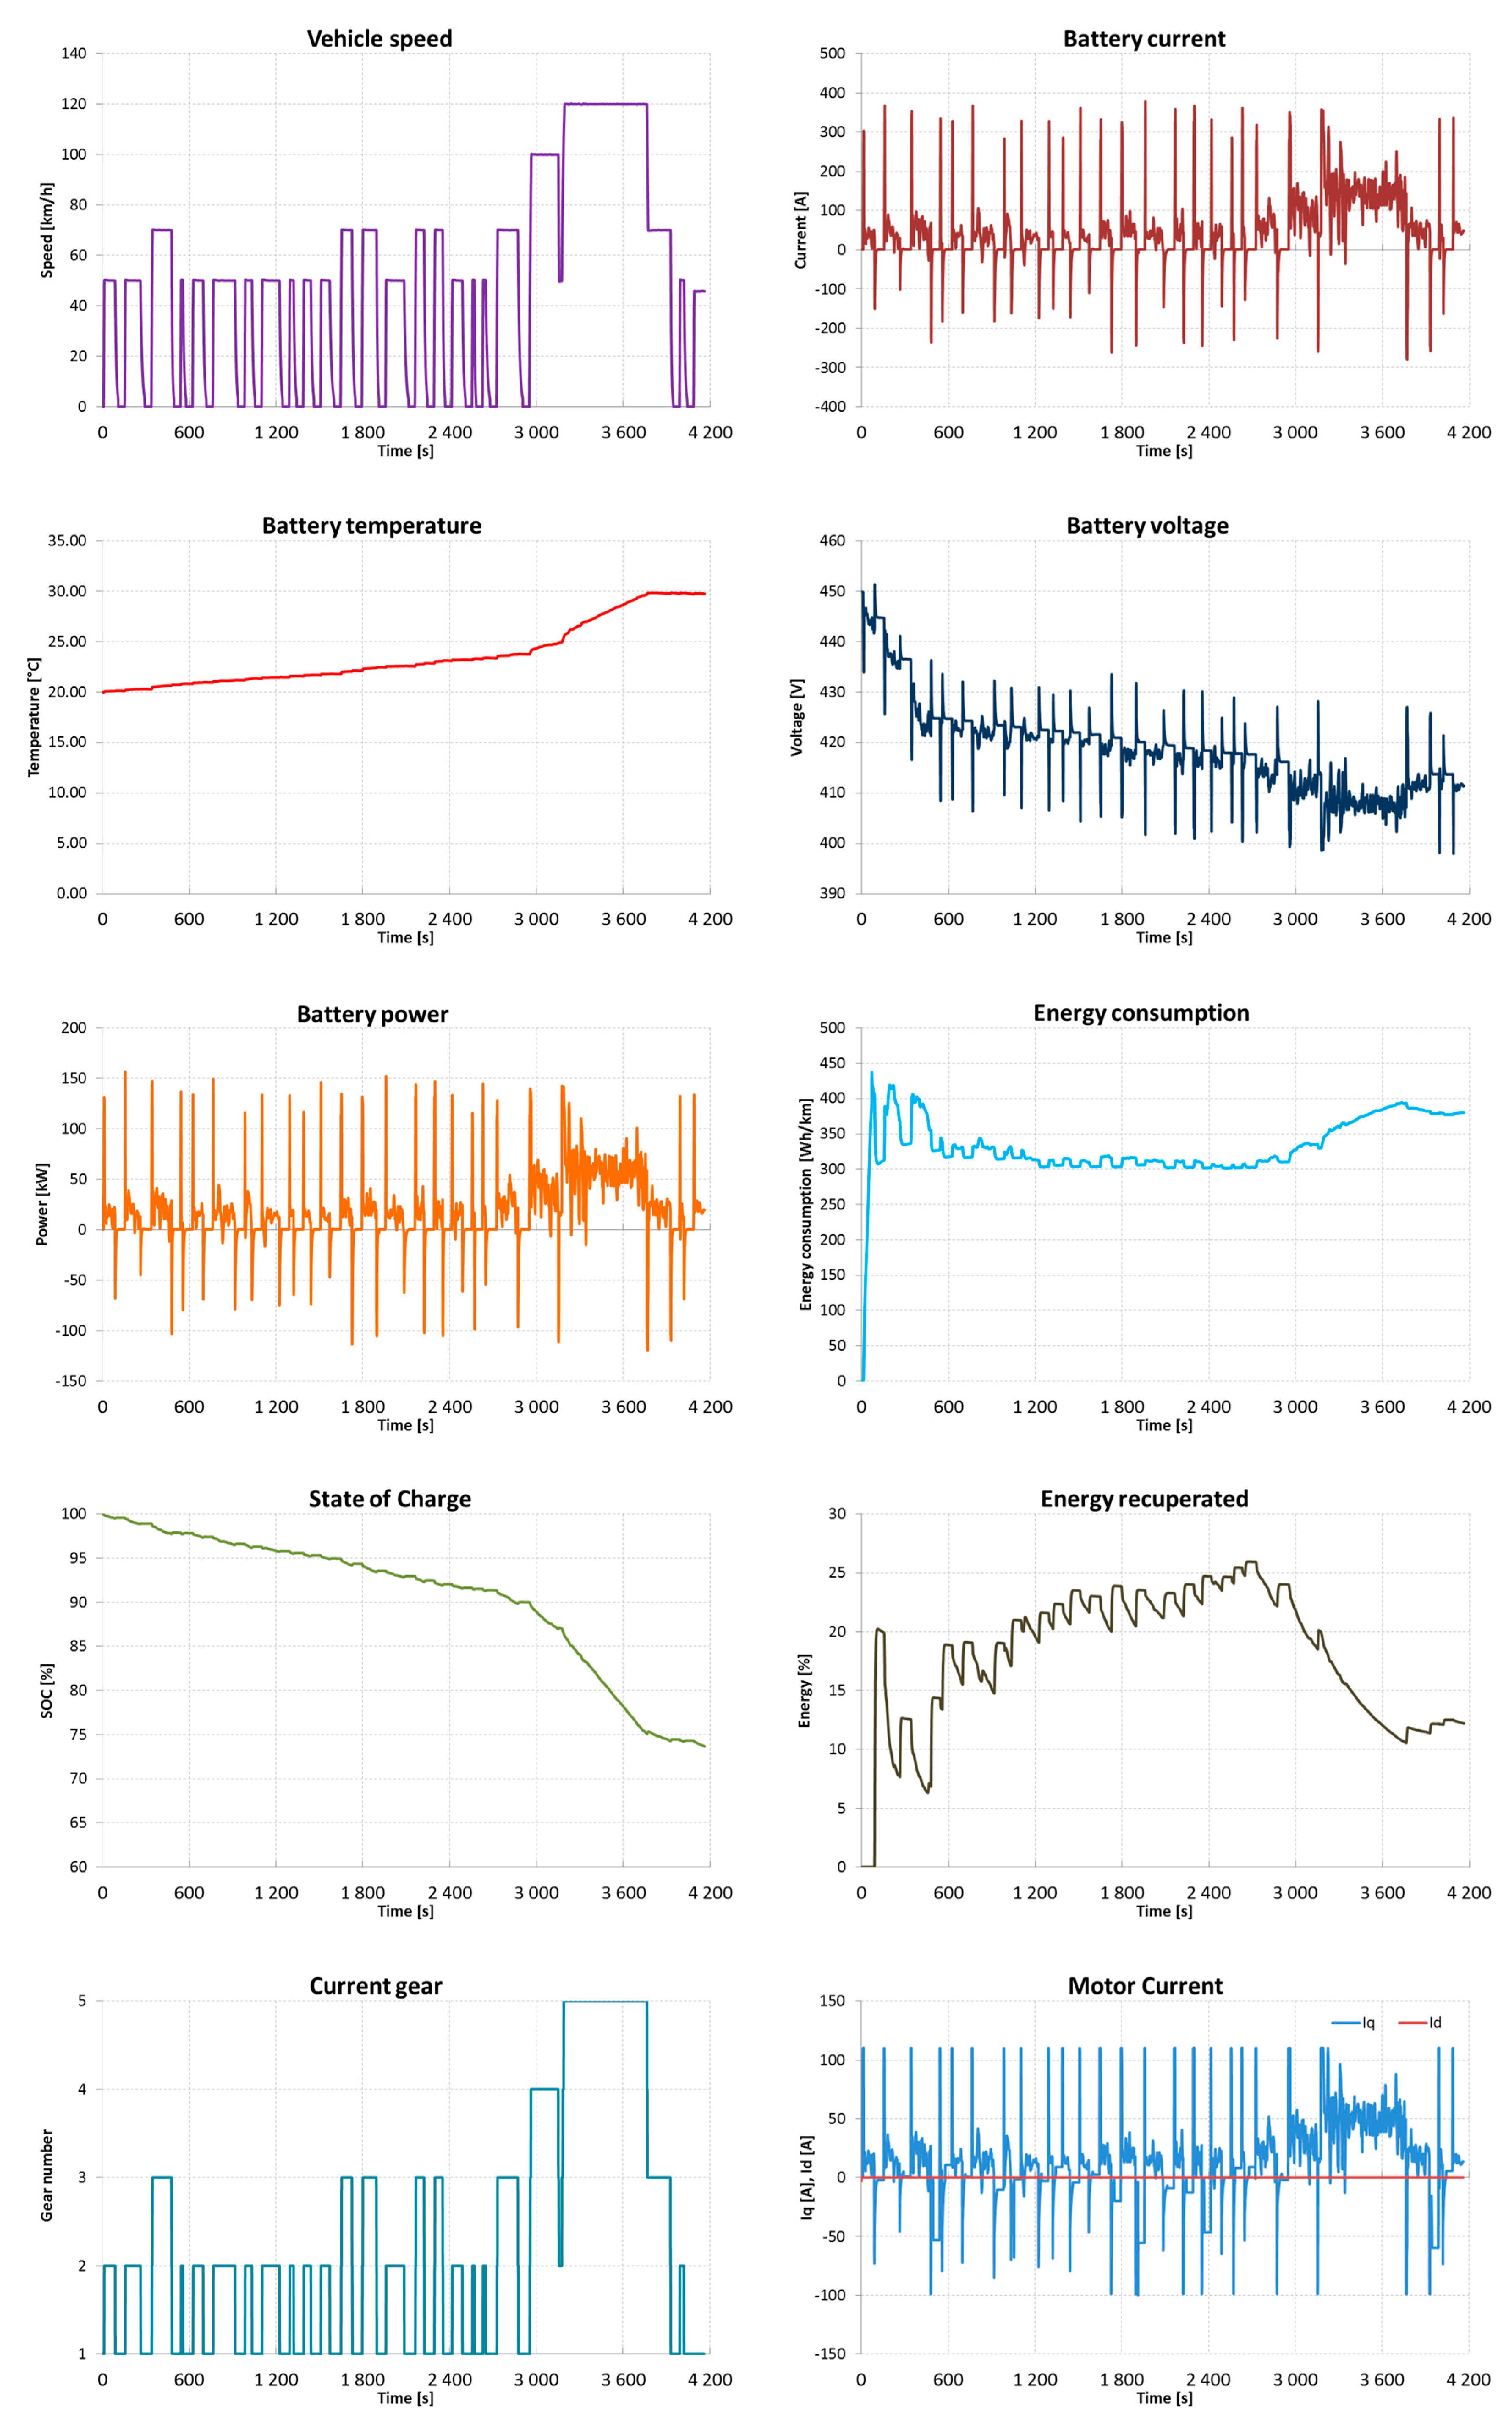
The analysis of the waveforms shown in
Figure 12,
Figure 15,
Figure 18 and
Figure 21, which show the active operation of the energy consumption optimizer by controlling the gear ratios and motor excitation, demonstrated the correct operation of the developed control rules. The places where the current value Id indicates the active operation of algorithms related to both motor excitation and de-excitation are clearly visible. Such work has a positive impact on the vehicle’s ability to achieve high set values of linear speeds.
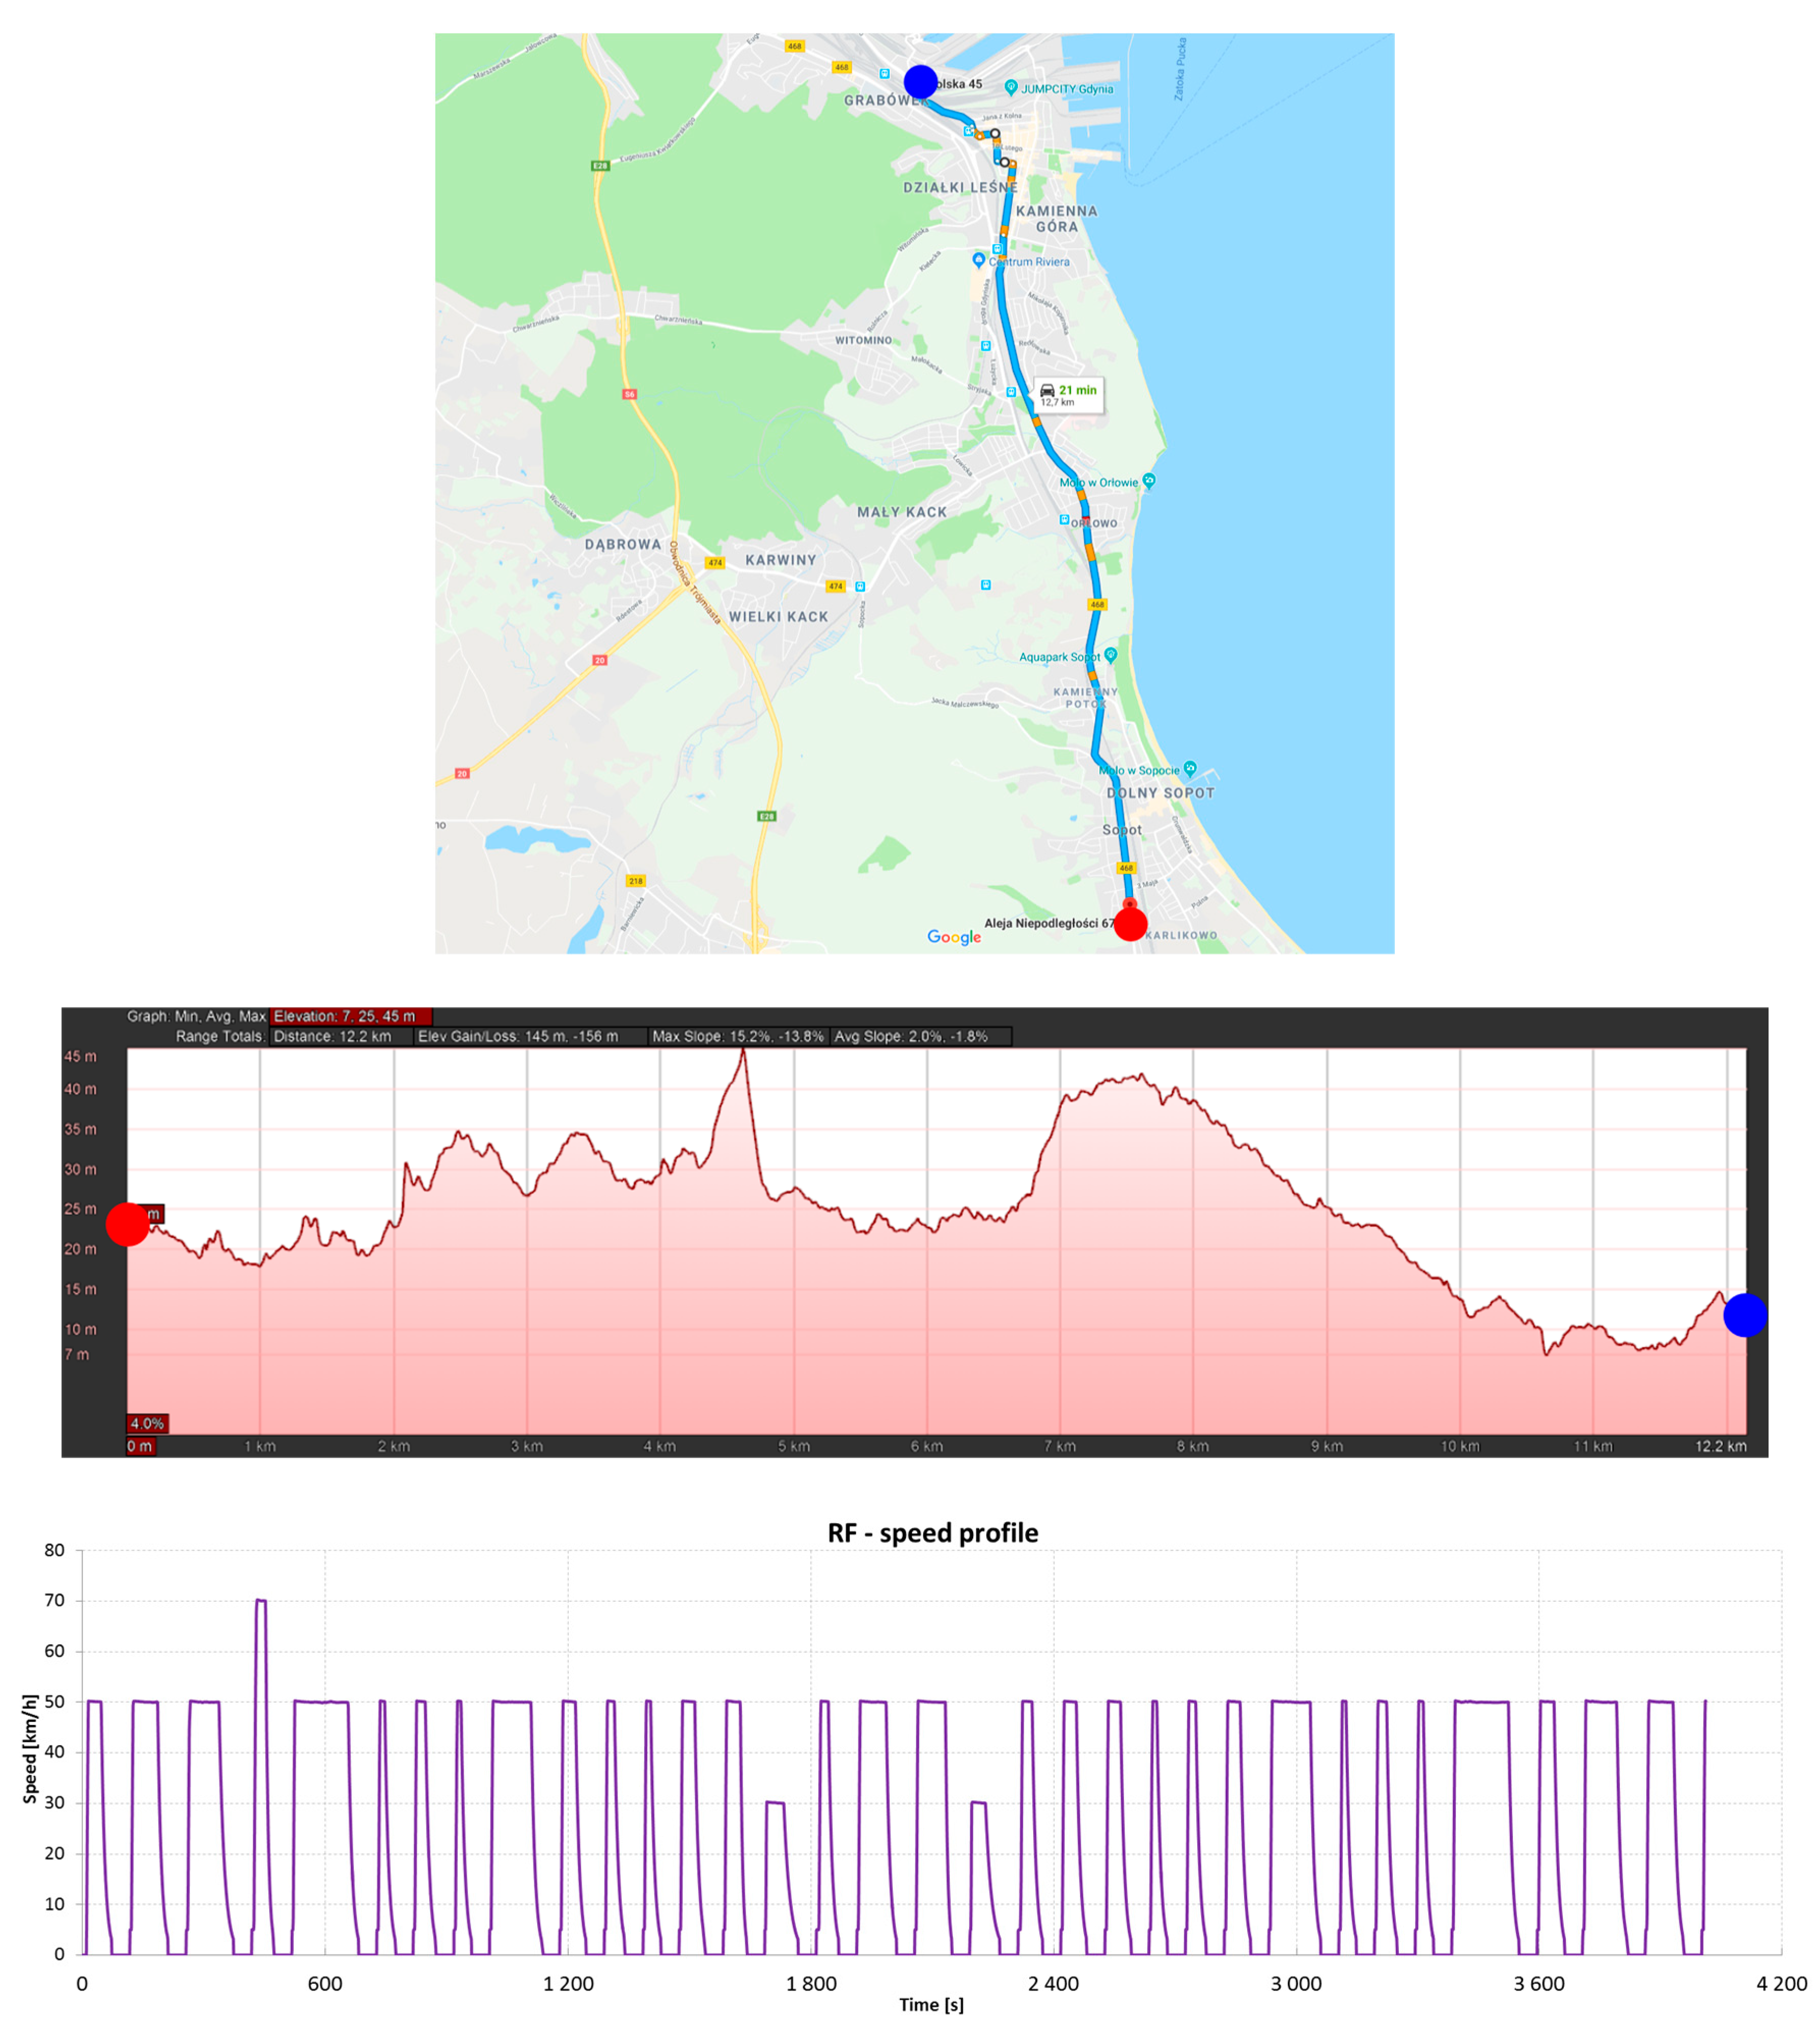
For the RF test cycle, in which the terrain slope was small and changes in the set speed remained practically constant, a small benefit resulting from the use of the optimizer was noted, amounting to approximately 1.5%.
In turn, for the RH test cycle, characterized by large differences in elevation, savings in energy consumption and range increase amounted to 9.9%. This is a very good result, because reducing energy consumption by approximately 10% translates into increasing the vehicle’s range by approximately 10%. At the same time, there were lower CO2 emissions into the atmosphere, possibly related to the production of electricity for the source from which the vehicle’s energy store was powered. It should also be noted that the reduction in energy consumption translates into a longer life of the energy store as its SOC charging level changes, which means that the user carries out fewer charging cycles than if the vehicle were operated without the energy consumption optimizer. The effect of increasing the share of regenerative braking was also noticeable for test routes where the difference in road height was significant.
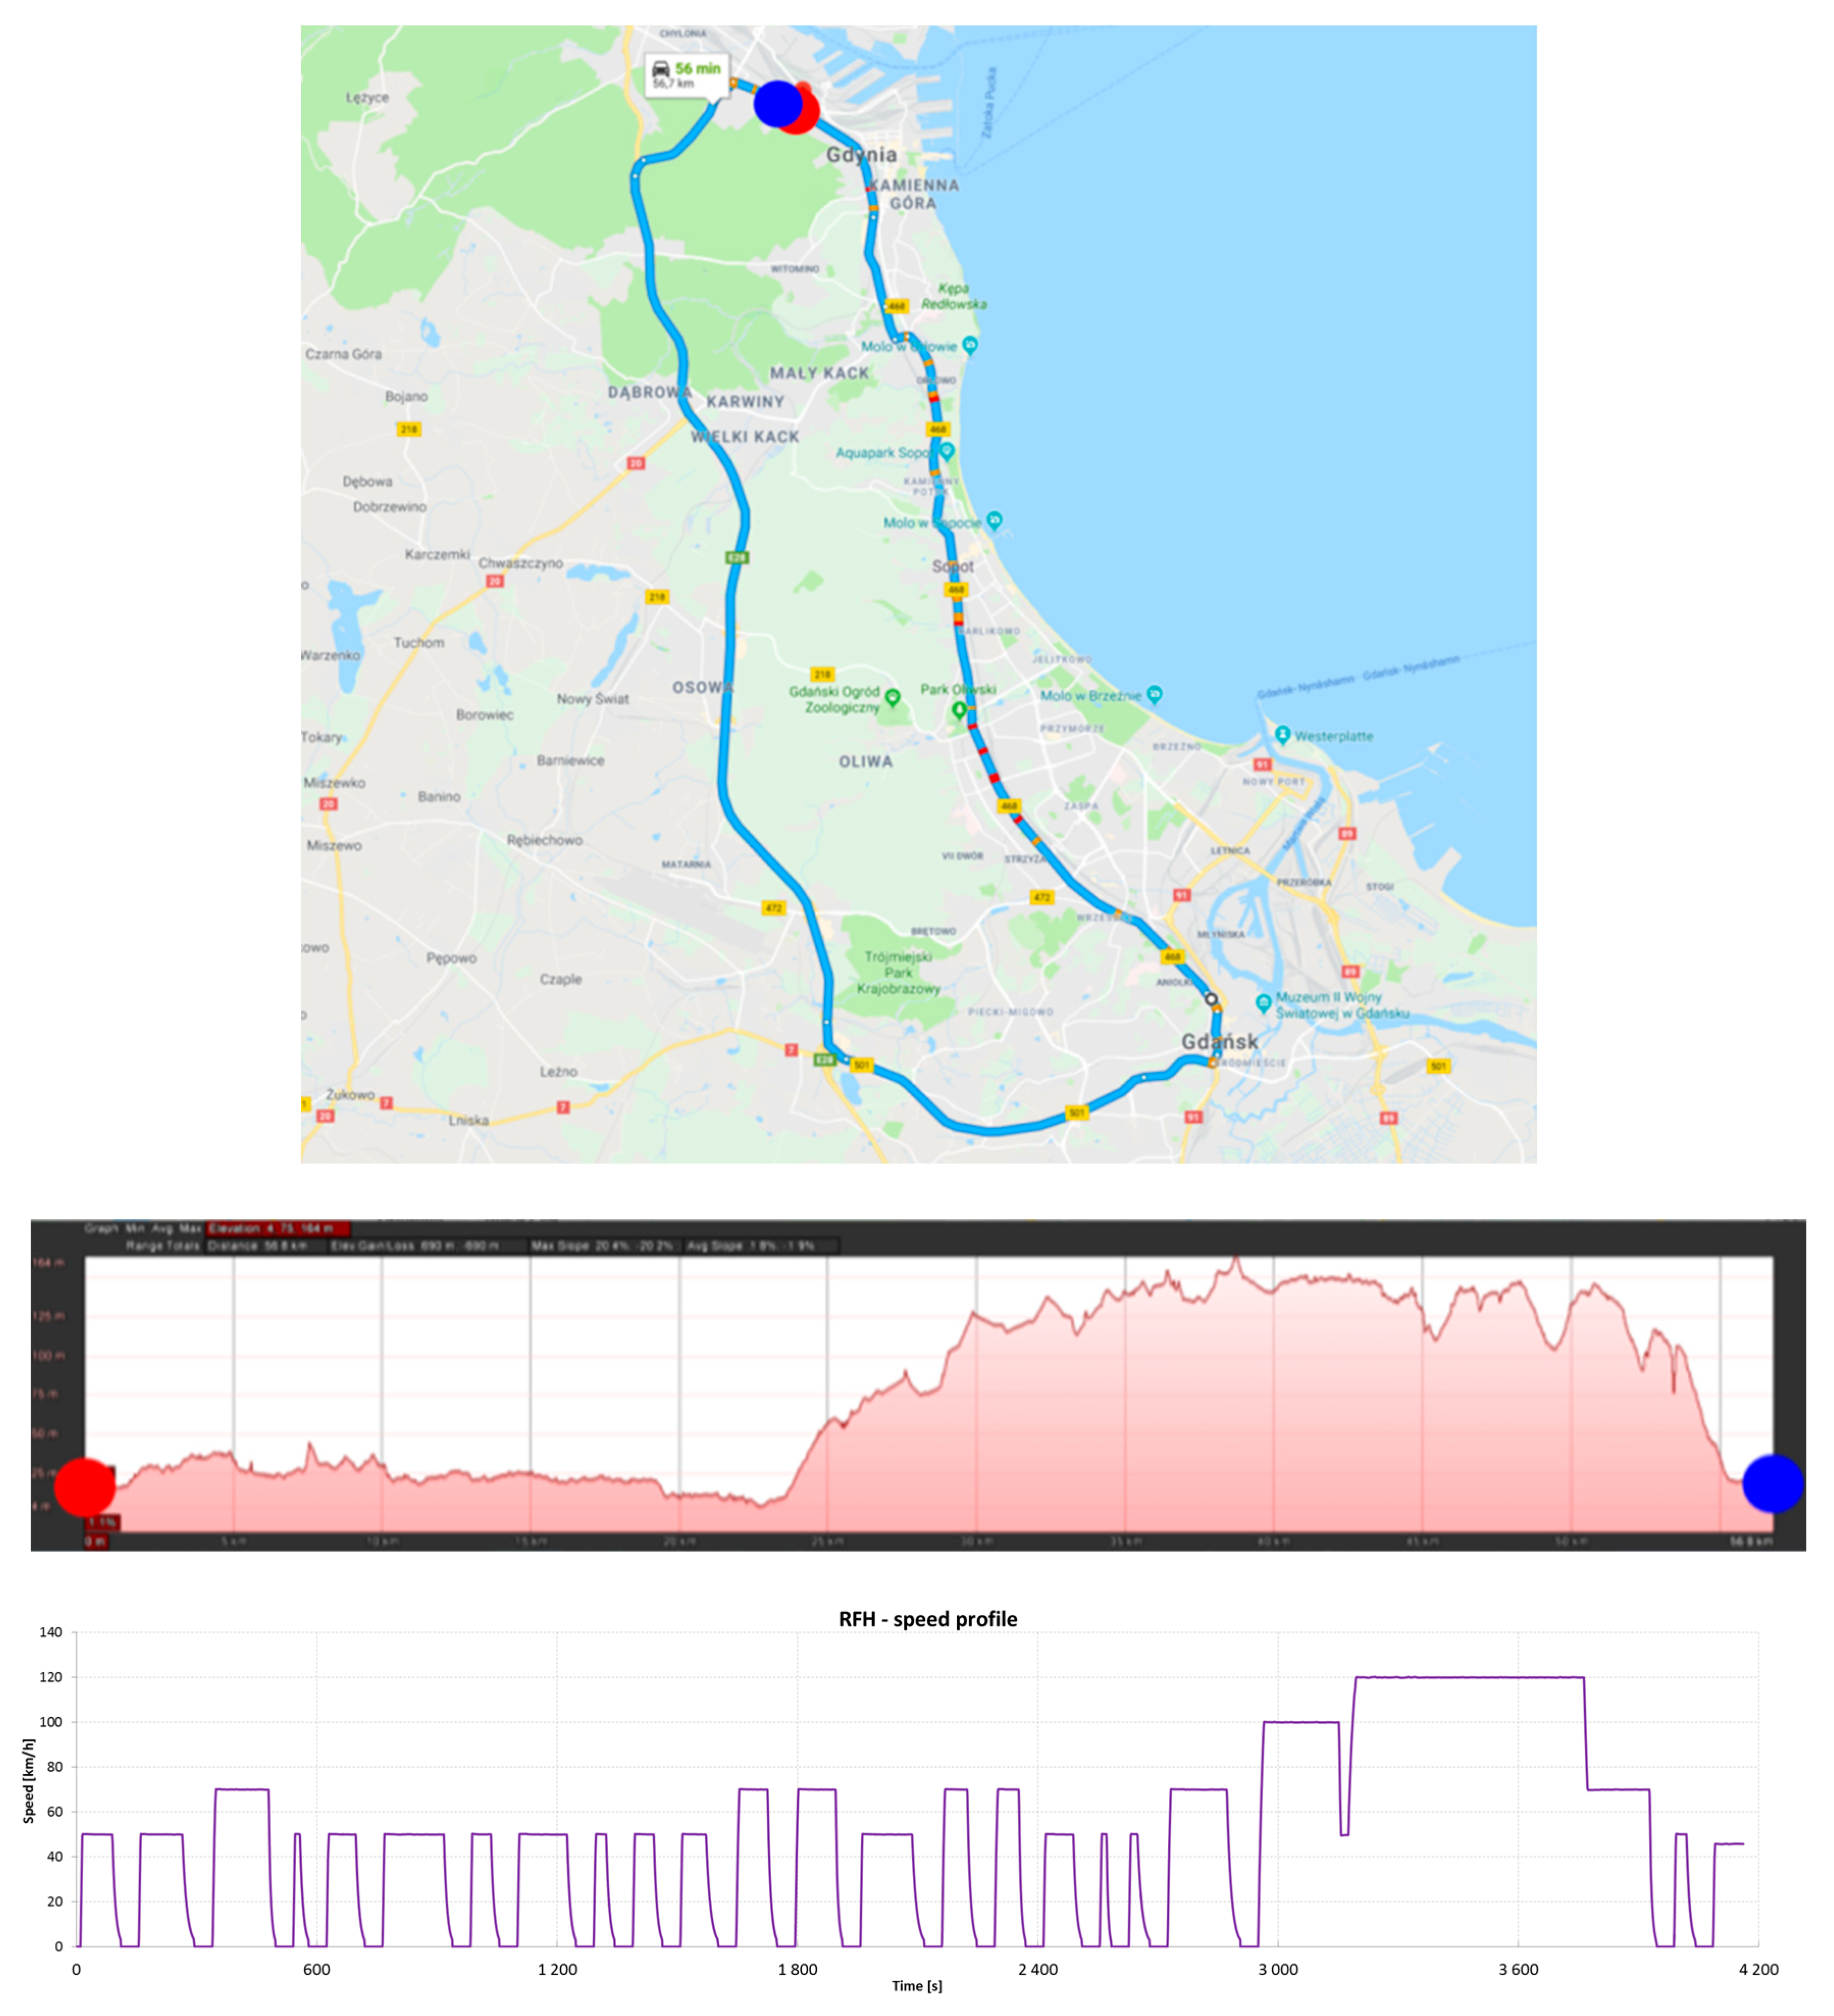
For the RFH test cycle, a reduction in vehicle energy consumption of 4.9% was observed. Although the difference in elevation levels for the considered route was not small, no significant share of energy recovery was observed during regenerative braking. This effect was related to the fact that the RFH test route largely ran through a highway with a relatively high and constant traffic speed, which significantly limited the operation of the energy consumption optimizer.
During the research, situations related to vehicle operation in the presence of low ambient temperatures were not taken into account and nor was variable vehicle loading, including the load on the energy store caused by the thermal conditioning system of the passenger compartment and elements of the electric drive system.


