Article

Optimizing Power Density in Partially Coated Cantilever Beam Energy Harvesters: A Cost-Effective Design Strategy

1
Department of Mechanical Engineering, Khulna University of Engineering & Technology, Khulna 9203, Bangladesh
2
Department of Mechanical Engineering, University of Wisconsin Green Bay, Green Bay, WI 54311, USA
*
Author to whom correspondence should be addressed.
Energies 2024, 17(22), 5572; https://doi.org/10.3390/en17225572
Submission received: 30 September 2024 / Revised: 30 October 2024 / Accepted: 5 November 2024 / Published: 7 November 2024
(This article belongs to the Section D: Energy Storage and Application)

Abstract

:
Cantilever beams with piezoelectric coating are the most widely used form of strain-driven energy harvesting. Almost all prior research on cantilever beam shapes aimed at enhancing energy output accounts for beams fully coated with piezoelectric materials. While a larger coating area, up to a certain limit, can enhance energy output, it also escalates the cost of the structure, as piezoelectric materials are very expensive. Output power density over the length of the beam/piezoelectric material varies significantly. Hence, a partially coated beam with an optimized positioning of piezoelectric material can not only cut the cost of the system but also warrant a higher output power density. On the other hand, optimizing the base beam shape always remains one of the top approaches to increasing the power output. As such, this work aims to select a cantilever beam design by investigating a wide variety of cantilever beam shapes while the beam is partially coated with the piezoelectric material to maximize the power output capacity of the harvester. In the first part of the study, an efficient size of the piezoelectric material and its placement in the host beam are selected based on the power capacity of the system. Next, the selected effective size and placement of the piezoelectric material is implemented in a wide range of cantilever beam shapes (e.g., trapezoidal, triangular, V-cut, concave, and convex) to select a host beam design for maximizing the output power density. To ascertain a comparable argument, the surface area, volume, and mass of all the considered beam shapes are kept consistent, as these parameters influence the power output of the harvester. The geometry of each shape is systematically varied to understand the effect of geometric configuration on the output power density. Additionally, an analysis is conducted to validate that the findings/selection of this study are independent of the thickness of the host beam or piezoelectric material.

1. Introduction

Energy harvesting is the process of converting ambient energy sources such as load, vibration, temperature, etc., into small electrical power. Piezoelectric materials are used for converting vibrations into usable electrical energy in many engineering applications, such as self-powered wireless sensors, radio transceivers, implanted biomedical devices, health monitoring, autonomous charging, automotive applications, etc. [1]. Their high-energy conversion efficiency and compatibility make them potential replacements or energy sources of batteries for small electronic devices. Cantilever beams are typically used for piezoelectric energy harvesting owing to their high average strain compared to other arrangements [2]. The strain profile of beams changes notably with geometry. Hence, the shape of the cantilever beam significantly affects the output power density.

1.1. Effect of Host Beam Shape on Power Output

Several studies on cantilever beams are available in the literature. These studies have mostly focused on enhancing the output power and working range. Baker et al. [3] analyzed various beam shapes with the goal of enhancing power output. Their findings showed that a cantilever beam with a trapezoidal footprint has the ability to generate 30% more power per unit volume compared to traditional rectangular beams. Zhang et al. [4] reported that the trapezoidal shape of a cantilever beam is more effective than that of a rectangular beam for piezoelectric energy harvesting. However, the experiment was performed for a small cantilever where the root width was greater than the beam length. In a computational study, Rosmi et al. [5] optimized the output power and demonstrated that modification of the micro-cantilever beam geometry can enhance the output power. A comprehensive study of rectangular and trapezoidal cantilever beams of the same volume, where the length of the trapezoid beam was increased to obtain the same volume, suggested an improved strain distribution and output power from the trapezoidal shape [6]. In another study, Benasciutti et al. [7] analyzed two trapezoidal configurations and found a significant increase in power per unit volume compared to rectangular counterparts. Lei et al. [8] examined different shapes of a cantilever beam and concluded that the truncated triangular beam provides a larger power output. Chen et al. [9] suggested a triangular cantilever beam over rectangular and trapezoidal cantilevers after analyzing these three geometries with uniform base widths and lengths. A similar investigation on microscale beams was conducted by Alameh et al. [10]. Goldschmidtboeing et al. [11] investigated various beam shapes for piezoelectric energy harvesters using the Rayleigh–Ritz method, and the study revealed that triangular-shaped beams contain greater effectiveness due to improved curvature homogeneity. An analysis conducted by Muthalif et al. [12] also showed the higher power-generating capability of a triangular shape over rectangular and trapezoidal-shaped beams due to uniform strain distribution. Additionally, it has been reported that the comb-shaped beam structure increases the number of natural frequencies within the desired frequency range. Karadag et al. [13] utilized a finite element-based method to analyze the carved-shaped width profile. Their findings revealed a 22% increase in strain uniformity with an optimized curved width compared to a triangular beam without a tip mass. Additionally, when a 5 g tip mass was introduced, there was a 29% increase in stress uniformity. Yang et al. [14] incorporated an arc-shaped piezoelectric energy harvester, demonstrating a power generation capability 2.55 to 4.25 times higher than flat plate counterparts, and the design also exhibited a lower resonant frequency. Ibrahim et al. [15] reported an 18.52% increase in output power by the utilization of a gauge-shaped beam in comparison to conventional piezoelectric energy harvesters. Raju et al. [16] introduced specially designed piezoelectric energy harvesters, one with a rectangular section from the root followed by a tapered section (RTCB) and the other type with a tapered section followed by a rectangular section (TRCB), and suggested that TRCB can produce 79% higher voltage. Mohamed et al. [17] optimized five distinct energy harvester shapes, including the T-shaped, rectangular, L-shaped, variable width, and triangular configurations. The results showed that the T-shaped cantilever produced the highest harvested power which surpassed the power generated by the triangular shape by a factor of 3.4.

1.2. Effect of Host Beam Tapering/Thickness on Power Output

Pradeesh et al. [18] numerically investigated the effect of taper in thickness and width on cantilever beams and suggested that an inverted taper in thickness and width can produce more power than a typical rectangular cantilever [19]. Another investigation conducted by Hajheidari et al. [20] concluded that tapering in thickness can significantly improve the power output. Mahreen et al. [21] reported that a tapered cantilever provides a uniform strain profile compared to rectangular and trapezoidal beams with uniform thickness, leading to an improved output power. According to Ibrahim et al. [22], using a taper in thickness is more effective in power output than using a taper in width. Paquin et al. [23] performed a semi-analytical investigation on the impact of slope angle in a tapered cantilever piezoelectric energy harvester, and the optimal slope angle was found to be 0.94 degrees, resulting in an increase in harvested power of 3.6 times compared to constant thickness harvester. This improvement is reported due to the more uniform strain distribution achieved by the tapered shape. Xie et al. [24] introduced a piezoelectric energy harvester using a tapered cantilever surface bonded with piezoelectric patches and found that the tapered harvester could achieve electric power up to 70 times higher than uniform cantilevers. However, Matova et al. [25] investigated the effectiveness of tapered beams in MEMS piezoelectric energy harvesters and suggested that the tapering of short and wide beams does not affect the power output. Kim et al. [26] analyzed the effect of the thickness of the elastic layer on the output power for the same piezoelectric layer dimension and proof mass with a unimorph setting. The analysis showed an increase in output power with substrate layer thickness at the beginning that started to fall again after reaching a maximum. The result suggests that the thickness of the substrate layer should be optimized for maximum power output.

1.3. Effect of Geometry and Positioning of the Piezoelectric Material in Host Structure on Power Output

Patel et al. [27] examined the influence of the piezoelectric layer geometry over a rectangular beam and proposed a shorter and thinner piezoelectric layer over the host material to obtain a significant increase in energy storage. The effect of the length of the piezoelectric material segment on the resonance frequency, output power, and working range was reported by Salem et al. [28]. Pradeesh et al. [18] numerically investigated the effect of the position of the piezoelectric material and proof mass on the performance of a piezoelectric energy harvester. It was observed that when a piezoelectric material was placed at the fixed end, the energy harvester produced maximum power. In an analytical exploration of a partially coated piezoelectric energy harvester, Hosseini et al. [29] revealed that width reduction is an effective method to maintain the fundamental natural frequency and improve harvested power. Zhou et al. [30] examined the performance of a piezoelectric simply supported beam energy harvester by changing the length of the piezoelectric material over the beam and showed that energy harvesting performance can be improved by optimizing the length of the piezoelectric layer. In an investigation, Fu et al. [31] found that increasing electrode coverage up to 66.1% led to increased output power, but beyond this point, further increase in coverage area resulted in decreased output. Hu et al. [32] demonstrated that variation in piezoelectric coverage in the higher range resulted in nearly constant maximum power. Du et al. [33] suggested that the piezoelectric area corresponding to less than 31% of the maximum bending stress should not be included in the active electrode region.

1.4. Advances in Piezoelectric Energy Harvesting Mechanisms

Wang et al. [34] improved galloping piezoelectric energy harvesters by integrating nonlinear magnetic forces, using a piezoelectric cantilever attached to a square bluff body with magnets positioned to create restoring forces. This design lowered the energy harvesting threshold wind speed by 33% compared to conventional galloping energy harvesters. Deng et al. [35] introduced a novel galloping energy harvester design featuring a U-shaped base with piezoelectric material to enhance stability and efficiency at high wind speeds by limiting amplitude to prevent base damage and promoting higher-frequency vibrations through rigid barrier limitations. Huang et al. [36] analyzed the dynamics of bio-inspired energy harvesters under harmonic excitation, uncovering how gravity, equivalent stiffness, and damping influence the harvester’s electrical output, including RMS voltage and power. Their findings highlighted complex behaviors, including bifurcations and chaotic responses, which were closely linked to changes in system parameters. A T-shaped piezoelectric cantilever beam to harness energy from fluid flow through an aeroelastic flutter was introduced by Kwon et al. [37]. This design, containing a T-shaped bimorph cantilever with a rectangular main body, accelerated the onset of flutter at low fluid speeds, achieving a maximum power output of 4 mW at a wind speed of 4 m/s. In recent times, researchers have advanced the integration of electromagnetic [38], triboelectric [39], and electrostatic [40] energy harvesting techniques with piezoelectric cantilevers to create hybrid systems.

1.5. Model/PZT Dimension from an Economics Perspective

It is important to note that the cost of an energy harvester increases with the increased coating area, as piezoelectric materials (PZT-5A) are pretty costly (~0.13 USD/mm3 [41]). It has been found that the power output of a cantilever beam energy harvester can be more than five times when the length of the base beam is increased threefold compared to a setup where the base beam and piezoelectric material are of equal size. It is important to note that the length of the PZT remains constant in this comparison [42]. While opting for a larger base beam entails increased material costs, it is notable that aluminum, commonly used for the base beam, is over 50 times cheaper than piezoelectric materials (such as PZT-5A), with a cost of approximately USD 0.00015 per cubic millimeter [43]. Hence, it is evident that for cost-effective optimization of power output, cantilever beams with partially coated piezoelectric materials are more effective than those fully coated.
Based on the review, numerous studies have been conducted to analyze various cantilever beam geometries to enhance the power generation capacity of cantilever beam energy harvesters. Most of these studies have focused on rectangular, trapezoidal, and triangular beam shapes. This work, however, examines additional shapes, including concave, convex, and V-cut cantilever beams, to find the optimal shape for maximizing power output. Additionally, while most research on optimizing beam shapes has involved coating the entire beam with piezoelectric material, this study explores a more cost-effective approach by only coating a portion of the beam. Consequently, this research aims to achieve two main objectives: (a) cost-effectiveness and (b) maximizing the power output of the harvester.
This work conducts a comprehensive study to determine the optimal geometric configuration for maximizing power output from various beam shapes. The study is carried out in two steps. The first step involves identifying an effective ratio of piezoelectric material (PZT) to the base beam for economical yet maximized energy harvesting. In the second step, using the effective PZT-to-base beam ratio identified in the first step, different cantilever beam shapes (e.g., trapezoidal, triangular, concave, convex, V-shaped) are analyzed to find the most efficient configuration for maximizing power output. The analysis is performed while maintaining a constant surface area and thickness for both the beam and the piezoelectric material. This consideration is crucial for a rational comparison of the different beam shapes. However, most previous research has overlooked this important aspect in their analyses.
Cantilever beam-based energy harvesting primarily relies on the structural resonance of the beam, which is significantly influenced by the beam’s mass distribution. Therefore, when the shape of the beam is changed to increase power output, its resonance frequency can also change. This study presents a relationship to understand how the resonance frequency depends on the geometric variations of each beam shape.

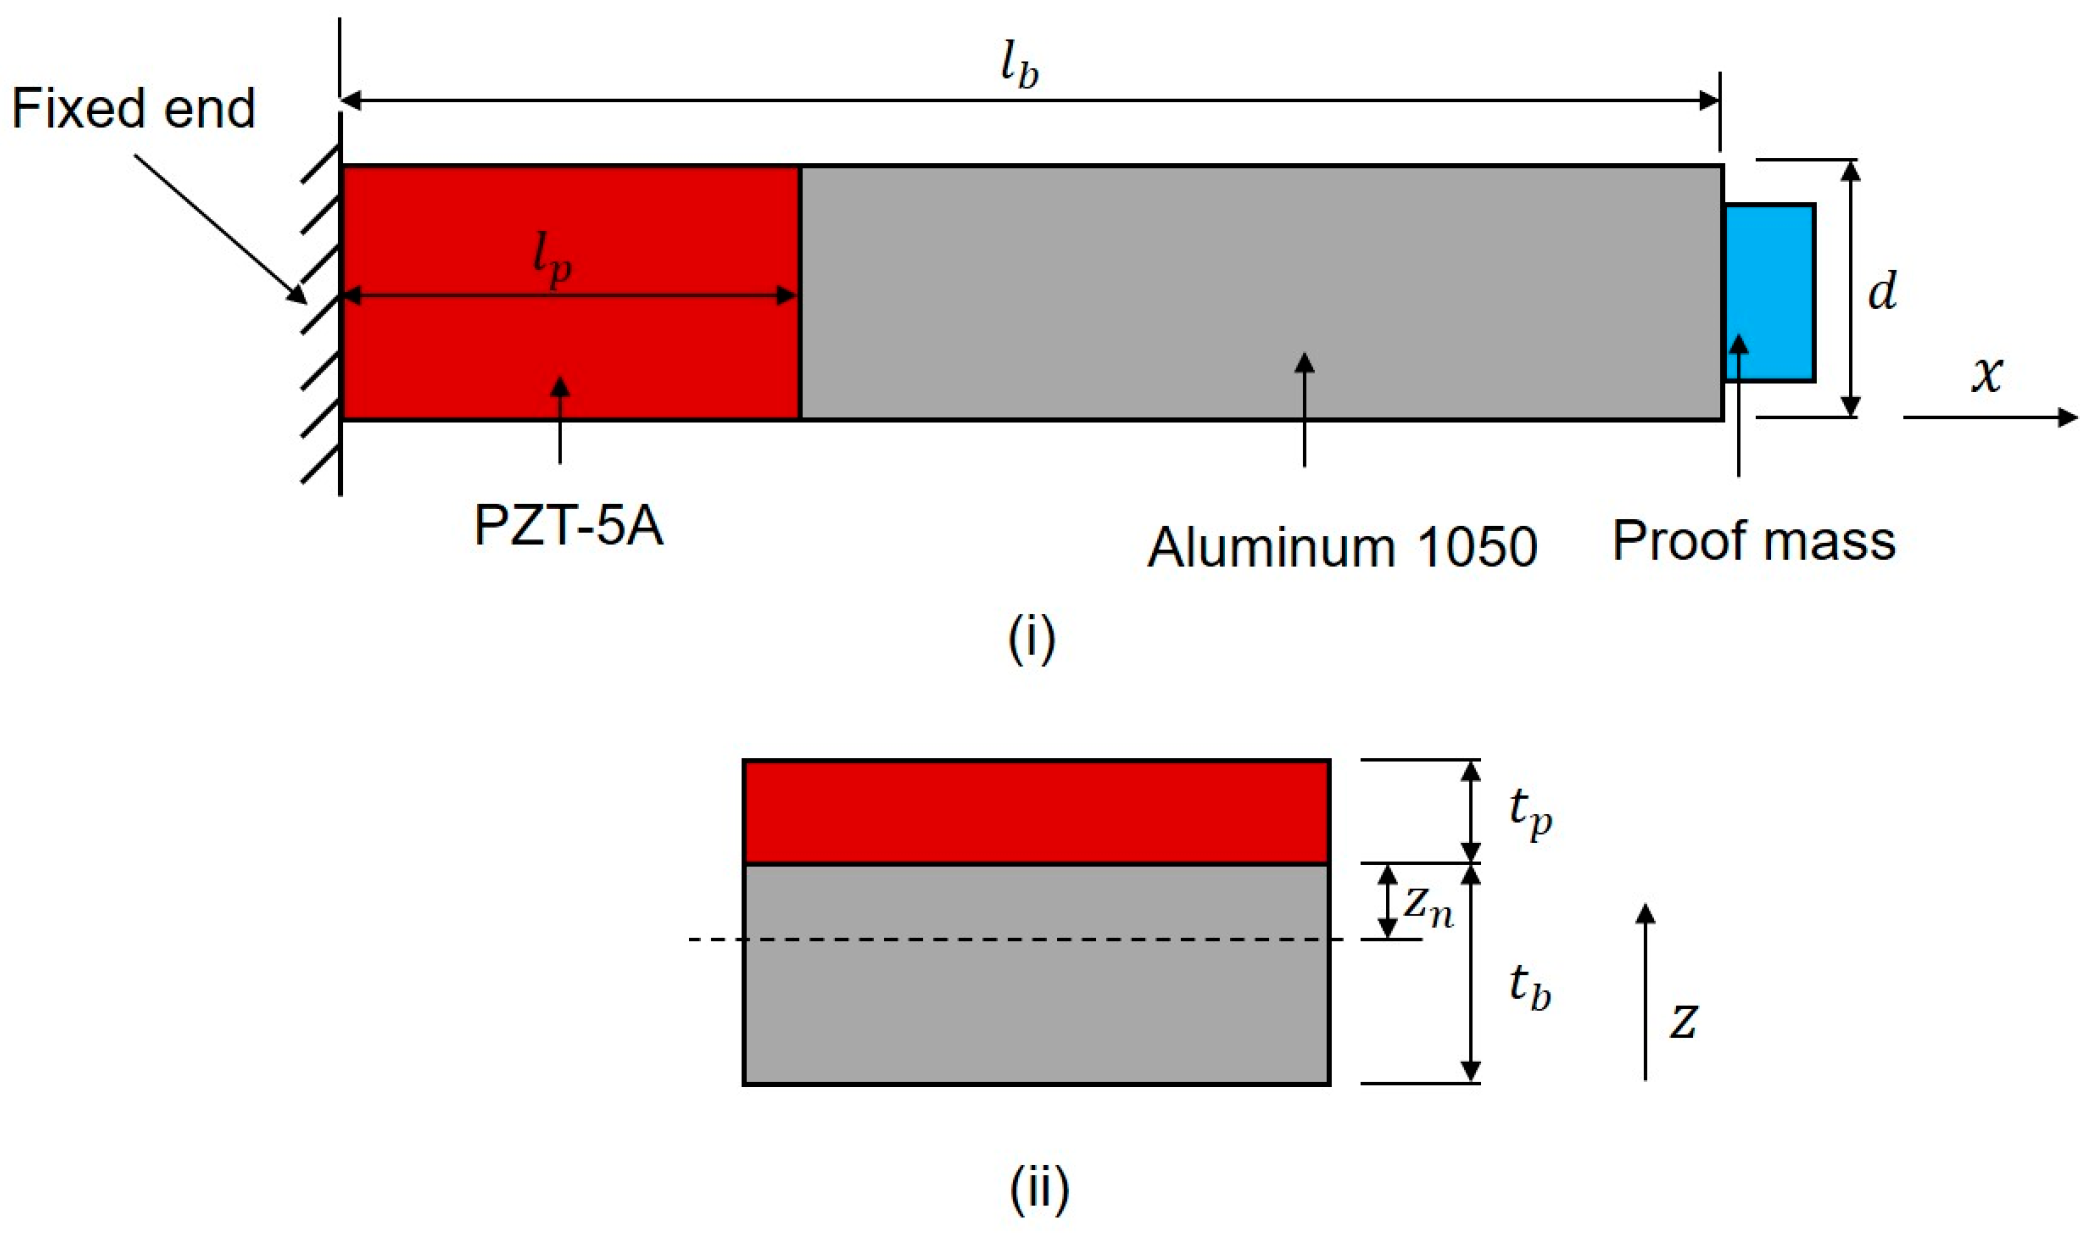
2. Theoretical Background

A model for an energy harvester was developed specifically for a rectangular beam, depicted in Figure 1 which is divided into two sections: one incorporating piezoelectric material and the other without. The bending vibration of this beam is analyzed using the Euler–Bernoulli beam theory. The governing equations of motion for the two sections of the beam are expressed as follows:
( E I ) 1 4 u ( x , t ) x 4 + c c u ( x , t ) t + ρ p t p + ρ b t b d 2 u x , t t 2 = g 0 S i n ω a t [ ρ p t p + ρ b t b ] d ( 0 x l p )
( E I ) 2 4 u ( x , t ) x 4 + c c u ( x , t ) t + ρ b t b d 2 u x , t t 2 = g 0 S i n ω a t [ ρ b t b ] d           ( l p x l b )
In these equations, u x , t represents the deflection displacement in the z-direction, while ( E I ) 1 and ( E I ) 2 indicate the bending rigidity of sections with and without the piezoelectric material, respectively. The term c c is the damping coefficient, ρ is the density, t denotes thickness, d is the width of the beam, and l represent lengths. Subscripts p and b refer to the piezoelectric material and the base beam, respectively. Additionally, g 0 represents the magnitude of external excitation, and ω a denotes the excitation frequency.
Using the modal technique, the displacement u x , t in Equation (1) is expressed as the product of spatial and temporal components:
u x , t = X x T ( t )
Substituting this expression into Equation (1) yields separate equations for the spatial and temporal components, X x and T ( t ) , respectively:
X i v x λ 4 X x = 0
T ¨ t + γ T ˙ t + ω 2 T t = g 0 S i n w d t
where λ is the eigenvalue, given by λ = ρ p t p + ρ b t b d E I 1 ω 2 4 , ω is the natural frequency of the system, and the term γ is related to damping, defined as γ = c c ρ p t p + ρ b t b d
Applying boundary conditions at x = 0 for the clamped side, where X 0 = 0 and X 0 = 0 , and at x = l p , where X l p = ω 2 ρ b t b d l b l p + m p ( E I ) 1 and X l p = ω 2 l b l p ρ b t b d l b l p 2 + m p ( E I ) 1 , a steady-state harmonic solution is obtained as follows:
u x , t = C 3 c o s h λ x c o s λ x + C 4 s i n h λ x s i n λ x · G s i n ( ω a t + α )
where
G = g 0 ( ω 2 ω a 2 ) 2 + γ 2 ω a 2
α = t a n 1 γ ω a ω 2 ω a 2
C 3 = ω 2 k 1 A λ 2 + B ( D λ k 1 A k 2 ) A λ 3 A 2 D B
C 4 = ω 2 D λ k 1 A k 2 λ 3 A 2 D B
A = c o s h λ l p + c o s λ l p  
B = s i n h λ l p + s i n λ l p
D = s i n h λ l p s i n λ l p
k 1 = l b l p ρ b t b d l b l p 2 + m p E I 1
k 2 = ρ b t b d l b l p + m p E I 1
Here, m p represents the mass of the proof mass.
The distributed electromechanical equation for a cantilevered piezoelectric power harvester under transverse vibrations is expressed as follows [29]:
ε r ε 0 d l p t p d v ( t ) d t + v ( t ) R + d 31 z n + t p 2 d 0 l p 3 u ( x , t ) x 2 t d x = 0
where ε r and ε 0 are the relative and vacuum permitivities, v t represents the output voltage, R is the load resistance, and d 31 is the piezoelectric constant. Here, z n represents the distance from the neutral axis to the inner surface of piezoelectric material, which can be obtained as follows:
z n = E b t b 2 E p t p 2 2 ( E b t b + E p t p )
Here, E represents Young’s modulus. Solving Equation (16) for steady-state harmonic response, the output voltage v t is given by the following:
v t = d 31 z n + t p 2 d · G ω a λ X l p R ω a 2 R 2 C p 2 + 1 sin ω a t + α + θ
where C p = ε r ε 0 d l p t p is the capacitance of the piezoelectric layer, and θ = t a n 1 1 ω a R C p represents the phase angle shift. The amplitude of the voltage output is expressed as follows:
v = d 31 z n + t p 2 d · G ω a λ X l p R ω a 2 R 2 C p 2 + 1
Finally, the power density output can be calculated as follows:
P = v 2 V R
Here, V is the volume of the piezoelectric material.
However, for a varying width of the beam so that d is a function of x , the Euler–Bernoulli equation can be modified as follows:
K 1 2 x 2 d ( x ) 2 u ( x , t ) x 2 + c c u ( x , t ) t + ρ p t p + ρ b t b d ( x ) 2 u x , t t 2 = g 0 S i n ω a t [ ρ p t p + ρ b t b ] d ( x )    ( 0 x l p )
K 2 2 x 2 d ( x ) 2 u ( x , t ) x 2 + c c u ( x , t ) t + ρ b t b d ( x ) 2 u x , t t 2 = g 0 S i n ω a t [ ρ b t b ] d ( x )          ( l p x l b )
where K 1 and K 2 are the bending rigidity per unit width for sections with and without piezoelectric material.

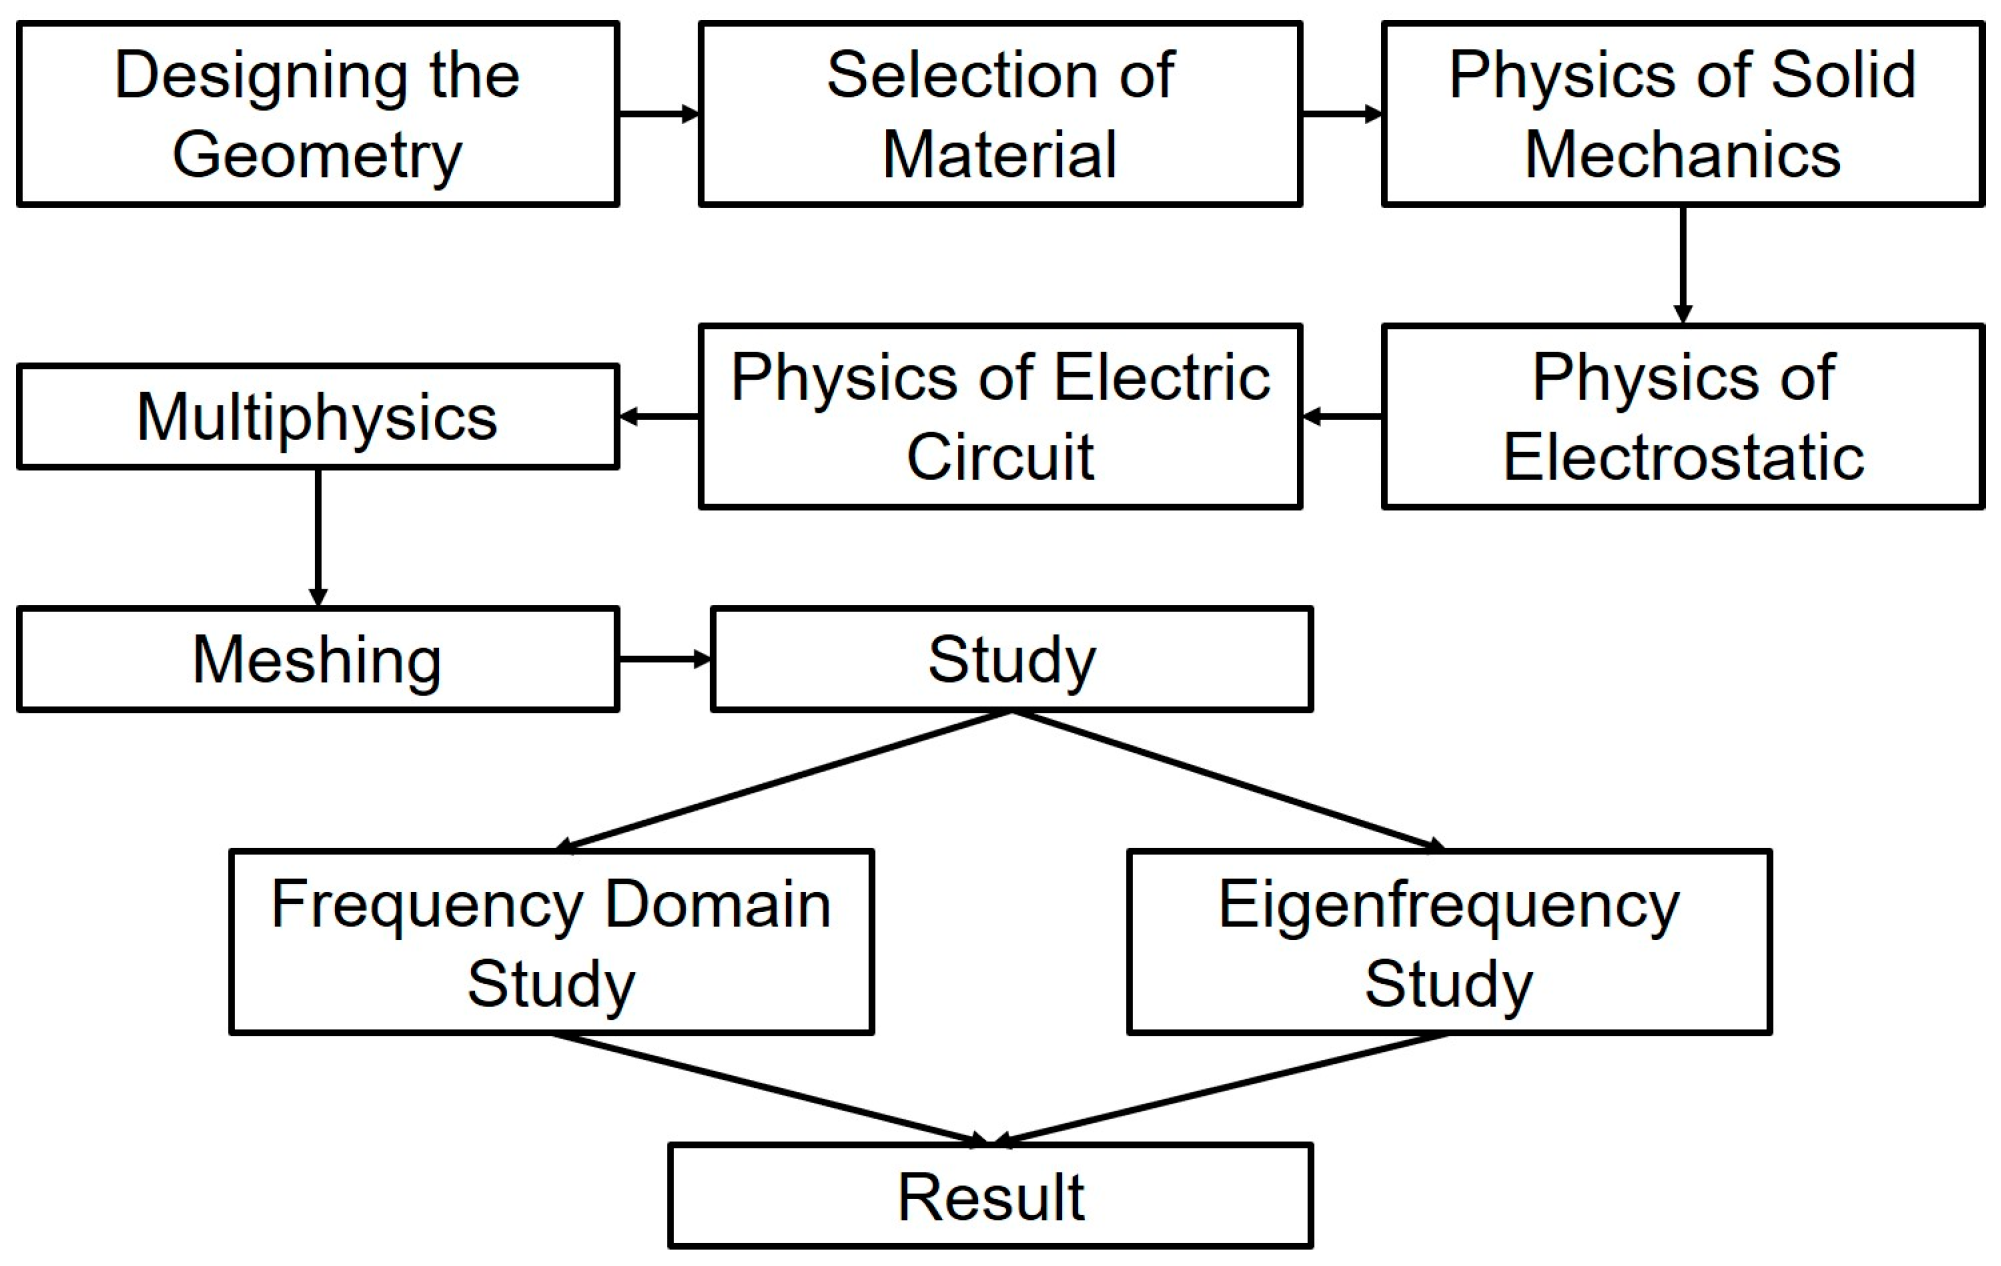
3. General Procedure of Numerical Analysis

Given this study’s focus on various shapes with differing widths, analytical solutions were challenging, as these variations introduce significant nonlinearity to the partial differential equations. Additionally, the equation d ( x ) varies for each shape, necessitating separate solutions for each case. Consequently, a numerical approach was adopted for the primary analysis. COMSOL Multiphysics 5.4 software was employed for this purpose, utilizing three key modules: solid mechanics, electrostatics, and electric circuit. The solid mechanics module models the structural behavior of the cantilever, capturing mechanical deformations and stresses that occur during vibration. The electrostatics module simulates the electric field distribution within the piezoelectric material, allowing for determining the generated electric potential due to mechanical strain. Finally, the electric circuit module integrates the harvester with an external electrical load, enabling analysis of the power output as current flows through the circuit under vibrational conditions. The flow chart in Figure 2 shows the method that has been followed to develop the numerical model in the COMSOL Multiphysics software. Tetrahedral elements were found to be the most effective for this analysis. Initially, an eigenfrequency analysis was conducted to determine the natural frequency of the first mode (n = 1). The study focuses on the first eigenmode (mode-1) because it is associated with the maximum power output. Once the mode-1 eigenfrequency was identified, a frequency domain analysis was performed to examine the power output variation around the mode-1 natural frequency. An isotropic damping loss of 5% was considered for these structures [18]. In this analysis, the load on the energy harvester was kept constant at 10 kΩ, and a proof mass of 0.17 g was used. To determine the most efficient geometry for maximizing power output, the shape of each beam type was systematically varied. A unimorph piezoelectric material (PZT-5A) with a thickness of 0.5 mm was placed at the fixed end of the aluminum beam. The properties for PZT-5A and aluminum are represented in Table 1. Previous studies have shown that placing the PZT material near the fixed end ensures the highest electric potential [18]. A gravitational force of 1 g was applied to the base beam, the piezoelectric materials, and the proof mass. This force was then systematically varied in a harmonic manner. The output power density in the study is defined as the output power in μW per unit volume of piezoelectric material in mm3.

4. Validation of Procedure Analysis

To validate the numerical procedure, a 1 mm thick rectangular piezoelectric cantilever beam energy harvester with a length of 100 mm and a width of 10 mm was used. This setup was compared with the established literature [18] to ensure the accuracy of the analysis. A piezoelectric material, measuring 10 mm in length and width and 0.5 mm in thickness, was attached at the fixed end of the cantilever. The geometry and dimensions of the beam and piezoelectric material were based on the study by Pradeesh et al. [18] for accurate predictions. Additionally, the result was compared with the analytical solution using the procedure outlined in Section 2.
The model was simulated for output power by varying the frequency from 75 Hz to 110 Hz at an excitation of 1 g. The applied resistive load was 0.563 MΩ. The maximum output of 0.37 mW was found to occur at 94.3 Hz, which is the resonance frequency of the model, as shown in Figure 3i. This result agrees with the findings of Pradeesh et al. [18] and the analytical solution. Therefore, the chosen computational settings and parameters are validated and acceptable for this study’s objectives.
The entire analysis in this article is performed using a computational framework. Hence, as part of the validation of the solution procedure, a mesh dependency study was performed. Figure 3ii demonstrates the impact of the element size on the maximum output power density and resonance frequency for the model adopted from the study of Pradesh et al. [18]. It has been found that for a minimum element size variation of 0.5–2.5 mm, the magnitudes of both the peak power density and the resonance frequency are almost unchanged. However, increasing the size to 2.75 mm leads to noticeable changes in these values. Hence, it can be concluded that the output parameters in this study become independent of the mesh size at 2.5 mm. Note that a minimum element size of 2.5 mm was used for every analysis in this study.

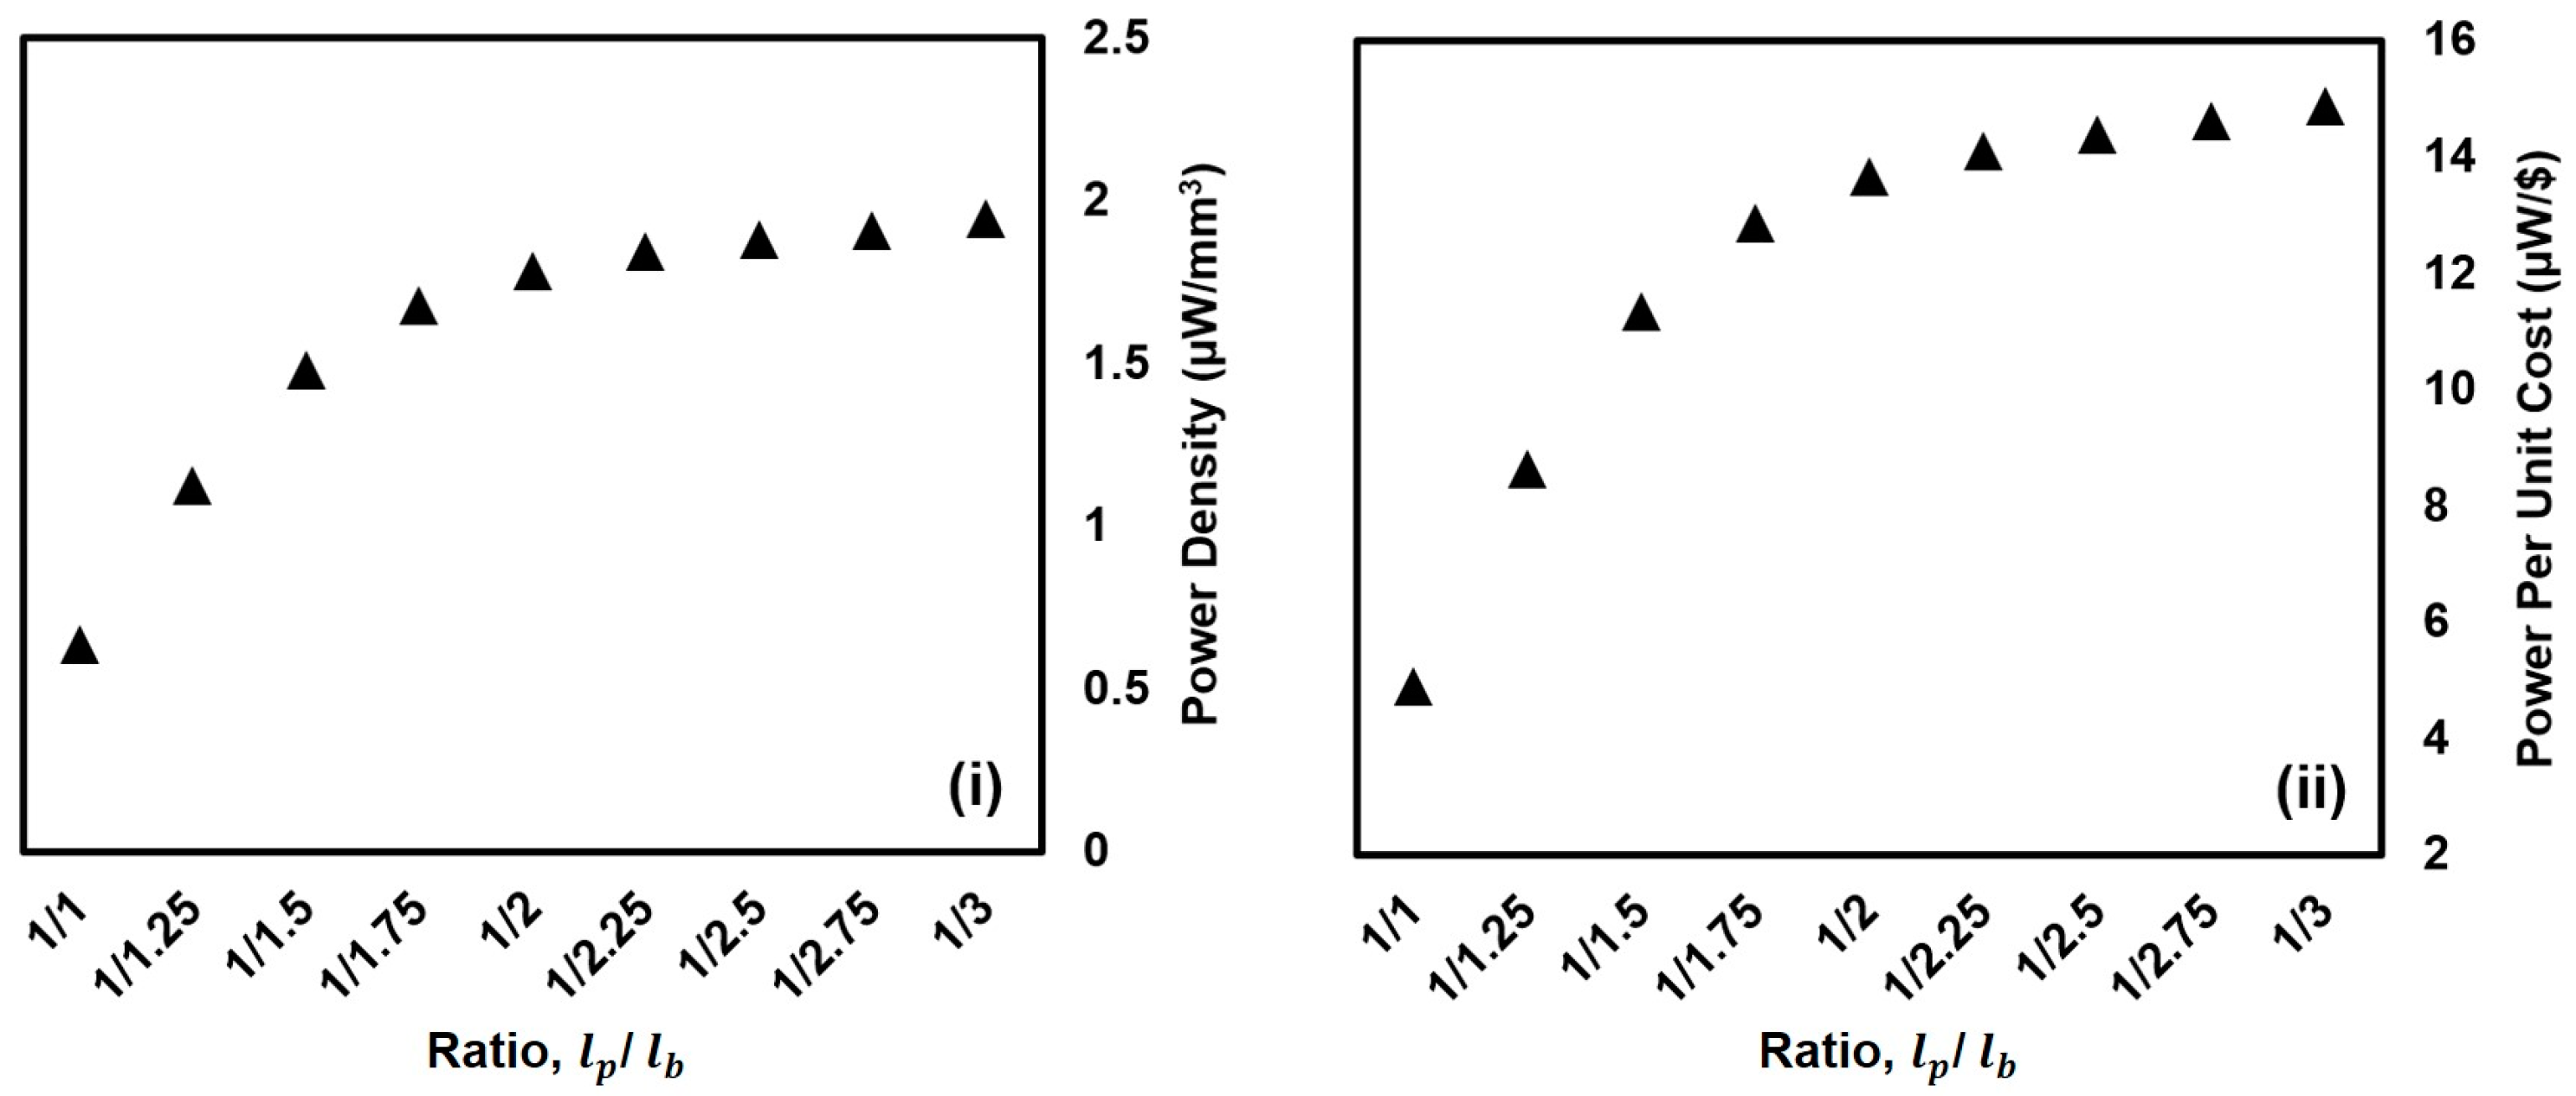
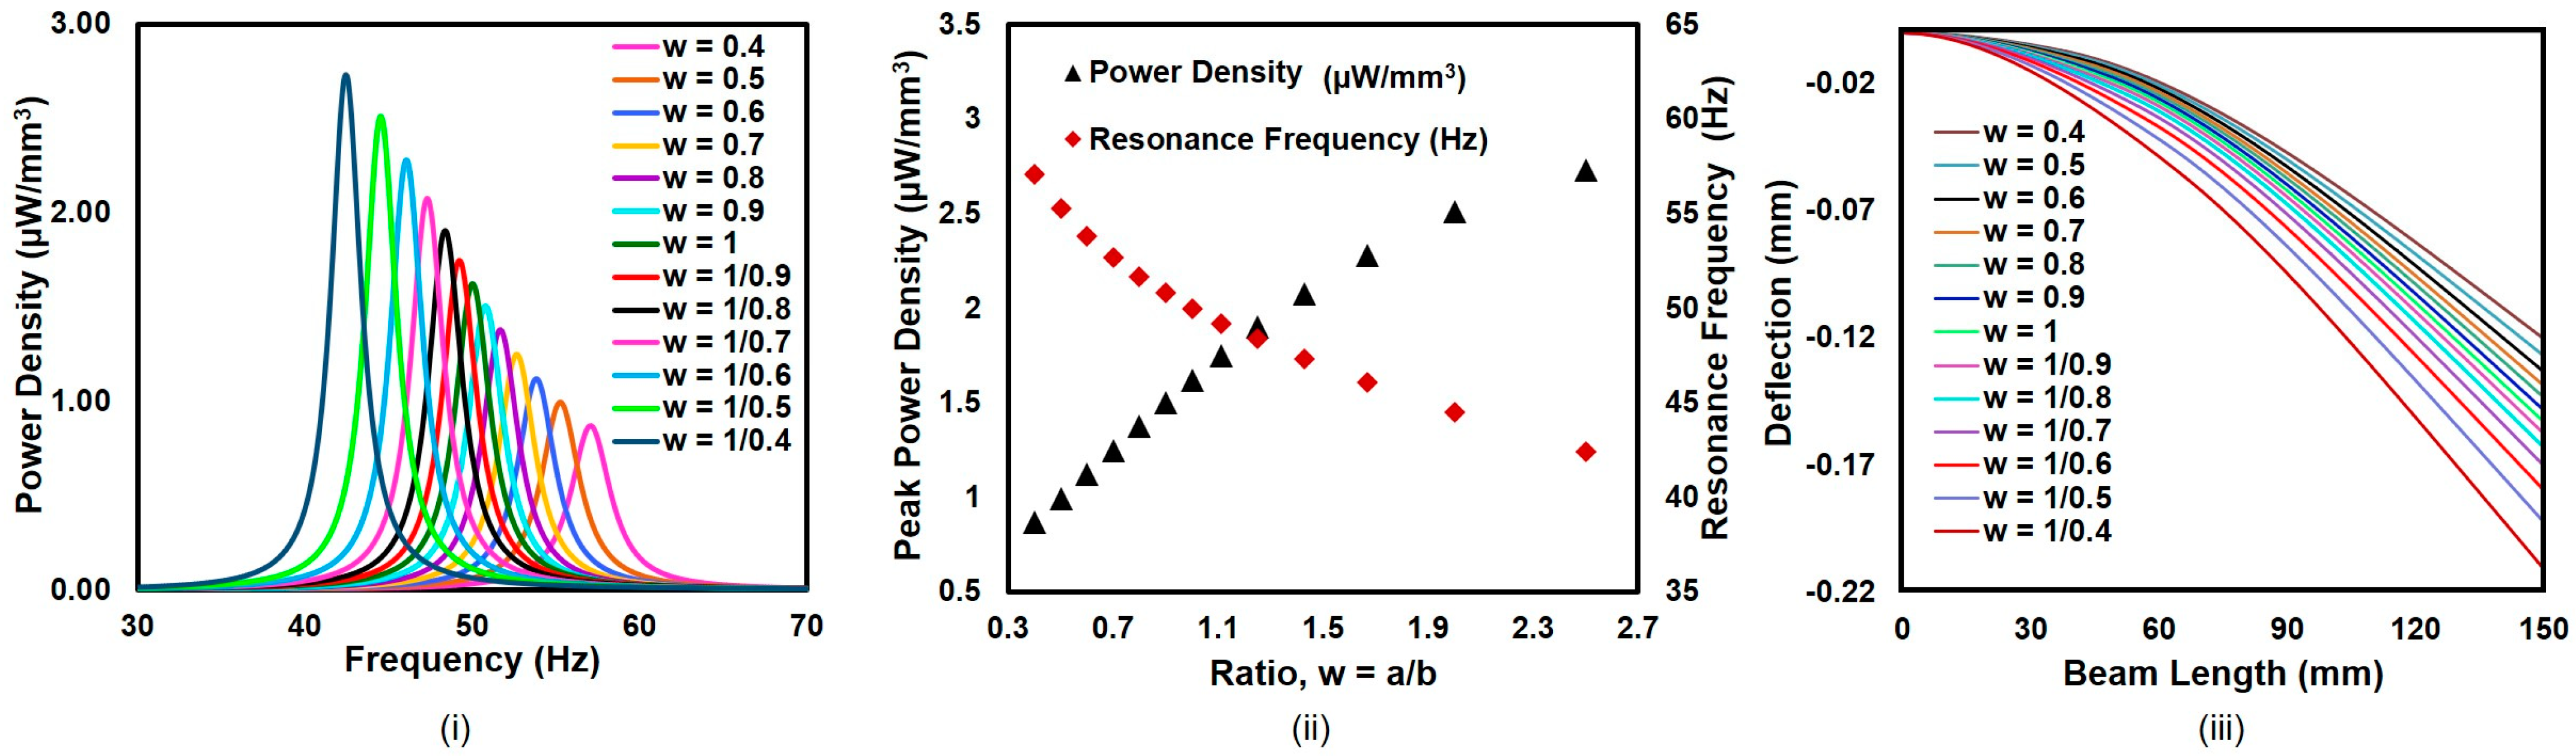
5. Finding an Effective PZT-to-Base Beam Ratio

In most, if not all, cantilever beam-based energy harvesting systems, a fully coated (unimorph or bimorph) base is used. However, it has been observed that maximum stress occurs at the fixed end of the cantilever beam during bending [44]. Therefore, we hypothesize that a partially coated beam could offer higher power density. Additionally, using partial coating could significantly reduce the overall cost of the structure, as the cost of piezoelectric material (PZT-5A) is approximately 50 times higher than that of the base material (aluminum). This approach may allow for increased power output per unit cost of the structure.
To determine an effective and economical PZT-to-base beam ratio, the length of the PZT was varied from 150 mm to 50 mm over a rectangular beam, while the base beam length was kept constant at 150 mm. This resulted in a PZT-to-base beam ratio ranging from one to one-third (ref. Figure 1). All other parameters of the setup remained unchanged. The PZT was positioned at the fixed end of the beam, as previous studies have shown that maximum stress develops in this area.
Figure 4 illustrates the effect of the PZT-to-base beam length ratio on power density and total power output per unit cost (μW/USD). From Figure 4i, it is evident that power density increases significantly as the PZT length (i.e., as the length ratio) decreases. However, the power density reaches an optimal level when the length ratio approaches one-third (where the PZT length is one-third of the base beam length). A similar trend is observed in Figure 4ii, where total power output (in μW) per dollar initially increases with decreasing PZT length and also reaches an optimal level around the one-third length ratio.
This study confirms that coating one-third of the base beam’s length with piezoelectric material achieves optimal power density and total power output per unit cost of the structure. Therefore, for the remainder of this study, this optimal configuration is maintained while analyzing different beam shapes and configurations in Section 5.

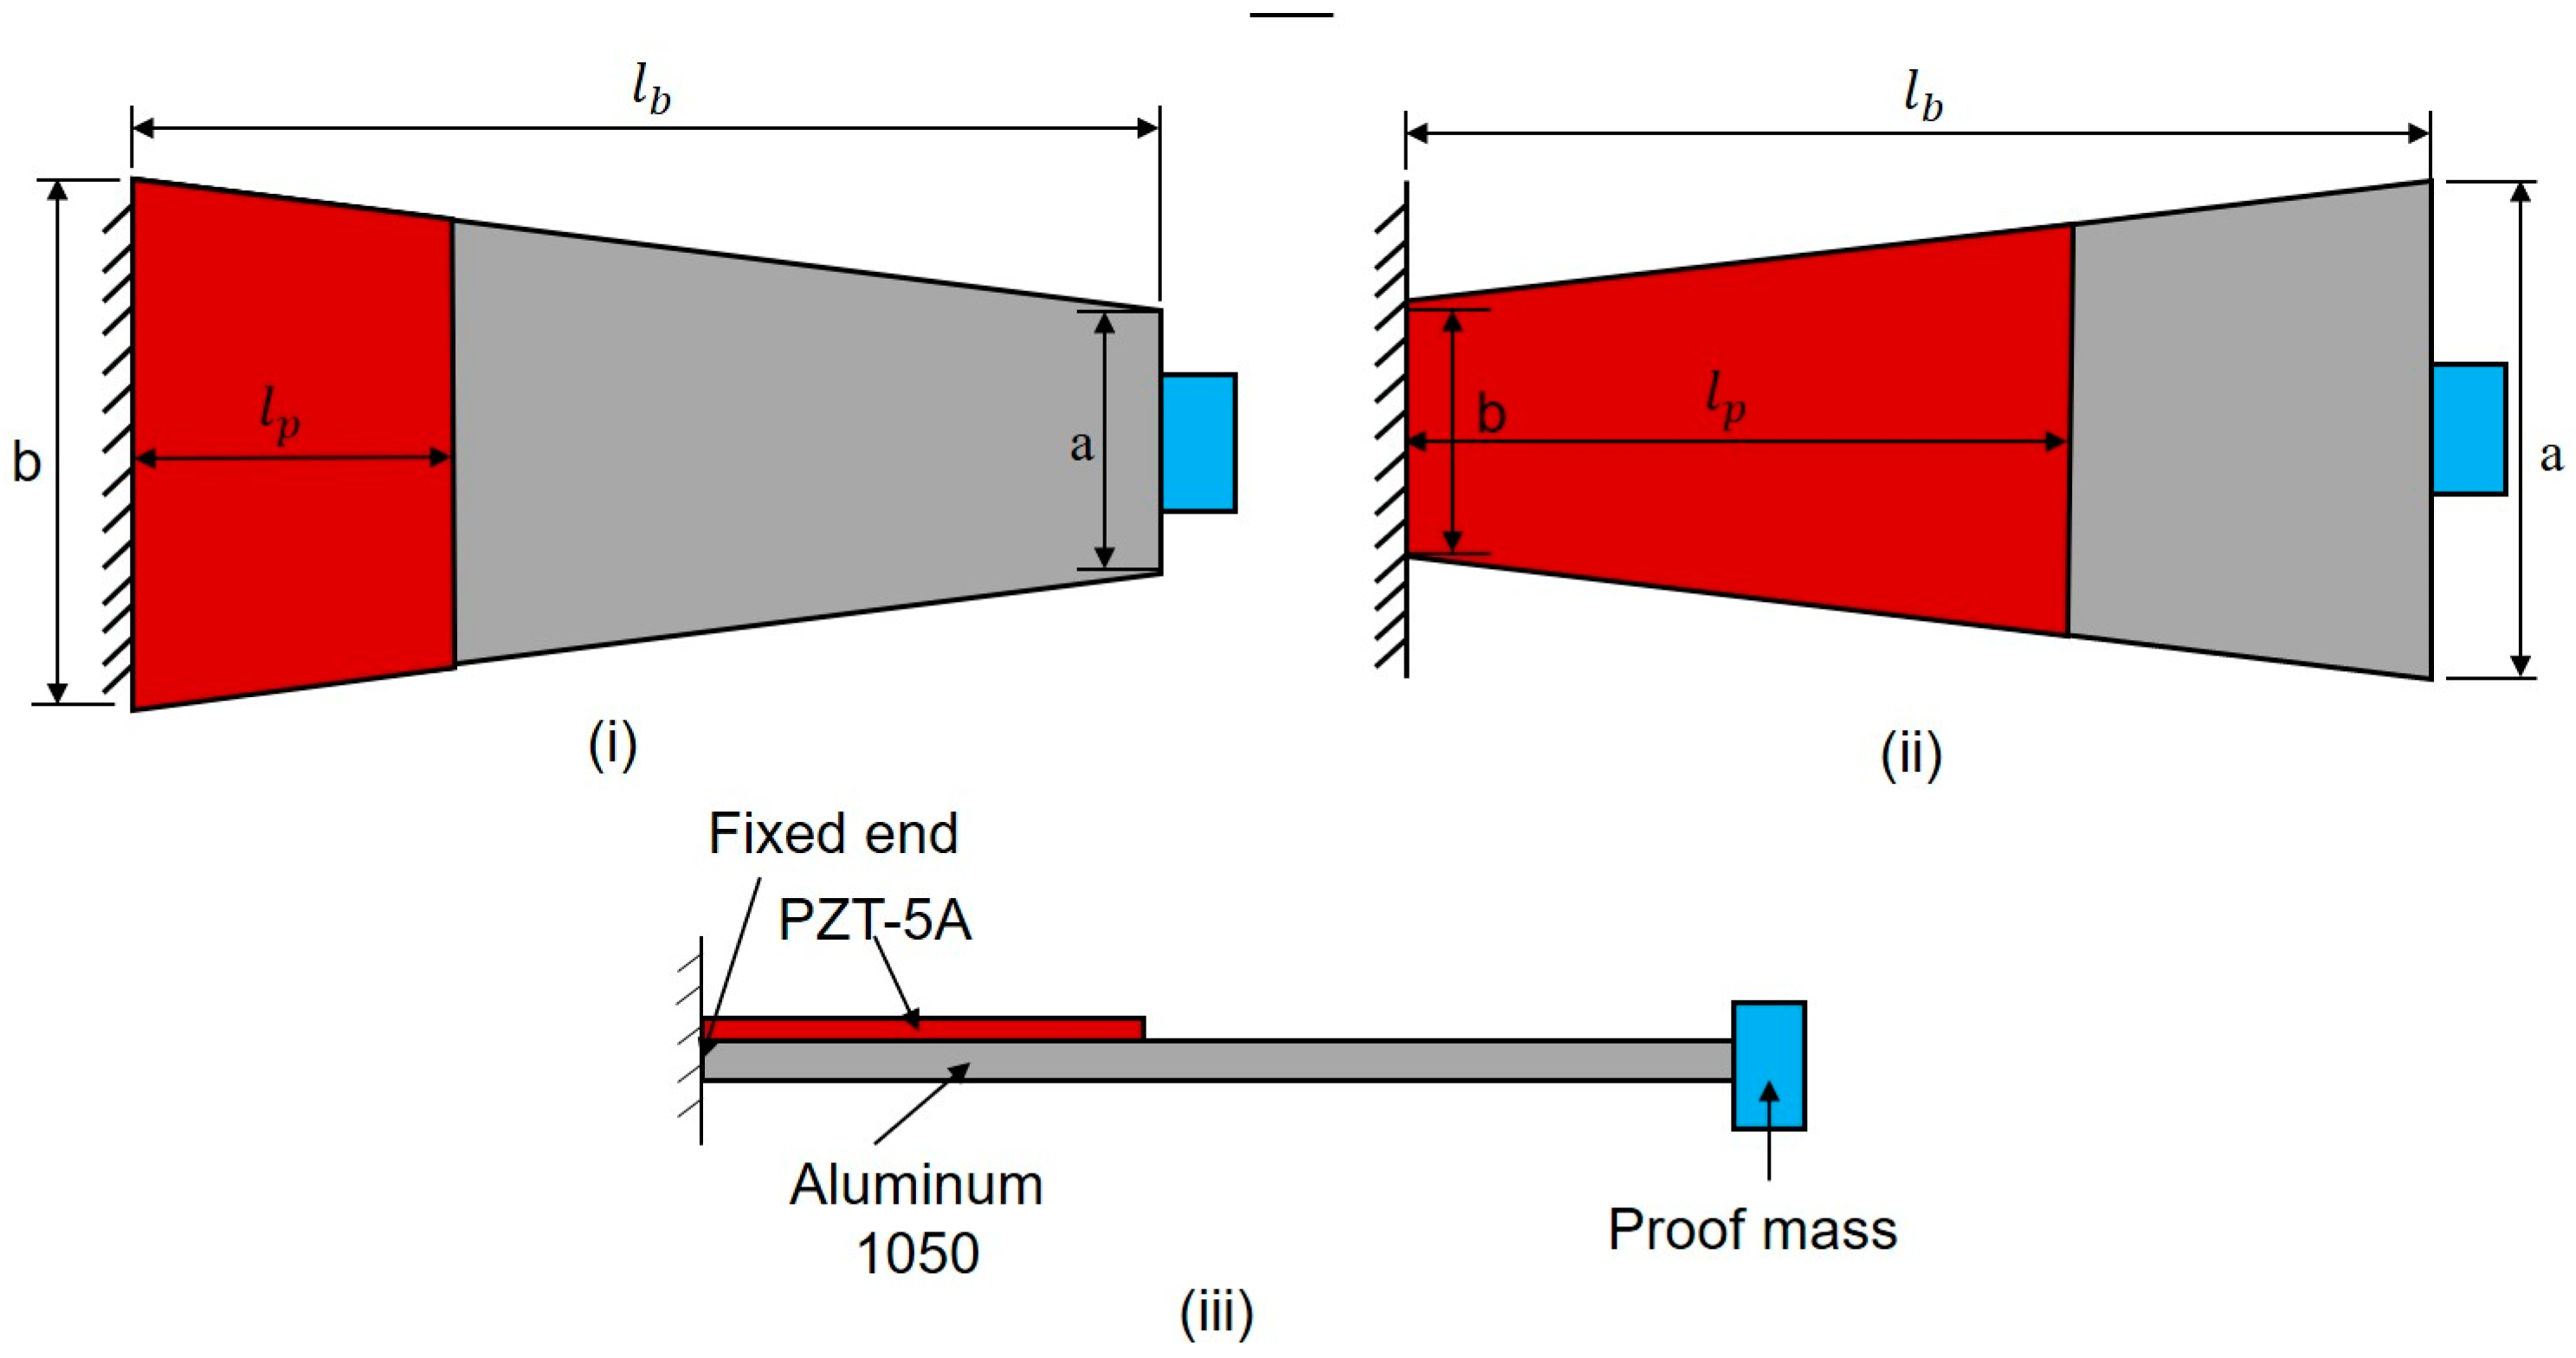
6. Analysis of Different Beam Shapes

6.1. Analysis of Trapezoidal Beam

Figure 5 shows the trapezoidal beam configuration, where “a” and “b” represent the widths of the apex (free end) and base (fixed end), respectively. “ l b ” represents the length of the beam, and “ l p ” represents the length of the PZT material. A consistent beam length of 150 mm was maintained throughout the analysis. To understand the effect of geometry on power output, the ratio (w = a/b) of the apex width (a) to the base width (b) was varied from 0.4 to 2.5 while keeping the length, the surface areas of the beam, and the piezoelectric materials constant. To obtain a consistent piezoelectric surface, the length ‘ l p was varied accordingly. For a trapezoidal beam, the width variation along the length is described by the following equation:
d x = 2 S l b 1 + 1 w × 1 w x L 1 w 1
Here, S represents the surface area of the beam, which was held constant at 1500 mm2 for all beams analyzed in this study.
Figure 6i,ii show how the ratio of the apex width to the base width (w) affects the output power density and resonance frequency for the trapezoidal beam configurations. Piezoelectric energy harvesters produce the most energy when this ratio is highest. Specifically, a maximum power density of 2.73 µW/mm3 was achieved at 42.4 Hz when the base width was 14.29 mm and the apex width was 5.71 mm (a ratio of 2.5). Conversely, the same volume of piezoelectric material and host structure produced the minimum power density of 0.87 µW/mm3 at 57.1 Hz when ‘w’ = 0.4.
Figure 6ii illustrates how power density and resonance frequency depend on the apex-to-base ratio (w). As the ratio (w) increases, the power output also increases. This is because the beam’s center of mass shifts away from the fixed end, and the area moment of inertia at the fixed end reduces, causing the beam to bend more under the same load. Increased bending generates larger strain energy at the fixed end, resulting in higher power density from the PZT material. Furthermore, the resonance frequency decreases as w increases. This is because the beam’s effective bending stiffness decreases, leading to a lower resonance frequency and increased tip deflection (ref. Figure 6iii).
For a trapezoidal cantilever beam with the wider end as the free end and the narrower end fixed, a higher power density can be achieved. This effect is particularly pronounced when the fixed end is coated with a piezoelectric material, covering one-third of the base beam surface. When comparing beams with w = 0.4 and w = 1/0.4 (which have identical shapes but different orientations), transitioning from w = 0.4 to w = 1/0.4 nearly triples the output power density. The power output for the beam with w = 1/0.4 is twice that of a traditional rectangular beam (w = 1). This finding highlights the potential for developing low-cost piezoelectric energy harvesting technologies.
Figure 6i,ii suggest that the output power density can be increased almost linearly by increasing the ratio ‘w’. However, the question remains as to what the optimal ‘w’ value for maximum power output would be. Is it allowable to use any ‘w’ value to increase the power output? By converting the trapezoidal domain to a rectangular domain, the highest ratio can be achieved. From the structural integrity perspective, is this acceptable? The answer is no. During the analysis of the trapezoidal beam, it was found that the maximum stress developed for the beam with ‘w = 2.5’, when excited at its resonant frequency, was 49 MPa. This stress level is below the strength limits of both the aluminum 1050 and PZT 5A materials. Note that with the increase in ‘w’, the mass center is shifting away from the fixed end and the area moment of inertia is decreasing. Consequently, the beam tends to bend further (ref. Figure 6iii). With a higher deflection, more banding stress is generated, and higher strength is required at the fixed end of the beam for structural integrity. However, with the increase in ‘w’, base width (b) is getting narrower, and strength at the fixed end is reducing. Hence, while choosing a higher ‘w’ for maximum power output, it is required to consider whether the base width is good enough to ensure structural integrity.

6.2. Analysis of Concave Beam

The configuration of the concave piezoelectric beam is presented in Figure 7i. The ratio (c), calculated as the ratio between the middle (m) and base (b) widths, is varied from 0.5 to 0.9. The widths of the fixed and free ends are kept the same and equal to b. In addition, similar to the trapezoidal beam, the beam length of l b = 150 mm, area of piezoelectric material, area of beam surface, and thicknesses were kept the same. The following equation describes how the width changes along the length of a concave beam:
d x = S l b 1 π 4 ( 1 c ) × 1 ( 1 c ) × 1 4 x l b 2 2 l b 2
From Figure 8ii, it is observed that a concave cantilever beam produces a power density of 1.55 µW/mm3 at 49.6 Hz, for a ratio of 0.9. The same volume of piezoelectric material has produced only 1.16 µW/mm3 at a resonance frequency of 45.7 Hz with c = 0.5. From Figure 8i,ii, it is apparent that in the case of the concave cantilever beam, both the power output and resonance frequency increase with an increase in c.
The deflection pattern of a concave cantilever beam is significantly dependent on its geometry. The width at the middle of the beam is always the minimum, and the widths of two ends are the maximum in a concave setup. Because of this configuration, the beam acts as a combination of two separate beams during the deflection: beam section-a, from fixed end to mid-width, and beam section-b, from the middle to the free end of the beam. In the case of section-a, the area moment of inertia at the supporting (fixed) end is the maximum when c is the lowest (=0.5). Hence, the deflection of section-a is the minimum for c = 0.5 (ref. Figure 8iii). The deflection amplitude of section-a increases with the increase in ‘c’ as the area moment of inertia decreases at the supporting end, and the mass center shifts away from the supporting end.
In contrast, for section-b, the opposite phenomenon can be observed, where the mid-width of the entire beam can be considered as the supporting end. The area moment of inertia at this supporting end is the minimum for c = 0.5, and the mass center of section-b lies closer to the free end, which results in the highest deflection amplitude at this c. With an increase in c, the area moment of inertia at the supporting end increases, and the mass center shifts away from the free end, which results in a decreased deflection amplitude for section-b with an increase in c (ref. Figure 8iii).
Because the PZT material is attached to section-a of the concave beam, the power output is largely dependent on the deflection pattern of this part. As noted earlier, the deflection amplitude in section-a of the beam increases with c, and consequently, power output from the beam increases (ref. Figure 8ii). Although the power capacity of the concave beam is mainly dependent on section-a, the resonance frequency is mainly governed by section-b of the beam. As c increases, the bending stiffness of section-b increases, owing to the increase in the area moment of inertia at the supporting end, which results in an increased overall effective bending stiffness of the entire beam. Hence, the resonance frequency of the beam increases with an increase in the ratio c (see Figure 8ii).

6.3. Analysis of Convex Beam

The convex configuration of the cantilever beam harvester is shown in Figure 7ii. Again, the widths of the fixed and free ends are considered equal and are represented by b, where l b and l p represent the length of the beam and the piezoelectric material, respectively. In this analysis, the beam length is maintained constant at 150 mm. Moreover, the area of the piezoelectric material, the area of the beam surface, and the thicknesses were kept the same. To analyze the geometric effect of the beam on power output, the ratio (cx = m/b) of the middle (m) and base (b) widths varied from 1.5 to 7.5. The equation below defines the width variation along the length of a convex beam:
d x = S l b 1 + π 4 ( c x 1 ) × 1 + ( c x 1 ) × 1 4 x l b 2 2 l b 2
Figure 9i,ii show that the peak power output density initially increases rapidly with an increase in cx. This is due to the fact that at the beginning, with the increase in cx, the width of the base becomes smaller. A smaller base width provides a smaller area moment of inertia, which increases the deflection amplitude of the beam (ref. Figure 9iv) and output power density. However, the power density becomes nearly constant at higher ratios. Figure 9iii shows that the rate of change of the length of the piezoelectric material decreases notably with an increase in cx. Consequently, at a higher cx, the stress and strain profiles of the beam along the piezoelectric material remain almost the same. This causes the variation in the output power density at higher ratios to be small.
Figure 9ii further shows that the resonance frequency of the beam decreases with an increase in cx, except for a few lower ratios where a slight increase in the resonance frequency can be observed. The resonance frequency of a cantilever beam is principally governed by the deflection of the free end. An increased deflection at the free end indicates a smaller bending stiffness of the beam. Figure 9iv shows that the deflection of the free end increases with cx, which in turn decreases the bending stiffness and resonance frequency of the beam.

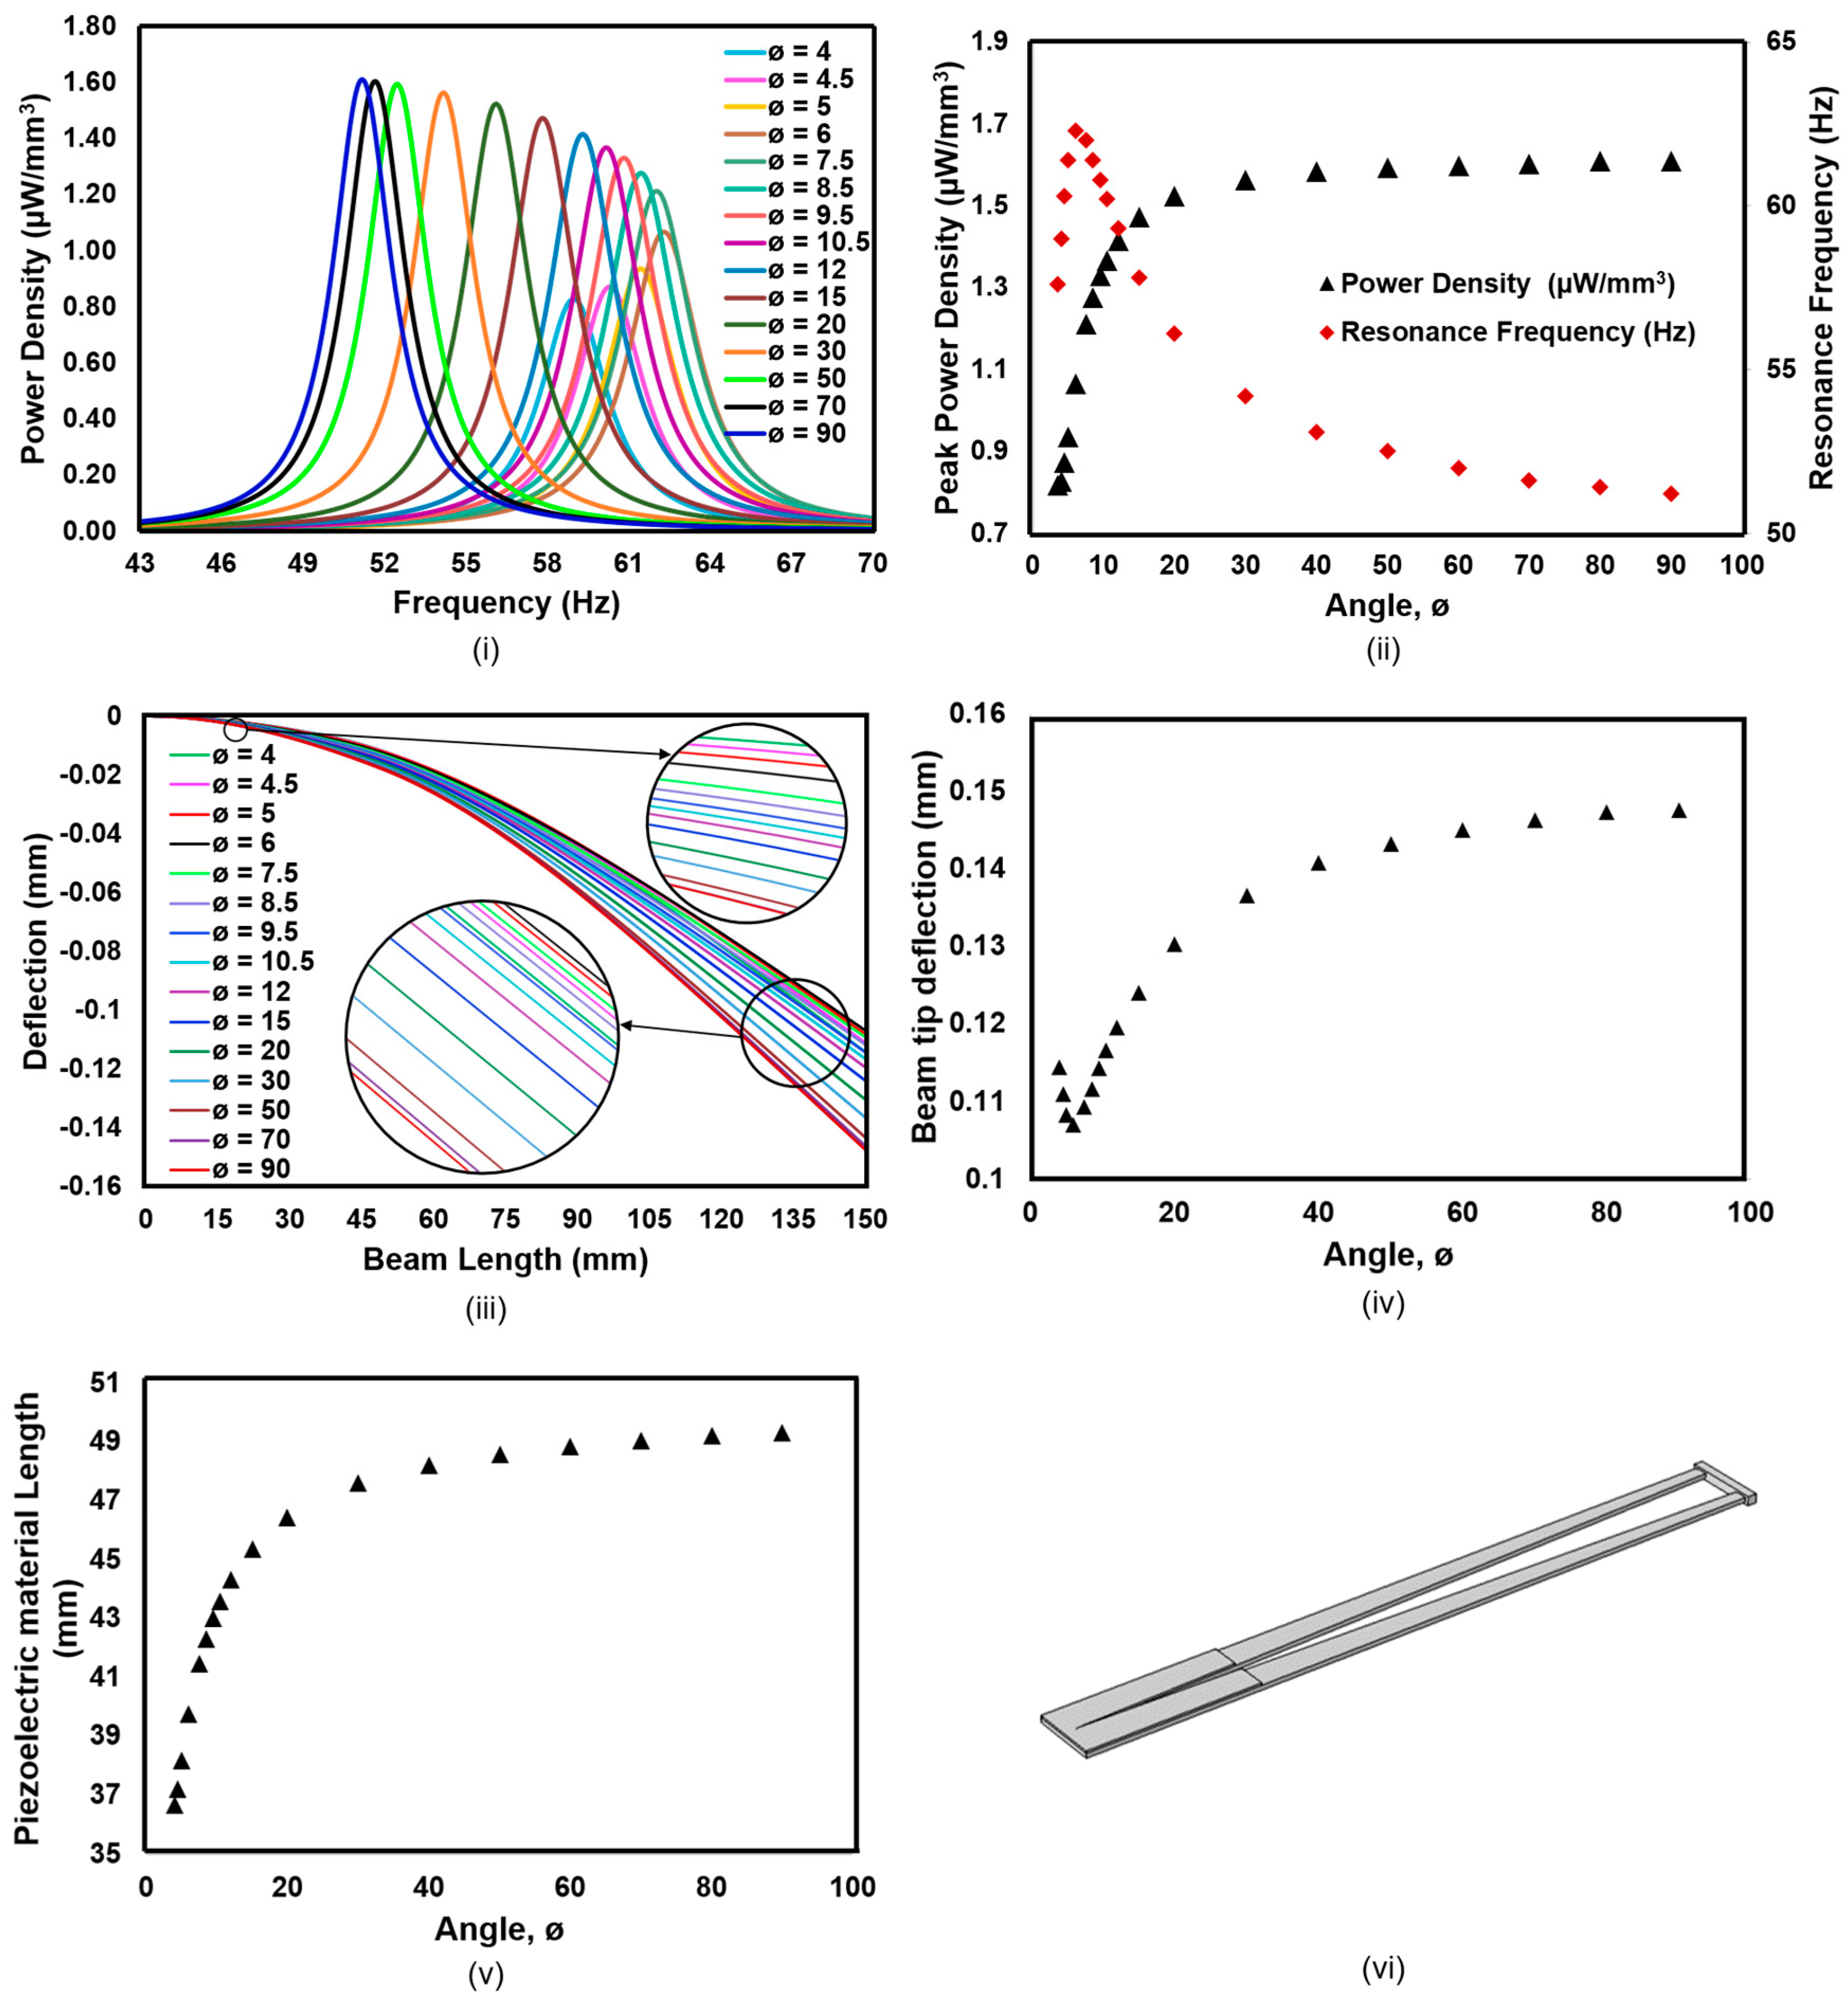
6.4. Analysis of V-Cut Beam

The V-cut configuration of the cantilever energy harvester is illustrated in Figure 7iii. As demonstrated in Figure 7iii, l b represents the length of the beam, l p is the length of the piezoelectric material, and angle ø represents the angle of the V-cut. To understand the geometric influence of the V-cut beam on the power capacity, the angle of the V-cut was varied from 4° to 90°, while the length of the beam (150 mm), surface area, and thickness were kept constant. To keep these parameters constant, the width of the beam was varied according to the angle ø. Further reduction of the angle ø may split the beam into two halves, while increasing ø beyond 90° produces an almost rectangular beam. For a beam with V-cut, the width variation along the length with angle ø is described by the following equation:
d x = 1 l b S + h 2 4 l b S i n ( / 2 )                0 x l b h 2 S i n ( / 2 ) d x = 1 l b S + h 2 4 l b S i n ( / 2 ) + 2 x l b S i n ( / 2 ) + h    l b h 2 S i n ( / 2 ) < x l b
Figure 10i,ii are representing the variation in the power output and resonance frequency with the alteration of the V-cut angle. It can be seen that at a smaller cut angle range, the power density from the beam increases sharply with an increase in the cut angle. However, the rate of change of the power output slowly becomes negligible at higher cut angles (>~150). In the case of the resonance frequency, it increases initially with an increase in the cut angle; however, it starts dropping with a further increase in the cut angle.
The deflection characteristics of the V-cut beam are quite complex. The V-cut beam behaves as a combination of three beams. The length between the cut notch and free end can be considered as two symmetric beams, and the distance between the cut notch and the fixed end is considered a separate beam. The length of the fixed end beam increases with an increase in the V-cut angle, whereas the symmetric beam length decreases simultaneously.
At a smaller cut angle (e.g., 40), the cut notch can be found in very close proximity to the fixed end, and the length of the fixed end beam is quite small compared to its width (ref. Figure 10vi). In such a setup, the deflection amplitude of the fixed end beam is pretty small, owing to the high area moment of inertia. With an increase in the cut angle, the width of the fixed end beam (as well as symmetric beams) decreases, and the length increases. Hence, the area moment of inertia of the segment decreases, and the segment experiences a higher deflection amplitude (see Figure 10iii, top right zoomed circle).
In the case of symmetric beams, the deflection amplitude decreases with an increase in the cut angle as the length-to-base width ratio of the beam is decreasing. The deflection of the beam tip depends on the deflection behavior of both the fixed end and symmetric beams. When the cut angle is small, the deflection of the fixed end beam is very small; hence, the tip deflection is mainly dependent on the deflection of the symmetric beams. Therefore, at small angles, the tip deflection decreases with an increase in the cut angle. However, with a further increase in the cut angle, the deflection of the fixed end beam further increases and becomes significant; hence, the tip deflection increases even though the symmetric beam deflection decreases at the same time (ref. Figure 10iv).
The power output from the cantilever beam is principally dependent on the length of the piezoelectric material and the deflection of the length segment of the beam to which it is attached. Because the PZT material is attached at the fixed end of the beam and the deflection of the end increases with an increase in the cut angle, the power output also increases consequently. Figure 10v suggests that the length of the PZT increases sharply at smaller cut angles, and the rate of the length increase becomes less significant at higher angles. The length variation of the PZT material shown in Figure 10v explains the power density output observed in Figure 10ii. Similarly, as the resonance frequency is mainly dependent on the tip deflection of the beam, the resonance frequency plot in Figure 10ii can be explained using Figure 10iv.

6.5. Analysis of Triangular Beam

In the analysis of the triangular cantilever beam piezoelectric energy harvester, the width of the apex, thickness, surface area of the beam, and piezoelectric material were kept constant, while the width of the base (b) and the length of the beam ( l b ) varied as a ratio of base width to length from 0.05 to 0.1. Even though a triangular cantilever beam is analyzed herein, as shown in Figure 7iv, a small width at the apex of the beam can be observed to avoid the singularity effect and to attach the proof mass at the free end of the beam. The piezoelectric material length ‘ l p ’ was adjusted to maintain a constant piezoelectric surface area. The width variation along the length of a triangular beam is represented by the following equation:
d x = k a + a 2 + 4 S k 2 k + x a a + a 2 + 4 S k 2 k k
Figure 11i,ii represent the changes in the output power density and resonance frequency with the variation in k (=b/ l b ). It appears that the triangular cantilever beam piezoelectric energy harvester produces a maximum output power density of 1.08 µW/mm3 at a resonance frequency of 30.1 Hz when the ratio is 0.05 and a minimum output power density of 0.96 µW/mm3 at a resonance frequency of 59.4 Hz for k = 0.1.
The output peak power density for the triangular piezoelectric energy harvester decreases linearly with an increase in k. On the contrary, the natural frequency of the beam increases linearly with an increase in k. An increase in k essentially means an increase in the base width of the beam, which results in an increase in the area moment of inertia at the base end. Simultaneously, the center of mass of the beam shifts toward the fixed/base end of the beam. Consequently, the beam tends to deflect less (ref. Figure 11iii) and produce less energy. An increase in the resonance frequency with an increase in k is also due to the shifting of the mass center toward the fixed end of the beam. This phenomenon increases the bending stiffness of the beam.

7. Comparison Among Beam Types

In this study, five different types of cantilever beams were investigated to identify the most cost-effective geometry for maximizing the power output of a cantilever beam-based energy harvester. To ensure a fair comparison, certain parameters of the beams and PZT materials, such as surface area, thickness, volume, and mass, were kept constant. Table 2 below compares the beams in terms of their measured maximum power output and corresponding resonance frequency.
Table 2 shows that the trapezoidal beam with a narrower fixed end and wider free end produces the maximum power, while the triangular beam produces the minimum. There is a clear relationship between maximum power output and the base width of the beam. Generally, beams with a narrower base width, especially those with partial piezoelectric coating at the fixed end, yield higher power output. This is because reducing the base width decreases the area moment of inertia and shifts the beam’s center of mass away from the fixed end, causing greater deflection of the piezoelectric material and increased power output. The convex cantilever beam has the smallest base width (2.53 mm), which is less than half of the trapezoidal beam’s base width. However, the trapezoidal beam still produces more power. This difference is due to the beam’s shape: the convex beam is symmetrical lengthwise, keeping the mass center at the midpoint, while the trapezoidal beam has a base that widens linearly toward the free end, shifting the mass center closer to the free end. This geometry results in greater deflection of the PZT material at the fixed end, enhancing power output.
Although the maximum power output is dependent on the amplitude of the PZT material, the resonance frequency is mainly dependent on the tip deflection of the beam. For a linearly varying geometry, the PZT deflection and beam tip deflection profiles remain proportional/consistent. However, in the case of nonlinear geometry variation (e.g., concave, convex, V-cut), the deflection of the PZT and beam tip are not proportional; however, they depend on the mass distribution of the beam. For example, in the case of a concave beam, the PZT deflection increases with an increase in the ratio w. However, the beam tip deflection decreases at the same time. Hence, for a concave beam, the PZT and beam tip deflections are inversely proportional.
In linearly varying configurations like trapezoidal and triangular beams, power output and resonance frequency are inversely proportional. When the beam stiffness decreases, the resonance frequency decreases as well, but the beam bends more and produces more power due to the reduced stiffness. In nonlinear geometries, the relationship between power output and resonance frequency is more complex and depends on mass distribution. For concave beams, this relationship remains linear, which can be advantageous for certain applications. However, in convex and V-cut beams, the power output and resonance frequency are not simply proportional or inversely proportional; they vary based on the ratio.
While the trapezoidal beam stands out by generating maximum power output, it is crucial to note that the findings from studying alternative beam shapes hold their own significance. This is because cantilever energy harvesters tend to achieve peak output at their resonant frequencies. Such an analysis is valuable when choosing the most suitable beam for a specific application, where the precise frequency the beam will be exposed to plays a defining role.
Table 3 presents a comparison with the literature, showing that the output power density of the analyzed beam is higher than that of most similar studies. Notably, this investigation used a constant resistive load, as the focus was on improving the beam configuration; using an optimal load would further increase the output power density significantly. Additionally, in this study, partial coating of the beam is used to have a cost-effective design, which was not the case for any of the listed studies in Table 3.

8. Effect of Beam and Piezoelectric Material Thickness

Figure 12i shows how the output power density of trapezoidal beams varies with ratios (w) at different beam thicknesses (‘tb’), with the piezoelectric material thickness maintained constant at 0.5 mm. Similarly, Figure 12ii demonstrates the variation in output power for different piezoelectric material thicknesses (‘tp’) while keeping the beam thickness consistent at 1 mm.
The results suggest that while the output power density is influenced by changes in thickness, the trend of increased power with the ratio (ref. Figure 6ii) remains the same across different thickness values. It is evident that despite the consistent use of a 1 mm beam thickness and a 0.5 mm piezoelectric material thickness in the analyses of various beam shapes in this study, the findings are applicable to modifications in the thickness of either the base beam or the piezoelectric material, as the change in thickness does not influence the trend.

9. Conclusions

In designing a cost-effective solution for maximizing power density in piezoelectric cantilever energy harvesters, this study demonstrates that partially (one-third portion) coating the base beam with piezoelectric material near the fixed end is effective, as both peak power density and power per unit cost increase as the coating area is reduced. Therefore, based on the outcome of the first part of the study, various cantilever beam shapes (trapezoidal, concave, convex, V-cut, and triangular) were examined with only one-third of the base beam’s surface coated while keeping the surface area and thickness of both the piezoelectric material and the base beam constant. This study reveals that when the beam is partially coated to reduce costs, the inverted trapezoidal beam (with a narrower base compared to the apex) outperforms traditional trapezoidal beams with wider bases, which have been favored in most (if not all) of the previous literature. Additionally, the inverted trapezoidal shape achieved the highest power density among all the shapes investigated. In general, beams with narrower base widths generate more power than those with wider bases due to higher stress concentrations at the narrow base and the placement of the piezoelectric material near the fixed end. The additional study, which varied the thickness of the base beam and the piezoelectric material, ensures that the trend of changing output power with different geometrical parameters remains consistent across all thicknesses. This study also investigated the effect of beam shape on resonance frequency, finding that for linearly varying geometries, resonance frequency and power output capacity are inversely proportional. For a nonlinear geometry, a different/variable relationship between the resonance frequency and the power output can be observed.
Considering that the output power density in the case of a trapezoidal beam continues increasing with a narrower base and wider apex, this may lead to high stress at the base, which must be carefully managed to prevent structural failure. Hence, future research should investigate the optimal base width to maximize power density without compromising the beam’s integrity.

Author Contributions

Conceptualization, R.A.; Methodology, R.A.; Validation, M.M.; Formal analysis, M.M.; Investigation, M.M.; Resources, K.M.R. and Z.A.; Data curation, M.M.; Writing—original draft, M.M.; Writing—review & editing, R.A.; Supervision, K.M.R., Z.A. and R.A.; Project administration, K.M.R. and R.A. All authors have read and agreed to the published version of the manuscript.

Funding

This research received no external funding.

Data Availability Statement

The original contributions presented in the study are included in the article, further inquiries can be directed to the corresponding author.

Conflicts of Interest

The authors declare no conflicts of interest.

References

  1. Liu, H.; Zhong, J.; Lee, C.; Lee, S.W.; Lin, L. A Comprehensive Review on Piezoelectric Energy Harvesting Technology: Materials, Mechanisms, and Applications. Appl. Phys. Rev. 2018, 5, 041306. [Google Scholar] [CrossRef]
  2. Roundy, S.; Wright, P.K.; Rabaey, J. A Study of Low Level Vibrations as a Power Source for Wireless Sensor Nodes. Comput. Commun. 2003, 26, 1131–1144. [Google Scholar] [CrossRef]
  3. Baker, J.; Roundy, S.; Wright, P. Alternative Geometries for Increasing Power Density in Vibration Energy Scavenging for Wireless Sensor Networks. In Collection of Technical Papers, Proceedings of the 3rd International Energy Conversion Engineering Conference, San Francisco, CA, USA, 15–18 August 2005; AIAA: Las Vegas, NV, USA, 2005; Volume 2, pp. 959–970. [Google Scholar] [CrossRef]
  4. Zhang, G.; Gao, S.; Liu, H.; Niu, S. A Low Frequency Piezoelectric Energy Harvester with Trapezoidal Cantilever Beam: Theory and Experiment. Microsyst. Technol. 2017, 23, 3457–3466. [Google Scholar] [CrossRef]
  5. Rosmi, A.S.; Isa, M.; Ismail, B.; Rohani, M.N.K.H.; Wahab, Y. An Optimization of Electrical Output Power for Piezoelectric Energy Harvester Using Different Micro-Cantilever Beam Geometries. J. Phys. Conf. Ser. 2018, 1019, 012033. [Google Scholar] [CrossRef]
  6. Hosseini, R.; Hamedi, M. Improvements in Energy Harvesting Capabilities by Using Different Shapes of Piezoelectric Bimorphs. J. Micromech. Microeng. 2015, 25, 125008. [Google Scholar] [CrossRef]
  7. Benasciutti, D.; Moro, L.; Zelenika, S.; Brusa, E. Vibration Energy Scavenging via Piezoelectric Bimorphs of Optimized Shapes. Microsyst. Technol. 2010, 16, 657–668. [Google Scholar] [CrossRef]
  8. Jin, L.; Gao, S.; Zhou, X.; Zhang, G. The Effect of Different Shapes of Cantilever Beam in Piezoelectric Energy Harvesters on Their Electrical Output. Microsyst. Technol. 2017, 23, 4805–4814. [Google Scholar] [CrossRef]
  9. Chen, Z.S.; Yang, Y.M.; Deng, G.Q. Analytical and Experimental Study on Vibration Energy Harvesting Behaviors of Piezoelectric Cantilevers with Different Geometries. In Proceedings of the 1st International Conference on Sustainable Power Generation and Supply, SUPERGEN ’09, Nanjing, China, 6–7 April 2009. [Google Scholar] [CrossRef]
  10. Alameh, A.H.; Gratuze, M.; Nabki, F. Impact of Geometry on the Performance of Cantilever-Based Piezoelectric Vibration Energy Harvesters. IEEE Sens. J. 2019, 19, 10316–10326. [Google Scholar] [CrossRef]
  11. Goldschmidtboeing, F.; Woias, P. Characterization of Different Beam Shapes for Piezoelectric Energy Harvesting. J. Micromech. Microeng. 2008, 18, 104013. [Google Scholar] [CrossRef]
  12. Muthalif, A.G.A.; Nordin, N.H.D. Optimal Piezoelectric Beam Shape for Single and Broadband Vibration Energy Harvesting: Modeling, Simulation and Experimental Results. Mech. Syst. Signal Process. 2015, 54–55, 417–426. [Google Scholar] [CrossRef]
  13. Karadag, C.V.; Ertarla, S.; Topaloglu, N.; Okyar, A.F. Optimization of Beam Profiles for Improved Piezoelectric Energy Harvesting Efficiency. Struct. Multidiscip. Optim. 2021, 63, 631–643. [Google Scholar] [CrossRef]
  14. Yang, Z.; Wang, Y.Q.; Zuo, L.; Zu, J. Introducing Arc-Shaped Piezoelectric Elements into Energy Harvesters. Energy Convers. Manag. 2017, 148, 260–266. [Google Scholar] [CrossRef]
  15. Ibrahim, D.S.; Beibei, S.; Fatai, S.; Oluseyi, O.A.; Sharif, U. Numerical and Experimental Study of a Gauge-Shaped Beam for Improved Performance of Piezoelectric Energy Harvester. Microsyst. Technol. 2021, 27, 4253–4268. [Google Scholar] [CrossRef]
  16. Raju, S.S.; Umapathy, M.; Uma, G. Design and Analysis of High Output Piezoelectric Energy Harvester Using Non Uniform Beam. Mech. Adv. Mater. Struct. 2020, 27, 218–227. [Google Scholar] [CrossRef]
  17. Mohamed, K.; Elgamal, H.; Kouritem, S.A. An Experimental Validation of a New Shape Optimization Technique for Piezoelectric Harvesting Cantilever Beams. Alex. Eng. J. 2021, 60, 1751–1766. [Google Scholar] [CrossRef]
  18. Pradeesh, E.L.; Udhayakumar, S. Effect of Placement of Piezoelectric Material and Proof Mass on the Performance of Piezoelectric Energy Harvester. Mech. Syst. Signal Process. 2019, 130, 664–676. [Google Scholar] [CrossRef]
  19. Pradeesh, E.L.; Udhayakumar, S. Investigation on the Geometry of Beams for Piezoelectric Energy Harvester. Microsyst. Technol. 2019, 25, 3463–3475. [Google Scholar] [CrossRef]
  20. Hajheidari, P.; Stiharu, I.; Bhat, R. Performance of Tapered Cantilever Piezoelectric Energy Harvester Based on Euler–Bernoulli and Timoshenko Beam Theories. J. Intell. Mater. Syst. Struct. 2019, 31, 487–502. [Google Scholar] [CrossRef]
  21. Mehraeen, S.; Jagannathan, S.; Corzine, K.A. Energy Harvesting from Vibration with Alternate Scavenging Circuitry and Tapered Cantilever Beam. IEEE Trans. Ind. Electron. 2010, 57, 820–830. [Google Scholar] [CrossRef]
  22. Ibrahim, D.S.; Beibei, S.; Oluseyi, O.A.; Sharif, U. Performance Analysis of Width and Thickness Tapered Geometries on Electrical Power Harvested from a Unimorph Piezoelectric Cantilever Beam. In Proceedings of the 2020 IEEE 3rd International Conference on Electronics Technology, ICET 2020, Chengdu, China, 8–12 May 2020; pp. 100–104. [Google Scholar] [CrossRef]
  23. Paquin, S.; St-Amant, Y. Improving the Performance of a Piezoelectric Energy Harvester Using a Variable Thickness. Smart Mater. Struct. 2010, 19, 105020. [Google Scholar] [CrossRef]
  24. Xie, X.D.; Carpinteri, A.; Wang, Q. A Theoretical Model for a Piezoelectric Energy Harvester with a Tapered Shape. Eng. Struct. 2017, 144, 19–25. [Google Scholar] [CrossRef]
  25. Matova, S.P.; Renaud, M.; Jambunathan, M.; Goedbloed, M.; Van Schaijk, R. Effect of Length/Width Ratio of Tapered Beams on the Performance of Piezoelectric Energy Harvesters. Smart Mater. Struct. 2013, 22, 075015. [Google Scholar] [CrossRef]
  26. Kim, G.Y.; Peddigari, M.; Lim, K.W.; Hwang, G.T.; Yoon, W.H.; Choi, H.S.; Lee, J.W.; Ryu, J. Effect of Thickness Ratio in Piezoelectric/Elastic Cantilever Structure on the Piezoelectric Energy Harvesting Performance. Electron. Mater. Lett. 2019, 15, 61–69. [Google Scholar] [CrossRef]
  27. Patel, R.; McWilliam, S.; Popov, A.A. A Geometric Parameter Study of Piezoelectric Coverage on a Rectangular Cantilever Energy. Smart Mater. Struct. 2011, 20, 085004. [Google Scholar] [CrossRef]
  28. Salem, M.S.; Ahmed, S.; Shaker, A.; Alshammari, M.T.; Al-Dhlan, K.A.; Alanazi, A.; Saeed, A.; Abouelatta, M. Bandwidth Broadening of Piezoelectric Energy Harvesters Using Arrays of a Proposed Piezoelectric Cantilever Structure. Micromachines 2021, 12, 973. [Google Scholar] [CrossRef] [PubMed]
  29. Hosseini, R.; Hamedi, M.; Im, J.; Kim, J.; Dayou, J. Analytical and Experimental Investigation of Partially Covered Piezoelectric Cantilever Energy Harvester. Int. J. Precis. Eng. Manuf. 2017, 18, 415–424. [Google Scholar] [CrossRef]
  30. Zhou, X.; Gao, S.; Jin, L.; Liu, H.; Li, P. Effects of Changing PZT Length on the Performance of Doubly-Clamped Piezoelectric Energy Harvester with Different Beam Shapes under Stochastic Excitation. Microsyst. Technol. 2018, 24, 3799–3813. [Google Scholar] [CrossRef]
  31. Fu, H.; Chen, G.; Bai, N. Electrode Coverage Optimization for Piezoelectric Energy Harvesting from Tip Excitation. Sensors 2018, 18, 804. [Google Scholar] [CrossRef]
  32. Hu, K.; Zhou, B.; Wang, F.; Yang, Z.; Wang, M. Influence of Effective Electrode Coverage on the Energy Harvesting Performance of Piezoelectric Cantilevers. Energy Convers. Manag. 2021, 248, 114758. [Google Scholar] [CrossRef]
  33. Du, S.; Jia, Y.; Seshia, A. Maximizing Output Power in a Cantilevered Piezoelectric Vibration Energy Harvester by Electrode Design. J. Phys. Conf. Ser. 2015, 660, 012114. [Google Scholar] [CrossRef]
  34. Wang, J.; Geng, L.; Zhou, S.; Zhang, Z.; Lai, Z.; Yurchenko, D. Design, Modeling and Experiments of Broadband Tristable Galloping Piezoelectric Energy Harvester. Acta Mech. Sin. Xuebao 2020, 36, 592–605. [Google Scholar] [CrossRef]
  35. Deng, H.; Ye, J.; Huang, D. Modeling and Theoretical Analysis of a Stochastic Novel Vibro-Impact Galloping Energy Harvester with a U-Shaped Base. Commun. Nonlinear Sci. Numer. Simul. 2025, 140, 108354. [Google Scholar] [CrossRef]
  36. Huang, D.; Wang, K.; Li, R.; Li, W. Complexity and Response of Bio-Inspired Energy Harvesters Based on Wing-Beat Pattern. Phys. Scr. 2024, 99, 115241. [Google Scholar] [CrossRef]
  37. Kwon, S.D. A T-Shaped Piezoelectric Cantilever for Fluid Energy Harvesting. Appl. Phys. Lett. 2010, 97, 164102. [Google Scholar] [CrossRef]
  38. Shi, G.; Xu, J.; Xia, Y.; Zeng, W.; Jia, S.; Li, Q.; Wang, X.; Xia, H.; Ye, Y. An Annular Tubular Wearable Piezoelectric-Electromagnetic Hybrid Vibration Energy Harvester Driven by Multi Magnetic Beads. Energy Convers. Manag. 2022, 269, 116119. [Google Scholar] [CrossRef]
  39. Zhou, N.; Ao, H.; Chen, X.; Jiang, H. A Wearable Piezoelectro-Triboelectric Sensor with Nanocomposite Electrodes for Human Physiological Detection. Nano Energy 2022, 96, 107127. [Google Scholar] [CrossRef]
  40. Mousavi Lajimi, S.A.; Friswell, M.I. Design, Analysis, and Feedback Control of a Nonlinear Micro-Piezoelectric–Electrostatic Energy Harvester. Nonlinear Dyn. 2020, 100, 3029–3042. [Google Scholar] [CrossRef]
  41. McMaster-Carr. Available online: https://www.mcmaster.com/products/aluminum/shape~sheet-and-bar/system-of-measurement~metric/thickness~2mm/width~10-mm/ (accessed on 8 August 2023).
  42. Mohiuddin, M.; Mostafijur Rahman, K.; Ahmed, U.Z.; Riaz, A. Impact of Base Beam Length on Piezoelectric Cantilever Energy Harvesters: A Numerical Investigation. In Proceedings of the 6th Industrial Engineering and Operations Management Bangladesh Conference, Dhaka, Bangladesh, 26–28 December 2023. [Google Scholar] [CrossRef]
  43. Piezoelectric Sheets & Plates|PIEZO.COM. Available online: https://piezo.com/collections/piezo-sheets-plates?_=pf&pf_t_quantity=Quantity__1&pf_t_piezo_material=Piezo Material__PZT 5A&pf_t_thickness=Thickness(in.)__0.0200 (accessed on 8 August 2023).
  44. Tao, J.; Cheng, H. Dynamic Stress Response and Fatigue Life of Cantilever Beam Under Non-Gaussian Base Excitation. J. Vibroeng. 2022, 16, 63–79. [Google Scholar] [CrossRef]
  45. Bai, X.; Wen, Y.; Li, P.; Yang, J.; Peng, X.; Yue, X. Multi-Modal Vibration Energy Harvesting Utilizing Spiral Cantilever with Magnetic Coupling. Sens. Actuators A Phys. 2014, 209, 78–86. [Google Scholar] [CrossRef]
  46. Izadgoshasb, I.; Lim, Y.Y.; Padilla, R.V.; Sedighi, M.; Novak, J.P. Performance Enhancement of a Multiresonant Piezoelectric Energy Harvester for Low Frequency Vibrations. Energies 2019, 12, 2770. [Google Scholar] [CrossRef]
Figure 1. Schematic diagram of a rectangular cantilever beam. (i) Top view, (ii) Cross-sectional view.
Energies 17 05572 g001
Figure 2. Steps followed for the development and solution of the numerical model.
Energies 17 05572 g002
Figure 3. (i) Power output comparison between the numerical technique used in this work and the analytical solution and published work by Pradeesh et al. [18]; (ii) mesh dependency of the power output.
Energies 17 05572 g003
Figure 4. Variation of (i) power density and (ii) total power output per unit cost (μW/USD), with the variation of PZT by base beam length ratio.
Energies 17 05572 g004
Figure 5. Trapezoidal beam piezoelectric energy harvester configuration. (i) Top view of the structure having a ratio (a/b) less than 1, (ii) top view of the structure having a ratio (a/b) greater than 1, and (iii) side view.
Energies 17 05572 g005
Figure 6. Trapezoidal beam’s (i) variation in output power density with excitation frequency at different apex-to-base ratios (w), (ii) peak power density and resonance frequency shift across varying ‘w’, and (iii) deflection curves at different ‘w’.
Energies 17 05572 g006
Figure 7. Configurations of cantilever beam piezoelectric energy harvesters: (i) Concave, (ii) convex, (iii) V-cut, and (iv) triangular designs.
Energies 17 05572 g007
Figure 8. Concave beam’s (i) variation in output power density with excitation frequency at different middle-to-base widths (c), (ii) peak power density and resonance frequency shift across varying ‘c’, and (iii) deflection curves at different ‘c’.
Energies 17 05572 g008
Figure 9. Convex beam’s (i) variation in output power density with excitation frequency at different middle-to-base widths (cx), (ii) peak power density and resonance frequency shift across varying ‘cx’, (iii) the increase in the length of piezoelectric material with ‘cx’, and (iv) tip deflection for different ‘cx’.
Energies 17 05572 g009
Figure 10. V-cut cantilever beam’s (i) variation in output power density with excitation frequency at different cut angles (ø), (ii) peak power density and resonance frequency shift across varying ‘ø’, (iii) deflection curves at different ‘ø’, (iv) tip deflection for varying ‘ø’, (v) the increase in the length of piezoelectric material with ‘ø’, and (vi) beams with a smaller ‘ø’.
Energies 17 05572 g010
Figure 11. V-cut cantilever beam’s (i) variation in output power density with excitation frequency at different base width-to-length ratios (k), (ii) peak power density and resonance frequency shift across varying ‘k’, and (iii) Tip deflection at different ‘ø’.
Energies 17 05572 g011
Figure 12. Variation of peak output power density with aspect ratios (w = a/b) for different thicknesses of (i) the beam and (ii) the piezoelectric material.
Energies 17 05572 g012
Table 1. Properties of piezoelectric material.
PropertiesPZT-5AAluminum
Elastic modulus (GPa)6170
Density (KG/m3)77502700
Piezoelectric constant, d 31 (C/m2)10.4-
Permittivity, ε r (F/m)1700 ε 0 -
Table 2. Maximum output power density and corresponding resonance frequency from different shapes.
ShapeResonance
Frequency (Hz)
Maximum Output Power Density (µW/mm3)Base Width
(mm)
Inverted Trapezoid42.42.735.71
Concave49.61.5510.85
Convex49.72.0032.53
V-Cut51.21.6110.13
Triangular30.11.0811.29
Table 3. Comparison of maximum power density with previously published works.
PresenterModel DescriptionOutput Power Density (µW/mm3)
Benasciutti et al. [7]Trapezoid0.73
Bai et al. [45]Spiral2.0538
Izadgoshasb et al. [46]Two triangular branches2.003
Yang et al. [14]Arc-shaped8.58
This studyInverted trapezoid2.73
Disclaimer/Publisher’s Note: The statements, opinions and data contained in all publications are solely those of the individual author(s) and contributor(s) and not of MDPI and/or the editor(s). MDPI and/or the editor(s) disclaim responsibility for any injury to people or property resulting from any ideas, methods, instructions or products referred to in the content.

