Article

Economical Operation and Hazardous Air Pollutant Emissions of Biodegradable Sludge Combustion Process in Commercial Fluidized Bed Plant

1
Department of Environmental Finance, Yonsei University, Wonju 26493, Republic of Korea
2
Department of Environmental Engineering, Yonsei University, Wonju 26493, Republic of Korea
*
Author to whom correspondence should be addressed.
Energies 2024, 17(2), 542; https://doi.org/10.3390/en17020542
Submission received: 27 November 2023 / Revised: 15 December 2023 / Accepted: 28 December 2023 / Published: 22 January 2024
(This article belongs to the Section I2: Energy and Combustion Science)

Abstract

:
Waste sludge is characterized by high moisture, volatile compounds, toxic compounds, and ashes. The efficient operation of a commercial fluidized bed combustion (FBC) plant is important for reducing operational costs. We selected a commercial FBC plant for industrial waste sludge combustion to investigate the mass balance of the FBC process and the performance of the air pollution control device. Based on fuel analysis, the flow rate of incineration air was calculated as 4567 Nm3/h. After FBC combustion, the flow rate of the incineration gas increased to 8493.8 Nm3/h. Analysis of the heat balance showed that some heat potential was lost through leakage during the combustion process. The temperature of the incineration gas decreased to 200 °C at the inlet of the air pollution control device. According to the hazardous air pollutant emission testing of sampling points, the operation factors of lime slurry injection for SOx and HCl in the semi-dry reactor were 64.20 and 4.81 kg/h, respectively. In the wet scrubber, the operation factors of NaOH for SOx and HCl were 23.88 and 3.14 kg/h, respectively. At these operation factors, the available waste generation in the semi-dry reactor and wet scrubber was optimized to 76.6 and 42.57 kg/h, respectively.

1. Introduction

Biodegradable wastes such as food waste, agriculture manure, and waste sludge should be carefully treated by available methods in commercial plants to prevent serious adverse effects on aquatic ecological systems and groundwater. Thus, the landfilling of biodegradable wastes or ocean dumping should be avoided. Food and agricultural waste can be used to generate methane gas through fermentation via a bio-gas process rather than converting it to thermal energy by the combustion process in terms of efficient treatment of the process. However, waste sludge should be treated by combustion processes because of its typical fuel characteristics, such as high moisture, volatile compounds, toxic compounds, and abundant ashes.
Fluidized bed combustion (FBC) technology has been commercially developed to generate thermal energy from biodegradable waste sludges such as sewage and industrial waste sludge. Due to the typical characteristics of biodegradable waste sludges, such as high moisture, volatile compounds, toxic compounds, and abundant ashes, there have been many efforts to solve operation problems of FBC sludge combustion. Anthony et al. reviewed FBC combustion technologies for diverse biodegradable fuels, such as petroleum coke, peat, pulp and paper wastes, sewage sludges, food waste, and agriculture waste. A bubbling fluidized bed (BFB) combustion technology has been widely commercialized for sewage sludge combustion [1]. Wether and Ogada reviewed sewage sludge combustion using a fluidized bed combustor. According to the authors, a bubbling fluidized bed (BFB) has advantages over a circulating fluidized bed (CFB), which has a longer residence time for the burning of wet sewage sludge. The major limitations of sewage sludge combustion utilizing FBC are the economic heat recovery and gaseous emissions such as SOx and NOx because of the high moisture and proportions of nitrogen and sulfur in waste sludge fuel [2]. Ogada and Werther tested the combustion characteristics of sewage sludge using lab-scale and pilot-scale FBC incinerators. They found that FBC sludge combustion was much more unstable than coal combustion in terms of drying and devolatilization time in the freeboard zone because of the large numbers of volatile compounds in sewage sludge [3]. Rink et al. investigated the behavior of ash particle formation by metal element components in sewage sludge at a 300 KW FBC pilot plant. According to the authors, the particle size distribution depended on the combustion region and metal composition of the fuel [4]. Somppi et al. revealed the size distribution of fly ash from sludge combustion by comparing the BFB and the CFB pilot test units. The temperature difference in the furnace zone of the BFB was higher than that of the CFB. This causes larger particles of fly ash from the BFB compared to those from the CFB. Generally, the particle size of fly ash from BFB sludge combustion ranges from 10 to 50 μm [5]. Elled et al. tested sulfur dioxide reduction through the co-combustion of sewage sludge and biomass using a 12 MWth CFB boiler. They mentioned that sewage sludge contained lots of phosphorus compounds, thus leading to a low capture efficiency of sulfur dioxide with lime injection in the FBC process [6]. Lapa et al. investigated the toxicological composition of ashes from sewage sludge combustion by comparing bottom ash and fly ash using a pilot-scale fluidized bed combustor. According to them, the fly ash was accumulated by toxic metal compounds such as metal chlorides and metal sulfates through the FBC process [7]. Hartman et al. tested the fluidization characteristics of the particles of dried sewage sludge using a lab-scale BFB reactor. The authors mentioned many operation troubles with the FBC incineration of sewage sludge because the characteristics of sewage sludge depend strongly on its origins, and the combustion of sewage sludge should require an auxiliary fuel for pre-drying because dried sludge particles contain lots of moisture and have a low net heating value [8]. Khiari et al. mentioned that the sludge particle temperature is very important in the drying process in the FBC reactor. Before the sludge combustion was started, the heat flux of the FBC reactor was initiated to evaporate the free and bound water in the sludge particles. After drying sludge particles, the combustion of volatiles in the sludge particles was the dominant reaction in the freeboard of the BFB combustor [9,10]. Since waste sludge contains a high amount of ashes and toxic heavy metals, the FBC process requires a lot of effort for economical operation, as follows: (1) ash generation and the particle formation mechanisms of toxic heavy metals should be considered in FBC sludge combustion [4,11]; (2) the reaction of particle formation is accelerated by acid gaseous pollutants such as NOx, HCl, and SOx [12,13,14]; (3) toxic heavy metals are accumulated in fly ash as metal oxide compounds as they undergo the FBC combustion process, including passing through the air pollution control device (APCD) [15,16,17].
Although FBC sludge combustion has been researched for a long period and proven to be a reliable technology, due to the inherent composition of typical sludge, which is different from sludge in its raw state, most investigations and studies of commercial FBC sludge plants should be required to optimize operating parameters and to increase facility performance. Also, since wet waste sludge combustion requires significant heat energy for the drying process, consuming much auxiliary fuel, such as diesel fuel, and generating lots of wastewater and hazardous wastes due to the injection of many additives for capturing HAP emissions, the economical operation of the APCD process should be considered to reduce the maintenance and operating costs of commercial facilities. In this study, we evaluated a typical FBC commercial industrial sludge combustor to optimize the operational performance of the combustion process and air pollution control devices (APCDs). The mass and heat balance were investigated during the FBC combustion process. Also, the operational performance of the APCD was investigated by measuring HAP emissions such as major gaseous pollutants, fine particles, and mercury at the inlet and outlet of the APCDs.

2. Facilities and Experimental Methods

2.1. Investigated Facility

Figure 1 shows the FBC incineration process and APCD configurations of the facility. The investigated facility was located in Ansan, which is near the Siwha industrial complex. The facility area measured 8300 m2. The incineration process set up involved a dryer, an FBC reactor, an air preheater, and a waste heat boiler (WHB). The APCD configuration was composed of a semi-dry reactor (SDA), a bag filter (B/F), and a wet scrubber (WS). Table 1 shows the sludge incineration conditions of the FBC commercial facility. The facility capacity maintained 2877 kg/h as a sludge feeding rate. The combustion temperature was 923 °C. The injection sludge was industrial sludge from the wastewater sewer system in the Siwha industrial complex. The industrial complex was composed of multitudinous industrial manufacturing plants, with plastic manufacture facilities, resin and rubber manufacture facilities, facilities for the manufacture of basic precious and non-ferrous metals, facilities for the treatment and coating of metals, etc. According to the results of the sludge analysis, the moisture content of the sludge was 82.1%. The lower heating value (LHV) of the sludge was 525.5 kcal/kg. According to elemental analysis, the sludge was composed of 34.07% carbon, 5.58% hydrogen, 5.02% nitrogen, 16.62% oxygen, 3.19% sulfur, and 0.68% chloride.

2.2. Sampling and Analysis

Figure 1 shows the hazardous air pollutant (HAP) sampling points of the investigated facility. At each sampling point, major gaseous pollutants, such as NOx, SOx, and HCl, particulate matter, toxic heavy metals, and mercury, were sampled and analyzed. The sampling of all pollutants was conducted 2 times at each sampling point. Gaseous pollutants were sampled and analyzed using a portable gas analyzer. Particulate matter (PM) sampling was carried out using EPA Method 1 and 2301. For particulate matter less than 10 μm in size (PM10) and particulate matter less than 2.5 μm in size (PM2.5), the sampling method was based on ISO 23210 as a stationary source for emissions determination of the PM10/PM2.5 mass concentration in flue gas measurement at low concentrations using an impactor [18]. A cascade impactor and iso-kinetic sampler were utilized to measure PM10 and PM2.5. Toxic metals in PM were analyzed using inductively coupled plasma mass spectrometry (Ultra mass 700: Varian Co. Ltd., Palo Alto, CA, USA). Mercury sampling was carried out using the Ontario Hydro Method (OHM). Liquid and solid samples from the impinger train were pre-treated by US EPA 7470A and US EPA 7471. This method is a modification of EPA Method 29, which was originally used to determine total mercury and has since been validated as a mercury speciation method of analyzing flue gas from fuel combustion plants. This method involved the use of seven sampling trains of impinger solutions. All oxidized mercury was selectively captured by three 1N KCl impinger solutions. The purpose of using the H2O2 impinger solution was to absorb sulfur dioxide and protect against the neutralization of KMnO4 impinger solutions. Elemental mercury was selectively captured using HNO3-H2O2 and H2SO4-KMnO4 impinger solutions [19,20,21,22]. Particulate mercury was sampled by an iso-kinetic method using a glass fiber filter followed by a gaseous mercury sampling train. Samples from sampling points were brought to an external laboratory for a sample digestion procedure before mercury speciation analysis with a mercury analyzer. Liquid and particle samples were digested by 4% H3BO4, aqua regia (HCl:HNO3 = 3:1), 5% KMnO4, and 5% K2S2O8 regents. Mercury speciation as elemental mercury, oxidized mercury, and particulate mercury was analyzed using a cold vapor atomic absorption-type Lab 254 mercury analyzer (Mercury Instrument GmbH, Karlsfeld, Germany).

3. Results and Discussion

3.1. Mass Balance of the FBC Incineration Process

Figure 1 shows the mass balance of the sewage sludge combustion process in the FBC. Each process and APCD was designed based on the composition of the input sludge and air flow rate. The process of sewage sludge incineration in the FBC process involves a sludge dryer, an FBC incinerator, an air preheater, a WHB, an SDA, a B/F, and a WS. The feeding rate of the input sewage sludge was 4167 kg/h(100 tons/d) for incineration. The elemental composition of the wet sludge was 34.07% carbon, 5.58% hydrogen, 16.62% oxygen, 5.02% nitrogen, 2.78% sulfur, and 0.68% chloride. The moisture content of the wet sludge was 82.05%. First, wet sludge was fed into a sludge dryer to reduce the moisture content. The moisture content of the input fuel is very important in waste-to-energy (WTE) facilities that not only effectively recover thermal energy from biodegradable waste fuel but also safely treat the leachate from waste to prevent secondary pollution of the ecological system. Based on the composition of the input sludge and considerations of economical operation, the moisture content of the dried sludge was designed to be 74%, and the water vapor content from the dryer was designed to be 1300 kg/h. After drying, the feeding rate of the input sludge was reduced to 2877 kg/h. The dried sludge was then fed into an FBC incinerator. The flow rate of incineration air for FBC sludge combustion was calculated as 4567 Nm3/h.
After sludge combustion, the flow rate of the incineration gas increased to 8493.8 Nm3/h. It was observed that the moisture of the input sludge evaporated via combustion, and the volume of the gas increased as the incineration temperature in the combustor increased. The total input heat potential for the FBC incineration process was calculated as 2,668,367 kcal/h, which included 1,711,902 kcal/h of input sludge and 956,464 kcal/h of incineration injection air. However, the total output heat potential of the incineration gas decreased to 2,624,099 kcal/h. Some amount of heat potential was thought to be likely lost through leakage during the FBC process. After the FBC incineration process, the heat content of the hot incineration gas was recovered through the air preheater and the WHB. In the air preheater, the incineration air was warmed up by heat translation from the hot incineration gas from the FBC incineration process. The heat translation rate of the air preheater was calculated as 938,214 kcal/h. After passing through the air preheater, the temperature of the incineration gas decreased to 569 °C. In the WHB, the rates of steam generation and heat translation were calculated as 1815.5 kg/h and 1,050,303 kcal/h, respectively, for the sludge dryer. Finally, the temperature of the incineration gas after the heat recovery process decreased to 200 °C at the inlet of the APCD.

3.2. HAP Emission from Sewage Sludge Combustion

Table 2 presents the gas composition and pollutants of the inlet and outlet APCD. The concentrations of H2O and O2 were analyzed during each process as a correction factor to determine the air pollutant concentrations in the incineration gas. The concentrations of gas pollutants such as CO, NOx, SOx, and HCl complied with the emission limits of air pollutant regulation. However, CO and NOx were not effectively captured during the APCD process. The NOx concentration was especially close to the emission limit of 50 ppm. An additional process of NOx control, such as a flue gas recirculation process, would be necessary to reduce NOx during sludge combustion. The concentrations of SOx and HCl, which needed to be carefully controlled by capturing processes, were 2368 ppm and 355 ppm, respectively, at the inlet of the APCD. Due to SDA and WS processes in the FBC sludge combustion, the control efficiencies of SOx and HCl were 99% and 94%, respectively.
Table 3 shows the PM concentrations, toxic heavy metal concentrations, and control efficiency of the APCDs. As shown in the figure, the concentration of PM at the inlet of the B/F was 13,117.4 mg/Sm3 of coarse particles over 2.5 μm in size and 2564.6 mg/Sm3 of fine particles less than 2.5 μm in size. At the inlet of the B/F, coarse and fine particles were enriched as follows: chromium > nickel > lead > arsenic > cadmium. At the stack, both particles were well captured, with the APCD configurations exhibiting a capture efficiency of 100%. As the concentration of coarse particles over 2.5 μm decreased after passing through the APCDs, the concentration of most heavy metals decreased, with a capture efficiency of over 99%. However, in fine particles less than 2.5 μm in size, the concentrations of nickel and chromium were more enriched than those of other metals at the outlet of the APCDs. It was found that most fine particulates at the outlet of the APCDs were enriched with these toxic metals and penetrated the APCD configurations.
Table 4 shows the mercury concentrations at the inlet and outlet of the APCDs. Generally, mercury speciation is distributed as elemental mercury, oxidized mercury, and particulate mercury in the combustion process. At the inlet of the APCDs, the total mercury concentration was 988.5 μg/Sm3 on average. The mercury compounds were distributed as 32.8 μg/Sm3 of elemental mercury, 953.5 μg/Sm3 of oxidized mercury, and 2.2 μg/Sm3 of particulate mercury. At the outlet of the APCDs, the total mercury concentration was 13.1 μg/Sm3. The total mercury removal efficiency of the APCD configuration was 98.7%. In the case of mercury compounds, the concentrations of oxidized mercury and elemental mercury sharply decreased due to the 96% control efficiency, whereas the concentration of particulate mercury increased from 2.15 μg/Sm3 to 11.82 μg/Sm3 after passing through the APCDs. Figure 2 shows the speciation of mercury at the inlet and outlet of the APCDs. The speciation of oxidized mercury was 96.9% on average at the inlet of the APCDs, being the dominant species among mercury compounds. However, at the outlet of the APCDs, particulate mercury was mostly speciated in the flue gas. Oxidized mercury was found to react with lime slurry in the SDA and was converted to particulate mercury, which was not removed by the APCD configurations.

3.3. Determination of APCD Operation Factor for FBC Sludge Combustion

Based on the mass balance and HAP emission concentration, APCD operation factors were optimized for the FBC sludge combustion plant. Since waste sludge from industrial plants contains high levels of moisture and toxic compounds, efficient APCD operation should be required for the FBC sludge combustion process. Additionally, the FBC sludge combustion process requires an efficient heat and mass balance because of the high operation costs of the drying process. Therefore, APCD operation factors for the FBC sludge incineration process must be optimized. The investigated facility was initially operated by considering a design prediction factor based on the elemental analysis of sludge composition at the time of facility construction. Since industrial sludge composition varies depending on the characteristics of the wastewater from industrial complexes, the operation factor should be optimized by mass balance and the on-site sampling and analysis of HAP emissions in designated sampling points. After passing through the APCD, major gaseous pollutants such as NOx, SOx, and HCl should be effectively captured by injected additives to reduce the slurry waste and operation costs. The additives, injections, and slurry waste generation values were all optimized by considering sampling and analysis data based on the on-site measurement of flue gas flow rate, gas temperature, flue gas composition, and major gaseous pollutants. In the case of PM and mercury, these pollutants were well captured by the existing APCD configurations. Accordingly, the impact of the APCD operation factor on these pollutants would be negligible. Figure 3 shows the APCD operation factors and potential waste generation in the FBC sludge combustion process. In the case of NOx, urea solution was injected as an additive into the FBC incinerator to capture emitted NOx. NOx could be reduced to nitrogen by a reaction with urea solution, as shown in Equation (1).
  • DeNOx process:
CO(NH2)2 + 2NO + 1/2O2 → 2N2 + 2H2O + CO2
Originally, the injection of urea solution as an additive for the FBC combustion process was designed to capture 70% of nitrogen oxide from waste sludge combustion to comply with the emission limit of 50 ppm at the outlet of the WHB. Based on the composition of waste sludge, the usage of 100% urea solution additive was calculated as 0.81 kg/h with the equation. Generally, the injection rate of additives is determined to be 2 times more than the targeted injection rate to ensure maximum emission capture of the designated pollutants. Finally, the total injection rate was determined as 54.11 kg/h by using 3% urea solution additive. As shown in Table 2, the NOx concentration was 45.59 ppm, which is similar to the targeted concentration. The emission limit of NOx has recently been observed to have a tendency to decrease to 30 ppm because NOx can be converted to greenhouse gases via photochemical reactions. Accordingly, the operation factor of additive injection for capturing NOx would be 38.96 kg/h using a 5% urea solution additive to comply with the 30 ppm NOx emission limit. After the FBC sludge combustion process, the flow rate of the incineration gas was 8493.8 Nm3/h at the inlet of SDA and the temperature of the incineration gas decreased to 200 °C. In the case of SOx, lime slurry and NaOH were injected into the SDA and the WS to capture this pollutant. The desulfurization process of SOx was initiated by a reaction with lime slurry and NaOH in each APCD, as shown in Equations (2) and (3).
  • Desulfurization process: SDA (Equation (2)) + WS (Equation (3))
SO2 + Ca(OH)2 → Ca2SO3 + H2O
SO2 + 1/2O2 + 2NaOH → Na2SO4 + H2O
In the SDA, the emission concentration of SOx at the inlet was calculated as 3645.9 ppm based on the composition analysis of waste sludge. Originally, the lime slurry injection rate at the inlet of SDA was designed to capture 2187.5 ppm of sulfur dioxide, which corresponds to a 60% capture efficiency. According to Equation (2), the usage of 100% lime slurry additive was calculated as 98.84 kg/h. The generation rate of slurry waste as Ca2SO3 was calculated to be 106.9 kg/h. According to the test results, the emission concentration at the inlet of SDA was 2368 ppm, which is lower than the targeted concentration. Based on the test results, the operation factor of lime slurry injection for capturing SOx at the inlet of SDA would be 64.20 kg/h. With this injection rate, the generation rate of lime slurry waste would be 69.4 kg/h. In the WS, the concentration of SOx at the inlet was calculated as 1458.4 ppm. According to Equation (3), the usage of NaOH was calculated as 37.05 kg/h, which was designed for a 98% capture efficiency. The generation rate of slurry waste as Na2SO4 was calculated as 58.36 kg/h. According to the test results, the concentration of SOx decreased to 947.2 ppm at the inlet of the WS. Finally, the operation factor of NaOH injection would be 23.88 kg/h. With this injection rate, the generation rate of slurry waste would be 37.62 kg/h. In the case of HCl, the capturing process was induced by a reaction with lime slurry and NaOH in each APCD, as shown in Equations (4) and (5).
  • HCl capture process: SDA (Equation (4)) + WS (Equation (5))
2HCl + Ca(OH)2 → CaCl2 + 2H2O
HCl + NaOH → NaCl + H2O
In the SDA, the concentration of HCl at the inlet was calculated as 712.7 ppm based on the composition analysis of waste sludge. As with SOx emissions, the injection rate of lime slurry was designed to capture 60% of HCl passing through the SDA. According to Equation (4), the usage of lime slurry was calculated as 9.66 kg/h. Slurry waste generation was calculated as 14.5 kg/h. According to the test results, the emission concentration of HCl at the inlet of the SDA was 355 ppm, which is much lower than the targeted concentration. Based on the test results, the operation factor of lime slurry injection would be 4.81 kg/h. With this injection rate, the amount of slurry waste generated would be 7.2 kg/h. In the WS, the concentration of HCl at the inlet was calculated as 285.1 ppm. According to Equation (5), the usage of lime slurry was calculated as 6.83 kg/h, which was designed for a 93% capture efficiency. The slurry waste generation was calculated as 10.76 kg/h. According to the test results, the concentration of HCl decreased to 142 ppm at the inlet of the WS. Finally, the operation factor of NaOH was determined as 3.14 kg/h. At this injection rate, the waste generation decreased to 4.95 kg/h.

4. Conclusions

Based on the mass balance and HAP emission concentration, APCD operation factors were optimized for the FBC sludge combustion plant. All additives, injections, and slurry waste generation values were optimized by considering sampling and analysis data based on the on-site measurement of a flue gas flow rate, a flue gas temperature, a flue gas composition, and major gaseous pollutants.
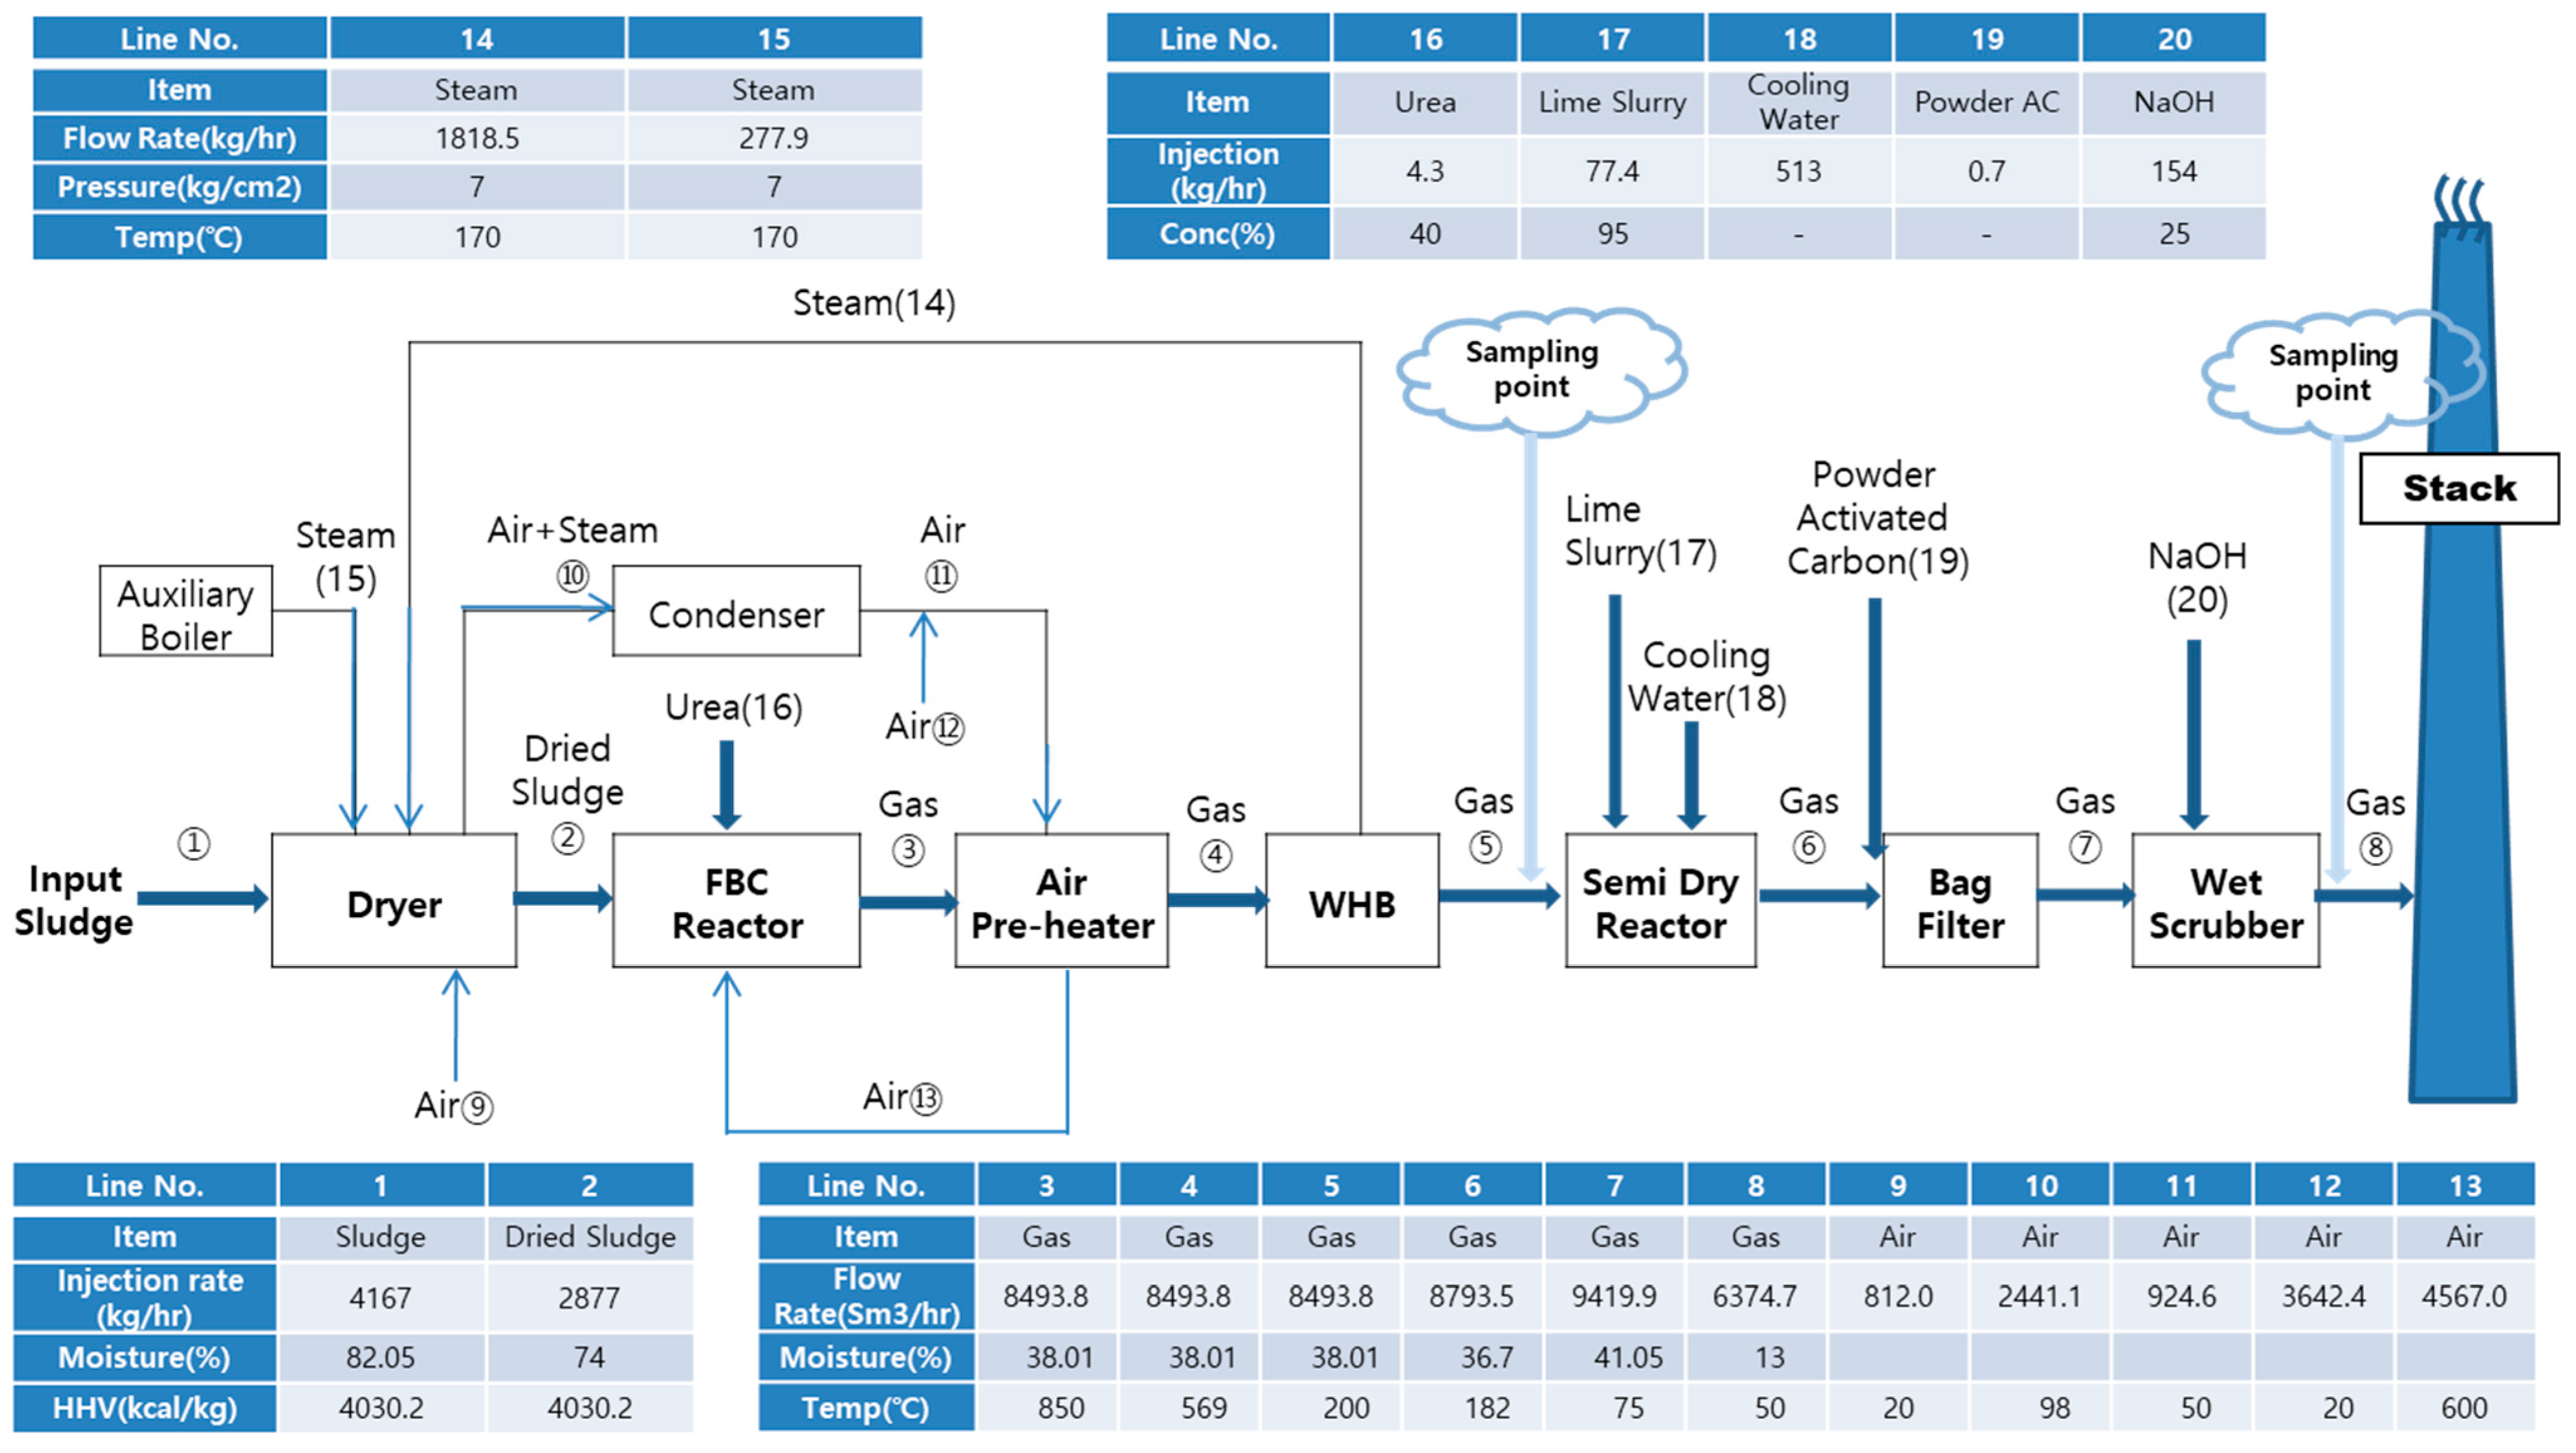
  • Because of the high moisture and toxic compound levels in waste sludge from industrial plants, the heat and mass balance of the FBC combustion process should be monitored to ensure economical operation. After the drying process, the input sewage sludge decreased from 4167 kg/h to 2877 kg/h. After sludge combustion, the flue gas rate increased to 8493.8 Nm3/h and the flue gas temperature decreased to 200 °C.
  • Since waste sludge contains abundant organic compounds and chloride, gaseous pollutants such as NOx, SOx, and HCl should be carefully treated in the process. The control efficiency of SOx and HCl for gaseous pollutants was 99% following additive injection into the SDA and WS, whereas the control efficiency of NOx was 41%, and thus an alternative capture process is needed.
  • With the APCD configurations used, coarse and fine particulates were well captured with 100% control efficiency. At the stack, fine PM was more enriched with chromium and nickel than other heavy metals. It was found that fine PM at the outlet of the APCDs mostly consisted of toxic metals that were not captured by APCD configurations.
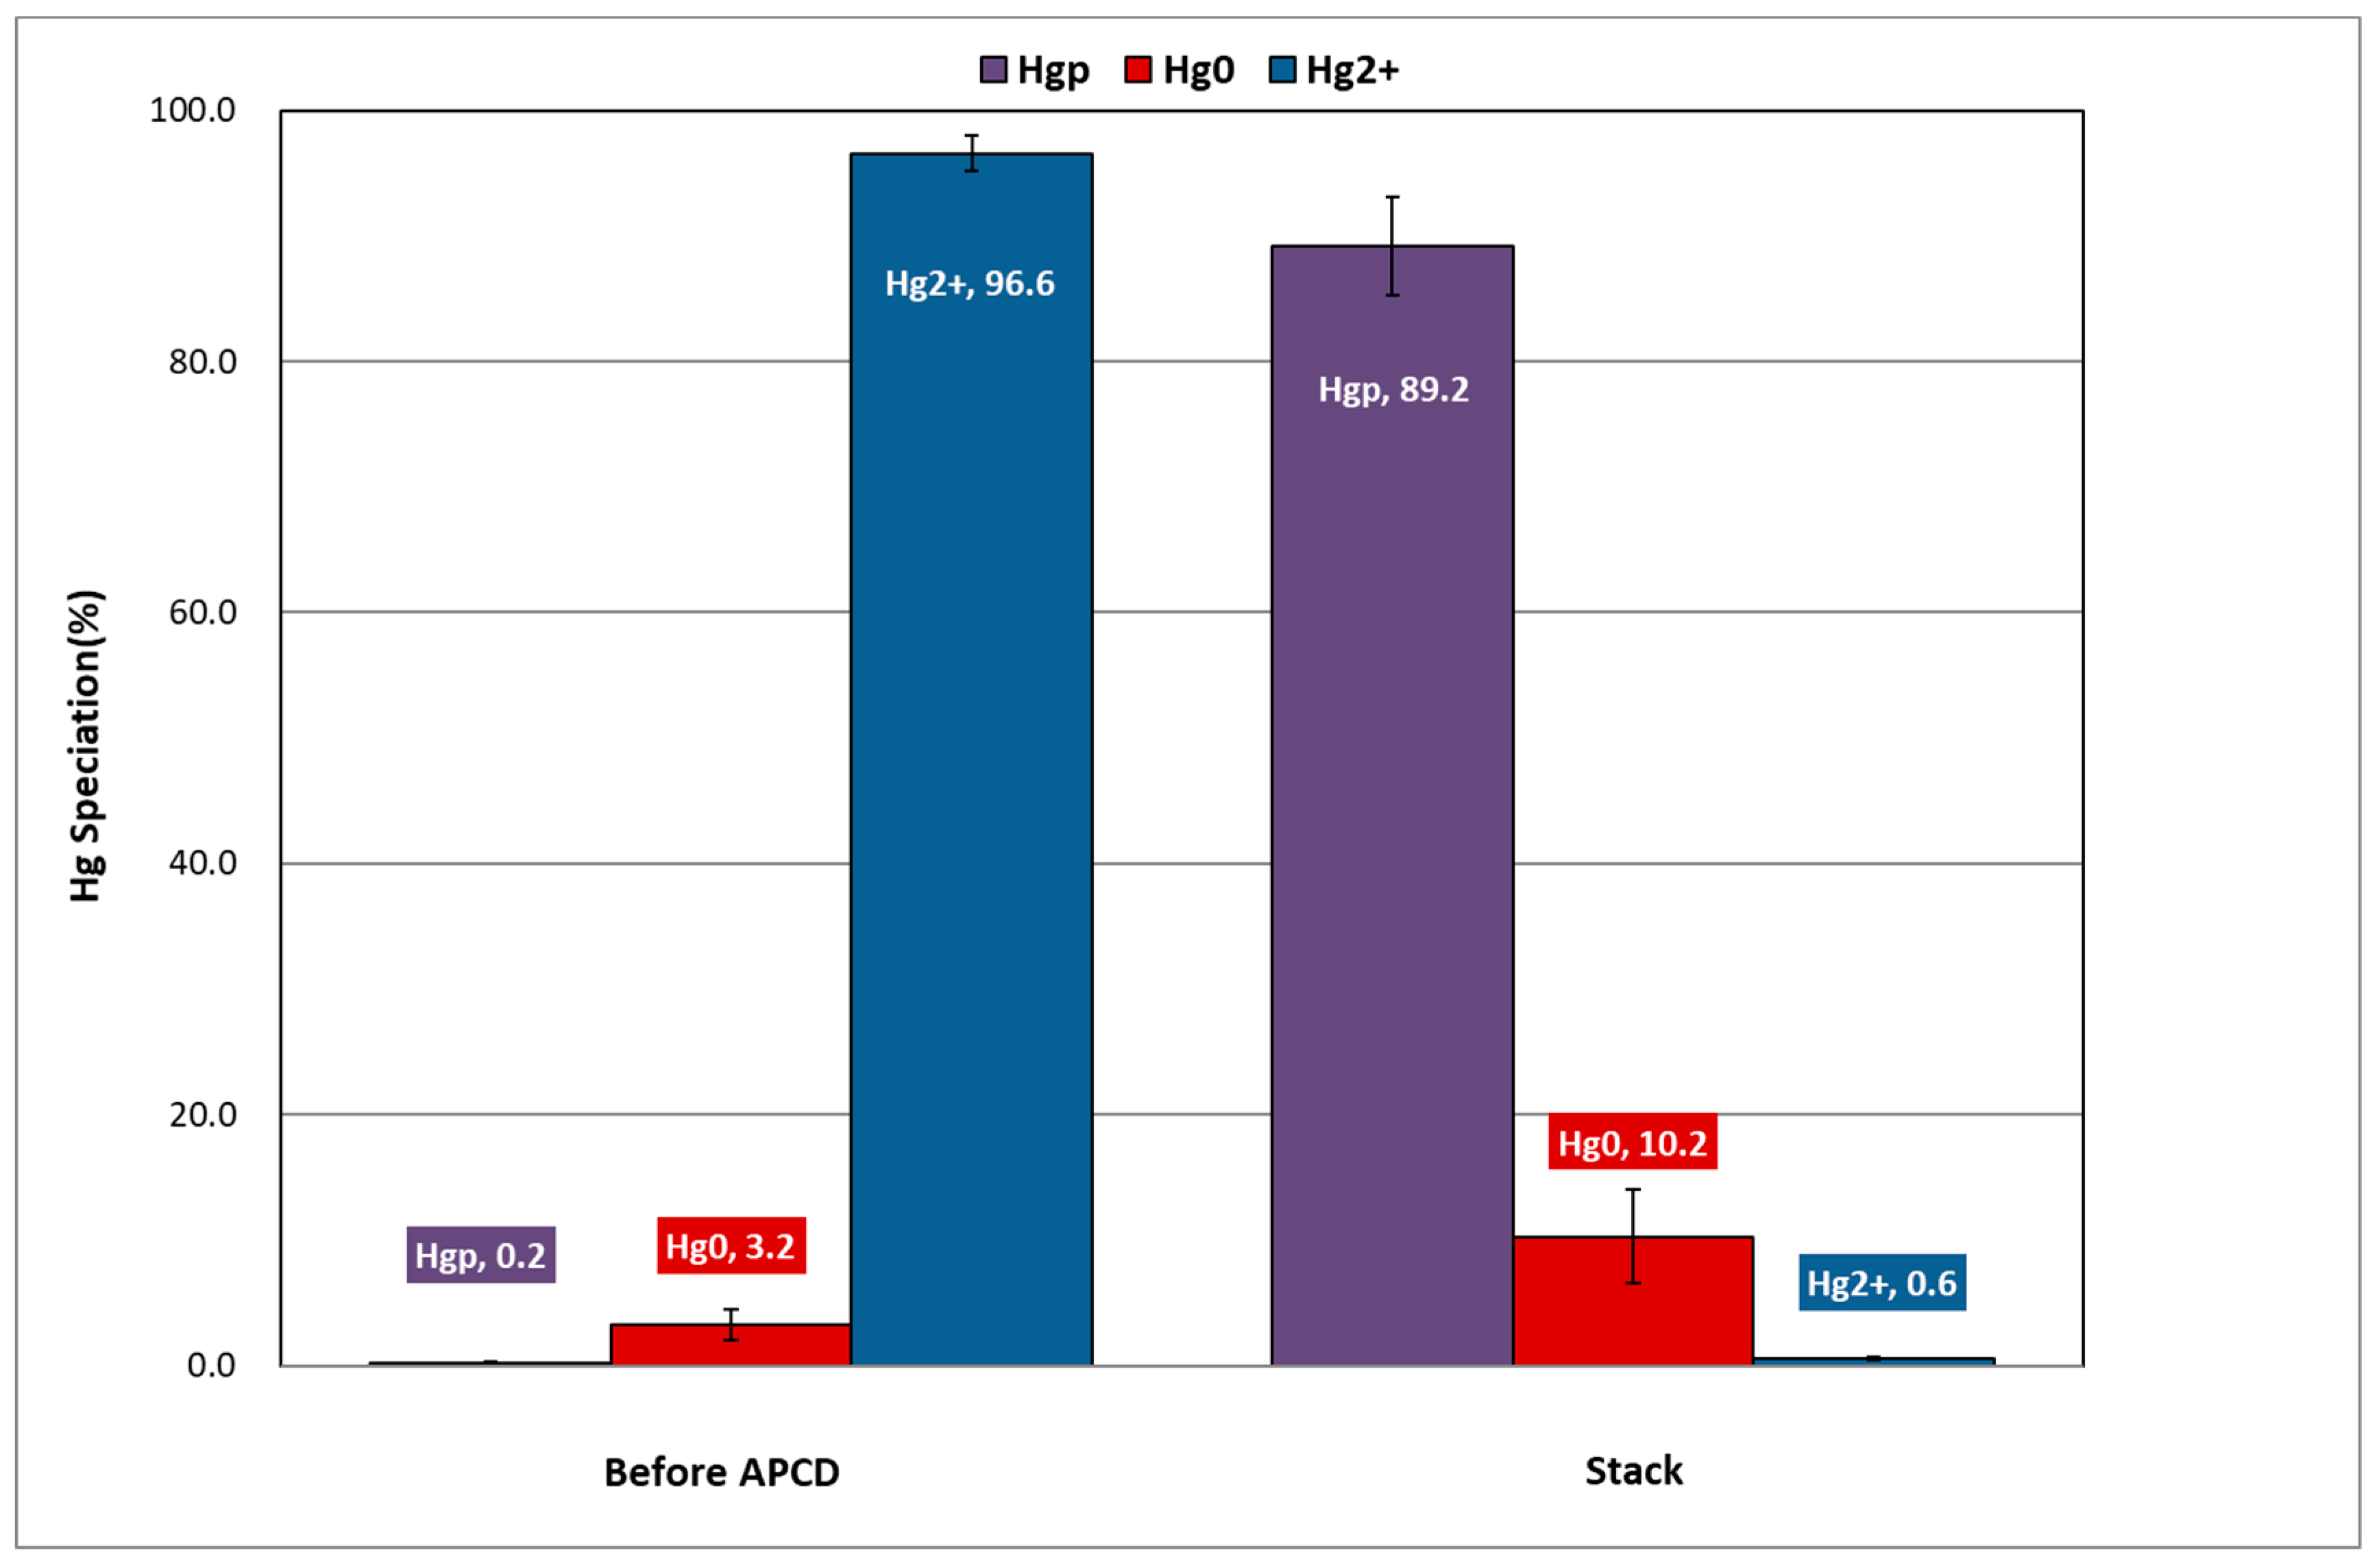
  • At the inlet of the APCDs, oxidized mercury accounted for 96.4% of the total mercury, and thus was the dominant species among mercury compounds. After passing through the APCDs, the concentrations of elemental and oxidized mercury decreased, and particulate mercury was mostly distributed in the flue gas. It was observed that oxidized mercury was transformed into particulate mercury by reacting with additives in the SDA and finally penetrated the APCDs.
  • For economical operation of an APCD, APCD operation factors and potential waste generation were determined based on the HAP test results. The additive injection and potential waste generation for gaseous pollutants were decreased by 30~40% compared with the predicted design injection rate in the SDA and WS. This should contribute to the efficient operation of APCDs and mitigate the operation costs of the combustion process.

Author Contributions

Conceptualization, H.-N.J. and H.S.C.; methodology, H.-N.J.; software, H.-N.J.; validation, H.-N.J. and H.S.C.; formal analysis, M.K.C.; investigation, H.-N.J. and M.K.C.; resources, H.-N.J.; data curation, M.K.C.; writing—original draft preparation, H.-N.J.; writing—review and editing, H.-N.J. and H.S.C.; visualization, H.-N.J.; supervision, H.S.C.; project administration, H.S.C.; funding acquisition, H.S.C. All authors have read and agreed to the published version of the manuscript.

Funding

This work was supported by the Korea Ministry of Environment as part of the Field of Green Financing on Green Integration Human Resource Development Project. Additionally, this study was carried out with the support of the “R&D Program for Forest Science Technology (Project No. 2021356A00-2323-AC03)” funded by the Korea Forest Service (Korea Forestry Promotion Institute).

Data Availability Statement

Data are contained within the article.

Conflicts of Interest

The authors declare no conflicts of interest.

References

  1. Anthony, E. Fluidized bed combustion of alternative solid fuels; status, successes and problems of the technology. Prog. Energy Combust. Sci. 1995, 21, 239–268. [Google Scholar] [CrossRef]
  2. Ogada, T.; Werther, J. Combustion characteristics of wet sludge in a fluidized bed. Fuel 1996, 75, 617–626. [Google Scholar] [CrossRef]
  3. Werther, J.; Ogada, T. Sewage Sludge Combustion. Prog. Energy Combust. Sci. 1999, 25, 55–116. [Google Scholar] [CrossRef]
  4. Rink, K.K.; Kozinski, J.A.; Lighty, J.S. Biosludge incineration in FBCs: Behavior of ash particles. Combust. Flame 1995, 100, 121–130. [Google Scholar] [CrossRef]
  5. Latva-Somppi, J.; Kauppinen, E.I.; Valmari, T.; Ahonen, P.; Gurav, A.S.; Kodas, T.T.; Johanson, B. The ash formation during co-combustion of wood and sludge in industrial fluidized bed boilers. Fuel Process. Technol. 1998, 54, 79–94. [Google Scholar] [CrossRef]
  6. Elled, A.-L.; Åmand, L.-E.; Leckner, B.; Åndersson, B.-A. Influence of Phosphorus on Sulphur Capture during Co-firing of Sewage Sludge with Wood or Bark in a Fluidized Bed. Fuel 2006, 85, 1671–1678. [Google Scholar] [CrossRef]
  7. Lapa, N.; Barbosa, R.; Lopes, M.H.; Mendes, B.; Abelha, P.; Gulyurtlu, I.; Oliveira, J.S. Chemical and Ecotoxicological Charac-terization of Ashes obtained from Sewage sludge combustion in a Fluidized Bed Reactor. J. Hazard. Mater. 2007, 147, 175–183. [Google Scholar] [CrossRef] [PubMed]
  8. Hartman, M.; Pohořelý, M.; Trnka, O. Fluidization of Dried Wastewater Sludge. Powder Technol. 2007, 178, 166–172. [Google Scholar] [CrossRef]
  9. Khiari, B.; Marias, F.; Vaxelaire, J.; Zagrouba, F. Incineration of a small particle of wet sewage sludge: A numerical comparison between two states of the surrounding atmosphere. J. Hazard. Mater. 2007, 147, 871–882. [Google Scholar] [CrossRef] [PubMed]
  10. Khiari, B.; Marias, F.; Zagrouba, F.; Vaxelaire, J. Transient mathematical modelling of a fluidized bed incinerator for sewage sludge. J. Clean. Prod. 2008, 16, 178–191. [Google Scholar] [CrossRef]
  11. Somppi, J.L.; Kauppinen, E.I.; Kurkela, J.; Tapper, U.; Ohman, M.; Nordin, A.; Johanson, B. Ultrafine Ash Particle Formation in Fluidized Bed Reactor. Combust. Sci. Technol. 1998, 134, 433–455. [Google Scholar] [CrossRef]
  12. Seames, W.S.; Fernandez, A.; Wendt, J.O.L. A Study of Fine Particulate Emissions from Combustion of Treated Pulverized Municipal Sewage Sludge. Environ. Sci. Technol. 2002, 36, 2772–2776. [Google Scholar] [CrossRef] [PubMed]
  13. Lopes, M.H.; Abelha, P.; Lapa, N.; Oliveira, J.S.; Cabrita, I.; Gulyurtlu, I. The behavior of Ashes and Heavy Metals during the Co-combustion of Sewage Sludge in a Fluidized Bed. Waste Manag. 2003, 23, 859–870. [Google Scholar] [CrossRef] [PubMed]
  14. Leckner, B.; Åmand, L.-E.; Lücke, K.; Werther, J. Gaseous emissions from co-combustion of sewage sludge and coal/wood in a fluidized bed. Fuel 2004, 83, 477–486. [Google Scholar] [CrossRef]
  15. Sanger, M.; Werther, J.; Ogada, T. NOx and N2O Emission Characteristics from Fluidized Bed Combustion of Semi-dried Municipal Sewage Sludge. Fuel 2001, 80, 167–177. [Google Scholar] [CrossRef]
  16. Shao, J.; Yan, R.; Chen, H.; Yang, H.; Lee, D.H.; Liang, D.T. Emission Characteristics of Heavy Metals and Organic Pollutants from the Combustion of Sewage Sludge in a Fluidized Bed Combustor. Energy Fuels 2008, 22, 2278–2283. [Google Scholar] [CrossRef]
  17. Lopes, M.H.; Gulyurtlu, I.; Cabrita, I. Control of Pollutants during FBC Combustion of Sewage Sludge. Ind. Eng. Chem. Res. 2004, 43, 5540–5547. [Google Scholar] [CrossRef]
  18. ISO 23210:2009; Stationary Source Emissions, Determination of PM10/PM2.5 Mass Concentration in Flue Gas, Measurement at Low Concentrations by Use of Impactors. ISO: Geneva, Switzerland, 2009.
  19. US EPA Method. Test Method for Evaluating Solid Waste, SW-846-3050B Acid Digestion of Sediments, Sludges, and Solis, 3rd ed.; US EPA, Office of Solid Waste and Emergency Response, US Government Printing Office: Washington, DC, USA, 1986.
  20. US EPA. Compilation of Air Pollutant Emission Factors AP-42. In Stationary Point and Area Sources, 5th ed.; AP-42 US EPA: Research Triangle Park, NC, USA, 1995; Volume 1. [Google Scholar]
  21. EMTIC TM-201A; Determination of PM10 Emissions. US EPA Method: Research Triangle Park, NC, USA, 1997.
  22. EMTIC TM-5; Determination of Particulate Matter Emissions from Stationary Sources. US EPA Method: Research Triangle Park, NC, USA, 2000.
Figure 1. FBC incineration process with APCD configuration and HAP sampling points.
Energies 17 00542 g001
Figure 2. Mercury speciation by OHM method at each sampling point.
Energies 17 00542 g002
Figure 3. APCD operation factors and potential waste generation for economical HAP capture process.
Energies 17 00542 g003
Table 1. Sludge incineration conditions of FBC commercial facility.
Incineration ConditionSludge Element Analysis (wt.%)
Facility Capacity (ton/d)100Carbon34.07
Temperature (°C)923Hydrogen5.58
Sludge InjectionS + INitrogen5.02
Sludge Moisture (%)82.1Oxygen16.62
Ash Production (kg/d)9140Sulfur3.19
APCD ConfigurationSDA + BF + WSChloride0.68
HLV (kcal/kg)525.5--
S: municipal sewage sludge, I: industrial sewage sludge, SDA: semi-dry reactor, BF: bag filter, WS: wet scrubber.
Table 2. Gas composition and pollutants of inlet and outlet APCD.
H2O (%)O2 (%)CO (ppm)NOx (ppm)SOx (ppm)HCl (ppm)
Inlet SDR38.015.7716.078.02368.0355.0
Inlet B/F36.706.29----
Outlet B/F41.056.29----
Stack13.09.046.045.591.593.94
Table 3. PM and toxic metal concentrations and control efficiency at sampling points.
PM (mg/Sm3)AS (μg/Sm3)Cd (μg/Sm3)
PM2.5PM2.5PM2.5PM2.5PM2.5PM2.5
Before B/F13,117.42564.6142.073.090.038.0
Stack1.01.91.0N.D.N.D.N.D.
Efficiency (%)100.0100.0100.0100.0100.0100.0
Cr (μg/Sm3)Ni (μg/Sm3)Pb (μg/Sm3)
PM2.5PM2.5PM2.5PM2.5PM2.5PM2.5
Before B/F155,103.050,711.021,163.08495.04403.01904.0
Stack6.056.02.097.08.01.0
Efficiency (%)100.099.9100.098.899.8100.0
PM2.5↑: coarse particles over than 2.5 μm in size, PM2.5↓: fine particles less than 2.5 μm in size., N.D.: no data.
Table 4. Mercury distribution and speciation at sampling points.
Sampling PointSampling MethodHg Conc. (μg/Sm3)Hg Distribution (μg/Sm3)Hg Speciation (%)
HgpHg0Hg2+HgpHg0Hg2+
Before B/FOHM-1907.10.717.7888.60.12.098.0
OHM-21069.93.647.91018.40.34.595.2
Average988.52.232.8953.50.23.296.6
StackOHM-116.715.51.10.193.16.40.5
OHM-29.58.11.30.185.314.01.0
Average13.111.81.20.190.39.10.7
Control Eff.98.7-96.4100.0---
OHM: Ontario Hydro Method, Hgp: particulate mercury, Hg0: elemental mercury, Hg2+: oxidized mercury.
Disclaimer/Publisher’s Note: The statements, opinions and data contained in all publications are solely those of the individual author(s) and contributor(s) and not of MDPI and/or the editor(s). MDPI and/or the editor(s) disclaim responsibility for any injury to people or property resulting from any ideas, methods, instructions or products referred to in the content.

