Article

Relative Comparison of Benefits of Floor Slab Insulation Methods, Using Polyiso and Extruded Polystyrene Materials in South Africa, Subject to the New National Building Energy Efficiency Standards

1
Department of Building and Human Settlements, Nelson Mandela University, Gqeberha 6001, South Africa
2
Department of Construction Management, Nelson Mandela University, Gqeberha 6001, South Africa
*
Author to whom correspondence should be addressed.
Energies 2024, 17(2), 539; https://doi.org/10.3390/en17020539
Submission received: 9 November 2023 / Revised: 5 January 2024 / Accepted: 15 January 2024 / Published: 22 January 2024
(This article belongs to the Special Issue Advances in Energy Efficiency and Conservation of Green Buildings)

Abstract

:
This article aims to assess the benefits of floor slab insulation measures using extruded polystyrene (XPS) and polyisocyanurate (also referred to as polyiso or PIR) insulation materials at various levels of insulation thicknesses for a detached residential building. An EnergyPlus simulation analysis was carried out within the seven energy zones (represented by eight locations) of South Africa in accordance with the South African national code for building energy efficiency (SANS10400-XA). The energy savings and payback periods related to the use of the insulation over a lifecycle period of 50 years were assessed. Cape Town (zone 4) behaved differently from other locations and hardly benefited from the application of floor slab insulation measures. Generally, polyiso (PIR) insulation performed better than XPS for vertical gap insulation, and lower insulation thicknesses required higher insulation depths to maximize energy savings. Similarly, lower insulation thicknesses (25 mm and 50 mm) required higher perimeter insulation widths to maximize energy savings for horizontal perimeter insulation, especially in Sutherland (zone 6) and Cape Town. The maximization of energy savings was also achieved at low insulation thickness for the full floor slab insulation method, except for Sutherland and Fraserburg (zone 7). The locations that benefitted most from the floor slab insulation methods were Pretoria (zone 5), Thohoyandou (zone 3), Sutherland (zone 6), Fraserburg (zone 7), Welkom (zone 1), Ixopo (zone 5H), Witbank (zone 2), and Cape Town (zone 4), in that order. Generally, higher net energy savings are achieved in areas with lower humidity levels and areas with greater annual sums of both cooling and heating degree days.

1. Introduction

1.1. Background

South Africa was the largest consumer of energy in Sub-Saharan Africa in 2021, followed by Nigeria and Algeria. The country has a large and intensive coal mining industry through which it meets most of its energy needs [1]. The number of households (in millions) globally that demand energy is projected to increase by 10.5% from 2208 million households (in 2022) to 2439 million households (in 2030), while the expansion of residential buildings (in million m2 of floor area) is expected to be about 14.6%, from 198,090 million m2 in 2022 to 227,039 million m2 in 2030 [2]. While [3] indicates that residential buildings consumed about a fifth or 20.96% of global energy in 2022, the 2022–2030 energy demand trends indicate an expected growth in residential building energy consumption of at least 10% (between 2022 and 2030). Heat losses through floors in residential buildings are quite significant and can account for as much as 10 to 20% of total building heat losses (10% for slab on ground buildings). The majority of the floor slab-on-grade heat losses (about 80%) occur at the edges (perimeter) of the slab [4]. In 2021, the most popular dwellings in South Africa (69.7%) were in the form of either a house or brick/concrete block structure located on a separate stand or farm [5]. Dwellings from traditional materials accounted for 4.2% of the total dwellings, while flats or apartment accounted for only 3.6% of the total dwellings. According to the most recent South African energy survey report in 2018, the average household size was 4.6, and the average number of bedrooms was 2.9 [6]. Therefore a three-bedroomed masonry unit appears to be the most common type of dwelling used in South Africa.
The use of the right technique and type of insulation material for residential building floors (slab-on-grade) may significantly reduce heat losses and therefore contribute to reducing both national and global building energy consumption.
This paper uses lifecycle cost analysis (LCA) and EnergyPlus simulations to comparatively evaluate the relative benefits of adding floor slab insulation materials such as XPS and PIR (polyiso) in residential building floor slabs with respect to each of the seven SANS10400-XA energy zones in South Africa. The insulation materials are applied at different levels of thickness and depths or widths from the slab edge, which influences the increase in embodied energy due to the application of the floor insulation. The increase in embodied energy is then compared to the realized benefits in the form of savings in operational energy to evaluate the payback periods and net energy savings after 50 years. A three-bedroomed clay brick cavity wall envelope house (with a minimum of 50 mm air gap) was used as the basis of the analysis subject to the SANS10400-XA building energy efficiency criteria.
This paper adds value to previous research by providing detailed insight into the energy zones that benefit most from the floor slab insulation methods and the optimum insulation thicknesses that would maximize the net energy savings based on the new SANS10400-XA building energy efficiency regulations. For non-South African readers, the paper also discusses the influence of relative humidity and degree days (cooling and heating degree days) on the net energy savings that are accrued due to the application of the floor slab insulation measures. This would directly contribute towards the goal of implementing net-zero energy-efficient buildings. However, the thermal conductivity of materials varies with changes in temperature and moisture content. Therefore, there are limitations to the results of this study because point estimates of thermal conductivity for the floor insulation materials were used [7].
This paper is divided into five sections. The remainder of this section reviews previous studies and other relevant literature on the subject. Section 2 deals with the methodology we used. Section 3 presents the analyzed results. In Section 4, the results are discussed. In Section 5, a summary of the main conclusions that could be derived from this study is presented.

1.2. Literature Review

1.2.1. Factors That Influence Heat Losses from Ground Floors

Several factors influence ground temperature. These include soil volumetric heat capacity, thermal conductivity, latent heat, changes in ambient temperature, and the characteristics of the ground surface, such as vegetation and slope [8]. The amplitude of daily average solar radiation flux (amount of solar power radiated through a given area in the form of photons or other particles) affects the total amount of heat transferred between the environment and the sub-soil where the building is located [9]. The temperature of the ground surface is affected by several factors, including energy loss by evaporation, heat transfer between the ground surface and deeper layers, convection, and radiation both in the immediate and farther surroundings. However, the temperature of the ground at any given point (on surface or beneath) depends also on the depth of the point beneath the ground surface, which yields surface temperatures (for points on or immediately beneath the surface), sub-surface temperatures (for points beneath the surface but in the shallow zone), and deep surface temperatures (for points beneath the surface but in the deep zone) [8]. Research by the authors of [10] shows that the factors influencing temperatures for surface, sub-surface, and deep surface zones significantly differ. For example, points near the surface have their temperatures predominantly influenced by daily changes in the surface ground temperature, which in turn is influenced by weather conditions, including wind and rain. However, sub-surface (shallow zone) points have their temperature predominantly influenced by seasonal variations and closely correspond to the average annual air temperature in the vicinity. On the other hand, regarding deep zone points, their temperatures are constant but also very slowly increase with depth beneath the ground, with the rate of the temperature increase with depth being dependent upon the local geothermal gradient. The geothermal gradient is the amount, at any place, that the earth’s temperature increases with depth. The geothermal gradient varies with location, as indicated by the authors of [11]. The geothermal gradient is high in places like Cape Town (Western Cape), Cradock (Eastern Cape), and Mbabane (Swaziland).
For single-family residential buildings (characterized by shallow foundations less than 1 m deep), the area of heat losses though the floor slab mainly consists of the central floor zone (which is not influenced by changes in external temperatures) and the external zone along the perimeter or area around the external walls, which has a width of about 0.75 m and in which heat loss fluctuations are severely influenced by fluctuations in external temperatures [8]. At these perimeter or near-perimeter areas, it is necessary to minimize heat losses in places where the vertical wall envelope meets the floor. Vertical perimeter insulation and a combination of vertical (along the slab edge) and horizontal (immediately beneath the slab) insulation methods along the slab edges serve to address these kinds of heat losses.
Ground interaction models: Several models have been developed to characterize the ground interaction of building energy models. In their study, the authors of [12] exhaustively monitored a real building and measured the ground and ground floor surface temperatures in order to determine the EnergyPlus components which characterized the ground–slab interaction as best as possible, both in terms of the simplicity of modeling and the costs. The dynamic ground temperature model (DGTM), which involved real-life measurements, was the best representative of reality. However, the ATZ or “Average TZ-15 °C” method (which only required the interior temperatures of thermal zones) and the “Static utility slab” modeling method (which only required the EnergyPlus slab auxiliary program) were both more cost-effective than the dynamic ground temperature model (DGTM). The Static utility modeling method (SUSM) was more straightforward to apply, and its results were found to be similar to those of the DGTM, with a coefficient of variation of root mean square error for the simulated and measured temperature CV (RMSE) of 1.61% (the ATZ method had CV (RMSE) of 1.62%). However, EnergyPlus versions 8.0 and above have an inbuilt C++ multi-dimensional finite element calculation routine based on an open-source software called Kiva, which calculates the convective heat gains and surface temperatures for the floor and wall surfaces [13]. The inputs required by Kiva to model the ground interaction of the building model include weather data, solar position, zone temperature, and zone radiation. Kiva’s accuracy has been compared using BESTEST against ground-coupled cases and found to be within accuracies of 3% [13]. Research by the authors of [12] reported that Kiva results had CV (RMSE) values of 1.58%, 1.82%, 1.90%, and 2.03% depending upon the conditions. The corresponding mean bias errors between the simulated and actual measured values were −0.36%, −0.81%, −0.92%, and −1.08%. The acceptable calibration tolerances for these two statistical indices, according to the authors of [14], are +/−10% for MBE and +/−30% for CV (RMSE). Using EnergyPlus weather files without using Kiva (thus relying on undisturbed ground temperatures) would yield CV (RMSE) values of 10.64%, 12.12%, and 12.75% at ground depths of 0.5 m, 2.0 m, and 4.0 m, respectively, with corresponding MBE values of 2.21, 2.64, and 2.79 [12].

1.2.2. Factors That Influence Savings in Embodied and Operational Energy Due to the Application of Floor Slab Insulation Measures

The increments in embodied energy due to the application of floor slab insulation measures are influenced by several factors. An increase in embodied energy due to the application of floor slab insulation may be followed by a larger or smaller reduction or increase in operational energy at the operational phase, and vice versa. Some major factors are discussed below.
Analysis period and system boundaries: The LCA analysis period influences the amount of computed embodied quantities. It is important to ensure that the analysis period is constant when making relative comparisons. This period may determine the number of replacements of any particular material based on its useful life relative to the analysis period. Most studies recommend an LCA analysis period of 50 years [15]. In addition, the system boundaries also influence the embodied quantity computations and must be kept constant when making relative comparisons. Figure 1 shows that it is possible to have system boundaries of 1 up to 5 (S.B.1 to S.B.5), and these system boundaries involve production (A1–A3), construction (A4–A5), use (B1–B7), and end of life (C1–C4). The boundaries may be extended to include benefits beyond end of life (such as recycling benefits: D1–D4). Several studies indicate that the building operational phase (B6 and B7) tends to account for 38% to 49% of total energy depending on the building technology used and other factors [15,16,17]. This means the embodied energy may range from 51% to 62%.
This study will be based on system boundaries A1–C4. For stages B3–B5, only the replacement (B4) process will be modeled under the use stage.
Building typology: The building typology can influence the embodied energy. Building facades have differing thermal and solar performance (depending on the materials used; the front, left, right, and back window-to-wall ratios; and the materials used in the windows), thus significantly influencing operational energy. Glass material has a high embodied carbon content, only second to aluminum; however, the embodied energy of aluminum (211 MJ/Kg) is more than seven times that of glass, which is 28.5 MJ/Kg [19]. On the other hand, the embodied energy of steel (0.0227 MJ/Kg) is less than ten times that of glass. According to the authors of [20], the embodied carbon per m2 (and therefore embodied energy per m2) significantly varies based on building typology (commercial office, commercial mixed use, commercial other, residential multi-family, and residential single family). Elongated building forms tend to be more suitable than compact ones in central Europe in regard to minimizing energy consumption for heating and cooling because they allow for larger window areas (larger window-to-wall ratios) during winter and thus more efficient solar energy harvesting. However, proper shading needed to be applied during the summer cooling season [21]. Therefore, a proper study of the pure effect of floor slab insulation should preferably be made using similar building typologies, unless the study aims to understand the influence of differences in typology.
Floor area and method of applying floor slab insulation: Closely related to typology is the square floor area of the building. A larger floor area will yield larger incremental embodied energy and emissions due to insulation measure application (unless the insulation material sequestrates carbon). Similarly, the embodied energy and emissions increments will be higher for a larger floor area when the floor slab insulation thickness or insulation depth is increased. However, any gains in terms of energy savings due to greater efficiency are not necessarily directly dependent on floor area; instead, more importantly, they can be dependent on building form, as observed by the authors of [21]. The insulation method will also influence the incremental embodied energy and emissions based on the standard formula for the computation of areas, volume, mass, and, eventually, the embodied energy and emissions. However, different insulation methods may have differing effects on operational energy, operational emissions, and their corresponding net saved quantities per m2 of floor area across the different energy zones or locations. Gap vertical insulation and external vertical insulation tend to be laid around the perimeter of the floor at selected insulation levels. Their depth going vertically downwards is also variable. While gap insulation is inserted between the slab and the foundation wall, exterior vertical insulation is inserted on the exterior side of the foundation wall. The factors influencing temperatures at different ground depths (near surface, sub-surface or shallow surface, and deep surface) differ from one another. The rates of temperature change with depth (geothermal gradient) are influenced by the ground depth [8]. They are also influenced by the location [11]. In the case of horizontal floor slab insulation, insights into its effects on energy savings for residential buildings can be derived from the research by the authors of [8], who showed that the central floor zone of the floor slab is hardly affected by changes in external temperatures, unlike an external wall perimeter-based zone of about 0.75 m width.
The authors of [22] aimed to investigate the practicalities and effectiveness of using concrete floor slab perimeter insulation in residential houses in New Zealand. The results showed that the R-Values of the floor slab increased with the area-to-perimeter ratios for the floor when using any of the insulation techniques. Square floor-shaped buildings have greater area-to-perimeter ratios, and therefore better thermal performance from a floor slab insulation perspective. However, from a building envelope wall perspective, the research work performed by the authors of [21] shows that elongated building forms (lower area-to-perimeter ratios) were more suitable than compact ones in minimizing energy consumption for heating and cooling (for example, by allowing for better cross ventilation). This apparent conflict in the effect of area-to-perimeter ratios requires balancing based on evaluating if the relative energy saving benefits due to cross ventilation (with an elongated building) are greater than those due to floor insulation (with an almost square floor-shaped building). Ideally, horizontal perimeter insulation (with vertical slab edge gap insulation) performed best and was followed by vertical gap perimeter insulation. The results of the study also showed that at a given level of insulation thickness (for any insulation method involving gap vertical insulation), the R-Values increased with floor area. For the same floor area, the R-Values generally increased with insulation thickness (the maximum thickness was 100 mm).
The ratios of the R-Value of the insulated floor slab to the R-value of the uninsulated floor slab as the floor insulation depth increased were higher for smaller floor areas (50 m2) compared to higher floor areas (200 m2). However, for a given floor area, these R-Values increased with insulation depth, but the rate of increase decreased with depth [22].
Local climatic conditions where the building is located: The local climatic conditions also influence the degree of increments or decrements in embodied and operational energy and emissions due to the application of insulation measures. For example, the region in Japan with the highest cooling degree days and lowest heating degree days (hottest climatic zone) did not experience any tangible benefits of using insulation [23]. It was also observed in South America that the use of insulation in hot climates tended to increase (rather than reduce) the thermal load, reducing the possibility of any energy savings [24]. Therefore, while some locations in these two studies experienced reductions in energy consumption due to the application of insulation measures, other locations never benefited. The South African climatic zone map classification in Figure A2, which was generated based on weather patterns, was replaced by the energy zone map in Figure A1, which is based on heating and cooling demand [25], taking into consideration the applicable Köppen–Geiger classifications [26]. Figure A1 (in Appendix A) illustrates the spatial extent of each energy zone (instead of climatic zones) in South Africa based on heating and cooling energy demand. Zone5H is a subset of zone 5 but with high humidity (greater than 80%). Accounting for these high humidity levels makes zone 5H a medium cooling zone rather than the normally expected high cooling zone 5. This map offers support for adaptive building designs for climates with significant diurnal or yearly temperature variations. The energy zone map was created based on standard effective temperatures (SETs), interpreted degree days, and the A2 climate change scenario from the Special Report on Emission Scenarios (SRES) spanning a period from 1961 to 2100 [27].
The accuracy and reliability of the weather files used: There are several sources of the weather data files used in building energy simulations. Typical meteorological year (TMY) files can be obtained from several sites, including [28,29,30]. The authors of [31], in a study conducted in New York and Buffalo, USA, compared various weather file formats (TMY3 (1991–2005), TMY4 (2004–2018), FTMY (3025,2055,2075), XMY [min and max]) from several sources against corresponding TMY3 weather files (as a baseline) to assess their relative accuracy and reliability using the resulting differences in computed site energy use intensities (EUIs). The tests were based on passive strategy analysis using software such as Climate Consultant [32] and building energy modeling (using EnergyPlus). The TMY4 or TMYx (2004–2018) file type from [28] yielded differences in EUIs that were among the lowest (−1% for New York and −3% for Buffalo) relative to the TMY3 file type. The advantage with Climate.OneBuilding.Org weather file data is that these data are also available for many locations in South Africa. Resilient Buildings data [29], which have lower absolute EUI differences, are not available for many South African locations. This study recommended the use of TMYx or TMY4 files for codes and standards analyses, measuring utility incentives, the optimization of energy efficiency measures (EEMs), and weather normalization for measured data. On the other hand, the authors of [31], reported that future typical meteorological year (FTMY) weather files (which are created by morphing data) cannot produce psychometrically correct weather since the atmosphere is highly non-linear, and any linear transformations applied to variables will never maintain the non-linear relationships. Since the current study aimed to evaluate the impact of floor slab insulation building measures on residential building energy consumption, we felt it was appropriate to use TMYx (TMY4) files and their corresponding EnergyPlus weather derivatives (EPWs), as recommended by the authors of [31]. Assessing the impacts of building energy efficiency measures involves the evaluation of differences in energy consumption between two models which differ only in the measure being applied. Therefore, any errors due to the weather files used tend to be neutralized.
National energy efficiency standards: The South African national building energy efficiency standards (SANS10400-XA) will also impact upon the computed embodied and operational carbon and emissions and their increments when there are changes in floor slab insulation thickness and depth. Generally, the national energy efficiency standards affect the extent and proper way of applying building measures. For residential buildings with a floor area greater than or equal to 80 m2, the SANS10400-XA regulations stipulate the minimum standards for wall envelopes to be either cavity walls (with a minimum air gap of 50 mm) or collar joint walls, depending on the energy zone or location [33]. Cavity walls have superior thermal insulating properties compared to single-leaf wall envelopes. Therefore, the net and incremental net energy savings per m2 of net floor area for residential buildings less than 80 m2 may be quite different than similar buildings that are greater or equal to 80 m2 in floor space. The relative impact of the cavity wall envelope design will also vary depending upon the energy zone or location.
The SANS10400-XA regulations also stipulate the minimum shading constants that should be applied, which are latitude-dependent. The net and increments of net energy savings per m2 of net floor area for residential buildings will also vary significantly based upon the shading constants selected. Utilizing a shading constant which is SANS10400-XA compliant for all locations under consideration may not necessarily maximize energy savings for each of the locations. It is therefore important to use location-specific shading constants that maximize the net energy savings per m2 of net floor area for each location.
The SANS10400-XA regulations also recommend the preferable orientation of buildings for energy efficiency purposes. The front wall orientations should preferably be in the north direction in all the energy zones, except for zone 5H, which is flexible [33]. While orientation will not affect the embodied energy and emissions, it will affect the operational energy, operational emissions, their corresponding net saved quantities, and possibly the patterns of increments in net saved quantities that arise due to variations in floor slab insulation thicknesses and depths or widths.
The building orientation, shading, and wall envelope construction standards are just some examples of how the regulations impact on the building measures. Other measure controls include the occupancy schedules, acceptable indoor thermal comfort temperature ranges (19–25 °C), and minimum R- (thermal resistance) and CR-Values (multiple of thermal resistance and thermal capacitance) for walls, roofs, and floors, as outlined in the [33] regulations. The minimum R- and CR-Values will directly affect the minimum thicknesses of the building technology materials used for the walls, roofs, and floors. The thickness will depend on the properties of the building technology material. The thickness will in turn have an impact upon the embodied energy, embodied emissions, and their corresponding operational quantities (by influencing the R-Values). According to [34], the embodied carbon contribution among non-residential buildings by steel ranged from 241 to 354 Kg CO2/m2, while reinforced concrete ranged from 332 to 433 Kg CO2/m2. On the other hand, the contribution by wood (including residential buildings) was 108–288 Kg CO2/m2. If, therefore, the goal of one’s research is to investigate the impact of floor insulation measures on the energy consumption and CO2 emissions of residential buildings, then the rest of the measures must always be maintained within acceptable SANS10400-XA limits (as constants or variables) while the insulation measures are applied incrementally.
Energy and CO2 emissions coefficient database accuracy: The embodied emissions and energy coefficients used can influence the quality of the energy and emissions lifecycle computations. Therefore, the accuracy of the database from which the coefficients are derived is very important, even more so when increments in such embodied quantities will be compared against increments or decrements in operational energy and emissions. The operational energy and emissions are derived not based on an energy and emissions coefficient database but by using the local country’s energy mix proportions. Various databases, such as the inventory of carbon and energy (ICE) database, are available worldwide and can be used to compute relative energy consumption and emissions in South Africa [35].
Other factors: Other factors which may affect the embodied and operational energy and emissions but whose effects can be controlled during the study by keeping them constant include the computational method for embodied quantities and the major building components for which the quantities are evaluated. The two (2) computational methods usually used are the input–output method and the LCA method [17,36]. The outputs for these methods may differ significantly. It is best to stick to only one of these methods throughout the study, unless the aim of the study is to make relative comparisons between the computational methods.
Regarding the influence of building components on the computation of embodied quantities, previous studies have generally shown that the sub-structures of residential buildings generally account for 22–45% of embodied emissions and 18–37% of the embodied energy [15,34]. However, since this research required the whole building as a basis for the energy model, the entire building unit will be used consistently throughout the study rather than its major sub-components.

1.2.3. The Floor Slab Insulation Materials

The floor slab insulation materials which were used included polyisocyanurate (also referred to as polyiso or PIR) and extruded polystyrene (XPS).
Polyiso (PIR): Like polyurethane, polyiso is a thermosetting plastic that consists of a closed-cell foam structure which contains a low-conductivity, hydrochlorofluorocarbon-free gas in its cells [37]. Polysio tends to suffer from thermal drift, which leads to its R-value dropping, especially in the first two years of its application. However, the use of plastic facings or foil can help to slow the thermal drift process. It contains recycled materials, is eco-friendly, is a good vapor barrier, and contains a less toxic flame retardant. It has a higher flammability performance compared to polyurethane but is low cost (although it is more costly than XPS or EPS) and has outstanding thermal insulation properties due to the thermal resistance of the gases in its cells. The use of agricultural waste additives in polysio has great potential for providing new polysio composites with better properties [38].
Extruded polystyrene (XPS): Polystyrene is a colorless, transparent thermoplastic that is commonly used to make foam board or beadboard insulation, concrete block insulation, and loose-fill insulation consisting of small beads of polystyrene [37]. The material is recyclable, according to studies in the literature [39,40]. Polystyrene can be installed as loose fill, as foam board, or as bead insulation. Extruded polystyrene (XPS) is installed usually as foam board, while expanded polystyrene (EPS) is installed as bead insulation [37]. XPS is not as environmentally friendly as polysio [41]. It uses Hydrofluoro carbons during its production, which deplete the ozone layer. However, both EPS and XPS generally insulate at the same level for the same layer thickness. XPS is more resistant to moisture compared to EPS.

2. Materials and Methods

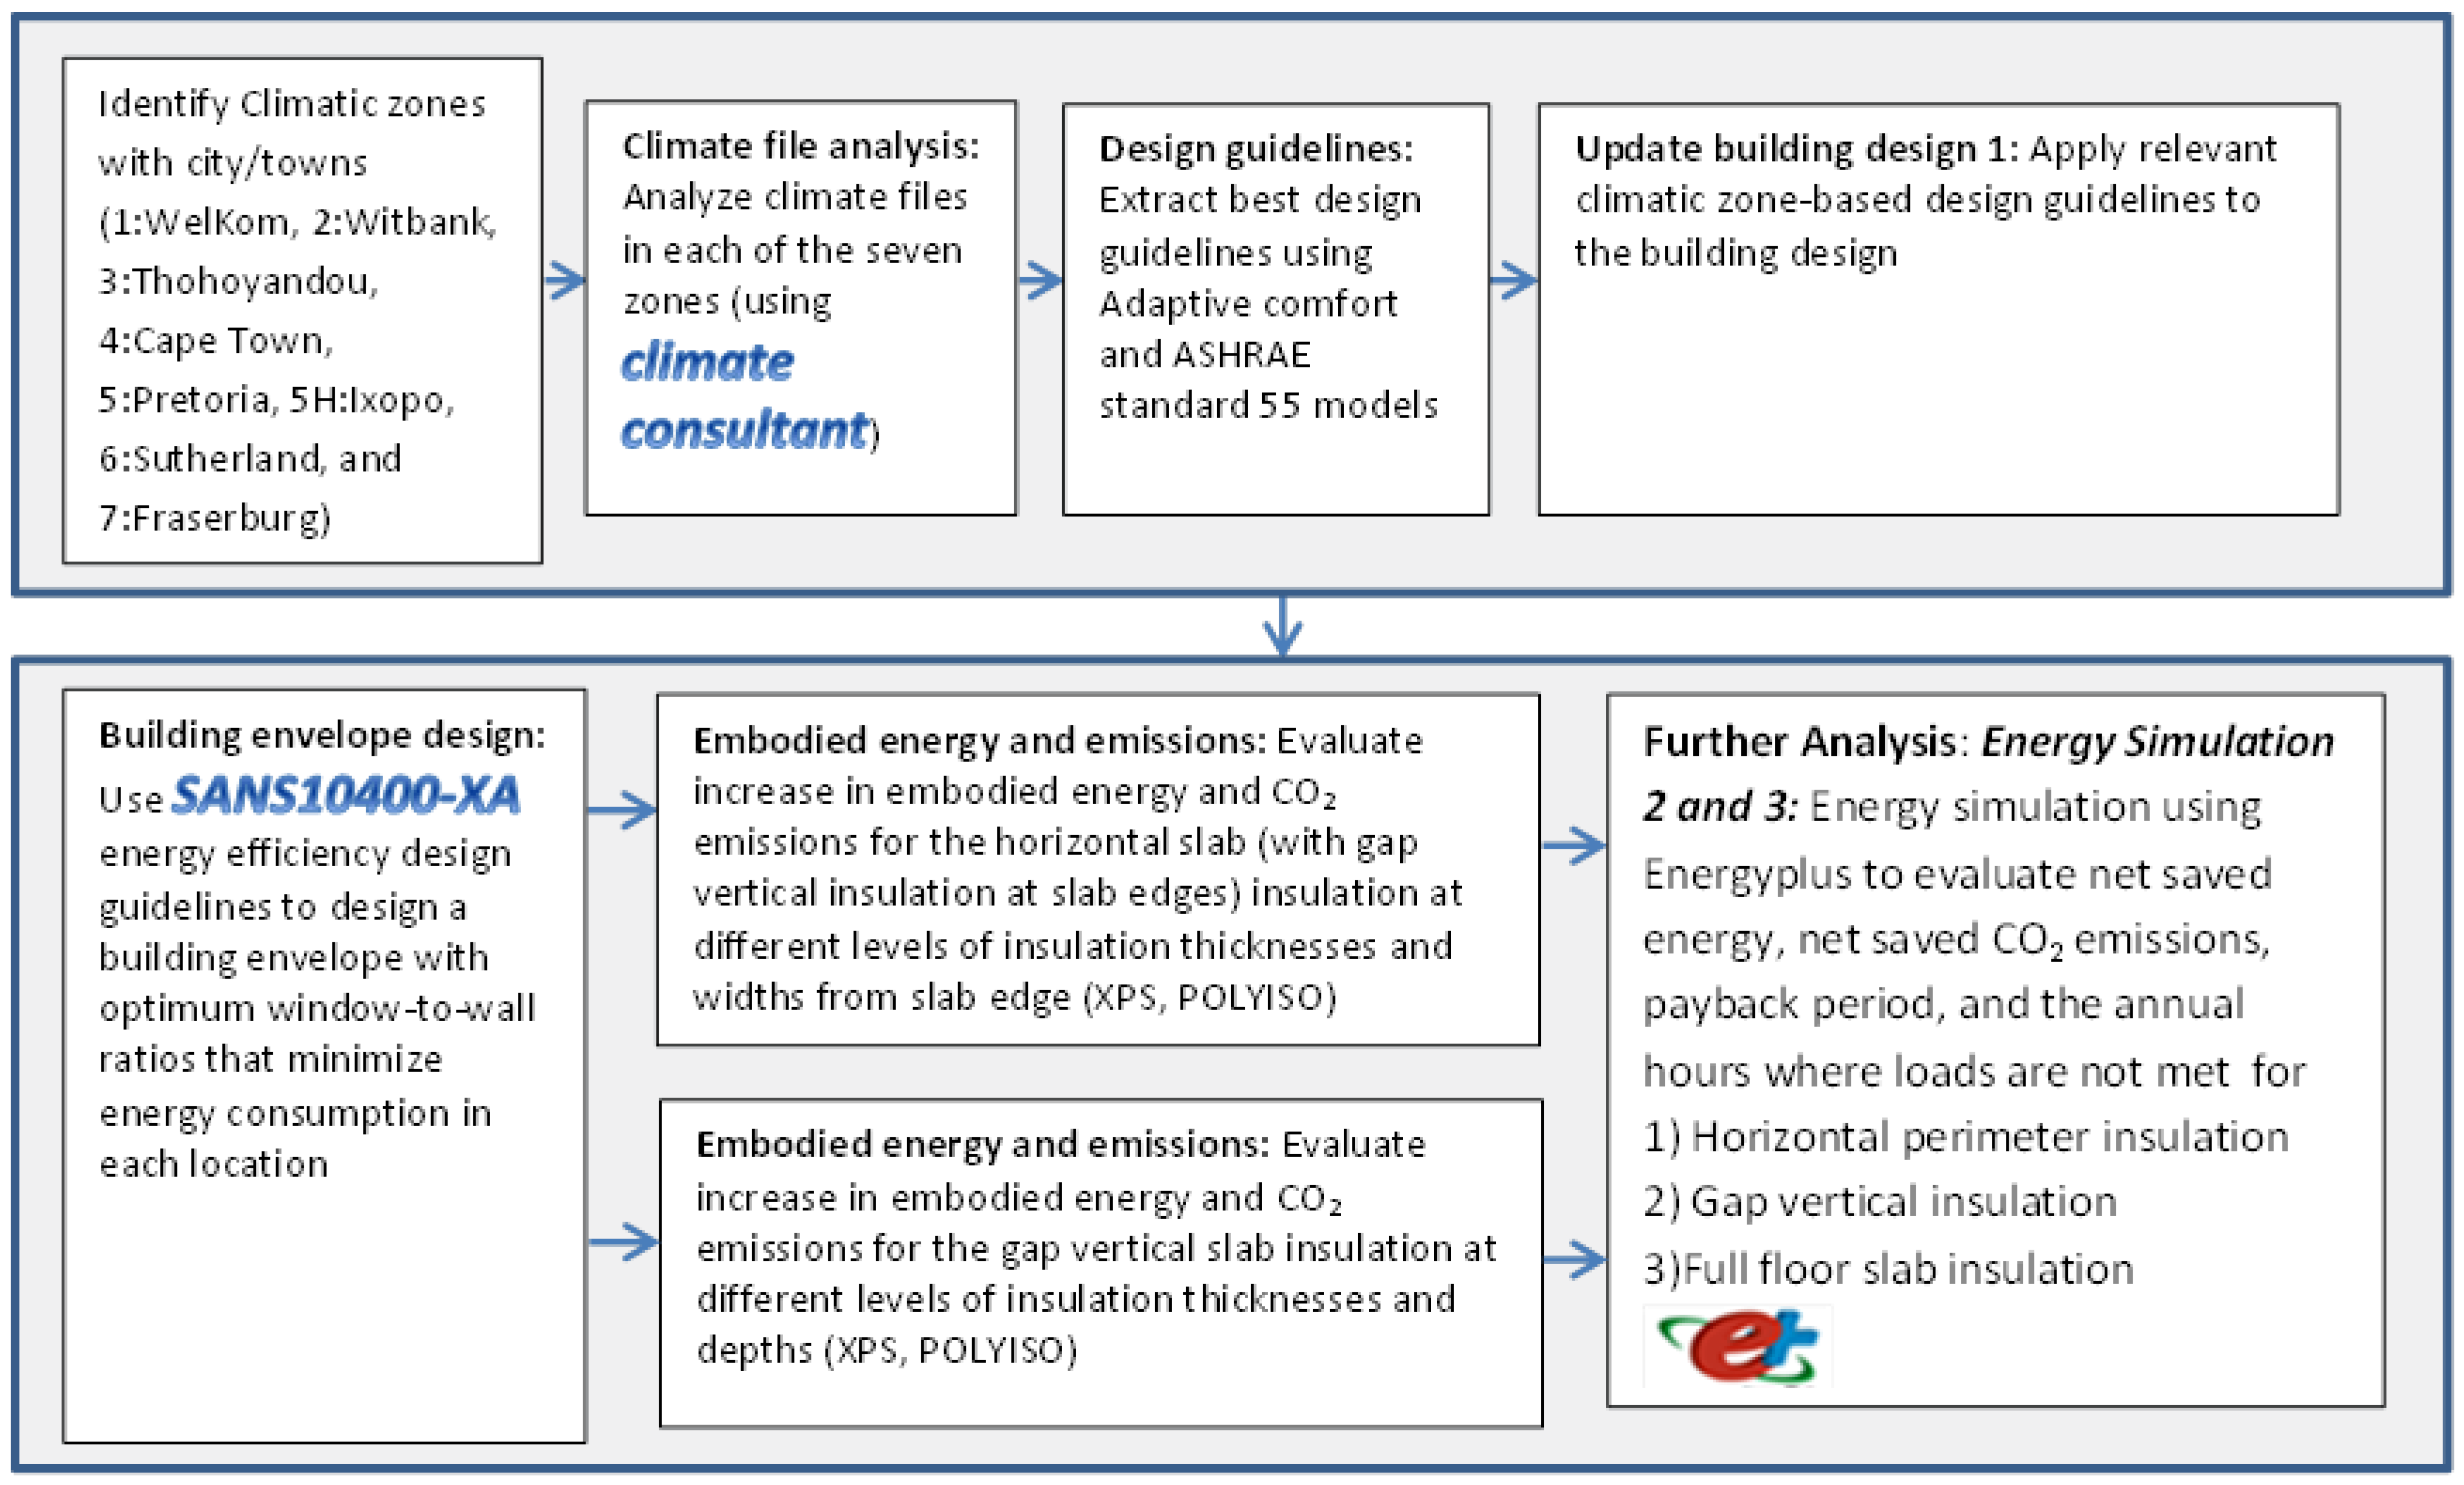
2.1. Overview of the Methodology Used

Figure 2 briefly summarizes the methodology that we followed to conduct our research.
The methodology consisted of first using Climate Consultant [32] and weather data to obtain the best building design strategies for each of the climatic zones in South Africa based on the adaptive comfort model and ASHRAE 55 model. The nature of the design will affect the computed embodied energy and emissions. Therefore, the energy efficiency standards and passive design strategies were used as a standard against which the design would be based. The second stage involved obtaining the optimum window-to-wall ratios (WWRs) through considering the performance of relative energy simulations, regression modeling, and optimization based on the evolutionary algorithm. The WWRs will affect the net wall area (excluding the window area and door area) and hence the embodied carbon emissions and energy of the walls. On the other hand, WWRs contribute greatly to passive strategies of achieving thermal comfort, leading to operational energy savings. The third step involved updating the building design using the optimum WWRs and SANS10400 energy efficiency guidelines, the computation of the increase in embodied energy (due to the application of floor slab insulation), and assessing the performance of energy simulations to evaluate the annual energy savings that arise due to the use of the insulation materials. The payback periods and net energy savings for a 50-year period were evaluated.

2.2. Data

Part of the data used consisted of weather file data from Climate.OneBuilding.Org site [28] and secondary data from energy and emissions coefficient databases such as the ICE database [35]. The other data were directly generated from the design specifications and material quantities corresponding to the building design and materials used. The material quantities were influenced by the SANS10400 energy efficiency guidelines [33], the net floor area, and the wall heights.

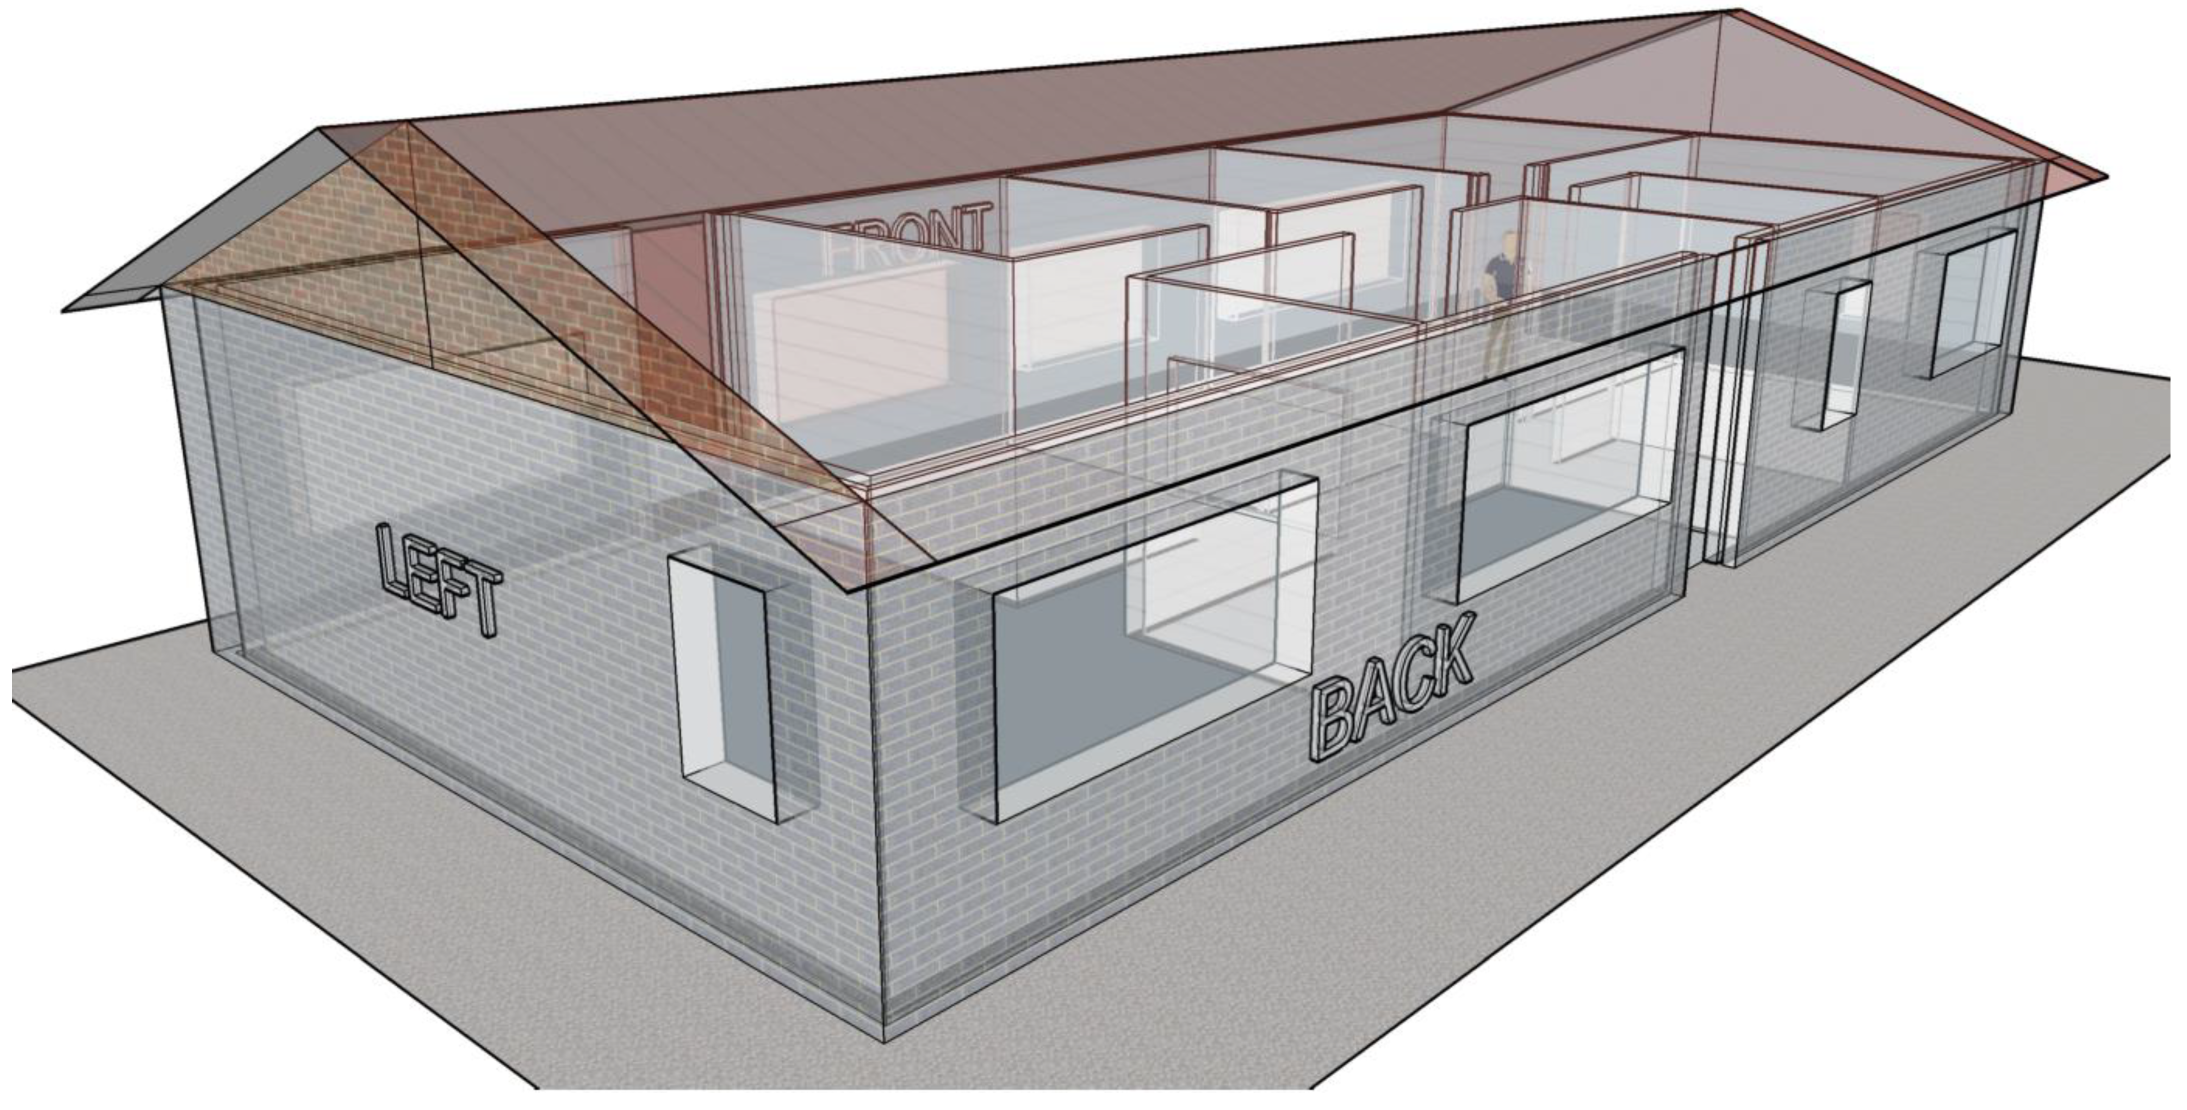
2.3. Architectural Design and Bills of Material

Climate Consultant [32] was used to obtain some of the basic energy efficiency, thermally comfortable design recommendations for the 105.4 m2 net floor area design of the residential unit.
Some of the quantities computed for the wall envelope to ensure compliance included the thermal resistance (R-Value), thermal capacitance, and the CR-Value. The CR-Value of the wall is the product of thermal resistance and thermal capacitance [33]. Wall assembly materials and their levels of thickness affect the R- and CR-Values of the assembly based on their properties. The guidelines for the methodology of computing the R, CR, fenestration-specific heat gain coefficients, and U-Values are outlined in the SANS10400-XA document. Bills of materials for the walls were generated from the building designs with the help of Microsoft Excel. The ICE database was used as a basis for the embodied energy computations. Its coefficients corresponded to system boundaries A1–A3. Missing coefficients were obtained from available environmental product declarations (EPDs). Emissions based on later system boundaries were obtained through further mathematical modeling. Figure 3 illustrates the single-story model. The model’s roof has not been included in order to expose the details of the internal wall partition (for the embodied energy computations).
The window-to-wall ratios were carefully selected to ensure the energy efficiency of the model in its passive form. Further design guidelines that influenced the model design (ascertained using the results from Climate Consultant) are discussed later in this paper.

2.3.1. Properties of the Building Materials

The relevant properties of the materials were obtained from the ICE database [42,43]. The properties were thermal conductivity, specific heat, density, embodied carbon coefficients, and embodied energy coefficients.

2.3.2. South African Energy Efficiency Standards for Wall Envelopes and the Surface Density

The South African National Standard on energy efficiency of buildings [33] recommends buildings in all seven energy zones (except zone 5H) to face northwards. Most of the window area should be in the north-facing and south-facing walls, in that order. Buildings that have greater length than width therefore allow for more cross ventilation as a form of passive cooling during summer.
Walls: Buildings with a floor area less than or equal to 80 m2 are classified as “category 1” buildings, according to [33]. The minimum masonry wall requirements of “category 1” buildings are a single-leaf masonry wall of a minimum thickness of 140 mm. When the floor area is greater than 80 m2 (non-category 1 buildings), the masonry wall system must either be a collar joint (energy zones 3, 5, and 5H) or a cavity wall with a minimum air gap thickness of 50 mm (energy zones 1, 2, 4, 6, and 7). Based on the South African energy efficiency standards, the floor area can affect the nature of wall construction, which in turn affects the embodied carbon and energy footprint (by influencing the thicknesses of the walls) and the annual operational carbon and energy footprint of a building (by influencing the minimum R-Values of the walls).
According to the energy efficiency standards in South Africa, the minimum nominal R-Value for the collar joint wall assembly is 0.4 m2·K/W if the surface density is greater than or equal to 270 Kg/m2. The minimum nominal R-Value for a cavity wall is 0.6 m2·K/W if the surface density is greater than or equal to 270 Kg/m2. If the surface density is less than 270 Kg/m2, then the minimum R-Value for both the collar joint and cavity walls in energy zones 1, 2, 6, and 7 is 2.2 m2·K/W; the minimum R-value in energy zones 3, 4, 5, and 5H is 1.9 m2·K/W [33]. Therefore, the energy efficiency standards influence the nature of wall construction, the minimum R-Values, and, hence, the minimum energy and carbon footprints of buildings per m2 of net floor area based on the energy zones in South Africa. Similarly, the minimum CR-Values would need to be 80 or 100 h, depending on the energy zone where the analysis is being carried out.
Shading constants: The SANS10400-XA standard specifies the minimum shading constants to use, which are dependent upon the latitude of the location. The values are 0.33 for latitudes less than or equal to 22 degrees, 0.36 for latitudes above 22 degrees and up to 24 degrees, 0.40 for latitudes above 24 degrees and up to 26 degrees, 0.42 for latitudes above 26 degrees and up to 28 degrees, 0.46 for latitudes above 28 degrees and up to 30 degrees, 0.50 for latitudes above 30 degrees and up to 32 degrees, and 0.54 for latitudes above 32 degrees [33]. The minimum length by which the shading device extends beyond the window width on either side is equal to the shading depth, according to the SANS10400-XA standards. The shading depths were evaluated by multiplying the relevant shading constant by the vertical distance between the base of the glazing element and the shadow-creating edge of the window overhang.

2.3.3. Optimum Window-to-Wall Ratios

Since front, back, left, and right window-to-wall ratios affect both the embodied carbon emissions and operational energy (and hence operational carbon emissions), we used separate energy simulations, regression methods with F tests, and evolutionary algorithm optimization techniques to derive optimum window-to-wall ratios that minimized operational energy consumption (subject to [33] standards) and the Climate Consultant analysis results. The F and T tests were passed, and the R square values indicated that the window-to-wall ratios in each of the 4 directions (left, right, front, and back) served to explain at least 90% of the variation in energy consumption. The analysis was carried out with respect to each zone. Although the detailed results of the analysis are not presented in this study, the final window-to wall ratios that were obtained were used by the research team.

2.3.4. Optimum Floor Slab Insulation Thickness, Insulation Depth, and Insulation Width

According to SANS10400-XA regulations, the minimum required R-Value for non-heated floors is 0.0 W/m2·K, and for heated floors, the minimum required R-Value is 1.0 W/m2·K. The floor in the model was considered to be non-heated. However, insulating floors may still improve upon the energy efficiency of the building. There are several techniques for insulating floor slabs. The first is vertical gap insulation, which involves inserting insulation between the floor slab and the foundation wall and then extending it vertically downwards to varying levels of depths. The second (called horizontal perimeter insulation) involves vertical gap insulation around the edges of the floor slab (between floor slab and foundation wall) and partial horizontal insulation around the perimeter of the slab at varying insulation widths. The third (called horizontal full floor slab insulation) involves the full horizontal insulation of the entire slab area (beneath the slab), with gap insulation still being applied at the slab edges. This study deals with all three of these insulation techniques. As a result, the insulation thickness and insulation depth (or widths), as a basis for our analysis, were of concern. Extruded polystyrene (XPS) and Polyisocyanurate (also referred to as PIR or polyiso) insulations were used for the analysis. We employed a 100 mm thick concrete floor slab and various levels of insulation thickness (25 mm, 50 mm, 100 mm, 150 mm, 200 mm) and insulation depths or widths (200, 400, 600, 800, 1000, 1200, 1400, 1600, 1800, 2000 mm) for all the energy zones. The minimum R-Values, where applicable, had to be met before any energy simulations or embodied energy computations were performed [33]. An evaluation of how the energy payback periods and net saved energy after 50 years both vary with the floor slab insulation material thickness and depth was then carried out. We also evaluated the optimum insulation material depth and thicknesses that maximized net energy savings per m2 floor area in each energy zone. In order to improve the results of the ground interaction with the building energy model, a later version of EnergyPlus with the Kiva finite difference heat transfer calculator was used [44,45].

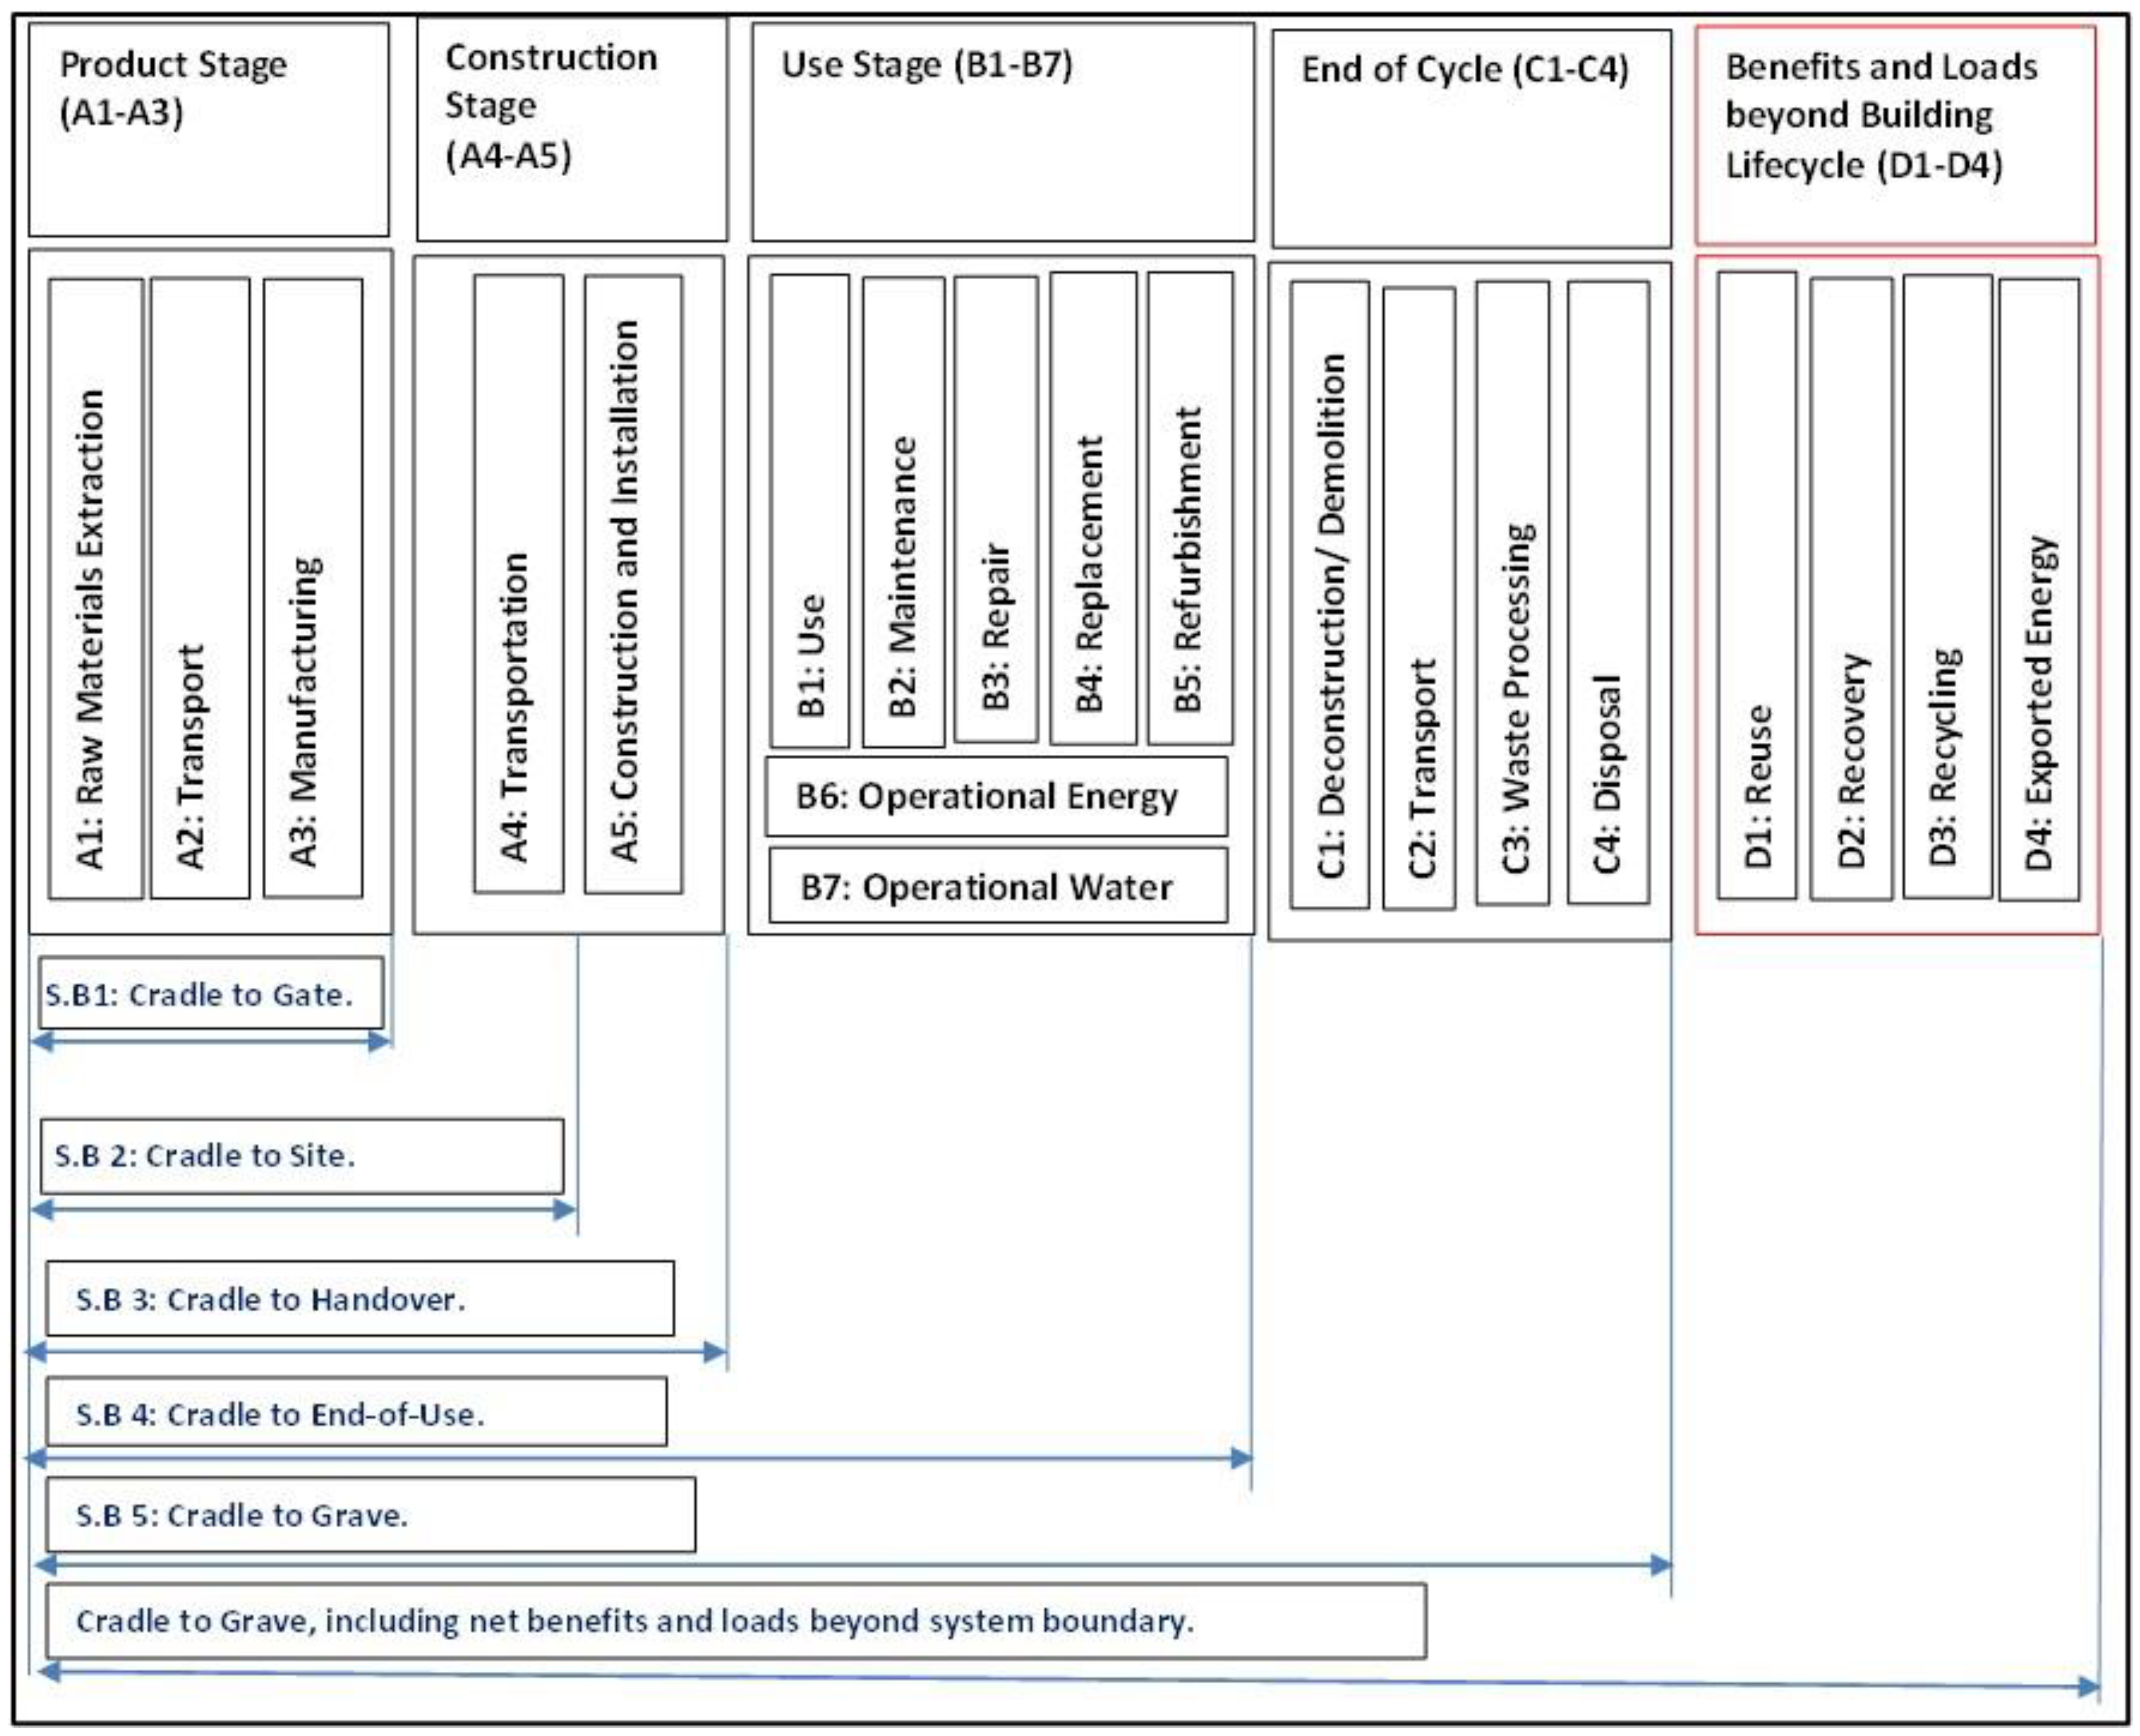
2.4. Estimation of IBT Embodied Energy and Emissions

Equation (1) was used to estimate the embodied energy of the building models.
T = i = 1 k C k g i q b i + n i · q b i 1 + w + f k E k g · q b i Q b i { 2 d b i 1 + n i + 60 · v + ( 2 d w i ( 1 + w + w · n i ) + v ) }  
Equation (1) shows the estimated embodied energy for a residential building consisting of k building materials. While the emissions and energy coefficients correspond to the cradle-to gate (A1–A3) system boundaries, Equation (1) illustrates their use for the evaluation of cradle-to-grave (A1–C4, excluding B3, B5, B6, and B7) embodied energy. However, stage B6 was later used during energy modeling.
The term (i) represents the ith building material (the maximum value is k).
The term (ni) refers to the number of times any building material (i) will be replaced during the maintenance process in the analysis period.
The term Ckgi refers to the cradle-to-gate embodied energy coefficient of the building material (i). The unit is Kg CO2e/Kg.
The quantity qbi refers to the initial quantity of the building material (i) that was used in constructing the building. The unit is kilograms (Kg).
The term w is a percentage expressing the amount of material wasted.
The term fk represents the fuel in kilograms (Kg) that is burnt per kilometer. This term varies depending on the type of vehicle used to transport the materials and the fuel type used by the vehicle (petrol, diesel, electric vehicle, and others).
The term Ekg represents the energy produced by this fuel in KWh per Kg of fuel.
The term dbi is the average distance (in kilometers or Km) from the factory gate to the building site for this material.
The term dwi is the average distance (in kilometers or Km) from the building site to the dumping site for this material.
The term T is the total embodied energy (KWh) for the building.
The term “v” is the rate of energy consumption per m2 of net floor area being deconstructed or demolished. The unit is KWh/m2.
The term Qbi refers to the maximum legal weight (in Kg) that can be carried by the vehicle which will be used to transport the building materials to the site of to the landfill [46].
The embodied energy resulting from the use of the floor slab insulation material at a certain level of thickness would then be the difference between the embodied energy of the building when the floor slab insulation was applied and embodied energy of the building when the floor slab insulation was not applied.

2.5. Cradle-to-Gate Approximate Embodied Quantities Due to Insulation Measures

2.5.1. Vertical Gap Insulation Only

The cradle-to-gate embodied energy resulting from the floor slab insulation measure is given by Equation (2).
E E i n s = { ( L f s + 2 T i n s ) · ( W f s + 2 T i n s ) ·   d i n s L f s W f s d i n s } D i n s C k g e
Lfs is the length of the floor slab in meters (m).
Wfs is the width of the floor slab in meters (m).
Tins is the thickness of the floor slab insulation material in meters (m).
dins is the depth of the floor slab insulation material (expressed in meters (m)).
Dins is the density of the floor slab insulation material (expressed in Kg/m3).
EEins are the embodied energy due to the applied floor slab insulation measure (expressed in mega joules (MJ)).
Ckge is the cradle-to-gate embodied energy coefficient (MJ/Kg).

2.5.2. Horizontal Perimeter Insulation (with Vertical Gap Insulation along the Slab Edges)

The cradle-to-gate embodied energy resulting from the floor slab insulation measure is given by Equations (3)–(5).
E E i n s _ g a p = { ( L f s + 2 T i n s ) · ( W f s + 2 T i n s ) T f s L f s W f s T f s } D i n s C k g e
E E i n s _ h r z = { ( L f s + 2 T i n s ) · ( W f s + 2 T i n s ) T i n s ( L f s 2 W i n s ) · ( W f s 2 W i n s ) T i n s } D i n s C k g e
E E i n s _ h t o t a l = E E i n s _ h r z + E E i n s _ g a p
Tfs is the thickness of the floor slab in meters (m).
Wins is the width of the floor slab insulation material from the edge of the floor slab (in the horizontal direction), expressed in meters (m).
EEins_gap is the embodied energy due to the applied gap floor slab insulation measure along edges of the floor slab (in MJ).
Ckge is the cradle-to-gate embodied energy coefficient (MJ/Kg).
EEins_hrz is the embodied energy due to the applied horizontal floor slab insulation measure beneath the floor slab (in MJ).
EEins_htotal is the total embodied energy due to horizontal floor slab insulation.

2.6. Saved Energy and Energy Payback Periods

The system boundaries over which embodied energy was evaluated are A1–A5, B4, and C1–C4. The period of analysis was 50 years. The difference in the embodied energy of the building due to the application of insulation at various levels of thickness was evaluated. Using the building model at the different levels of floor slab insulation thicknesses and depths (vertical insulation) or widths (horizontal insulation), annual energy consumption was evaluated for each of the scenarios. The differences between annual building energy consumption when insulation was used and annual building energy consumption without insulation were evaluated. They represented the possible annual operational site energy savings at a given level of insulation thickness.

2.6.1. Saved Energy after 50 Years

The saved energy after 50 years (period for evaluating embodied energy) is given by Equation (6):
E S n = t = 1 t = n O E S E E n A F
EEn refers to the estimated increase in the embodied energy (in MJ) of the building due to the application of the floor slab insulation measure at a certain level of thickness (over a lifecycle period of 50 years).
The term OES refers to the estimated annual savings in operational site energy (in MJ) due to the application of floor slab insulation at a certain level of thickness and depth (for vertical insulation) or width (for horizontal insulation).
The term ESn refers to the estimated net saved energy per m2 of net floor area (AF) that is accumulated over a period of n years (50 years in this case) due to the application of the floor slab insulation at a certain level of thickness and depth (vertical) or width (horizontal). The unit is MJ/m2.
A larger value of ESn at a certain level of floor slab insulation thickness and depth (vertical insulation) or width (horizontal insulation) indicates that more benefits are accrued due to the application of the floor slab insulation. When energy expressed in mega joules (MJ) is divided by 3.6, it is converted to kilowatt hours (KWh).

2.6.2. Energy Payback Periods

The payback periods resulting from the increase in operational energy and increase in embodied energy (over 50 years) because of the application of the floor slab insulation were also evaluated at different levels of floor slab insulation thicknesses and depths (vertical insulation) or widths (horizontal insulation). The annual operational source energy savings corresponding to the use of the floor slab insulation at the same level of thickness that resulted in the increase in embodied energy were first evaluated. Equation (7) shows how the energy payback period (PBE) in years was evaluated.
P B E = E E n O E S  

2.6.3. Validation of the Building Energy Model

The SANS10400-XA [33] validation standards were used as a basis for validating the energy models. These standards state the maximum allowable annual energy consumption per m2 of net floor area for residential buildings (classified as H3 and H4) in each of the seven South African energy zones. The occupancy and utilization rate schedules recommended by SANS10400-XA are all greater than zero over the 24 h of each day in a given week. The implication is that a residential building is assumed to be partly occupied at any time of the day throughout the week. Therefore, when the simulations are run, 95% of the 8760 annual hours must be between temperatures of 19 °C and 25 °C inclusive [33]. Prior to running the simulations, the heating and cooling set point schedules were aligned with the recommended indoor comfort temperatures. After the simulations, the annual cooling and heating loads not met (in the form of hours outside the comfort range) were obtained and compared to the maximum 5% allowed by the SANS10400-XA standards.
While site energy corresponds to the amount of energy consumed by the building as reflected in the utility bills, source energy refers to the energy consumed by utilities and other entities to supply the energy consumed by the building. EnergyPlus computes both site energy and source energy. The South African standards stipulate that the annual energy consumption per net floor area of the building is based on the sum of the monthly consumption of 12 consecutive months [33]. The net floor area, according to [33], is the floor area within a building envelope, including the area occupied by vertical elements such as internal walls, lift wells, enclosed stairs, storage areas, and rooms. Since the model only used electricity from the grid, the annual energy consumption directly corresponds to the building’s site energy (as reflected in the electricity utility bill) rather than source energy. Site energy was used as the basis for model validation and for evaluating the impact of the floor slab XPS and PIR insulation measures.

3. Results

3.1. Climatic Recommendations and SANS10400-XA Test Results

Climate Consultant Results

Table 1 shows the results derived from using the adaptive comfort model and ASHRAE standard 55 model. The details of the ten best design guidelines extracted are summarized in the table in order of importance (highest number of comfortable hours added).
Each guideline number refers to the passive strategy design guideline number assigned to a design guideline within the Climate Consultant application. For example, heat gains from lights, people, and equipment (guideline number 11) was the fifth most important strategy in Welkom, the fourth most important strategy in Pretoria, the best (1st) strategy in Cape Town and Ixopo, the second most important strategy in Fraserburg, the third most important strategy in Witbank and Sutherland, and the ninth most important strategy in Thohoyandou. The most important passive strategies for all seven energy zones, on average, were 62, 11, 58, and 35. These strategies include the use of lightweight construction with slab on grade, operable walls, and shaded outdoor spaces; the use of internal heat gains; the use of shade to prevent overheating, opening the house to breezes in summer, and the use of passive solar gains in winter; and the use of good natural ventilation by using shaded windows that are oriented to prevailing breezes. A rectangular building floor plan would benefit all selected locations in the zones (primarily zone 3, followed by zones 1, 5, and 4). Similarly, heat gains from lights, from people, and from equipment; facing the front wall of the house north; and the use of low-pitched roofs with wide overhangs benefit all zones. The design guideline 3 was overridden by SANS10400-XA-recommended indoor temperature comfort range values of 19 to 25 °C. Furthermore, 69.7% of dwellings in South Africa utilize bricks or concrete blocks as the building element for the wall envelope [5]. Although, mostly, these materials are not lightweight, they are representative of the South African household dwelling preferences.
Therefore, most windows should be facing the north and south directions for cross ventilation and solar gain purposes in all zones. The inside floor and walls can be covered with high-mass materials to store heat during the day and release it later at night.
Table 2 shows some of the design parameters of the building model.
For the embodied energy computations, the period of analysis was 50 years, the average distance from factory to site was taken to be 220 km, the average distance from site to landfill was 70 km, and the fraction of material that is wasted was 2.5%. The energy to carbon conversion factor used was 1.131 Kg/KWh, while the average cargo mass for transportation truck used was 18 tonnes.

3.2. Optimum Window-to-Wall Ratios

The optimum WWRs used were based on an earlier study. The detailed results of the analysis are not presented here, but the final WWRs are indicated in Table 2. The steps involved the simulation of annual energy consumption using EnergyPlus, regressing annual energy consumption over the WWRs, and optimization using the regression models and the Microsoft Excel-based evolutionary algorithm. The stargazer package in R was used to generate the regression models [47].

3.3. Energy Savings Model Validation for Vertical Gap Insulation

Using the adopted WWRs, (Table 2) and recommended SANS10400-XA load schedules, modifications were made in the building design and energy model before running the energy simulations to determine the impact of the floor slab insulation measures. The model validation consisted of two components. The first consisted of the evaluation and comparison of site energy consumption per m2 of net floor area with the maximum allowable according to SANS10400-XA. The second consisted of the evaluation of unmet heating and cooling loads annually and comparing them to the maximum allowable SANS10400-XA of 5%. The output simulation results for vertical gap insulation are found in Table S1 as part of the supplementary material.

3.3.1. Site Energy Consumption per m2 of Floor Area (Vertical Gap Insulation)

Table 3 shows the summarized site energy (and source energy in brackets) consumption statistics (according to the energy zones) per net floor area and the corresponding SANS10400-XA maximum site energy limits.
The results show that the models used across all the energy zones were within the acceptable SANS10400-XA site energy limits per m2 of net floor area.
The results also show that all the loads (sum of heating and cooling loads) which were not met annually were all less than 5%. The highest unmet loads appeared to occur in Witbank (energy zone 2), while the least occurred in Welkom and Fraserburg (zones 1 and 7). The maximum energy consumption per m2 was highest in zone 6 (Sutherland), followed by zone 3 (Thohoyandou), zone 7 (Fraserburg), and zone 5 (Pretoria). A comparison with Figure A1 in the appendix shows that there is some agreement because all the first three ranked zones with maximum values had either high heating requirements (zone 6 for Sutherland and 7 for Fraserburg) or high cooling requirements (zone 3 for Thohoyandou). However, there are also some discrepancies, as Cape Town (low heating/low cooling) instead of Witbank (medium heating/low cooling) would be expected to consume the least energy. Table A1 in Appendix D shows paired points within the same energy zones for zones 1, 4, and 5. The data for Welkom and Kimberley in zone 1 shows that two locations in the same energy zone could significantly differ in energy consumption for the same building model (24.61 and 27.09 KWh/m2, respectively). The maximum energy consumption per m2 of net floor area for all the models generated by varying the insulation thickness from 25 mm to 200 mm and the insulation width from 0.2 m to 2 m were all below the maximum allowable SANS10400-XA standards, irrespective of the energy zones, subject to the general energy model settings in Table 2. The energy models also included a model that does not utilize any floor slab insulation at all. This model tended to consume the highest site and source energy. Therefore, the results in Table 3 implied that relying on passive design strategies only (without the use of vertical gap insulation measures) was sufficient for generating buildings that consume less energy and meet the national energy efficiency standards.
The corresponding minimum energy consumption per m2 indicated the lowest energy consumption scenarios that could be reached with the application of vertical gap insulation measures. All the minimum values were positive, indicating that additional measures (apart from passive strategies and vertical gap insulation) were required if net-zero energy status is to be achieved for the low energy consumption building models.
The standard deviation indicated the beneficial effects of applying vertical gap insulation measures. A higher standard deviation generally indicated greater benefits, as the insulation thickness and width varied. Witbank (zone 2) and Thohoyandou (zone 3) were benefitted to the greatest extent. Therefore, all the models used fulfilled the requirements of the SANS10400-XA standards.

3.3.2. Embodied Energy of the Building

The evaluated embodied energy of the building (for 50 years) without using insulation in the wall envelope was 439,556.8 MJ or 4170.4 MJ/m2 (of net floor area). The embodied energy due to the floor was 99,289.7 MJ or 942.03 MJ/m2 (of net floor area). These results are comparable to studies pertaining to other countries like Australia. The authors of [48] used the input–output analysis method to evaluate embodied quantities. While the authors of [48] used a 110 mm thick concrete slab (leading to a 1053 MJ/m2 evaluation), this study used a 100 mm thick concrete slab.

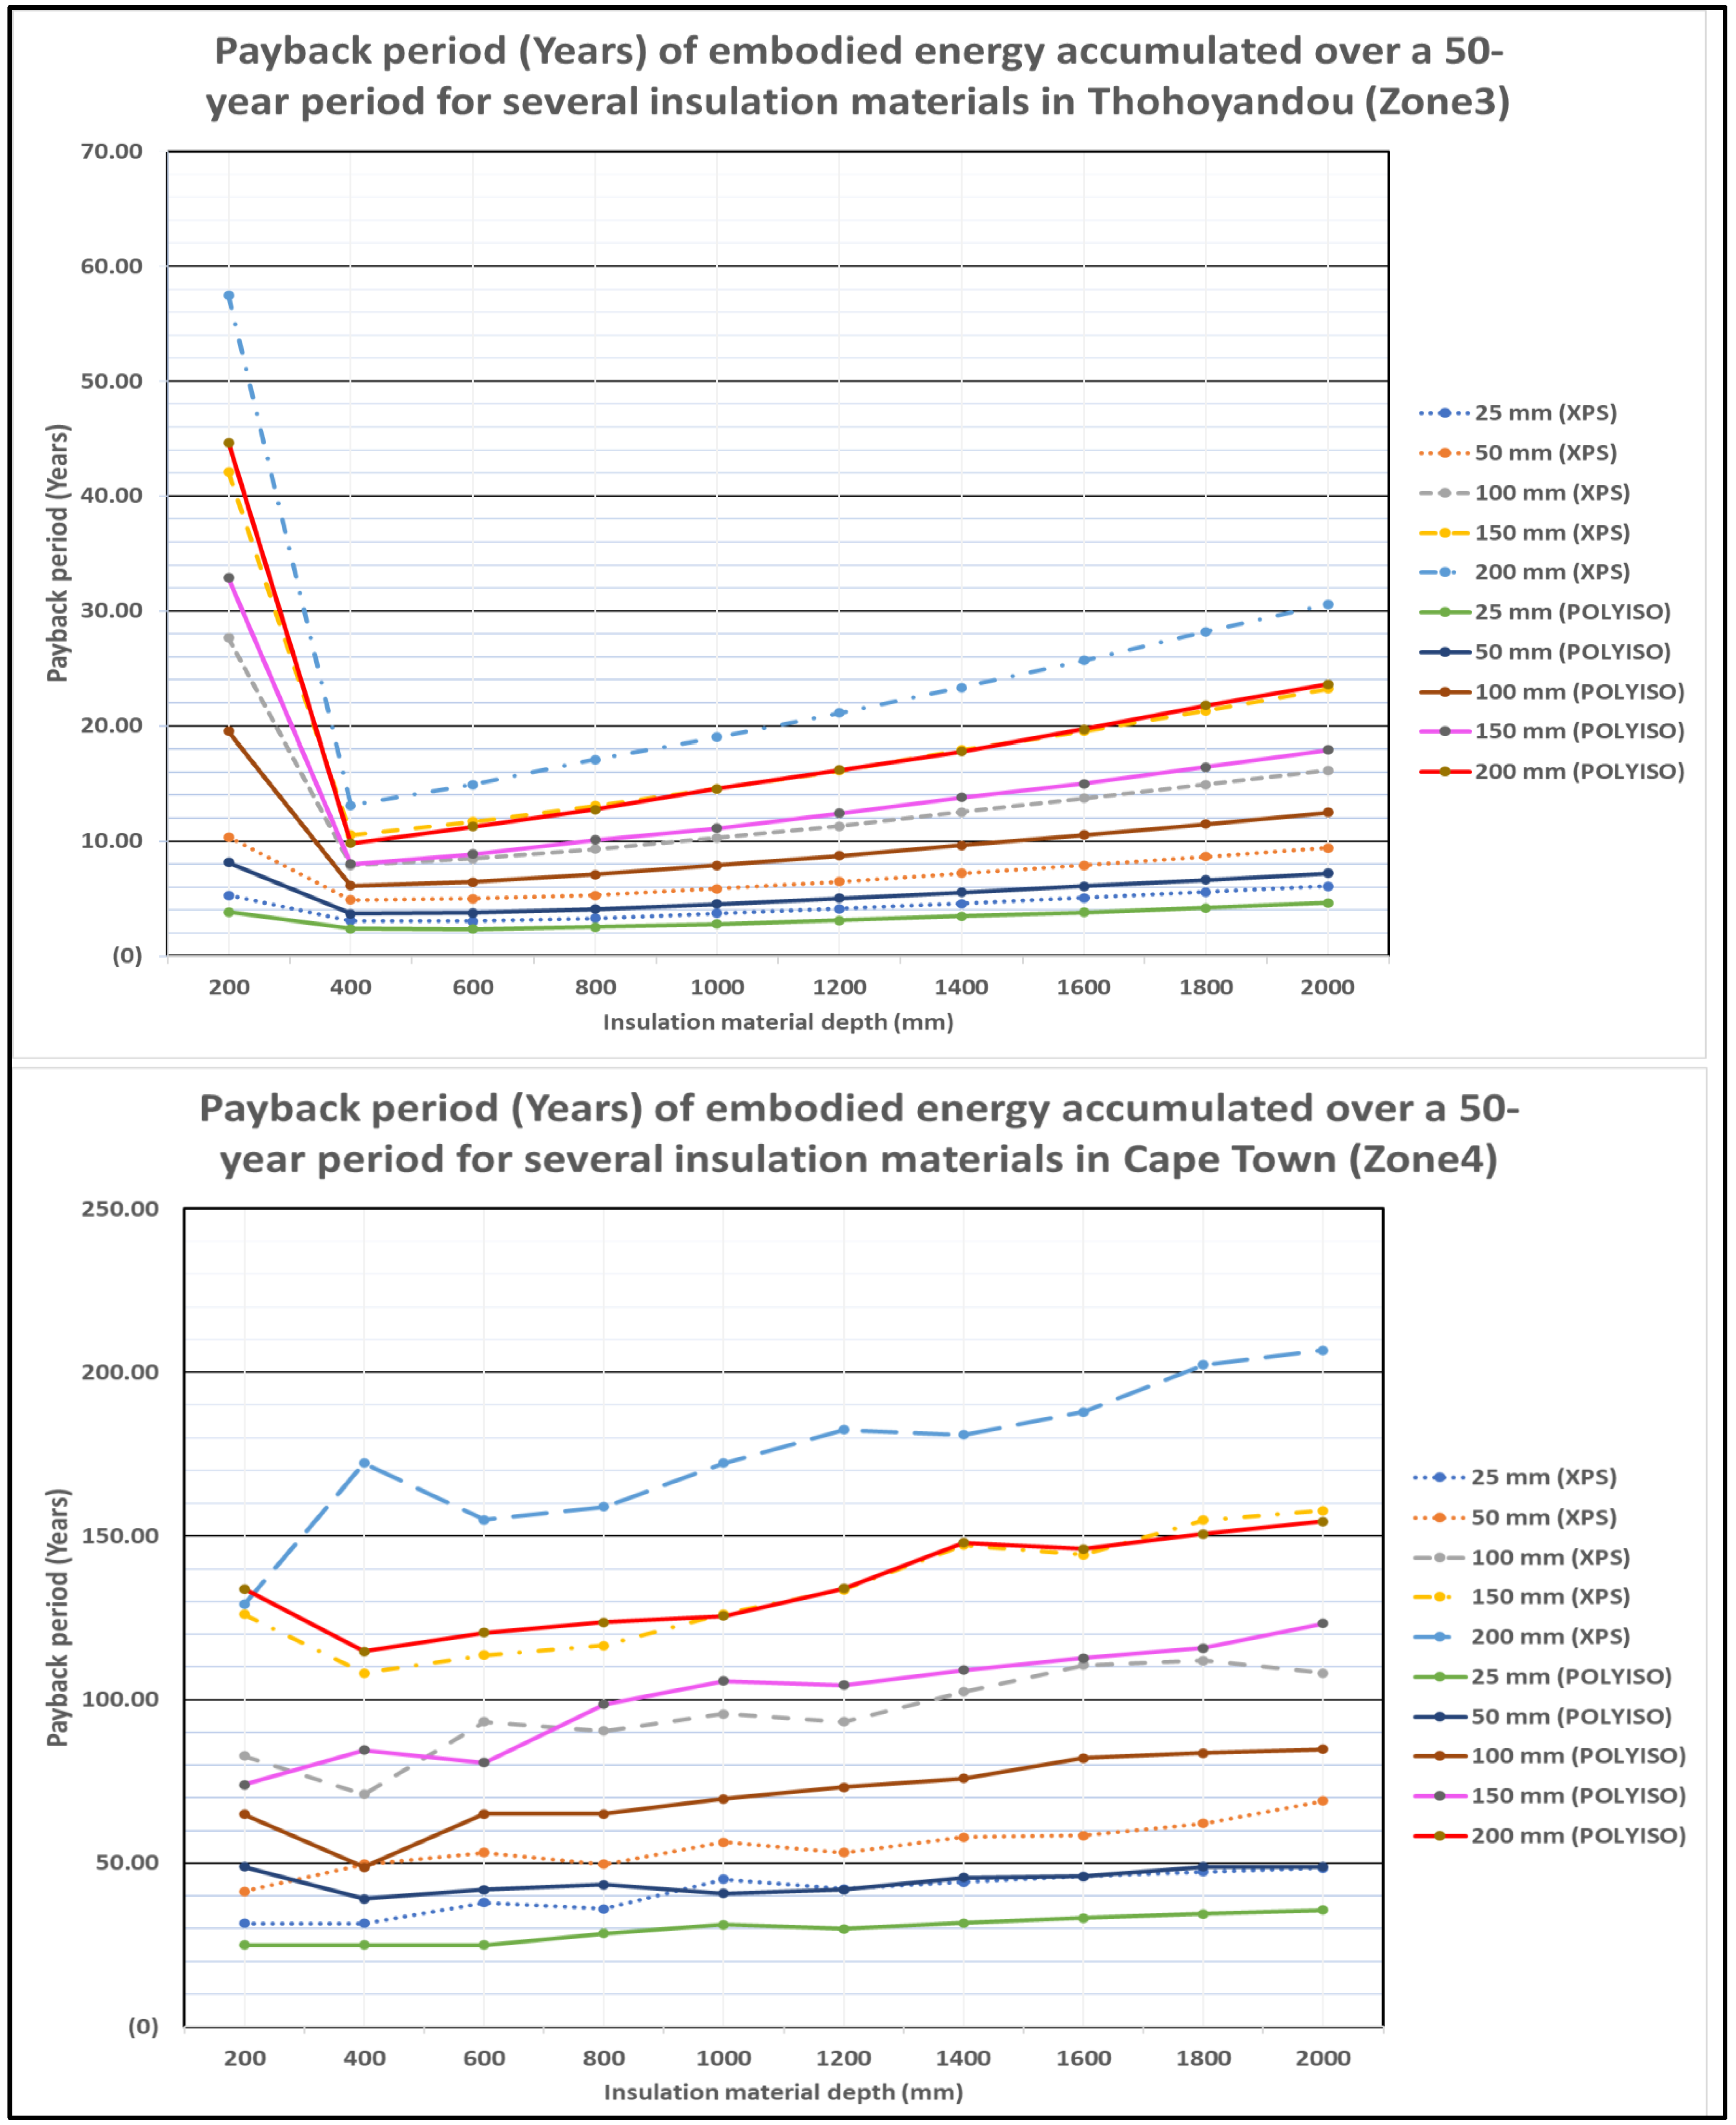
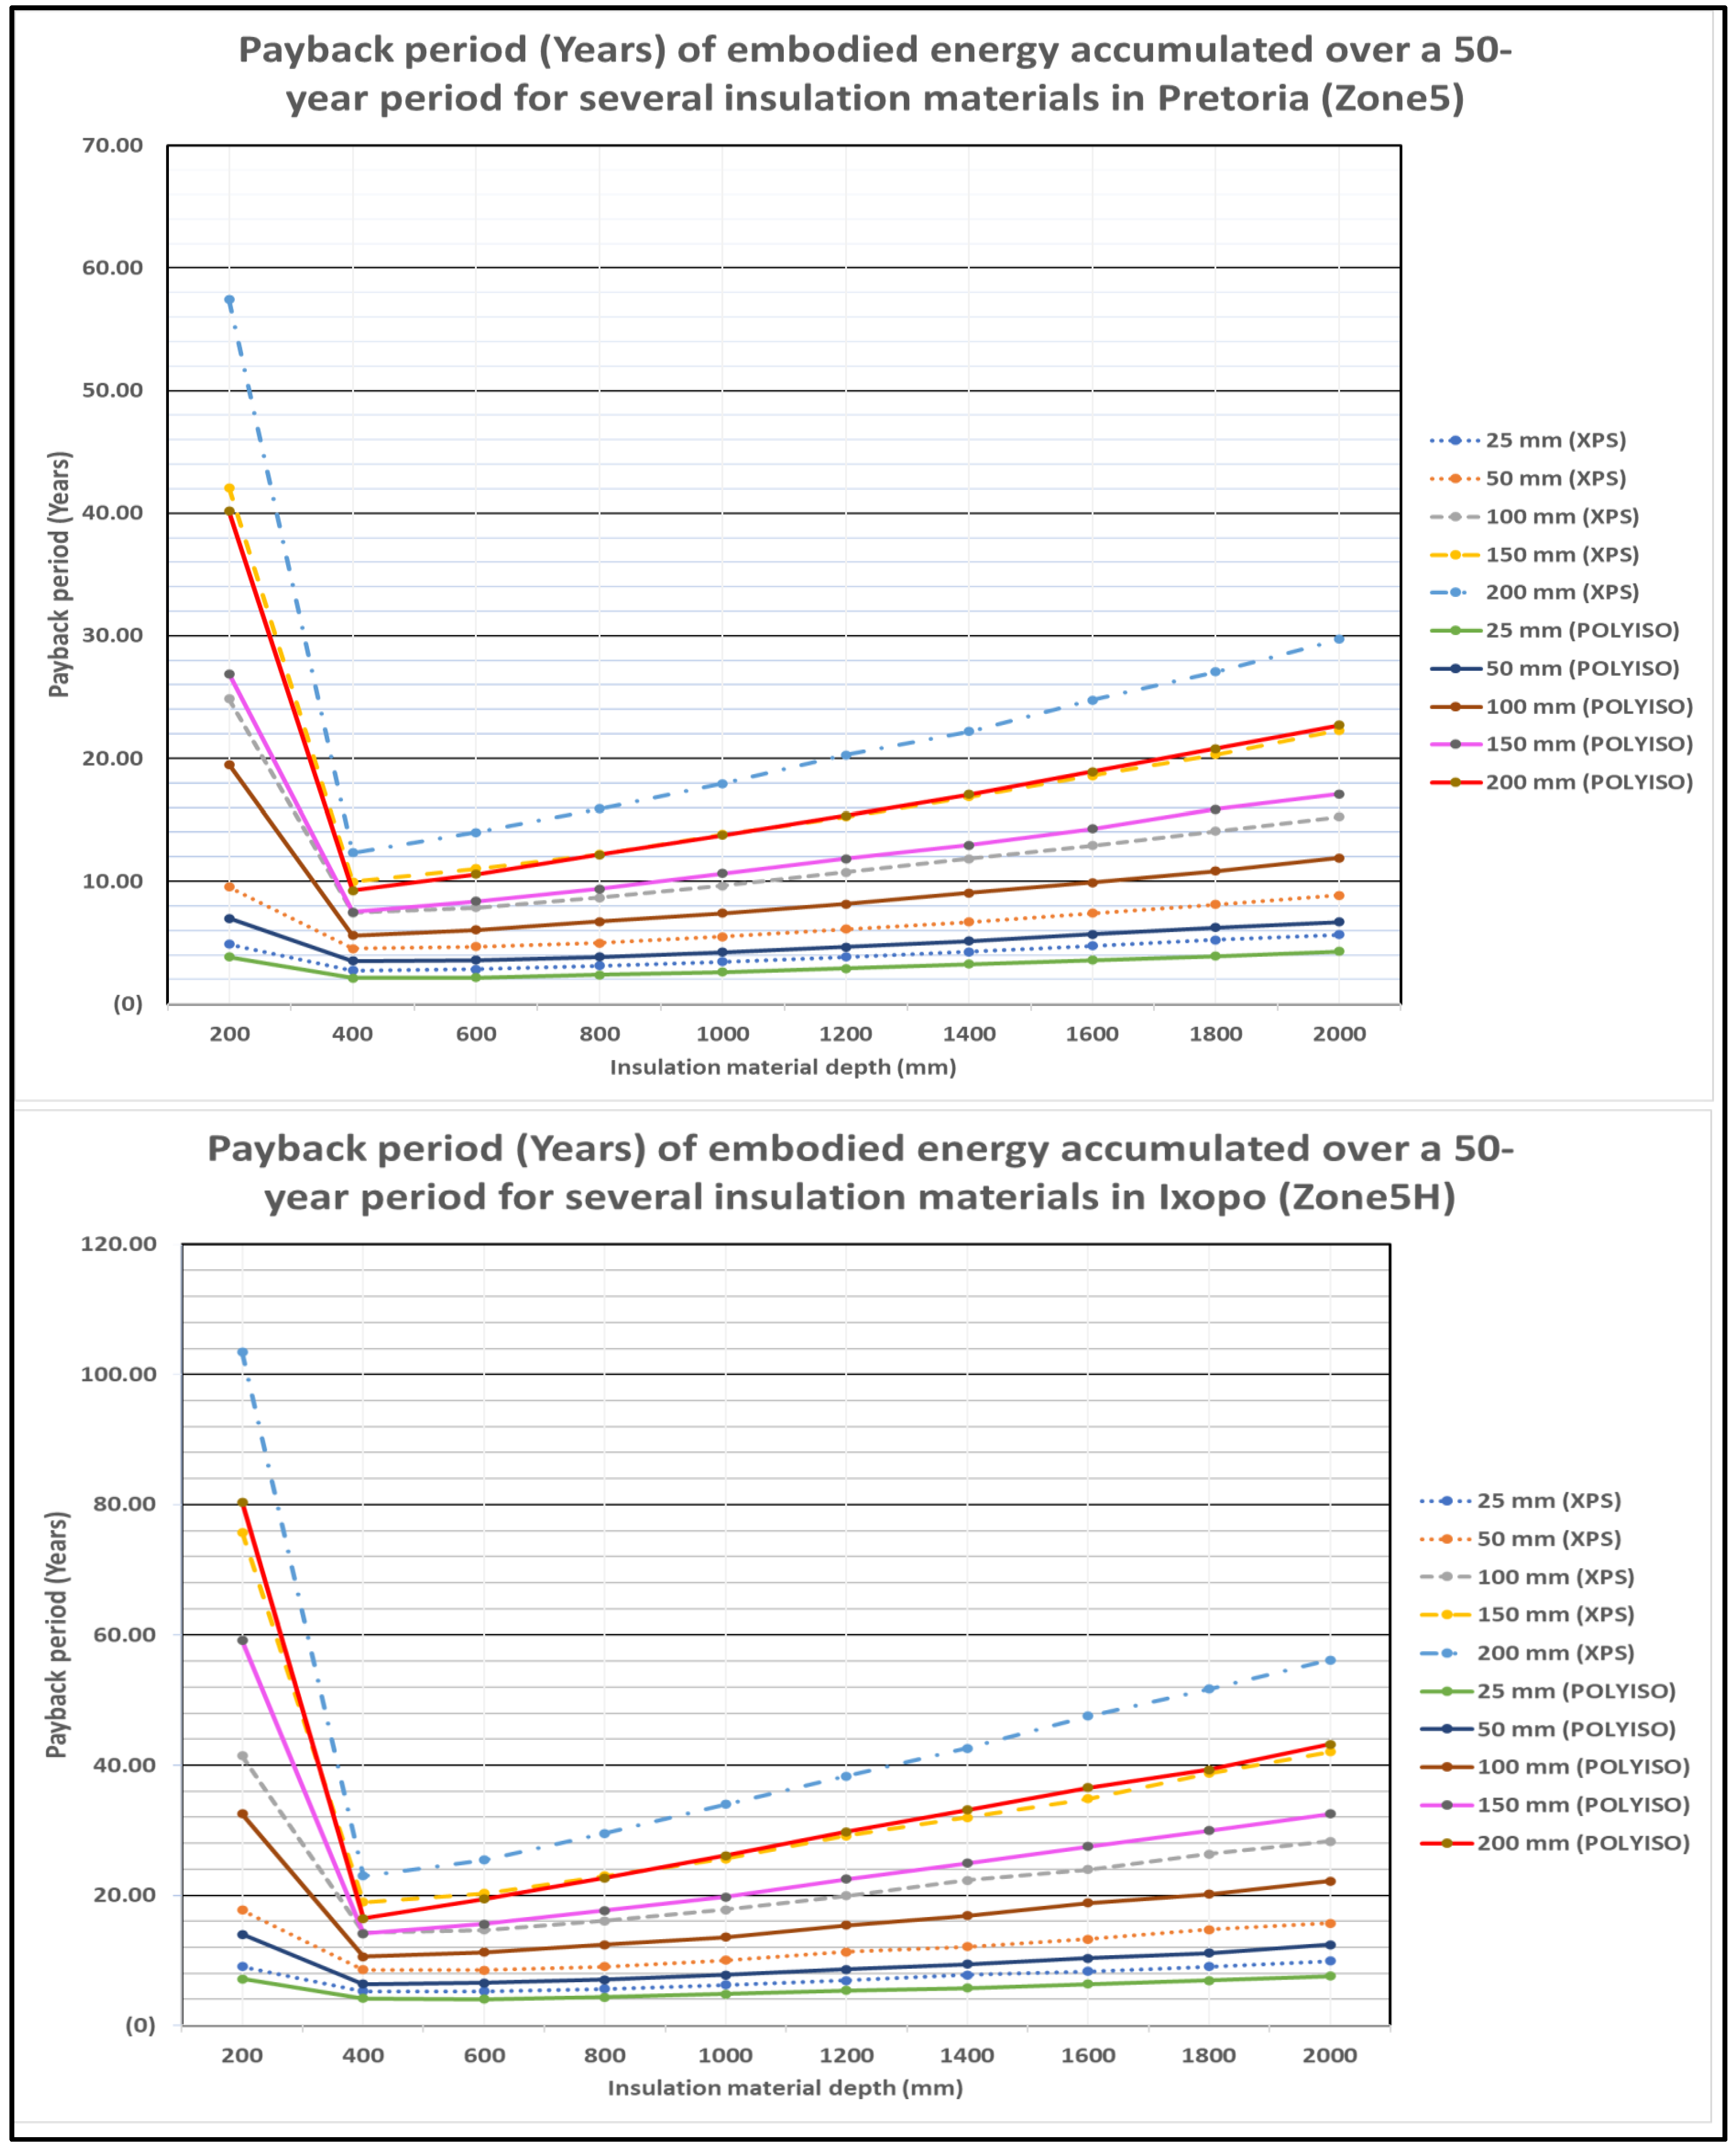
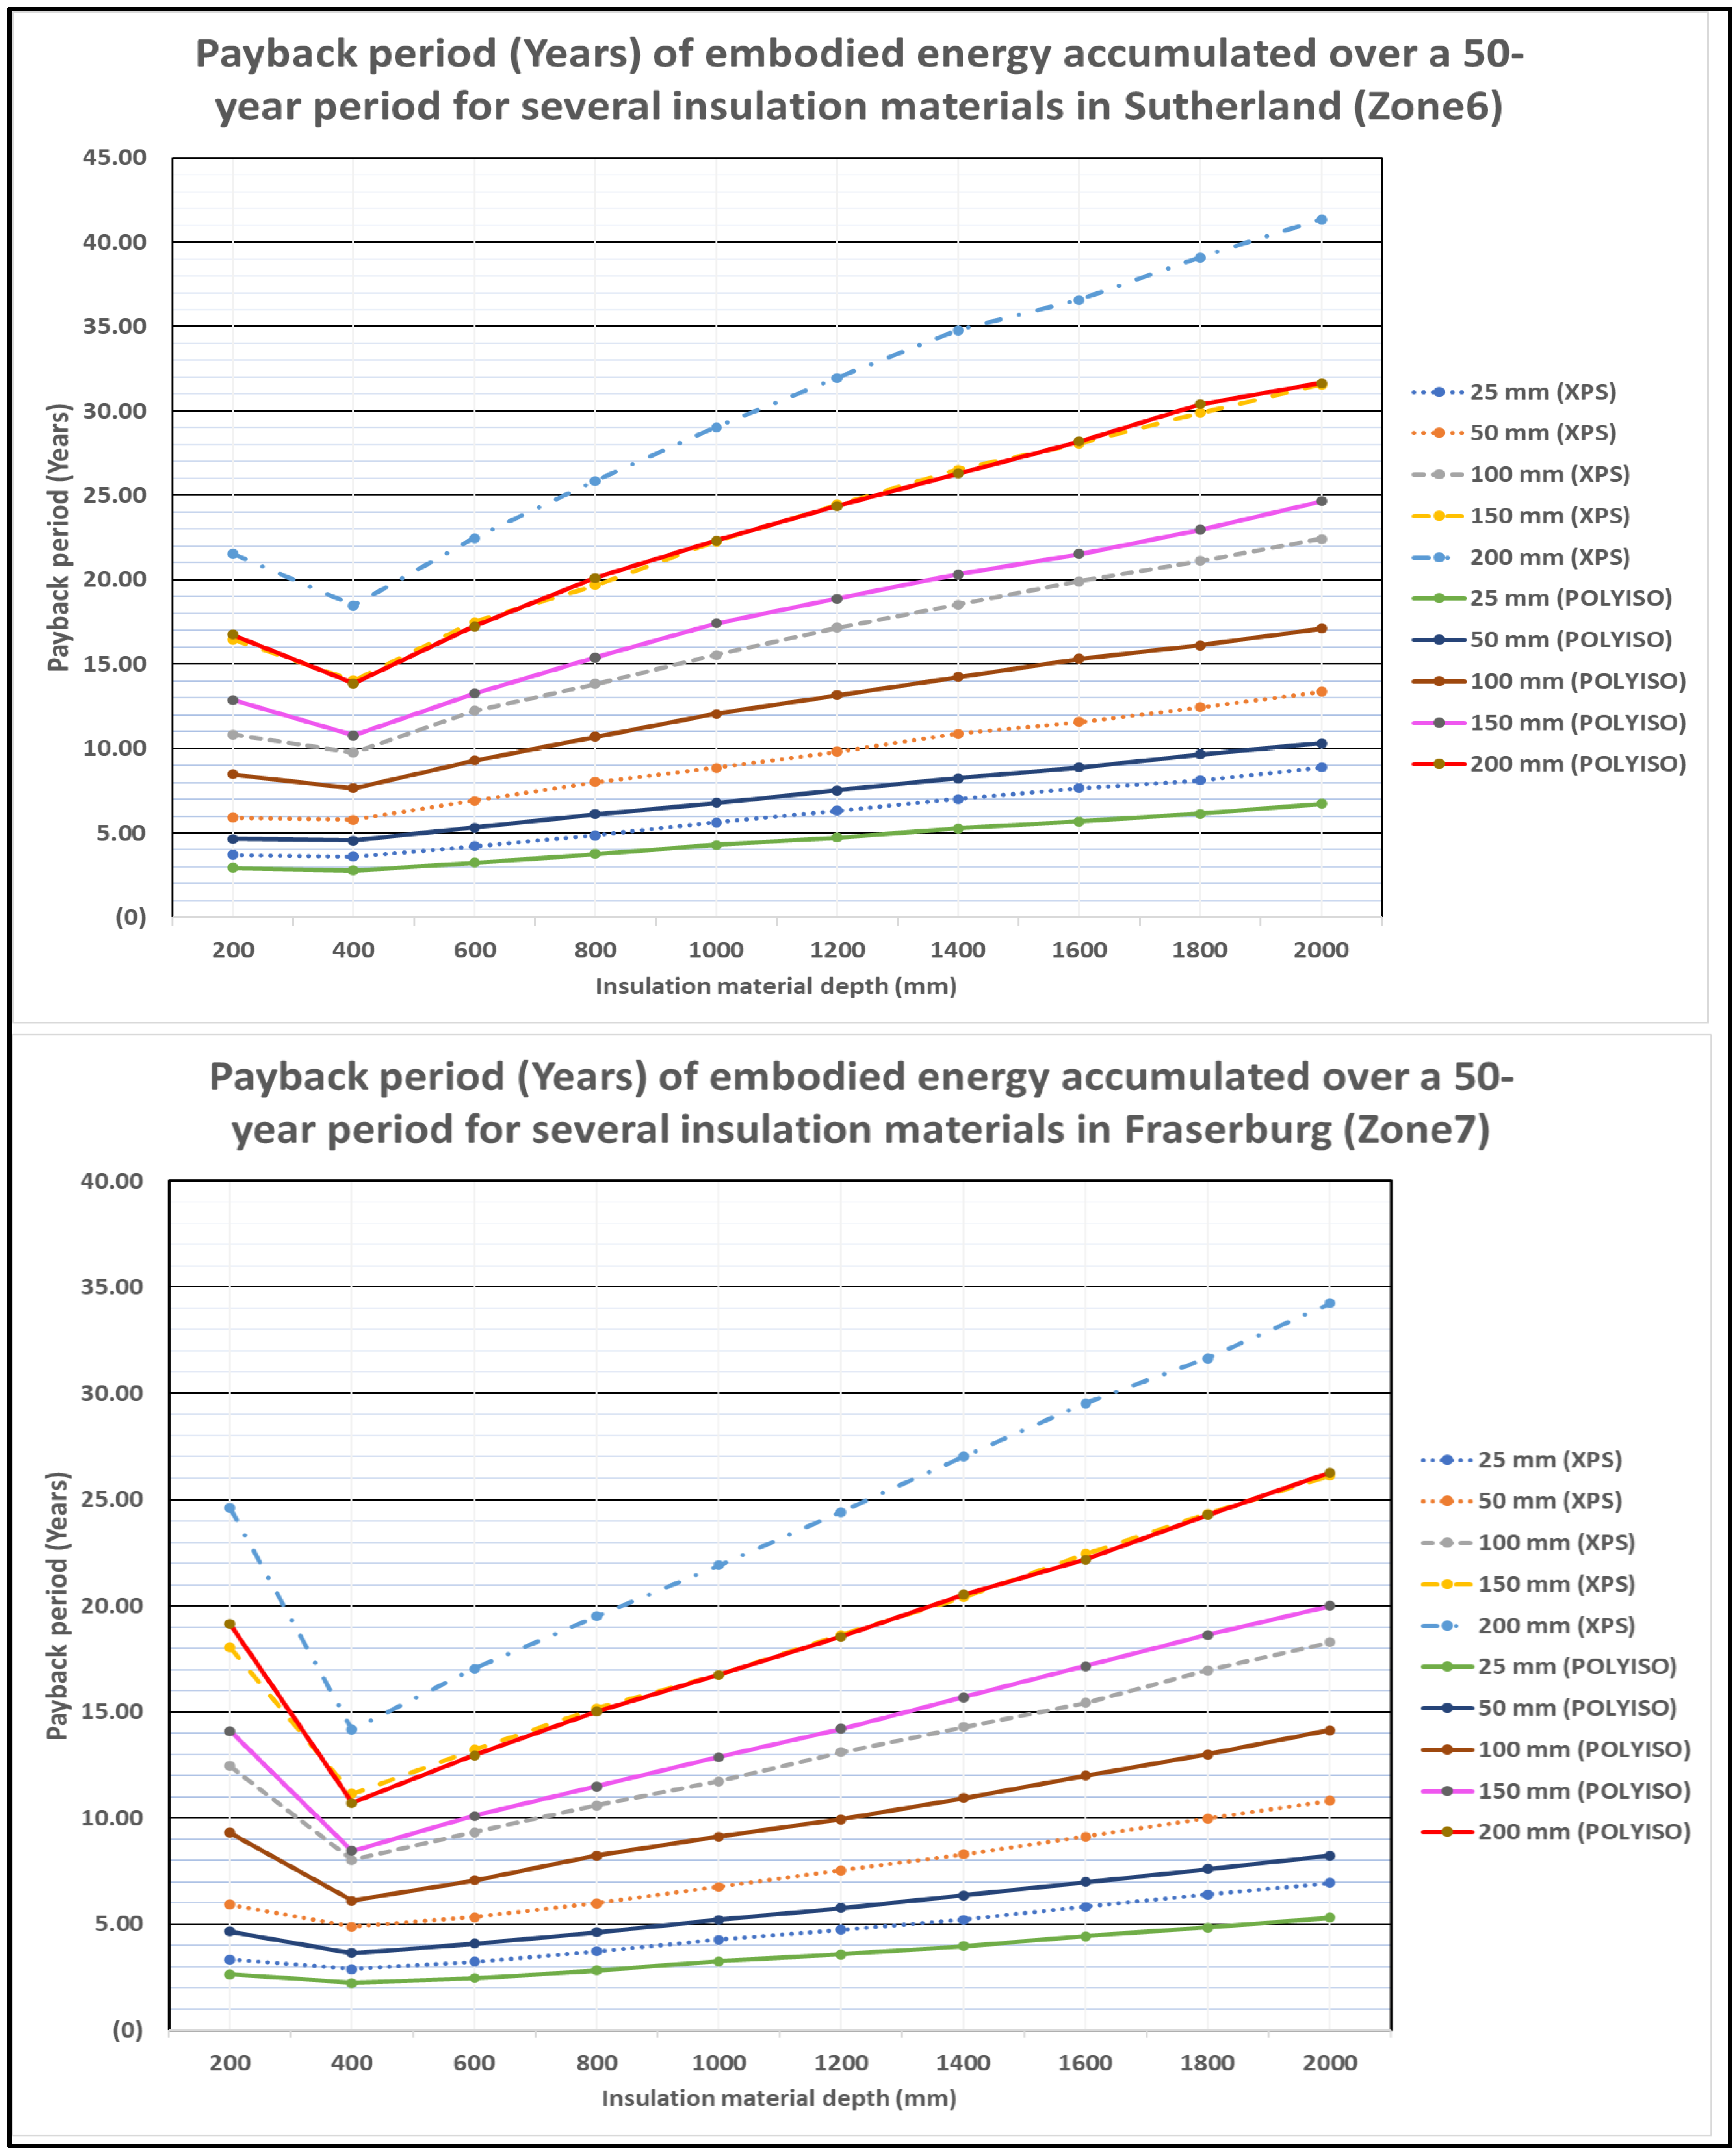
3.4. Energy Payback Periods for Vertical Gap Insulation Depths Greater than or Equal to 0.4 m

The energy payback periods were evaluated using Equation (7). Figure A3, Figure A4, Figure A5 and Figure A6 in Appendix B illustrate the results. These figures show that at the same floor insulation thickness levels, XPS insulation leads to higher payback periods compared to polyiso (PIR) insulation for all energy zones. These figures also indicate that higher insulation thicknesses for XPS and polyiso (PIR) lead to higher payback periods. Therefore, 25 mm thick polyiso would yield the lowest payback periods, followed by 25 mm thick XPS.
Except for Cape Town (zone 4), the payback periods tend to reduce as the insulation depth increases up to 400 mm, and thereafter, they increase with increases in insulation depth. Except for Cape Town (zone 4), it appears that the insulation depths corresponding to the lowest payback periods occur somewhere between 200 mm and 400 mm for both XPS and polyiso (PIR) with respect to all levels of thickness (25 mm to 200 mm). Therefore, low insulation depths do not necessarily lead to energy savings for insulation depths below 400 mm. For insulation depths of 400 mm and above, the highest payback periods occur in Cape Town (zone 4), followed by Witbank (zone 2) and Ixopo (zone 5H). The lowest payback periods occur in Thohoyandou (zone 3), Pretoria (zone 5), Fraserburg (zone 7), and Welkom (zone 1). Therefore, it is inadvisable to use vertical perimeter floor slab insulation in zone 4 using XPS or polyiso (PIR).
Based on these results, it is therefore apparent that using 25 mm thick polyiso (PIR) at an insulation depth of 400 mm would generally yield the lowest payback periods in energy zones 1, 2, 3, 5, 5H, 6, and 7, followed by using 25 mm thick XPS at an insulation depth of 400 mm. For insulation depths greater than or equal to 400 mm, zone 3, zone 5, zone 7, and zone 1 had the lowest energy payback. For insulation depths greater than or equal to 400 mm, Cape Town (zone 4), Witbank (zone 2), and Ixopo (zone 5H) had the highest energy payback periods (in that order). The highest energy payback periods for XPS and polyiso (PIR) in the energy zones were 38.6 and 29.5 years, respectively, in Welkom (zone 1); 74.9 and 58.2 years in Witbank (zone 2); 30.6 and 23.6 years in Thohoyandou (zone 3); 206.7 and 154.5 years in Cape Town (zone 4); 29.7 and 22.7 years in Pretoria (zone 5); 56.2 and 46.2 years in Ixopo (zone 5H); 41.4 and 31.6 years in Sutherland (zone 6); 34.2 and 26.3 years in Fraserburg (zone 7).

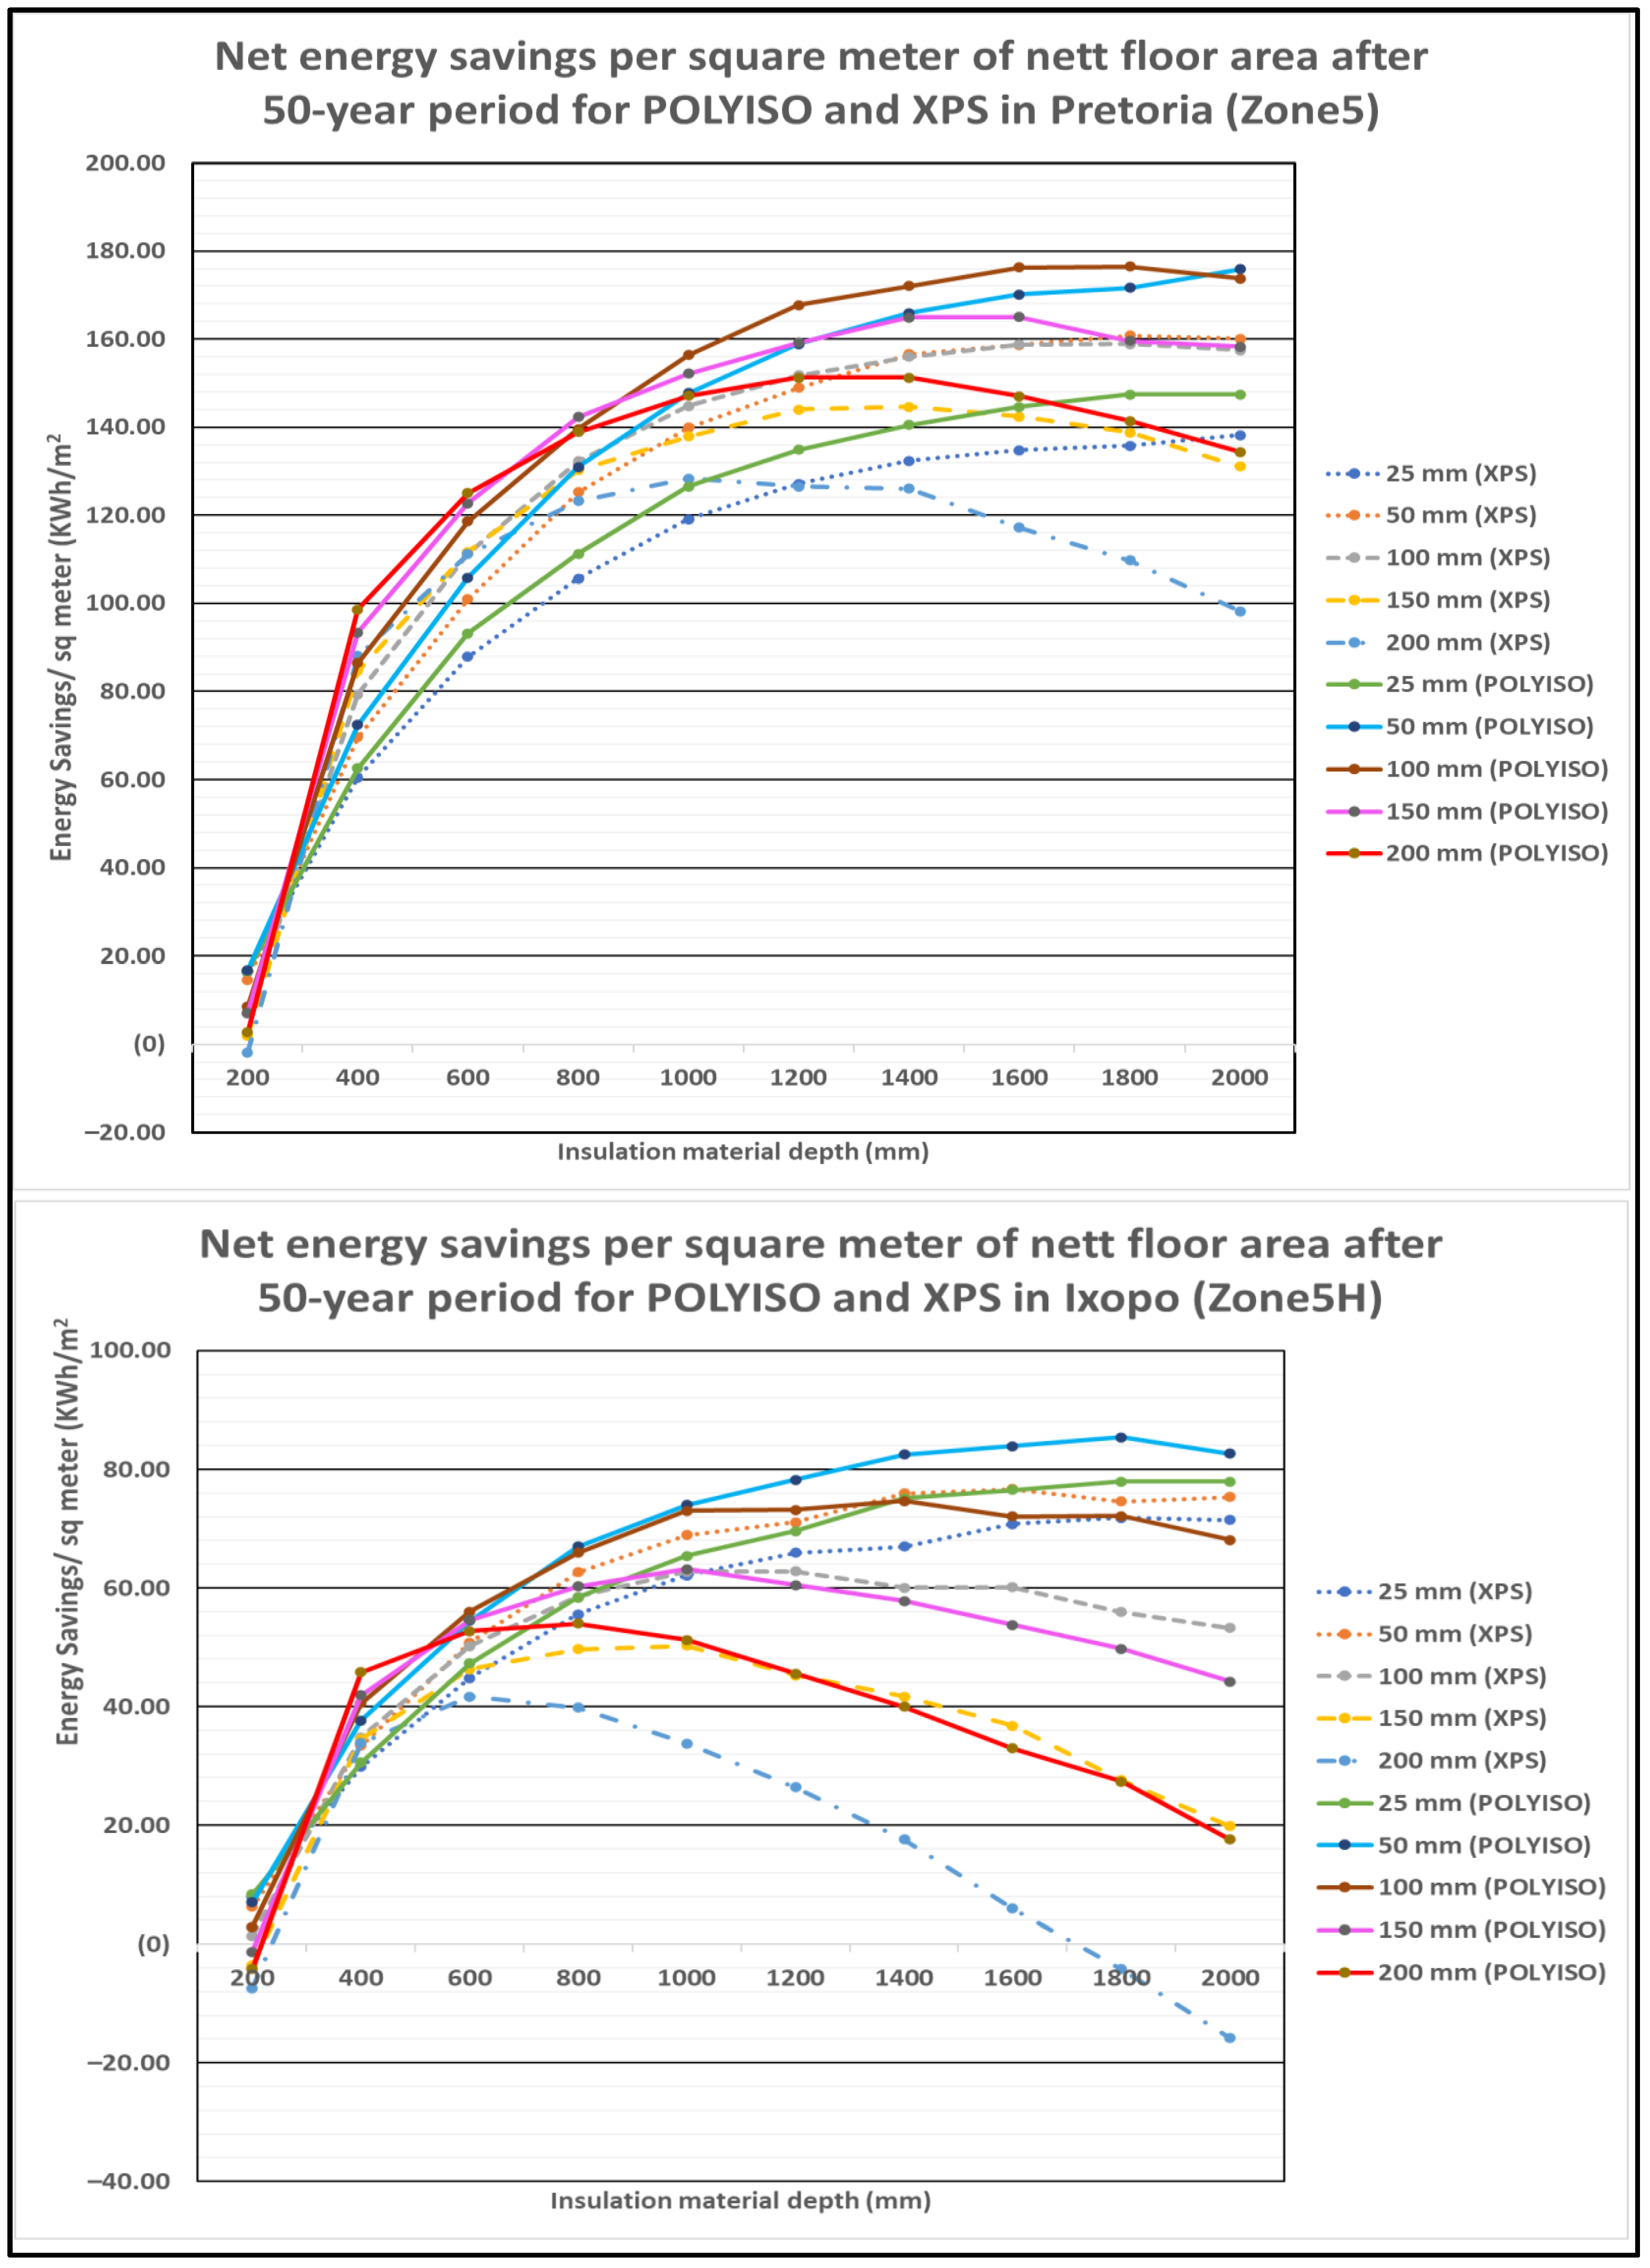
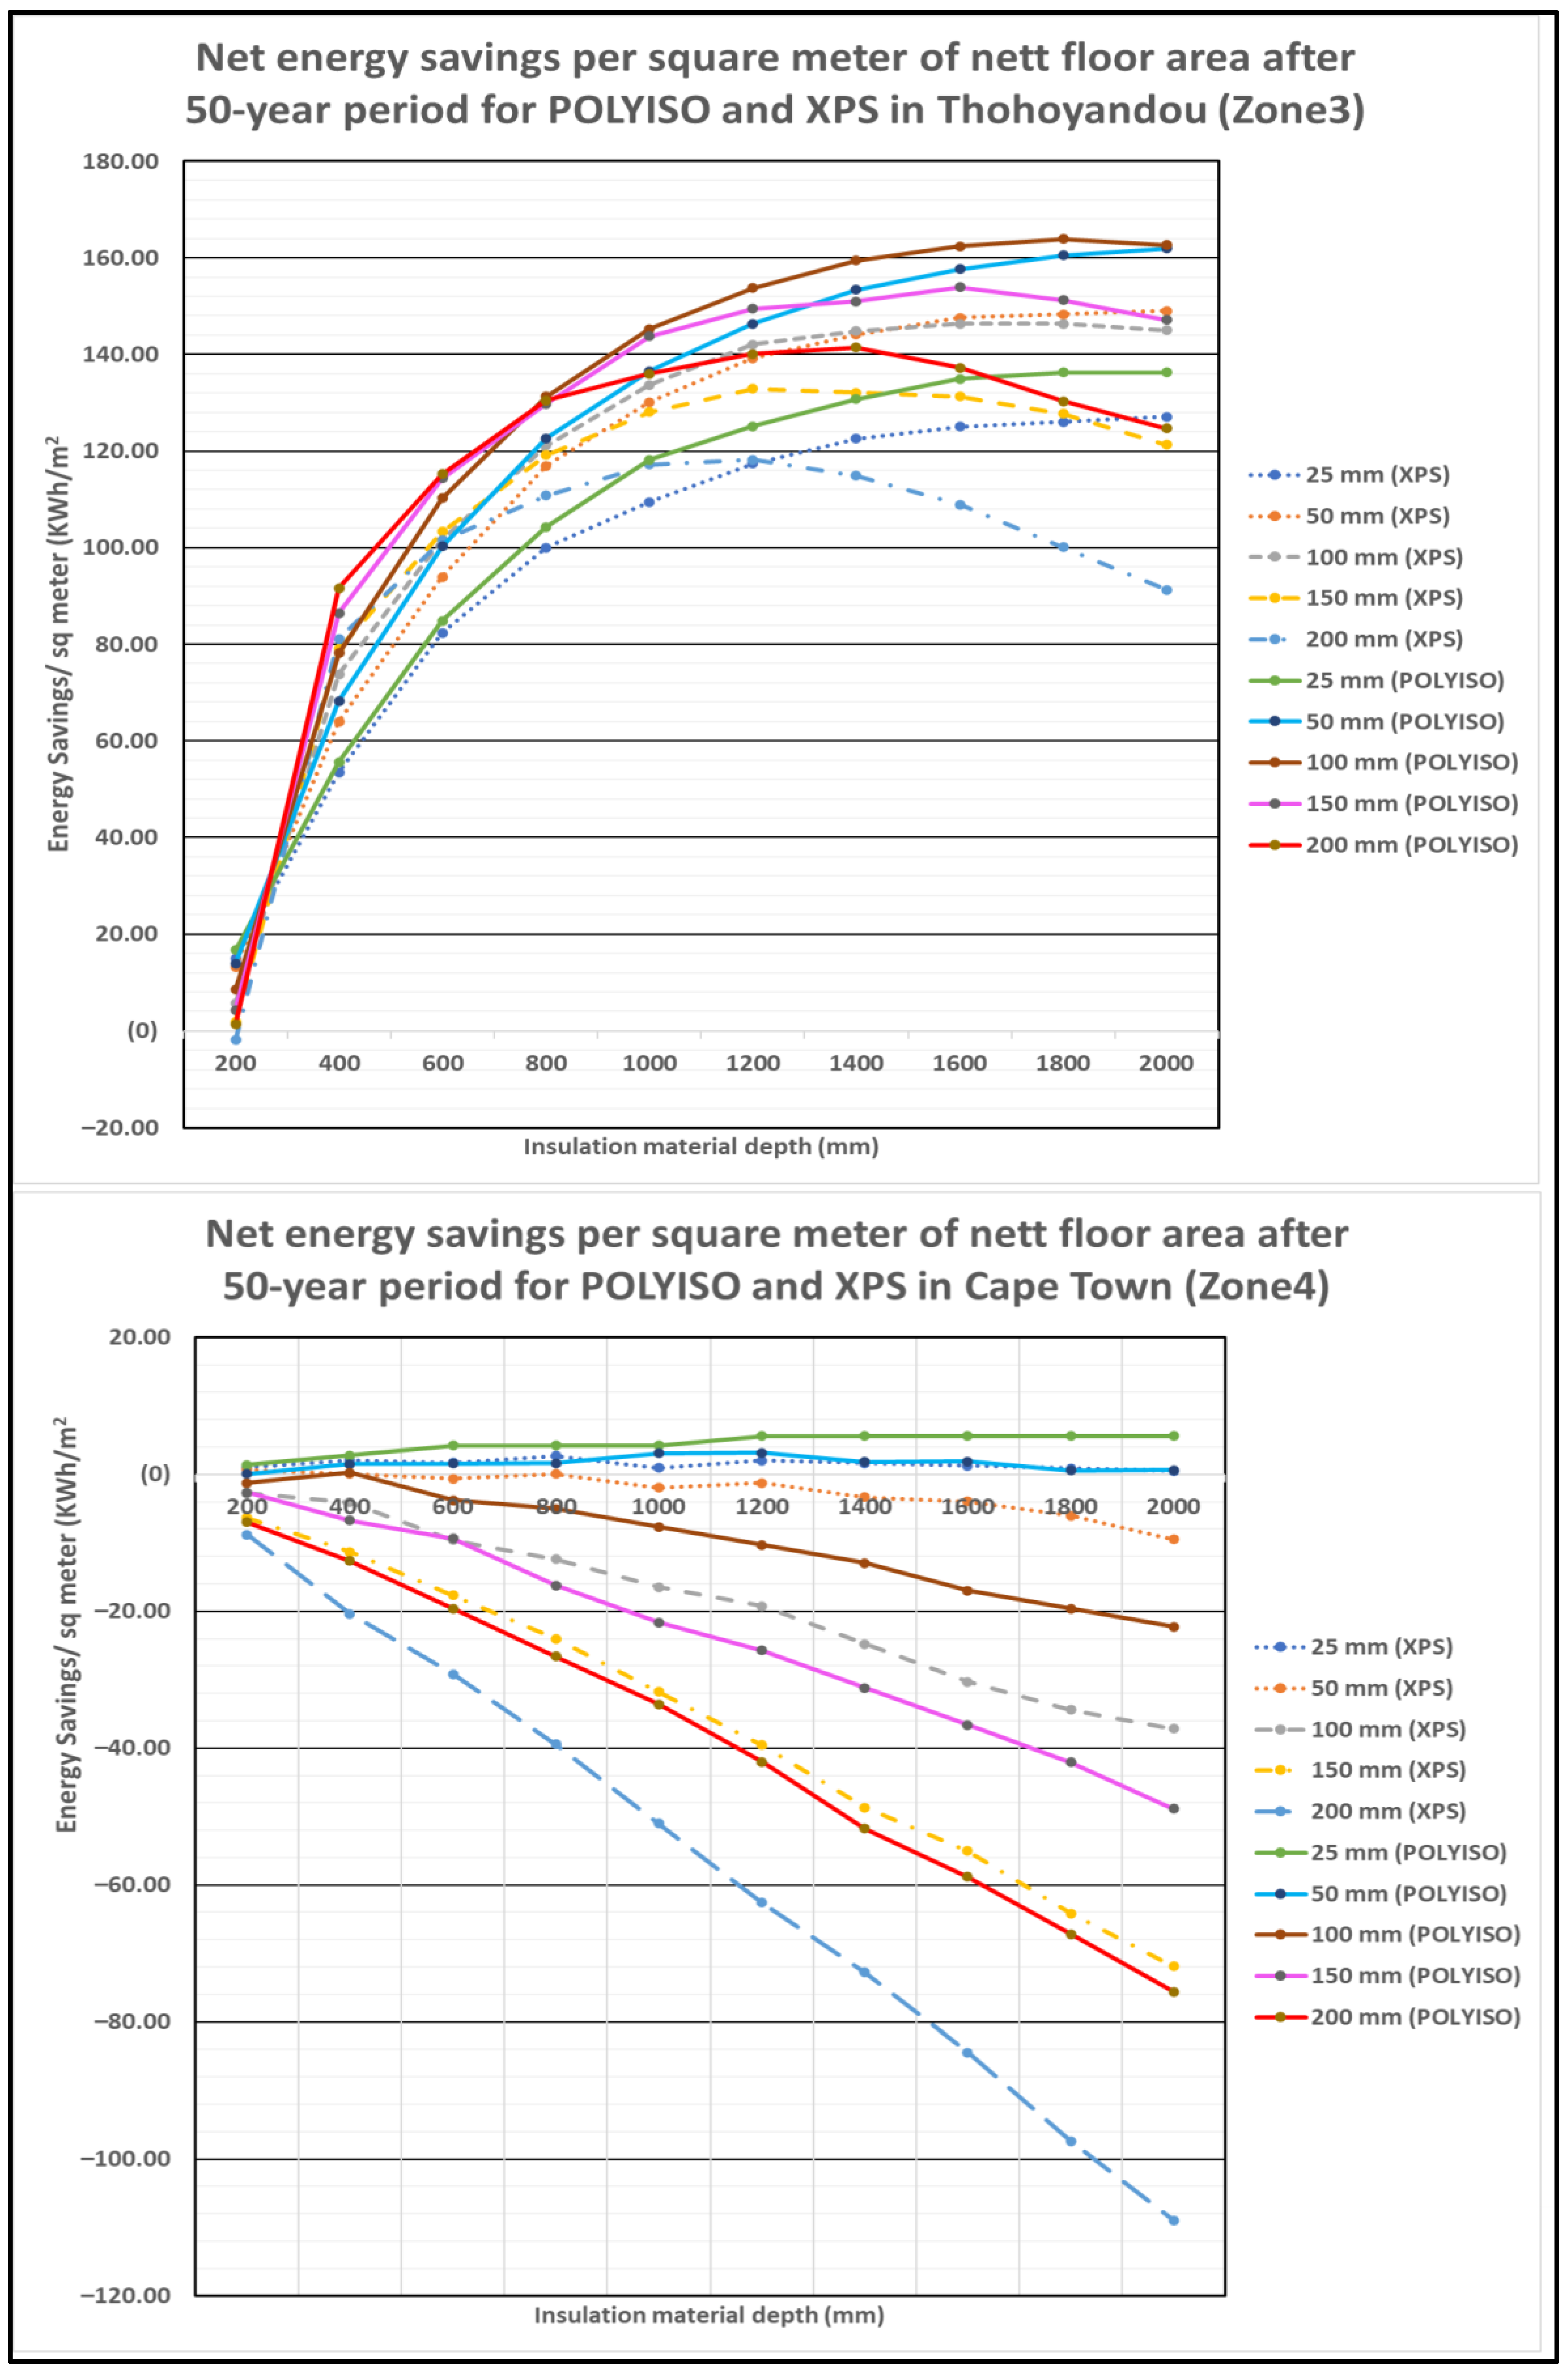
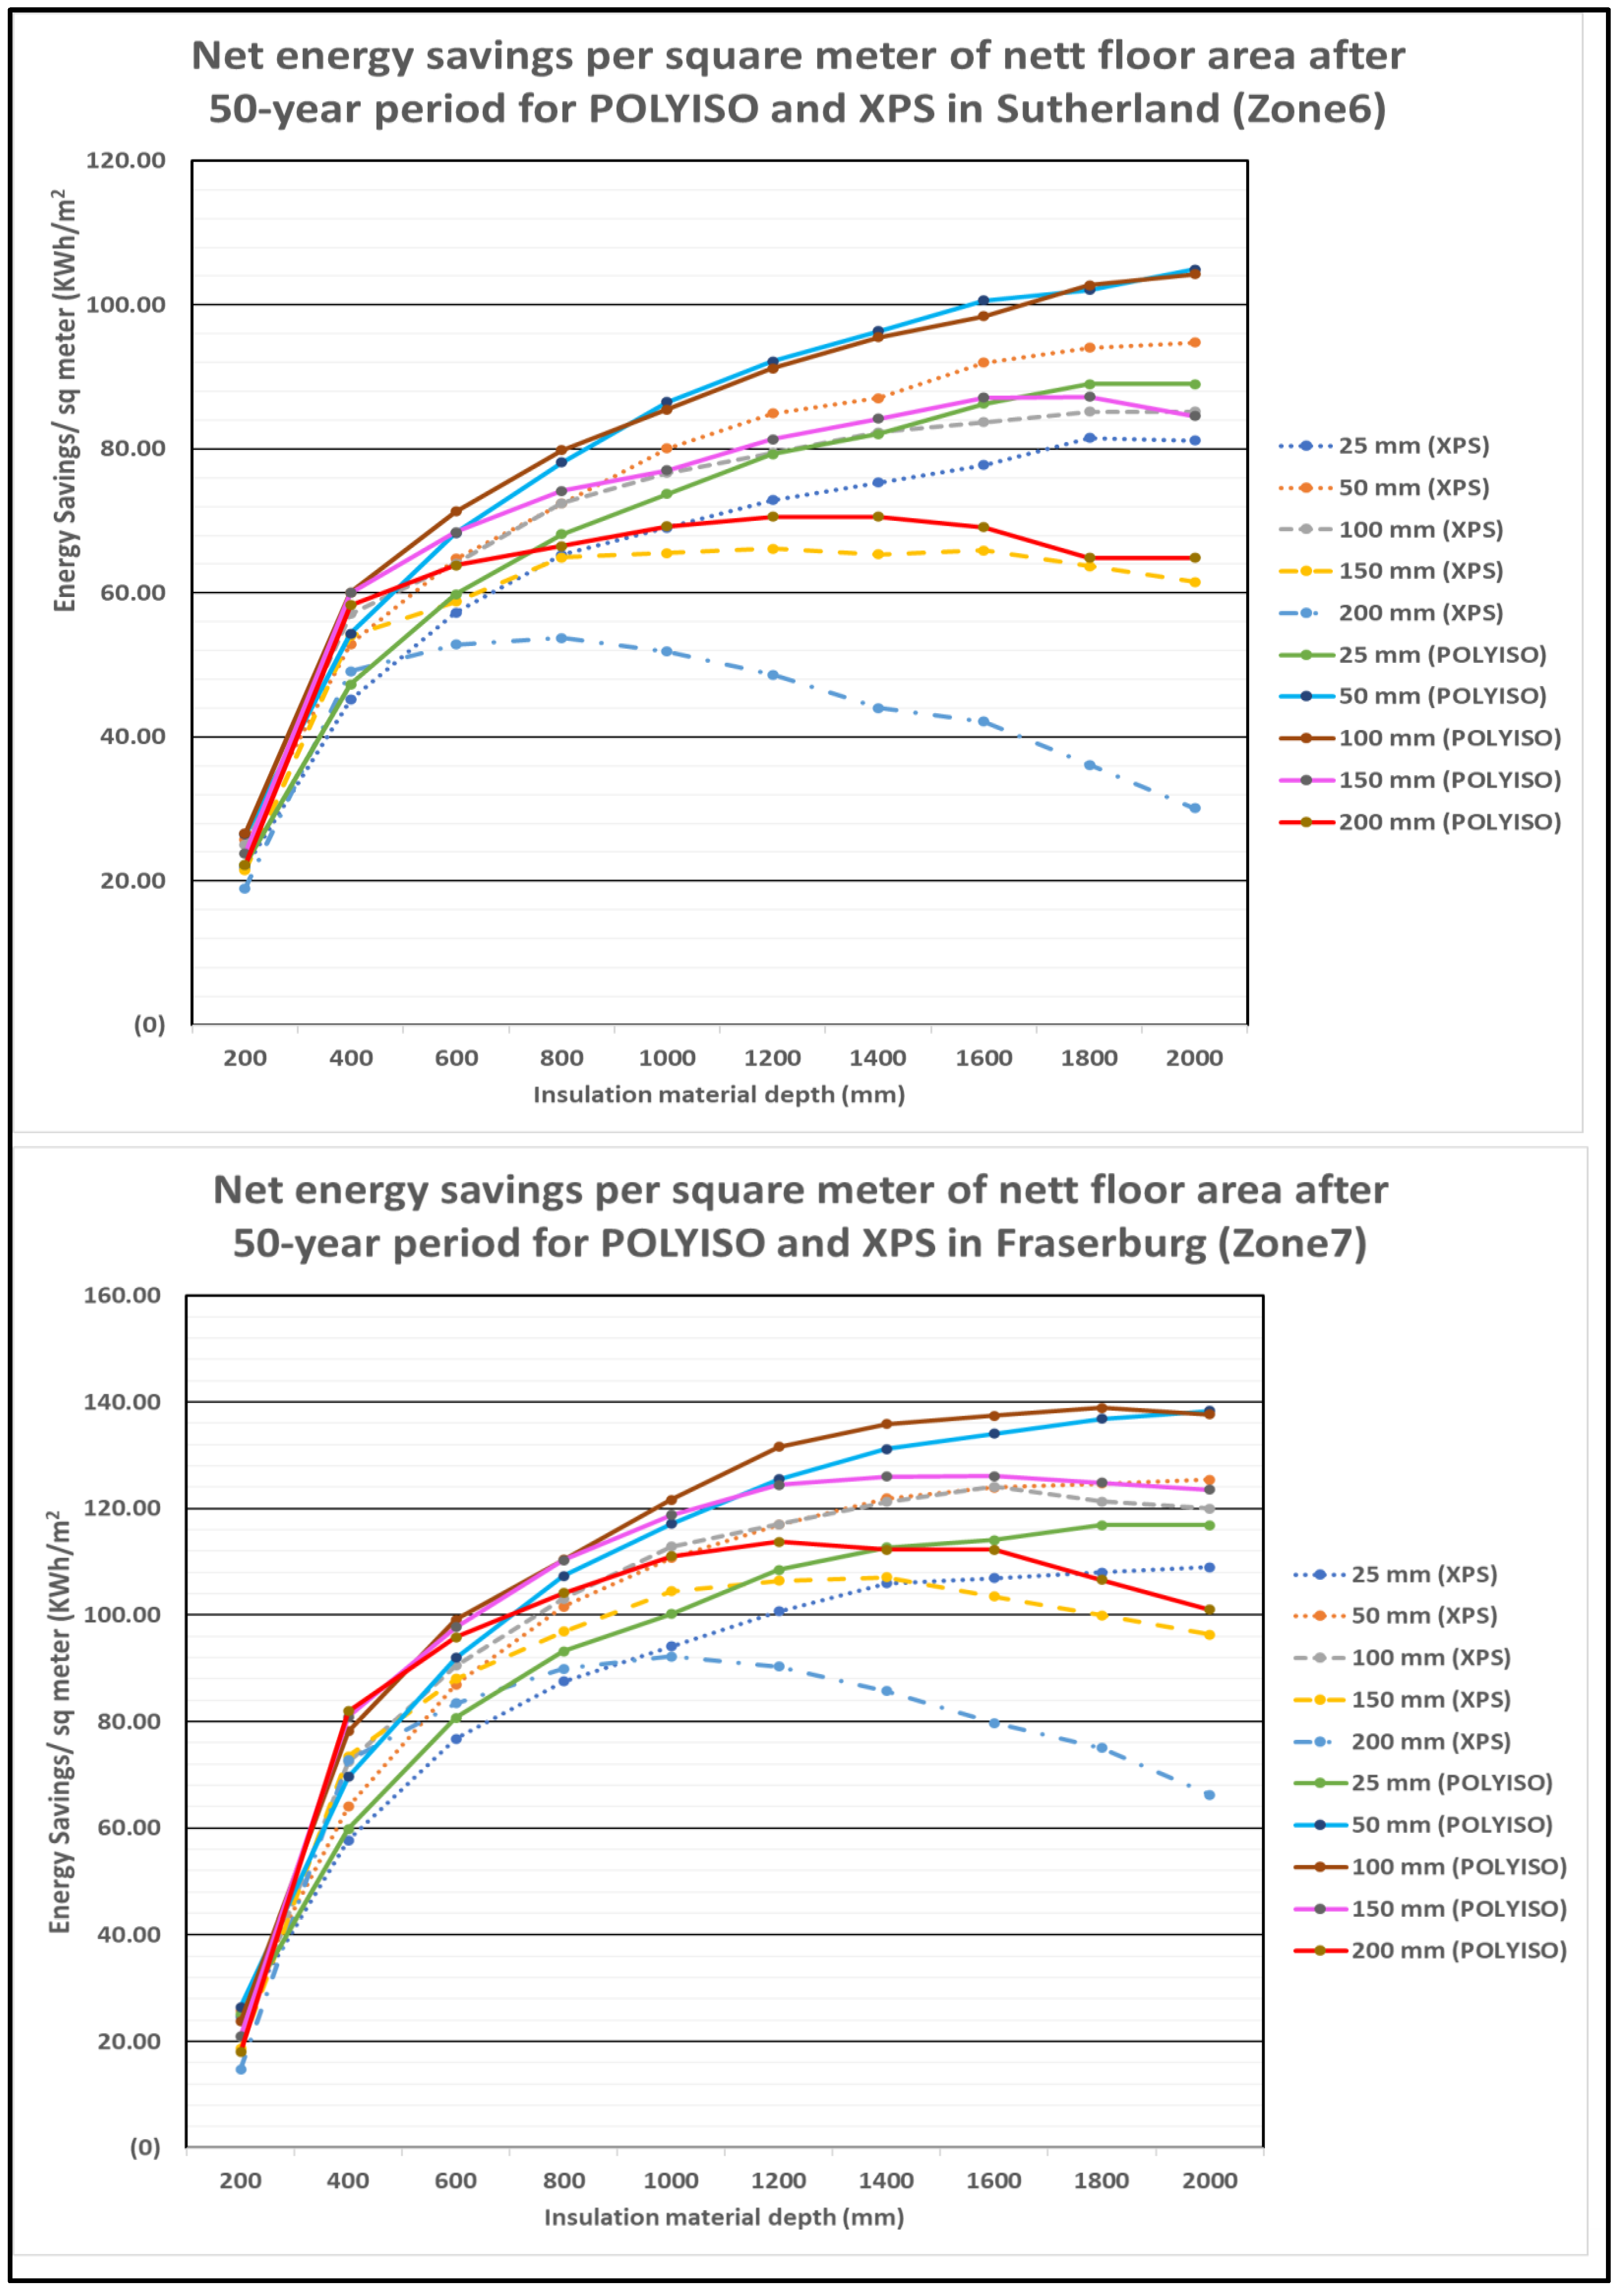
3.5. Net Saved Energy for Vertical Gap Insulation after 50 Years

Equation (6) was used to evaluate the net saved energy after 50 years. Only the results for maximum and minimum net energy savings are presented in Table 4.

3.5.1. Minimum and Maximum Values per Energy Zone

Table 4 below shows the minimum and maximum net energy saving per m2 of net floor area after 50 years for the insulation materials and the energy zones.
The results indicate that the maximum net energy savings are not necessarily achieved at the highest insulation thickness levels and appear to be influenced by the insulation type, insulation thickness, and the location or the energy zones.
The results also show that higher insulation thicknesses will lead to lower net energy savings. The results also show that lower insulation thicknesses (25 mm and below for XPS; 50 mm and below for polyiso or PIR) can be applied for all insulation depths without the risk of not acquiring positive net energy savings.
XPS: The maximum energy savings in Welkom (zone 1), Witbank (zone 2), Thohoyandou (zone 3), Pretoria (zone 5), Ixopo (zone 5H), Sutherland (zone 6), and Fraserburg (zone 7) occurred at a floor slab insulation thickness of 50 mm. The maximum energy savings in Cape Town (zone 4) occurred at a floor slab insulation thickness of 25 mm.
PIR (polyiso): The maximum energy savings in Welkom (zone 1), Witbank (zone 2), Ixopo (zone 5H), and Sutherland (zone 6) occurred at a floor slab insulation thickness of 50 mm. The maximum energy savings in Thohoyandou (zone 3), Pretoria (zone 5), and Fraserburg (zone 7) all occurred at a floor slab insulation thickness of 100 mm. However, the maximum energy savings in Cape Town (zone 4) occurred at a floor slab insulation thickness level of 25 mm.
Therefore, based on the net energy savings after 50 years, it is best to use polyiso (PIR) at insulation thicknesses of 25 mm, 50 mm, or 100 mm (depending on the energy zone) and to use XPS at insulation thicknesses of 25 mm (for zone 4) or 50 mm (for the rest of the energy zones).

3.5.2. General Results for Net Saved Energy after 50 Years Based on Zones

Figure 4, Figure 5, Figure 6 and Figure 7 represent data for the values of net saved energy per net floor area after 50 years for the seven energy zones of South Africa after the use of XPS and polyiso (PIR) for the floor slab insulation in the model. The results show that the choice of the best insulation material based on the highest net saved energy per m2 after 50 years may keep changing due to differences in location (zones), insulation thickness levels, and insulation depth levels.
Welkom (zone 1): In zone 1, under XPS insulation, the best insulation thickness at insulation depths ranging from 400 mm to 600 mm (0.4–0.6 m) was 150 mm XPS. At 800 mm (0.8 m) depth, the best XPS insulation thickness was 100 mm. At 1000 mm to 2000 mm (1.0–2.0 m) depth, the best XPS insulation thickness was 50 mm.
When polyiso (PIR) was used, the best insulation thickness at 400 mm (0.4 m) insulation depth, was 200 mm. At 600 mm (0.6 m) depth, the best thickness was 150 mm. From 800 mm to 1200 mm (0.8–1.2 m) depth, the best insulation thickness was 100 mm. From 1.4 to 2.0 m depth (1400–2000 mm), the best insulation thickness was 50 mm thick polyiso (PIR).
Witbank (zone 2): In zone 2, under XPS insulation, the best insulation thickness at insulation depths from 400 mm (0.4 m) to 1400 mm (1.4 m) was generally 50 mm. Above 1400 mm (1.4–2.0 m) depth, the best XPS insulation thickness was 25 mm.
When polyiso (PIR) was used, the best insulation thickness throughout most insulation depth levels above 400 mm was 50 mm. For a depth level of 2.0 m, the best insulation thickness was 25 mm.
These results show that when the insulation depth level is increased, the optimum thickness that maximizes net energy savings after 50 years reduces. Generally, zone 1 (Welkom) experiences greater energy savings than zone 2 (Witbank) for the same insulation thickness levels and insulation depths.
Optimal points: Since the maximum energy payback periods for Welkom in zone 1 (29.5 years for all insulation thicknesses) and Witbank in zone 2 (43.5 years for thicknesses up to 150 mm) for both insulations was less than 50 years, the highest maximum energy savings in Welkom (zone 1) that also allow for a payback period smaller than 50 years correspond to the use of polyiso (PIR) at 50 mm thickness and a depth of 2000 mm (2.0 m), with a payback period of 8.80 years, corresponding to net energy savings of 127.16 KWh/m2. The highest maximum energy savings in Witbank (zone 2) that also allow for a payback period smaller than 50 years correspond to the use of polyiso (PIR) at 25 mm thickness and a depth of 2000 mm (1.8 m), with a payback period of 10.17 years, corresponding to net energy savings of 54.28 KWh/m2.
Thohoyandou (zone 3): These results also show that when the insulation depth level is increased, then the optimum thickness that maximizes net energy savings after 50 years reduces. Thohoyandou (zone 3) experienced greater energy savings than Cape Town (zone 4) for the same insulation thickness levels and insulation depths.
For XPS, the best insulation thickness at 400 mm was 200 mm; at 600 mm depth, optimum thickness was 150 mm; 800 mm to 1400 mm depth, the best insulation thickness was 100 mm; Above 1400 mm insulation depth, the best thickness was 50 mm.
Under polyiso (PIR), the best insulation thickness up to 800 mm insulation depth was 200 mm; From 1000 to 2000 mm insulation depth, the best insulation thickness was 100 mm.
Cape Town (zone 4): Cape Town had the lowest energy savings per m2 net floor area. With the exception of XPS at 25 mm thickness and polysio at 25- and 50 mm thicknesses, the energy savings were generally negative for other levels of insulation thicknesses, and became more negative with the increase in insulation depth. Therefore, if vertical perimeter insulation is to be used in zone 4, it should be used at very low levels of insulation thicknesses for both XPS and polyiso (PIR).
Optimal points: Since the maximum energy payback periods for Thohoyandou (zone 3) for both insulation materials was less than 50 years, the highest maximum energy savings in zone 3 that also allow a payback period less than 50 years correspond to the use of polyiso (PIR) at 100 mm thickness and a depth of 1800 mm (1.8 m). The payback period is 11.47 years. It corresponds to net energy savings of 163.92 KWh/m2. The maximum payback periods for polyiso (PIR) at 25 mm thickness in Cape Town (zone 4) is 35.58 years (less than 50 years). Therefore, it is still possible to use 25 mm thick polyiso (PIR) at an insulation depth of 2.0 m, leading to net energy savings of 5.61 KWh/m2. However, these net energy savings are quite low, rendering the application of the insulation almost non-beneficial.
Figure 6 shows the net energy savings per m2 of net area in Pretoria (zone 5) and Ixopo (zone 5H).
Pretoria (zone 5): The results for Pretoria (zone 5) in Figure 6 also show that when the insulation depth level was increased, then the optimum thickness that maximized the net energy savings after 50 years reduced.
Under XPS, the best insulation thickness at 400 mm insulation depth was 200 mm; at 600 mm, optimum thickness was 150 mm; 800–1600 mm depth, the best thickness was 100 mm; above 1600 mm depth, the best thickness was 50 mm.
Under polyiso (PIR), the best insulation thickness for insulation depths ranging from 400 to 600 mm was 200 mm; at insulation depth of 800 mm, the best thickness was 150 mm; at depths from 1000 mm to 1800 mm, the best thickness was 100 mm; at insulation depth of 2000 mm, best thickness was 50 mm.
Ixopo (zone 5H): In zone 5H, under XPS, the best insulation thickness at 400 mm insulation depth was 100 mm; From 600 to 2000 mm insulation depth, the best insulation thickness was 50 mm.
Under polyiso (PIR), the best insulation thickness for an insulation depth of 400 mm was 200 mm. For an insulation thickness depth of 600 mm, the best insulation thickness was 100 mm. The best insulation thickness for insulation depths ranging from 800 to 2000 mm was 50 mm.
Optimal points: Since the maximum energy payback periods for Pretoria (zone 5) and Ixopo (zone 5H) for 25 mm and 50 mm thick polyiso (PIR) was less than 50 years, the highest maximum energy savings in zone 5 that also allow a payback period less than 50 years correspond to the use of polyiso (PIR) at 100 mm thickness and a depth of 1800 mm (1.8 m). The payback period is 10.84 years. It corresponds to net energy savings of 176.23 KWh/m2. The highest maximum energy savings in zone 5H that also allow a payback period less than 50 years correspond to the use of polyiso (PIR) at 50 mm thickness and a depth of 1800 mm (1.8 m). The payback period is 11.13 years. It corresponds to net energy savings of 85.38 KWh/m2.
The Sutherland (zone 6) and Fraserburg (zone 7) results in Figure 7 also show that when the insulation depth level was increased, the optimum thickness that maximized the net energy savings per m2 of net floor area after 50 years was reduced.
Sutherland (zone 6): Under XPS, the best insulation thickness at 400 mm insulation depth was 100 mm. The best insulation thickness from 600 mm to 2000 mm insulation depth was 50 mm.
Under polyiso (PIR), the best insulation thickness for insulation depths ranging 400 mm to 800 mm was 100 mm. For insulation thickness depths of 1000 mm to 2000 mm, the best insulation thickness was generally 50 mm.
Fraserburg (zone 7): Under XPS, the best insulation thickness at 400 mm insulation depth was 150 mm. Generally, the best insulation thickness from 600 mm to 1600 mm insulation depth was 100 mm. From 1800 to 2000 mm insulation depth, the best insulation thickness was 50 mm.
Under polyiso (PIR), the best insulation thickness for an insulation depth of 400 mm was 200 mm. For insulation thickness depths of 600 mm to 1800 mm, the best insulation thickness was 100 mm. The best insulation thickness for insulation depths above 1800 up to 2000 mm was 50 mm.
Optimal points: The highest maximum energy savings in zone 6 that also allow for a payback period smaller than 50 years correspond to the use of polyiso (PIR) at 50 mm thickness and a depth of 2000 mm (2.0 m). The payback period is 10.29 years, corresponding to net energy savings of 104.92 KWh/m2. The highest maximum energy savings in zone 7 that also allow for a payback period smaller than 50 years correspond to the use of polyiso (PIR) at 100 mm thickness and a depth of 1800 mm (1.8 m). The payback period is 13.0 years, corresponding to net energy savings of 138.89 KWh/m2.
General patterns: Generally, Pretoria (zone 5), Sutherland (zone 6), Thohoyandou (zone 3), and Fraserburg (zone 7) corresponded to the highest net energy savings per m2 of net floor area after 50 years, in that order. Cape Town (zone 4), Witbank (zone 2), Ixopo (zone 5H), and Welkom (zone 1) corresponded to the lowest net energy savings per m2 of net floor area after 50 years, in that order. For all the locations under consideration, except Cape Town (zone 4), the net saved energy after 50 years also tended to initially increase with the level of insulation depth up to a maximum and then decreased at later insulation depth values. This phenomenon was especially pronounced at higher insulation thickness levels. At lower insulation thickness levels, there was a general increase in net energy savings with insulation depth, although the rate of increase decreased as the insulation depth increased. Therefore, the increase in insulation depths produced higher marginal benefits (in the form of net energy savings per m2 of net floor area) at lower levels of insulation depth. The increase in net energy savings with lower values of insulation thickness is generally in agreement with the work carried out by the authors of [22] in New Zealand, which showed that the R-Values generally reduced with an increase in insulation thickness.

3.6. Horizontal Perimeter Insulation (with Vertical Gap Insulation along Floor Slab Edges)

The method of insulation was changed to horizontal insulation (with gap insulation along the floor slab edges). Only PIR (polyiso) results are presented for some selected scenarios.

3.6.1. Site Energy Consumption per m2 Floor Area (Horizontal Insulation in General)

Table 5 shows the summarized site energy (and source energy in brackets) consumption statistics per net floor area for the building energy models used and the corresponding SANS10400-XA maximum site energy limits. The table applies both for horizontal perimeter floor slab insulation and horizontal full floor slab insulation. The output simulation results for horizontal insulation can be found in Table S2 as part of the supplementary material.
Just like the results for vertical gap insulation, the results for all the energy models used for horizontal floor slab insulation (including the full floor slab insulation) were within the acceptable SANS10400-XA site energy limits per m2 of net floor area.
Furthermore, all the loads (sum of heating and cooling loads) that were not met annually were less than 5%. The highest unmet loads again appeared to occur in energy zone 2, while the least, again, occurred in energy zones 1 and 7. The status and interpretations for the maximum, minimum, and standard deviations of the annual energy consumption were similar for those in Table 3 (for vertical gap insulation). Passive strategies (without horizontal insulation measures) were sufficient for the models to meet the SANS10400-XA standards, but more measures (apart from passive strategies and floor slab insulation) would still be needed to bring the low energy consumption models to net-zero status. The corresponding maximum energy consumption values are similar for both Table 3 and Table 5 because they occurred when no insulation was used. However, the minimum values differ because they indicate the lowest levels of energy consumption due to the application of insulation measures using vertical gap insulation on one hand and either horizontal with gap or full floor slab horizontal insulation on the other hand.
Therefore, all the models used for horizontal floor slab insulation measure analysis fulfilled the requirements of the SANS10400-XA standards.

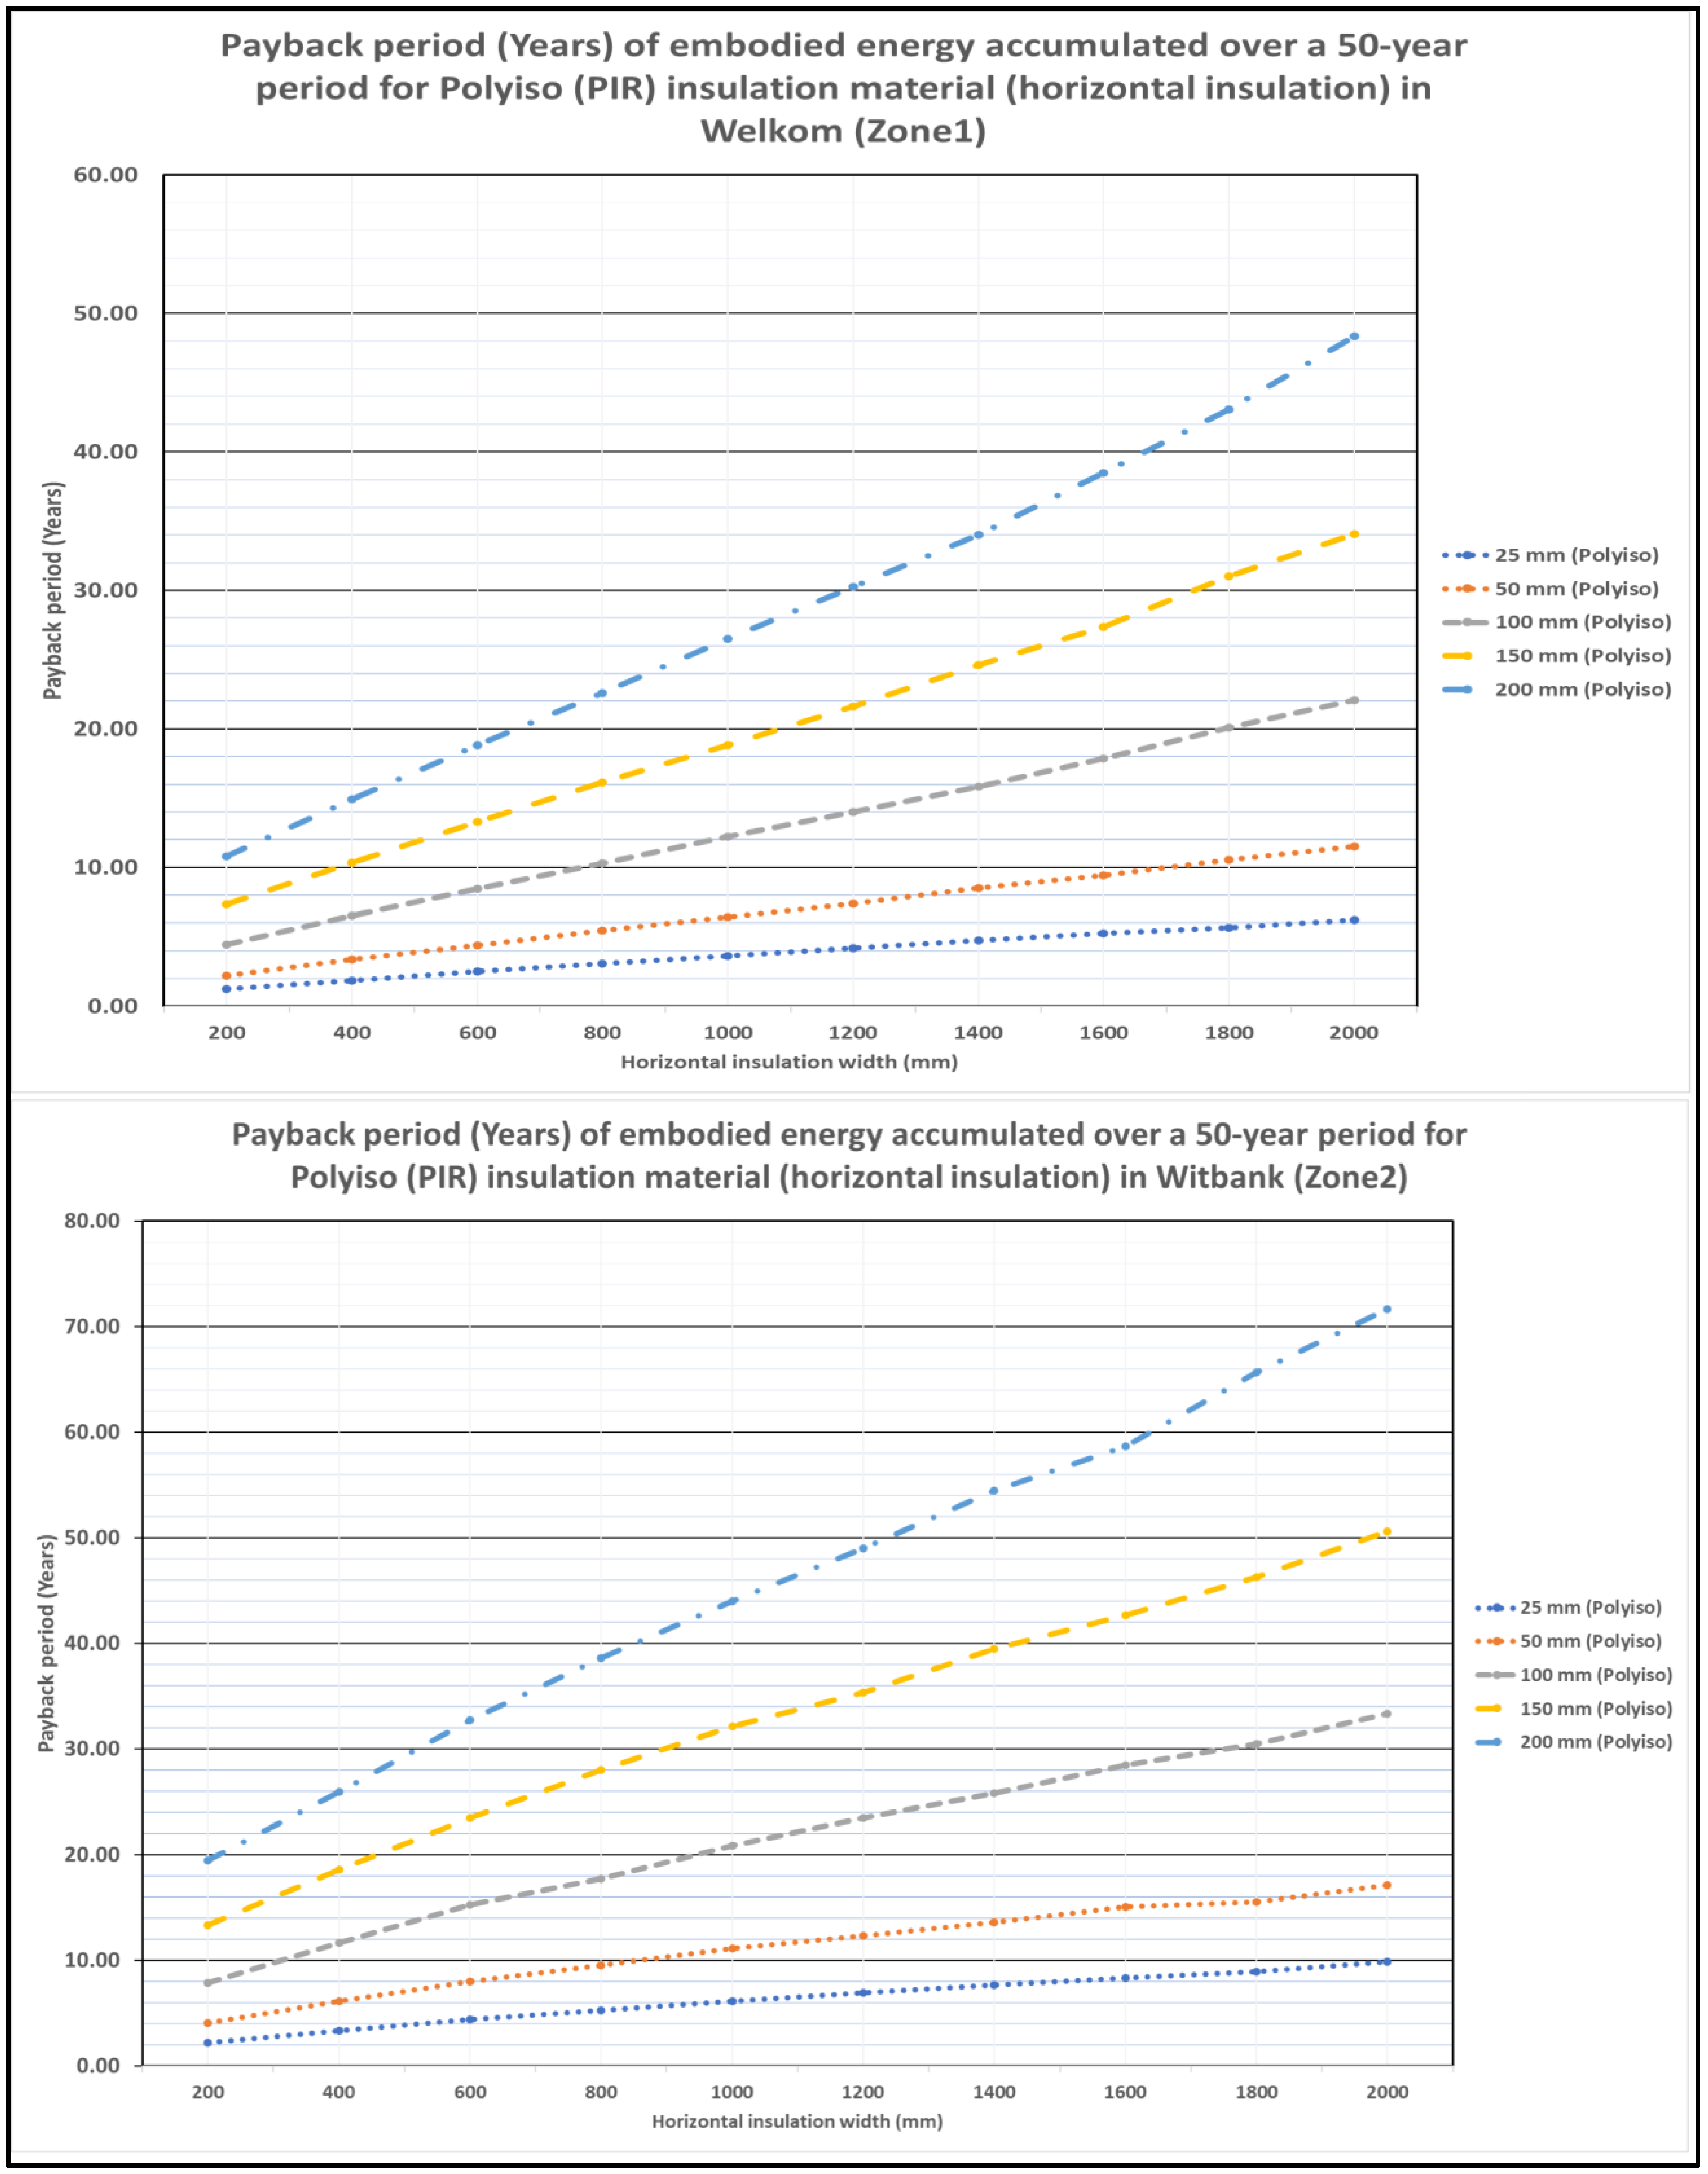
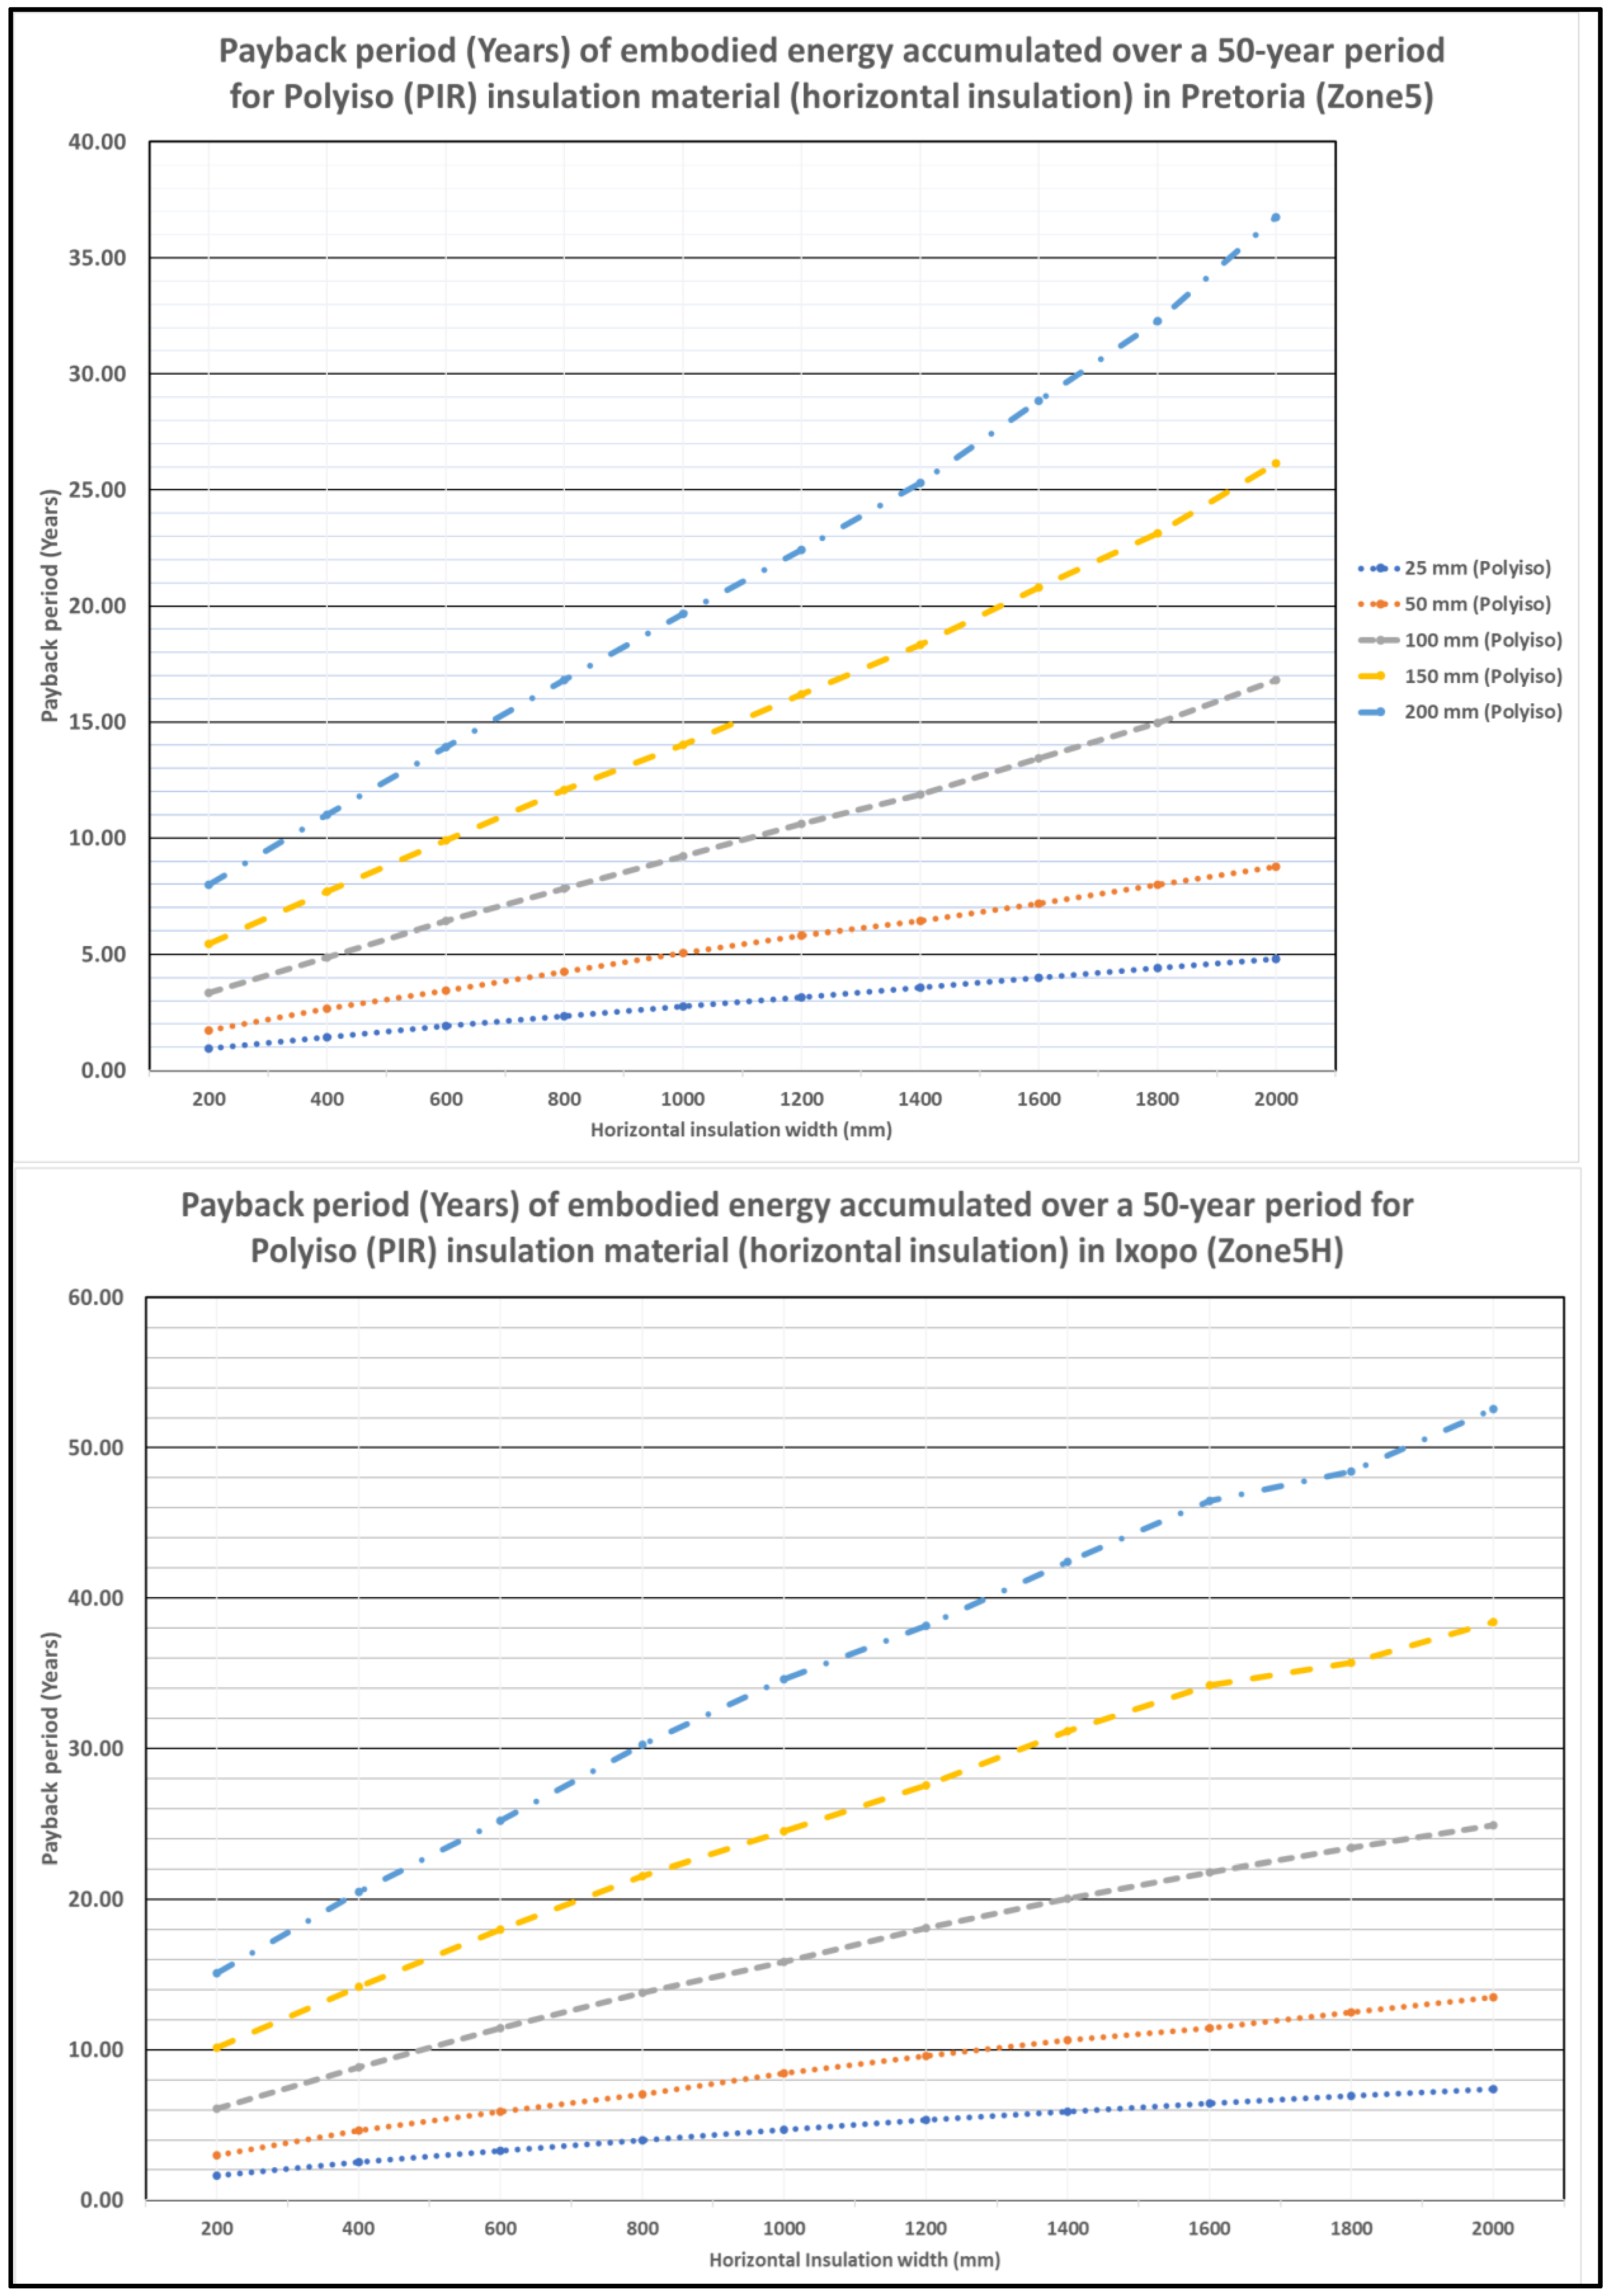
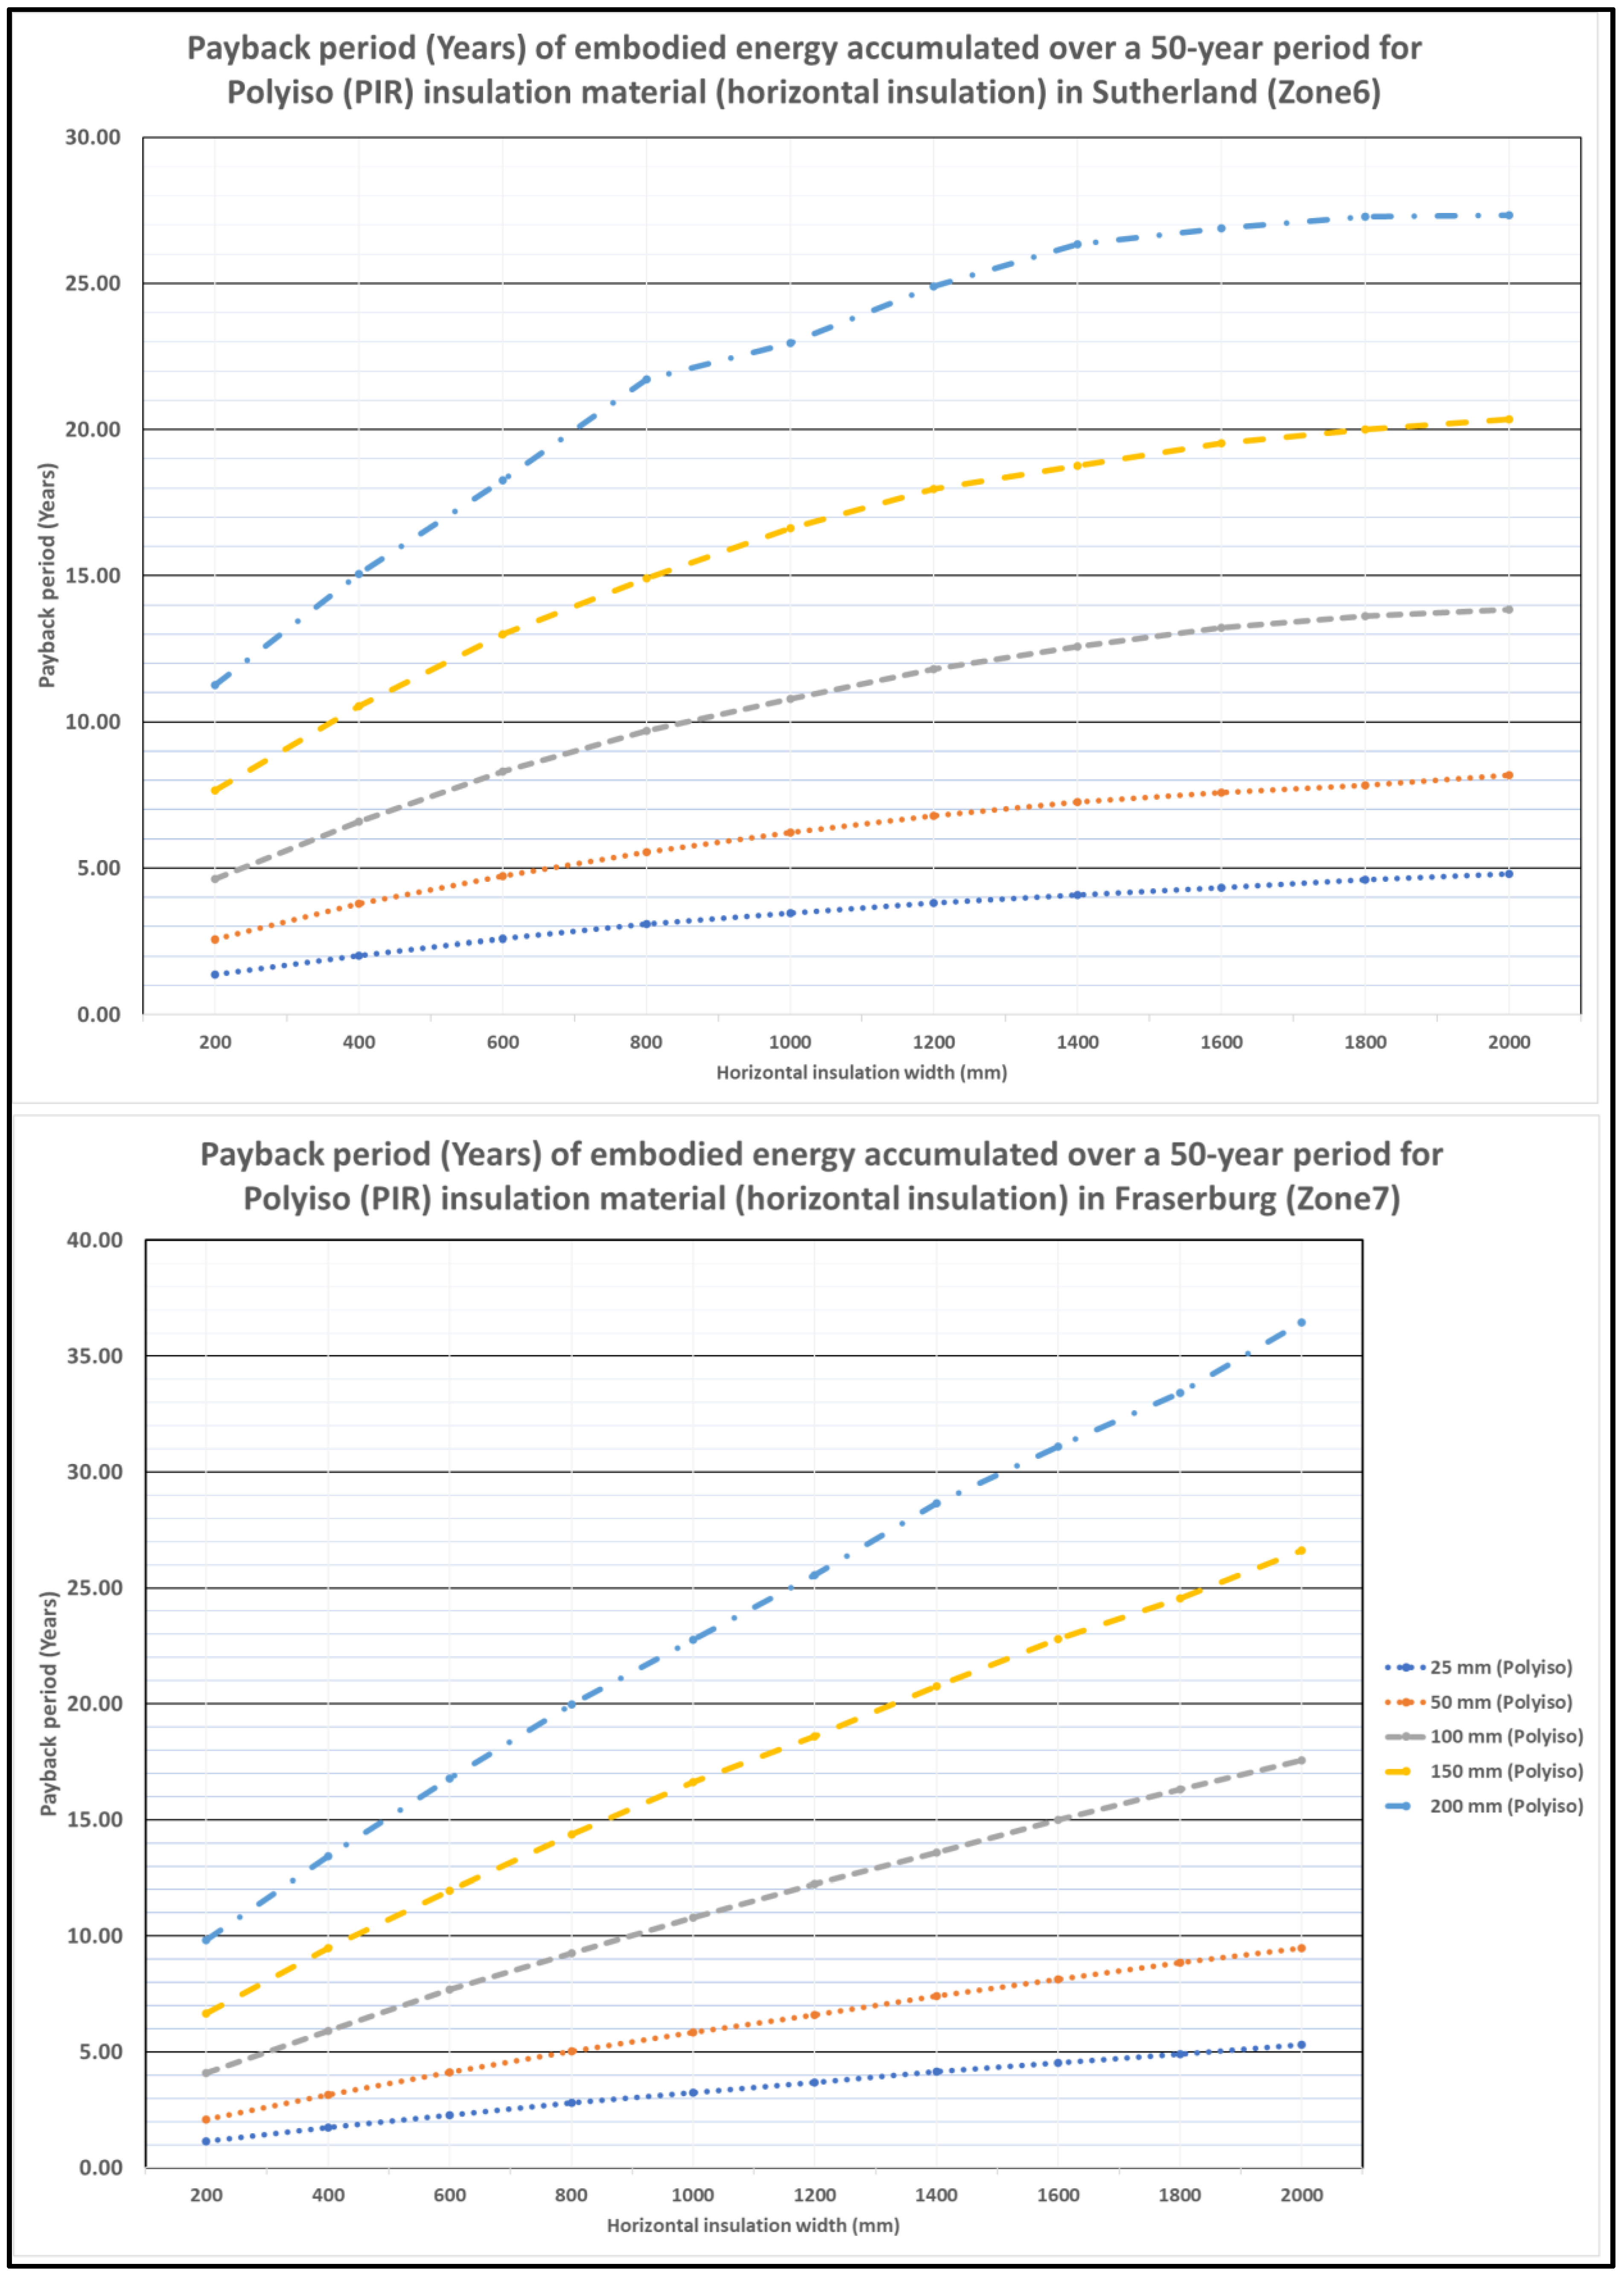
3.6.2. Payback Periods (Horizontal Perimeter Insulation)

The energy payback periods resulting from the application of horizontal insulation were evaluated across the different locations (energy zones). Figure A7, Figure A8, Figure A9 and Figure A10 in Appendix C show the results.
According to Figure A7, Figure A8, Figure A9 and Figure A10, the energy payback period increases with horizontal insulation thickness and width from the edges, except for zone 4. Although the payback period increases with insulation thickness in zone 4, it tends to decrease with horizontal insulation widths greater than 1.2 m and in cases where the thickness is greater than or equal to 200 mm. Therefore, if the thickness is 200 mm and above, it is better to use larger insulation widths (from the floor slab edges) in zone 4. Generally, the lowest payback periods for the horizontal floor slab insulation were experienced in zone 6, zone 7, zone 5, zone 3, zone 1, zone 5H, zone 2, and zone 4, in that order. Zone 4 had the highest payback periods.

3.6.3. Minimum and Maximum Values of Net Energy Savings after 50 Years

Table 6 below shows the minimum and maximum net energy saving per m2 of net floor area after 50 years for the PIR (polyiso) horizontal perimeter insulation and the energy zones.
The results also indicate that the maximum net energy savings are not necessarily achieved at the highest insulation thickness levels. The results also appear to be influenced by the location and the energy zones.
Just like for vertical gap insulation, these results for horizontal insulation show that lower net energy savings are obtained when higher insulation thickness values are used. Therefore, it is also safe to apply lower insulation thicknesses (50 mm and below for PIR) at all insulation width levels (200 mm to 2000 mm) in all the locations representing the energy zones to avoid the risk of incurring negative net energy savings. A higher insulation thickness of 100 mm can be applied in all the locations at all insulation widths, except in cape Town (zone 4), where it should be applied selectively.
The maximum energy savings for polyiso (PIR) occurred at 100 mm insulation thickness in all locations (zones), except for Cape Town (zone 4), where it occurred at 25 mm thickness. Cape Town had the lowest net energy savings, followed by Witbank (zone 2), zone 5H, zone 1, and zone 7, in that order. The greatest beneficiaries from the net energy savings after 50 years due to horizontal floor slab insulation were zone 5, zone 6, zone 3, zone 7, zone 1, zone 5H, zone 2, and zone 4, in that order.

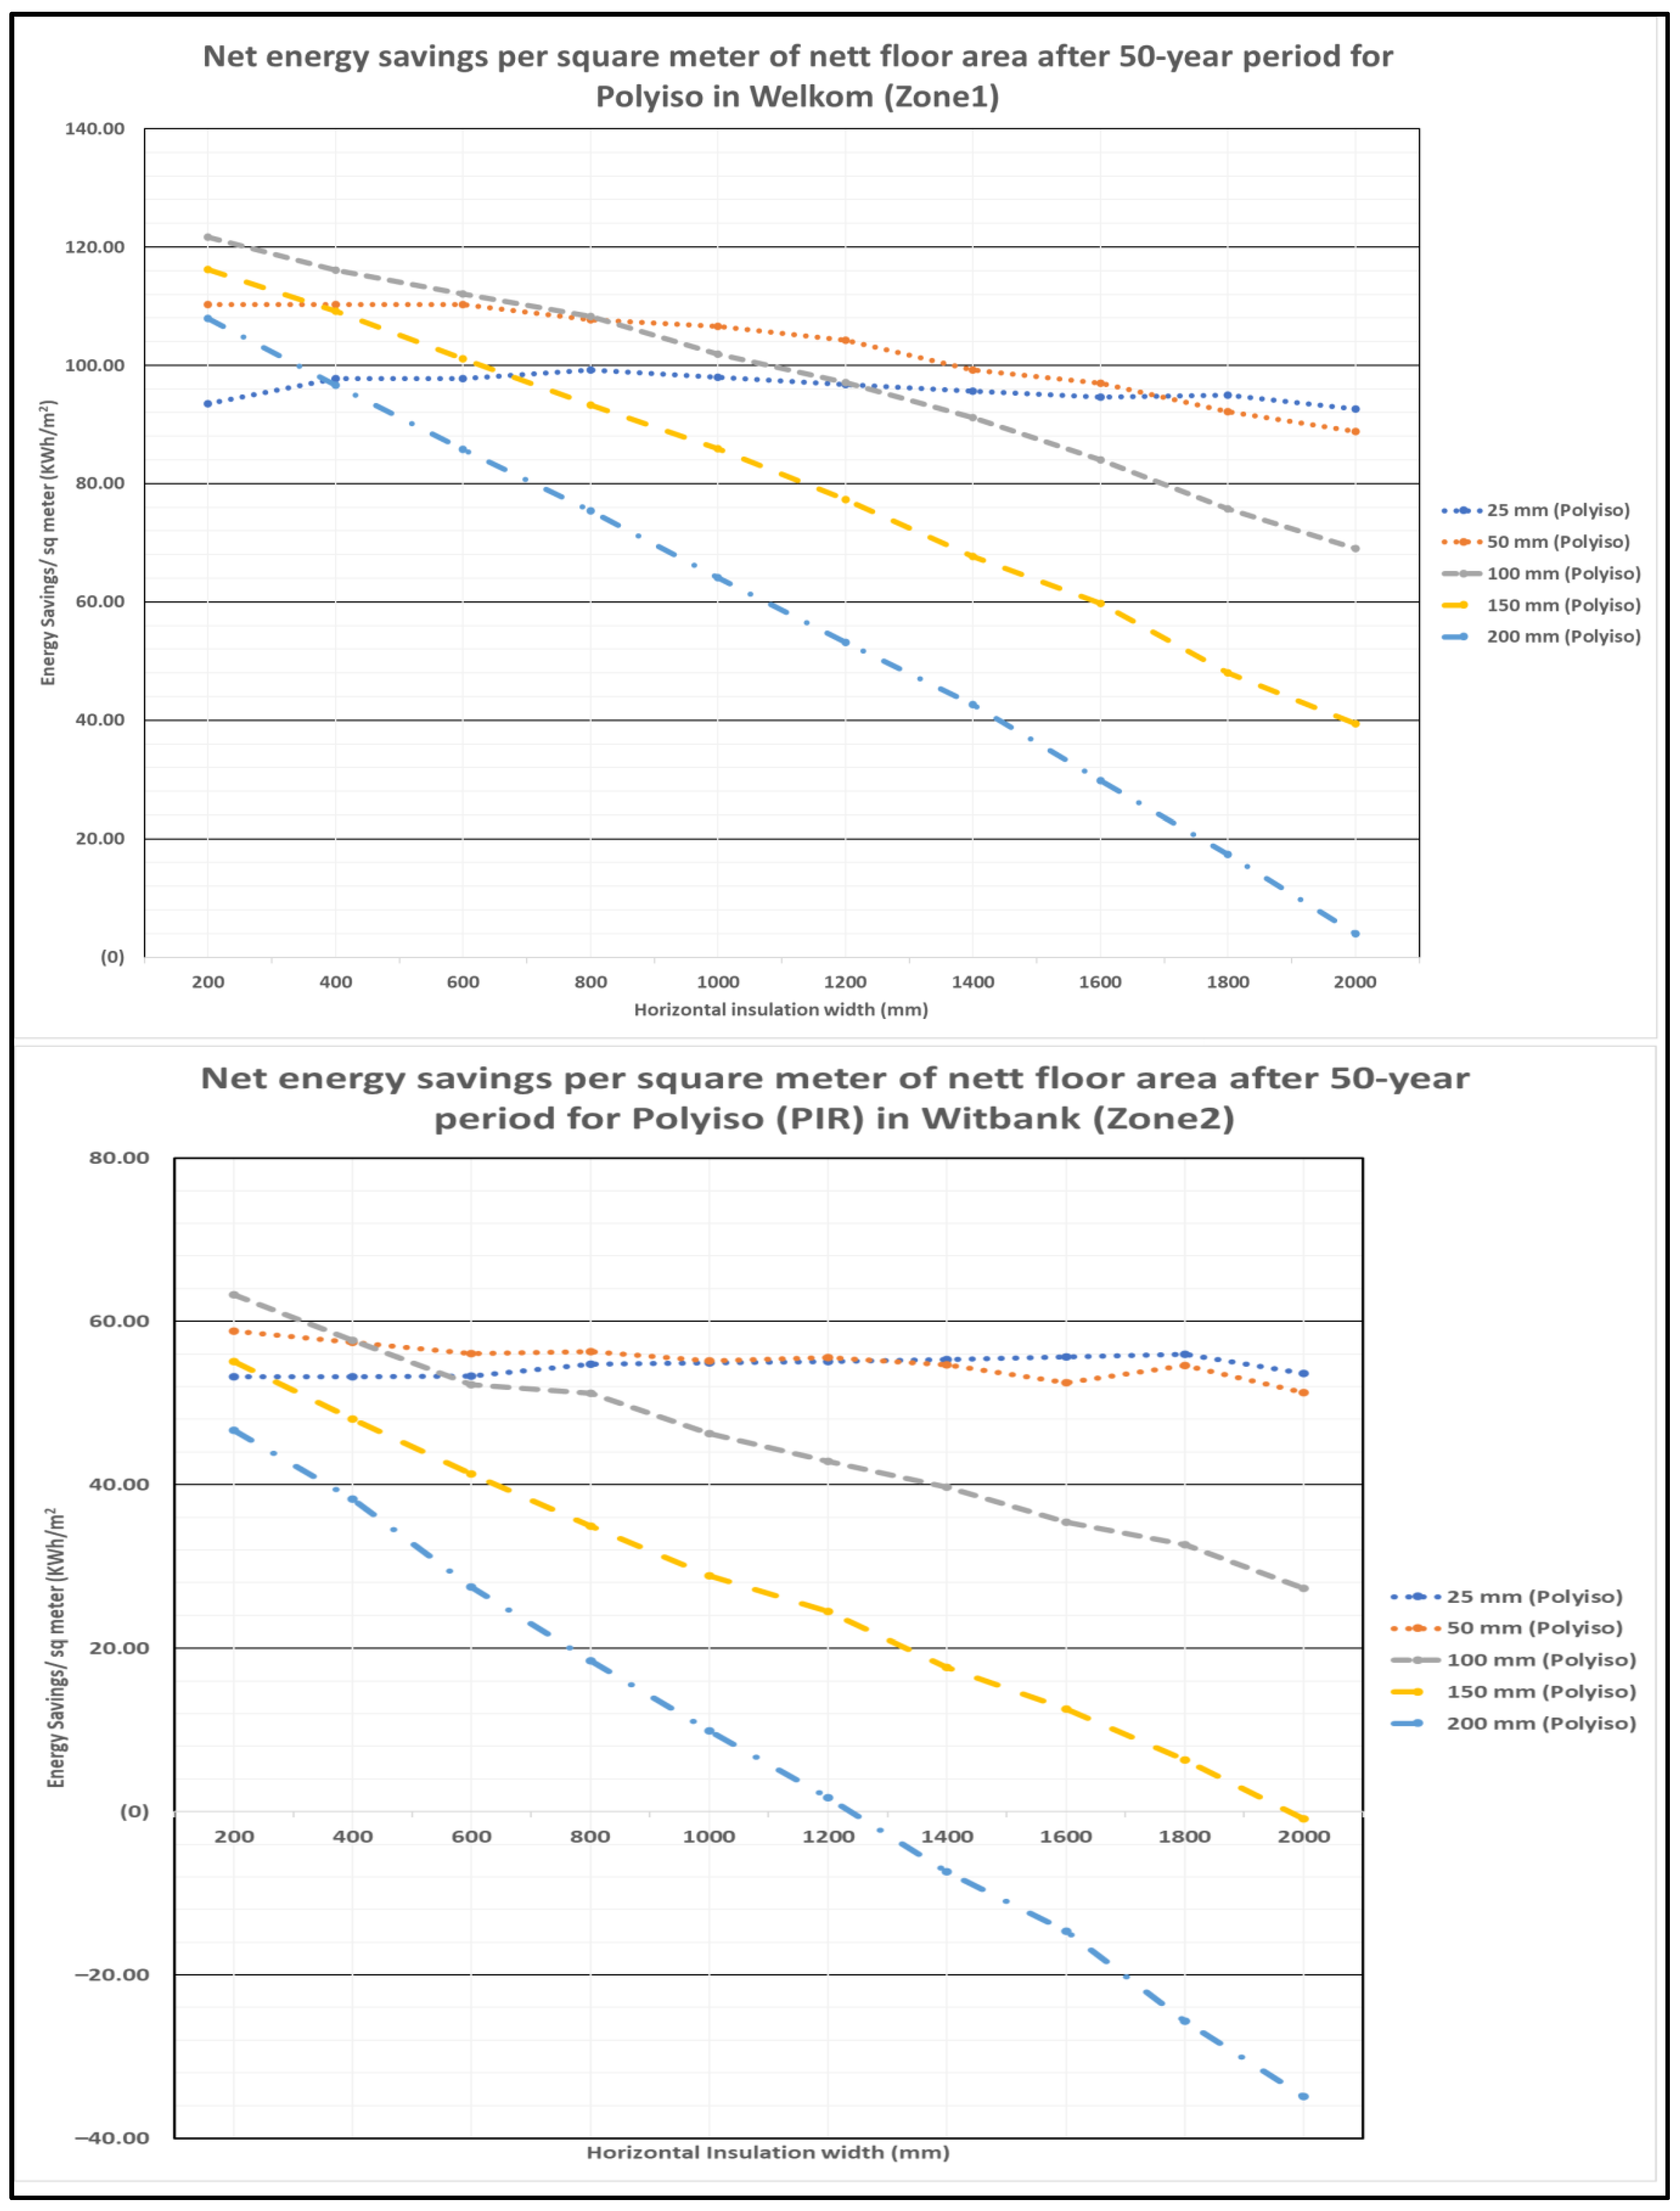
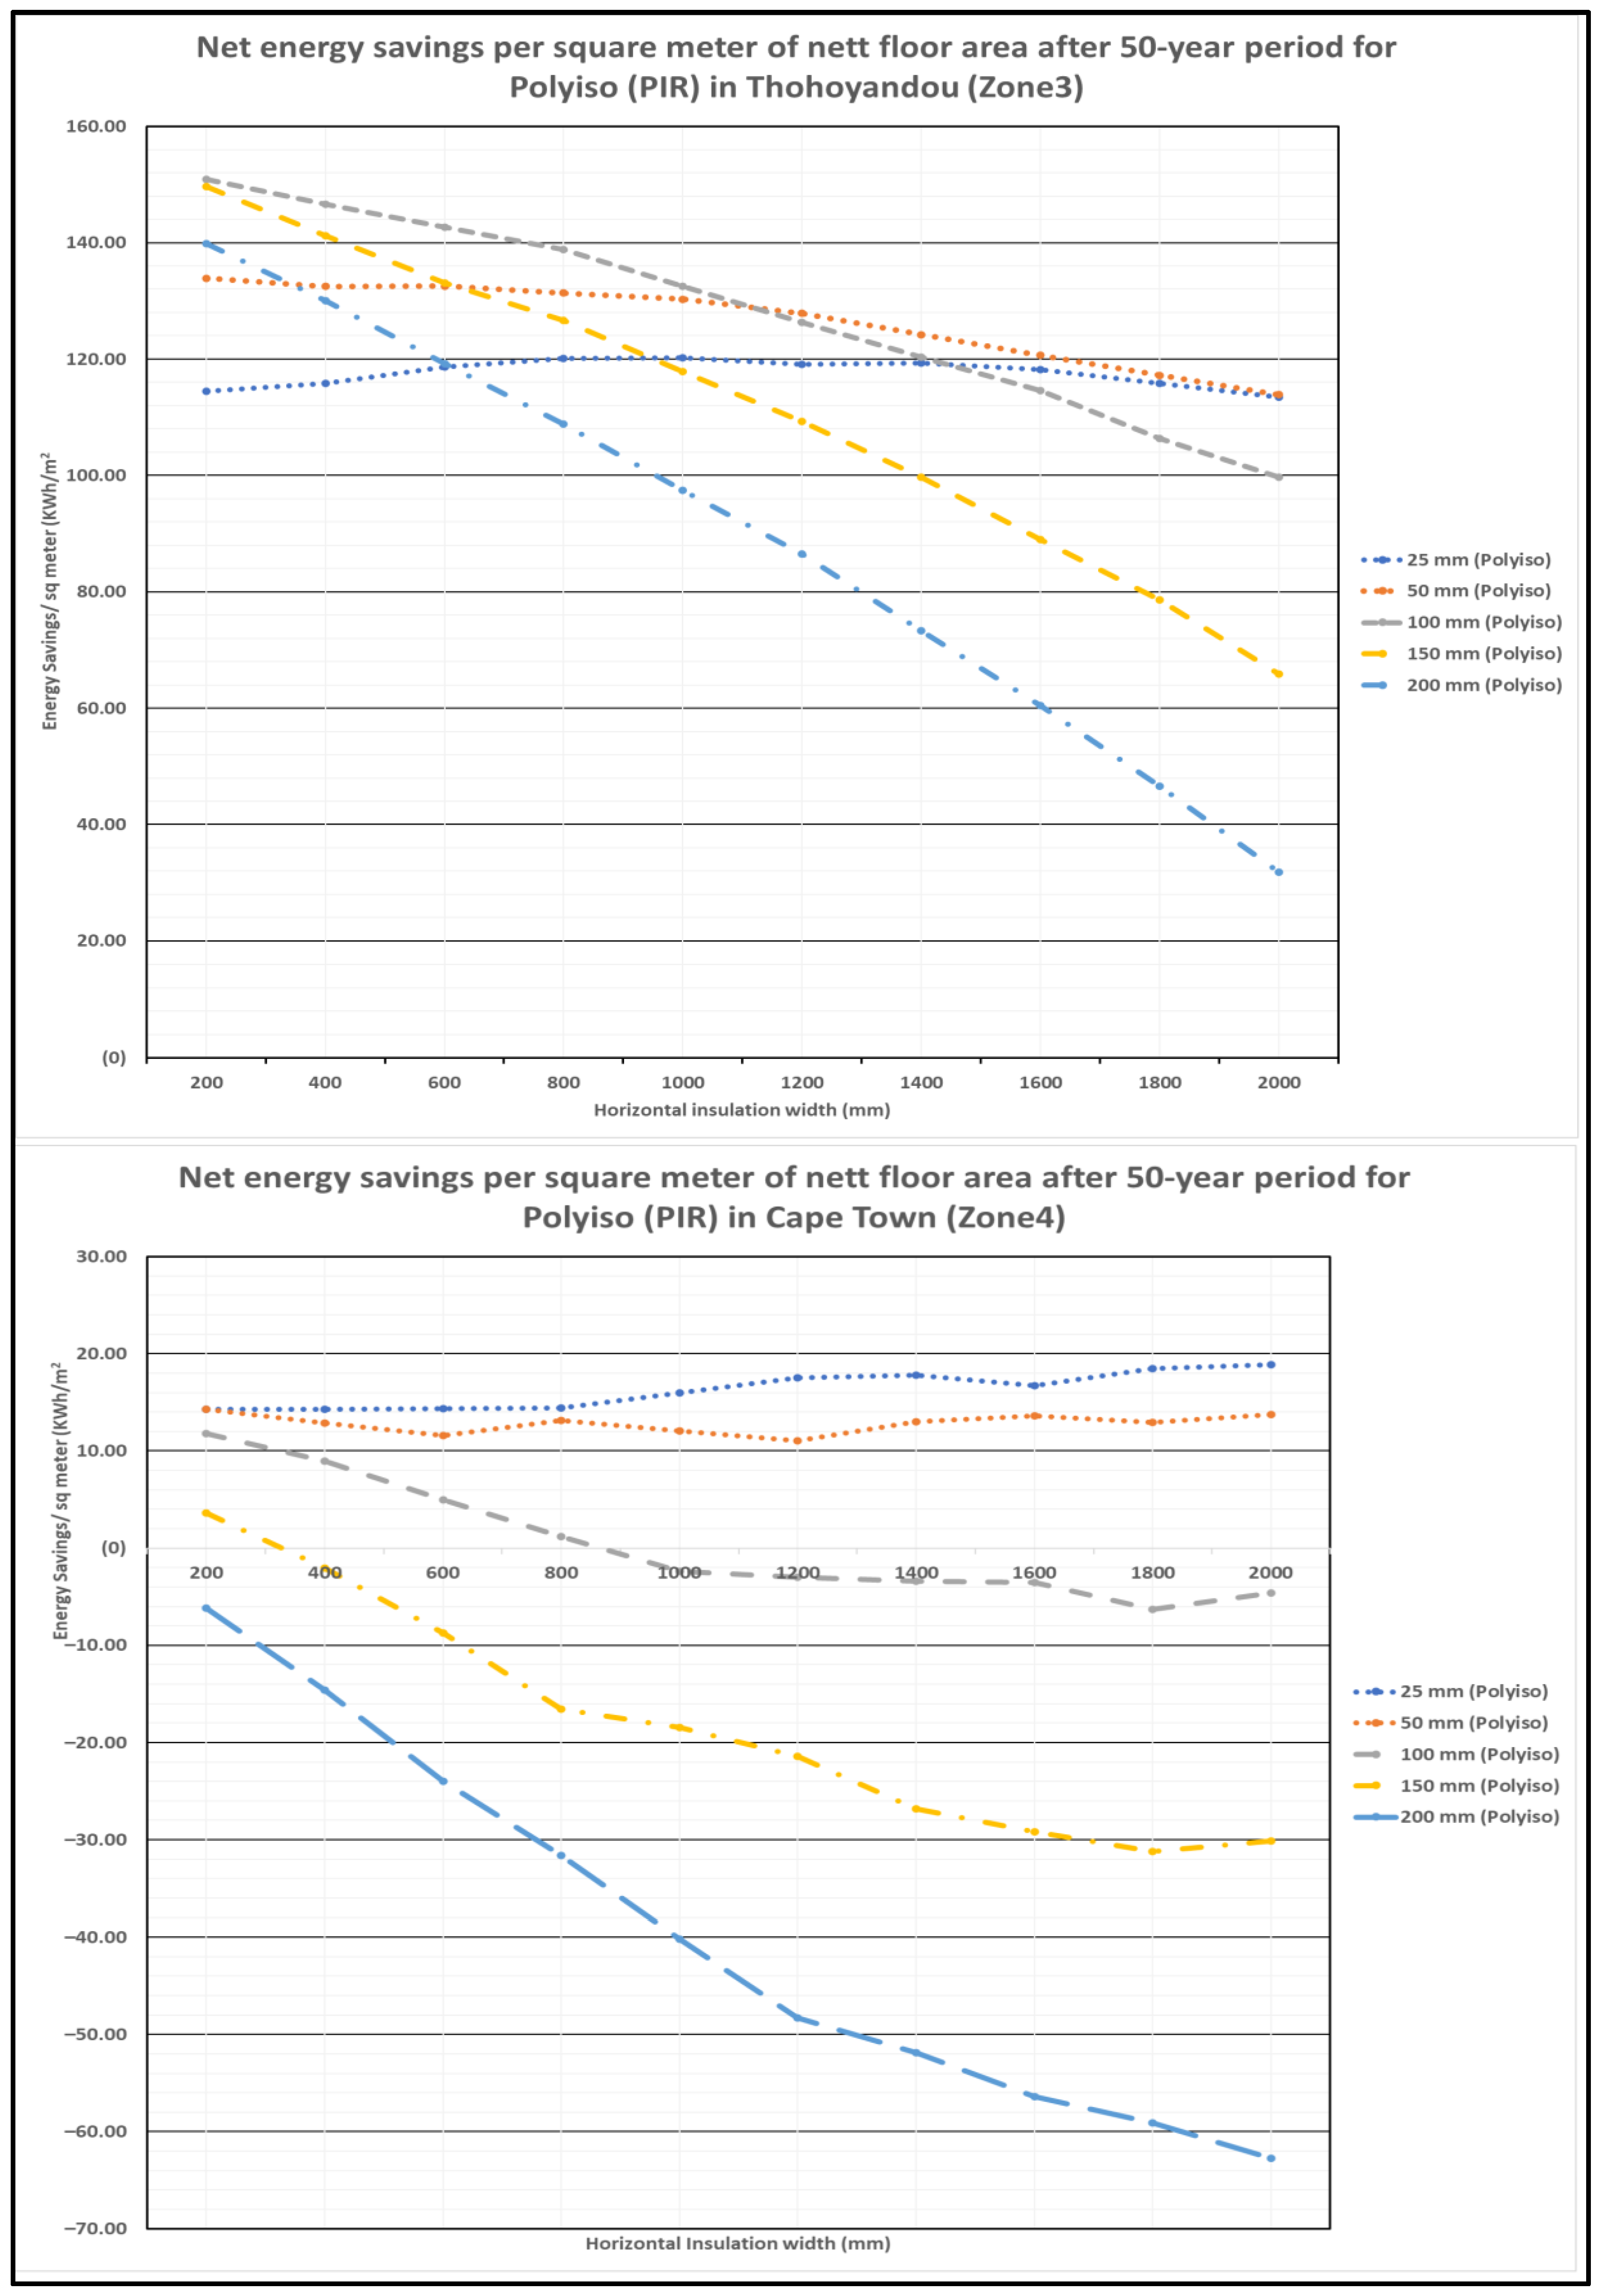
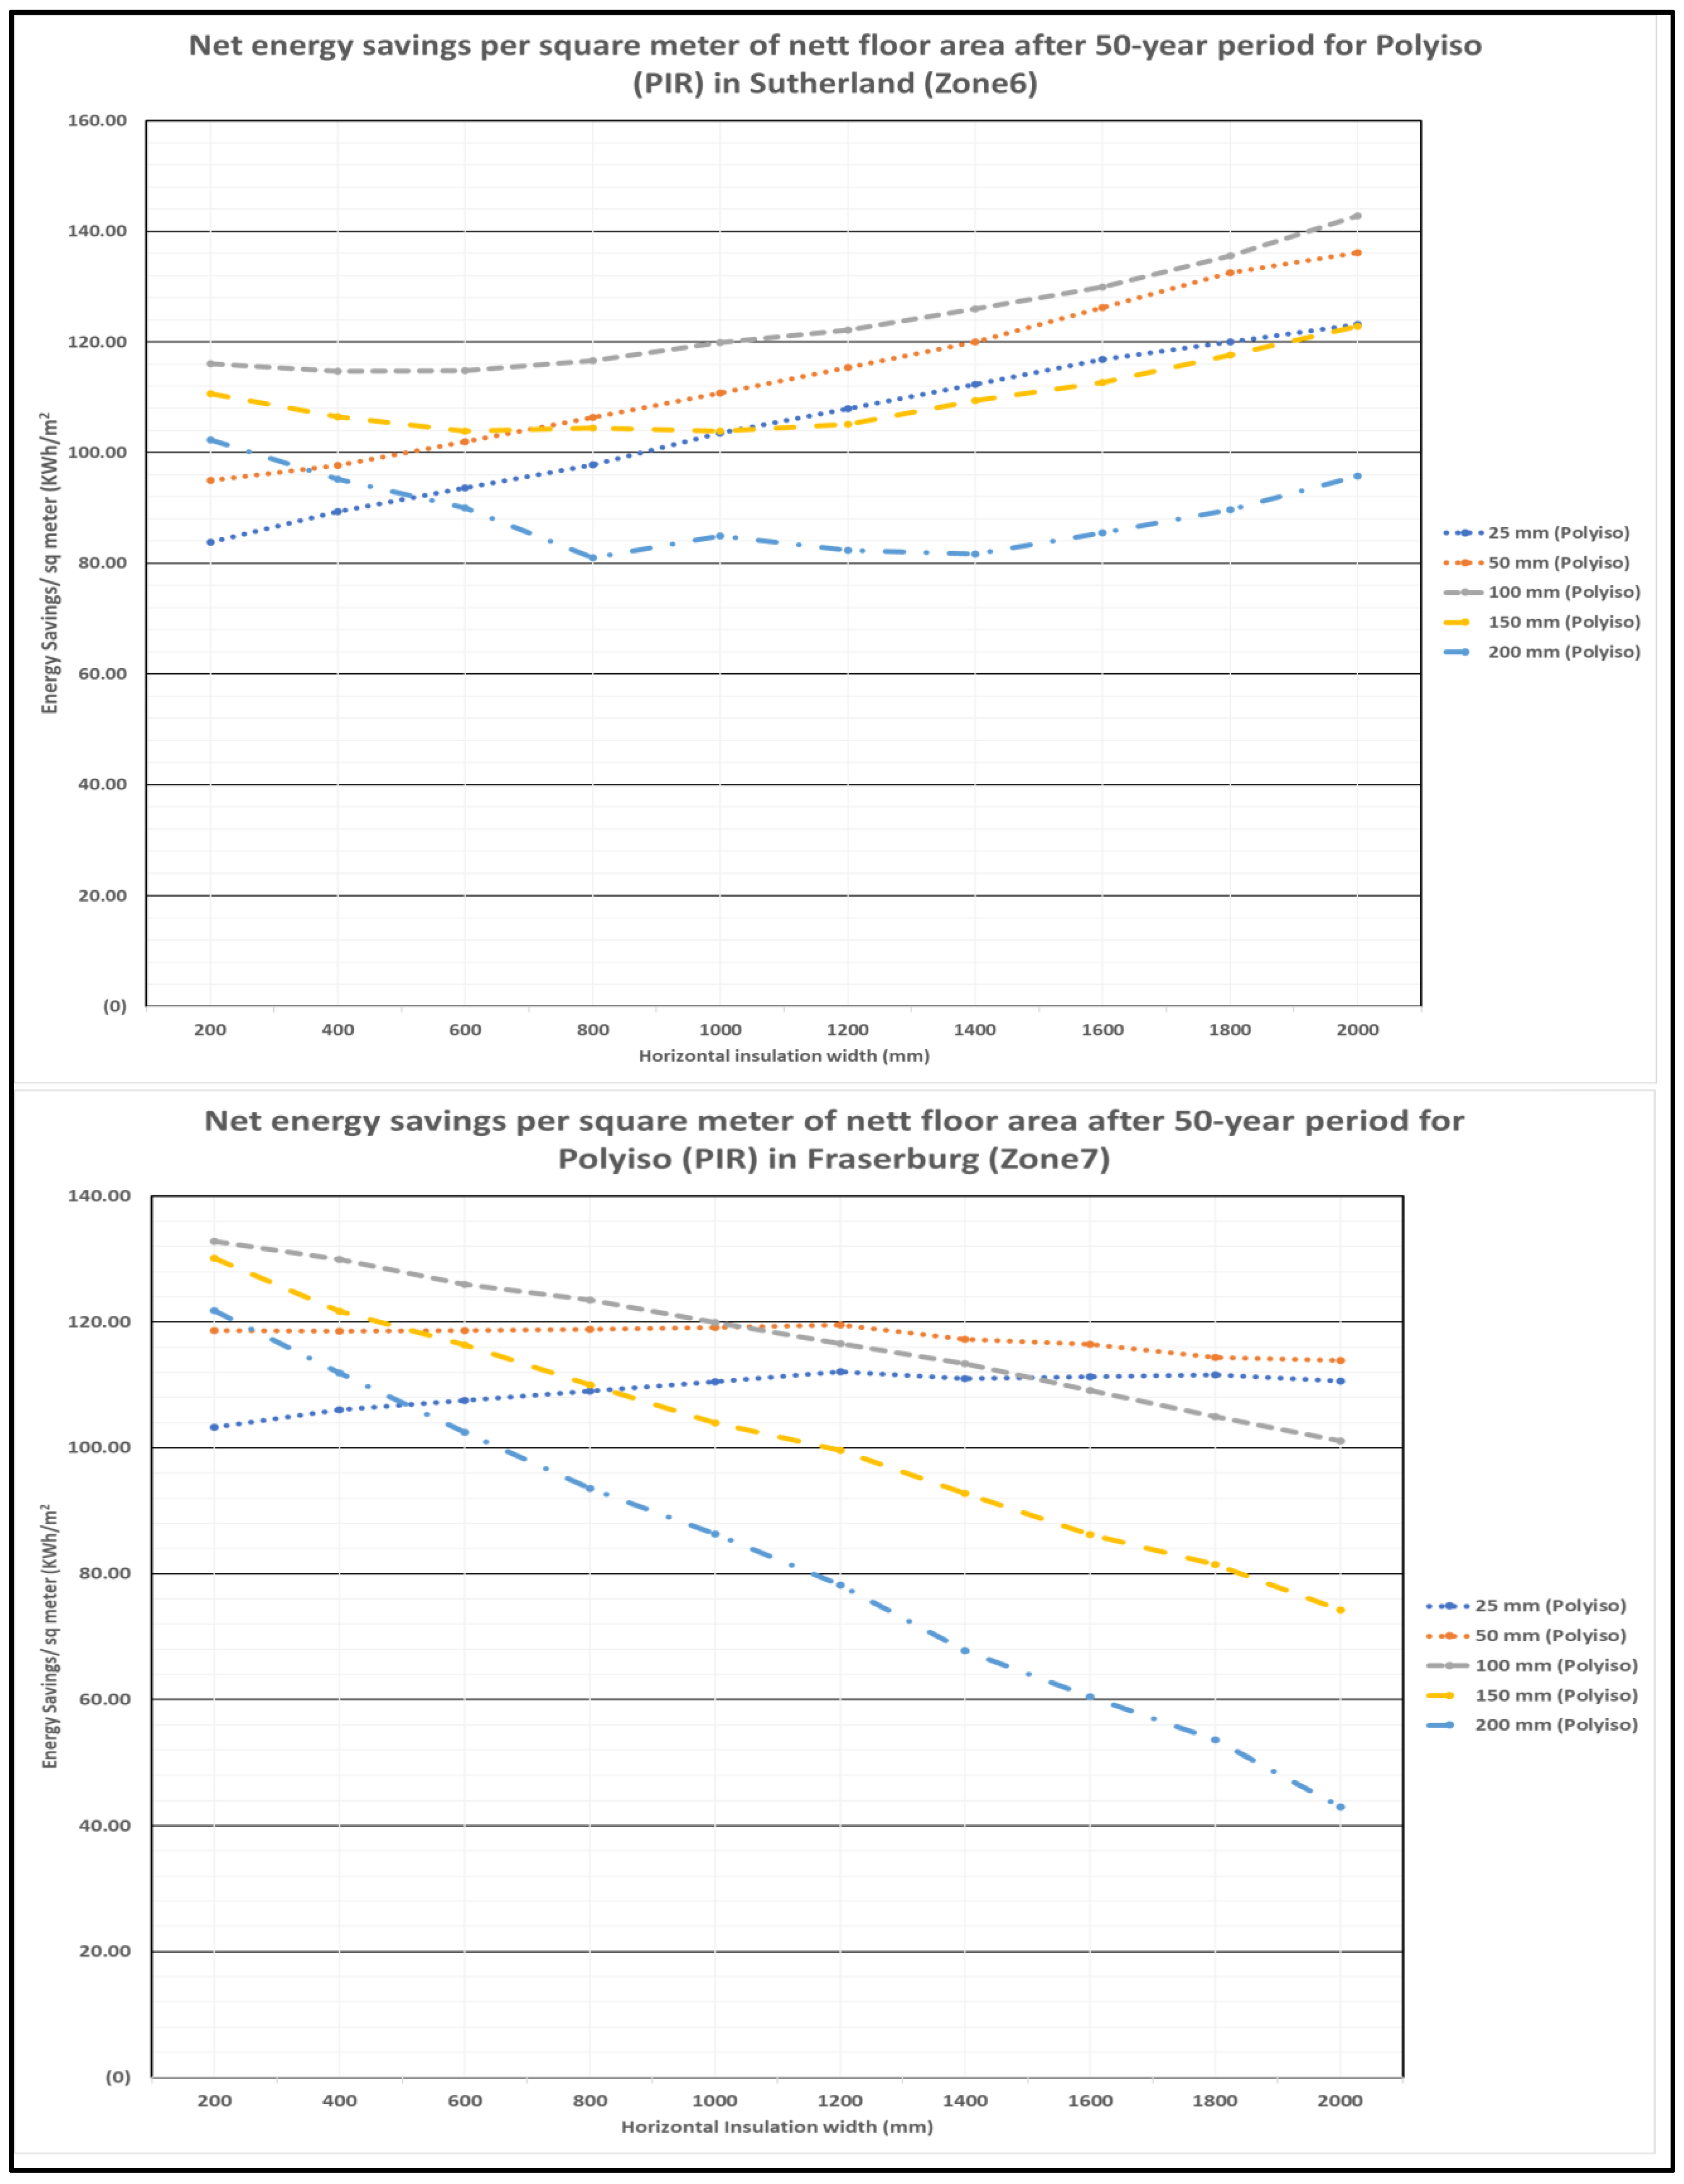
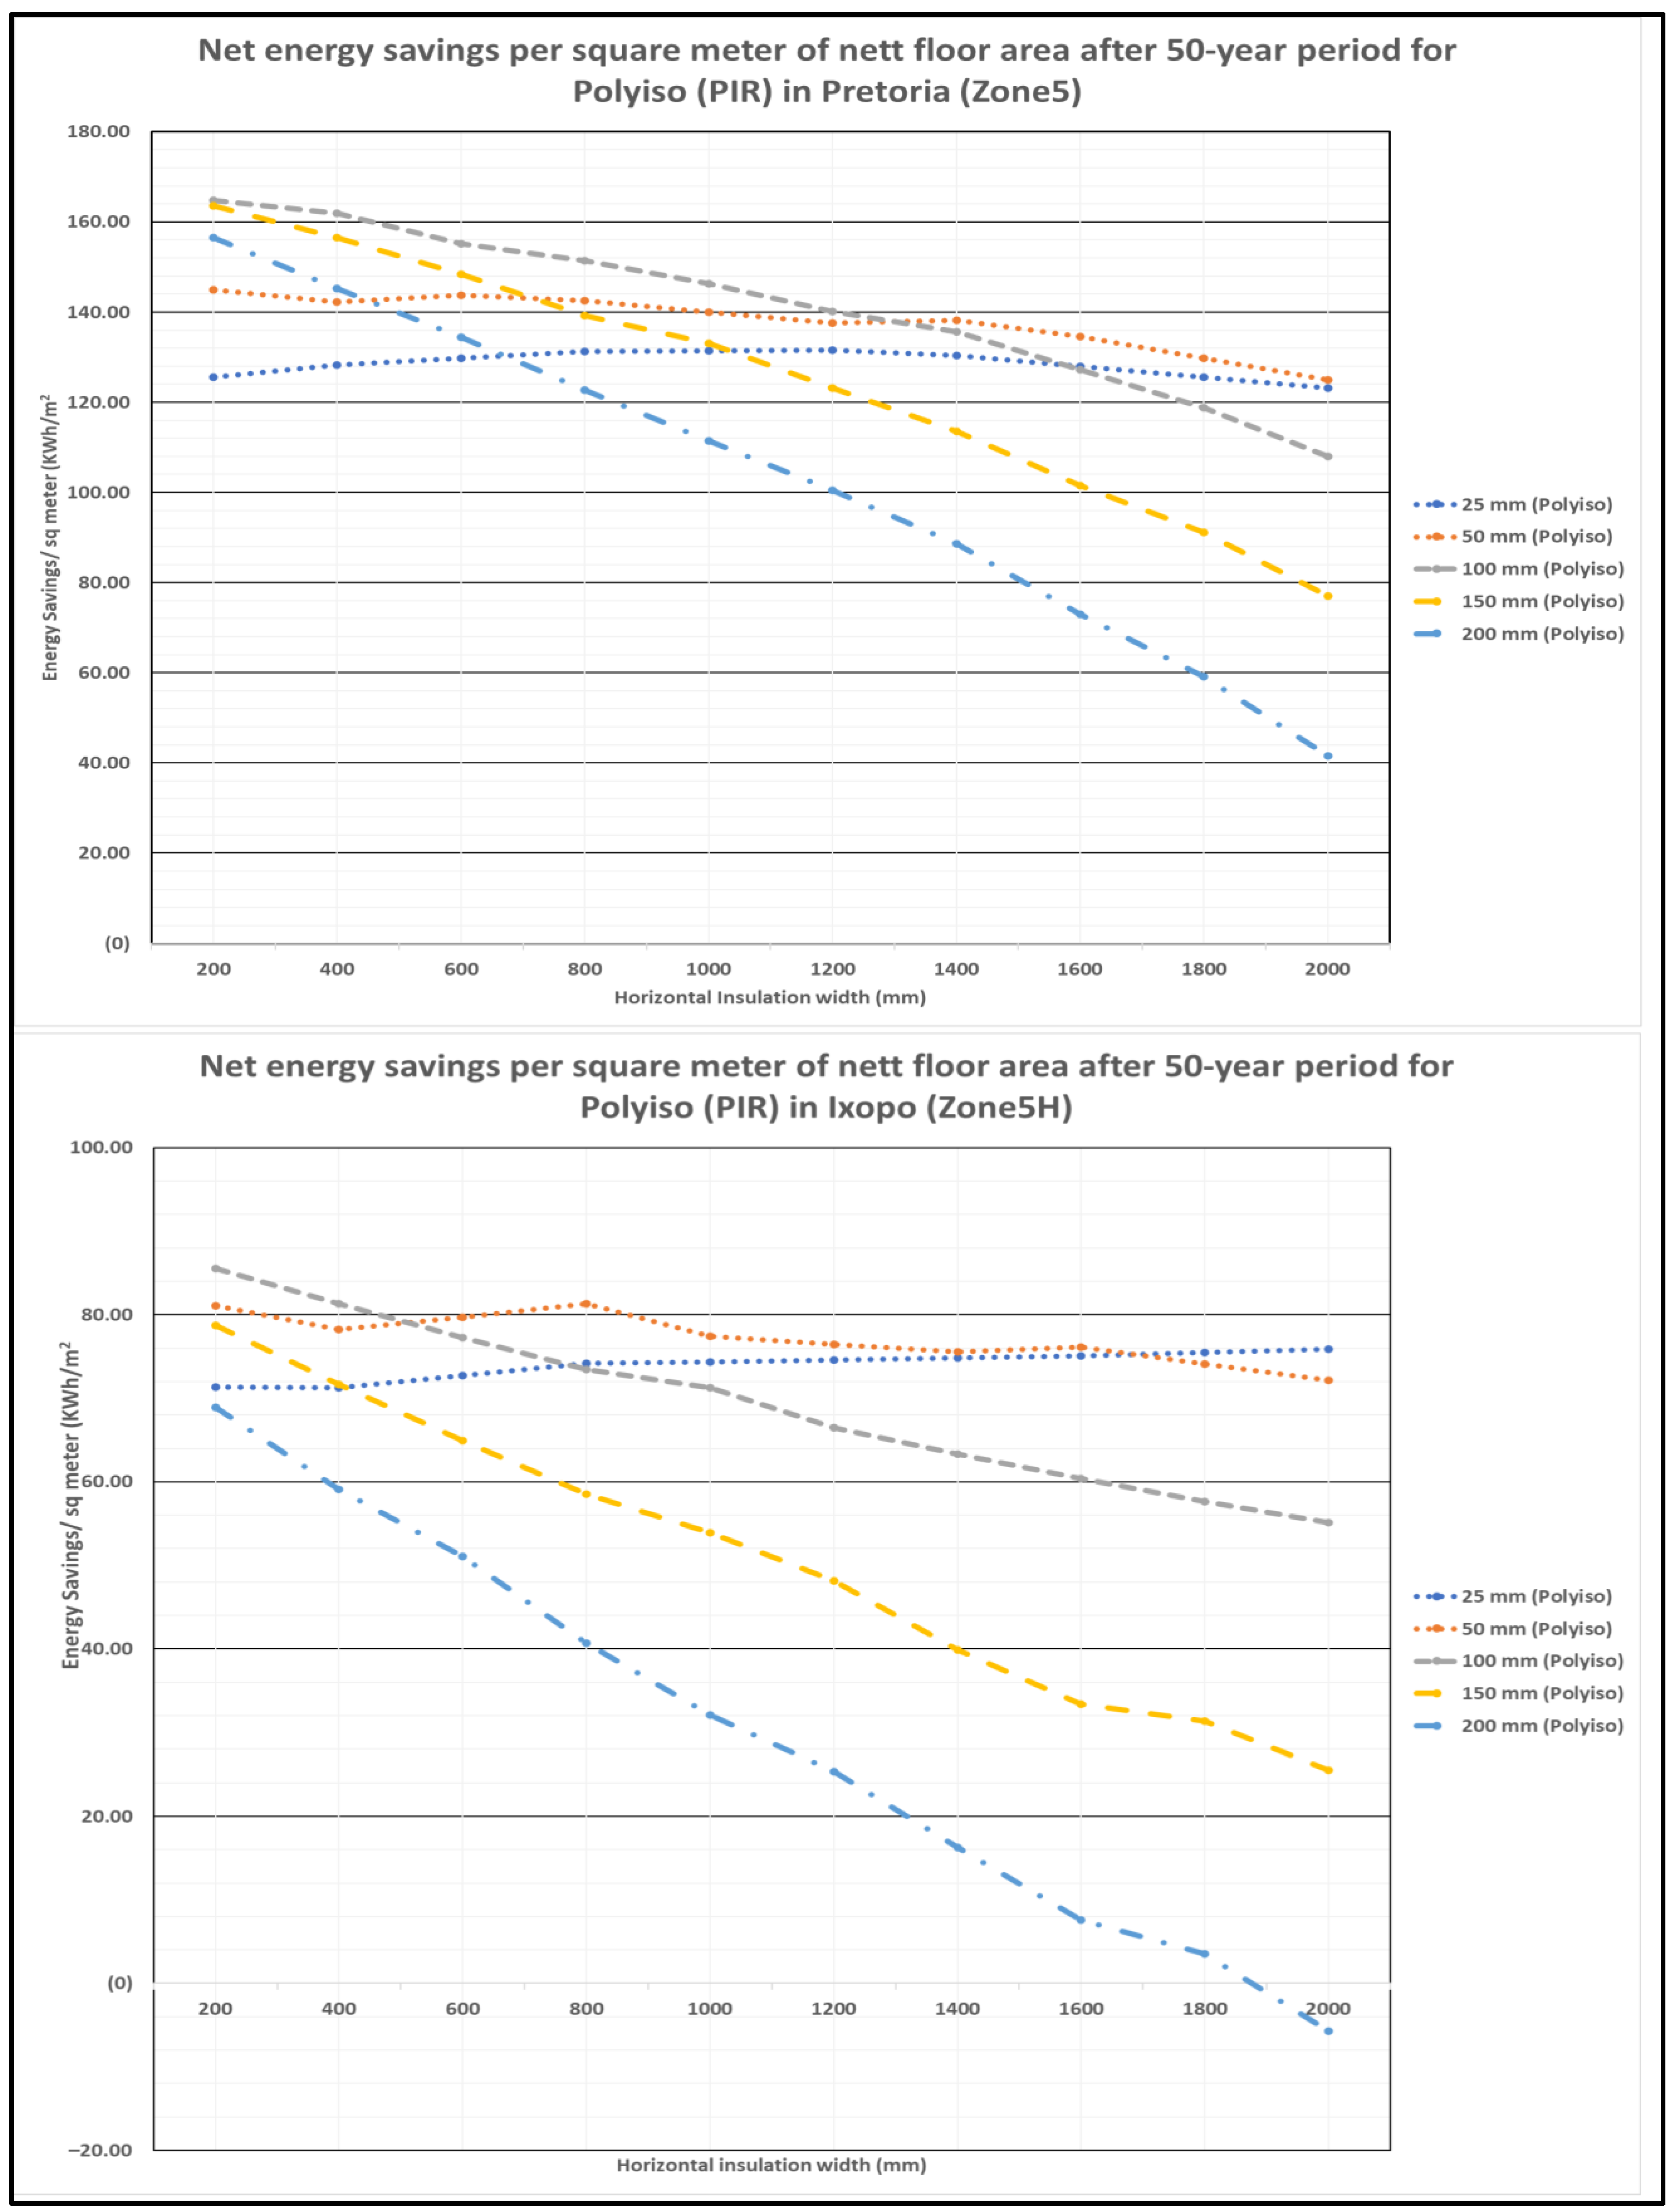
3.6.4. Net Saved Energy for Horizontal Perimeter Insulation after 50 Years

The net energy savings per m2 of net floor area (after 50 years) for horizontal insulation were evaluated across the different locations (energy zones). Figure 8, Figure 9, Figure 10 and Figure 11 show the results.
Generally, the net saved energy in Welkom (zone1) and Witbank (zone 2) occurs at insulation thicknesses of 100 mm or less, according to Figure 8. Higher insulation widths tend to require lower insulation thicknesses in order to maximize the net energy savings per m2 of net floor area.
Welkom (zone 1): For insulation widths of 800 mm or less, it is better to use an insulation thickness of 100 mm. For insulation widths above 800 mm up to 1600 mm, it is better to use an insulation thickness of 50 mm to maximize the energy savings in zone 1. For insulation widths of 1800 mm and above, it is better to use an insulation thickness of 25 mm.
Witbank (zone 2): Insulation widths up to 400 mm would require 100 mm insulation thickness to maximize the net energy savings. Beyond insulation widths of 400 mm up to 1200 mm, an insulation thickness of 50 mm would be suitable. Beyond 1200 mm insulation width, an insulation thickness of 25 mm would be suitable.
Thohoyandou (zone 3): According to Figure 9, insulation widths up to 1000 mm would require 100 mm insulation thickness to maximize the net energy savings. Beyond 1000 mm insulation width, an insulation thickness of 50 mm would be suitable.
Cape Town (zone 4): To maximize the net energy savings, an insulation thickness of 25 mm would generally be required for use throughout. Only insulation thicknesses of up to 100 mm would yield positive net energy savings for all the insulation widths (0.2 to 2.0 m). Thicknesses 150 mm and above would not yield positive net energy savings for all the insulation widths. The range of insulation widths that yield positive net energy savings narrows as the insulation thickness increases.
Pretoria (zone 5): In Pretoria, insulation widths up to 1200 mm would require 100 mm insulation thickness to maximize the net energy savings (Figure 10). Beyond 1200 mm insulation width, an insulation thickness of 50 mm would be suitable.
Ixopo (zone 5H): Insulation widths up to 400 mm would require 100 mm insulation thickness to maximize the net energy savings. Beyond 400 mm up to 1600 mm insulation widths, an insulation thickness of 50 mm would be suitable. Beyond 1600 mm insulation width, an insulation thicknesses of 25 mm would be suitable. Only insulation thicknesses of up to 150 mm would yield positive net energy savings at all the levels of insulation width. Additionally, 200 mm thick insulation would yield positive net energy savings for insulation widths less than or equal to 1800 mm.
Sutherland (zone 6): According to Figure 11, the best insulation thickness in Sutherland (zone 6) at all the width levels was 100 mm.
Fraserburg (zone 7): Insulation widths up to 1000 mm would require 100 mm insulation thickness to maximize the net energy savings. Beyond 1000 mm insulation width, an insulation thickness of 50 mm would be suitable.
Overall general trends: Generally, net energy savings for smaller insulation thicknesses of 50 mm or less tended to slightly increase, remain constant, or slightly reduce with changes in insulation width. The net energy savings for larger insulation thicknesses of 100 mm and above generally decreased significantly with an increase in insulation width. Operating at lower horizontal insulation thicknesses and lower horizontal insulation widths would almost serve to maximize the net energy savings after 50 years, yield lower payback periods, and also lead to lower costs being spent on insulation materials.
This is in sharp contrast to the vertical gap insulation method, where maximum net energy savings were generally achieved at lower levels of insulation thickness but at higher levels of insulation depth. This means more insulation material (to increase insulation depth) would be required for gap vertical insulation in order to maximize the net energy savings after 50 years.

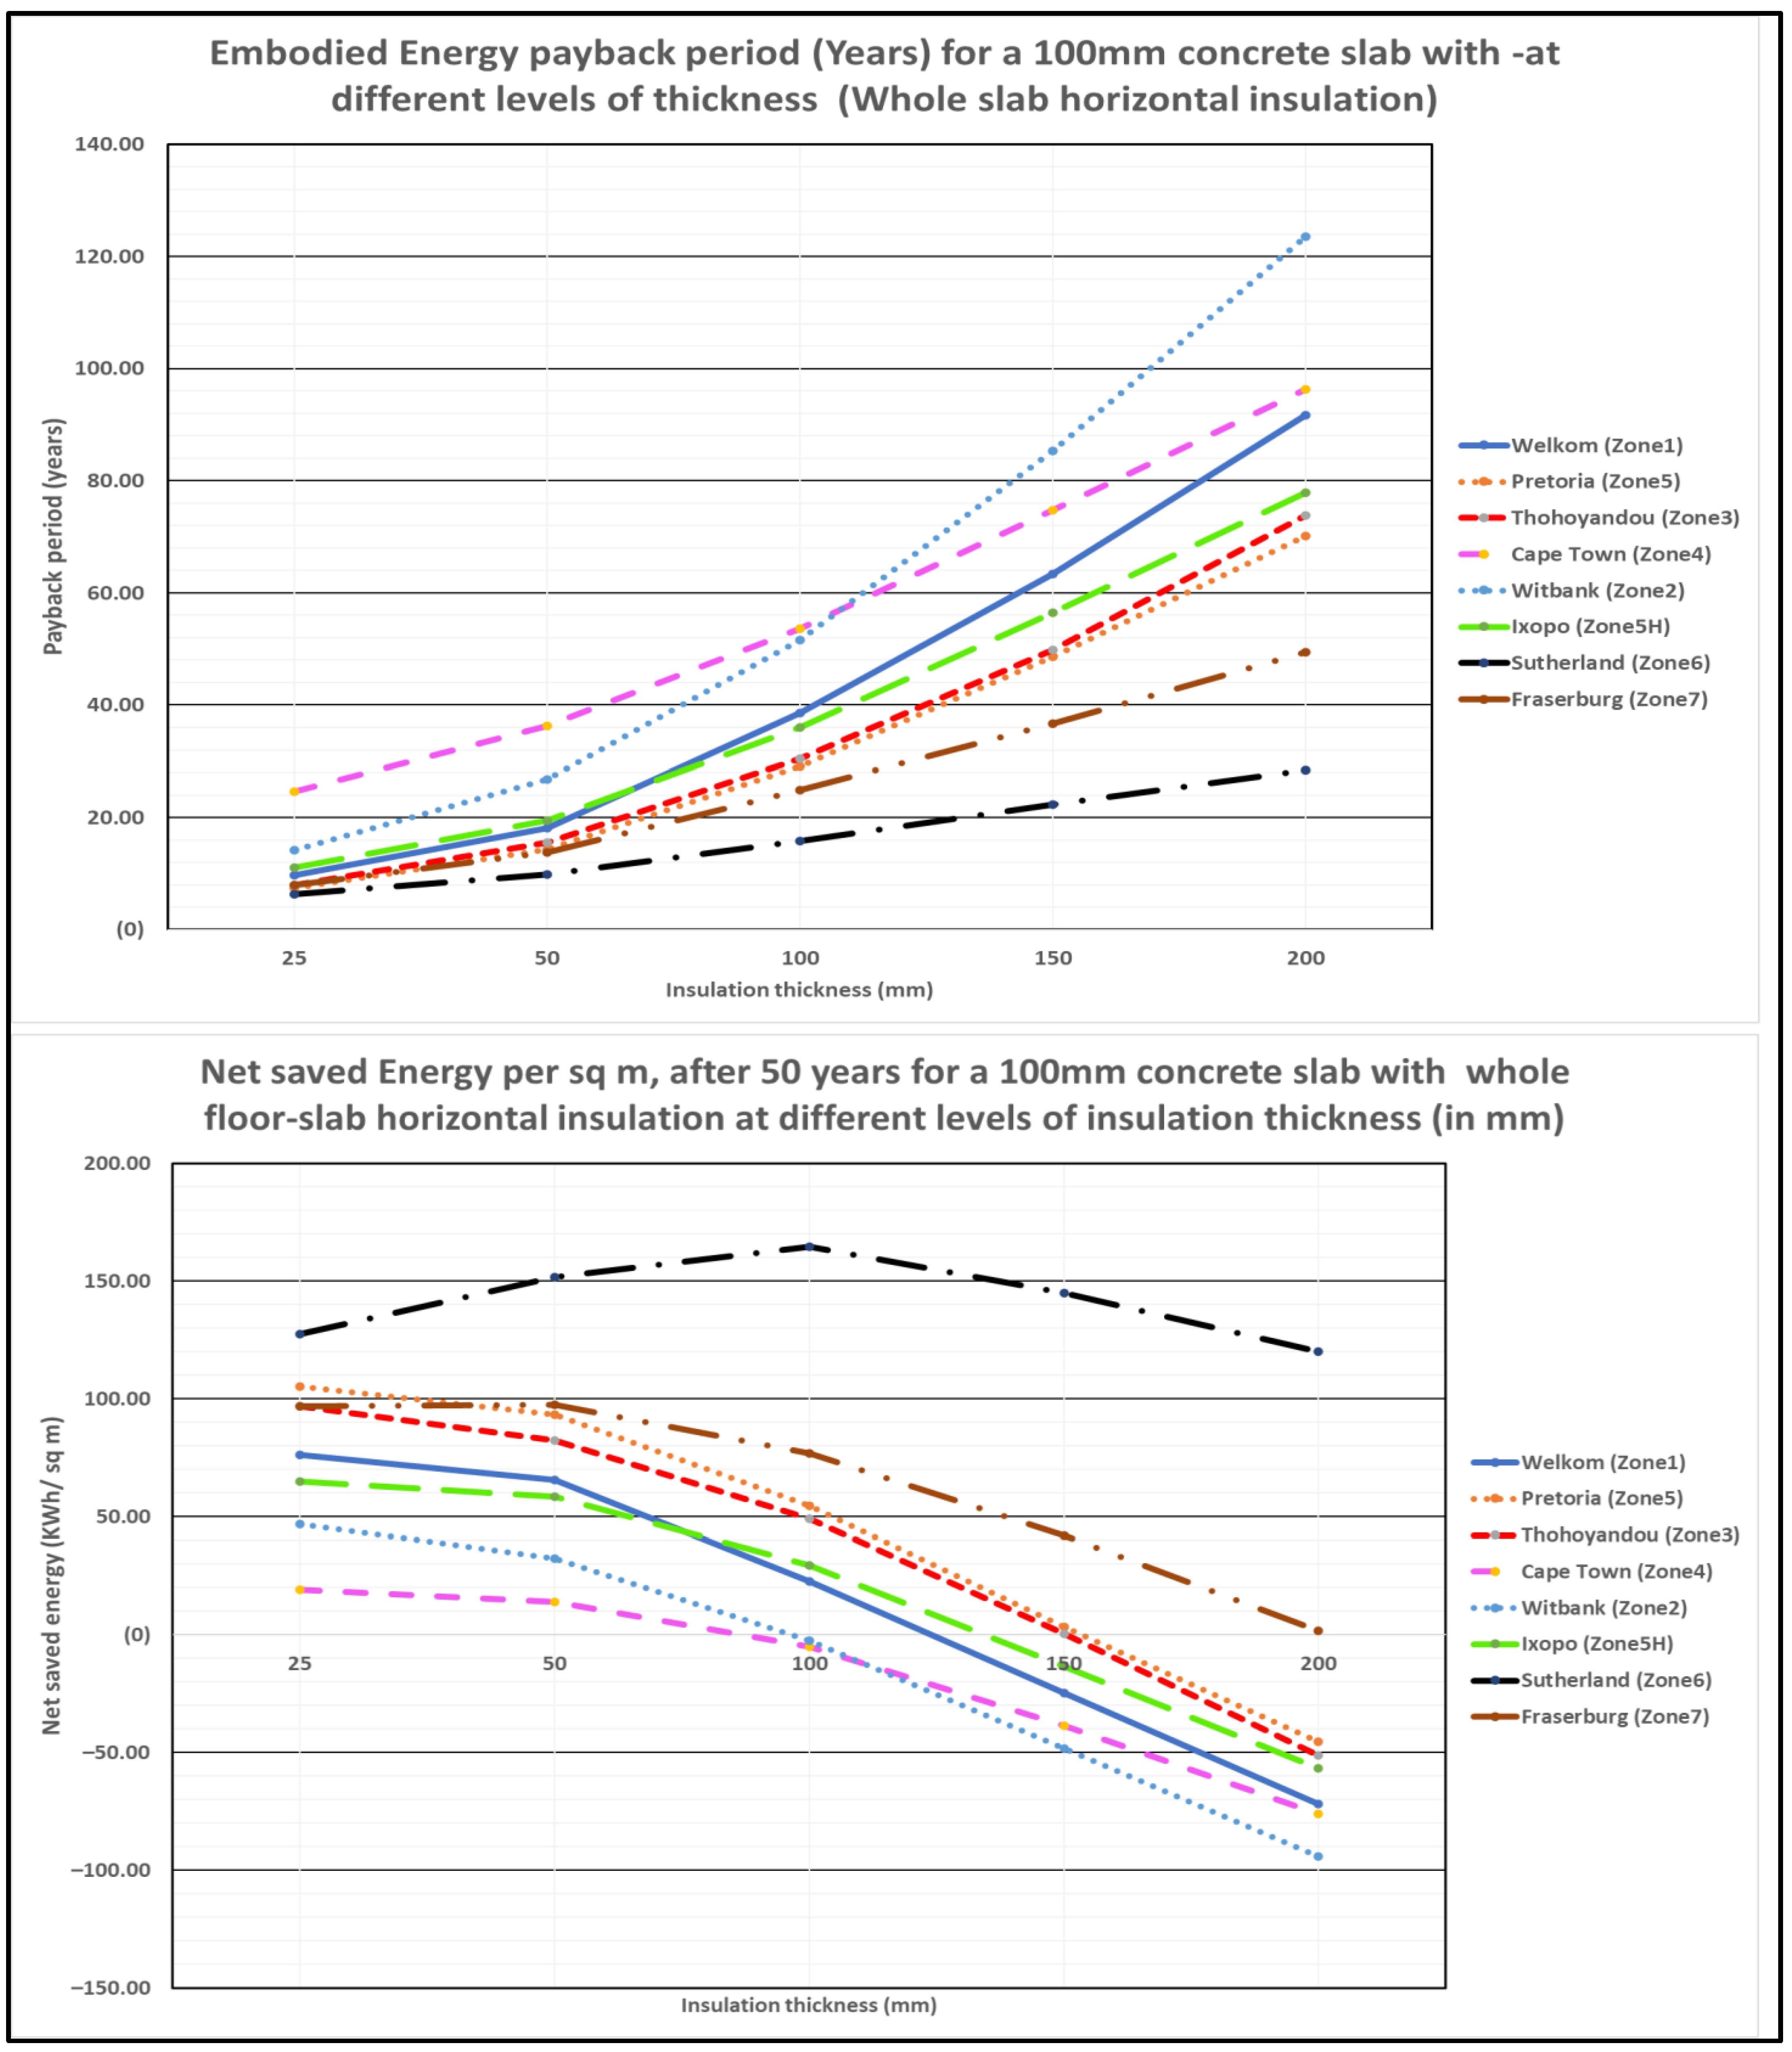
3.7. Energy Payback Periods and Net Saved Energy for Horizontal Full Floor Slab Insulation after 50 Years

Energy payback periods and net saved energy were evaluated at various levels of insulation thickness for when the whole floor slab was insulated. Table 5 is a combination of the results for both the partial horizontal perimeter (with vertical gap) and horizontal full floor slab insulation methods. Figure 12 shows the results for the full floor slab insulation method.
Payback periods: Based on Figure 12, small payback periods were associated with the lowest levels of insulation thickness, and vice versa. The locations with the lowest payback periods were Sutherland (zone 6), Fraserburg (zone 7), Pretoria (zone 5), and Thohoyandou (zone 3), depending on the thickness level. Cape Town (Zone 4) had the highest payback periods for thicknesses of 100 mm or less. For thicknesses greater than 100 mm, zone 2 (Witbank) had the highest payback periods.
Net energy savings: Generally, zone 6 (Sutherland) had the highest net energy savings per m2 of net floor area for all insulation thickness levels, followed by zone 7 (Fraserburg), zone 5 (Pretoria), and zone 3 (Thohoyandou). Net energy savings per m2 generally decreased with an increase in insulation thickness, except for zone 6 (Sutherland) for thicknesses up to 100 mm and zone 7 (Fraserburg) for thicknesses up to 50 mm. Therefore, apart from zone 6 and zone 7 (whose optimum thicknesses were 100 mm and 50 mm, respectively), operating at insulation thicknesses of 25 mm or less would generally ensure the maximization of net energy savings and would be cost-effective due to less insulation material being required. This trend is similar to the results derived from the work carried out by the authors of [22] in New Zealand, where an increase in the size of perimeter insulation top gap (an hence an increase in insulation thickness) reduced thermal performance (R-Value). For thicknesses lower than 100 mm, zone 4 (Cape Town) had the lowest net energy savings. However, for thicknesses greater than 100 mm, zone 2 (Witbank) had the lowest net energy savings.

4. Discussions

The study considered the benefits of applying polyiso (PIR) and XPS floor slab insulation for a detached residential building model with respect to the seven energy zones in South Africa and the three floor slab insulation methods. The study first implemented an energy-efficient design using the passive design strategy recommendations from Climate Consultant and the SANS10400-XA building energy efficiency standards before evaluating the embodied and operational site energy. Eight locations representing the seven energy zones were used for the analysis. These were Welkom (zone 1), Witbank (zone 2), Thohoyandou (zone 3), Cape Town (zone 4), Pretoria (zone 5), Ixopo (zone 5H), Sutherland (zone 6), and Fraserburg (zone 7). The SANS 10400-XA shading multipliers were applied to obtain minimum applicable shading depths of 0.62 (Welkom), 0.68 (Fraserburg and Ixopo), 0.54 (Pretoria and Witbank), 0.73 (Cape Town and Sutherland), and 0.49 (Thohoyandou).
When vertical gap insulation was used, polyiso (PIR) generally yielded lower payback periods and higher net energy savings compared to XPS under similar conditions. The addition of floor slab vertical gap insulation material as a measure hardly yielded any operational site energy savings in Cape Town (zone 4), with maximum possible savings of 5.61 KWh/m2. Therefore, thermal vertical gap insulation is not necessarily beneficial in zone 4 (Cape Town). Previous research carried out in South America and Japan also showed that the use of thermal insulation does not necessarily lead to a reduction in annual energy consumption [24].
Net energy savings: Table 7 shows the optimum thicknesses, maximum net energy savings, and corresponding payback periods for the three insulation methods in all the energy zones when using polyiso (PIR). The ratios of corresponding net energy savings to the net energy savings for vertical gap insulation method in Cape Town (zone 4) were also evaluated. Zone 5 (Pretoria) consistently yielded the highest net energy savings for each of the three floor slab insulation methods, except for full slab horizontal insulation, for which it came in second place. For example, using gap vertical insulation in Pretoria (zone 5), the amount of net energy saved was 31.4 times as much as that saved in Cape Town (zone 4) using gap vertical insulation. When horizontal insulation with gap vertical insulation was used in Pretoria (zone 5), the saved energy was 29.4 times that in Cape Town (zone 4) with gap vertical insulation. When full floor slab insulation was used in Pretoria (zone 5), the saved energy was 18.8 times the energy saved using gap vertical insulation in Cape Town (zone 4). Looking at the rankings for net saved energy for each insulation method, the zones that saved the most energy due to floor slab insulation and their corresponding energy savings ratios for gap vertical, horizontal with gap vertical, and horizontal full floor slab insulation methods, respectively, were zone 5 (Pretoria: 31.4, 29.4, and 18.8 times), zone 3 (Thohoyandou: 29.2, 26.9, and 17.3 times), zone 6 (Sutherland: 18.7, 25.4, and 29.3 times), and zone 7 (Fraserburg: 24.8, 23.7, and 17.4 times). The least beneficiaries were zone 4 (Cape Town: 1.0, 3.4, and 3.4 times), zone 2 (Witbank: 9.8, 11.3, and 8.4 times), zone 5H (Ixopo: 15.2, 15.2, and 11.6 times), and zone 1 (Welkom: 22.7, 21.7, and 13.6 times). Based on net energy savings, it is best to apply the gap vertical insulation method in zone 1 (ratio: 22.7 for Welkom), zone 3 (ratio: 29.2 for Thohoyandou), zone 5 (ratio: 31.4 for Pretoria), and zone 7 (ratio: 24.8 for Fraserburg) because the highest ratios corresponded to this insulation method in these zones. However, for the same reason, it is best to apply full slab insulation in zone 4 (ratio: 3.4 for Cape Town) and zone 6 (ratio: 29.3 for Sutherland). Using the same reasoning, it is best to use the horizontal with gap vertical insulation method in zone 2 (ratio: 11.3 for Witbank) and zone 5H (ratio: 15.2 for Ixopo). Therefore, the general findings reported by [22], which generally state that horizontal full floor slab insulation with vertical gap perimeter insulation performed better than vertical gap insulation alone, were only confirmed in Cape Town (energy savings of 19.08 and 5.61 KWh/m2) and Sutherland (energy savings of 164.47 and 104.92 KWh/m2), respectively. The locations in the other energy zones differed.
Consideration of the embodied energy payback period: The maximum net energy savings per m2 of net floor area for gap vertical insulation measures are only slightly greater than or less than those obtained using the horizontal with gap vertical insulation method (after 50 years), with the exception of Cape Town (zone 4) and Sutherland (zone 6). That is why the corresponding ratios (apart from the Pretoria and Sutherland ratios) are close in value. However, the payback periods for the gap vertical insulation method are mostly at least twice those for the horizontal insulation method with gap vertical insulation in the zones where the net energy savings are comparable. This is because significantly more insulation material is used to obtain the corresponding net energy savings using the gap vertical insulation method (Equations (2)–(4)) since the gap vertical insulation method yields maximum energy savings at high insulation depths (1.8–2.0 m). On the other hand, the horizontal insulation method with gap vertical insulation achieves maximum energy savings at the lowest insulation widths (0.2 m or 200 mm) for all energy zones except for zone 6 (2.0 m for Sutherland). It is no wonder that the Sutherland (zone 6) payback periods for these two methods are comparable (10.3 and 13.9 years). Therefore, it will correspondingly take more years (and more expenses to buy extra insulation) to save enough energy and compensate for the embodied energy of the insulation material used in the case of the gap vertical insulation method in Welkom (zone 1), Thohoyandou (zone 3), Pretoria (zone 5), and Fraserburg (zone 7). Therefore, although gap vertical insulation is preferable in these four zones, it comes at higher costs and higher energy payback periods. It may be rational to use horizontal perimeter insulation in these four zones if costs and energy payback periods are considered. Using the same reasoning, it would be better to still use horizontal perimeter insulation in zone 4 (payback period: 20 years for Cape Town) and zone 6 (payback period: 13.9 years for Sutherland) instead of using the horizontal (full floor slab) insulation method in zone 4 (payback period: 24.6 years for Cape Town) and zone 6 (energy payback: 15.8 years for Sutherland), since both methods have almost similar net energy saving ratios in Cape Town (3.4 and 3.4 in zone 4) and Sutherland (25.4 and 29.3 in zone 6).
Discrepancies between energy zone classification and total annual energy consumption: There appears to be some discrepancies between the SANS10400-XA heating/cooling demand classification and the maximum energy consumption per m2. For example, a building in Fraserburg (zone 7: 28.06 KWh/m2) would be expected to consume more energy than a similar building in Sutherland (zone 6: 34.18 KWh/m2). Similarly, a building in Cape Town (zone 4: 24.11 KWh/m2) would be expected to consume less energy than a similar building in Witbank (zone 2: 21.0 KWh/m2). Table A1, in Appendix D, shows that building energy models in locations within the same energy zone may lead to significant differences in annual energy consumption, as exemplified by the maximum energy consumption of Kimberley and Welkom. Several factors could account for these differences. First, while the SANS10400-XA energy zones were based upon the future climate predictions (1961–2100) indicated in [25], this study (which focused on floor slab insulation measures) used TMYx files from 2004 to 2018, as recommended by the authors of [31]. This implies that any differences in comparisons between the building models and the SANS10400-XA energy zones (Table 7) could also be attributed to the differences in the methodologies used to obtain the TMYx files and the energy zone future weather predictions (1961–2100). Second, the low, medium, and high (L, M, H) classifications of energy demand, according to SANS10400-XA, are based on interval estimates rather than point estimates. For example, a building with a low heating demand at the upper end of the interval may consume almost the same energy as a medium-heating building at the lower end of the interval, apart from their cooling energy consumption. The third reason is most probably due to differences in relative humidity, as explained under general patterns.
General Patterns: Two major general patterns also appear to emerge from the findings. The first one is that there is a very strong positive relationship (very strong positive correlation) between the net energy savings and the annual sum of the heating (HDD) and cooling (CDD) degree days, as shown in Table A2 and Table A3 in Appendix D. The correlations were 0.80, 0.88, and 0.83 for the vertical gap, the horizontal perimeter, and the horizontal full floor slab insulation methods, respectively. A higher sum of heating and cooling degree days leads to greater net energy savings. This explains why Cape Town (zone 4) has low net energy savings. The sum of the degree days for Cape Town are significantly the lowest. The tables also show that the cooling degree days (CDD), which are also influenced by the maximum temperature (max = 27.07 °C; range = 17.81 °C from 2000 to 2022, for cape Town), have significantly greater influence on net energy savings. Cape Town had a significantly lower maximum temperature compared to the other locations. The correlations between the maximum temperature of a location and the maximum net energy savings were 0.84 (very strong), 0.85 (very strong), and 0.66 (strong) for the vertical gap, the horizontal perimeter, and the horizontal full floor slab methods, respectively.
The second general pattern is that there is a strong negative correlation (relationship) between the net energy savings (resulting from the application of floor slab insulation measures) and the relative humidity of a location, as shown in Table A1 and Table A3. The correlations were −0.76, −0.79, and −0.65 for the vertical gap, the horizontal perimeter, and the horizontal full floor slab methods, respectively. Therefore, with other factors remaining constant, locations with higher relative humidity will benefit less from the application of floor slab insulation measures (and therefore have less net energy savings). This may explain why Welkom (RH = 49.68, energy savings = 127.16 KWh/m2), Nelspruit (RH = 61.31; energy savings = 143.20 KWh/m2), and Cape Town (RH = 79.04; energy savings = 5.61 KWh/m2) had lower net energy savings compared to Kimberley (RH = 41.30; energy savings = 154.18 KWh/m2), Pretoria (RH = 50.62; energy savings = 176.43 KWh/m2), and Mthatha (RH = 69.85; energy savings = 57.05 KWh/m2), respectively, as shown in Table A1 (Appendix D), despite being within similar respective energy zones.
Generally, greater net energy savings per m2 were experienced at lower floor slab insulation thickness levels, although other factors also influenced the savings. This agrees with the work carried out by the authors of [22] in New Zealand, where R-Values (thermal performance) tended to decrease with an increase in vertical insulation thickness. Except for zone 4 (Cape Town), the net energy savings per m2 (for vertical gap insulation) also initially tended to increase with insulation depth before peaking in some instances and then decreasing with insulation depth (up to a maximum depth of 2000 mm or 2.0 m). The same trends were confirmed by the authors of [22] in New Zealand, where although the R-Values increased with insulation height, the rate of increase reduced with insulation height (up to a maximum height of 1.0 m). The authors of [22] used depths only up to 1.0 m and never considered locations in different energy or climatic zones, and these factors may serve to explain why the peak points were never reached in their study, as well as why outlier cases like Cape Town were not revealed in their study.

5. Conclusions

This study considered whether it was beneficial to use floor slab insulation materials for a 50 mm air gap cavity wall made of clay brick masonry for a residential building whose net floor area was 105.4 m2 within several locations located in the seven energy zones of South Africa. Three methods of insulation involving the use of PIR (polyiso) and, in some cases, XPS insulation were analyzed. These were the gap vertical insulation, the horizontal perimeter floor slab insulation, and the full horizontal floor slab insulation methods. Using polyiso (PIR), the optimal insulation thicknesses that maximized net energy savings using the gap vertical insulation method were either 0.05 m (Welkom: zone 1; Witbank: zone 2; Ixopo: zone 5H; and Sutherland: zone 6), 0.100 m (Thohoyandou: zone 3; Pretoria: zone 5; and Fraserburg: zone 7), or 0.25 m (Pretoria: zone 4). The optimal insulation thicknesses that maximized net energy savings using the horizontal perimeter insulation method were mostly 0.025 m (zone 4: Cape Town) and 0.100 m (locations in other zones). On the other hand, the optimal insulation thicknesses that maximized net energy savings using the horizontal full floor slab insulation method were 0.100 m (zone 6: Sutherland), 0.050 m (zone 7: Fraserburg), and 0.025 (the remaining locations). The maximum net energy savings in Welkom (zone 1), Thohoyandou (zone 3), Pretoria (zone 5), and Fraserburg (zone 7) were 127.16, 163.92, 176.43, and 138.89 KWh/m2, respectively, and were achieved using the vertical gap insulation method, while the minimum net energy savings were 76.09, 96.95, 105.29, and 97.58 KWh/m2, respectively, and were achieved using the horizontal full floor slab insulation method. The maximum net energy savings in Cape Town (zone 4) and Sutherland (zone 6) were 19.08 and 97.58 KWh/m2, respectively, and were achieved using the horizontal full floor slab insulation method, while the minimum net energy savings were 5.61 and 104.92 KWh/m2, respectively, and were achieved using the vertical gap perimeter floor slab insulation method. On the other hand, the maximum net energy savings due to floor slab insulation in Witbank (zone 2) and Ixopo (zone 5H) were 63.27 and 85.51 KWh/m2, respectively, and were achieved using the horizontal perimeter floor slab insulation method, while the minimum net energy savings were 46.89 and 64.96 KWh/m2, respectively, and were achieved using the horizontal full floor slab insulation method. The significantly low net energy savings per m2 in Cape Town (zone 4) could be due to Cape Town having the lowest maximum temperatures and temperature range, leading to Cape Town having the lowest sum of heating and cooling degree days. Generally, higher net energy savings occur in areas with lower humidity levels and with higher annual sums of both cooling and heating degree days. Given that the thermal conductivity of materials changes with temperature and moisture content, there are limitations to the results of this study. The results were also limited to residential buildings with masonry cavity wall envelopes and the derived window-to-wall ratios for the front (0.277), back (0.240), left (0.05), and right (0.05) envelope wall facades. They apply only to the 8 locations (Welkom, Witbank, Thohoyandou, Cape Town, Pretoria, Ixopo, Sutherland, and Fraserburg) in each of the 7 energy zones of South Africa (1, 2, 3, 4, 5, 5H, 6, and 7), together with their minimum derived shading depths according to the SANS10400-XA standard. Further research could consider the application of other suitable floor slab insulation materials, or even the application of polyiso (PIR) with agricultural additives.

Supplementary Materials

The following supporting information can be downloaded at: https://www.mdpi.com/article/10.3390/en17020539/s1, Table S1: Output simulation Results for vertical gap insulation; Table S2: Output simulation results for horizontal insulation.

Author Contributions

Conceptualization, E.K., S.M. and B.B.; methodology, E.K., S.M. and B.B.; software, E.K.; validation, E.K.; formal analysis, E.K.; investigation, E.K. and E.A.-K.; resources, E.A.-K.; data curation, E.K. and E.A.-K.; writing—original draft preparation, E.K., E.A.-K., S.M. and B.B.; writing—review and editing, E.K., E.A.-K., S.M. and B.B.; visualization, E.K.; supervision, E.A.-K. and S.M.; project administration, E.A.-K. and S.M.; funding acquisition, E.K., E.A.-K., S.M. and B.B. All authors have read and agreed to the published version of the manuscript.

Funding

This study received no external funding.

Data Availability Statement

Some publicly available datasets were analyzed in this study. These data (weather files) can be found here: https://climate.onebuilding.org/ (accessed on 15 June 2023). Other data are available as supplementary materials.

Acknowledgments

Acknowledgements go to Nelson Mandela University (NMU) for their support.

Conflicts of Interest

The authors declare no conflicts of interest.

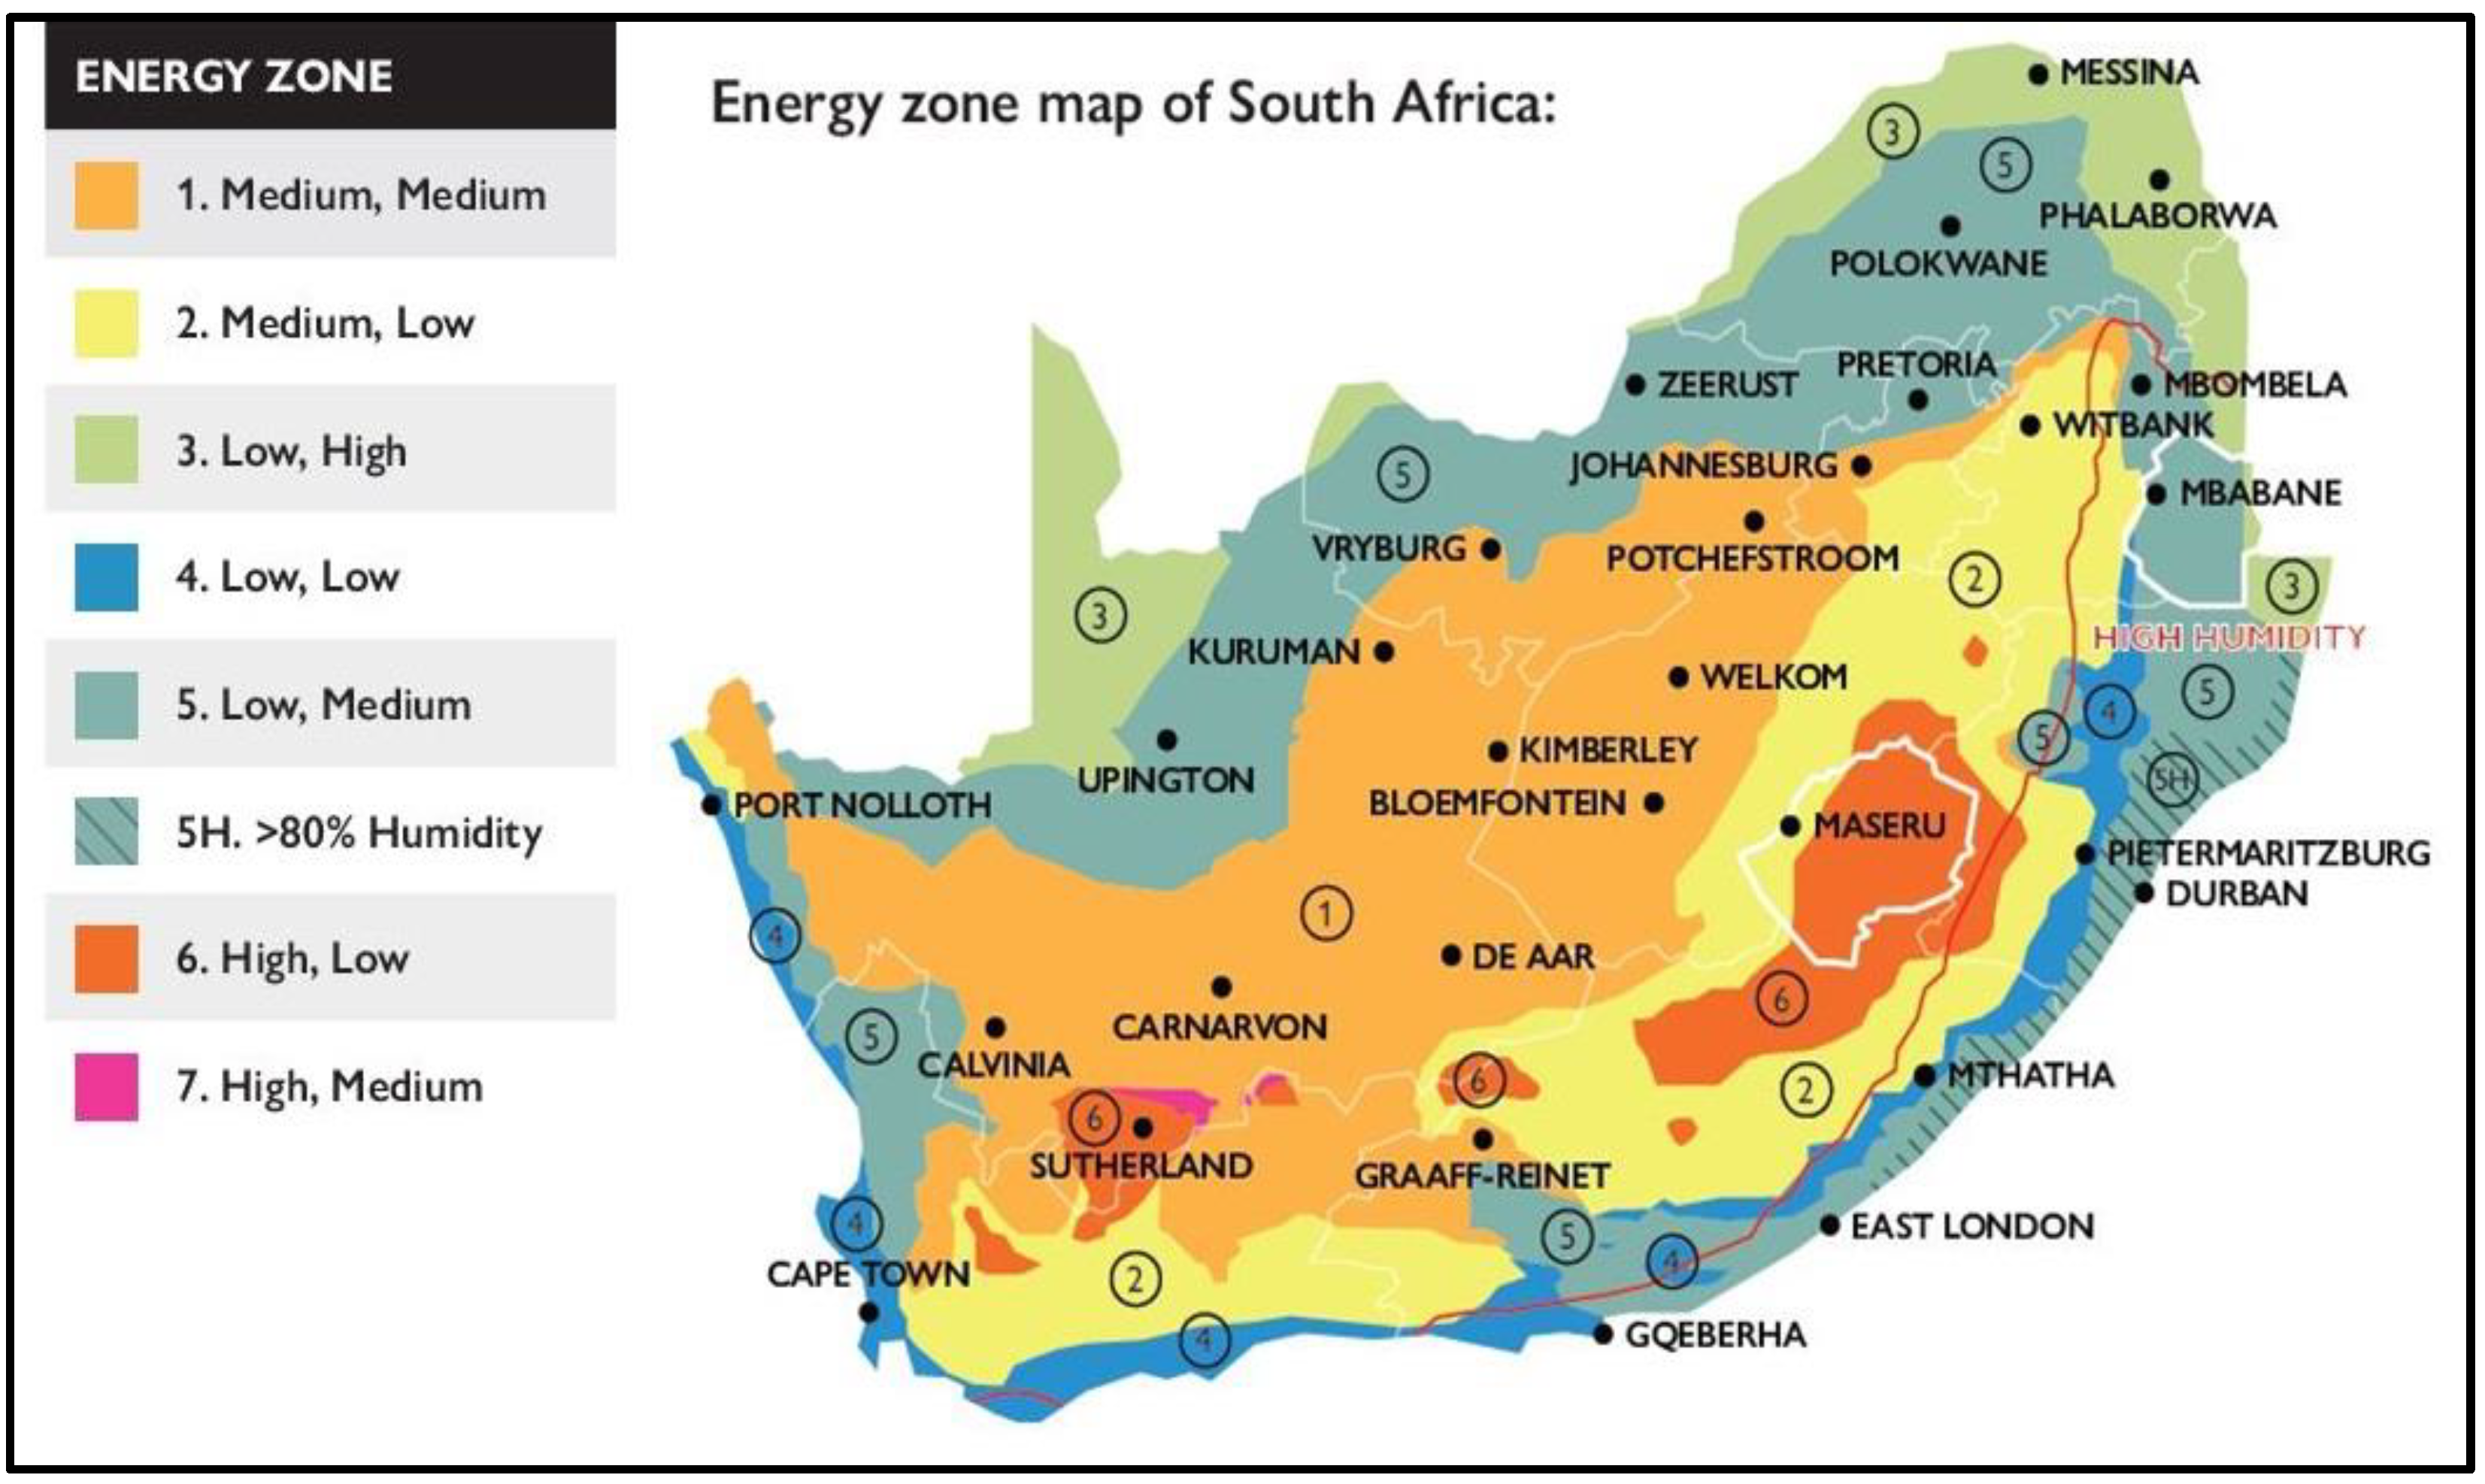
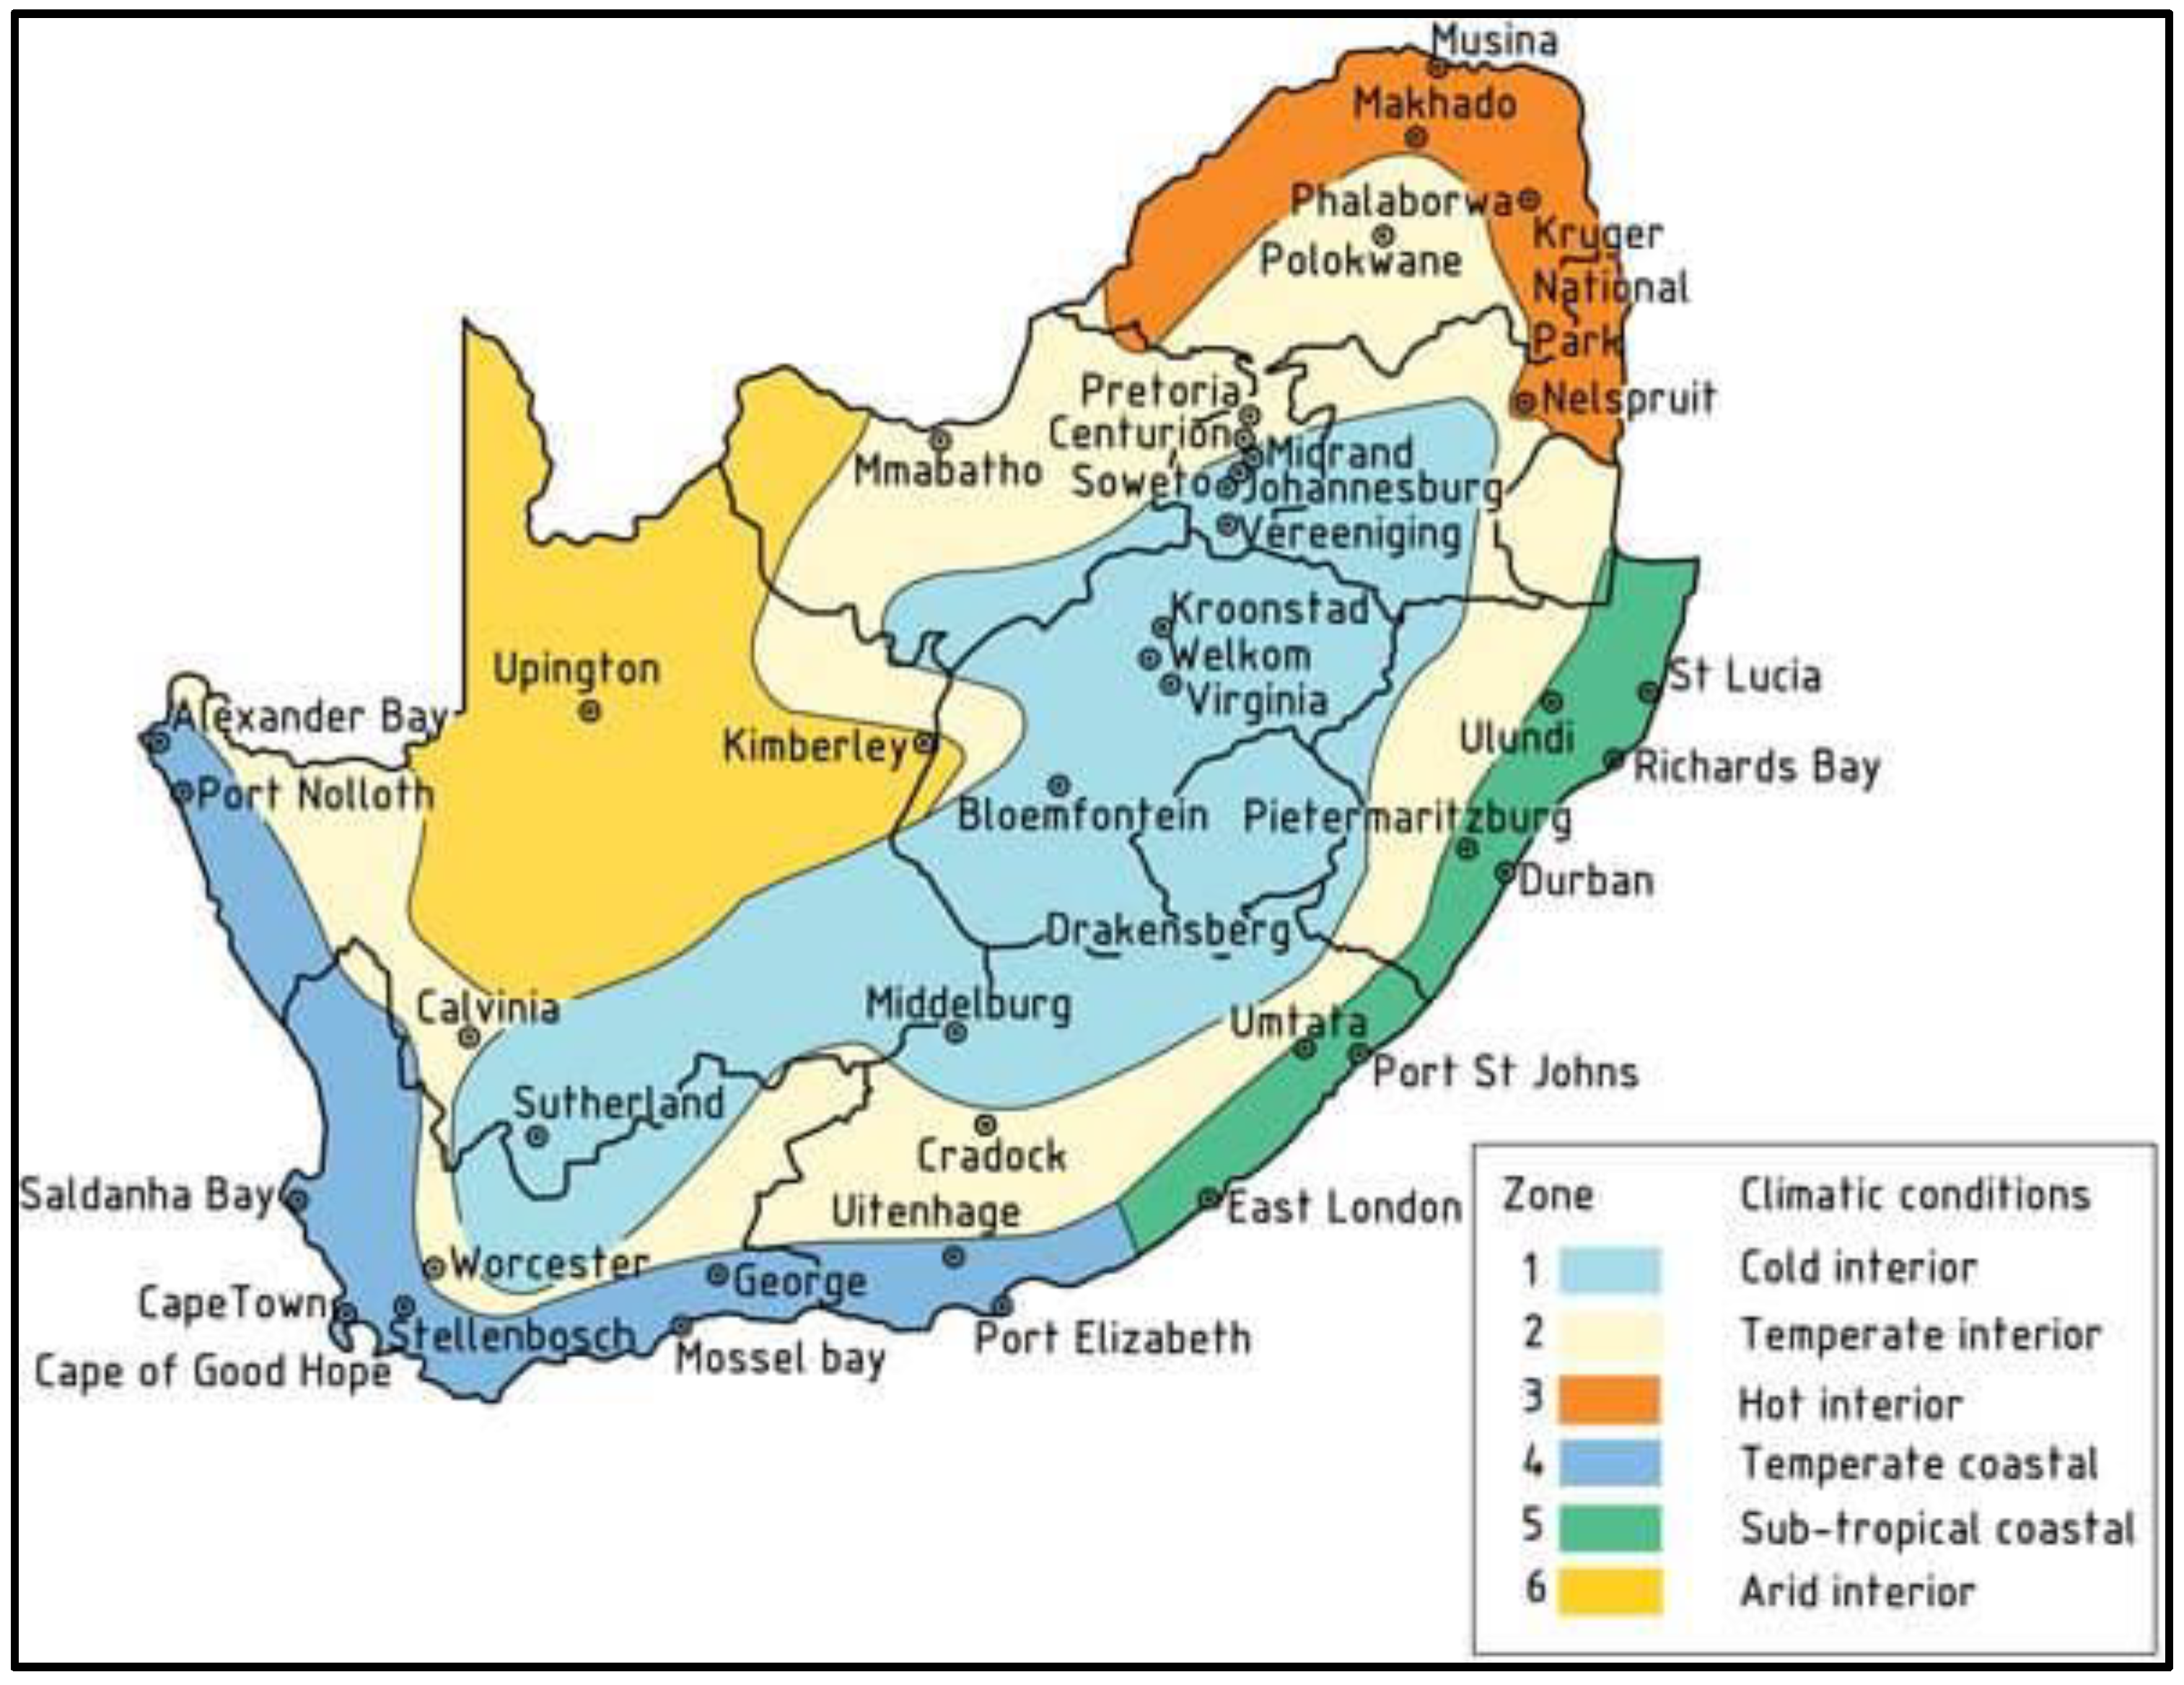
Appendix A. The Energy and Climatic Zone Maps

SANS10400-XA Energy Zone map of South Africa (in use currently).
Figure A1. Map showing the seven energy zones of South Africa classified according to building heating and cooling energy demand. Source: [49].
Energies 17 00539 g0a1
Climatic Zone map of South Africa (replaced by energy zone map in Figure A1).
Figure A2. Map showing the six SANS10400-XA climatic zones of South Africa classified purely according to climatic conditions. Source: [50].
Energies 17 00539 g0a2

Appendix B. Payback Periods for Vertical Gap Floor Slab Insulation

Figure A3. Energy payback periods for Welkom (zone 1) and Witbank (zone 2) at different levels of slab insulation depth (200 to 2000 mm) and insulation thickness (25 to 200 mm). Source: authors.
Energies 17 00539 g0a3
Figure A4. Energy payback periods for Thohoyandou (zone 3) and Cape Town (zone 4) at different levels of slab insulation depth (200 to 2000 mm) and insulation thickness (25 to 200 mm). Source: authors.
Energies 17 00539 g0a4
Figure A5. Energy payback periods for Pretoria (zone 5) and Ixopo (zone 5H) at different levels of slab insulation depth (200 to 2000 mm) and insulation thickness (25 to 200 mm). Source: authors.
Energies 17 00539 g0a5
Figure A6. Energy payback periods for Sutherland (zone 6) and Fraserburg (zone 7) at different levels of slab insulation depth (200 to 2000 mm) and insulation thickness (25 to 200 mm). Source: authors.
Energies 17 00539 g0a6

Appendix C. Payback Periods for Horizontal Perimeter Floor Slab Insulation

Figure A7. Energy payback periods for zone 1 and zone 2 at different levels of slab horizontal insulation width from the slab edges (200 to 2000 mm) and insulation thickness (25 to 200 mm). Source: authors.
Energies 17 00539 g0a7
Figure A8. Energy payback periods for zone 3 and zone 4 at different levels of slab horizontal insulation width from the slab edges (200 to 2000 mm) and insulation thickness (25 to 200 mm). Source: authors.
Energies 17 00539 g0a8
Figure A9. Energy payback periods for zone 5 and zone 5H at different levels of slab horizontal insulation width from the slab edges (200 to 2000 mm) and insulation thickness (25 to 200 mm). Source: authors.
Energies 17 00539 g0a9
Figure A10. Energy payback periods for zone 6 and zone 7 at different levels of slab horizontal insulation width from the slab edges (200 to 2000 mm) and insulation thickness (25 to 200 mm). Source: authors.
Energies 17 00539 g0a10

Appendix D

Table A1. Maximum, minimum, and mean annual site (and source) energy consumption per net floor area and loads not met (% of annual hours) for the vertical gap insulation method for locations within similar zones.
SANS10400-XA (2022)Welkom
(Zone 1)
Kimberley (Zone 1)Pretoria (Zone 5)Nelspruit (Zone 5)Cape Town (Zone 4)Mthatha (Zone 4)
Heating/coolingM/MM/ML/ML/ML/LL/L
Site energy
(source energy)
maximum (KWh/m2)24.61 (77.7)27.09 (85.35)25.61 (80.79)25.72 (81.23)24.11 (76.14)23.08 (72.69)
Minimum (KWh/m2)20.83 (65.82)22.61 (71.3)20.69 (65.27)21.47 (67.63)23.39 (73.72)21.19 (66.88)
Range (KWh/m2)3.78 (11.88)4.48 (14.05)4.92 (15.52)4.25 (13.60)0.72 (2.42)1.89 (5.81)
Mean (KWh/m2)22.22 (70.09)24.22 (76.36)22.49 (70.94)23.13 (72.94)23.75 (74.94)21.82 (68.85)
SD (KWh/m2)1.005 (3.164)1.156 (3.653)1.341 (4.231)1.197 (3.797)0.182 (0.566)0.5 (1.576)
SANS10400-XA reference (KWh/m2)909085858080
Net energy savings (KWh/m2)127.16154.18176.14143.25.6157.05
Annual unmet heating and cooling loads
Maximum(% hours)0%1%2%1%0%2%
Minimum(% hours)0%0%0%0%0%1%
Mean (% hours)0%0%1%0%0%1%
SD (% hours)0.00%0.08%0.61%0.20%0.00%0.23%
SANS10400-XA reference (% hours)5%5%5%5%5%5%
Shading multiplier0.460.460.40.40.540.5
Altitude (m)1342120413228831550731
Relative humidity (%)49.6841.350.6261.3179.0469.85
Latitude (degrees)28.004628.728225.747925.475333.924931.5067
Source: authors and [51].
Table A2. Maximum and minimum temperatures and their ranges (2000–2022), the mean annual cooling and heating degree days and their sum (2012–2021) referenced to 18.3 °C, and the maximum and minimum net energy savings per m2 (over a 50-year period) in KWh/m2.
Energy ZoneLocationT2M_MAXT2M_MINT2M_RANGEMaximum Savings (Gap Vertical)Maximum Savings (Horizontal Perimeter)Maximum Savings (Horizontal Full_Slab)CDDHDDTOTAL (CDD and HDD)Relative Humidity (%)
1Welkom41.63−5.6147.24127.16121.6776.09838923176149.68
2Witbank38.12−5.6643.7854.7963.2746.89482841132358.78
3Thohoyandou44.194.9639.23163.92150.8796.95179569186456.21
4Cape Town27.059.2417.815.6118.8819.0817464281679.04
5Pretoria39.58−2.6542.23176.43164.87105.291172418159050.62
5HIxopo38.36−1.3539.7185.3885.5164.96357967132473.95
6Sutherland40.64−4.7745.41104.92142.75164.475031443194652.57
7Fraserburg41.58−4.646.18138.89132.7997.588271164199142.81
Source: authors and [51].
T2M_MAX: maximum temperature at 2 m (2000–2022); T2M_MIN: minimum temperature at 2 m (2000–2022); T2M_RANGE: difference between maximum and minimum temperatures at 2 m; CDD: mean annual cooling degree days (2012–2021); HDD: mean annual heating degree days (2012–2021).
Table A3. Correlation coefficients for temperatures and degree days with maximum net energy savings.
Maximum Savings (Gap Vertical)Maximum Savings (Horizontal Perimeter)Maximum Savings (Horizontal Full Slab)
T2M_RANGE0.660.710.62
T2M_MAX0.840.850.66
T2M_MIN−0.34−0.42−0.45
CDD0.830.740.36
HDD−0.26−0.080.33
TOTAL (CDD and HDD)0.800.880.83
Relative humidity−0.76−0.79−0.65
Source: authors.

References

  1. United States Energy Information Administration. South Africa. 2022. Available online: https://www.eia.gov/international/overview/country/ZAF (accessed on 22 September 2023).
  2. IEA (International Energy Agency). World Energy Outlook 2023. 2023. Available online: https://iea.blob.core.windows.net/assets/2b0ded44-6a47-495b-96d9-2fac0ac735a8/WorldEnergyOutlook2023.pdf (accessed on 29 October 2023).
  3. IEA (International Energy Agency). Buildings. 2023. Available online: https://www.iea.org/energy-system/buildings (accessed on 29 October 2023).
  4. EDF. Acomplete Guide to Floor Insulation. 2023. Available online: https://www.edfenergy.com/heating/advice/complete-guide-floor-insulation (accessed on 23 October 2023).
  5. STATSA. General Household Survey, 2020. 2021. Available online: https://www.datafirst.uct.ac.za/dataportal/index.php/catalog/887 (accessed on 20 April 2023).
  6. Hughes, A.; Larmour, R. Residential Electricity Consumption in South Africa. University of Cape Town. 2021. Available online: https://www.sanedi.org.za/wp-content/uploads/2022/05/2021-Residential-Electricity-Consumption-in-South-Africa-research-report-1.pdf (accessed on 21 May 2022).
  7. Tariku, F.; Shang, Y.; Molleti, S. Thermal performance of flat roof insulation materials: A review of temperature, moisture and aging effects. J. Build. Eng. 2023, 76, 107142. [Google Scholar] [CrossRef]
  8. Pokorska-Silva, I.; Kadela, M.; Orlik-Kożdoń, B.; Fedorowicz, L. Calculation of Building Heat Losses through Slab-on-Ground Structures Based on Soil Temperature Measured In Situ. Energies 2021, 15, 114. [Google Scholar] [CrossRef]
  9. Larwa, B. Heat Transfer Model to Predict Temperature Distribution in the Ground. Energies 2019, 12, 25. [Google Scholar] [CrossRef]
  10. Tsilingiridis, G.; Papakostas, K. Investigating the relationship between air and ground temperature variations in shallow depths in northern Greece. Energy 2014, 73, 1007–1016. [Google Scholar] [CrossRef]
  11. Dhansay, T.; Musekiwa, C.; Ntholi, T.; Chevallier, L.; Cole, D.; De Wit, M.J. South Africa’s geothermal energy hotspots inferred from subsurface temperature and geology. S. Afr. J. Sci. 2017, 113, 11–12. [Google Scholar] [CrossRef] [PubMed]
  12. González, V.G.; Ruiz, G.R.; Bandera, C.F. Ground characterization of building energy models. Energy Build. 2021, 254, 111565. [Google Scholar] [CrossRef]
  13. Kruis, N.; Krarti, M. KivaTM: A Numerical Framework for Improving Foundation Heat Transfer Calculations. J. Build. Perform. Simul. 2015, 8, 449–468. [Google Scholar] [CrossRef]
  14. U.S Department of Energy. M&V Guidelines: Measurement and Verification for Performance-Based Contracts Version 4.0. 2015. Available online: https://www.energy.gov/sites/default/files/2016/01/f28/mv_guide_4_0.pdf (accessed on 22 January 2023).
  15. Abouhamad, M.; Abu-Hamd, M. Life Cycle Assessment Framework for Embodied Environmental Impacts of Building Construction Systems. Sustainability 2021, 13, 461. [Google Scholar] [CrossRef]
  16. Chastas, P.; Theodosiou, T.; Kontoleon, K.J.; Bikas, D. Normalising and assessing carbon emissions in the building sector: A review on the embodied CO2 emissions of residential buildings. Build. Environ. 2018, 130, 212–226. [Google Scholar] [CrossRef]
  17. Zhang, X.; Liu, K.; Zhang, Z. Life cycle carbon emissions of two residential buildings in China: Comparison and uncertainty analysis of different assessment methods. J. Clean. Prod. 2020, 266, 122037. [Google Scholar] [CrossRef]
  18. Royal Institution of Chartered Surveyors. Whole Life Carbon Assessment for the Built Environment. RICS Professional Statement. RICS, London. 2017. Available online: https://www.rics.org/content/dam/ricsglobal/documents/standards/Whole_life_carbon_assessment_PS_Sept23.pdf (accessed on 17 August 2023).
  19. ARUP. Carbon Footprint of Façades: Significance of Glass. Findings from the Life Cycle Assessment of 16 Façade Typologies & 18,000 Design Simulation. 2022. Available online: https://www.shareyourgreendesign.com/wp-content/uploads/2022/08/texto-3.pdf (accessed on 15 July 2023).
  20. Carbon Leadership Forum. Embodied Carbon Benchmark Study LCA for Low Carbon Construction: Part One. 2017. Available online: https://carbonleadershipforum.org/wp-content/uploads/2017/02/CLF-Embodied-Carbon-Benchmark-Study.pdf (accessed on 22 July 2023).
  21. Košir, M.; Gostiša, T.; Kristl, Z. Influence of architectural building envelope characteristics on energy performance in Central European climatic conditions. J. Build. Eng. 2018, 15, 278–288. [Google Scholar] [CrossRef]
  22. Cox-Smith, I. Perimeter Insulation of Concrete Slab Foundations; Study Report SR352; Branz Ltd.: Judge Ford, New Zealand, 2016; Available online: https://d39d3mj7qio96p.cloudfront.net/media/documents/SR352_Perimeter_insulation_of_concrete_slab_foundations.pdf (accessed on 28 October 2023).
  23. Dong, Y.; Kong, J.; Mousavi, S.; Rismanchi, B.; Yap, P. Wall Insulation Materials in Different Climate Zones: A Review on Challenges and Opportunities of Available Alternatives. Thermo 2023, 3, 38–65. [Google Scholar] [CrossRef]
  24. Melo, A.P.; Lamberts, R.; Versage, R.S.; Zhang, Y. Is Thermal Insulation Always Beneficial in Hot Climate? In Proceedings of the BS2015: 14th Conference of International Building Performance Simulation Association, Hyderabad, India, 7–9 December 2015; Available online: http://www.ibpsa.org/proceedings/BS2015/p2188.pdf (accessed on 25 June 2023).
  25. Conradie, D.; van Reenen, T.; Bole, S. Degree-day building energy reference map for South Africa. Build. Res. Inf. 2018, 46, 191–206. [Google Scholar] [CrossRef]
  26. CSIR. Koppen Geiger Zones. 2023. Available online: https://csir.maps.arcgis.com/apps/webappviewer/index.html?id=22cb03d8bd244f6ea3dd67e946f0ce1e (accessed on 16 November 2023).
  27. Engelbrecht, F.; Landman, W.; Engelbrecht, C.; Landman, S.; Bopape, M.; Roux, B.; McGregor, J.; Thatcher, M. Multi-scale climate modelling over Southern Africa using a variable-resolution global model. Water SA 2011, 37, 647–658. [Google Scholar] [CrossRef]
  28. Climate.OneBuilding.Org. Repository of Free Climate Data for Building Performance Simulation. 2023. Available online: http://climate.onebuilding.org/ (accessed on 15 June 2023).
  29. Resilient Buildings. Resilient Buildings Lab: Researching the Impact of Climate Change on the Built Environment. 2023. Available online: https://resilientbuildings.org/ (accessed on 29 November 2023).
  30. White Box Technologies. Weather Data for Energy Calculations. 2023. Available online: https://resilientbuildings.org/ (accessed on 29 November 2023).
  31. Brown. Assessment of Future Typical Meteorological Year Data Files. 2020. Available online: https://www.nyserda.ny.gov/-/media/Project/Nyserda/Files/Publications/Research/Environmental/21-01-Assessment-of-Future-Typical-Meterological-Year-Data-Files.pdf (accessed on 28 November 2023).
  32. Society of Building Science Educators. Climate Cosultant. 2023. Available online: https://www.sbse.org/resources/climate-consultant (accessed on 15 July 2023).
  33. SANS10400-XA. The Application of the National Building Regulations Part X: Environmental Sustainability Part XA: Energy Usage in Buildings. SABS Standards Division. 2022. Available online: https://www.spectechonline.com/10400-xa (accessed on 13 March 2022).
  34. Gervasio, H.; Dimova, S.; Pinto, A. Benchmarking the Life-Cycle Environmental Performance of Buildings. Sustainability 2018, 10, 1454. [Google Scholar] [CrossRef]
  35. Circular Ecology. Inventory of Carbon and Energy Database V3. 2019. Available online: https://circularecology.com/embodied-carbon-footprint-database.html (accessed on 26 May 2023).
  36. IEA. Basics for the Assessment of Embodied Energy and Embodied GHG Emissions for Building Construction. Guideline for Designers and Consultants—Part 1. 2016. Available online: http://www.iea-ebc.org/Data/publications/EBC_Annex_57_Guideline_for_Designers_Part_1.pdf (accessed on 10 January 2022).
  37. U.S Department of Energy. Insulation Materials. 2023. Available online: https://www.energy.gov/energysaver/insulation-materials (accessed on 10 July 2023).
  38. Lazo, M.; Puga, I.; Macías, M.A.; Barragán, A.; Manzano, P.; Rivas, A.; Rigail-Cedeño, A. Mechanical and thermal properties of polyisocyanurate rigid foams reinforced with agricultural waste. Case Stud. Chem. Environ. Eng. 2023, 8, 100392. [Google Scholar] [CrossRef]
  39. Netsch, N.; Simons, M.; Feil, A.; Leibold, H.; Richter, F.; Slama, J.; Yogish, S.P.; Greiff, K.; Stapf, D. Recycling of polystyrene-based external thermal insulation composite systems–Application of combined mechanical and chemical recycling. Waste Manag. 2022, 150, 141–150. [Google Scholar] [CrossRef] [PubMed]
  40. Reynoso, L.E.; Romero, A.B.C.; Viegas, G.M.; Juan, G.A.S. Characterization of an alternative thermal insulation material using recycled expanded polystyrene. Constr. Build. Mater. 2021, 301, 124058. [Google Scholar] [CrossRef]
  41. Füchsl, S.; Rheude, F.; Röder, H. Life cycle assessment (LCA) of thermal insulation materials: A critical review. Clean. Mater. 2022, 5, 10011. [Google Scholar] [CrossRef]
  42. Thermtest Instruments. Materials Thermal Properties Database. 2023. Available online: https://thermtest.com/thermal-resources/materials-database (accessed on 2 July 2023).
  43. Intelligent Communities Lifecycle. Table 6: Thermal Conductivity, Specific Heat Capacity and Density. 2023. Available online: https://help.iesve.com/ve2021/table_6_thermal_conductivity__specific_heat_capacity_and_density.htm (accessed on 12 May 2022).
  44. BigLadder Software. Engineering Reference—EnergyPlus 8.7. 2023. Available online: https://bigladdersoftware.com/epx/docs/8-7/engineering-reference/ground-heat-transfer-calculations-using-kiva.html (accessed on 29 November 2023).
  45. Kruis, N. Development and Application of a Numerical Framework for Improving Building Foundation Heat Transfer Calculations. Ph.D. Dissertation, University of Colorado, Denver, CO, USA, 2015. [Google Scholar]
  46. Liu, H.; Li, J.; Sun, Y.; Wang, Y.; Zhao, H. Estimation Method of Carbon Emissions in the Embodied Phase of Low Carbon Building. Adv. Civ. Eng. 2020, 2020, 8853536. [Google Scholar] [CrossRef]
  47. Hlavac, M. Stargazer: Well-Formatted Regression and Summary Statistics Tables. R Package Version 5.2.3. 2022. Available online: https://CRAN.R-project.org/package=stargazer (accessed on 20 July 2023).
  48. Crawford, R.H. Embodied Energy of Common Construction Assemblies (Version 1.0); The University of Melbourne: Melbourne, Australia, 2019. [Google Scholar]
  49. CSIR. Energy Demand. 2023. Available online: https://csir.maps.arcgis.com/apps/webappviewer/index.html?id=79602766e2b54ede82625c939ac1814b (accessed on 16 November 2023).
  50. Home Insulations. South African Building Laws. 2020. Available online: https://www.homeinsulations.co.za/sans-10400-xa/ (accessed on 29 November 2023).
  51. NASA. Power Data Access View. 2019. Available online: https://power.larc.nasa.gov/data-access-viewer/ (accessed on 10 January 2019).
Figure 1. Building lifecycle stages [18].
Energies 17 00539 g001
Figure 2. Diagrammatic overview of the methodology used (Source: authors).
Energies 17 00539 g002
Figure 3. Diagrammatic representation of the building model (the wall envelope and inner partitions). Source: authors.
Energies 17 00539 g003
Figure 4. Net saved energy after 50 years under Welkom (zone 1) and Witbank (zone 2) at different levels of slab insulation depth (200 to 2000 mm) and insulation thickness (25 to 200 mm). Source: authors.
Energies 17 00539 g004
Figure 5. Net saved energy after 50 years for Thohoyandou (zone 3) and Cape Town (zone 4) at different levels of slab insulation depth (200 to 2000 mm) and insulation thickness (25 to 200 mm). Source: authors.
Energies 17 00539 g005
Figure 6. Net saved energy after 50 years for Pretoria (zone 5) and Ixopo (zone 5H). Source: authors.
Energies 17 00539 g006
Figure 7. Net saved energy after 50 years for Sutherland (zone 6) and Fraserburg (zone 7). Source: authors.
Energies 17 00539 g007
Figure 8. Net energy savings after 50 years for Welkom (zone 1) and Witbank (zone 2) at different levels of slab horizontal insulation width from the slab edges (200 to 2000 mm) and insulation thickness (25 to 200 mm). Source: authors.
Energies 17 00539 g008
Figure 9. Net energy savings after 50 years for Thohoyandou (zone 3) and Cape Town (zone 4) at different levels of slab horizontal insulation width from the slab edges (200 to 2000 mm) and insulation thickness (25 to 200 mm). Source: authors.
Energies 17 00539 g009
Figure 10. Net energy savings after 50 years for Pretoria (zone 5) and Ixopo (zone 5H) at different levels of slab horizontal insulation width from the slab edges (200 to 2000 mm) and insulation thickness (25 to 200 mm). Source: authors.
Energies 17 00539 g010
Figure 11. Net energy savings after 50 years for Sutherland (zone 6) and Fraserburg (zone 7) at different levels of slab horizontal insulation width from the slab edges (200 to 2000 mm) and insulation thickness (25 to 200 mm). Source: authors.
Energies 17 00539 g011
Figure 12. Energy payback periods and net energy savings (after 50 years) for full floor slab horizontal polyiso (PIR) insulation at different levels of insulation thickness (25 to 200 mm). Source: authors.
Energies 17 00539 g012
Table 1. A ranking of the importance of the ten best design guidelines per energy zone that ensure 100% thermal comfort.
Guideline NumberDesign GuidelineRank (Welkom: Zone 1)Rank (Pretoria: Zone 5)Rank (Cape Town: Zone 4)Rank (Ixopo: Zone 5H)Rank (Fraserburg: Zone 7)Rank (Witbank: Zone 2)Rank (Thohoyandou: Zone 3)Rank (Sutherland: Zone 6)
11Heat gain from lights, people, and equipment greatly reduces heating needs to keep the home tight and well insulated (and to lower balance point temperature).54112393
58Shade to prevent overheating, open the house to breezes in summer, and use passive solar gains in winter.1228713
62Use lightweight construction with slab on grade, operable walls, and shaded outdoor spaces.21334218
35Good natural ventilation: use shaded windows that are oriented to prevailing breezes.33455426
56Screened porches and patios can provide passive comfort cooling by ventilation in warm weather and can prevent insect problems.965 104
63In overcast cool climates, use low-mass, tightly sealed, well-insulated construction to provide rapid heat accumulation in the morning. 66
55Use low-pitched roofs with wide overhangs.877111067
19For passive solar heating, face most of the glass area north to maximize winter sun exposure, though overhangs should be designed to fully shade in summer.488215101
10Glazing should minimize conductance loss and gain because undesired solar radiation gain has less impact on the temperate climate in Port Elizabeth. 94
33A long, narrow building floor plan helps to maximize cross ventilation in this temperate, hot, and humid climate.751010975
20Provide double-pane high-performance glazing (Low-E) on west, south, and east, but clear on north for maximum passive solar gain.69 38 2
3For heating and cooling, lower the indoor comfort temperature at night to reduce energy consumption (at home: 6 p.m. to midnight = 70–80 °F; midnight to 6 am = 55–78 °F; 6 a.m. to 8 a.m. = 70–80 °F; not at home (work, school): 8 a.m. to 6 p.m. = 65–85 °F) 1012769 4
31Organize the floor plan so that the winter sun penetrates into daytime use spaces with specific functions that coincide with solar orientation.10
36To facilitate cross ventilation, locate door and window openings on opposite sides of the building with larger openings (facing up-wind if possible). 6
8Sunny wind-protected outdoor spaces can extend living areas in cool weather (seasonal sun rooms, enclosed patios, courtyards, or verandahs). 9 7
1Tiles or slate (even on wood floors) or a stone-faced fireplace provides enough surface mass to store winter daytime solar gains and summer nighttime ‘coolth’. 8 5
68Traditional passive homes in hot, humid climates use lightweight construction with openable walls and shaded outdoor porches raised above ground. 8
15A high-efficiency furnace (at least Energy Star) should prove cost-effective. 9
18Keep the building small (correctly sized) because excessive floor area wastes heating and cooling energy. 10
Source: authors.
Table 2. Other details from the design.
ItemDetails
Energy zonesEnergy zones 1, 2, 3, 4, 5, 5H, 6, and 7
LocationWelkom = zone 1; Kimberley = zone 1; Witbank = zone 2; Thohoyandou = zone 3; Cape Town = zone 4; Mthatha = zone 4; Pretoria = zone 5; Nespruit = zone 5; Ixopo = zone 5H; Sutherland = zone 6; Fraserburg = zone 7.
Shading depths (m)Welkom = 0.62; Kimberley = 0.62; Wibank = 0.54; Thohoyandou = 0.49; Cape Town = 0.73; Mthatha = 0.68; Pretoria = 0.54; Nelspruit = 0.54; Ixopo = 0.68; Sutherland = 0.73; Fraserburg = 0.68.
Orientation of buildingFront wall faces north. Back wall faces south. Right wall faces east. Left wall faces west.
Inside length of the floor (m) (runs in the east–west direction)15.5 m.
Inside width of the floor (m) (runs in the north–south direction)6.8 m.
Net floor area (m2)105.40 m2.
Wall height (m)2.7 m.
Inner wall thickness (m)0.90 m.
Net inner wall area (m2)89.06 m2.
Cavity wall thickness: gypsum plaster, clay brick leaf1, air gap, clay brick leaf 2, gypsum plaster (units: m)0.010 m, 0.110 m, 0.050 m, 0.110 m, 0.010 m.
Cavity wall: surface density; R-Value; U-Value; [SANS10400-XA Reference R-Values]431.08 Kg/m2; 0.68 m2K/W; 1.46 W/m2K; [Ref R: 0.4 and 0.6 m2K/W].
Roof: materialsLightweight metal material. Gypsum plasterboard ceiling. OSB decking/sheathing. Insulation.
Roof: R-Value; U-Value; [SANS10400-XA Reference R-Value]3.8 m2·K/W; 0.46 W/m2K; [3.7 m2·K/W].
Fenestration
Fenestration to net floor area; total fenestration area (m2)0.228 m2; 11.886 m2.
U-Value; [SANS10400-XA U-Value reference upper limit]2.258; [5.20 W/m2K].
SHGC; [SANS10400-XA reference upper limit]0.571; [0.66].
Window-to-wall ratios (WWRs)
Front, back, left, right WWRs [Overall WWR]0.277, 0.240, 0.05, 0.05 [0.20].
Window to floor area0.22.
Cavity wall materialsValues (Density; Specific heat; conductivity; Embodied energy coefficient; Embodied CO2 coefficient): SI units
1. Clay brick (Service life = 150 years or more)1826 Kgm−3; 0.835 KJ/Kg·K; 0.820 W/m·K; 3.20 MJ/Kg; 0.240 KgCO2/Kg.
Floor
Floor slab thickness (m)0.100.
XPS vertical insulation (service life = 100 years)32 Kgm−3; 1.50 KJ/Kg·K; 0.028 W/m·K; 89.5 MJ/Kg; 2.80 (−1.41) KgCO2/Kg.
Polyiso vertical insulation (service life = 120 years)35 Kgm−3; 0.80 KJ/Kg·K; 0.025 W/m·K; 72 MJ/Kg; 3.9695 KgCO2/Kg.
Insulation depths analyzed (m)0.20 to 2.0 m at intervals of 0.20 m.
Insulation thicknesses analyzed (mm)25, 50, 100, 150, 200 mm.
Foundation thickness (m): Strip Foundation (stones used)0.220 m.
WWR computationSource energy was used as the basis. The only source of energy was electricity.
Model validationSite energy was compared to standards, and the only source of energy was electricity.
Model’s determination of the impact of insulation measuresEnergy savings were based on site energy. The only source of energy was electricity.
Schedules: cooling set point; heating set point; relative humidity (weekdays and weekend)25 °C; 19 °C; 60%.
Source: authors.
Table 3. Maximum, minimum, and mean annual site (and source in brackets) energy consumption per net floor area and loads not met (% of annual hours) for the vertical gap insulation method.
Welkom (Zone 1)Witbank (Zone 2)ThohoyaThohoyandoundou (Zone 3)Cape Town (Zone 4)Pretoria (Zone 5)Ixopo (Zone 5H)Sutherland (Zone 6)Fraserburg (Zone 7)
Heating/cooling demandMedium/mediumMedium/lowLow/highLow/lowLow/mediumLow/mediumHigh/lowHigh/medium
Maximum
(KWh/m2)
24.61
(77.7)
21.00
(66.27)
29.37
(92.66)
24.11
(76.14)
25.61
(80.79)
24.5
(77.36)
34.18
(107.73)
28.06
(88.29)
Minimum
(KWh/m2)
20.83
(65.82)
19.08
(60.15)
24.64
(77.73)
23.39
(73.72)
20.69
(65.27)
21.91
(69.16)
30.65
(96.64)
23.8
(75.14)
Range: site (KWh/m2)3.781.924.730.724.922.593.534.26
Mean
(KWh/m2)
22.22
(70.09)
19.77
(62.37)
26.43
(83.35)
23.75
(74.94)
22.49
(70.94)
22.82
(71.97)
32.11
(101.25)
25.43
(80.21)
SD
(KWh/m2)
1.005
(3.164)
0.522
(1.641)
1.282
(4.04)
0.182
(0.566)
1.341
(4.231)
0.71
(2.24)
0.807
(2.545)
1.043
(3.284)
SANS10400-XA
reference (KWh/m2)
9010050808560110110
Annual unmet heating
and cooling loads
Maximum
(% hours)
2%3%0%2%1%1%0%2%
Minimum
(% hours)
0%2%0%0%0%0%0%0%
Mean (% hours)1%2%0%1%0%0%0%1%
SD (% hours)0.42%0.26%0.00%0.61%0.26%0.08%0.00%0.42%
SANS10400-XA reference
(% hours)
5%5%5%5%5%5%5%5%
Source: authors.
Table 4. Minimum and maximum net energy savings per m2 of net floor area (KWh/m2) after 50 years for vertical gap insulation.
Welkom (Zone 1) (min; max)Witbank (Zone 2) (min; max)Thohoyandou (Zone 3) (min; max)Cape Town (Zone 4) (min; max)Pretoria (Zone 5) (min; max)Ixopo (Zone 5H) (min; max)Sutherland (Zone 6) (min; max)Fraserburg (Zone 7) (min; max)
XPS (25 mm)12.1; 100.63.8; 47.114.9; 127.10.5; 2.716.3; 138.28; 71.821.9; 81.524.7; 109
XPS (50 mm)10.5; 116.32.1; 48.113.2; 149−9.5; 0.714.6; 160.86.3; 76.725.8; 94.825.7; 125.4
XPS (100 mm)7; 108.8−2.7; 36.35.6; 146.3−37.2; −2.77; 158.81.4; 62.825.1; 85.220.9; 124
XPS (150 mm)3.4; 94.7−10.8; 25.42; 132.9−71.9; −6.42; 144.6−3.6; 50.221.5; 66.118.7; 107
XPS (200 mm)−0.5; 81.1−47.8; 17.1−1.9; 118.2−109; −8.8−1.9; 128.4−15.8; 41.719; 53.714.8; 92.2
Polyiso (25 mm)13.9; 109.94.2; 54.316.7; 136.31.4; 5.616.7; 147.48.3; 77.922.3; 8925; 116.8
Polyiso (50 mm)14; 127.22.8; 54.814; 161.90.1; 3.216.8; 175.87; 85.426.5; 104.926.5; 138.3
Polyiso (100 mm)8.5; 123.5−1.3; 44.18.5; 163.9−22.3; 0.38.5; 176.42.9; 74.726.6; 104.323.8; 138.9
Polyiso (150 mm)5.7; 110.5−4.1; 33.84.3; 153.9−48.9; −2.77.1; 165−1.3; 63.123.8; 87.221; 126.1
Polyiso (200 mm)2.7; 99.9−15.8; 26.31.3; 141.5−75.6; −72.7; 151.3−4.2; 5422.2; 70.618; 113.7
Source: authors.
Table 5. Maximum, minimum, and mean annual site (and source in brackets) energy consumption per net floor area and loads not met (hours) for horizontal floor slab insulation (including full floor slab insulation).
Welkom (Zone 1)Witbank (Zone 2)Thohoyandou (Zone 3)Cape Town (Zone 4)Pretoria
(Zone 5)
Ixopo (Zone 5H)Sutherland (Zone 6)Fraserburg (Zone 7)
Heating/cooling demand (SANS10400)Medium/
medium
Medium/
low
Low/highLow/lowLow/
medium
Low/
medium
High/lowHigh/
medium
Maximum (KWh/m2)24.61 (77.7)21.00 (66.27)29.37 (92.66)24.11 (76.14)25.61 (80.79)24.5 (77.36)34.18 (107.73)28.06 (88.29)
Minimum (KWh/m2)21.86 (68.86)19.3 (60.9)25.95 (81.84)23.03 (72.64)21.89 (69.02)22.28 (70.36)29.95 (94.38)24.83 (78.45)
Range: site (KWh/m2)2.751.73.421.083.722.224.233.23
Mean (KWh/m2)22.17 (69.91)19.52 (61.59)26.38 (83.2)23.48 (74.06)22.38 (70.6)22.58 (71.2)31.32 (98.76)25.25 (79.65)
SD (KWh/m2)0.426 (1.363)0.266 (0.83)0.54 (1.708)0.205 (0.677)0.584 (1.852)0.338 (1.083)0.731 (2.297)0.514 (1.604)
SANS10400-XA Reference (KWh/m2)9010050808560110110
Annual unmet heating and cooling loads
Maximum (% hours)0.01%1.34%2.28%0.00%2.09%0.78%0.08%0.00%
Minimum (% hours)0.00%0.41%1.97%0.00%0.73%0.10%0.00%0.00%
Mean (% hours)0.00%0.52%2.06%0.00%0.95%0.24%0.02%0.00%
SD (% hours)0.00%0.14%0.05%0.00%0.24%0.13%0.02%0.00%
SANS10400-XA Reference (% hours)5%5%5%5%5%5%5%5%
Source: authors.
Table 6. Minimum and maximum net energy savings per m2 of net floor area (KWh/m2) after 50 years for horizontal floor slab insulation.
Welkom (Zone 1) (min; max)Witbank (Zone 2) (min; max)Thohoyandou (Zone 3)
(min; max)
Cape Town (Zone 4) (min; max)Pretoria (Zone 5) (min; max)Ixopo (Zone 5H) (min; max)Sutherland (Zone 6) (min; max)Fraserburg (Zone 7) (min; max)
Polyiso: (25 mm)92.6; 99.253.2; 56113.4; 120.214.3; 18.9123.2; 131.671.3; 75.983.8; 123.2103.3; 112.1
Polyiso: (50 mm)88.8; 110.351.3; 58.8113.8; 133.911.1; 14.3125; 14572.1; 81.395; 136.1113.8; 119.5
Polyiso: (100 mm)69.1; 121.727.3; 63.399.6; 150.9−6.3; 11.8108; 164.855.1; 85.5114.7; 142.7101; 132.8
Polyiso: (150 mm)39.4; 116.2−0.9; 55.165.8; 149.6−31.2; 3.676.9; 163.525.5; 78.7103.9; 122.874.2; 130.1
Polyiso: (200 mm)4; 107.9−34.9; 46.731.8; 139.8−62.7; −6.141.6; 156.5−5.7; 68.981; 102.343; 121.8
Source: authors.
Table 7. General summary of optimum polyiso (PIR) insulation thicknesses, depths, and widths that lead to the maximization of net energy savings in each energy zone.
Insulation MethodMeasurementPIR (Zone 1:Welkom)PIR (Zone 2: Witbank)PIR (Zone 3: Thohoyandou)PIR (Zone 4: Cape Town)PIR (Zone 5: Pretoria)PIR (Zone 5H: Ixopo)PIR (Zone 6: Sutherland)PIR (Zone 7: Fraserburg)
Heating/cooling demandMedium/
medium
Medium/
low
Low/
high
Low/
low
Low/
medium
Low/
medium
High/
low
High/
medium
Maximum site (source) energy use (KWh/m2)24.61 (77.7)21.00 (66.27)29.37 (92.66)24.11 (76.14)25.61 (80.79)24.5 (77.36)34.18 (107.73)28.06 (88.29)
1: Gap verticalOptimum thickness (m)0.0500.0500.1000.0250.1000.0500.0500.100
1: Gap verticalOptimum depth (m)2.0001.8001.8002.0001.8001.8002.0001.800
1: Gap verticalNet energy savings (KWh/m2)127.1654.79163.925.61176.4385.38104.92138.89
1: Gap verticalRatio: energy savings relative to zone 4 Gap vertical energy savings22.79.829.21.031.415.218.724.8
1: Gap verticalRank of ratios: energy savings relative to zone 4 gap vertical energy savings47281653
1: Gap verticalPayback period (Years)8.815.411.535.610.811.110.313.0
2: Horizontal perimeterOptimum thickness (m)0.1000.1000.1000.0250.1000.1000.1000.100
2: Horizontal perimeterOptimum width (m)0.2000.2000.2002.0000.2000.2002.0000.200
2: Horizontal perimeterNet energy savings (KWh/m2)121.6763.27150.8718.88164.7785.51142.75132.79
2: Horizontal perimeterRatio: energy savings relative to zone 4 gap vertical energy savings21.711.326.93.429.415.225.423.7
2: Horizontal perimeterRank of ratios: energy savings relative to zone 4 gap vertical energy savings57281634
2: Horizontal perimeterPayback period (Years)4.47.93.620.03.46.113.94.1
3: Horizontal (whole slab)Optimum thickness (m)0.0250.0250.0250.0250.0250.0250.1000.050
3: Horizontal (whole slab)Net energy savings (KWh/m2)76.0946.8996.9519.08105.2964.96164.4797.58
3: Horizontal (whole slab)Ratio: energy savings relative to zone 4 gap vertical energy savings13.68.417.33.418.811.629.317.4
3: Horizontal (whole slab)Rank of ratios: energy savings relative to zone 4 gap vertical energy savings57482613
3: Horizontal (whole slab)Payback period (Years)9.814.18.024.67.511.115.813.8
Source: authors.
Disclaimer/Publisher’s Note: The statements, opinions and data contained in all publications are solely those of the individual author(s) and contributor(s) and not of MDPI and/or the editor(s). MDPI and/or the editor(s) disclaim responsibility for any injury to people or property resulting from any ideas, methods, instructions or products referred to in the content.

