Article

Feasibility Study on Production of Slush Hydrogen Based on Liquid and Solid Phase for Long Term Storage

1
Institute for Advanced Engineering, Yongin 17180, Republic of Korea
2
Department of Mechanical Engineering, Korea Advanced Institute of Science and Technology (KAIST), Daejeon 34141, Republic of Korea
*
Author to whom correspondence should be addressed.
Energies 2024, 17(17), 4415; https://doi.org/10.3390/en17174415
Submission received: 29 July 2024 / Revised: 28 August 2024 / Accepted: 29 August 2024 / Published: 3 September 2024
(This article belongs to the Section A5: Hydrogen Energy)

Abstract

:
To achieve net-zero objectives, the expansion of renewable energy sources is anticipated to be accompanied by an increased use of carbon-free fuels, such as hydrogen. Internationally, there are proposals for transporting hydrogen by synthesizing it into carriers like ammonia or Liquid Organic Hydrogen Carriers (LOHCs). However, considering the energy consumption required for hydrogenation and dehydrogenation processes and the need for high-purity hydrogen production, the development of liquid hydrogen transportation technologies is becoming increasingly important. Liquid hydrogen, with a density approximately one-sixth that of liquid natural gas and a boiling point roughly 90 K lower, poses significant challenges in suppressing and managing boil-off gas during transportation. Slush hydrogen, a mixture of liquid and solid phases, offers potential benefits. with an approximate 15% increase in density and an 18% increase in thermal capacity compared to liquid hydrogen. The latent heat of fusion of solid hydrogen effectively suppresses boil-off gas (BOG), and the increased density can reduce transportation costs. This study experimentally validated the long-duration storage and transportation concept of slush hydrogen by adapting NASA’s (National Aeronautics and Space Administration) proposed IRAS (Integrated Refrigeration and Storage) technology for compact and mobile tanks. Slush hydrogen was successfully produced by reaching the triple point of hydrogen, resulting in a composition of 47% solid and 53% liquid, with a density of approximately 80.9 kg/m3. Most importantly, methodologies were presented to observe and measure whether the hydrogen was indeed in the slush state and to determine its density. Additionally, CFD (Computational Fluid Dynamics) analysis was performed using solid hydrogen properties, and the results were compared with experimental values. Notably, this analytical technique can be utilized in designing large-capacity tanks for storing slush hydrogen.

1. Introduction

Amid continuous economic and industrial advancement, reliance on fossil fuels has become increasingly pronounced, accelerating global warming. The Intergovernmental Panel on Climate Change (IPCC) has proposed a target to limit the increase in global temperatures to less than 1.5 °C above pre-industrial levels. To achieve this goal, it is essential to reduce fossil fuel consumption and consider renewable energy sources and carbon-neutral fuels [1]. Hydrogen gas, the lightest element produced after the Big Bang, is abundant, comprising 75% of the universe. Its significance lies in its lack of greenhouse gas emissions following combustion and oxidation reactions, making it a sustainable and environmentally friendly energy source [2]. However, the high energy density per unit mass of hydrogen has led to its extensive use as a fuel in the aerospace sector. Despite this, with a Lower Heating Value (LHV) based energy density of only 9.9 MJ/m3, its volumetric energy density is relatively low, complicating storage and transportation compared to other gaseous fuels [3]. Hydrogen storage technologies are classified into physical-based storage, physical adsorption, and chemical adsorption (Figure 1).
Physical adsorption stores hydrogen by adsorbing it into the porous structure of materials such as metal-organic frameworks (MOFs). Despite low binding energies and rapid charge and discharge rates, this technique faces challenges related to the low gravimetric and volumetric densities of hydrogen, necessitating larger storage tanks [4,5,6]. Chemical adsorption involves storing hydrogen by chemically binding it to nitrogen or hydrocarbons. Ammonia and Liquid Organic Hydrogen Carriers (LOHC) are representative technologies for chemical adsorption storage [7,8]. The primary technology for hydrogen storage, distinct from chemical or physical adsorption, is physical containment through phase changes enabled by compression or liquefaction without dependency on an alternative storage medium. Compressed hydrogen storage technology increases hydrogen density significantly compared to standard temperatures and pressures (STP) via compression. These storage vessels are categorized into four types based on the material and type of liner used. Type III vessels can increase storage pressure to 70 MPa while weighing less than 30% of Type I tanks. Type IV vessels offer similar pressure containment capabilities as Type III but use polyethylene and High-Density Polyethylene (HDPE) liners instead of metal liners, making them the lightest containers capable of withstanding high pressures [9,10]. Cryo-compressed hydrogen storage technology compresses hydrogen into a supercritical state at approximately 40 K, offering higher storage density and enabling faster, more efficient charging. However, high safety measures must be in place to prevent explosions due to significant gas volume fluctuations from insulation performance deterioration [11]. Liquid hydrogen storage achieves a high density of approximately 71 kg/m3 by transitioning to a liquid state at around 20 K, nearly 1.8 times the density achievable with high-pressure gas storage at 70 MPa. This makes it suitable for large-scale storage and transportation industries. Liquid hydrogen trailers can transport over five times the capacity of compressed hydrogen gas-tube trailers, though preventing thermal influx using double-walled vessels and vacuum jackets and maintaining low temperatures through re-liquefaction devices and safety facilities results in higher costs [12]. This paper reviews the hydrogen storage properties of graphene-based materials modified with various metals, focusing on their potential to achieve the U.S. Department of Energy’s storage target. The paper highlights that pristine graphene does not meet the hydrogen storage requirements, but metal decoration, particularly with lithium and calcium, significantly enhances storage capacity. Both theoretical predictions and experimental findings are discussed, covering metals such as alkali, alkaline earth, and transition metals, and their role in improving hydrogen adsorption. The analysis concludes that optimizing graphene’s surface properties through metal modifications presents a viable path toward effective hydrogen storage solutions [13].
Figure 2 illustrates the hydrogen storage costs associated with hydrogen conversion and reconversion for each storage technology, as reported by the International Energy Agency (IEA). For liquid hydrogen, a significant portion of energy (over 40%) is used for liquefaction, making hydrogen conversion relatively expensive. However, the simple reconversion process reduces reconversion costs, making liquid hydrogen the most cost-effective technology for hydrogen storage and transportation based on total cost analysis [14].
The boiling point of liquid hydrogen is approximately 20 K, which is about 90 K lower than that of liquefied natural gas (LNG). Due to this physical property, it is expected that more boil-off gas will be generated from heat penetration from the outside. Furthermore, predicting the boil-off gas for liquid hydrogen is challenging due to the unclear film-boiling regime compared to other fluids like LNG. The gas barrier formed by film boiling usually blocks the intrusion of external heat; however, liquid hydrogen cannot achieve this for the reasons mentioned above [15,16,17]. As illustrated in Figure 3, the slush phase represents a state where both liquid and solid coexist, typically consisting of 50% liquid and 50% solid. Notably, the slush phase has a higher density than regular liquids. Unlike water converting to a slush phase, slush hydrogen can increase its density by approximately 15%. Additionally, for ammonia and LNG, conversion to the slush phase can increase density by 13–18%. Moreover, because it behaves like a liquid, it can be transported through pipelines, and during this process, the heat of fusion of the solids can suppress boil-off gas [18,19].
Various studies have investigated methods for producing slush hydrogen. Daney et al. explored the production of slush hydrogen using the Augur method in facilities where a refrigerant cycle with liquid helium was applied. They successfully produced slush hydrogen with a specially designed augur of 178 mm in diameter. They noted that the cooling temperature and the rotational speed of the augur were crucial factors in optimizing slush hydrogen production [20]. Fujiwara et al. produced slush hydrogen at a rate of 4.16 kg/s using the Augur method, with approximately 1.25 l/s of liquid helium supplied for cooling, yielding significant results. As the solid hydrogen rapidly accumulated between the solid hydrogen and the blades, the augur’s speed and production capacity significantly decreased. To investigate this issue, experiments were conducted to produce slush nitrogen instead of hydrogen [21]. Ohira et al. produced slush hydrogen using the freeze-thaw method by applying a vacuum pump to a Dewar container filled with liquid hydrogen to reach the triple point pressure. They measured the density of the slush hydrogen using a capacitance method that allowed for density measurement [22]. Swagner et al. implemented Integrated Refrigeration and Storage (IRAS) technology using the freeze-thaw method on a 125 m3 scale and conducted a demonstration project using an R1620 helium refrigerator. As the solid fraction reached approximately 25%, they adopted the term ‘densification’ instead of ‘slush hydrogen’. To achieve this, they installed a submerged heat exchanger in a tank and supplied cold helium gas to the heat exchanger [19]. Brunnhoger et al. proposed a technology for producing slush hydrogen using a spray method called a “Slush Gun”. The nozzle had a capacity of 1.5 L/h, allowing for the production of solid hydrogen particles ranging from 0.2 mm to 0.5 mm. Liquid hydrogen expelled from a spray gun installed at the bottom of a liquid helium tank dispersed into liquid helium, forming solid hydrogen. Liquid hydrogen at 20 K immediately turned into solid hydrogen upon direct contact with liquid helium at approximately 4 K. The helium, transformed from a liquid to a gaseous state by the liquid hydrogen, was recycled through a helium liquefier. This system for producing slush hydrogen is notable for its effectiveness in minimizing helium loss [23]. Berstad et al. assessed the use of liquid hydrogen as a potential energy carrier and designed its supply chain, highlighting the technical challenges related to heat ingress and the construction of large-capacity tanks within the liquid hydrogen supply network. They concluded that boil-off gas losses due to heat ingress in liquid hydrogen storage tanks were a major issue and emphasized the need for technical improvements to minimize these losses [24]. Ratnakar et al. forecast that the liquid hydrogen market could shape a future energy market extending beyond the current LNG market. They conducted a comprehensive review of the global hydrogen supply chain and evaluated the current state and technical challenges related to large-scale storage and transport of liquid hydrogen. Specifically, they identified maintaining storage at 20 K using advanced insulation techniques and minimizing boil-off gas as the most significant challenges [25].
In this study, slush hydrogen, a mixture of liquid and solid hydrogen, is proposed as a solution to mitigate the issues of boil-off gas suppression and low storage density in liquid hydrogen transportation, and experiments were conducted to validate this concept. A 2 kg class production facility for slush hydrogen was established, and slush hydrogen was successfully produced using the freeze-thaw method. A methodology for measuring the density of slush hydrogen was proposed and validated through experimental results. Additionally, physical properties of slush hydrogen were established based on the characteristics of solid-phase hydrogen, and the experimental results were further validated through CFD analysis.

2. Definition for Slush Hydrogen Production

2.1. Slush Hydrogen

Slush hydrogen is a transitional state in which liquid and solid phases are intermixed, as shown in Figure 4. This state results from the combination of a subcooled liquid with solid hydrogen. Due to variations in solidification temperature and pressure, the temperature of slush hydrogen can differ depending on the specific conditions. Slush hydrogen can occur naturally when liquid hydrogen reaches its triple point during subcooling, or it can be artificially produced by inducing a phase change from liquid to solid and then mixing it back with the liquid. Generally, slush hydrogen, which consists of approximately 50% liquid and 50% solid, has a higher heat capacity than the original liquid hydrogen due to the thermal capacity of the solid phase. Moreover, its viscosity and flow characteristics are similar to those of liquids, which facilitates handling, supply, and storage. While transitioning water to a slush state results in increased volume, most fluids, including hydrogen, experience a volume decrease, enabling high-density storage and transportation.

2.2. Physical Properties of Slush Hydrogen

Figure 5 shows the T-S diagram of para-hydrogen. Slush hydrogen is produced by extracting an additional 29.14 kJ/kg from liquid hydrogen at its triple point, which occurs at 13.8 K and 0.007 MPa. To achieve a slush hydrogen mixture comprising 50% liquid and 50% solid, a total of 81.77 kJ/kg must be removed, which includes 52.63 kJ/kg for subcooling from the normal boiling point [26]. The density of liquid hydrogen increases from 70.78 kg/m3 at 20.27 K and 0.1 MPa to 77.02 kg/m3 as it approaches the triple point. When transitioning to the 50% solid phase, the density further increases to approximately 81.48 kg/m3.
Figure 6 illustrates the energy required for hydrogen at STP to transition through the liquid state and reach the slush state. Transitioning from gaseous hydrogen at STP to slush hydrogen requires the removal of approximately 4543.2 kJ/kg of heat, which includes sensible heat, latent heat, and ortho-para conversion energy. In contrast, producing slush hydrogen requires the removal of only about 81.77 kJ/kg of heat, representing approximately 1.79% of the liquefaction energy, indicating minimal energy consumption. The removal of heat from cryogenic fluids necessitates a refrigeration cycle, such as the reverse helium Brayton refrigeration cycle. The Coefficient of Performance (COP) of such refrigeration cycles can vary based on factors like the pinch point in the recuperator and the isentropic efficiency of the compressor and expander, which affect the actual energy consumption. According to a technical report by R. O. Voth, the energy required for slush hydrogen production can vary depending on the production method and cooling technique; however, it is generally estimated to be approximately 11.7% to 22.5% of the hydrogen liquefaction energy [18]. Further research is required to reduce the energy needed for slush hydrogen production.

2.3. Production Methods for Slush Hydrogen

The methods for producing slush hydrogen are primarily categorized into three approaches. The first method, known as the auger method, operates on principles similar to those of slush beverage machines commonly found in amusement parks, albeit at much lower temperatures. During the production process, an auger, driven by a motor or turbine, rotates slowly. As it operates, liquid hydrogen moves from the top to the bottom of the chamber, spreading outward and downward through the rotating auger. When the outer surface of the auger is exposed to 4 K liquid helium or saturated helium vapor, the liquid hydrogen condenses into a thin film of solid hydrogen between the auger and the chamber wall. The solidified hydrogen is then pushed downward as solid particles by the auger, which subsequently mix with the remaining liquid hydrogen to form slush hydrogen. The second method, the freeze-thaw method, involves inducing the fluid to reach its triple point, where both the liquid and solid phases coexist. Since the triple point represents the state where gas, liquid, and solid phases coexist, creating a vacuum of 7.042 kPa around the hydrogen can induce a phase change at the upper interface, transforming it into a solid state. As this solid hydrogen forms at the interface, it sinks due to its higher density compared to the liquid phase. Continuous agitation causes the liquid hydrogen to circulate between the upper and lower parts of the chamber, leading to repeated solidification at the interface and, consequently, the formation of slush hydrogen. The third method, the spray method, involves compressing subcooled hydrogen and then expanding it rapidly through a nozzle, resulting in a significant pressure drop. This pressure reduction quickly converts the subcooled liquid hydrogen into gaseous hydrogen. During this phase transition, the surrounding liquid hydrogen absorbs heat due to the evaporative cooling effect, causing a portion of the liquid hydrogen to solidify into slush hydrogen. In this scenario, reducing the internal chamber pressure through vacuum conditions can enhance the expansion ratio, thereby increasing the quantity of solid hydrogen produced. Additionally, using a laminar flow injection nozzle based on liquid filament technology, instead of a standard spray nozzle, can further optimize process efficiency.

3. Experimental Study on Slush Hydrogen Production

3.1. Experimental Facilities for Slush Hydrogen Production

As illustrated in Figure 7, to assess the feasibility of slush hydrogen production technology, we constructed an experimental facility capable of producing 2 kg of liquid hydrogen and converting it into slush hydrogen. The liquid hydrogen tank features a vertical cylindrical design and is equipped to store 2 kg of liquid hydrogen. The tank is insulated with multilayer material and maintains a vacuum of 10−5 torr, managed by both low- and high-pressure vacuum pumps. The vacuum level was controlled to evaluate the boil-off gas (BOG) of the slush hydrogen, which is indicative of insulation performance of the tank. A recording camera was positioned at the top of the tank to monitor the liquefaction of the supplied gaseous hydrogen and the transformation of liquid hydrogen into slush hydrogen. Additionally, a load cell was installed adjacent to the vertical cylinder tank to measure the quantity of liquefied hydrogen and the boil-off rate (BOR). Gaseous hydrogen was introduced into the tank through a pressure-regulating valve to ensure that the tank pressure did not exceed the design specifications. To achieve hydrogen liquefaction, helium gas at 4 K was supplied to a spiral coil-type heat exchanger. Gaseous helium at 11 K was then returned to the helium liquefier and stored as liquid helium. The 4 K gaseous helium was continuously recirculated through the spiral coil heat exchanger.

3.2. Experimental Result for Slush Hydrogen Production

The Ground Operations Demonstration Unit for Liquid Hydrogen (GODU LH2) successfully achieved zero-loss storage and transfer, including a zero-loss chilldown and three tanker offloads with minimal venting. Zero boil-off (ZBO) was demonstrated effectively using pressure control, maintaining liquid hydrogen without losses. Temperature control also worked well, though equilibrium took longer to reach. Densification tests cooled liquid hydrogen below the normal boiling point, producing slush hydrogen with an estimated solid mass fraction of 25%. Liquefaction of gaseous hydrogen was achieved, although this was limited by budget constraints, with over 200 kg of hydrogen liquefied during testing. The system demonstrated effective operations at various liquid levels, validating its capability for advanced cryogenic storage. Overall, the GODU LH2 system met its key objectives, advancing technologies for zero-loss storage, propellant densification, and hydrogen liquefaction.
The objective was to produce slush hydrogen in the 2 kg class slush hydrogen tank to verify the storage technology. As shown in Figure 8, gaseous hydrogen was supplied and continuously exposed to saturated vapor at 4 K from the helium storage tank. Saturated helium vapor at 4 K absorbs heat and exits the system at approximately 11 K after the hydrogen liquefaction and slush hydrogen production. Due to the difficulty in measuring and controlling the flow of helium at 11 K, flow regulation was based on the mass and pressure of the liquid hydrogen produced. The amount of hydrogen supplied to the slush hydrogen tank was measured using a load cell, and pressure was regulated to ensure it did not exceed design limits. Figure 9 shows an image of the process in which hydrogen is supplied to the slush production tank, its liquefaction, and the achievement of the triple point of hydrogen, resulting in slush hydrogen formation. Figure 10 depicts the process where hydrogen gas is supplied, undergoes liquefaction, and reaches the triple point to form slush hydrogen. Despite significant fluctuations during the transition to the triple point, due to variations in helium flow rate and a heat absorption of 83 kJ/kg, the formation of slush hydrogen stabilized after 35,000 s. Figure 9 provides images showing the progression of slush hydrogen production. According to the schematic in Figure 9, phase transitions were monitored using a camera mounted on top of the slush hydrogen tank, documenting the dynamic changes within. Figure 9A shows the process of supplying gaseous hydrogen during cooling. As the gas becomes saturated with vapor, hydrogen liquefaction begins, as depicted in Figure 9B. Once 2 kg of hydrogen was fully liquefied, the production of 2 kg of liquid hydrogen was achieved, as shown in Figure 9C. Upon reaching the triple point, the solidification of hydrogen starts at the top, completing the formation of slush hydrogen, as illustrated in Figure 9D.

3.3. Verification of Slush Hydrogen Production

Ohira et al. proposed a method for measuring the density of slush hydrogen using a capacitance-type sensor. In contrast, we developed and validated a theoretical method for predicting the amount of liquid hydrogen that evaporates into gaseous hydrogen [22]. Although this method does not allow for real-time density measurement or prediction, it can be effectively used with several instruments. As liquid hydrogen is converted into gaseous boil-off gas and vented from the tank, the change in mass can be monitored using a load cell. Consequently, we performed slush hydrogen boil-off experiments to determine the ratio of the solid to the liquid phase in slush hydrogen. This was achieved using a silicon diode-type thermocouple mounted on the tank and a load cell for measuring the fluid within the tank. To deduce the solid-to-liquid ratio, we employed time-weight and time-temperature graphs until all hydrogen inside the tank had evaporated. To calculate the ratio of solid hydrogen to liquid hydrogen, we utilized time t1 and the temperature gradient at t1 as indicated in Figure 11, using both the time-weight and time-temperature graphs. The ratio f of solid to liquid hydrogen was computed using Equations (1)–(3). During the phase transition period, characterized by a stable temperature, the average heat transfer rate was necessary to determine f at t1. We assumed that the instantaneous heat transfer rate at time t1 (temperature T1) was equivalent to the average heat transfer rate during the isothermal period. The temperature gradients at times t1 and t2, required to calculate f, were obtained from Figure 11.
A production facility for slush hydrogen, comprising both liquid and solid phases, was utilized to produce 0.1 kg of slush hydrogen. The ratio of solid to liquid hydrogen was then calculated. A boiling test was conducted to measure this ratio, and Equation (3) verified the mass of solid hydrogen (ms) as 1.2 kg, as shown in Figure 12. The time t1 at which solid hydrogen melts was determined from Figure 13, with the phase transition from solid to liquid hydrogen treated as an isothermal process. t1 was set at the point where the temperature reached 14 K, indicating that the time required for solid hydrogen to completely melt was 1500 s.
To calculate the heat transfer rate at t1, the specific heat capacity (Cp) was set at 6.927 kJ/kg·K at 14 K [27], and the latent heat of fusion of solid hydrogen, which is 58.28 kJ/kg, was used. At time t1, the temperature gradient (dT/dt) was calculated to be 0.0032 K/s. By incorporating these values, the ratio of solid to liquid hydrogen was determined to be 0.57. Consequently, the density of slush hydrogen was calculated to be 80.9 kg/m3 using Equation (4), representing a 14% increase compared to the density of liquid hydrogen.
Q t 1 = Q t 2 ,
m s × Δ h f 1 f t 1 t 0 = m s × C p × d T d t ,
f = 1 m s × C p × d T d t × t 1 t 0 m s × Δ h f ,
ρ S L = 1 f ρ S + f ρ L ,
f = 1 C p × d T d t × t 1 t 0 Δ h f = 0.57

4. Computational Fluid Dynamics Simulation for Slush Hydrogen Production

4.1. Computational Model and Simulation Conditions

Numerical simulations were performed using the commercial software STAR-CCM+ (ver. 15.02.007) to model the BOR test phase, involving natural boil-off. The equipment used in slush hydrogen production was accurately modeled, and the finite volume method was employed for thermal analysis. The governing equations for this study are the continuity, momentum, and energy equations, as described by Chung et al. [28]. Additionally, conjugate heat transfer interfaces were considered to account for heat transfer between the components of the slush hydrogen production tank (i.e., between the fluid and solid components). Heat transfer within the solid components occurred via conduction through contact surfaces, while heat transfer between solids and fluids involved both conduction and convection through these surfaces. The configuration of these interfaces followed the methodology outlined by Chung et al. The simulations involved three phases simultaneously, necessitating the consideration of phase transitions among them. This study specifically focuses on the transitions between gaseous hydrogen and liquid hydrogen, as well as between liquid hydrogen and solid hydrogen. For modeling these phase transitions, the volume of fluid (VOF) method was employed. The VOF model calculates the volume fractions of each fluid in a single momentum equation, facilitating the simulation of multiphase flows involving immiscible fluids. This approach allows for mutual penetration between phases and is advantageous for simulating internal, bubbly, and free-surface flows. To simulate the phase transition processes, the Rohsenow boiling model was applied to the transitions between gaseous and liquid hydrogen. For transitions between liquid hydrogen and solid hydrogen, a melting-solidification model was used. Additionally, a slush viscosity model was implemented to interpret mixtures of liquids and solids in the slush state. Figure 14 presents a cross-section of the 3D analysis model of the slush hydrogen tank, illustrating the initial volume fraction of liquid hydrogen. A volume fraction of 1 denotes a fully liquid phase, while 0 represents a gas phase. The simulations were conducted with an equivalent amount of liquid hydrogen to that used in the experiments. The BOR value was calculated based on the volume of liquid hydrogen resulting from natural boil-off following slush hydrogen production.
Figure 15 shows a comparison between the temperature of the helium refrigerant over time and the wall temperature of the conical tube. To replicate the experimental environment, the measured temperature of the helium refrigerant was used as the wall temperature of the conical tube. Since the flow of liquefied helium inside the conical tube was not deemed critical, it was not modeled separately; only the wall temperature was considered. The average surface temperature of the conical tube, as measured in the analysis, aligned closely with the experimental values throughout the slush hydrogen production process with liquefied helium. This confirms that the simulation environment successfully mirrored the experimental conditions.

4.2. Simulation of Natural Convection and Boil-Off in a Slush Hydrogen Tank

For the boil-off test of the slush hydrogen tank, the vent line was opened after the cessation of slush hydrogen production. Consequently, in the simulation, the chamber was maintained at atmospheric pressure, allowing the slush hydrogen to evaporate naturally. As time progresses, liquid hydrogen evaporates into gaseous hydrogen, and the BOR is calculated based on the volume of internal liquid hydrogen. Figure 16 illustrates the formation of solid hydrogen over time. In this study, the transition of gaseous hydrogen into the solid state was not considered. Instead, the model focused solely on the transition between liquid hydrogen and solid hydrogen. A solid volume fraction of 1 indicates a completely solid state, while a solid volume fraction of 0.5 denotes an equal presence of liquid and solid hydrogen. The finite-volume method used in this study shares one cell for both liquid and solid hydrogen, limiting the consideration of volume changes. As a result, the level of liquid hydrogen does not increase as it cools and transforms into solid hydrogen through the conical tube. Figure 16 depicts the transition to solid hydrogen as the temperature of the liquefied helium inside the conical tube is transferred to the internal liquid hydrogen.
Figure 17 shows the state after opening the vent line during the BOR test phase, following the end of slush hydrogen production, with an emphasis on the melting of solid hydrogen over time. To calculate the BOR of the slush hydrogen tank, the total weight of the slush hydrogen production system was measured over time, and the time required for the initially injected liquid hydrogen to fully evaporate was determined to be 6.23%/h. The BOR was calculated based on the volume of liquid hydrogen. The initial volume of liquid hydrogen and the total volume of the internal tank were numerically determined, and the calculation was converted based on the time required for evaporation as follows:
V l i q u i d , i n i t i a l V l i q u i d V t a n k × t 3600 × 100   [ % / hr ]
Figure 18 compares the BOR values calculated from the analysis, using Equation (6), with the experimental values. Initially, no BOR was observed after slush hydrogen production ceased. BOR started occurring at approximately 1100 s, attributed to the evaporation of liquid hydrogen into gaseous hydrogen through heat exchange with air introduced via the vent line. The BOR stabilized around 1600 s, similar to the complete melting of solid hydrogen observed in the experiment at approximately 1500 s. The converged BOR value from the analysis was 6.65%/h, showing a relative error of about 6.74% compared to the experimental values. Possible reasons for this discrepancy include an imperfect match between the temperature control of the conical tube in the simulation and the experimental environment during natural boil-off. Additionally, the analysis did not account for volume expansion due to solidification, which may have contributed to the error. Incorporating volume expansion in the model during transitions between liquid and solid hydrogen phases could potentially improve accuracy.

5. Conclusions

As the need for hydrogen energy grows in pursuit of carbon neutrality, interest in the storage and transportation of liquid hydrogen is also increasing. Liquid hydrogen must be stored and transported at temperatures 90 K lower than conventional LNG, and due to its low density, advanced insulation and boil-off gas (BOG) control technologies are required. Slush hydrogen increases the density by approximately 18% compared to conventional liquid hydrogen and, with its higher heat capacity, can significantly reduce BOG during bunkering and storage. NASA successfully demonstrated zero boil-off hydrogen storage through its Ground Operation Demonstration Unit. However, the solid mass fraction was only about 25%, indicating that further efforts are needed to enhance the storage, heat capacity, and density of slush hydrogen. In this study, we evaluated slush hydrogen, a mixture of liquid and solid hydrogen phases, as a promising technology to address major issues related to boil-off gas suppression and low storage density in liquid hydrogen transportation. To validate this concept, we established a slush production facility with a capacity of 2 kg/day and confirmed the effectiveness of its manufacturing method. Furthermore, we overcame the existing 25% solidification technology and successfully produced slush hydrogen with a composition of 50% solid and 50% liquid. We successfully produced slush hydrogen using the freeze-thaw method and verified its presence. Additionally, we validated the production through experimental results and CFD analysis. The findings are summarized as follows:
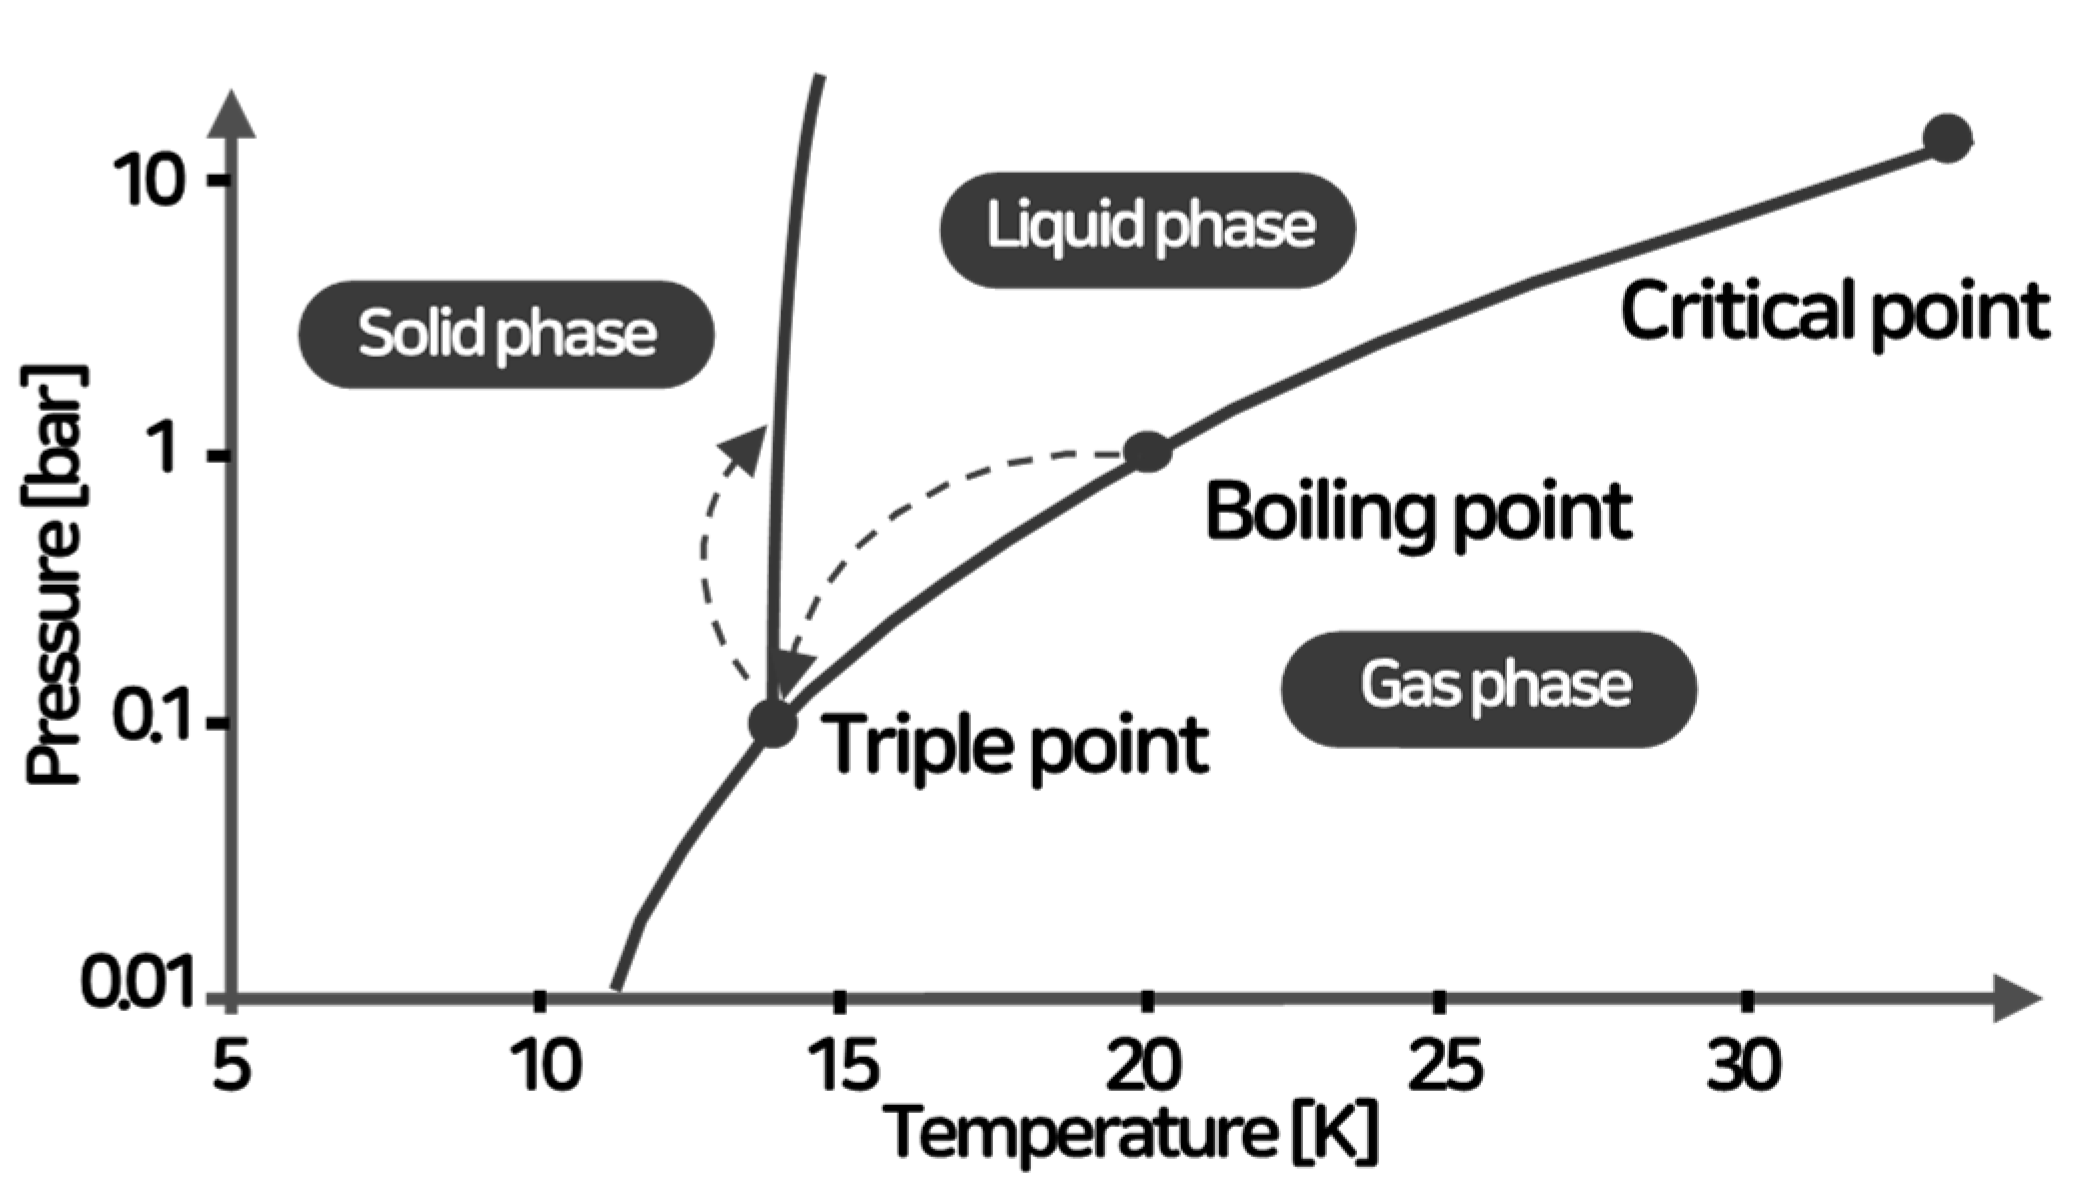
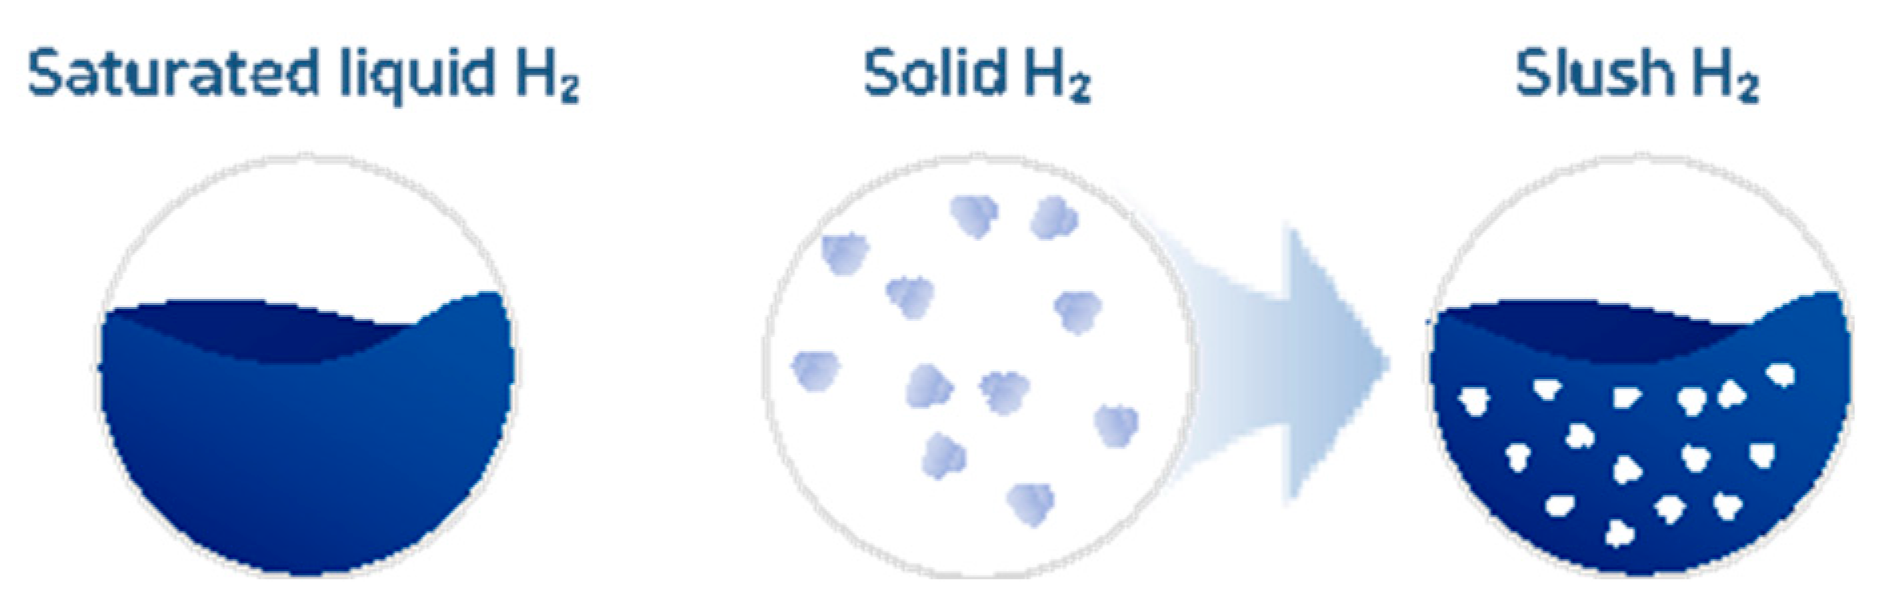
  • Slush hydrogen, a fluid where liquid and solid phases coexist, has a density approximately 15% higher than liquid hydrogen and helps suppress boil-off gas. This characteristic is expected to address challenges related to the transportation and storage of liquid hydrogen, which has a lower boiling point compared to conventional LNG.
  • We designed and validated a facility capable of producing 2 kg/day of slush hydrogen using the freeze-thaw method. The production method was confirmed through experiments, and we recorded the slush hydrogen formation process. Additionally, we introduced and validated a new methodology to demonstrate that slush hydrogen consists of a 50% liquid and 50% solid mixture.
  • In our 2 kg/day slush production facility, we verified that the slush hydrogen was approximately 50% liquid and 50% solid. The ratio of solid to liquid hydrogen was determined by comparing the boil-off rate to that of a standard amount of liquid hydrogen, estimating the solid hydrogen formed. The resulting ratio of solid hydrogen to liquid hydrogen was approximately 0.57, with a density of about 80.9 kg/m3.
  • We performed simulations of natural convection and boil-off tests for slush hydrogen using STAR-CCM+ to verify the state of the slush hydrogen. The simulations utilized the VOF model to account for phase changes among gas, liquid, and solid states. The solid-to-liquid hydrogen ratio confirmed in the simulations was approximately 0.57. The BOR test results from the simulations aligned well with experimental values, indicating that the simulation environment accurately replicated experimental conditions.
  • We aimed to control the particle size of slush hydrogen. Various approaches have been explored, as controlling its particle size would eliminate barriers to its application in various industrial fields. Although we successfully achieved nearly 50% solid hydrogen content, further development is needed to produce solid hydrogen with uniform particles. Future efforts will focus on applying additional techniques to achieve this goal in this study.

Author Contributions

Conceptualization, S.H. and J.L.; investigation, S.P. and C.L.; simulation and validation, S.P. and S.C.; supervision, D.C.; funding acquisition, S.P. All authors have read and agreed to the published version of the manuscript.

Funding

This research was a part of the project titled ’Development of Safety and Control Standards for Hydrogen Ships: Cargo Handling and Fuel Gas Supply Systems’ (Grant number: 20200456), funded by the Ministry of Oceans and Fisheries, Republic of Korea.

Data Availability Statement

The data presented in this study are available upon request from the corresponding author.

Conflicts of Interest

The authors declare no conflicts of interest.

Abbreviations

BOGBoil-off gasLCOELevelized cost of electricity
COPCoefficient of performanceLCOSLevelized cost of LH2 storage and transportation
HDPEHigh-density polyethyleneLHVLower heating value
HDSAMHydrogen delivery scenario analysis modelLOHCLiquid organic hydrogen carriers
GODUGround operation demonstration unitMOFsMetal-organic frameworks
IEAInternational energy agencyNASANational aeronautics and space administration
IPCCIntergovernmental panel on climate changeLNGLiquefied natural gas
IRASIntegrated refrigeration and storageSTPStandard temperature and pressure

References

  1. IPCC. Climate Change 2021: The Physical Science Basis. In Contribution of Working Group I to the Sixth Assessment Report of the Intergovernmental Panel on Climate Change; IPCC: Geneva, Switzerland, 2021. [Google Scholar]
  2. Adolf, J.; Balzer, C.H.; Louis, J.; Schabla, U.; Fischedick, M.; Arnold, K.; Pastowski, A.; Schüwer, D. Energy of the Future: Sustainable Mobility through Fuel Cells and H2; Shell Hydrogen Study; Shell Deutschland Oil: Hamburg, Germany, 2017. [Google Scholar]
  3. White, C.M.; Steeper, R.R.; Lutz, A.E. The Hydrogen-Fueled Internal Combustion Engine: A Technical Review. Int. J. Hydrogen Energy 2006, 31, 1292–1305. [Google Scholar] [CrossRef]
  4. Zhang, F.; Zhao, P.; Niu, M.; Maddy, J. The Survey of Key Technologies in Hydrogen Energy Storage. Int. J. Hydrogen Energy 2016, 41, 14535–14552. [Google Scholar] [CrossRef]
  5. Zhu, Q.L.; Xu, Q. Metal-Organic Framework Composites. Chem. Soc. Rev. 2014, 43, 5468–5512. [Google Scholar] [CrossRef] [PubMed]
  6. Xia, Y.; Yang, Z.; Zhu, Y. Porous Carbon-Based Materials for Hydrogen Storage: Advancement and Challenges. J. Mater. Chem. A Mater. 2013, 1, 9365–9381. [Google Scholar] [CrossRef]
  7. Petit, J.F.; Miele, P.; Demirci, U.B. Ammonia Borane H3N-BH3 for Solid-State Chemical Hydrogen Storage: Different Samples with Different Thermal Behaviors. Int. J. Hydrogen Energy 2016, 41, 15462–15470. [Google Scholar] [CrossRef]
  8. Preuster, P.; Papp, C.; Wasserscheid, P. Liquid Organic Hydrogen Carriers (LOHCs): Toward a Hydrogen-Free Hydrogen Economy. Acc. Chem. Res. 2017, 50, 74–85. [Google Scholar] [CrossRef] [PubMed]
  9. Barthelemy, H.; Weber, M.; Barbier, F. Hydrogen Storage: Recent Improvements and Industrial Perspectives. Int. J. Hydrogen Energy 2017, 42, 7254–7262. [Google Scholar] [CrossRef]
  10. Yersak, T.A.; Baker, D.R.; Yanagisawa, Y.; Slavik, S.; Immel, R.; Mack-Gardner, A.; Herrmann, M.; Cai, M. Predictive Model for Depressurization-Induced Blistering of Type IV Tank Liners for Hydrogen Storage. Int. J. Hydrogen Energy 2017, 42, 28910–28917. [Google Scholar] [CrossRef]
  11. Aceves, S.M.; Espinosa-Loza, F.; Ledesma-Orozco, E.; Ross, T.O.; Weisberg, A.H.; Brunner, T.C.; Kircher, O. High-Density Automotive Hydrogen Storage with Cryogenic Capable Pressure Vessels. Int. J. Hydrogen Energy 2010, 35, 1219–1226. [Google Scholar] [CrossRef]
  12. Midilli, A.; Ay, M.; Dincer, I.; Rosen, M.A. On Hydrogen and Hydrogen Energy Strategies I: Current Status and Needs. Renew. Sustain. Energy Rev. 2005, 9, 255–271. [Google Scholar] [CrossRef]
  13. Sotsky, L.; Castillo, A.; Ramos, H.; Mitchko, E.; Heuvel-Horwitz, J.; Bick, B.; Mahajan, D.; Wong, S.S. Hydrogen Storage Properties of Metal-Modified Graphene Materials. Energies 2024, 17, 3944. [Google Scholar] [CrossRef]
  14. International Energy Agency. The Future of Hydrogen; International Energy Agency: Paris, France, 2019. [Google Scholar]
  15. Retief, H.L.; Markgraaff, J. A Review of Hydrogen Storage for Vehicular Application and the Determination of the Effect of Extraction Boil-Off. Ph.D. Thesis, North-West University, Potchefstroom Campus, Potchefstroom, South Africa, 2012. [Google Scholar]
  16. Al Ghafri, S.Z.S.; Swanger, A.; Jusko, V.; Siahvashi, A.; Perez, F.; Johns, M.L.; May, E.F. Modelling of Liquid Hydrogen Boil-Off. Energies 2022, 15, 1149. [Google Scholar] [CrossRef]
  17. Aursand, E.; Odsæter, L.H.; Skarsvåg, H.; Reigstad, G.; Ustolin, F.; Paltrinieri, N. Risk and Consequences of Rapid Phase Transition for Liquid Hydrogen. In Proceedings of the 30th European Safety and Reliability Conference and the 15th Probabilistic Safety Assessment and Management Conference, Venice, Italy, 1–5 November 2020; Research Publishing: Singapore, 2020; pp. 1899–1906. [Google Scholar]
  18. Voth, R.O. Producing Liquid-Solid Mixtures of Hydrogen Using an Auger; National Institute of Standards and Technology: Gaithersburg, MD, USA, 1978. [Google Scholar]
  19. Swanger, A.M.; Notardonato, W.U.; Fesmire, J.E.; Jumper, K.M.; Johnson, W.L.; Tomsik, T.M. Large Scale Production of Densified Hydrogen to the Triple Point and Below. IOP Conf. Ser. Mater. Sci. Eng. 2017, 278, 012013. [Google Scholar] [CrossRef]
  20. Daney, D.E.; Arp, V.D.; Voth, R.O. Hydrogen Slush Production with a Large Auger. Adv. Cryog. Eng. 1990, 35, 1767–1776. [Google Scholar]
  21. Fujiwara, H.; Yatabe, M.; Tamura, H.; Takahashi, M.; Mlyazakif, J.; Tsuruta, Y. Experiment on Slush Hydrogen Production with the Auger Method. Int. J. Hydrog. Energy 1998, 23, 333–338. [Google Scholar] [CrossRef]
  22. Ohira, K.; Matsuo, S.; Furumoto, H. An Experimental Investigation of Production and Density Measurement of Slush Hydrogen. Cryogenics 1994, 34, 397–400. [Google Scholar] [CrossRef]
  23. Brunnhofer, K.; Paragina, A.S.; Scheerer, M.; Dermouz, H. Slush Hydrogen and Slush Nitrogen Production and Characterization. In Proceedings of the 42nd AIAA/ASME/SAE/ASEE Joint Propulsion Conference & Exhibit, Sacramento, CA, USA, 9 July 2006; pp. 1–19. [Google Scholar]
  24. Berstad, D.; Gardarsdottir, S.; Roussanaly, S.; Voldsund, M.; Ishimoto, Y.; Nekså, P. Liquid Hydrogen as Prospective Energy Carrier: A Brief Review and Discussion of Underlying Assumptions Applied in Value Chain Analysis. Renew. Sustain. Energy Rev. 2022, 154, 111772. [Google Scholar] [CrossRef]
  25. Ratnakar, R.R.; Gupta, N.; Zhang, K.; van Doorne, C.; Fesmire, J.; Dindoruk, B.; Balakotaiah, V. Hydrogen Supply Chain and Challenges in Large-Scale LH2 Storage and Transportation. Int. J. Hydrogen Energy 2021, 46, 24149–24168. [Google Scholar] [CrossRef]
  26. Ohira, K. Slush Hydrogen Production, Storage, and Transportation. In Compendium of Hydrogen Energy: Hydrogen Storage, Distribution and Infrastructure: Volume 2; Elsevier: Amsterdam, The Netherlands, 2015; pp. 53–90. ISBN 9781782423621. [Google Scholar]
  27. McCarty, R.D.; Hord, J.; Roder, H.M. Selected Properties of Hydrogen (Engineering Design Data); National Institute of Standards and Technology: Gaithersburg, MD, USA, 1981. [Google Scholar]
  28. Chung, S.; Ahn, H.; Park, J. Numerical approach to analyze fluid flow in a type C tank for liquefied hydrogen carrier (part 2: Thermal flow). J. Energy Storage 2024, 76, 109599. [Google Scholar] [CrossRef]
Figure 1. Classification of hydrogen storage technologies.
Energies 17 04415 g001
Figure 2. Cost comparison for hydrogen conversion, storage, and transmission across different technologies [13].
Energies 17 04415 g002
Figure 3. Pressure-temperature diagram for liquid hydrogen.
Energies 17 04415 g003
Figure 4. Conceptual diagram of slush hydrogen, showing the mixture of solid and liquid phases.
Energies 17 04415 g004
Figure 5. Temperature-entropy diagram for para-hydrogen.
Energies 17 04415 g005
Figure 6. Enthalpy changes from gaseous hydrogen at standard temperature and pressure (STP) to slush hydrogen.
Energies 17 04415 g006
Figure 7. Schematic diagram illustrating the process of creating slush hydrogen.
Energies 17 04415 g007
Figure 8. Experimental setup for 2 kg slush hydrogen production facility.
Energies 17 04415 g008
Figure 9. Progression of slush hydrogen production, shown through images.
Energies 17 04415 g009
Figure 10. Temperature profile during the production of 2 kg slush hydrogen.
Energies 17 04415 g010
Figure 11. Time-weight diagram (a) and time-temperature diagram (b) for slush hydrogen.
Energies 17 04415 g011
Figure 12. The time-weight trend for slush hydrogen during storage experiments.
Energies 17 04415 g012
Figure 13. The time-temperature trend for slush hydrogen during storage experiments.
Energies 17 04415 g013
Figure 14. Cross-sectional view of the slush hydrogen tank and the initial volume fraction of liquid hydrogen.
Energies 17 04415 g014
Figure 15. Comparison of helium refrigerant temperature with the wall temperature of the conical tube.
Energies 17 04415 g015
Figure 16. Formation and growth of solid hydrogen crystals around the conical tube.
Energies 17 04415 g016
Figure 17. Internal flow field changes in a slush hydrogen tank.
Energies 17 04415 g017
Figure 18. Comparison of boil-off rates in the slush hydrogen tank.
Energies 17 04415 g018
Disclaimer/Publisher’s Note: The statements, opinions and data contained in all publications are solely those of the individual author(s) and contributor(s) and not of MDPI and/or the editor(s). MDPI and/or the editor(s) disclaim responsibility for any injury to people or property resulting from any ideas, methods, instructions or products referred to in the content.

