

Probabilistic Analysis of Green Hydrogen Production from a Mix of Solar and Wind Energy
 ,
,  ,
,  and
and
Abstract
1. Introduction
2. Materials and Methods
3. Results
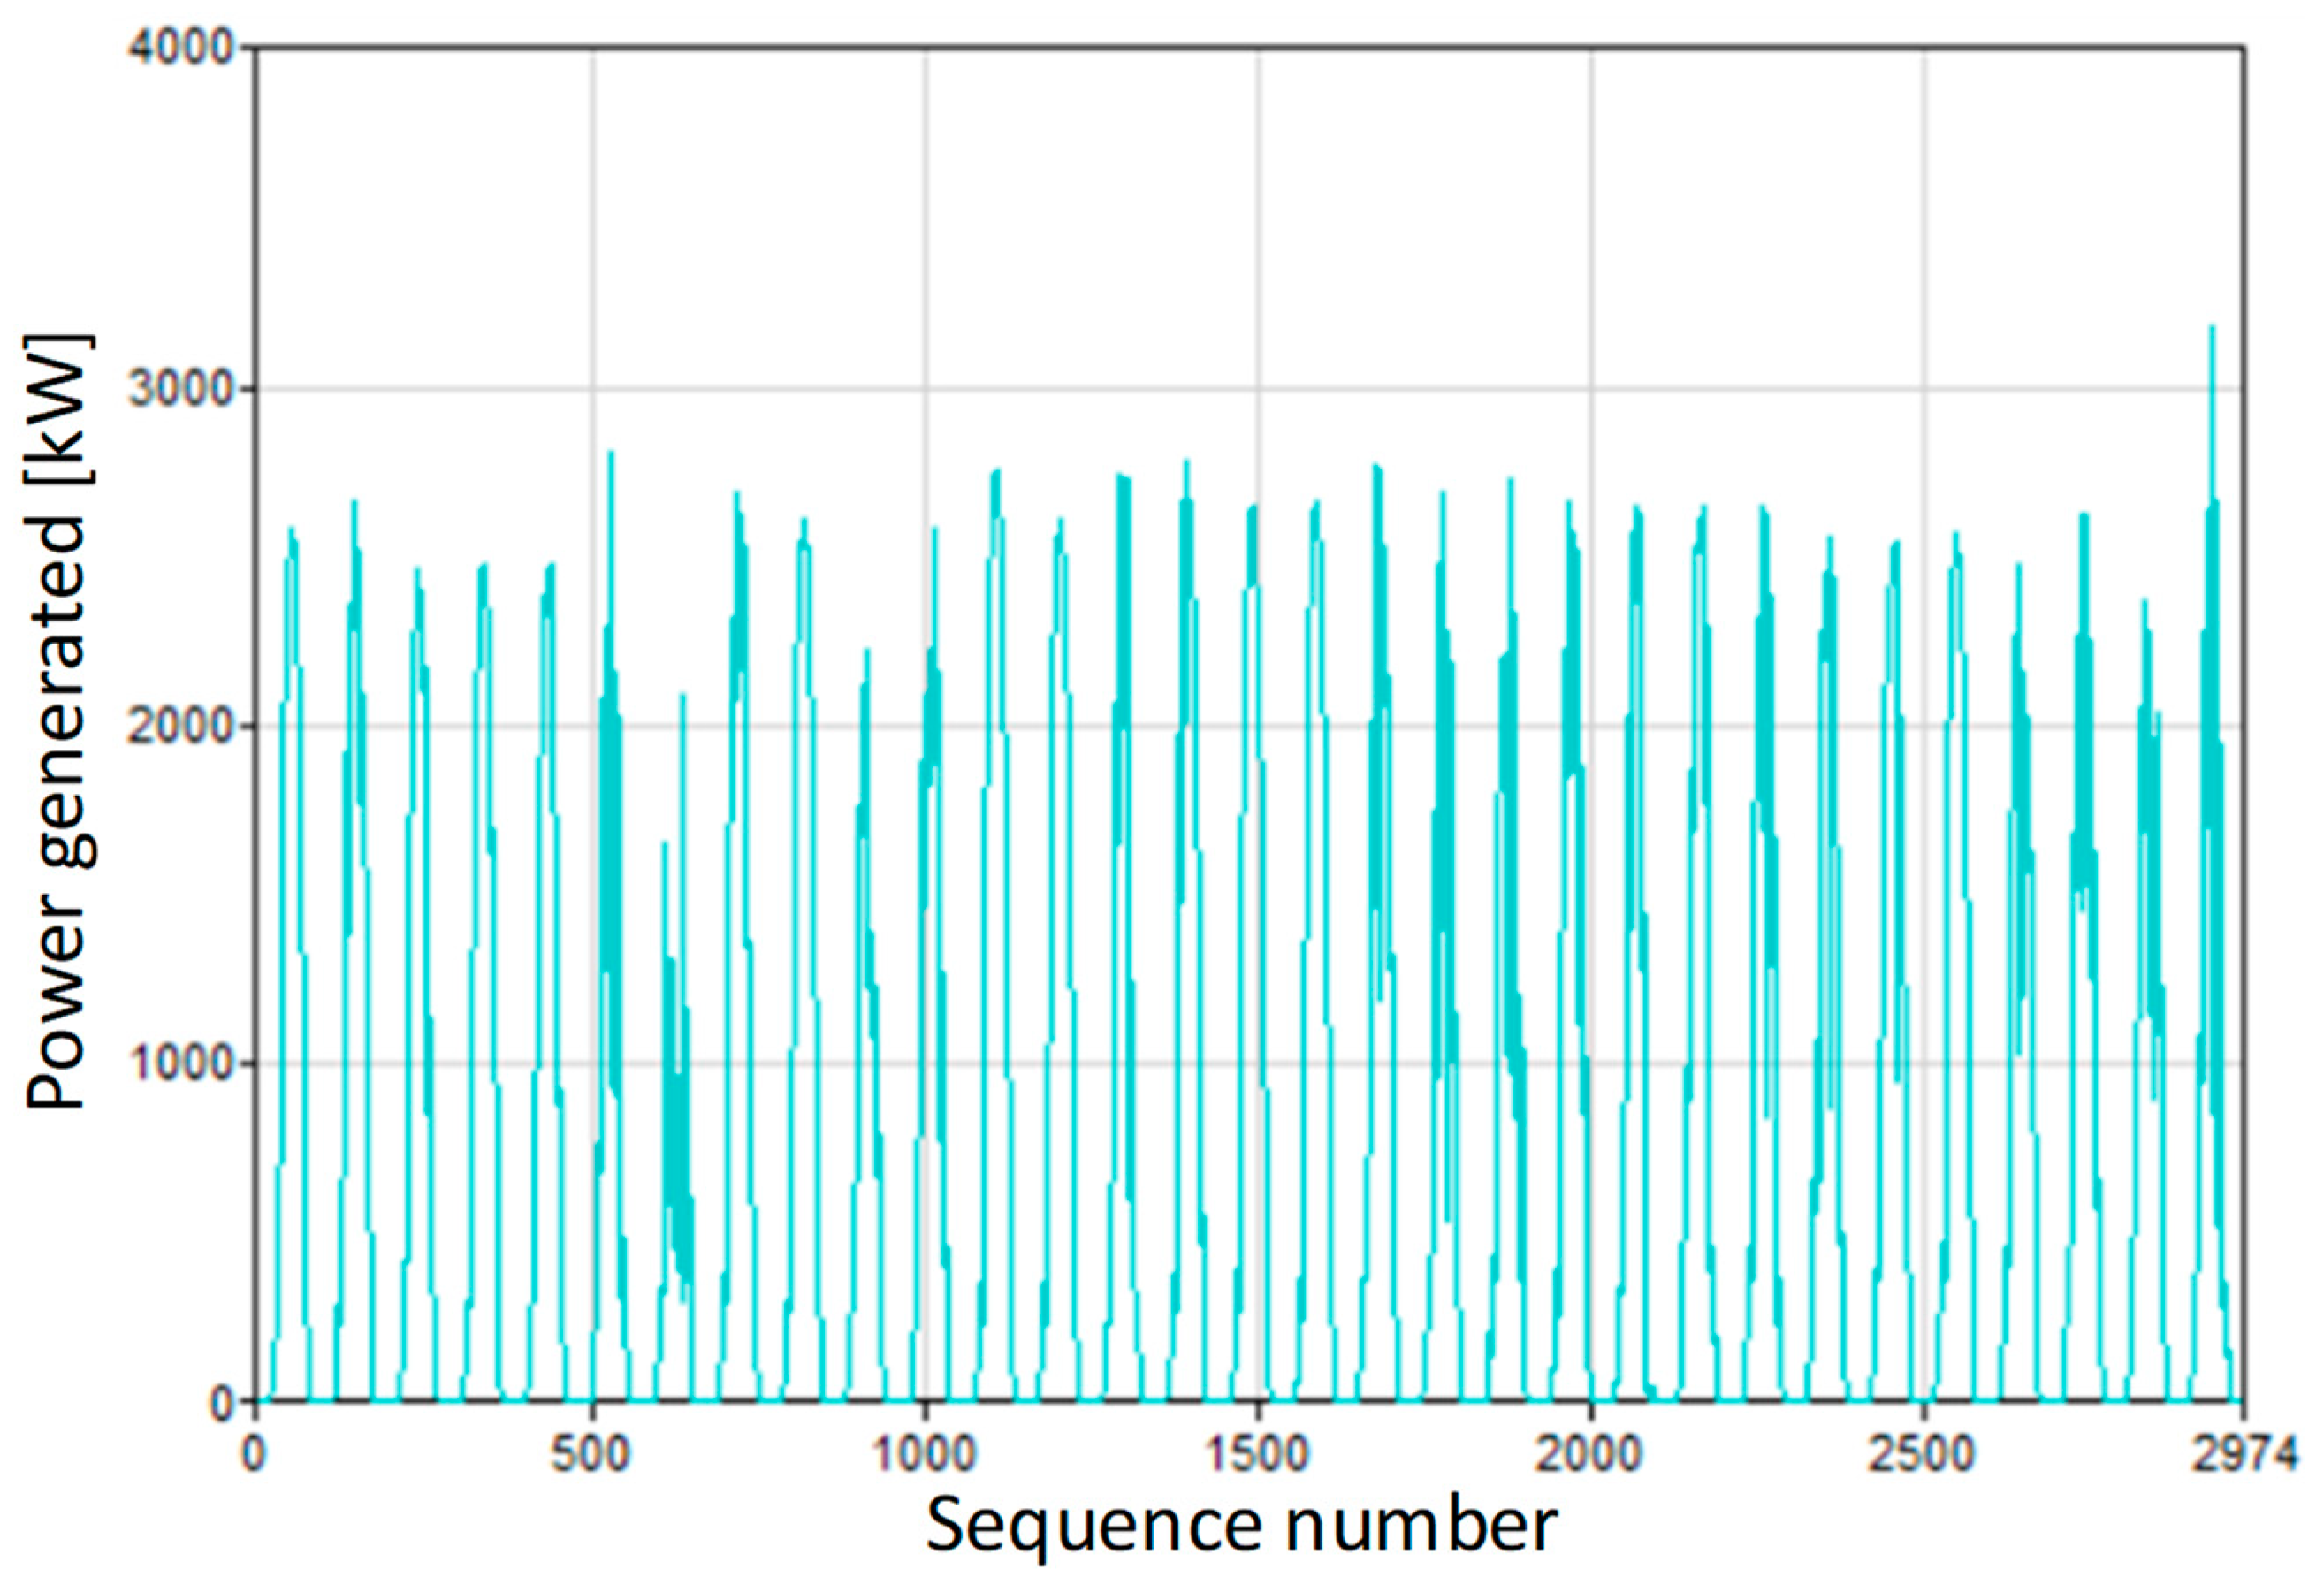
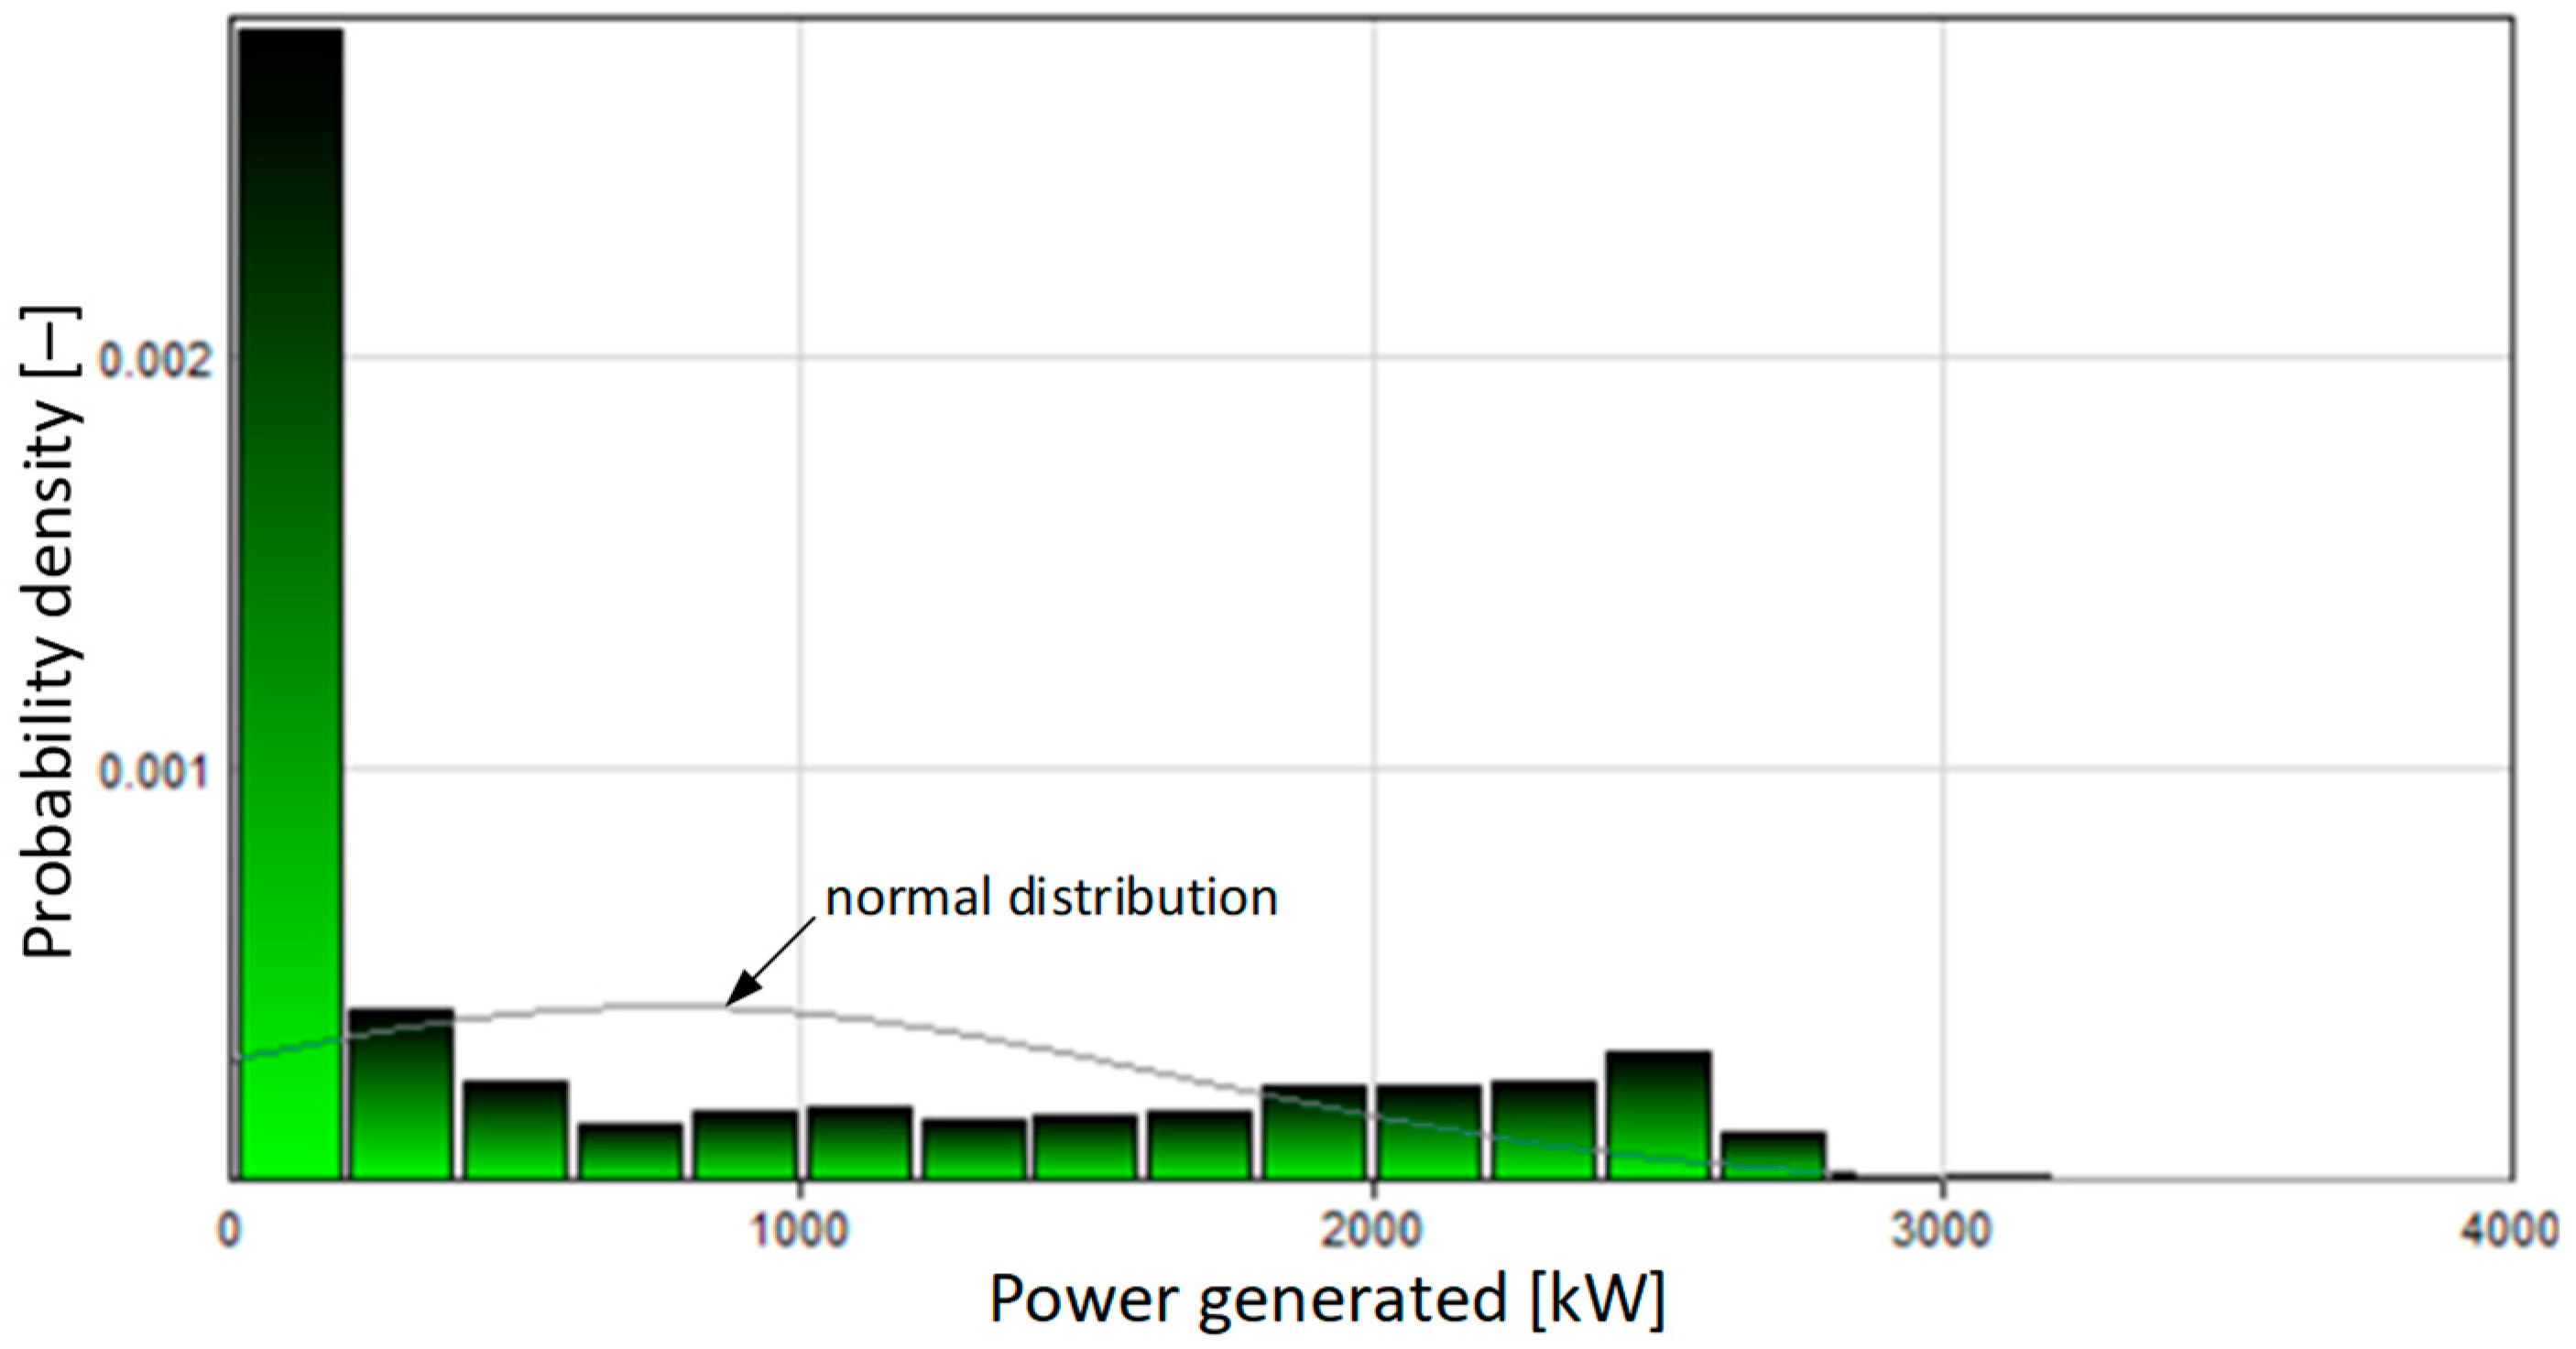
3.1. Characteristics of Energy Production by Photovoltaic Systems
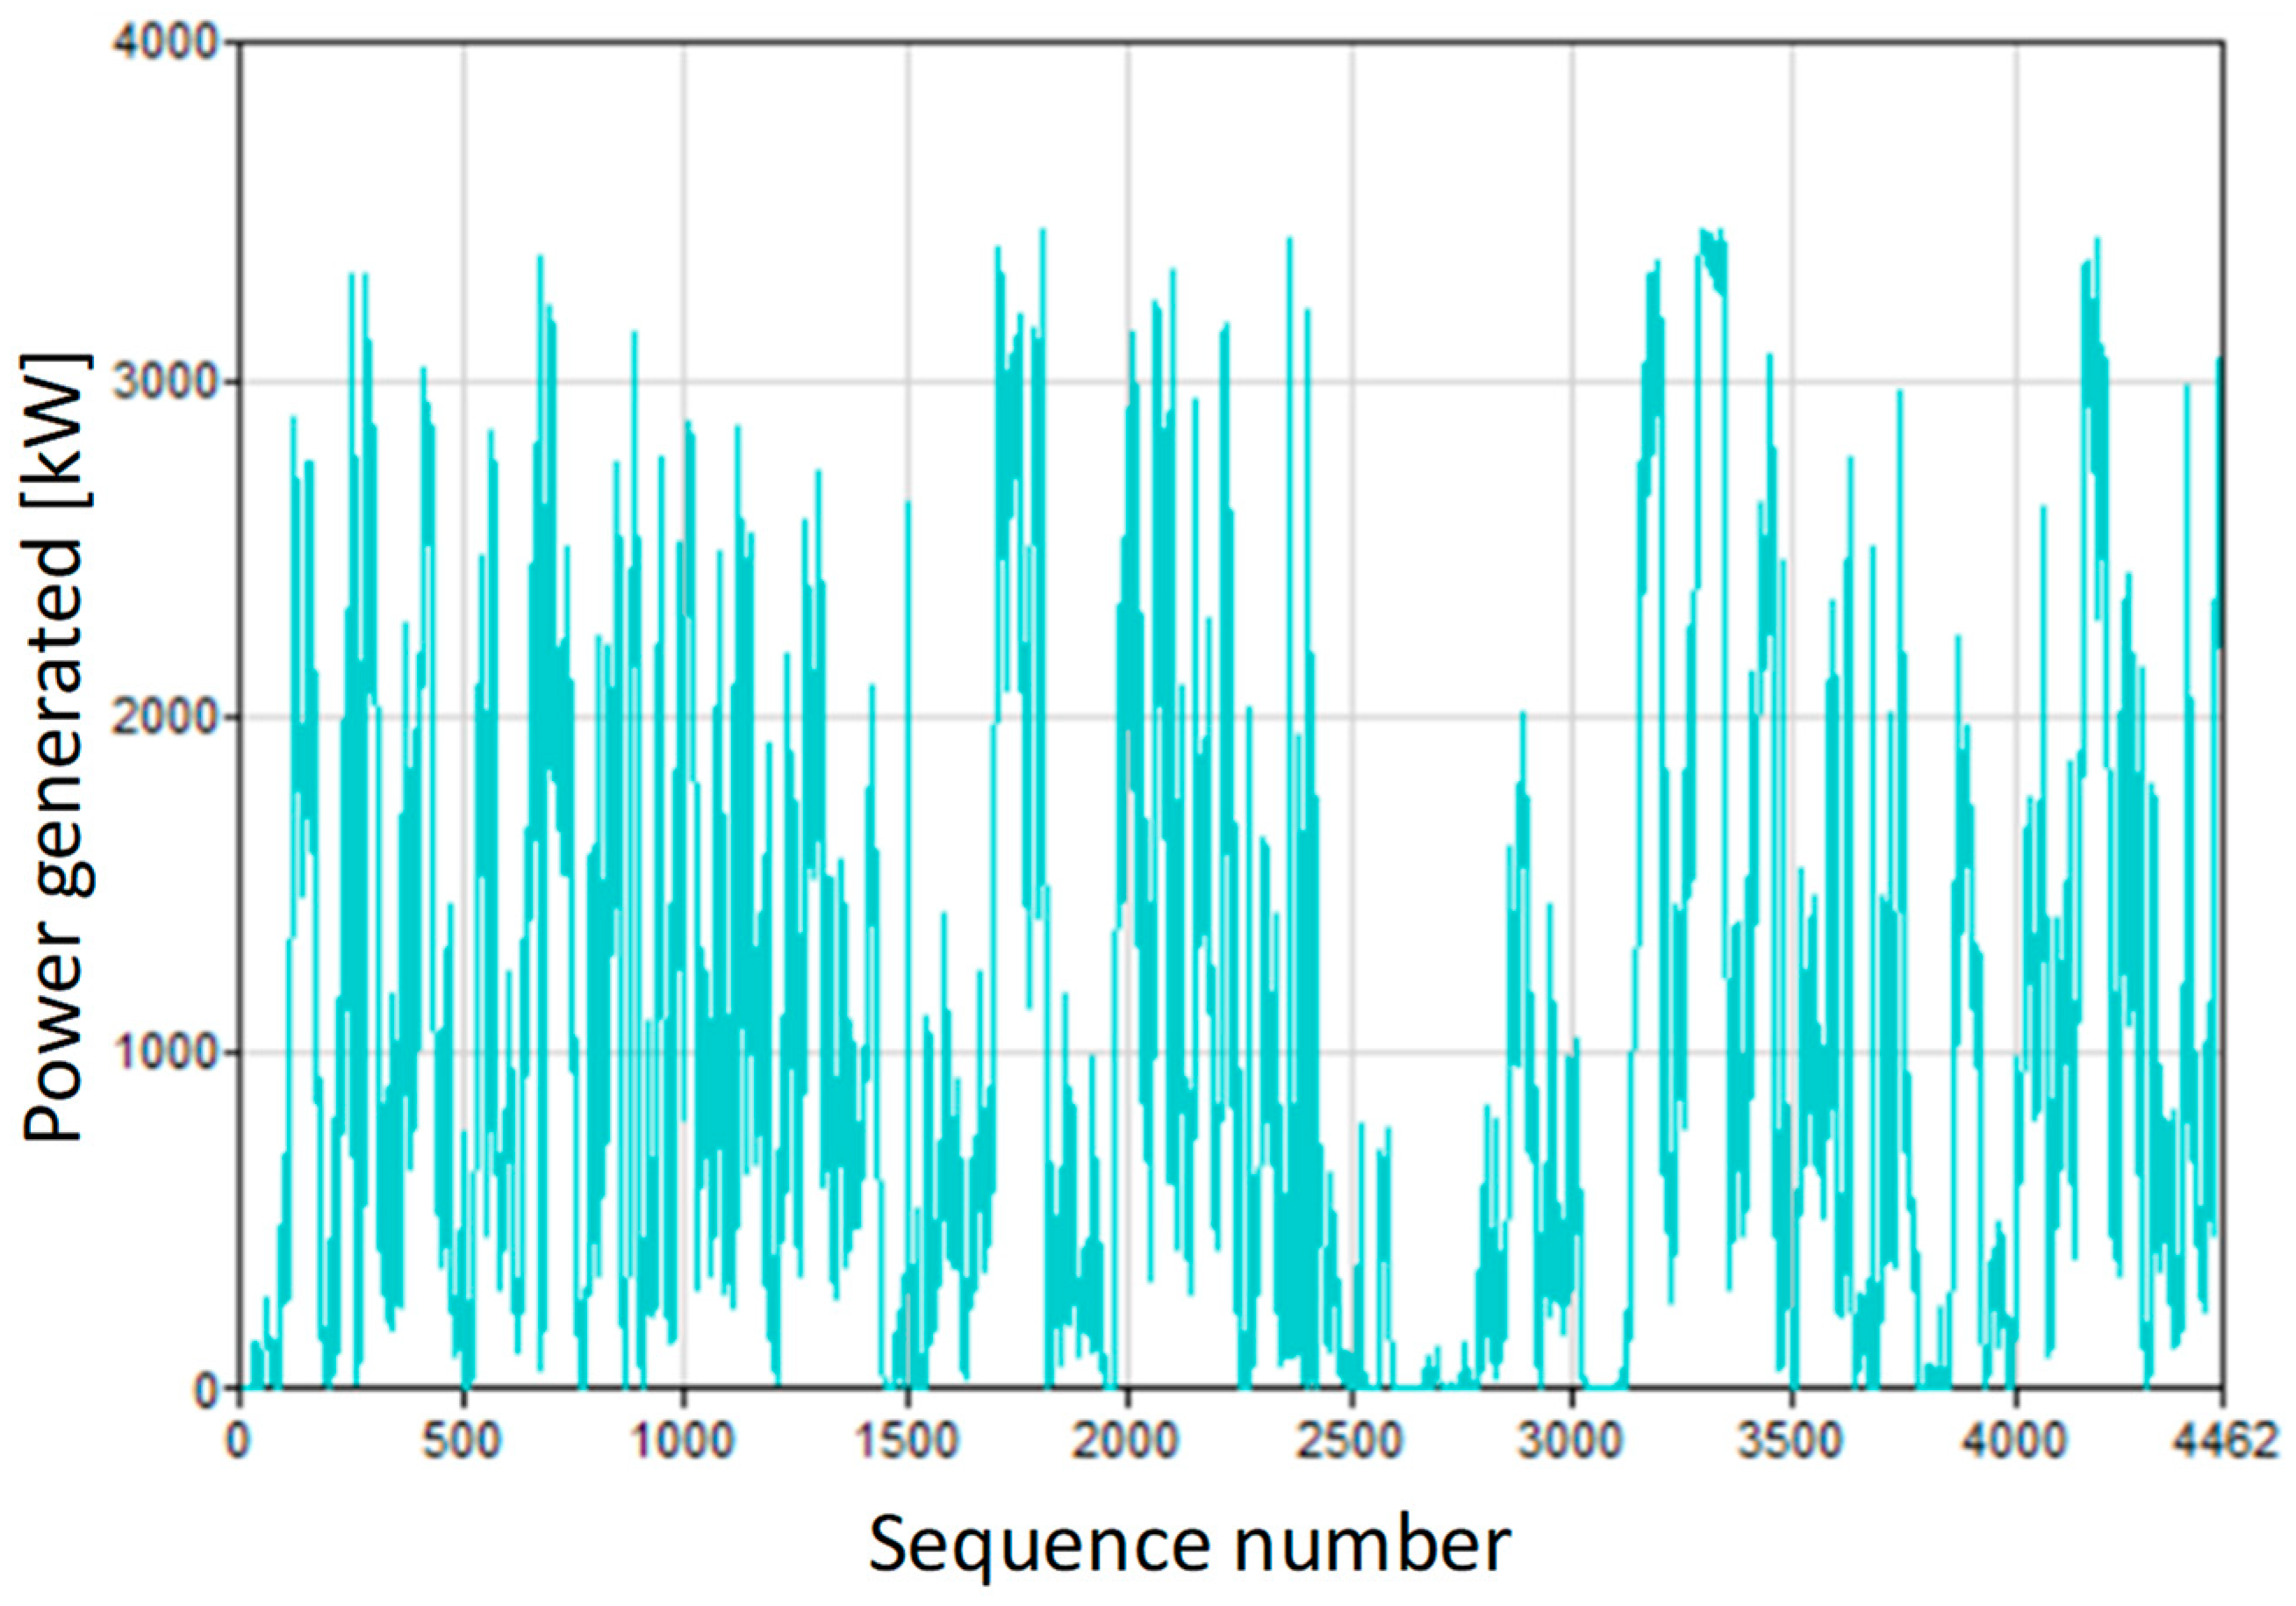
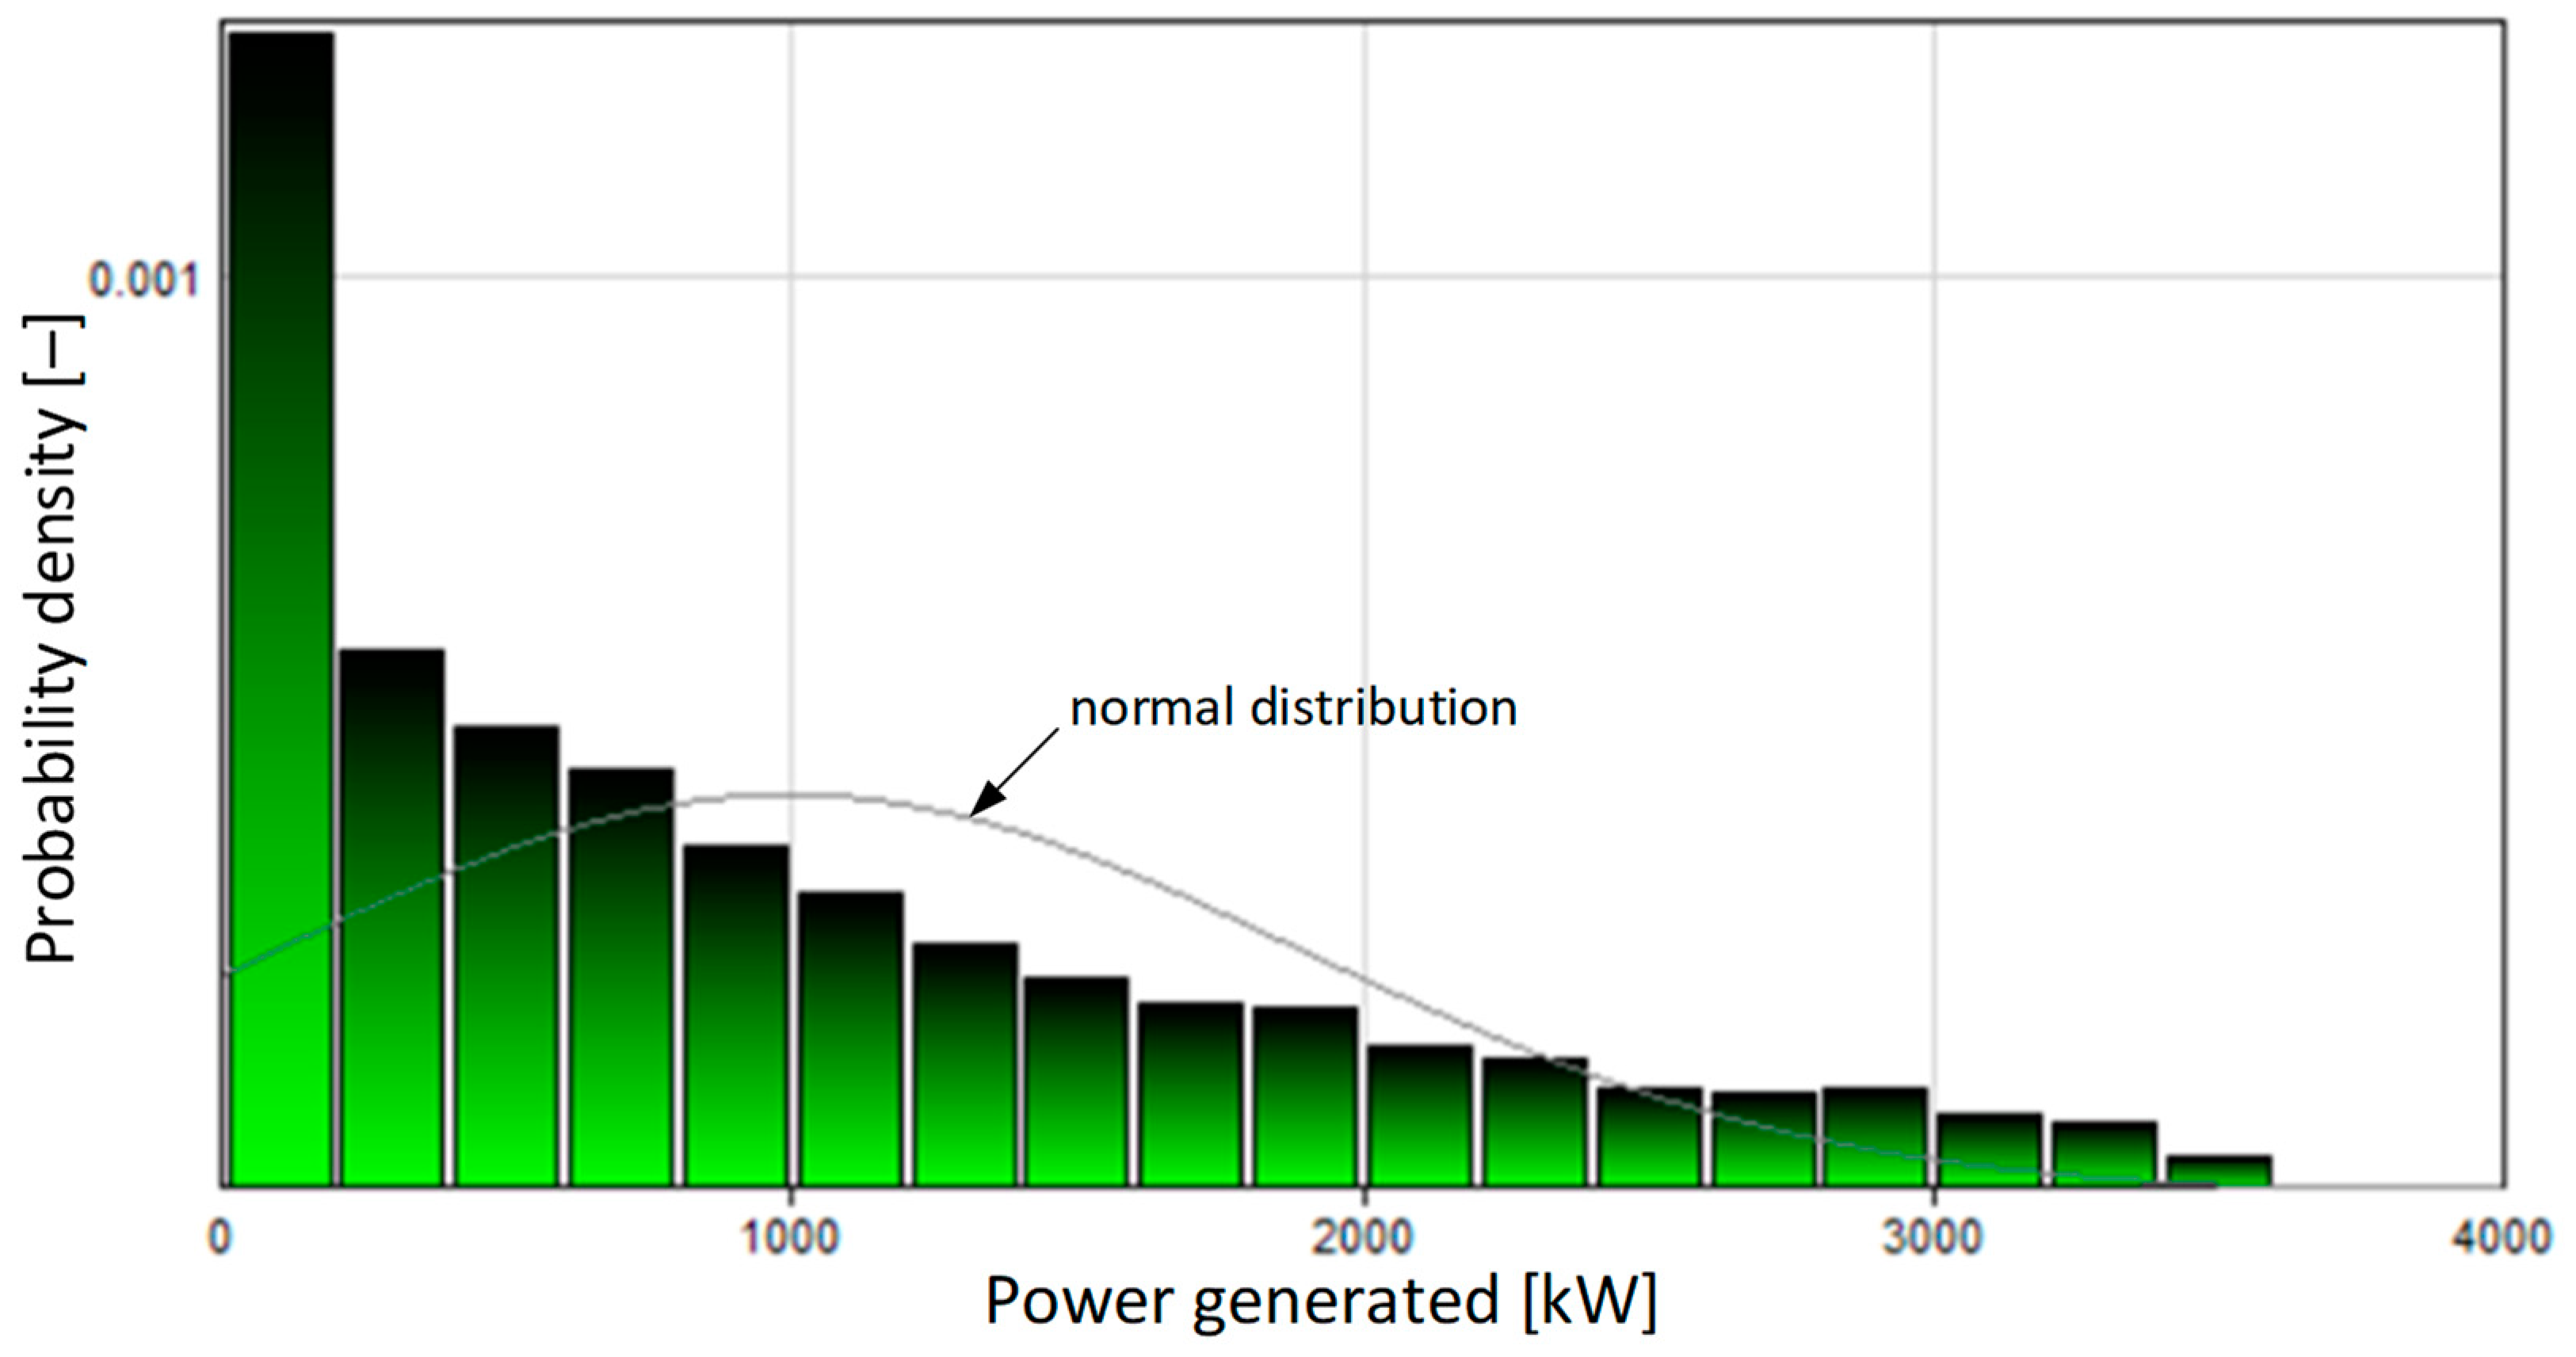
3.2. Characteristics of Energy Production by Wind Turbines
3.3. Energy Production Characteristics of a Mix of Photovoltaic Systems and Wind Turbines
4. Discussion
5. Conclusions
Author Contributions
Funding
Data Availability Statement
Conflicts of Interest
Abbreviations
| RES | Renewable energy source |
| PEM | Proton exchange membrane |
| AEM | Aion exchange membrane |
| AFC | Alkaline fuel cell |
| SOFC | Solid oxide fuel cell |
| SOE | Solid oxide electrolyzer |
| MCFC | Molten carbonate fuel cell |
| FCV | Fuel cell vehicle |
| PV | Photovoltaic |
References
- Available online: https://www.rynekelektryczny.pl/moc-zainstalowana-fotowoltaiki-w-polsce/ (accessed on 1 August 2024).
- Available online: https://www.forum-energii.eu/rocznik-dane-o-energetyce (accessed on 1 August 2024).
- Gnap, J.; Šarkan, B.; Konečný, V.; Skrúcaný, T. The impact of road transport on the environment. In Ecology in Transport: Problems and Solutions; Springer: Cham, Switzerland, 2020; pp. 251–309. [Google Scholar]
- Raihan, A.; Pavel, M.I.; Muhtasim, D.A.; Farhana, S.; Faruk, O.; Paul, A. The role of renewable energy use, technological innovation, and forest cover toward green development: Evidence from Indonesia. Innov. Green Dev. 2023, 2, 100035. [Google Scholar] [CrossRef]
- Petkov, I.; Gabrielli, P. Power-to-hydrogen as seasonal energy storage: An uncertainty analysis for optimal design of low-carbon multi-energy systems. Appl. Energy 2020, 274, 115197. [Google Scholar] [CrossRef]
- Lin, Y.C.; Wyżga, P.; Macyk, J.; Macyk, W.; Guzik, M.N. Solar-driven (photo)electrochemical devices for green hydrogen production and storage: Working principles and design. J. Energy Storage 2024, 82, 110484. [Google Scholar] [CrossRef]
- Silalahi, D.F.; Blakers, A.; Cheng, C. 100% Renewable Electricity in Indonesia. Energies 2024, 17, 3. [Google Scholar] [CrossRef]
- Trattner, A.; Kleli, M.; Radner, F. Sustainable hydrogen society e Vision, findings and development of a hydrogen economy using the example of Austria. Int. J. Hydrogen Energy 2022, 47, 2059–2079. [Google Scholar] [CrossRef]
- Megía, P.J.; Vizcaíno, A.J.; Calles, J.A.; Carrero, A. Hydrogen Production Technologies: From Fossil Fuels toward Renewable Sources. A Mini Review. Energy Fuels 2021, 35, 20. [Google Scholar] [CrossRef]
- Le, T.T.; Sharma, P.; Bora, B.I.; Tran, V.D.; Truong, T.H.; Le, H.C.; Nguyen, P.Q.P. Fueling the future: A comprehensive review of hydrogen energy systems and their challenges. Int. J. Hydrogen Energy 2024, 54, 791–816. [Google Scholar] [CrossRef]
- Worku, A.K.; Ayele, D.W.; Deepak, D.B.; Gebreyohannes, A.Y.; Agegnehu, S.D.; Kolhe, M.L. Recent Advances and Challenges of Hydrogen Production Technologies via Renewable Energy Sources. Adv. Energy Sustain. Res. 2024, 5, 2300273. [Google Scholar] [CrossRef]
- Okunlola, A.; Davis, M.; Kumar, A. The development of an assessment framework to determine the technical hydrogen production potential from wind and solar energy. Renew. Sustain. Energy Rev. 2022, 166, 112610. [Google Scholar] [CrossRef]
- Agyekum, E.B.; Nutakor, C.; Agwa, A.M.; Kamel, S. A Critical Review of Renewable Hydrogen Production Methods: Factors Affecting Their Scale-Up and Its Role in Future Energy Generation. Membranes 2022, 12, 173. [Google Scholar] [CrossRef] [PubMed]
- Available online: https://www.gov.pl/web/klimat/polska-strategia-wodorowa-do-roku-2030 (accessed on 1 August 2024).
- Raport “Prognoza Zapotrzebowania na Wodór Odnawialny RFNBO”—Listopad 2023 r. Available online: https://ien.com.pl/images/konferencje/Prognoza-zapotrzebowania-na-wod%C3%B3r-odnawialny-raport.pdf (accessed on 1 August 2024).
- Wang, S.; Tonge, E.; Sekanyo, I.; Portmann, E.; Azzouz, S.M. On the State-of-the-Art of Solar, Wind, and Other Green Energy Resources and Their Respective Storage Systems. Eng 2023, 4, 857–883. [Google Scholar] [CrossRef]
- Małek, A.; Karowiec, R.; Jóżwik, K. A review of technologies in the area of production, storage and use of hydrogen in the automotive industry. Arch. Automot. Eng. Arch. Motoryz. 2023, 102, 41–67. [Google Scholar] [CrossRef]
- Maestre, V.M.; Ortiz, A.; Ortiz, I. Challenges and prospects of renewable hydrogen-based strategies for full decarbonization of stationary power applications. Renew. Sustain. Energy Rev. 2021, 152, 111628. [Google Scholar] [CrossRef]
- Joshua, S.R.; Yeon, A.N.; Park, S.; Kwon, K. Solar–Hydrogen Storage System: Architecture and Integration Design of University Energy Management Systems. Appl. Sci. 2024, 14, 4376. [Google Scholar] [CrossRef]
- Ishaq, H.; Dincer, I. Comparative assessment of renewable energy-based hydrogen production methods. Renew. Sustain. Energy Rev. 2021, 135, 110192. [Google Scholar] [CrossRef]
- Nwokediegwu, Z.Q.S.; Ibekwe, K.I.; Ilojianya, V.I.; Etukudoh, E.A.; Ayorinde, B.O. Renewable Energy Technologies in Engineering: A Review of Current Developments and Future Prospects. Eng. Sci. Technol. J. 2024, 5, 367–384. [Google Scholar] [CrossRef]
- Jaszczur, M.; Hassan, Q.; Sameen, A.Z.; Salman, H.M.; Olapade, O.T.; Wieteska, S. Massive Green Hydrogen Production Using Solar and Wind Energy: Comparison between Europe and the Middle East. Energies 2023, 16, 5445. [Google Scholar] [CrossRef]
- Xiao, S.; Liu, H.; Lin, K. Dynamic Performance of Monopile-Supported Wind Turbines (MWTs) under Different Operating and Ground Conditions. Energies 2024, 17, 112. [Google Scholar] [CrossRef]
- Ngando Ebba, J.D.; Camara, M.B.; Doumbia, M.L.; Dakyo, B.; Song-Manguelle, J. Large-Scale Hydrogen Production Systems Using Marine Renewable Energies: State-of-the-Art. Energies 2024, 17, 130. [Google Scholar] [CrossRef]
- Available online: https://www.lublin112.pl/lubelszczyzna-moze-stac-sie-zaglebiem-elektrowni-wiatrowych-posiada-jedne-z-najlepszych-warunkow-w-polsce/ (accessed on 1 August 2024).
- Murshed, M.; Chamana, M.; Schmitt, K.E.K.; Bhatta, R.; Adeyanju, O.; Bayne, S. Design and Performance Analysis of a Grid-Connected Distributed Wind Turbine. Energies 2023, 16, 5778. [Google Scholar] [CrossRef]
- Almaraz, S.D.L.; Rácz, V.; Azzaro-Pantel, C.; Szántó, Z.O. Multiobjective and social cost-benefit optimisation for a sustainable hydrogen supply chain: Application to Hungary. Appl. Energy 2022, 325, 119882. [Google Scholar] [CrossRef]
- Hassan, Q.; Sameen, A.Z.; Salman, H.M.; Jaszczur, M. Large-scale green hydrogen production via alkaline water electrolysis using solar and wind energy. Int. J. Hydrogen Energy 2023, 48, 34299–34315. [Google Scholar] [CrossRef]
- Hassan, N.S.; Jalil, A.A.; Rajendran, S.; Khusnun, N.F.; Bahari, M.B.; Johari, A.; Kamaruddin, M.J.; Ismail, M. Recent review and evaluation of green hydrogen production via water electrolysis for a sustainable and clean energy society. Int. J. Hydrogen Energy 2023, 52 Pt B, 420–441. [Google Scholar] [CrossRef]
- Hassan, Q.; Algburi, S.; Sameen, A.Z.; Salman, H.M.; Jaszczur, M. A review of hybrid renewable energy systems: Solar and wind-powered solutions: Challenges, opportunities, and policy implications. Results Eng. 2023, 20, 101621. [Google Scholar] [CrossRef]
- Noussan, N.; Raimondi, P.P.; Scita, R.; Hafner, M. The Role of Green and Blue Hydrogen in the Energy Transition—A Technological and Geopolitical Perspective. Sustainability 2021, 13, 298. [Google Scholar] [CrossRef]
- Marouani, I.; Guesmi, T.; Alshammari, B.M.; Alqunun, K.; Alzamil, A.; Alturki, M.; Hadj Abdallah, H. Integration of Renewable Energy-Based Green Hydrogen into the Energy Future. Processes 2023, 11, 2685. [Google Scholar] [CrossRef]
- Wang, R.; Zhang, R. Techno-economic analysis and optimization of hybrid energy systems based on hydrogen storage for sustainable energy utilization by a biological-inspired optimization algorithm. J. Energy Storage 2023, 66, 107469. [Google Scholar] [CrossRef]
- Keelin, T.W.; Chrisman, L.; Savage, S.L. The metalog distributions and extremely accurate sums of lognormals in closed form. In Proceedings of the 2019 Winter Simulation Conference (WSC), National Harbor, MD, USA, 8–11 December 2019; pp. 3074–3085. [Google Scholar] [CrossRef]
- Małek, A.; Dudziak, A.; Caban, J.; Stoma, M. Strategic Model for Yellow Hydrogen Production Using the Metalog Family of Probability Distributions. Energies 2024, 17, 2398. [Google Scholar] [CrossRef]
- Caban, J.; Małek, A.; Kroczyński, D. A Method for Assessing the Technical Condition of Traction Batteries Using the Metalog Family of Probability Distributions. Energies 2024, 17, 3096. [Google Scholar] [CrossRef]
- Dincer, I.; Acar, C. Innovation in hydrogen production. Renew. Sustain. Energy Rev. 2017, 42, 14843–14864. [Google Scholar] [CrossRef]
- Liu, C.; Zhang, X.; Mei, S.; Zhen, Z.; Jia, M.; Li, Z.; Tang, H. Numerical weather prediction enhanced wind power forecasting: Rank ensemble and probabilistic fluctuation awareness. Appl. Energy 2022, 313, 118769. [Google Scholar] [CrossRef]
- Zhang, W.; Chen, Q.; Yan, J.; Zhang, S.; Xu, J. A novel asynchronous deep reinforcement learning model with adaptive early forecasting method and reward incentive mechanism for short-term load forecasting. Energy 2021, 236, 121492. [Google Scholar] [CrossRef]
- Becerra, M.; Moran, J.; Jerez, A.; Cepeda, F.; Valenzuela, M. Wind energy potential in Chile: Assessment of a small-scale wind farm for residential clients. Energy Convers. Manag. 2017, 140, 71–90. [Google Scholar] [CrossRef]
- Eriksen, T.E.; Hajizadeh, A.; Sabrina, S. Hydrogen-based systems for integration of renewable energy in power systems: Achievements and perspectives. Int. J. Hydrogen Energy 2021, 46, 31963–31983. [Google Scholar] [CrossRef]
- Saleem, M.S.; Abas, N.; Kalair, A.R.; Rauf, S.; Haider, A.; Tahir, M.S.; Sagir, M. Design and optimization of hybrid solar-hydrogen generation system using TRNSYS. Int. J. Hydrogen Energy 2020, 45, 15814–15830. [Google Scholar] [CrossRef]
- Jamil, H.; Qayyum, F.; Iqbal, N.; Khan, M.A.; Naqvi, S.S.A.; Khan, S.; Kim, D.H. Secure Hydrogen Production Analysis and Prediction Based on Blockchain Service Framework for Intelligent Power Management System. Smart Cities 2023, 6, 3192–3224. [Google Scholar] [CrossRef]
- Zhu, C.; Zhang, Y.; Wang, M.; Deng, J.; Cai, Y.; Wei, W.; Guo, M. Optimization, validation and analyses of a hybrid PV-battery-diesel power system using enhanced electromagnetic field optimization algorithm and ε-constraint. Energy Rep. 2024, 11, 5335–5349. [Google Scholar] [CrossRef]
- Available online: https://download.bayesfusion.com/files.html?category=Academia (accessed on 11 June 2024).
- Nestler, S.; Keelin, T. Introducing the Metalog Distributions. Significance 2022, 19, 31–33. [Google Scholar] [CrossRef]
- Sobaszek, Ł.; Piasecka, I.; Flizikowski, J.; Tomporowski, A.; Sokolovskij, E.; Bałdowska-Witos, P. Environmentally Oriented Analysis of Benefits and Expenditures in the Life Cycle of a Wind Power Plant. Materials 2023, 16, 538. [Google Scholar] [CrossRef]
- Chipindula, J.; Botlaguduru, V.S.V.; Du, H.; Kommalapati, R.R.; Huque, Z. Life cycle environmental impact of onshore and offshore wind farms in Texas. Sustainability 2018, 10, 2022. [Google Scholar] [CrossRef]
- Piotrowska, K.; Piasecka, I.; Kłos, Z.; Marczuk, A.; Kasner, R. Assessment of the Life Cycle of a Wind and Photovoltaic Power Plant in the Context of Sustainable Development of Energy Systems. Materials 2022, 15, 7778. [Google Scholar] [CrossRef]
- Amsharuk, A.; Łaska, G. The Approach to Finding Locations for Wind Farms Using GIS and MCDA: Case Study Based on Podlaskie Voivodeship, Poland. Energies 2023, 16, 7107. [Google Scholar] [CrossRef]
- Zhu, Q.; Xiong, W.; Wang, H.; Jin, X. Refined Equivalent Modeling Method for Mixed Wind Farms Based on Small Sample Data. Energies 2023, 16, 7191. [Google Scholar] [CrossRef]
- Heo, K.; Park, H.; Yuck, R.-H.; Lee, D. Numerical Investigation of a Floating-Type Support Structure (Tri-Star Floater) for 9.5 MW Wind Turbine Generators. Energies 2023, 16, 7961. [Google Scholar] [CrossRef]
- Drela, K. Harnessing solar energy and green hydrogen–the energy transition. Procedia Comput. Sci. 2021, 192, 4942–4951. [Google Scholar] [CrossRef]
- Sabovčík, R.; Hradický, J.M.; Šinka, M. Leveraging open-source data to study solar-wind complementarity in the global perspective. Renew. Energy Focus 2024, 50, 100583. [Google Scholar] [CrossRef]
- Liu, R.; Song, Y.; Yuan, C.; Wang, D.; Xu, P.; Li, Y. GAN-Based Abrupt Weather Data Augmentation for Wind Turbine Power Day-Ahead Predictions. Energies 2023, 16, 7250. [Google Scholar] [CrossRef]
- Hur, S.H. Short-term wind speed prediction using Extended Kalman filter and machine learning. Energy Rep. 2021, 7, 1046–1054. [Google Scholar] [CrossRef]
- Ma, Z.; Mei, G. A hybrid attention-based deep learning approach for wind power prediction. Appl. Energy 2022, 323, 119608. [Google Scholar] [CrossRef]
- Gunawan, A.; Thamrin, S.; Kuntjoro, Y.D.; Idris, A.M. Backpropagation Neural Network (BPNN) Algorithm for Predicting Wind Speed Patterns in East Nusa Tenggara. Trends Renew. Energy 2022, 8, 107–118. [Google Scholar] [CrossRef]
- Cao, X.; Wang, J.; Zhao, P.; Xia, H.; Li, Y.; Sun, L.; He, W. Hydrogen Production System Using Alkaline Water Electrolysis Adapting to Fast Fluctuating Photovoltaic Power. Energies 2023, 16, 3308. [Google Scholar] [CrossRef]
- Srinivas, S.; Dhanushkodi, S.R.; Chidambaram, R.K.; Skrzyniowska, D.; Korzen, A.; Taler, J. Benchmarking Electrolytes for the Solid Oxide Electrolyzer Using a Finite Element Model. Energies 2023, 16, 6419. [Google Scholar] [CrossRef]
- Keelin, T.W. The Metalog Distributions. Decis. Anal. 2016, 13, 243–277. [Google Scholar] [CrossRef]


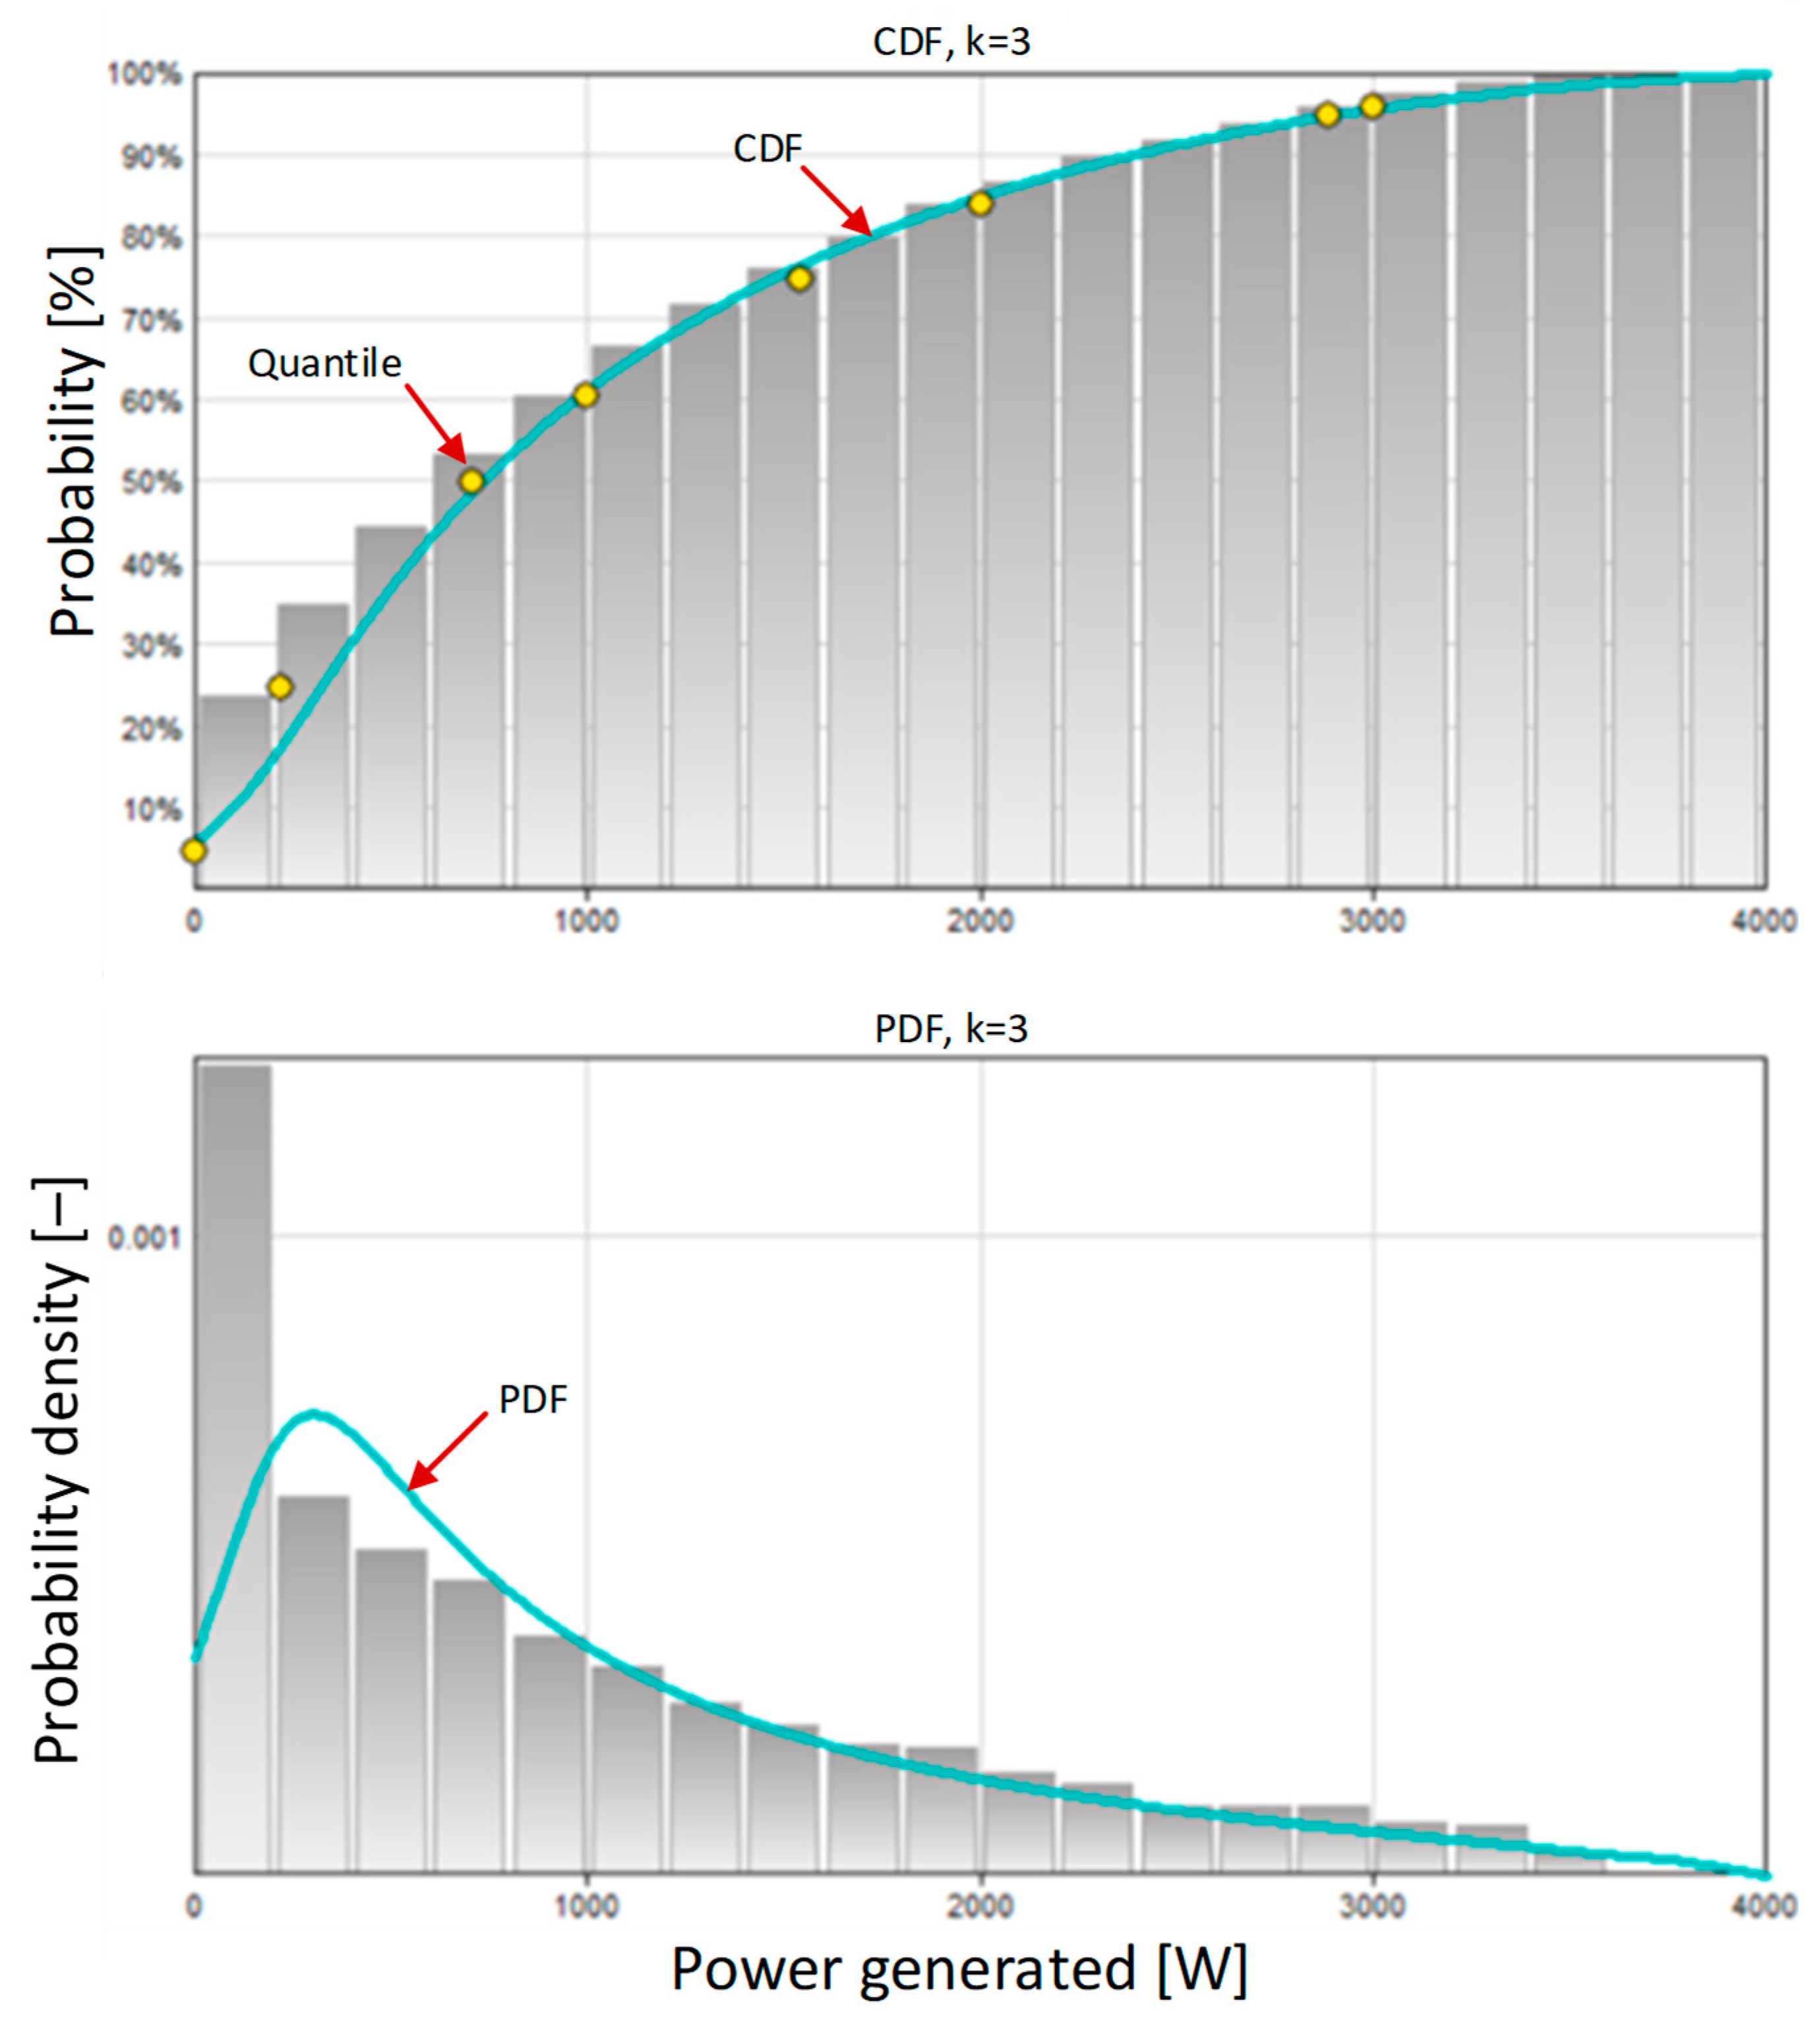
| Power [kW] | |
|---|---|
| Count | 2975 |
| Minimum | 0 |
| Maximum | 3188 |
| Mean | 744.59 |
| StdDev | 915.335 |
| Probability | Power [kW] |
|---|---|
| 0.05 | 0 |
| 0.25 | 0 |
| 0.5 | 228 |
| 0.75 | 1538 |
| 0.95 | 2499 |
| 0.5953 | 500 |
| 0.6703 | 1000 |
| 0.8339 | 2000 |
| 0.9997 | 3000 |
| Power [kW] | Probability ≤ | Probability > |
|---|---|---|
| 500 | 0.5953 | 0.4047 |
| 1000 | 0.6703 | 0.3297 |
| 2000 | 0.8339 | 0.1661 |
| 3000 | 0.9997 | 0.0003 |
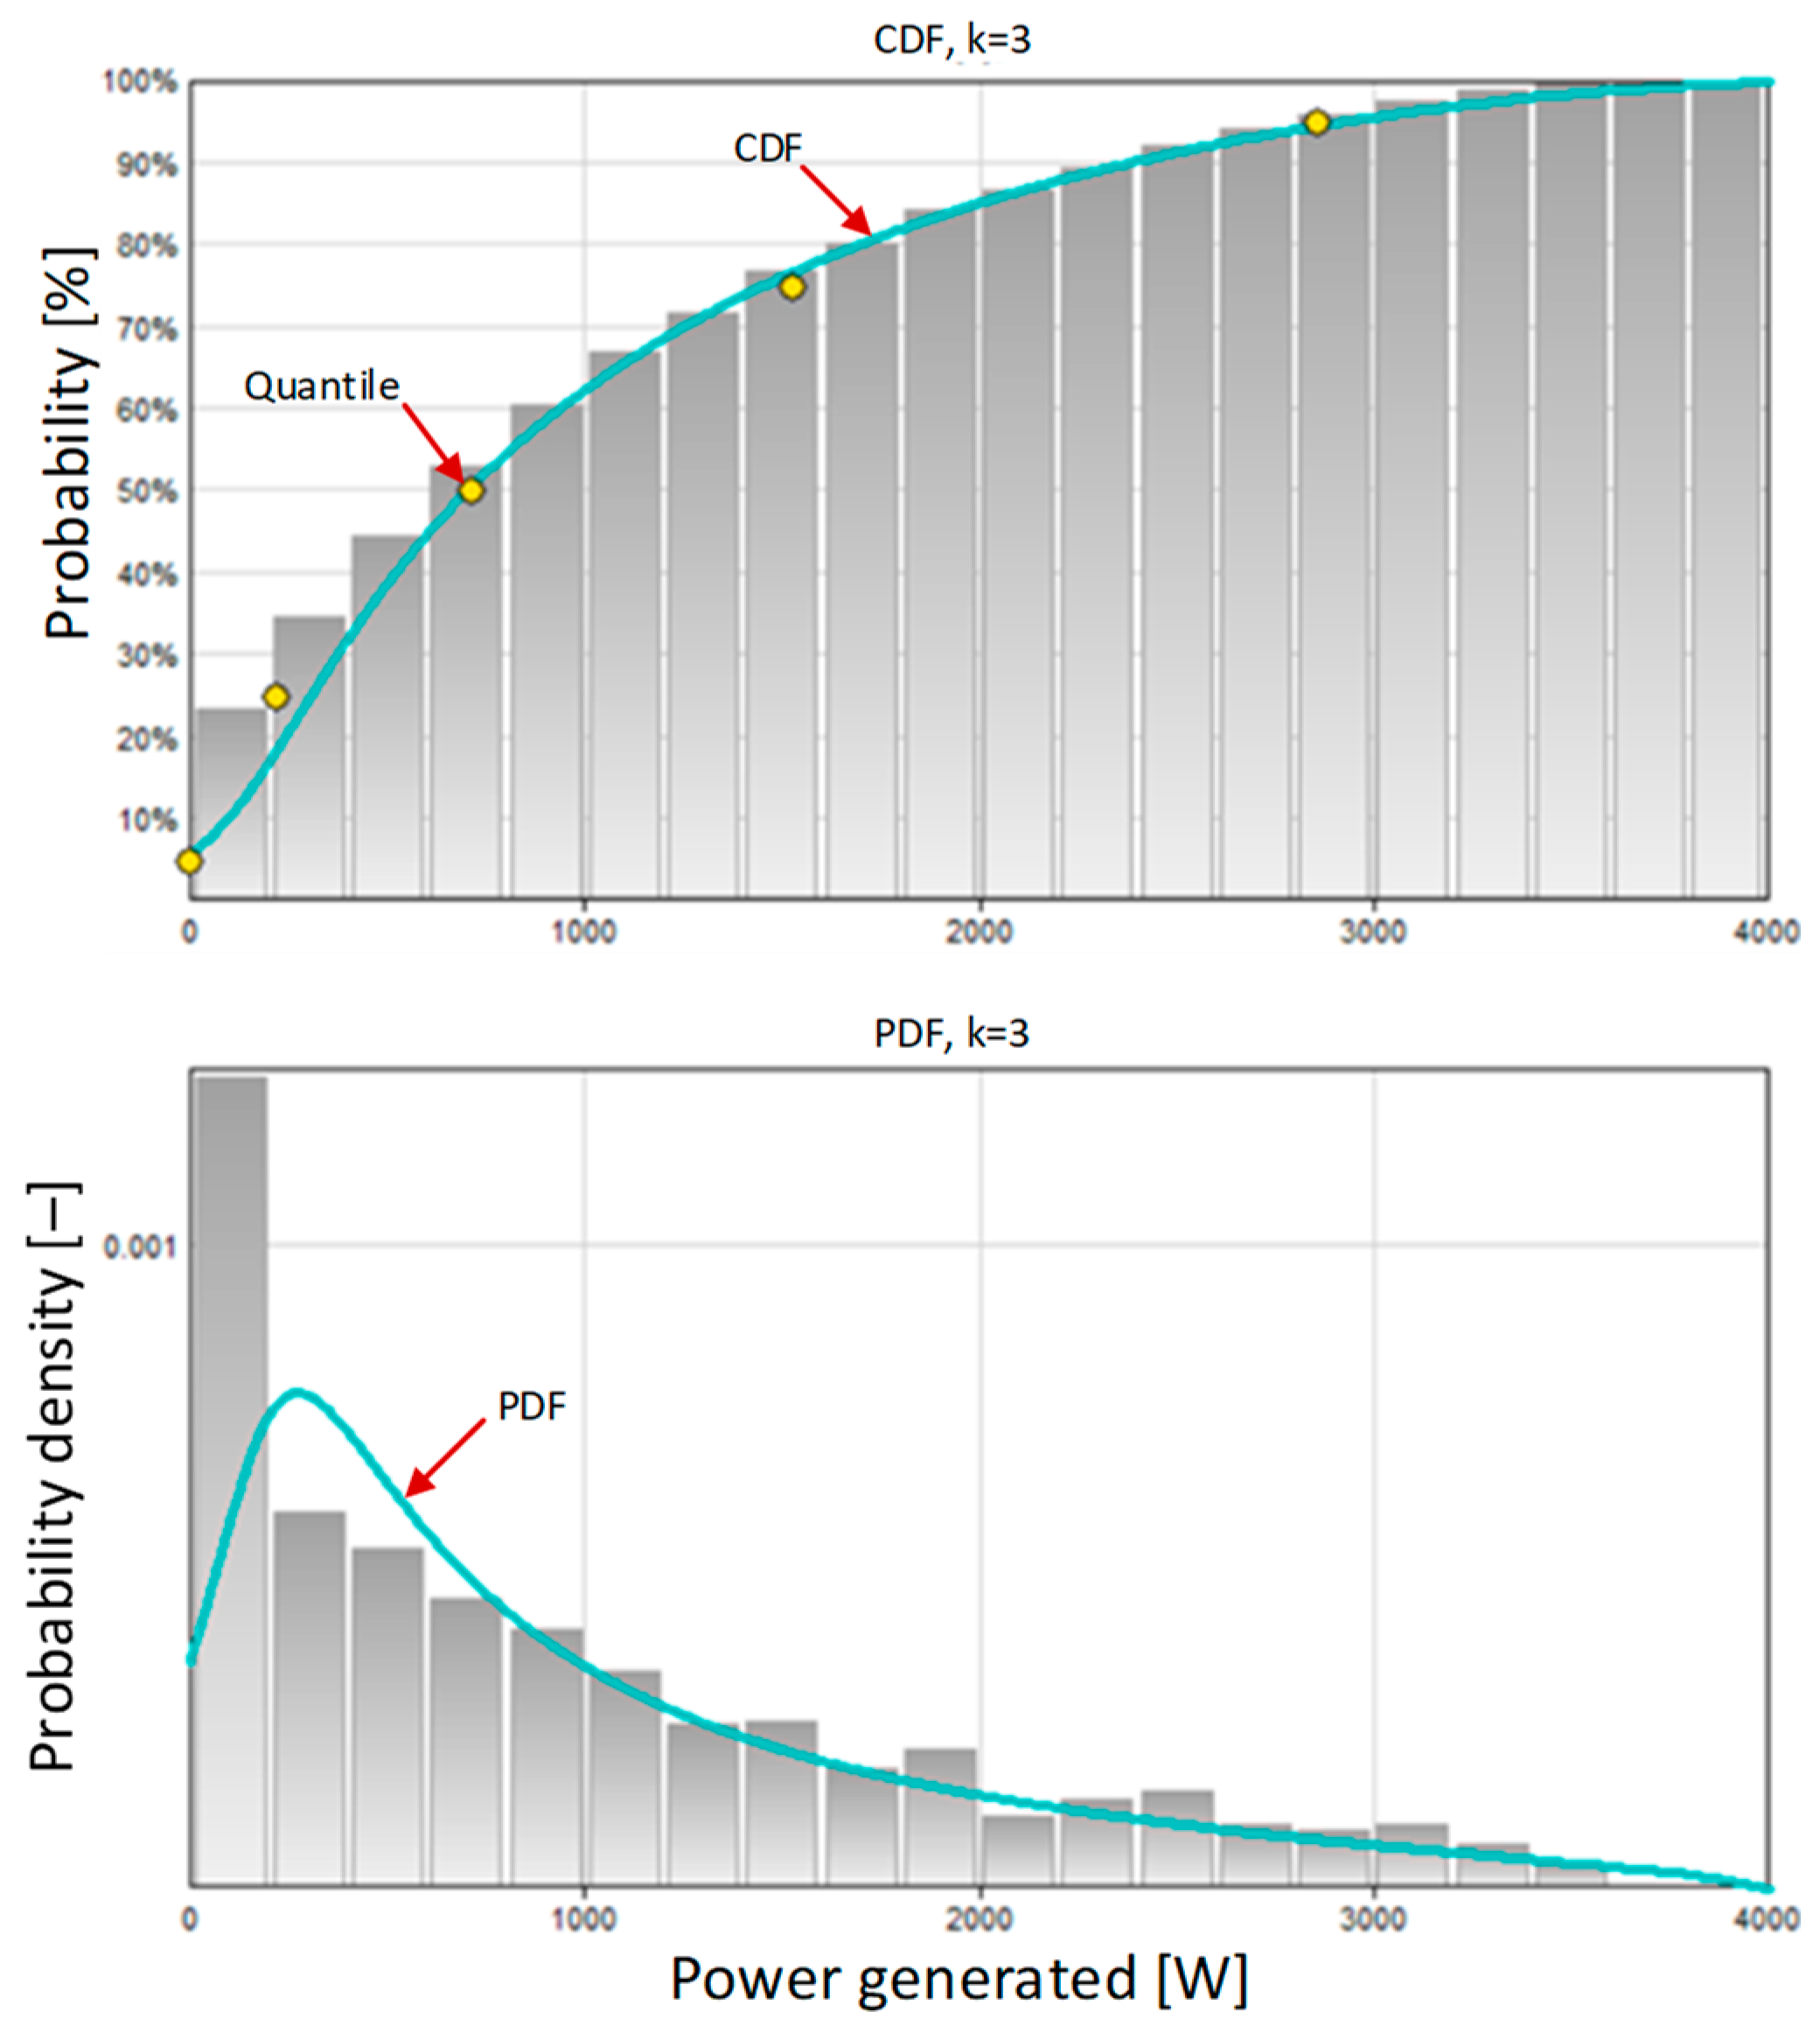
| Power [kW] | |
|---|---|
| Count | 1487 |
| Minimum | 0 |
| Maximum | 3188 |
| Mean | 742.843 |
| StdDev | 912.015 |
| Probability | Power [kW] |
|---|---|
| 0.05 | 0 |
| 0.25 | 0 |
| 0.5 | 227 |
| 0.75 | 1544 |
| 0.95 | 2496 |
| 0.5958 | 500 |
| 0.6759 | 1000 |
| 0.8359 | 2000 |
| 0.9993 | 3000 |
| Power [kW] | Probability ≤ | Probability > |
|---|---|---|
| 500 | 0.5958 | 0.4042 |
| 1000 | 0.6759 | 0.3241 |
| 2000 | 0.8359 | 0.1641 |
| 3000 | 0.9993 | 0.0007 |
| Power [kW] | Probability before Interpolation > | Probability after Interpolation > | Relative Error [%] |
|---|---|---|---|
| 500 | 0.4047 | 0.4042 | 0.13 |
| 1000 | 0.3297 | 0.3241 | 1.70 |
| 2000 | 0.1661 | 0.1641 | 1.18 |
| 3000 | 0.0003 | 0.0007 | −100.07 |
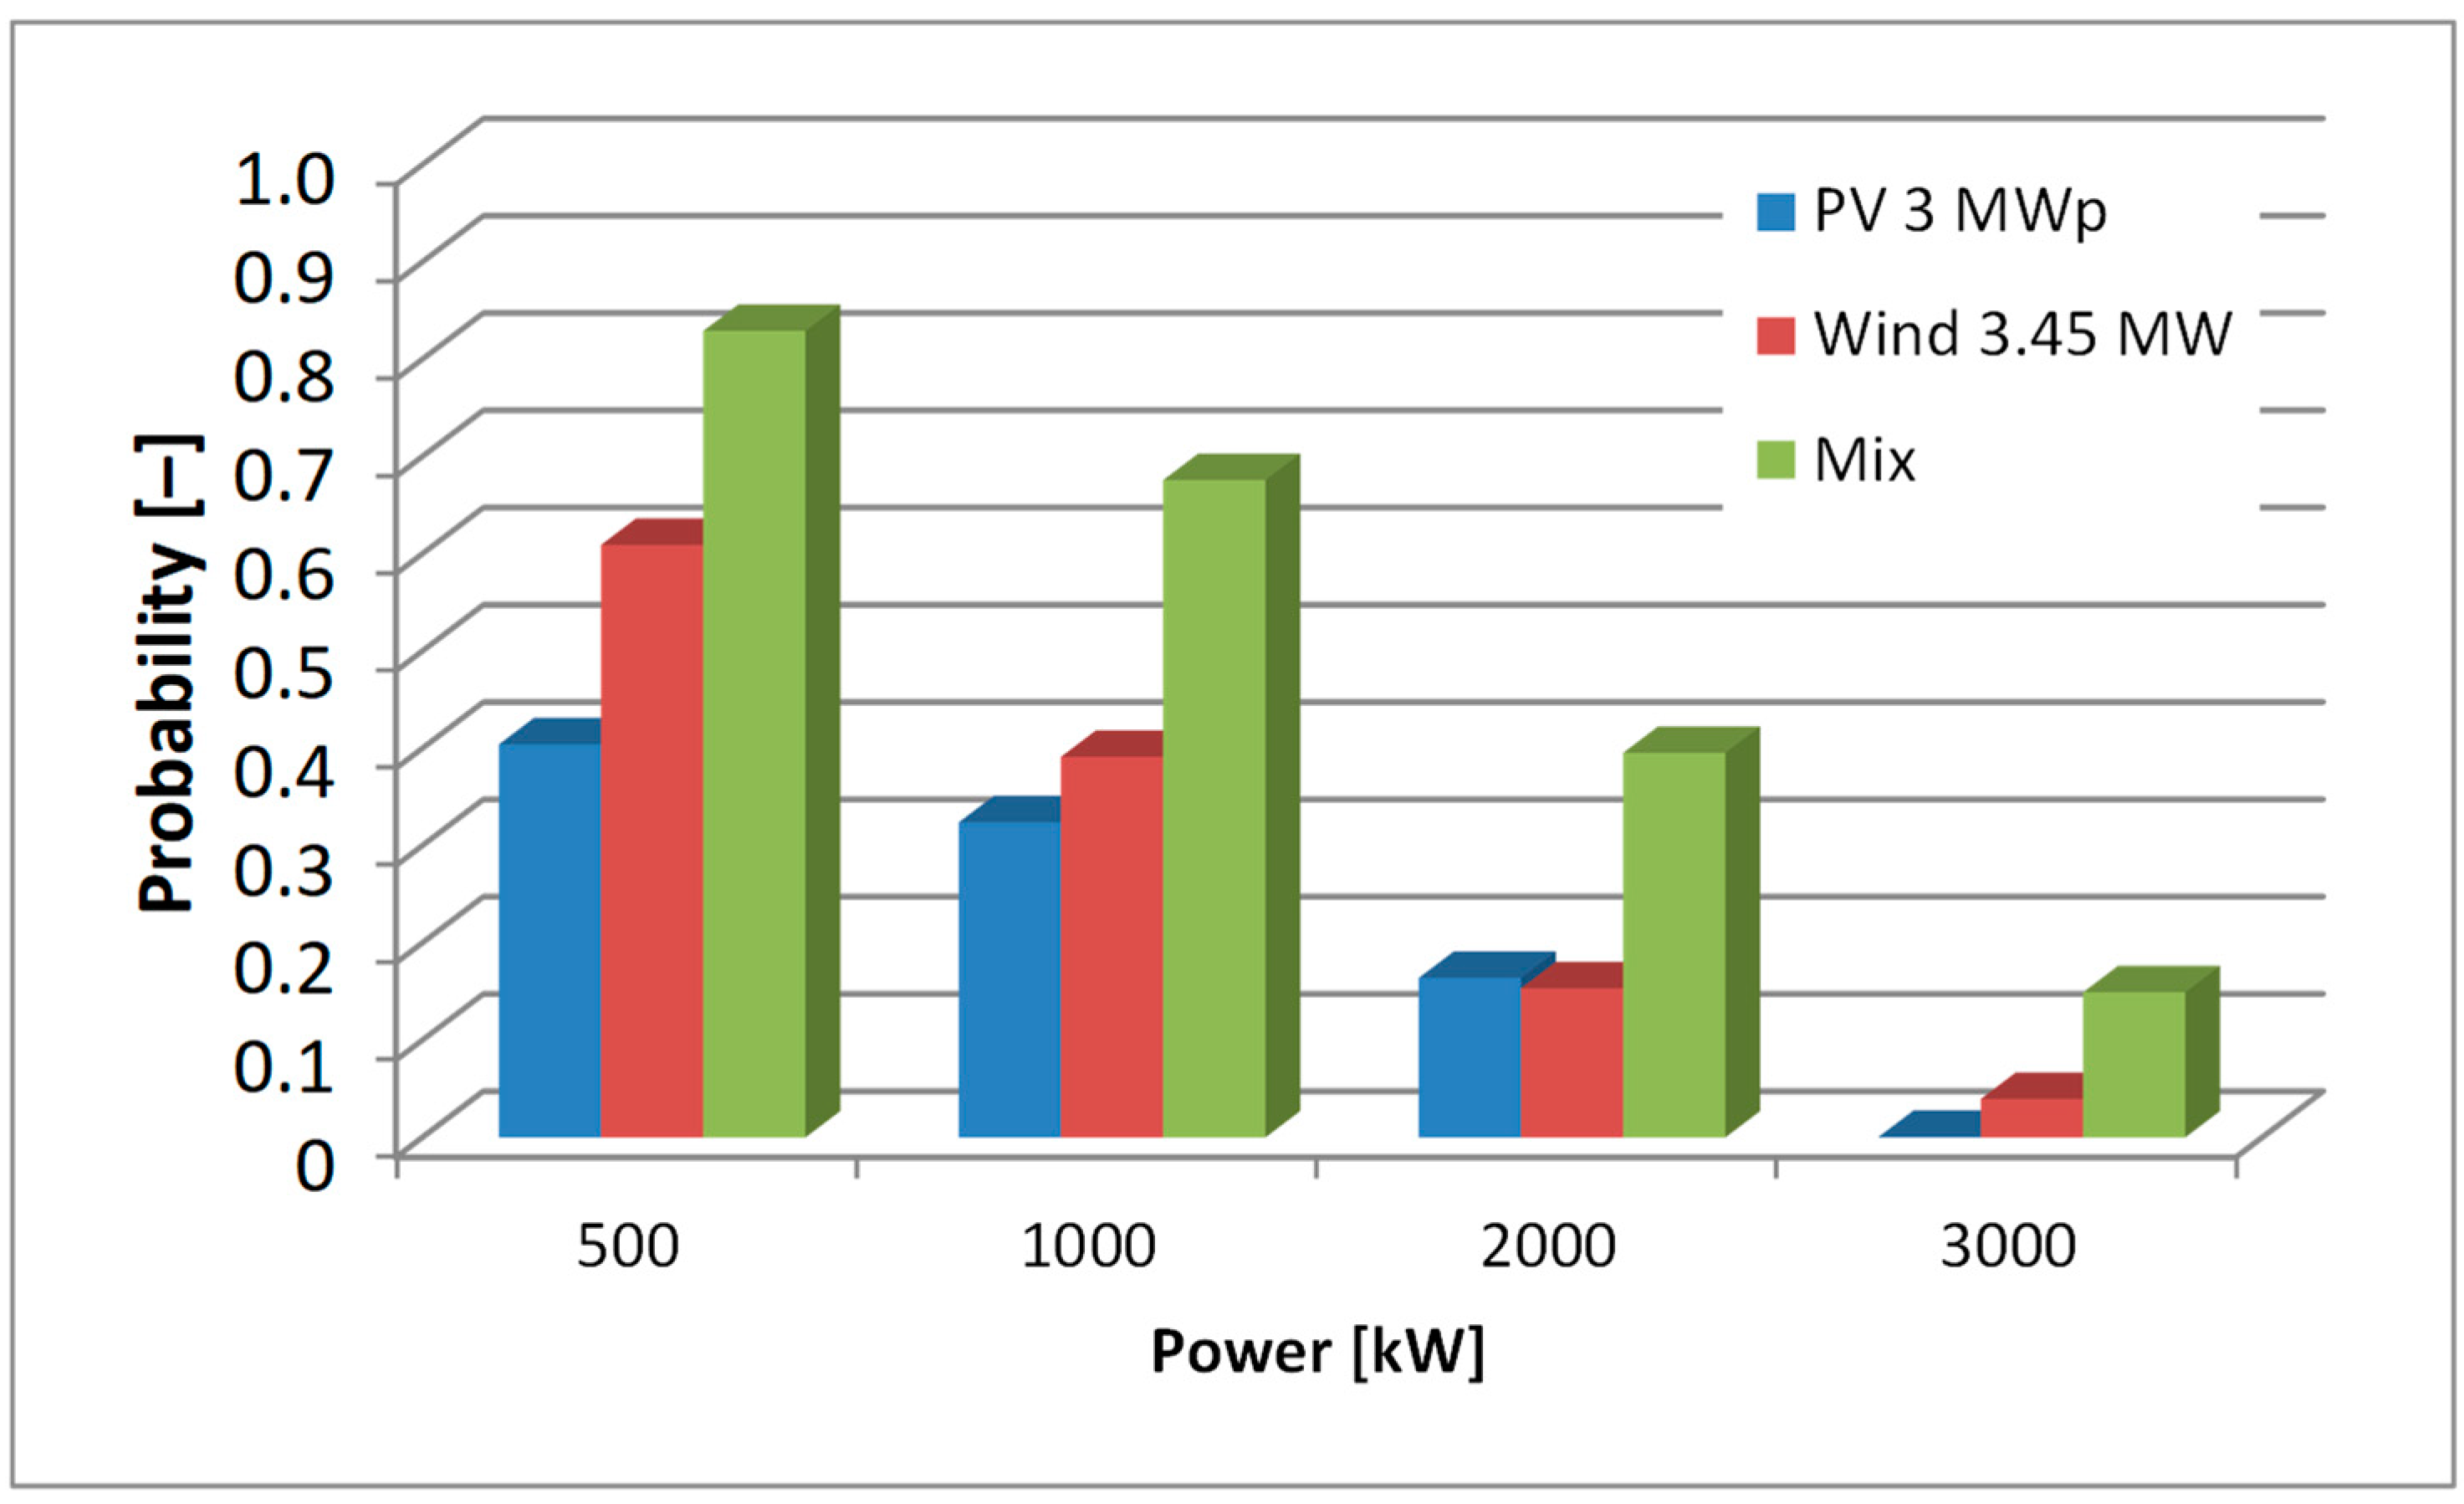
| Power [kW] | |
|---|---|
| Count | 4463 |
| Minimum | 0 |
| Maximum | 3450 |
| Mean | 980.951 |
| StdDev | 911.637 |
| Probability | Power [kW] |
|---|---|
| 0.05 | 0 |
| 0.25 | 221 |
| 0.5 | 712 |
| 0.75 | 1542 |
| 0.95 | 2887 |
| 0.3979 | 500 |
| 0.6059 | 1000 |
| 0.8402 | 2000 |
| 0.9617 | 3000 |
| Power [kW] | Probability ≤ | Probability > |
|---|---|---|
| 500 | 0.3979 | 0.6021 |
| 1000 | 0.6059 | 0.3941 |
| 2000 | 0.8402 | 0.1598 |
| 3000 | 0.9617 | 0.0383 |
| Power [kW] | |
|---|---|
| Count | 1487 |
| Minimum | 0 |
| Maximum | 3450 |
| Mean | 978.703 |
| StdDev | 906.256 |
| Probability | Power [kW] |
|---|---|
| 0.05 | 0 |
| 0.25 | 225 |
| 0.5 | 714 |
| 0.75 | 1527 |
| 0.95 | 2862 |
| 0.3907 | 500 |
| 0.6086 | 1000 |
| 0.8467 | 2000 |
| 0.9603 | 3000 |
| Power [kW] | Probability ≤ | Probability > |
|---|---|---|
| 500 | 0.3907 | 0.6093 |
| 1000 | 0.6086 | 0.3914 |
| 2000 | 0.8467 | 0.1533 |
| 3000 | 0.9603 | 0.0397 |
| Power [kW] | Probability before Interpolation > | Probability after Interpolation > | Relative Error [%] |
|---|---|---|---|
| 500 | 0.6021 | 0.6093 | −1.20 |
| 1000 | 0.3941 | 0.3914 | 0.69 |
| 2000 | 0.1598 | 0.1533 | 4.02 |
| 3000 | 0.0383 | 0.0397 | −3.55 |
| Power [kW] | |
|---|---|
| Count | 1487 |
| Minimum | 0 |
| Maximum | 6032 |
| Mean | 1721.55 |
| StdDev | 1142.87 |
| Probability | Power [kW] |
|---|---|
| 0.05 | 101 |
| 0.25 | 749 |
| 0.5 | 1623 |
| 0.75 | 2548 |
| 0.95 | 3651 |
| 0.1708 | 500 |
| 0.3241 | 1000 |
| 0.6046 | 2000 |
| 0.8507 | 3000 |
| Power [kW] | Probability ≤ | Probability > |
|---|---|---|
| 500 | 0.1708 | 0.8292 |
| 1000 | 0.3241 | 0.6759 |
| 2000 | 0.6046 | 0.3954 |
| 3000 | 0.8507 | 0.1493 |
Disclaimer/Publisher’s Note: The statements, opinions and data contained in all publications are solely those of the individual author(s) and contributor(s) and not of MDPI and/or the editor(s). MDPI and/or the editor(s) disclaim responsibility for any injury to people or property resulting from any ideas, methods, instructions or products referred to in the content. |
© 2024 by the authors. Licensee MDPI, Basel, Switzerland. This article is an open access article distributed under the terms and conditions of the Creative Commons Attribution (CC BY) license (https://creativecommons.org/licenses/by/4.0/).
Share and Cite
Dudziak, A.; Małek, A.; Marciniak, A.; Caban, J.; Seńko, J. Probabilistic Analysis of Green Hydrogen Production from a Mix of Solar and Wind Energy. Energies 2024, 17, 4387. https://doi.org/10.3390/en17174387
Dudziak A, Małek A, Marciniak A, Caban J, Seńko J. Probabilistic Analysis of Green Hydrogen Production from a Mix of Solar and Wind Energy. Energies. 2024; 17(17):4387. https://doi.org/10.3390/en17174387
Chicago/Turabian StyleDudziak, Agnieszka, Arkadiusz Małek, Andrzej Marciniak, Jacek Caban, and Jarosław Seńko. 2024. "Probabilistic Analysis of Green Hydrogen Production from a Mix of Solar and Wind Energy" Energies 17, no. 17: 4387. https://doi.org/10.3390/en17174387
APA StyleDudziak, A., Małek, A., Marciniak, A., Caban, J., & Seńko, J. (2024). Probabilistic Analysis of Green Hydrogen Production from a Mix of Solar and Wind Energy. Energies, 17(17), 4387. https://doi.org/10.3390/en17174387