1. Introduction
Revitalizing abandoned hydrocarbon fields for sustainable energy utilization presents a promising pathway to address the intermittent nature of renewable resources and the global challenge of carbon emission reduction [
1,
2]. This initiative aligns with the urgent call for innovative energy solutions underscored in pivotal studies and reports [
3,
4,
5,
6], aiming to bridge the seasonal supply–demand mismatch and enhance energy security [
7,
8]. It embodies the drive towards energy decentralization and independence, highlighting the critical need for adaptable and reliable energy systems in the face of fluctuating renewable outputs [
9,
10]. Hydrocarbon fields, upon reaching depletion, typically require decommissioning and plugging to ensure environmental safety and compliance with regulatory standards. This process is often costly, with median decommissioning expenses estimated at around USD 76,000 per well, and can exceed USD 1 million in more complex scenarios due to factors like well depth, age, and location [
11]. These costs encompass plugging the well to prevent leaks, removing infrastructure, and restoring the surface to its natural state.
Various initiatives have explored converting depleted hydrocarbon reservoirs for different pore utilization, encompassing CO
2 storage [
12], electricity generation [
1], hydrogen storage [
13], and Aquifer Thermal Energy Storage [
14,
15], further underscoring the versatility and potential of these underground spaces. Utilizing depleted hydrocarbon reservoirs for Aquifer Thermal Energy Storage (ATES) signifies a pivotal move toward sustainable energy practices. This approach leverages existing geological insights and infrastructure for renewable energy storage and adeptly meets fluctuating energy demands across seasons. ATES, a proven technology, boasts over 2800 sites globally, particularly in the Netherlands, evidencing its efficacy and adoption [
16,
17,
18,
19].
ATES systems underscore a pivotal advancement in renewable energy utilization, offering a strategic solution to the energy mismatch challenge by enabling the seasonal storage and retrieval of heat. This enhances energy security by stabilizing the supply–demand continuum and fosters the integration of renewable sources into the energy grid. Critically, ATES’s contribution extends to environmental conservation, showcasing a potential pathway for substantial reductions in CO
2 emissions. The proven operational success in regions like the Netherlands is a testament to ATES’s role in promoting sustainable energy solutions and advancing environmental preservation goals, marking it as a cornerstone technology in the quest for a greener future [
17].
As the lifespan of many hydrocarbon fields approaches its end, stakeholders face a critical decision: undertake the expensive decommissioning process, or pivot towards repurposing these sites for renewable energy projects [
20,
21]. With their inherent geological characteristics, depleted hydrocarbon reservoirs offer a promising avenue for such energy storage solutions. Their permeability, porosity, and extensive historical data availability position them as ideal candidates for geothermal battery energy storage applications [
22]. The operational efficiency of High Temperature-ATES (HT-ATES) systems, particularly in deeper reservoirs that do not affect near-surface groundwater horizons, coupled with the favorable geothermal conditions in regions like the Upper Rhine Graben, underscores the potential of depleted hydrocarbon reservoirs as ideal candidates for geothermal energy storage solutions [
23]. A study [
24] on Advanced Geothermal Energy Storage systems, which investigated field-scale implementation in the low-temperature Illinois basin by utilizing an oil well, complements the operational efficiency of HT-ATES systems in deeper reservoirs, making it a promising solution for sustainable geothermal energy storage [
23]. Numerous hydrocarbon fields, once bustling with oil and gas production, now stand depleted. We have selected one of the potential formations in the southeast, renowned for its extensive gas production history and substantial water volume, to emerge as a potential site for different pore utilizations, including ATES exploration. To effectively harness these reservoirs for ATES, either for low-temperature (LT) or high-temperature (HT) applications, a detailed methodology is essential for pinpointing the optimal locations within these reservoirs, ensuring their successful transformation into viable energy storage solutions.
The robustness of Multi-Criteria Decision Analysis (MCDA) as a methodological approach for this research is affirmed through its broad application across diverse geoscience and environmental management domains. Its efficacy is evidenced in the selection of sites for compressed air energy storage systems [
14], where MCDA facilitated the integration of spatial and non-spatial criteria to discern optimal locations, and in water resource management [
25], where it enabled the balancing of economic, social, and environmental objectives among multiple stakeholders. Furthermore, using MCDA in reservoir system operational planning through a two-stage procedure combining multi-objective optimization and MCDA techniques underscores its versatility in handling quantitative and qualitative objectives [
26]. These varied applications illustrate MCDA’s comprehensive capacity to navigate complex decision-making landscapes, making it a fitting choice for evaluating the depleted hydrocarbon field’s potential for HT-ATES and other pore utilization strategies.
This study proposes a comprehensive methodology for evaluating abandoned hydrocarbon fields for various pore utilization purposes. It utilizes a real hydrocarbon field in Hungary as a case study to assess its suitability for HT-ATES, among other applications. Leveraging MCDA and extensive reservoir data, we aim to pinpoint optimal zones for ATES deployment. The goal is to deliver a lucid systematic analysis to inform future ATES projects or other energy pore utilizations, thereby enhancing energy sustainability and independence amid escalating environmental and demand-driven challenges.
2. Glossary of Terms
Abandoned Hydrocarbon Fields: Oil and gas fields that have ceased production and are no longer economically viable for extraction.
Analytic Hierarchy Process (AHP): A structured technique for organizing and analyzing complex decisions, using mathematics and psychology. It helps in setting priorities and making decisions by reducing complex decisions to a series of pairwise comparisons.
Aquifer Thermal Energy Storage (ATES): A technology that stores thermal energy in underground aquifers for later use, helping to balance the supply and demand of energy.
CO2 Storage: The process of capturing and storing carbon dioxide to reduce its presence in the atmosphere, usually in underground geological formations.
Consistency Check: In AHP, it refers to a process that ensures the consistency of judgments or comparisons made during the decision-making process.
Decommissioning: The process of safely closing and dismantling a facility, such as an oil well, that is no longer in use.
Electro-Lithologies: Rock types identified based on their electrical properties, often derived from gamma-ray logs.
Geostatistical Methods: Techniques used in geosciences to model spatial patterns and distributions.
High Temperature-Aquifer Thermal Energy Storage (HT-ATES): A type of ATES that operates at higher temperatures, typically used for applications requiring more heat energy.
Hydrocarbon Fields: Geological formations containing accumulations of oil and/or gas.
Lithology: The study and description of the petrological characteristics of rocks.
MCDA (Multi-Criteria Decision Analysis): A decision-making process that evaluates multiple conflicting criteria in decision-making, used to evaluate complex problems.
P10, P50, P90: They are parameters describing some characters of a cumulative distribution function (cdf). P10 is the value with a 0.1 probability of being exceeded, P50 with a 0.5 probability, and P90 with a 0.9 probability of being exceeded. These terms help quantify the uncertainty and variability in data, providing a range of possible outcomes.
Permeability: A measure of the ability of a porous material (like rock) to allow fluids to pass through it.
Porosity: The percentage of a rock’s volume that consists of open spaces (voids), which can store fluids such as water or hydrocarbons.
Python Scripting: Writing scripts in Python programming language to automate processes and perform complex calculations.
Reservoir: A subsurface pool of hydrocarbons contained in porous or fractured rock formations.
Sensitivity Analysis: A method to predict the outcome of a decision given a certain range of variables, used to understand the impact of different variables on the outcome.
Sequential Gaussian Simulation (SGS): A geostatistical simulation technique used to model spatial distributions of geological variables.
Stochastic Simulation: A method of simulating random variables to predict the probability distribution of possible outcomes in a process.
Universal Kriging: A geostatistical method used to interpolate the value of a random field at an unobserved location based on observations at nearby locations, taking into account both the trend and the spatial correlation of the data.
Variogram: A function describing the degree of spatial dependence of a spatial random field or stochastic process.
3. Materials and Methods
3.1. Methodological Framework
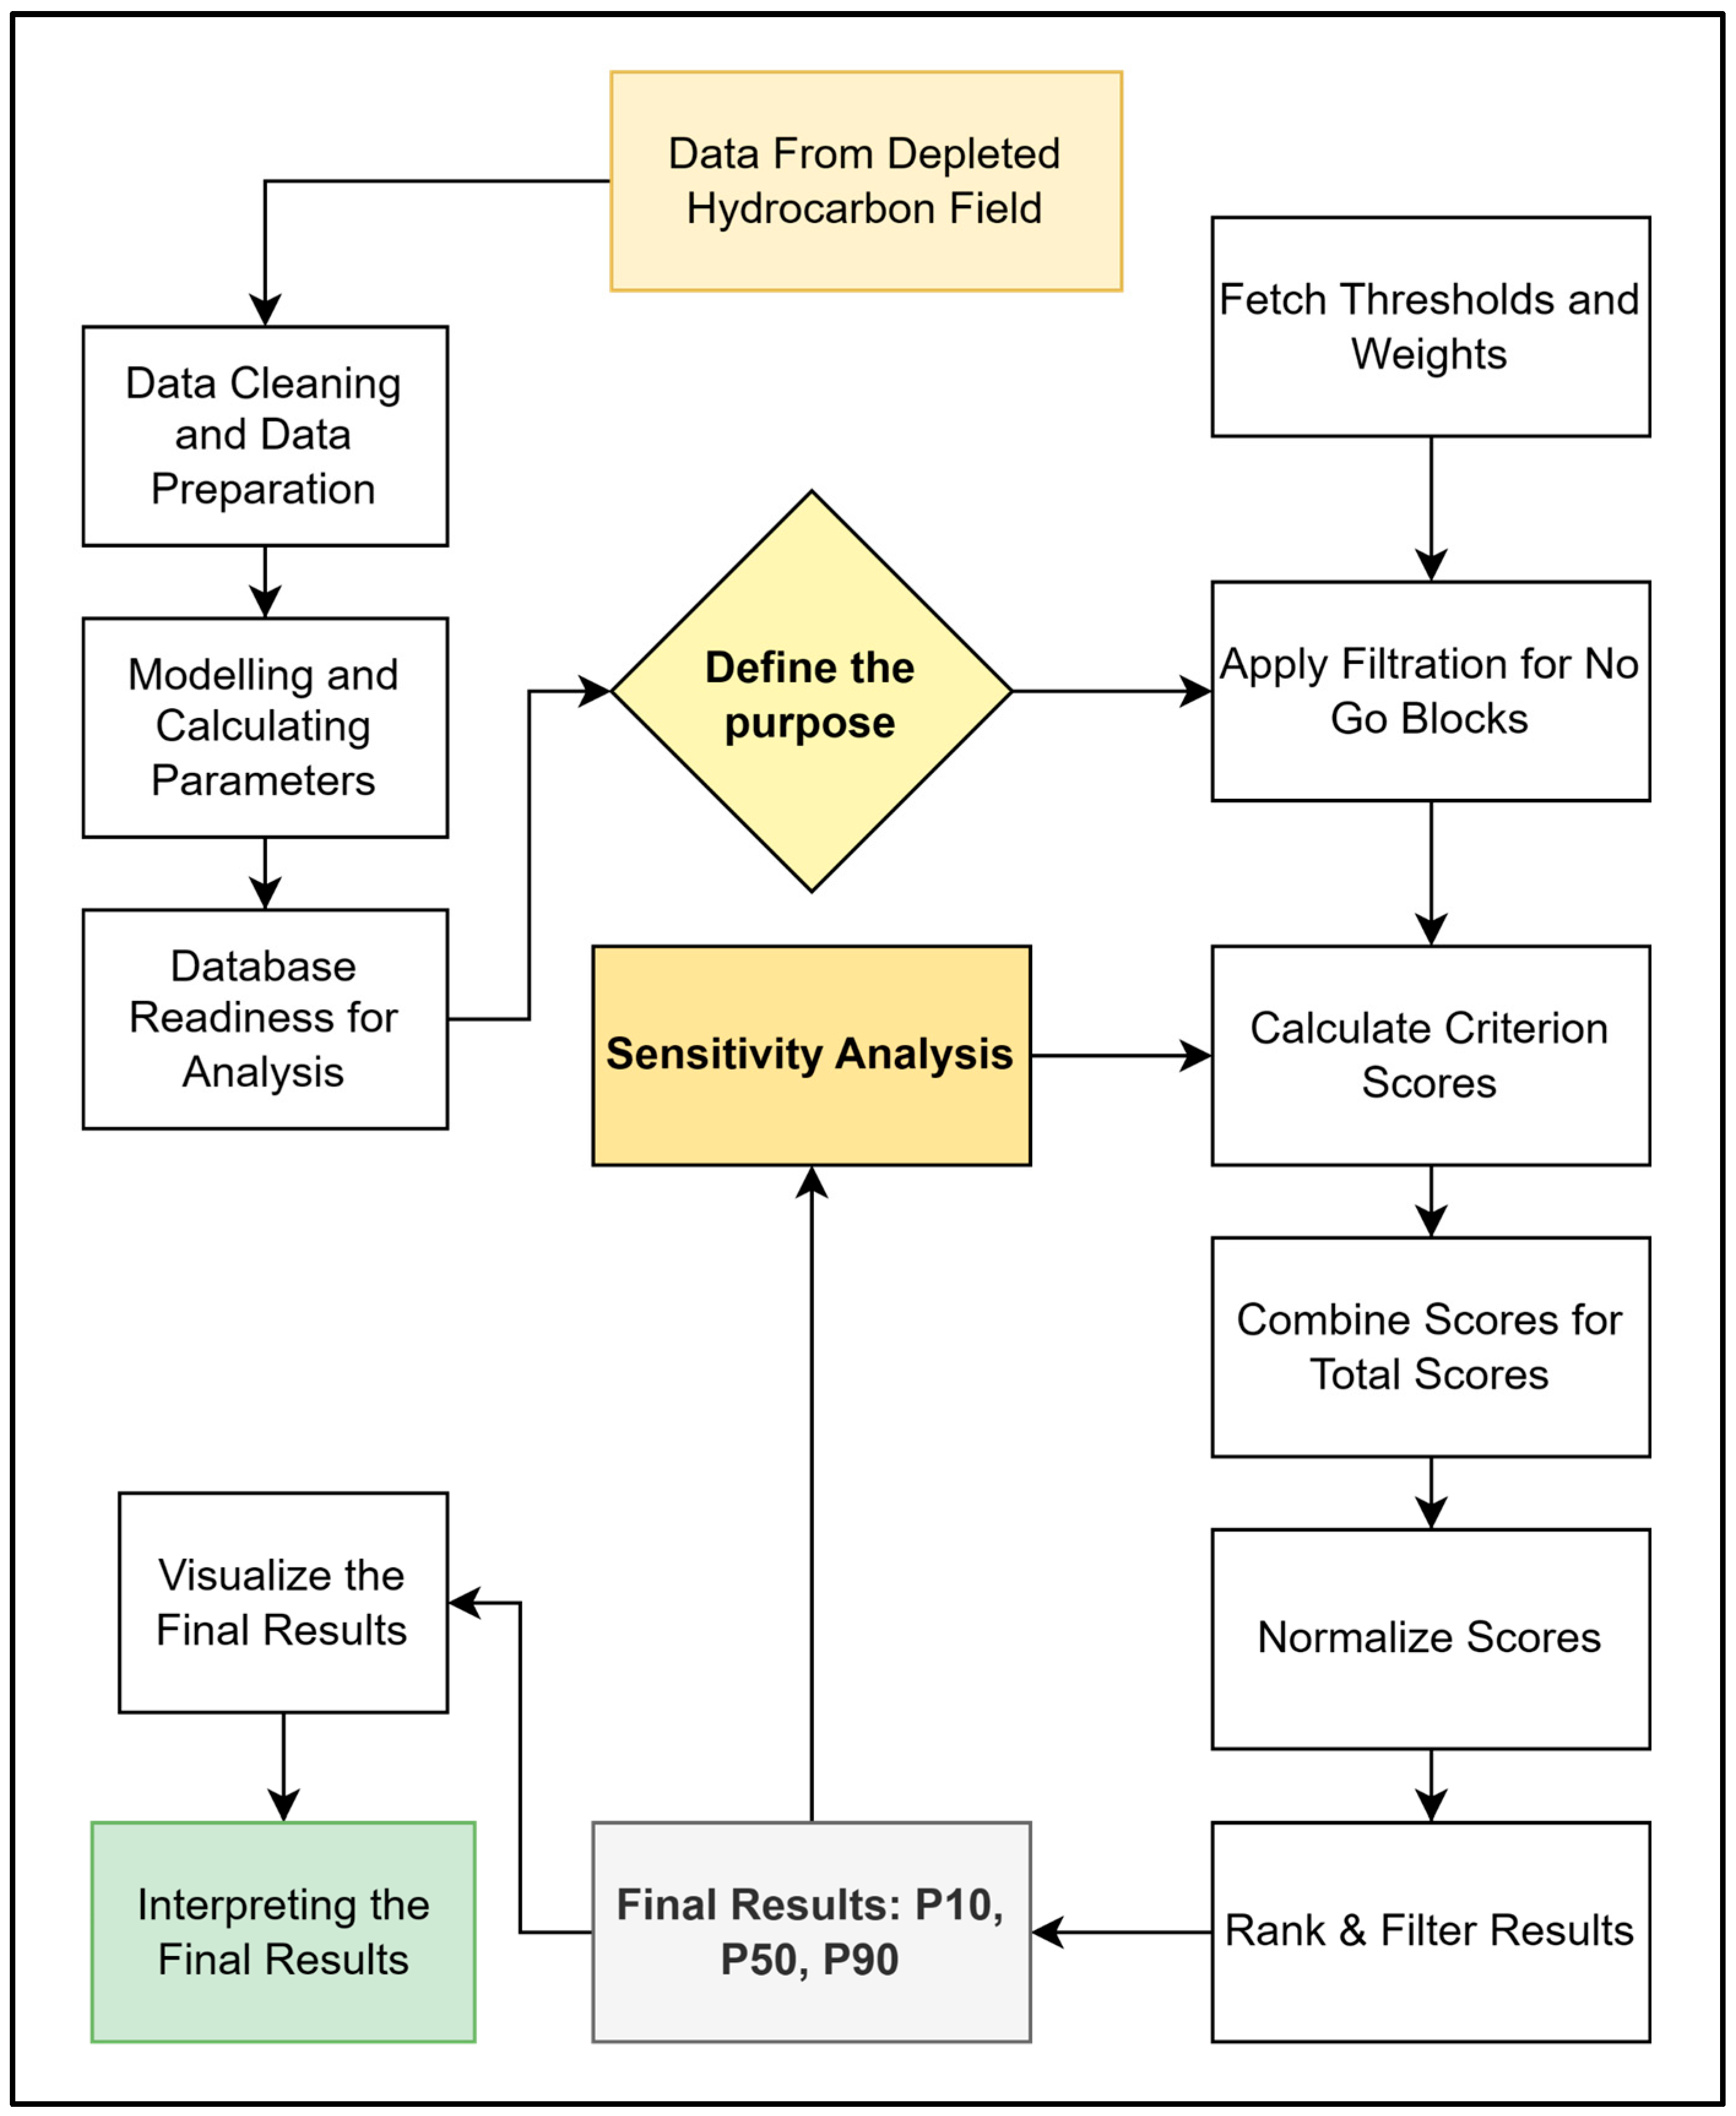
In our study, we utilized MCDA with an emphasis on the Analytic Hierarchy Process (AHP) for our geostatistical modeled data due to its robust framework for handling complex decision-making scenarios [
27]. AHP facilitates the breakdown of the decision problem into a hierarchy of more easily comprehended sub-problems, each of which can be analyzed independently (
Figure 1). This method is particularly suited to our study’s goal of evaluating the suitability of different blocks within the study area for heat storage, as it allows for incorporating both quantitative data and qualitative expert judgments.
The criteria were weighted based on a thorough local sensitivity analysis reflecting the relative importance of each parameter in the context of ATES systems and high-temperature applications similar to electricity generation. This participatory approach ensures that the weighting scheme accurately captures the priorities and insights of professionals in geothermal energy and heat storage fields. By engaging experts in the weighting process, we aimed to ground our analysis in practical, field-informed perspectives. The criteria were further validated through a consistency check in the Analytical Hierarchy Process (AHP), ensuring the robustness of the weighting scheme.
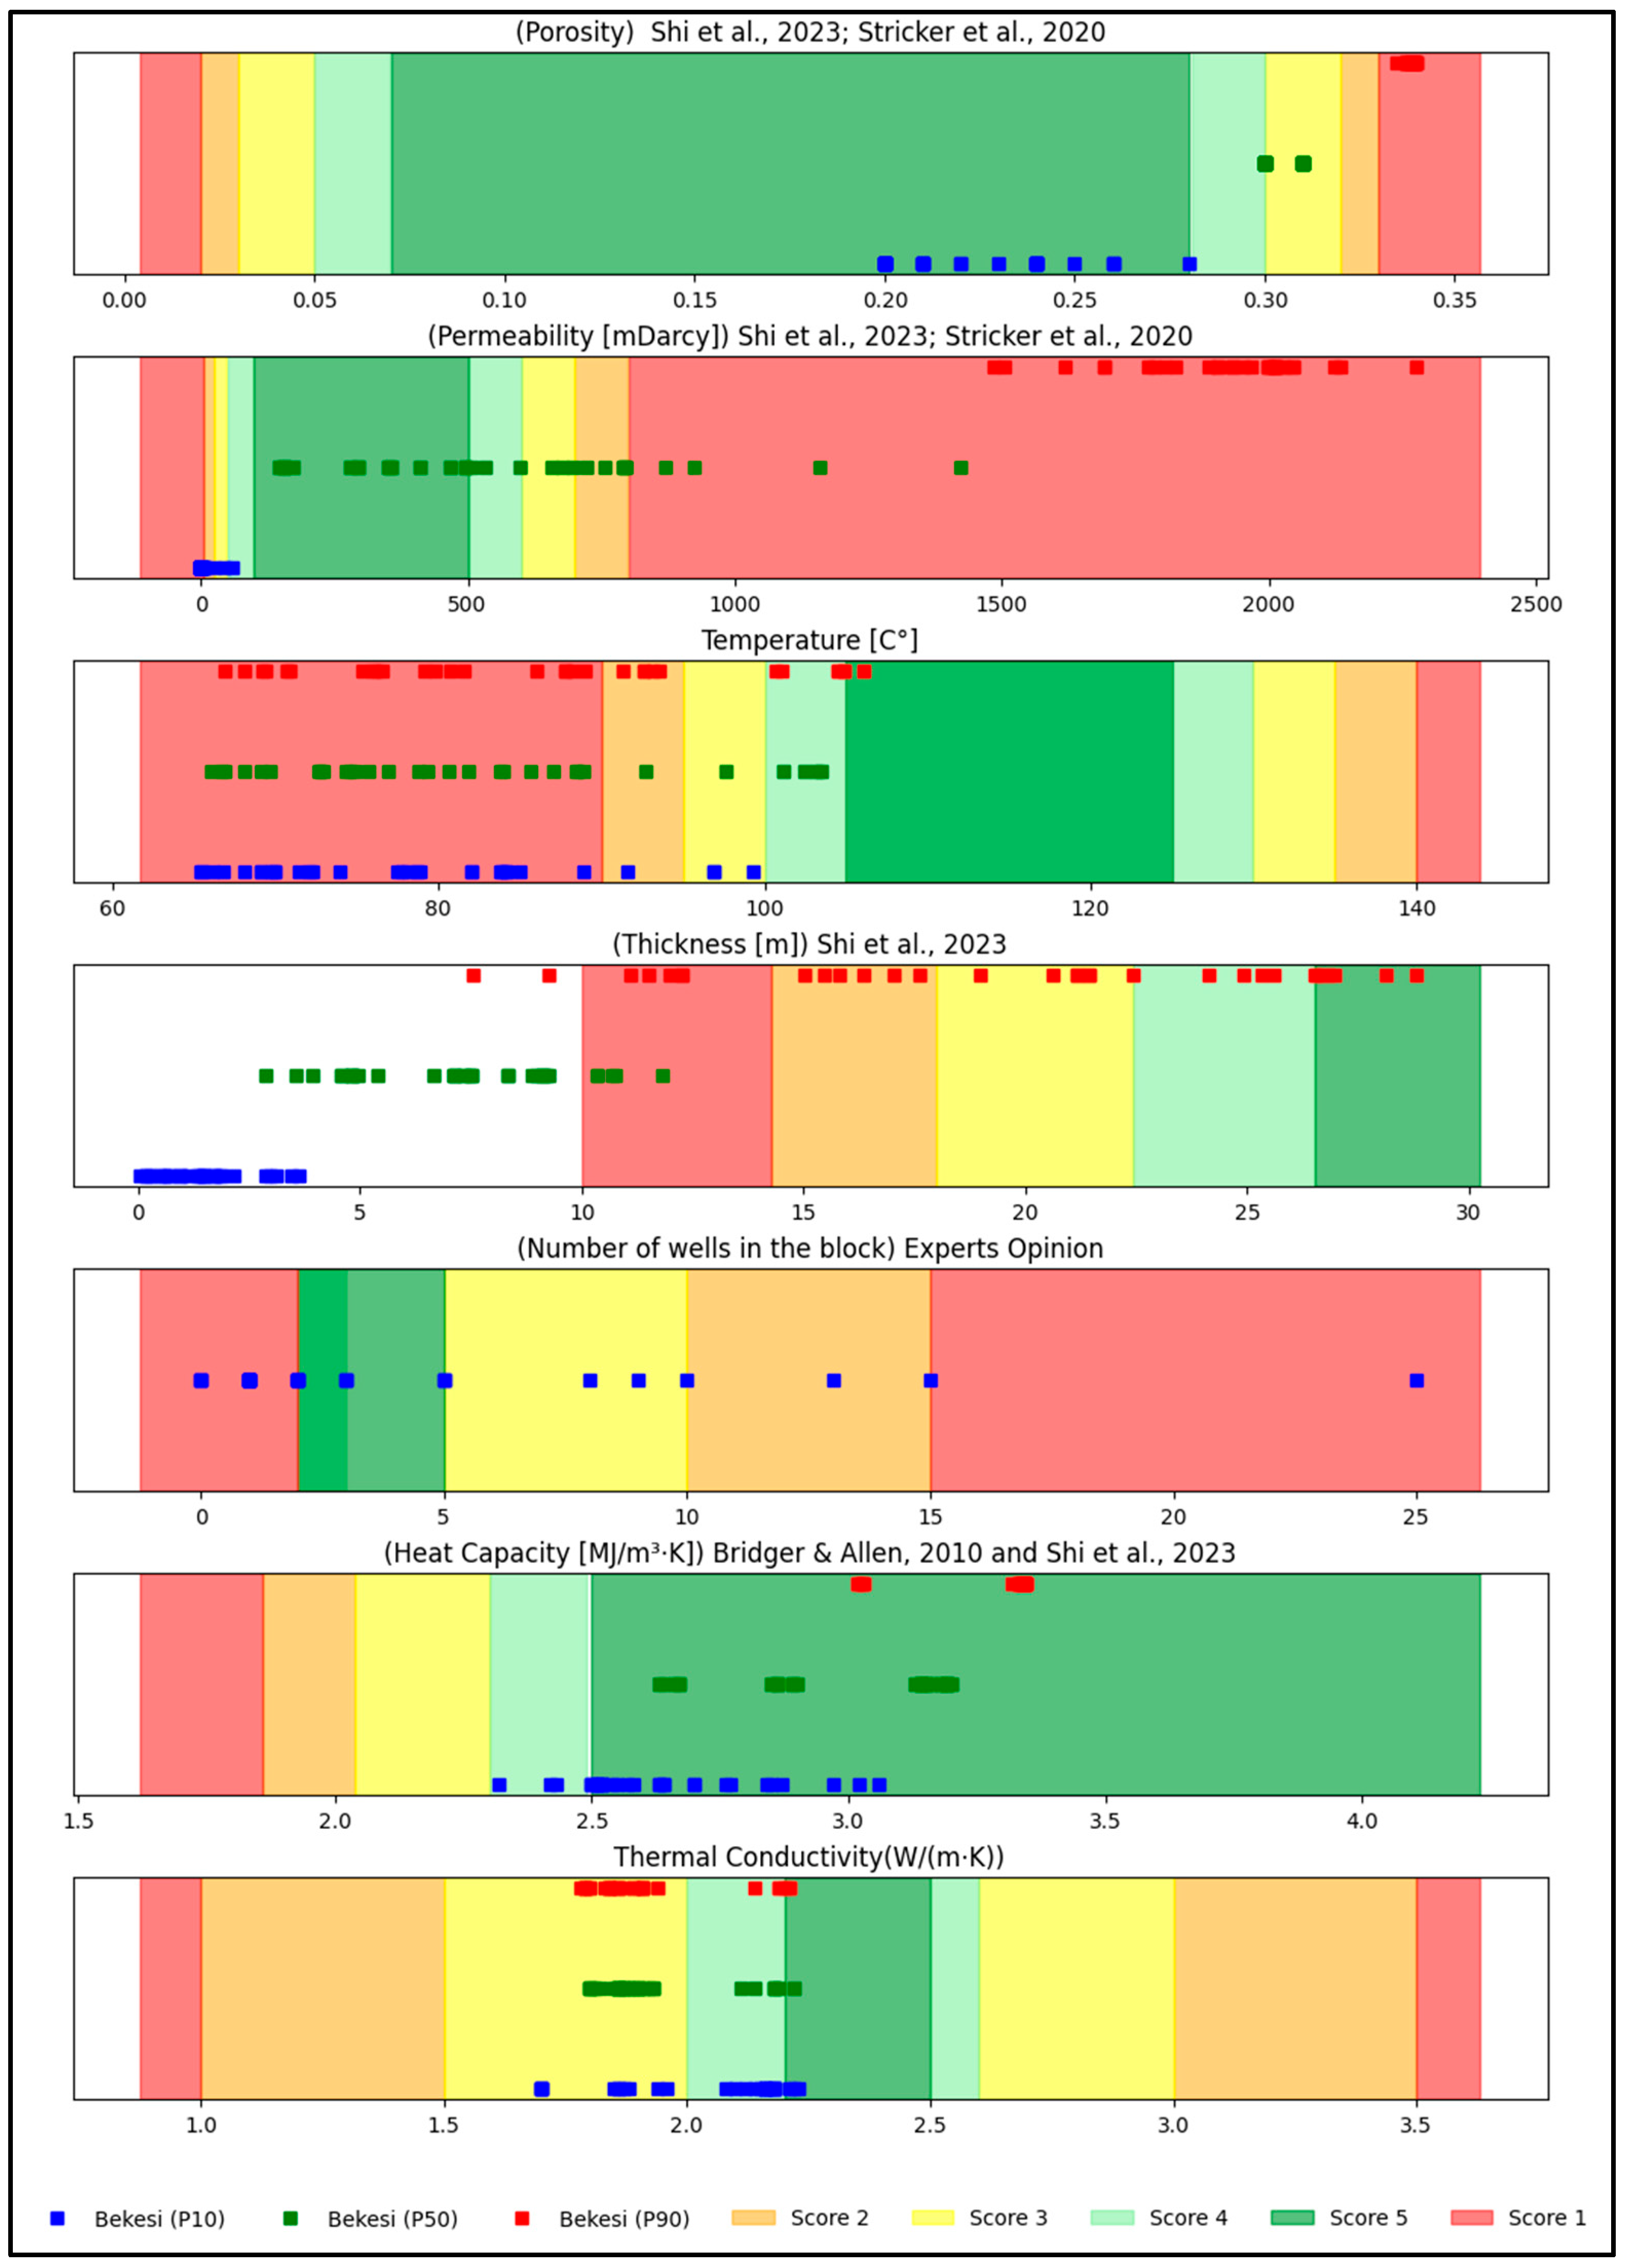
Figure 2 provides a detailed visual representation of each parameter, displaying their respective score ranges through a color-coded system: green, pale green, yellow, orange, and red. The green color signifies the best scores, indicating optimal conditions, while red denotes the worst scores, highlighting areas of concern. Each parameter is illustrated with a series of colored square points—red, green, and blue—representing the data array for that parameter.
3.2. Data Collection
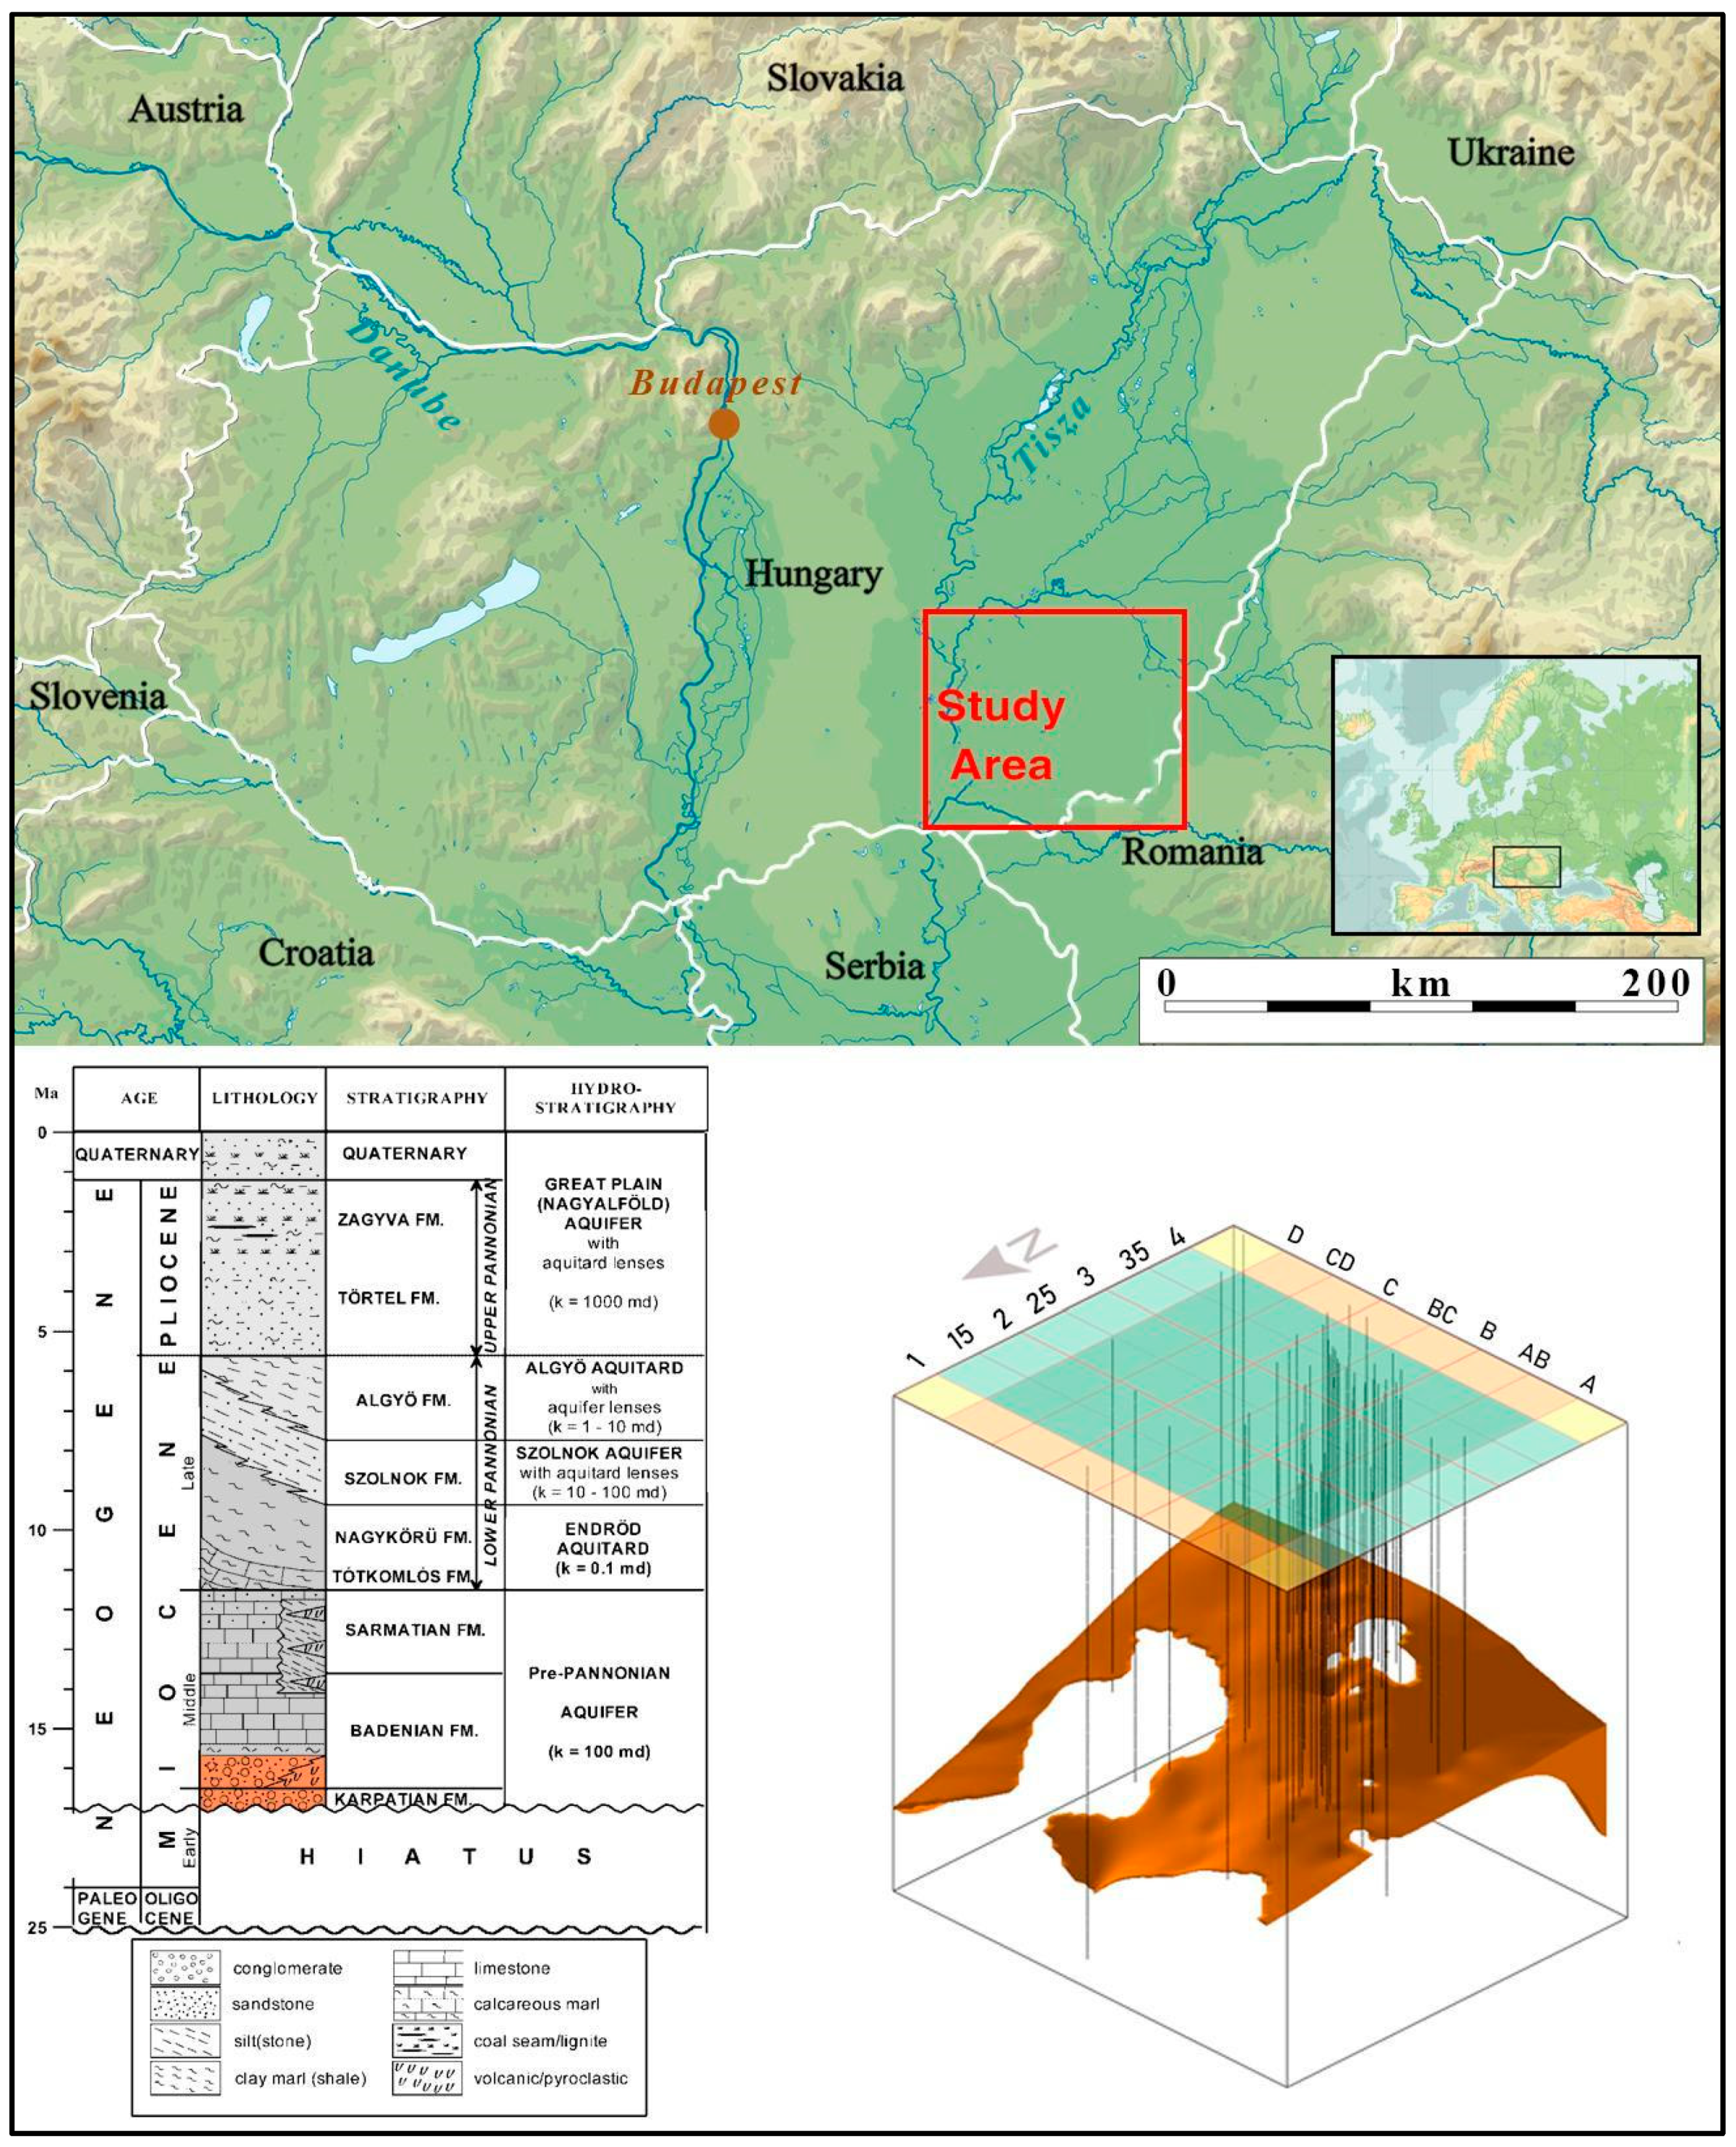
For the Data Collection segment of our study, we utilized data from 67 wells in the study area, which is located in the southern part of the Bekes Basin, Hungary, a site previously explored for hydrocarbon, but now considered for its geothermal potential [
31]. This field encompasses two potential formations, the shallow Szolnok Formation as an aquifer [
32] and the deeper Bekes Formation [
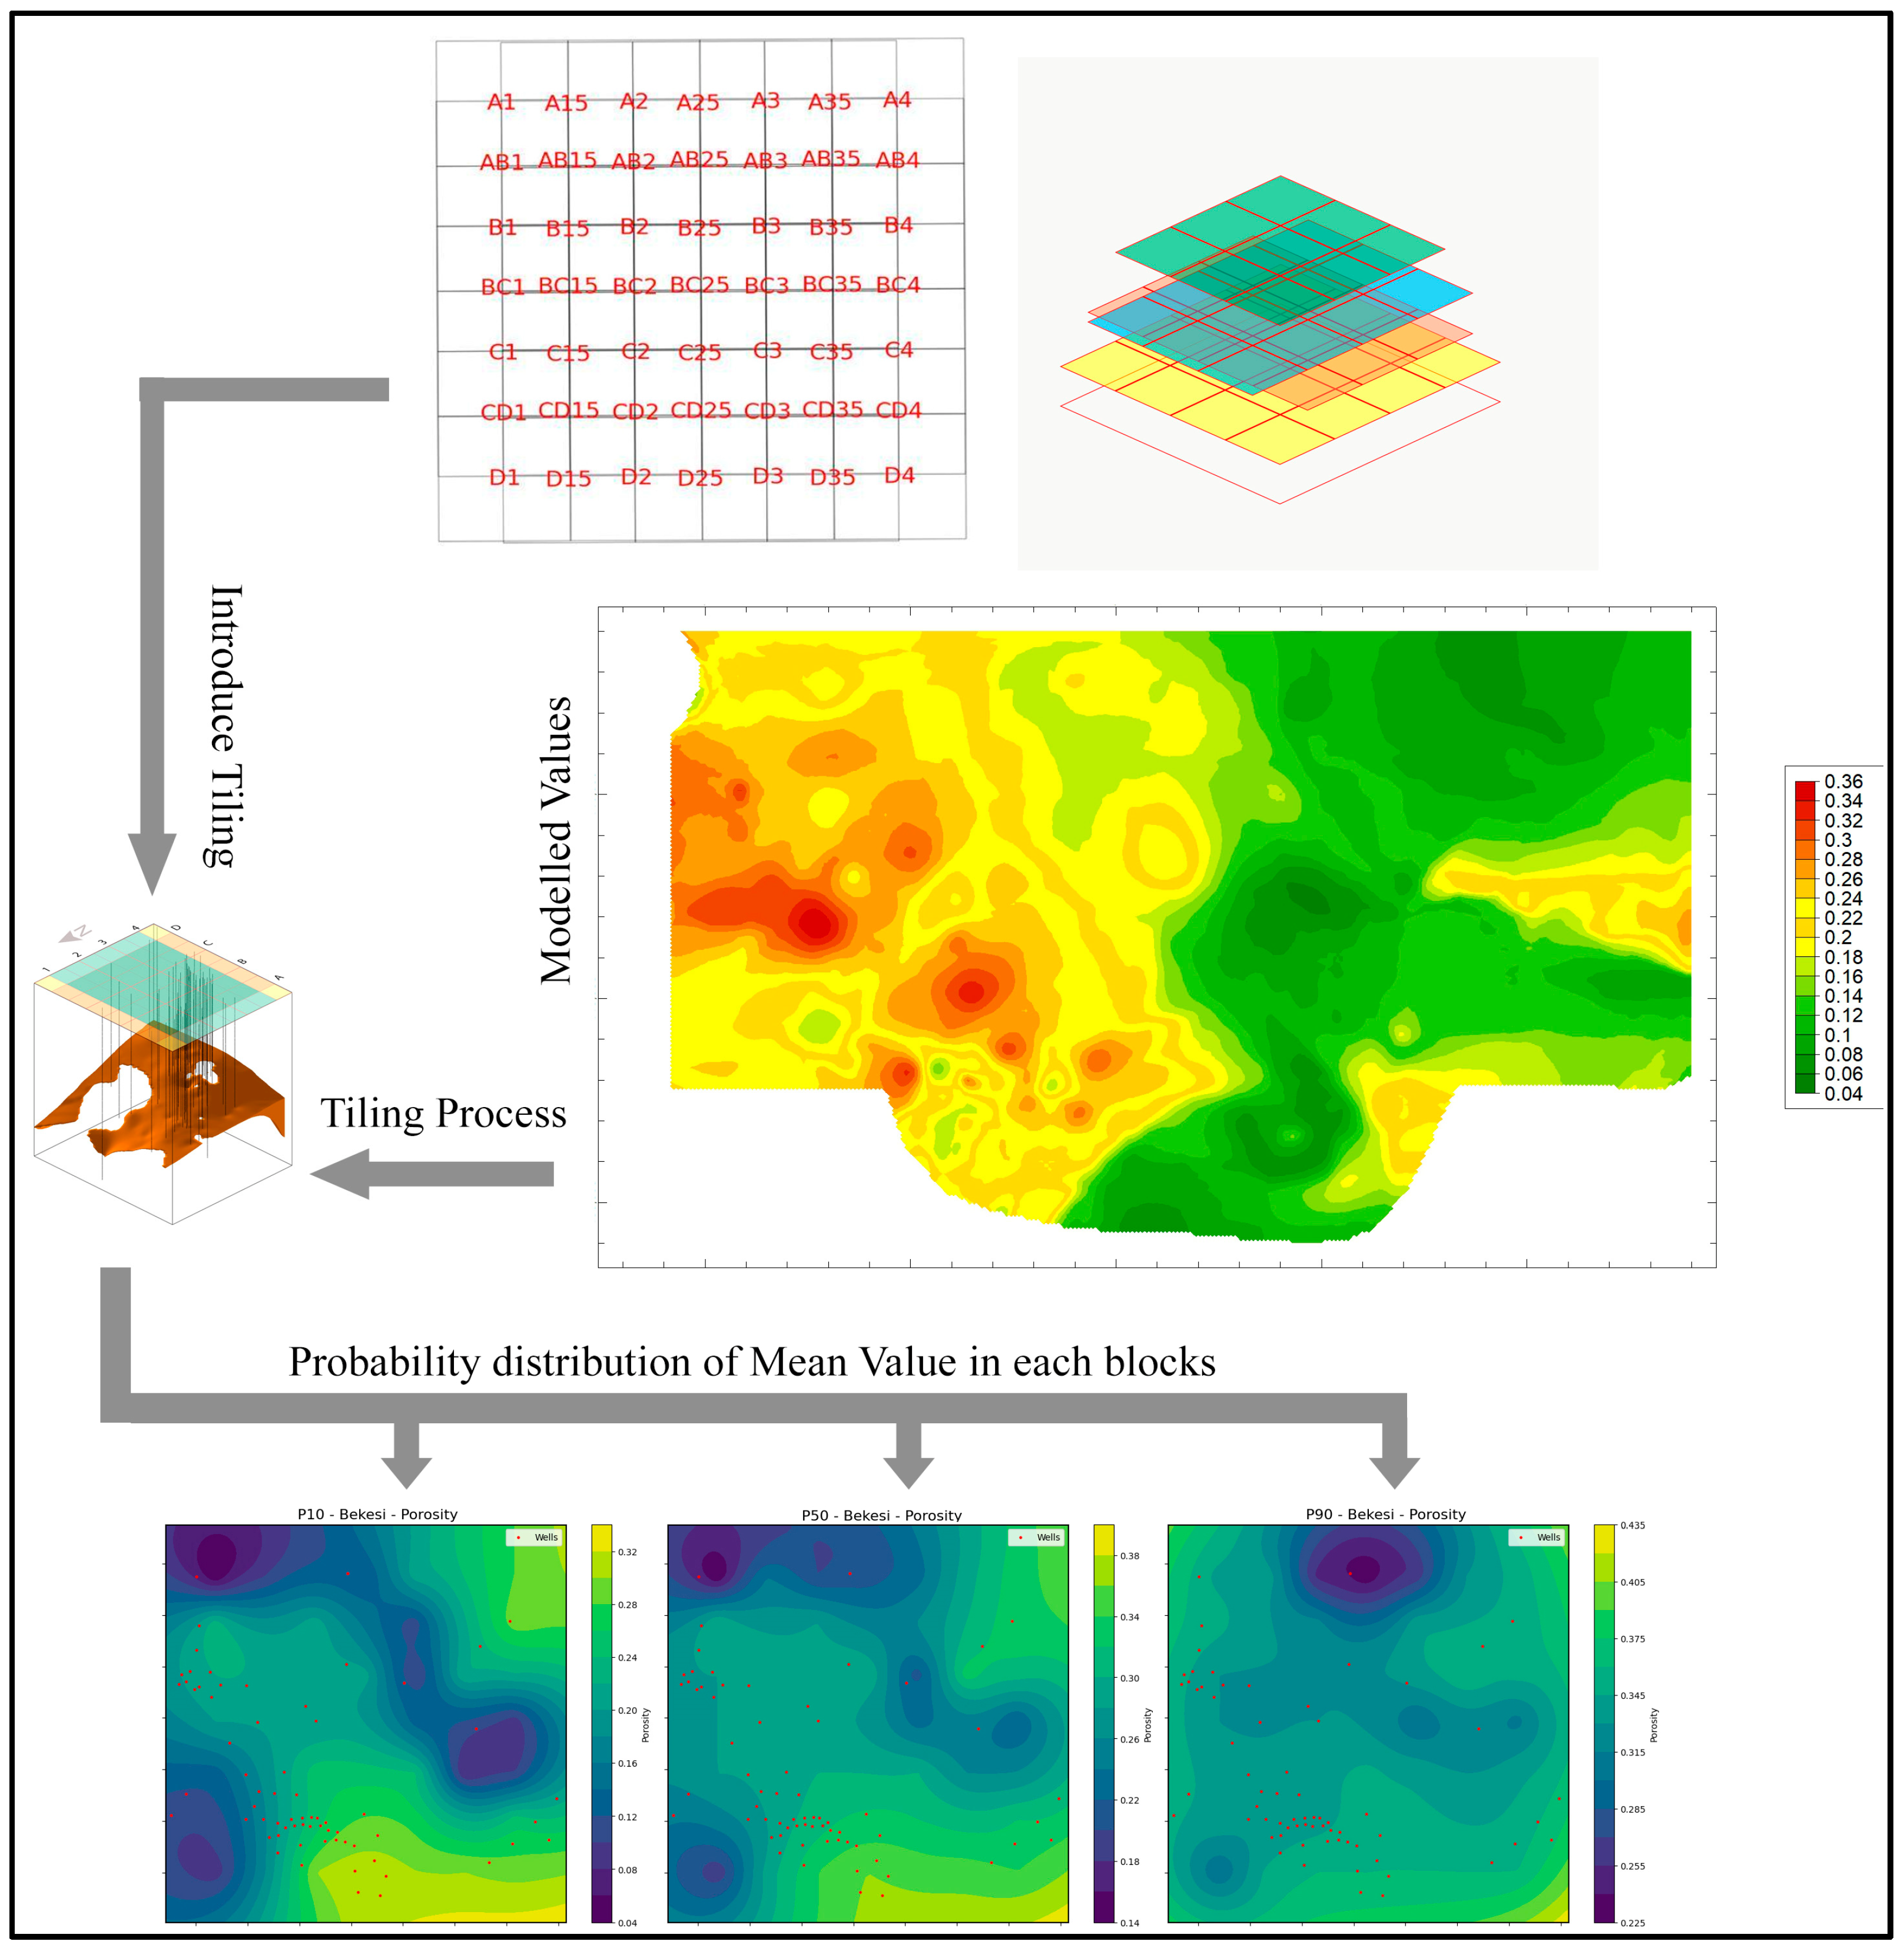
32], offering a unique lens to examine heat storage capabilities. The selection of 3.88 km as the side length for our analysis squares derives from the optimal area typically utilized for injection and production processes within such formations. Although the range for these dimensions could vary between 3 and 4 km, we chose 3.88 km to maximize coverage and efficiency across the study area. Implementing a quarter-overlapping array was used to mitigate potential spatial biases, thereby enhancing the probability of identifying the most suitable locations for our geothermal applications. This overlapping design ensures comprehensive coverage and uniformity in data analysis and is essential for accurately evaluating the site’s potential. The integration of different types of data, including core data, density logs, resistivity logs, and gamma-ray measures, was conducted through a stochastic simulation process detailed further in the Data Modeling (
Section 3.3). This integration, crucial for converting well data into a comprehensive spatial model, facilitated the mapping of average reservoir properties. We applied SGeMS for geostatistical simulation, while RockWorks was used to integrate the different simulation results obtained for gross thickness, effective porosity, and permeability. Heat capacity, thermal conductivity, and temperature were modeled using Python scripts.
The Python script utilized for further data processing employed libraries such as NumPy, pandas, and matplotlib for advanced computational tasks. This script, executed on the Google Colab platform [
33], generated cumulative histograms that enhanced our understanding of reservoir properties with significant data variability. The analysis of uncertainty must come from the geostatistical simulations. The histograms by themselves are not appropriate for this purpose. All processed data were systematically organized into Google Sheets, preparing for the MCDA.
3.3. Data Modeling
Data modeling was based on 67 wells in the study area. Porosity and permeability data predominantly came from quantitative log interpretations, but core measurements were also used to validate log data. The main purpose of the data modeling was to produce 2D stochastic models of gross thickness and 3D stochastic models of porosity, permeability, and lithology distributions for geothermal modeling. The dimensions of each 3D model were 100 × 100 × 2 m (
Figure 3).
3.3.1. Modeling of Stratigraphy
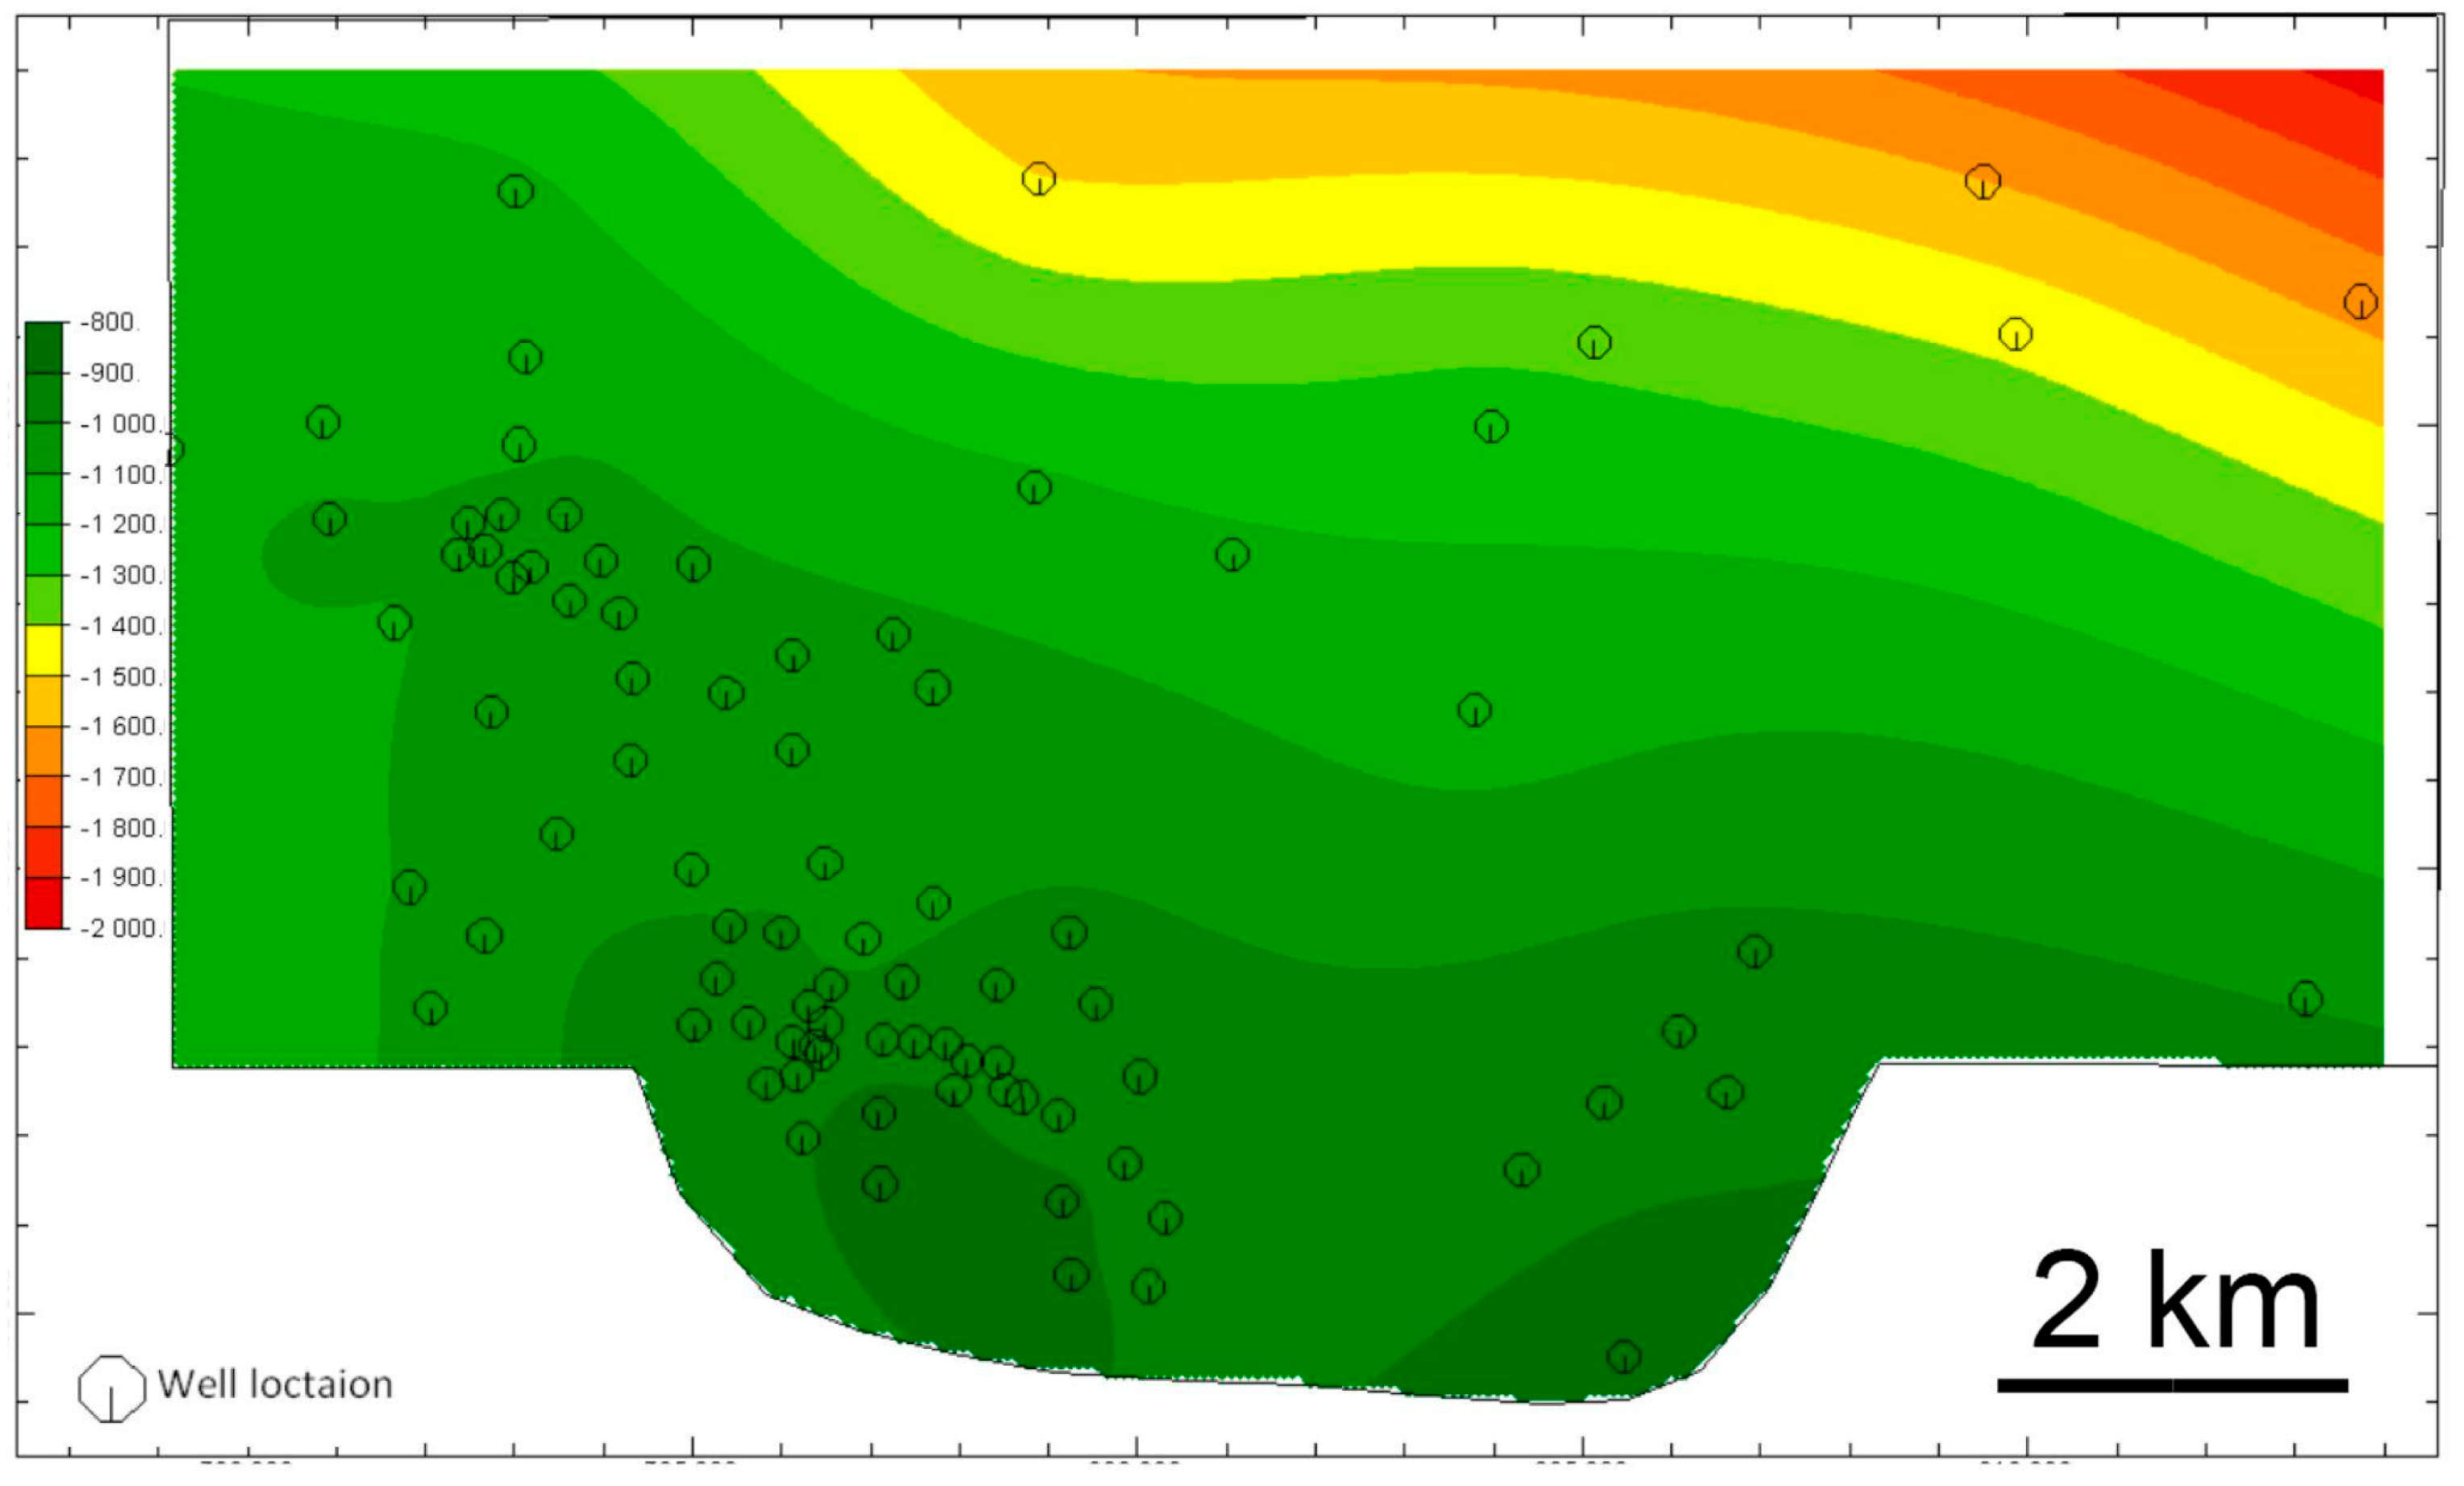
The top of the Bekes Formation show a significant north–south trend (
Figure 4). Therefore, a non-stationary geostatistical model was the most appropriate choice. The applied Universal Kriging [
34] decomposed the variable into its trend and a stationary residual. A variogram was fitted to the residuals. In this approach, the trend residuals were kriged, and the estimated residuals were added to the trend model.
The thickness data were transformed into normal space; then, declustering weights were applied to obtain a representative probability distribution. Finally, the declustered normal values were extended into the plan using a Sequential Gaussian Simulation [
35,
36]. We generated 100 independent and equally probable stochastic realizations from which the following grids were calculated: (1) an E-type grid showing the most probable lateral thickness distribution; (2) a grid of the coefficient of variation calculated at each grid point from the simulated 100 values to show the uncertainty of the model; and (3) three quantile grids showing the P10, P50, and P90 quantiles at each grid point (
Figure 5).
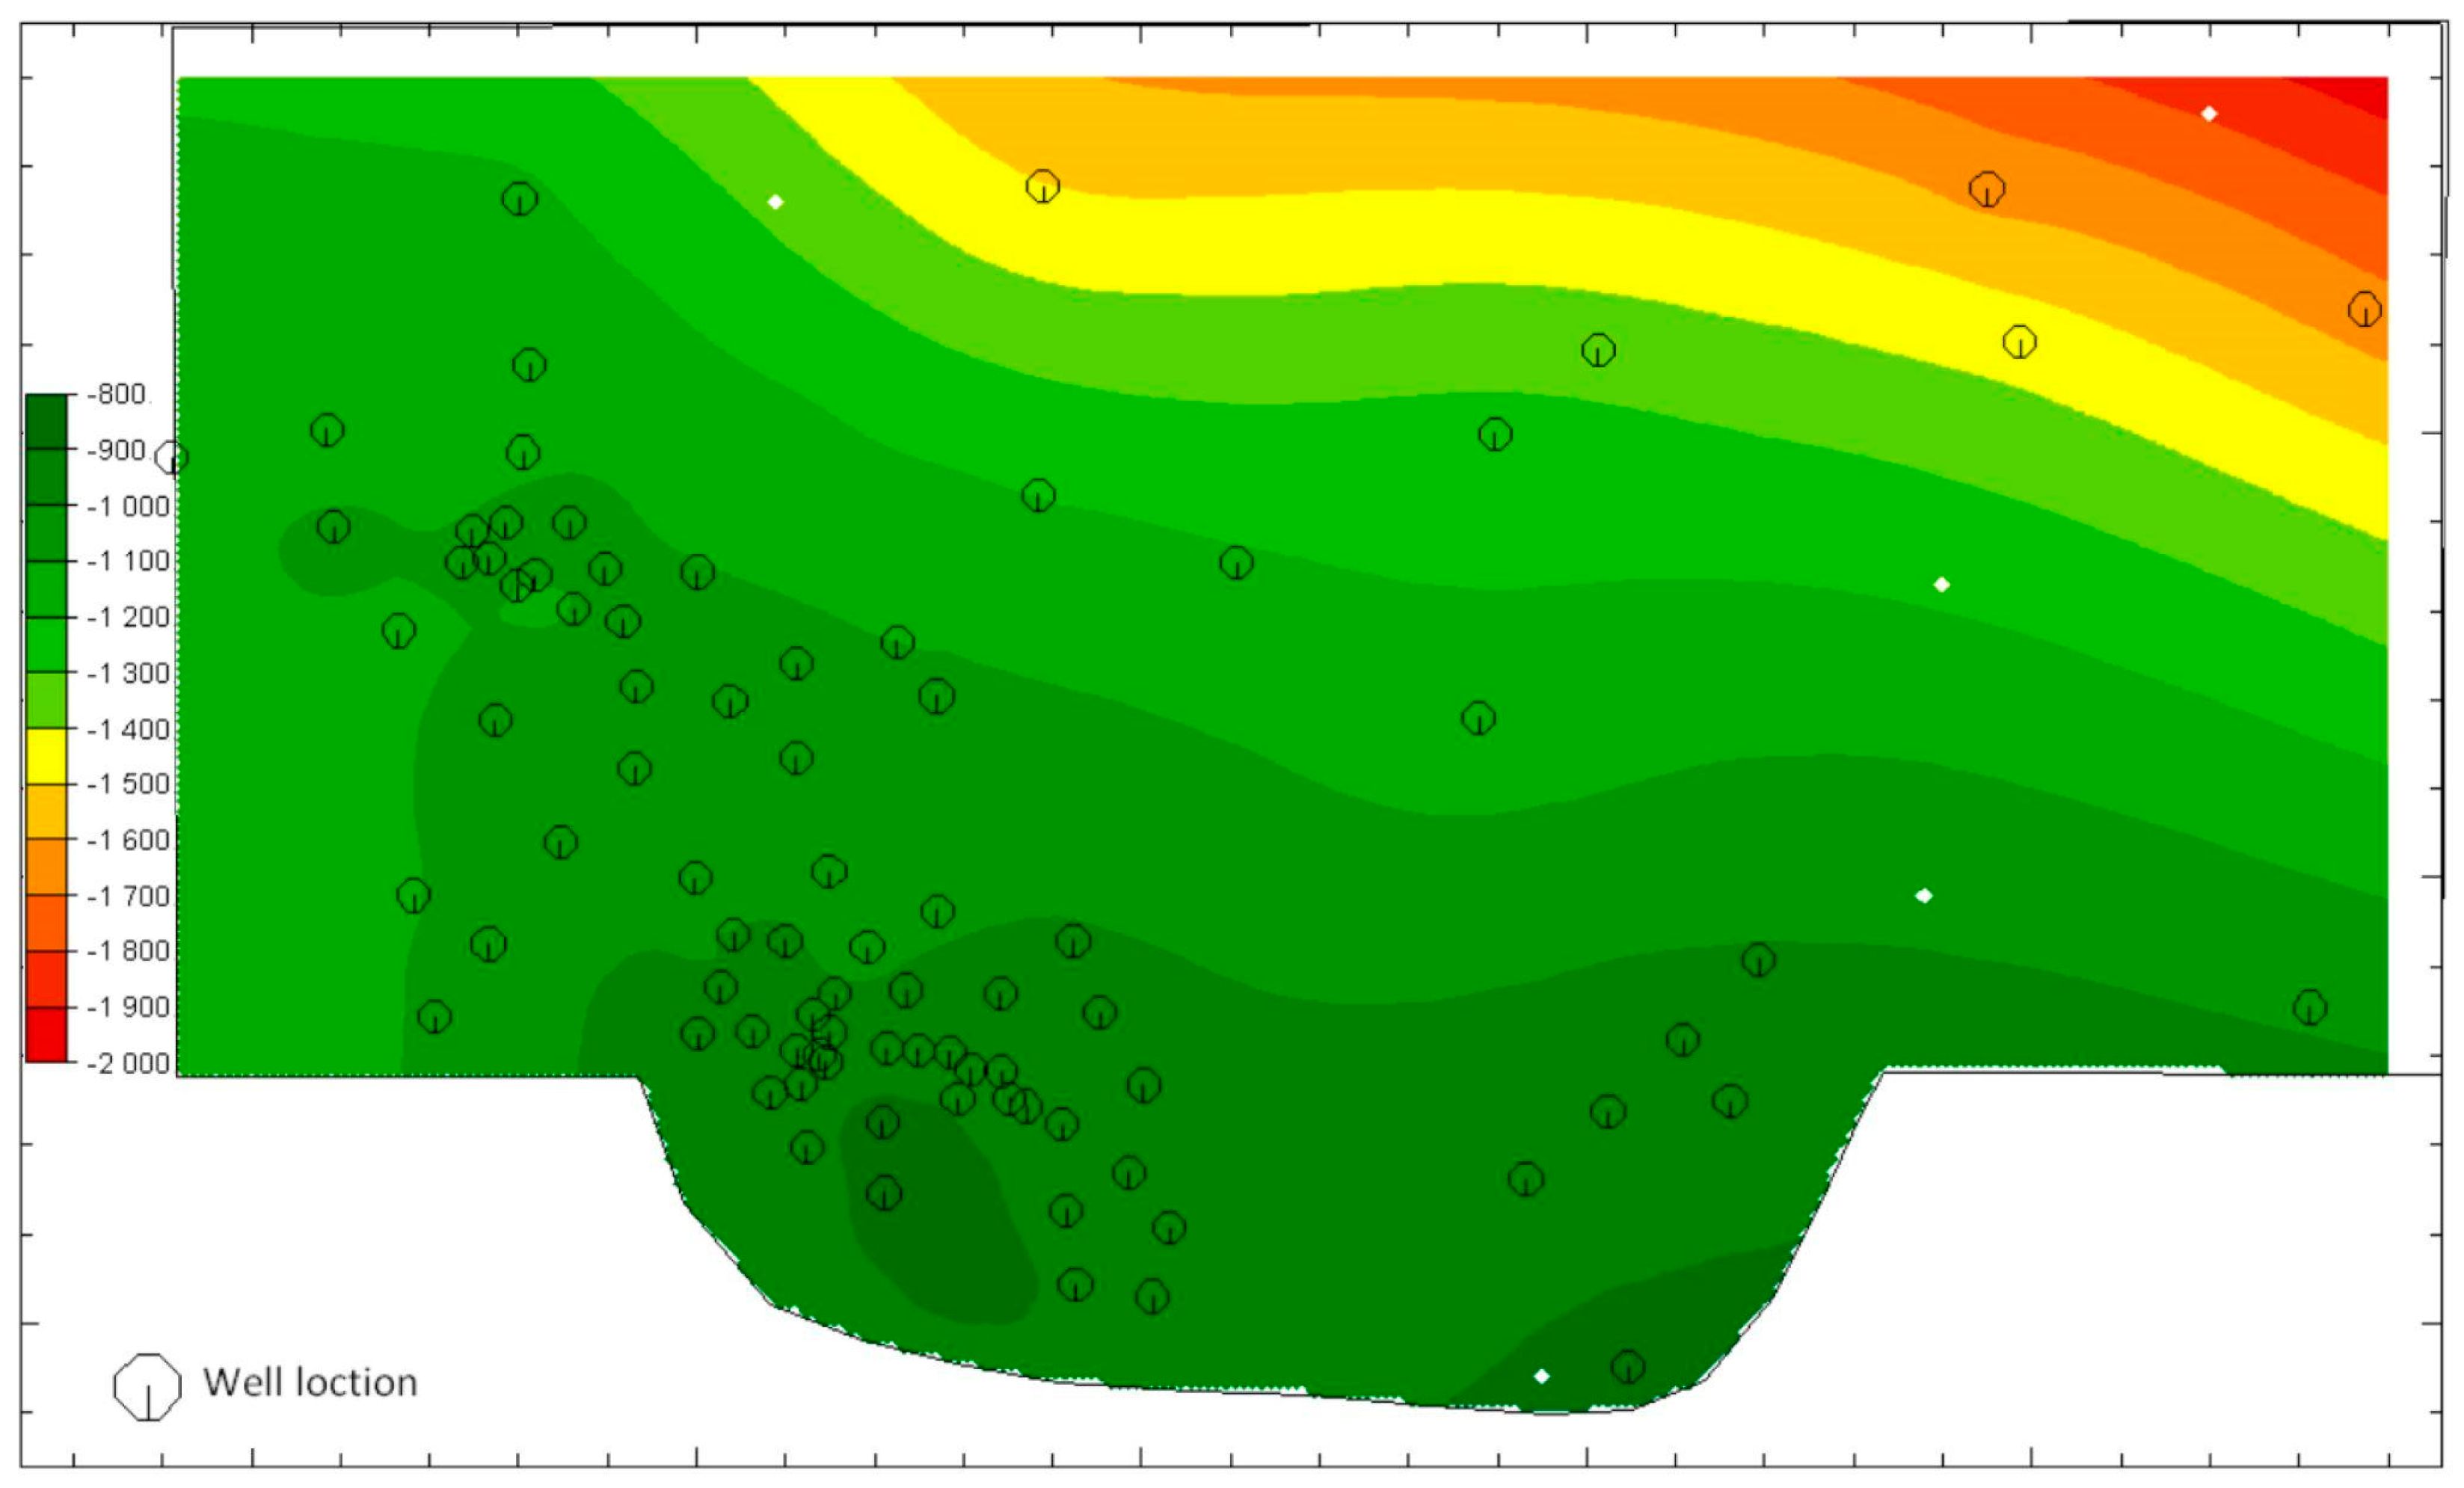
The base of the formation was estimated by subtracting the E-type thickness grid from the previously estimated top grid (
Figure 6).
3.3.2. Modeling Porosity and Permeability
During the exploratory analysis phase, we decided to transform all log-derived porosity and permeability data to the scale of the core measurements. We applied a q-q transformation [
36] of the log scale porosity and permeability distributions to the core scale distributions. To simulate the 3D spatial distributions of these two variables, the SGS approach was applied to the datasets transformed into normal space using 3D declustering weights.
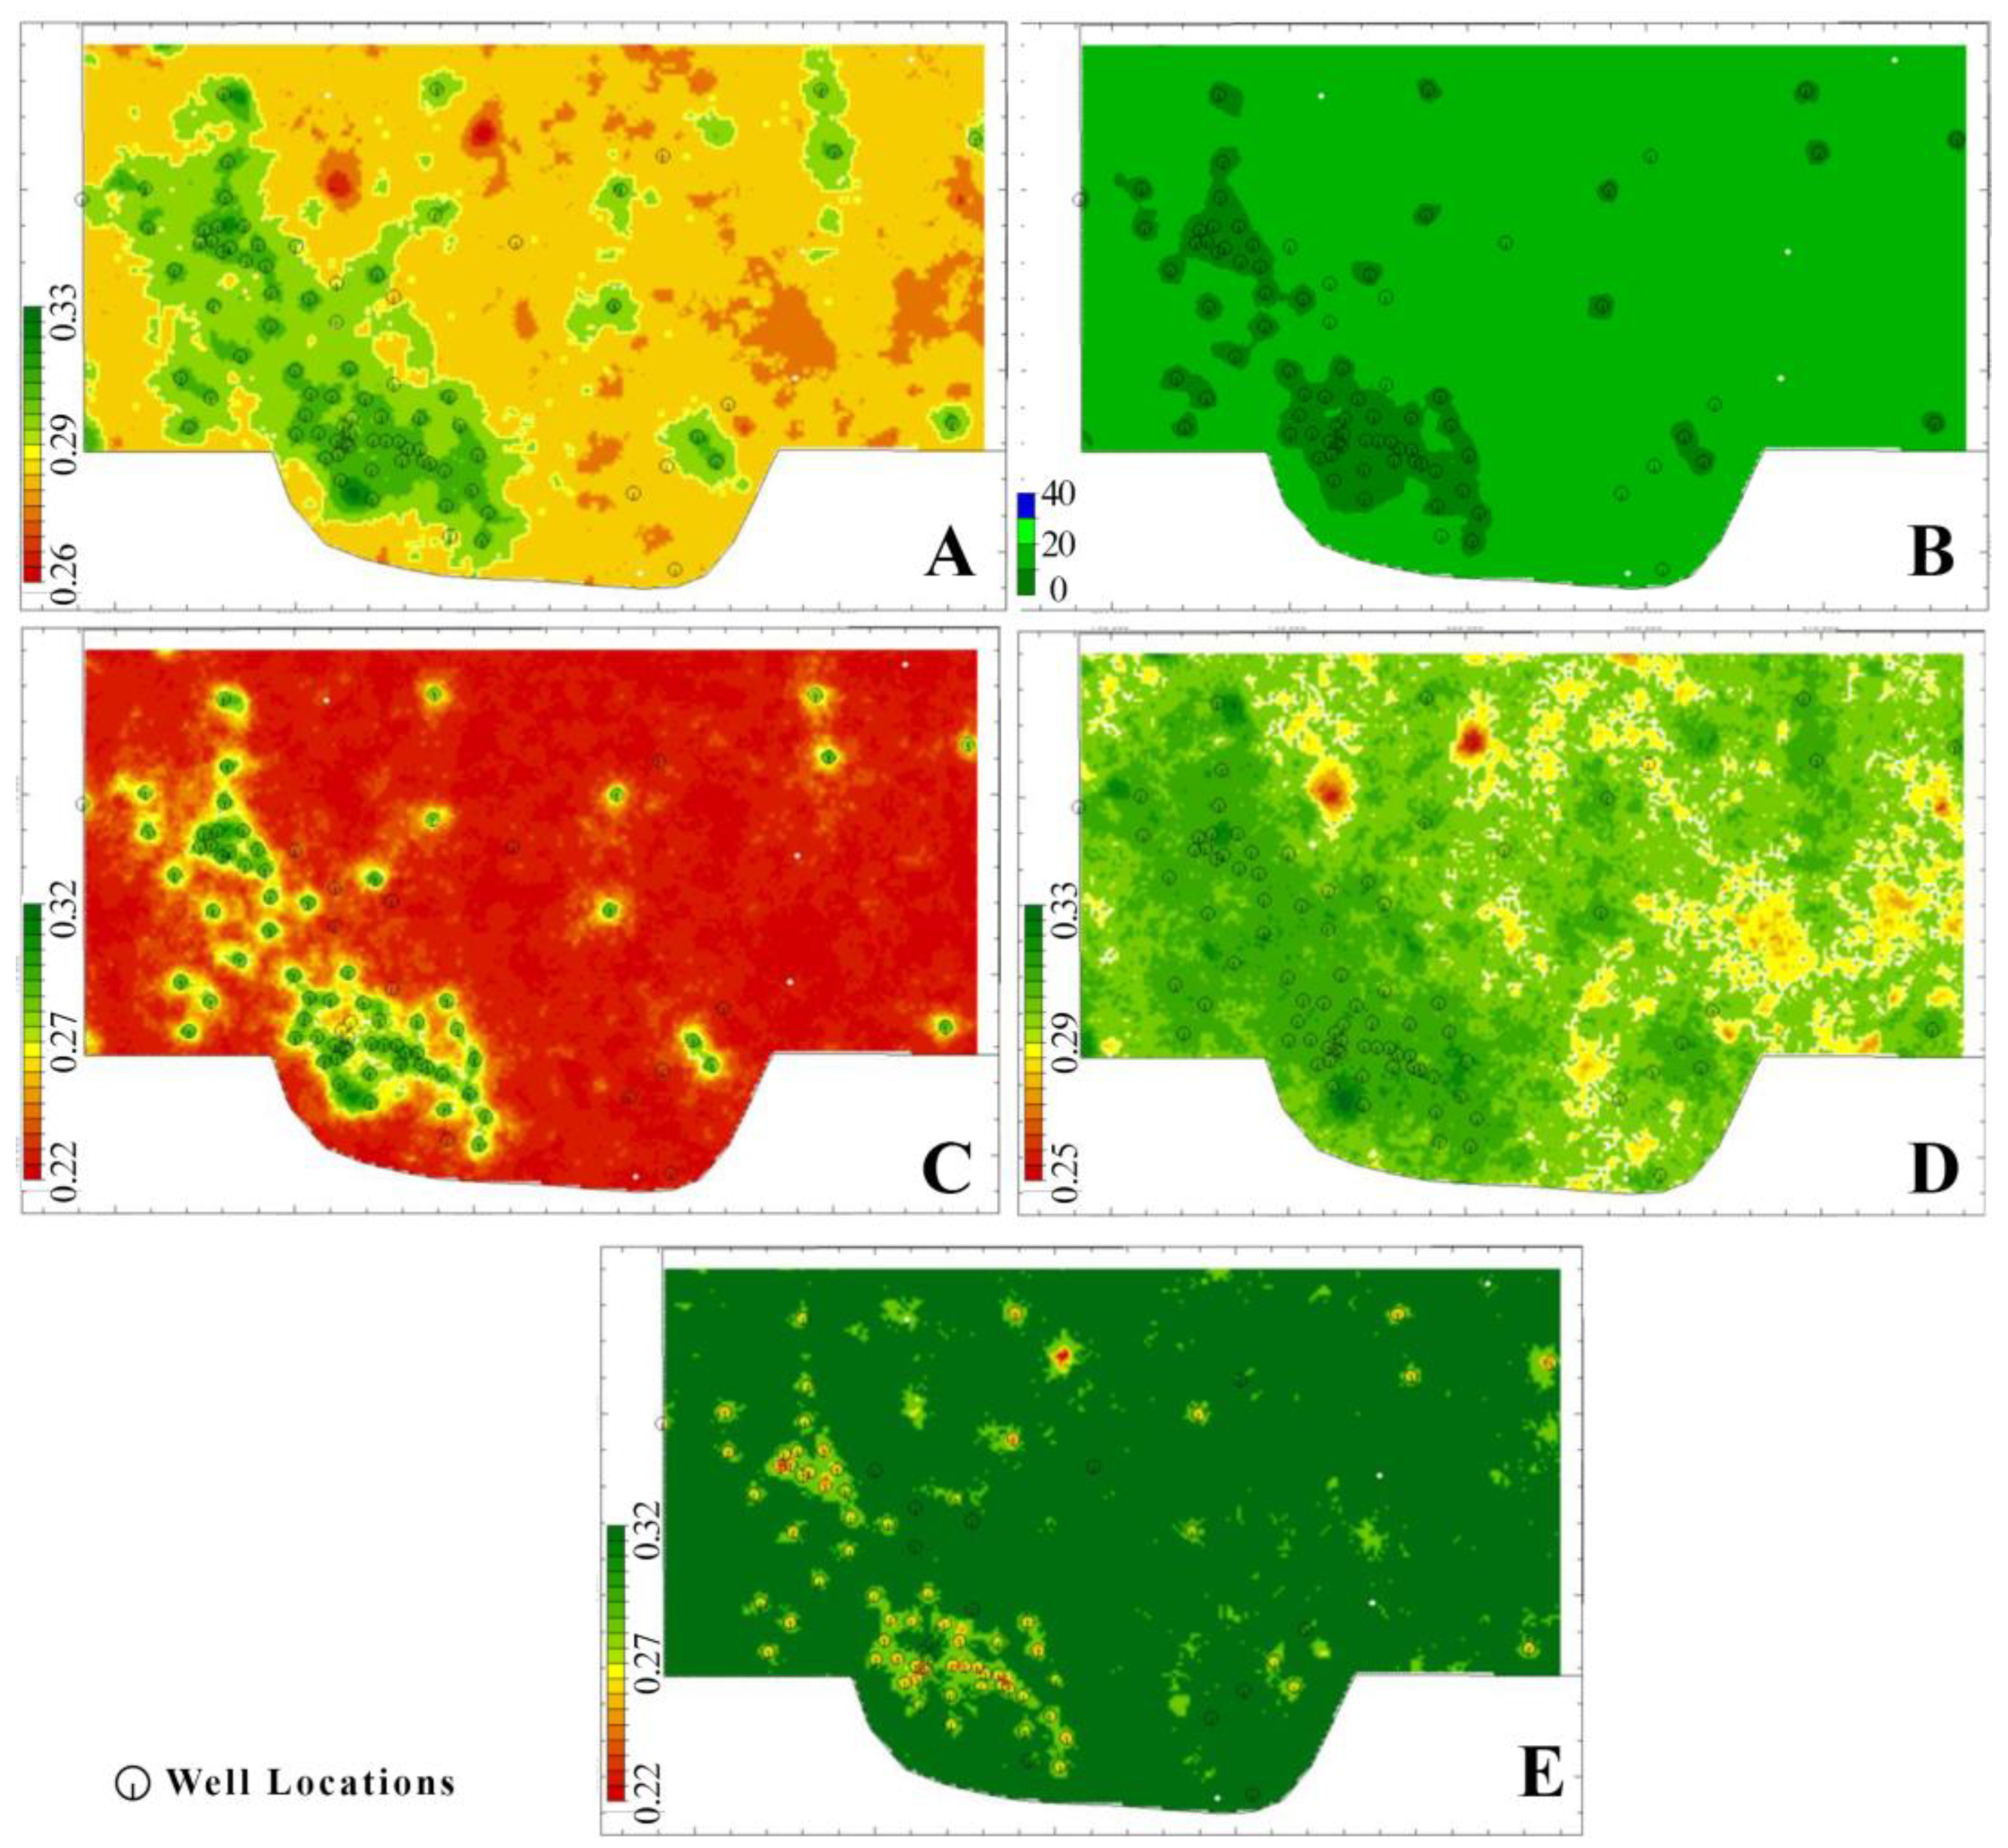
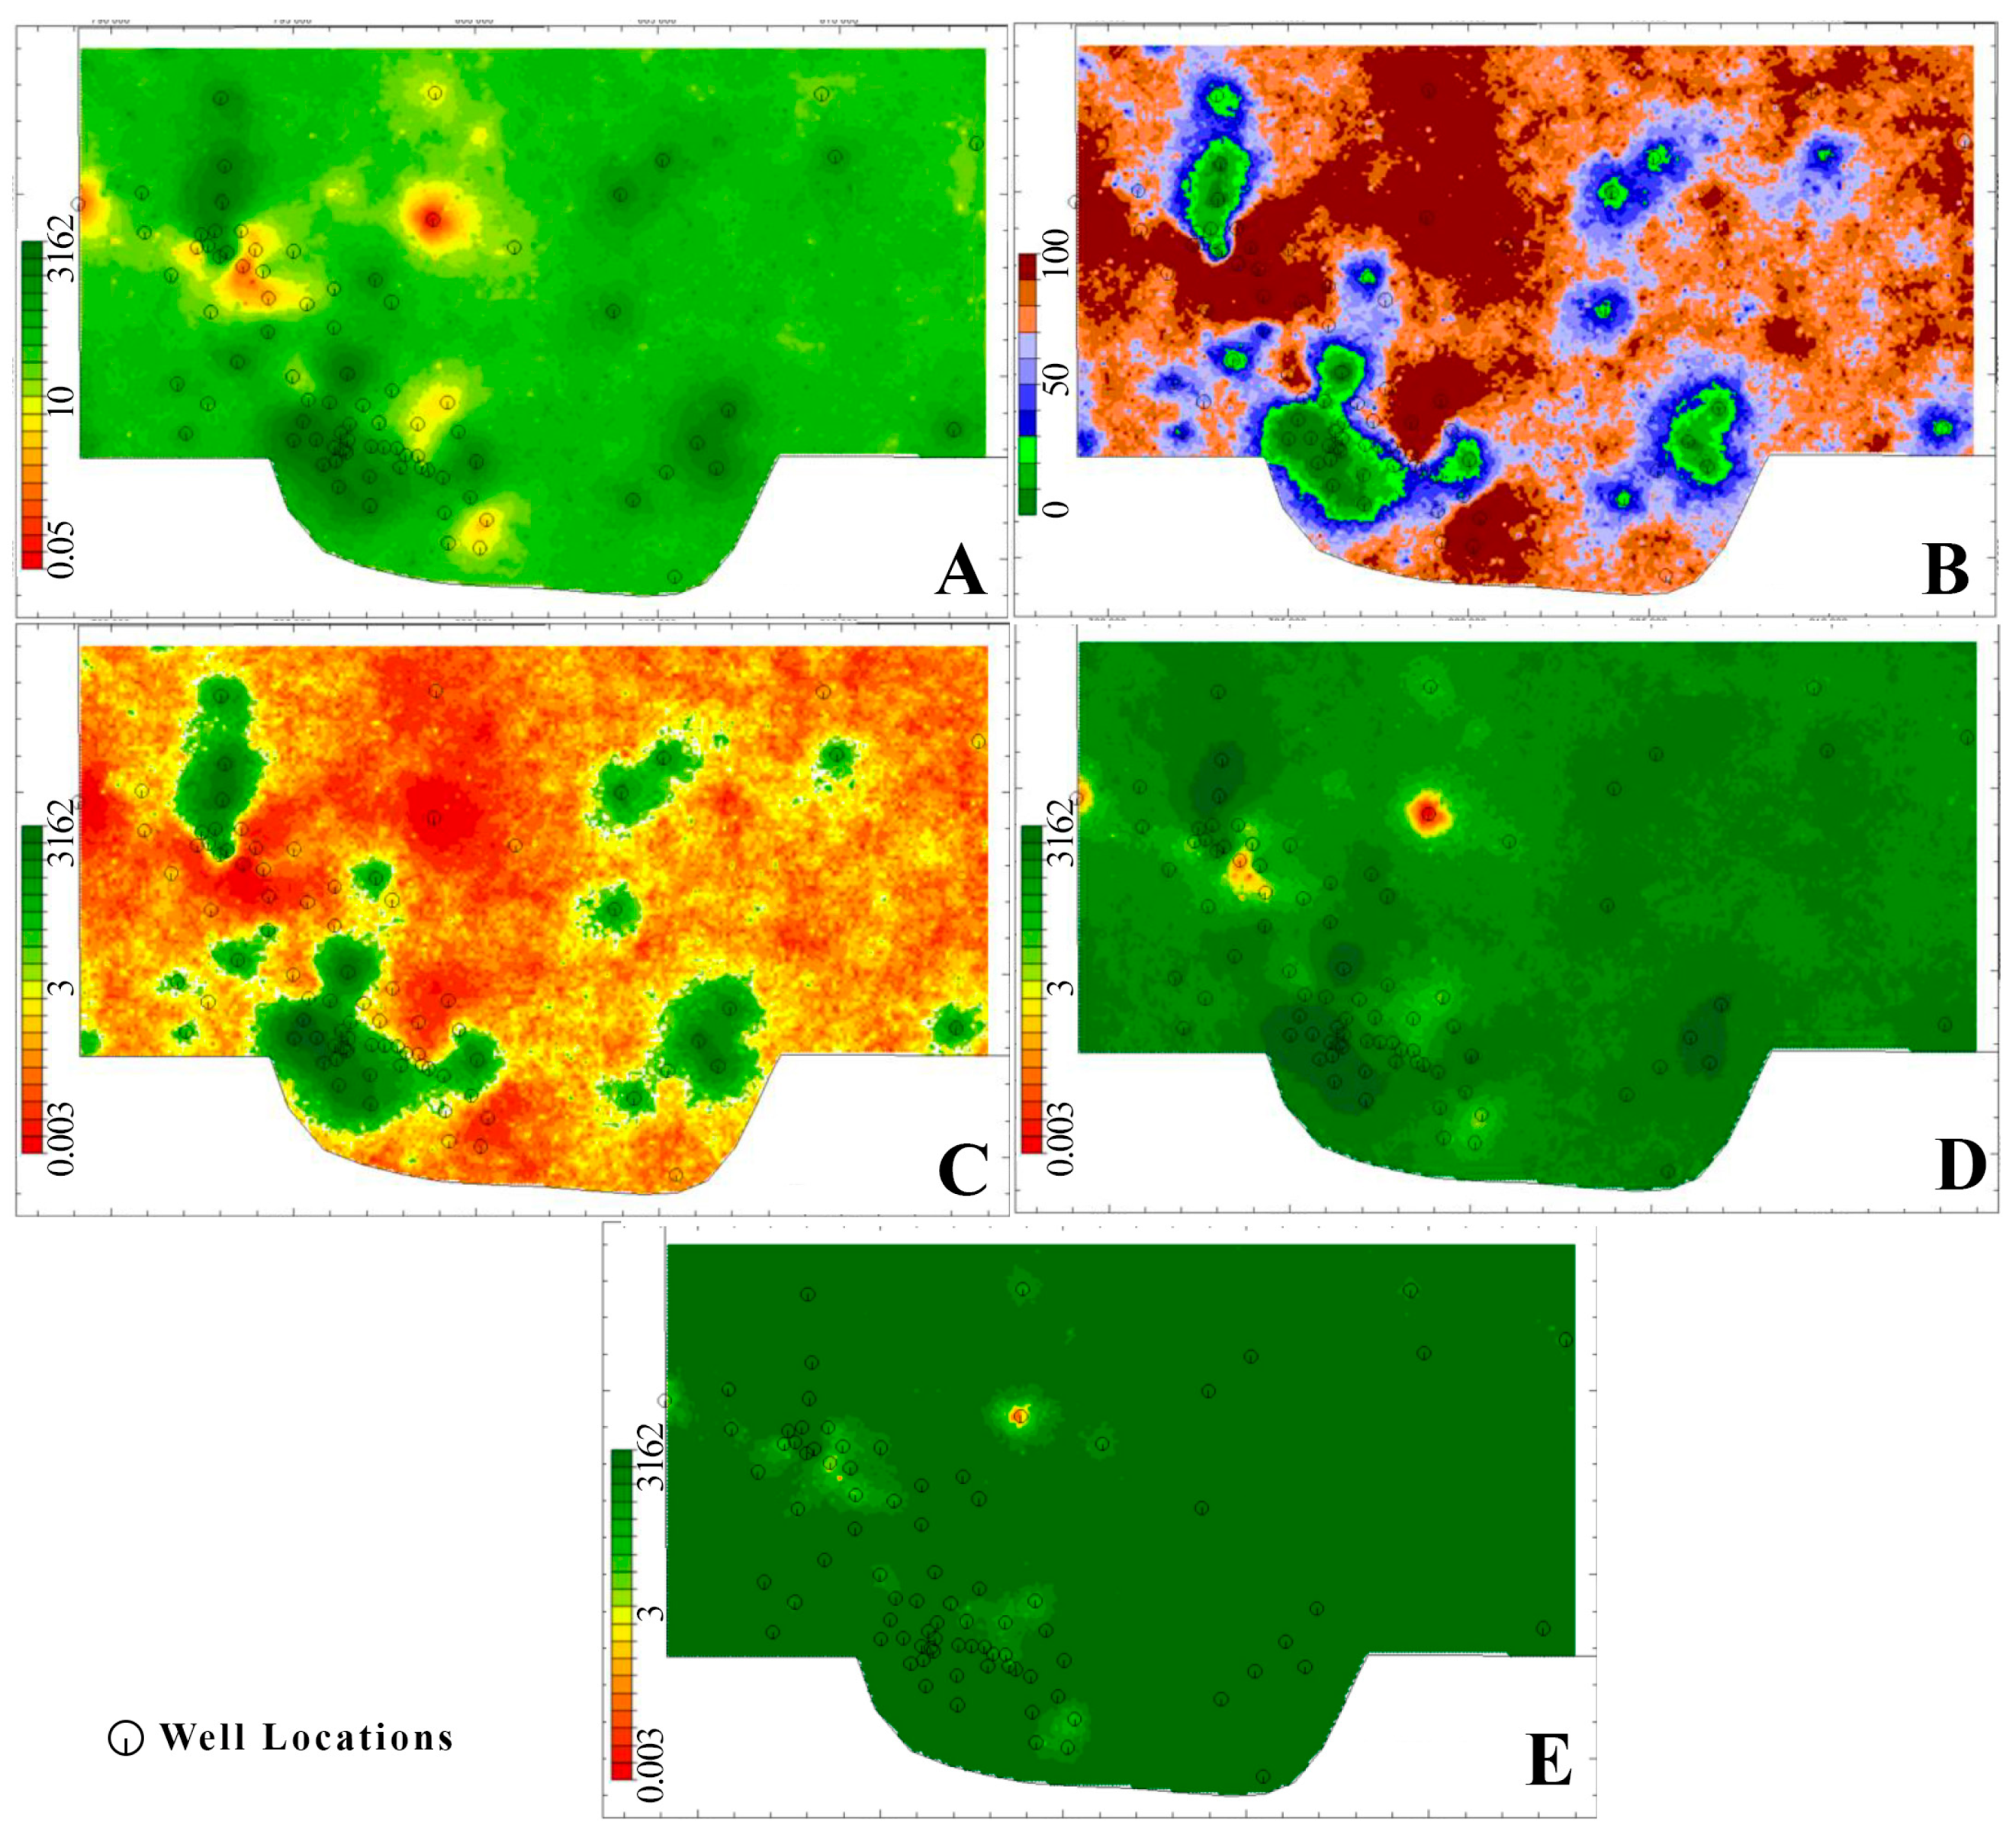
Again, 100 independent equally likely 3D realizations were generated, from which the 3D distribution of the P10, P50, and P90 quantiles was calculated in addition to the 3D array of expectation and the coefficient of variation. The means of these 3D models per grid column were fitted to a 2D grid system (
Figure 7 and
Figure 8).
3.3.3. Lithology Model
The lithology model of the study area was created using the 3D gamma model. In this approach, we first defined the electro-lithologies using the gamma log in the available boreholes. The next step was to build a 3D gamma model. Finally, we transformed the voxel values of the 3D gamma model into electro-lithology types using the minimum and maximum gamma values of the previously defined electro-lithologies.
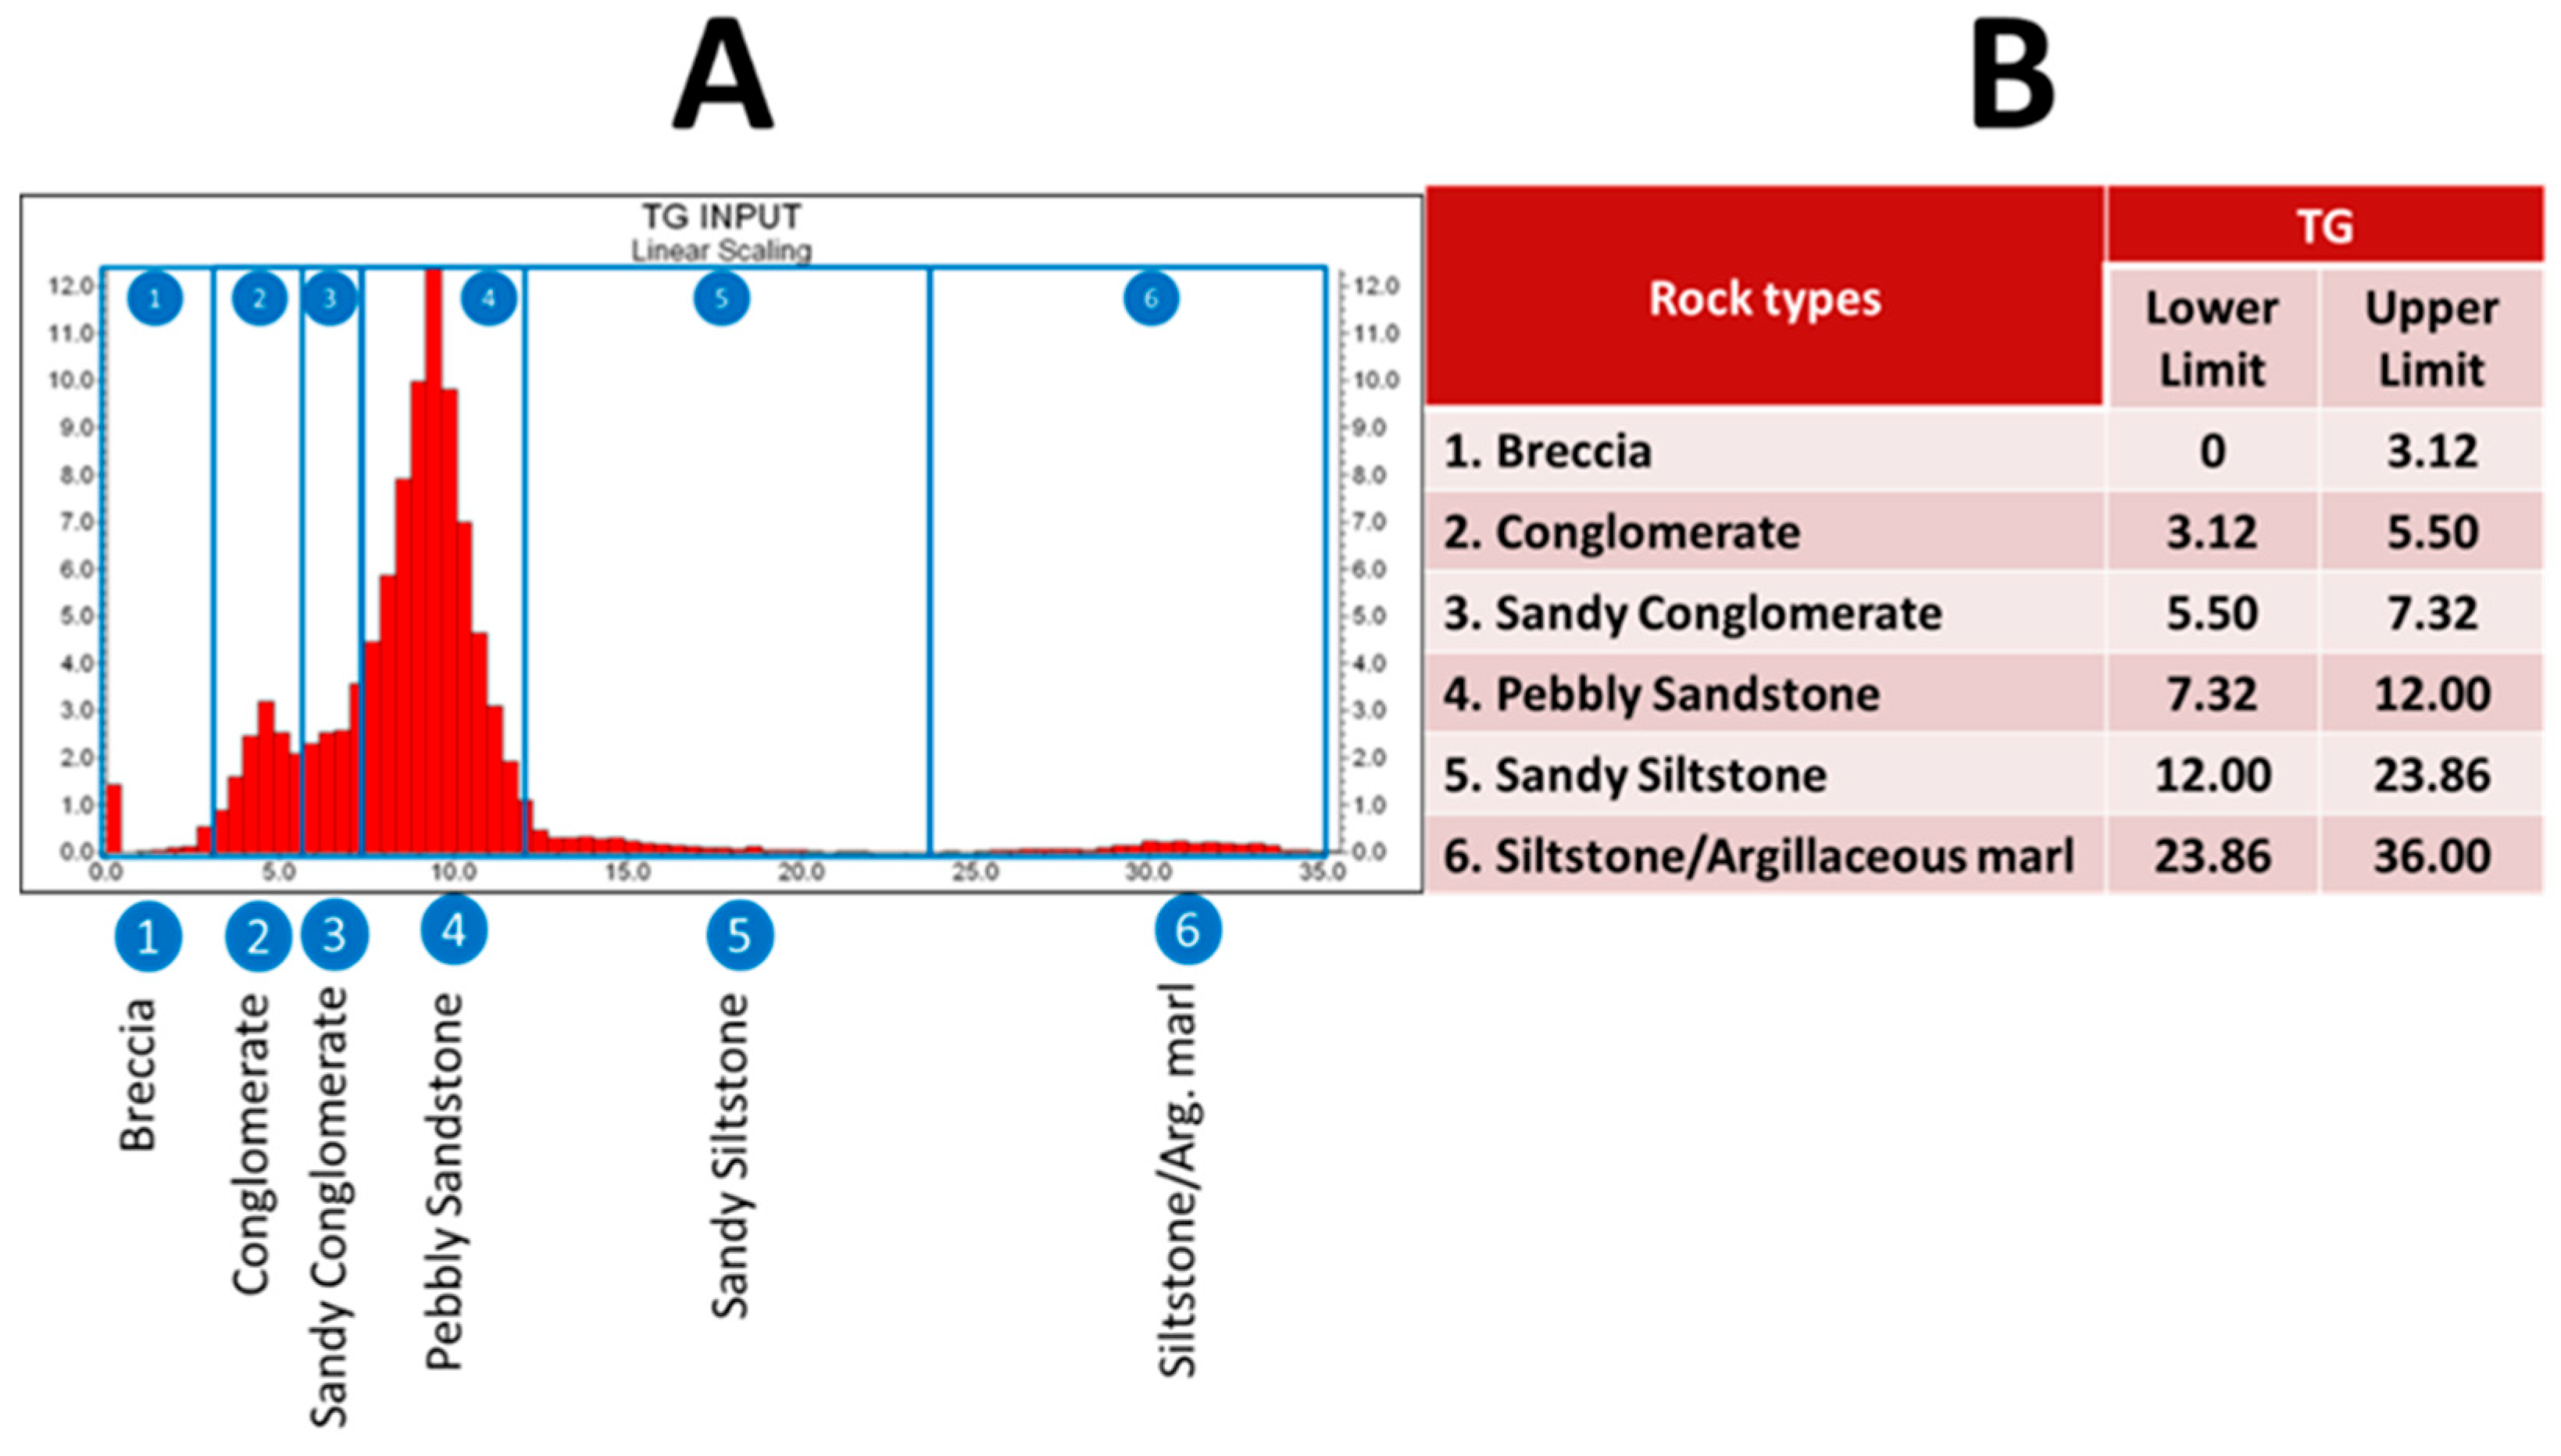
There were 28 boreholes from which gamma logs were available. At the EDA phase of the gamma data analysis, the main purpose was to identify some electro-lithological types based on the gamma values. We used EM clustering [
37] to segment the original histogram of gamma values into different groups. We were then able to compare the EM clusters to the real (geological) rock types of the borehole columns by regressing the gamma values of each cluster to the real stratigraphic positions. These comparisons calculated for different numbers of clusters were used to identify the optimal number of groups in the EM clustering. As a result, we defined six electro-lithological types (
Figure 9).
To increase the stability of the 3D estimation of the gamma values, we added 12 virtual (auxiliary) locations to the 3D input. First, we generated an initial very coarse 3D gamma model with a resolution of 500 × 500 × 2 m using a simple inverse distance estimation with a high-fidelity constraint. From this model, we back-estimated the gamma values to each vertical voxel of the 12 auxiliary wells and added these back-estimated values to the original 3D gamma input set. This extended input set generated the final high-resolution 3D gamma model (
Figure 10A). The corresponding 3D lithology model (
Figure 10B) was obtained by converting the voxel values of the 3D gamma model into electro-lithological categories using the minimum and maximum gamma values of the EM clusters (
Figure 9B).
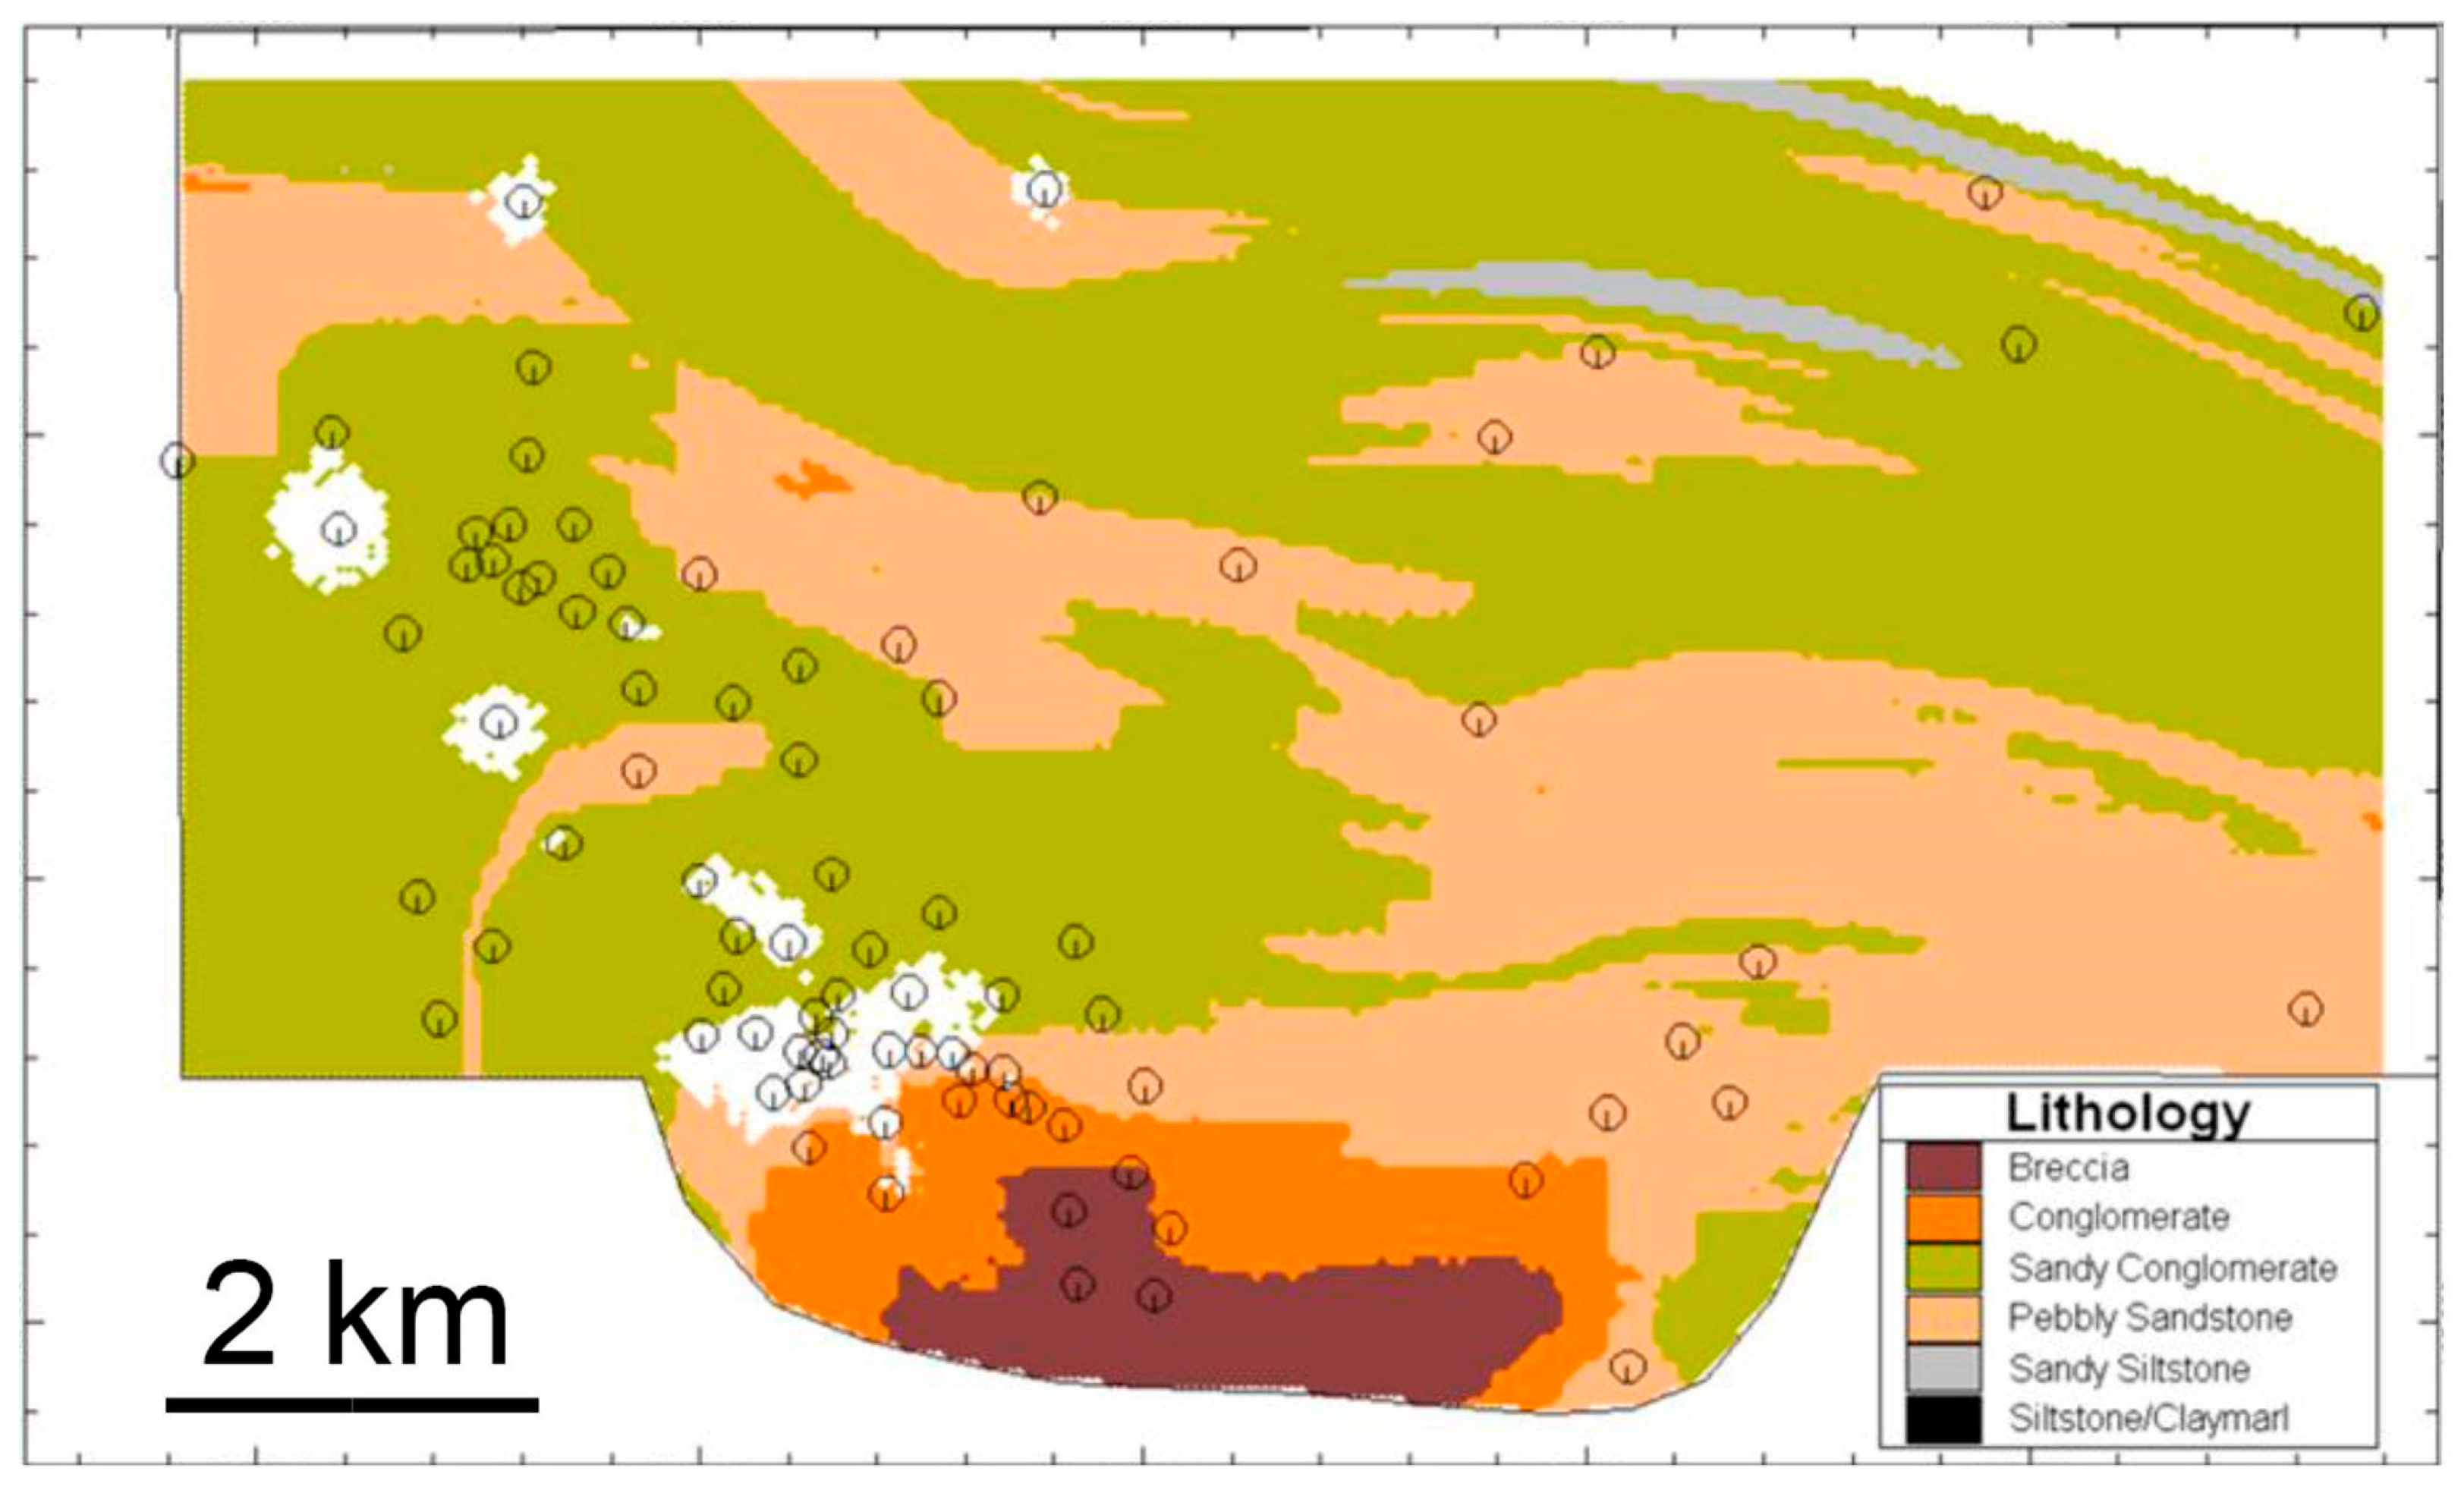
Figure 11 shows the 2D map of the most frequent electro-lithological category in the voxel columns of the 3D electro-lithological model (
Figure 10B).
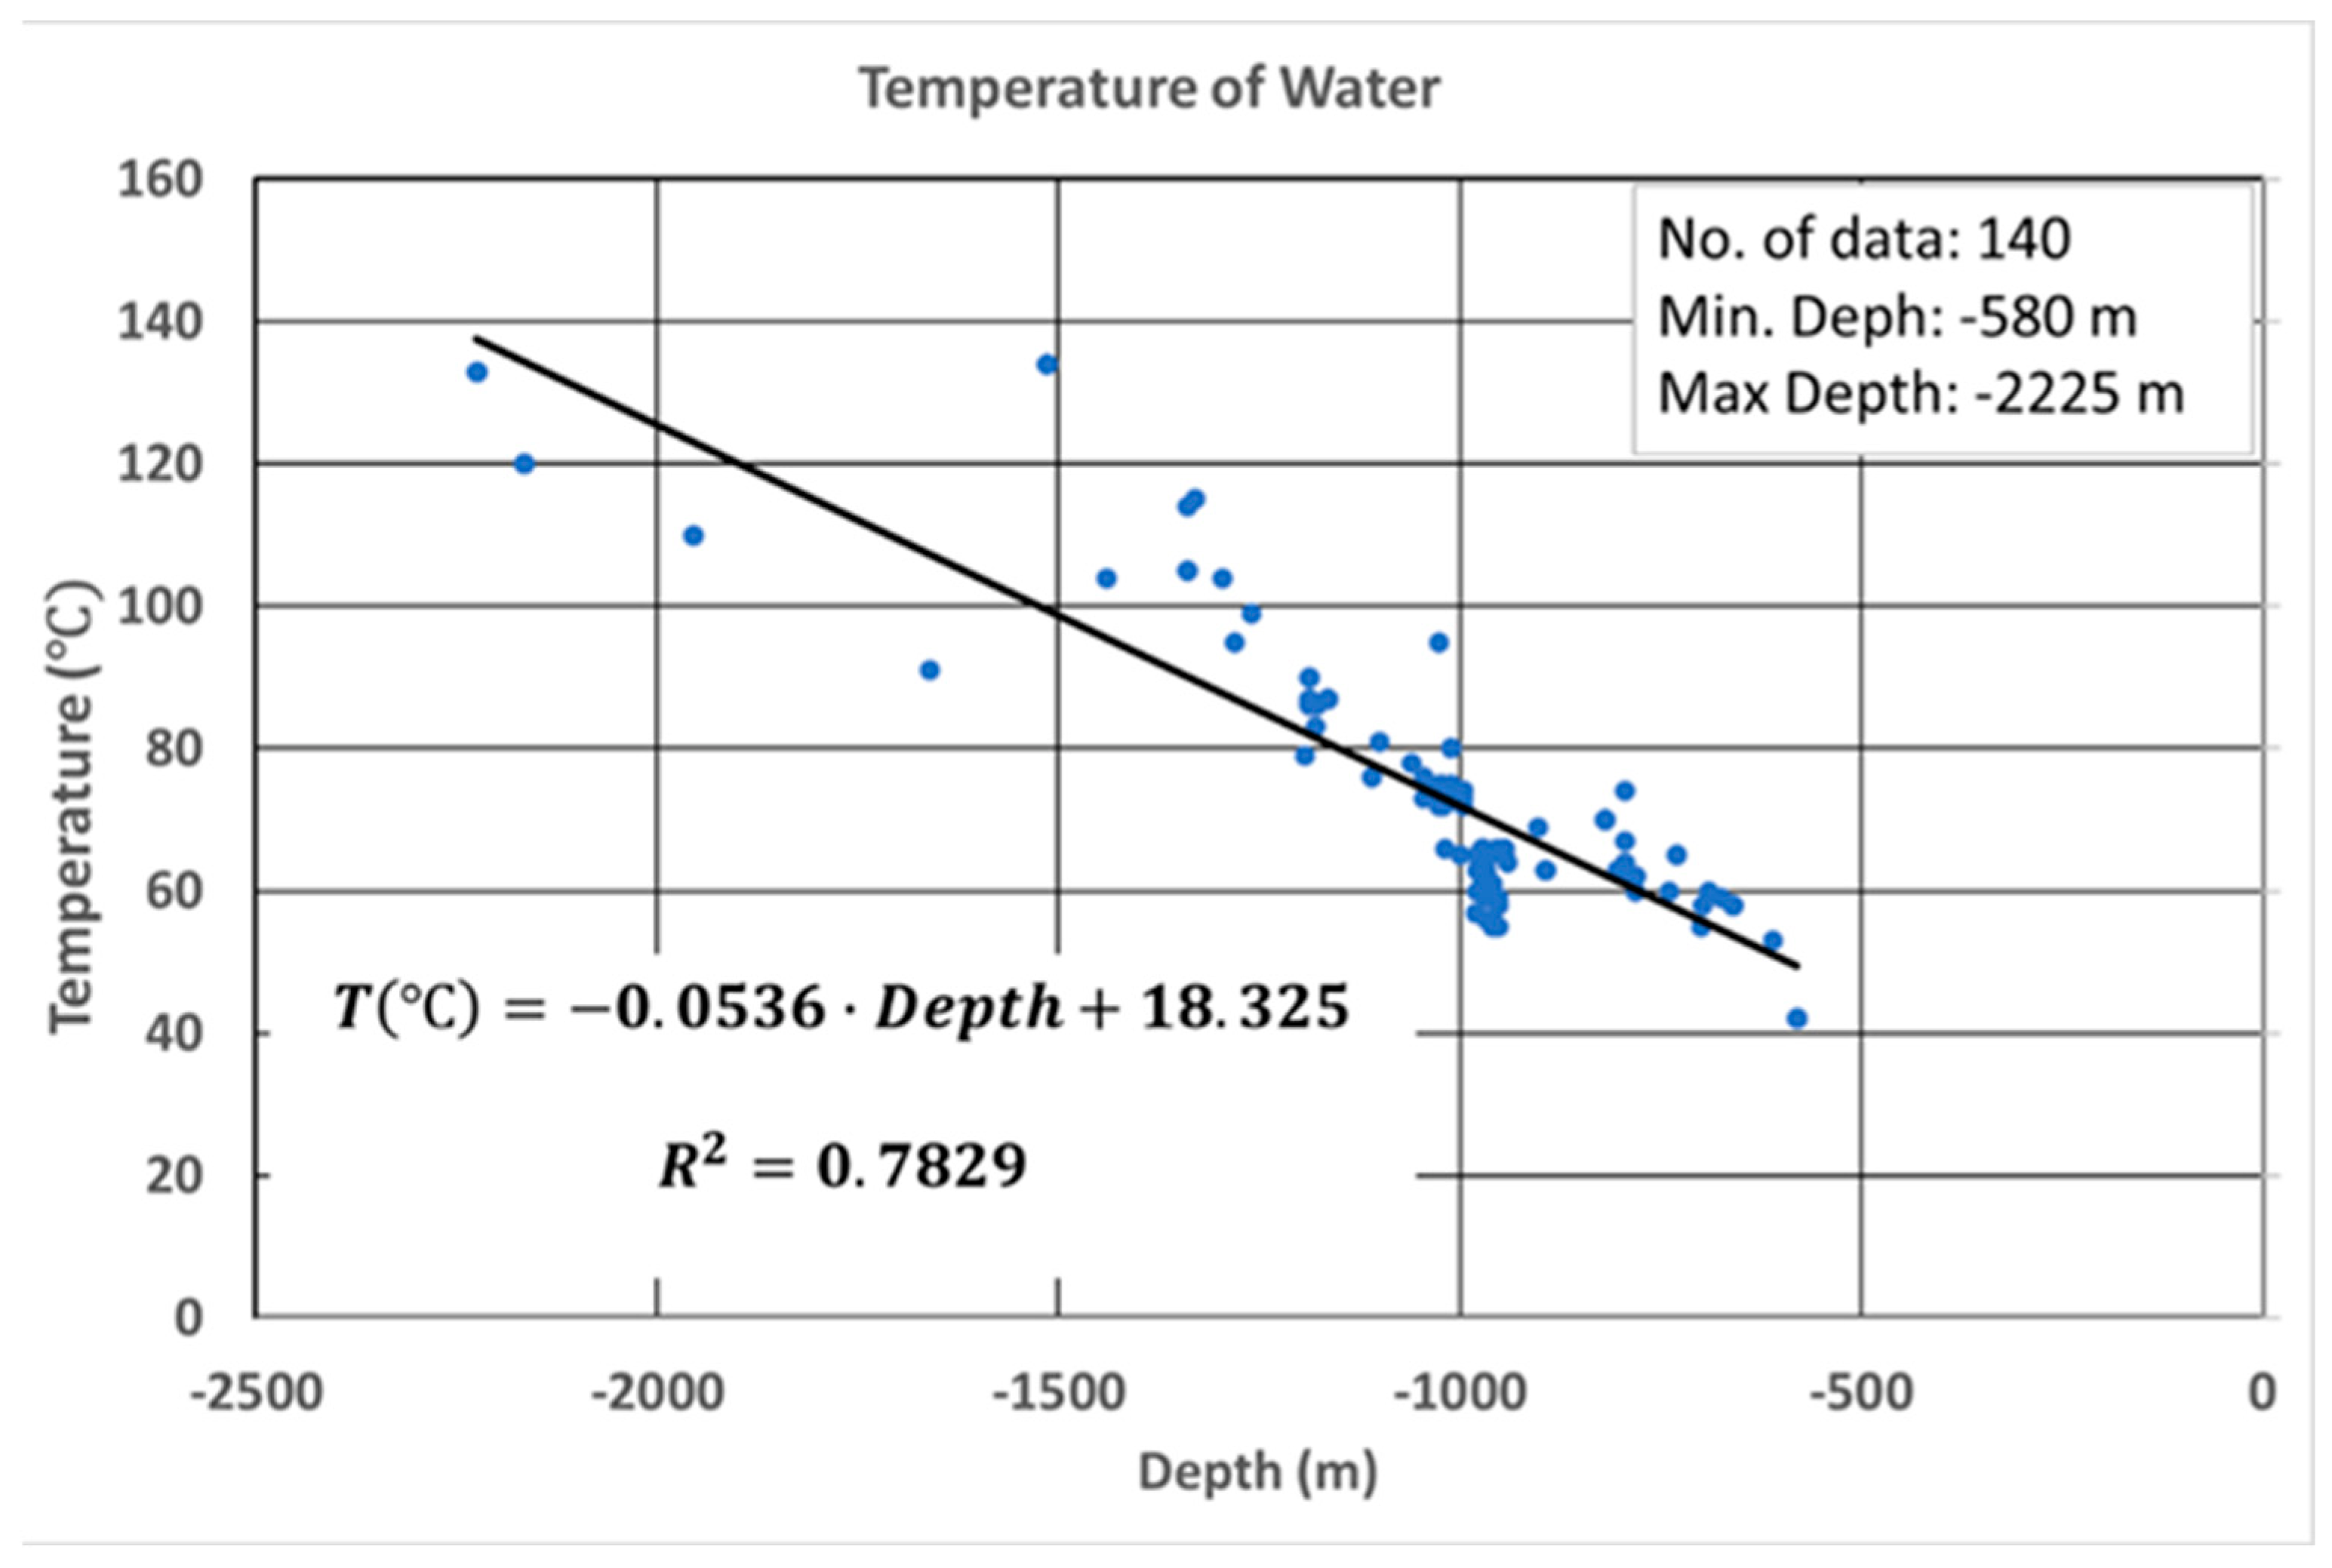
The temperature parameter was modeled using data from drilling steam tests and bottom-hole temperatures from the MOL database. There was an acceptable strong linear regression describing the temperature change with increasing depth (
Figure 12).
Figure 12.
This figure shows the applied linear regression describing the change in temperature with increasing depth. This regression was applied to both the top and bottom grid to obtain the temperature distribution at the top and bottom of the Bekes Formation (
Figure 13A,B).
Figure 12.
This figure shows the applied linear regression describing the change in temperature with increasing depth. This regression was applied to both the top and bottom grid to obtain the temperature distribution at the top and bottom of the Bekes Formation (
Figure 13A,B).
Figure 13.
Maps of the temperature distributions [°C] at the top (A) and base (B) of the Bekes Formation.
Figure 13.
Maps of the temperature distributions [°C] at the top (A) and base (B) of the Bekes Formation.
3.3.4. Heat Capacity
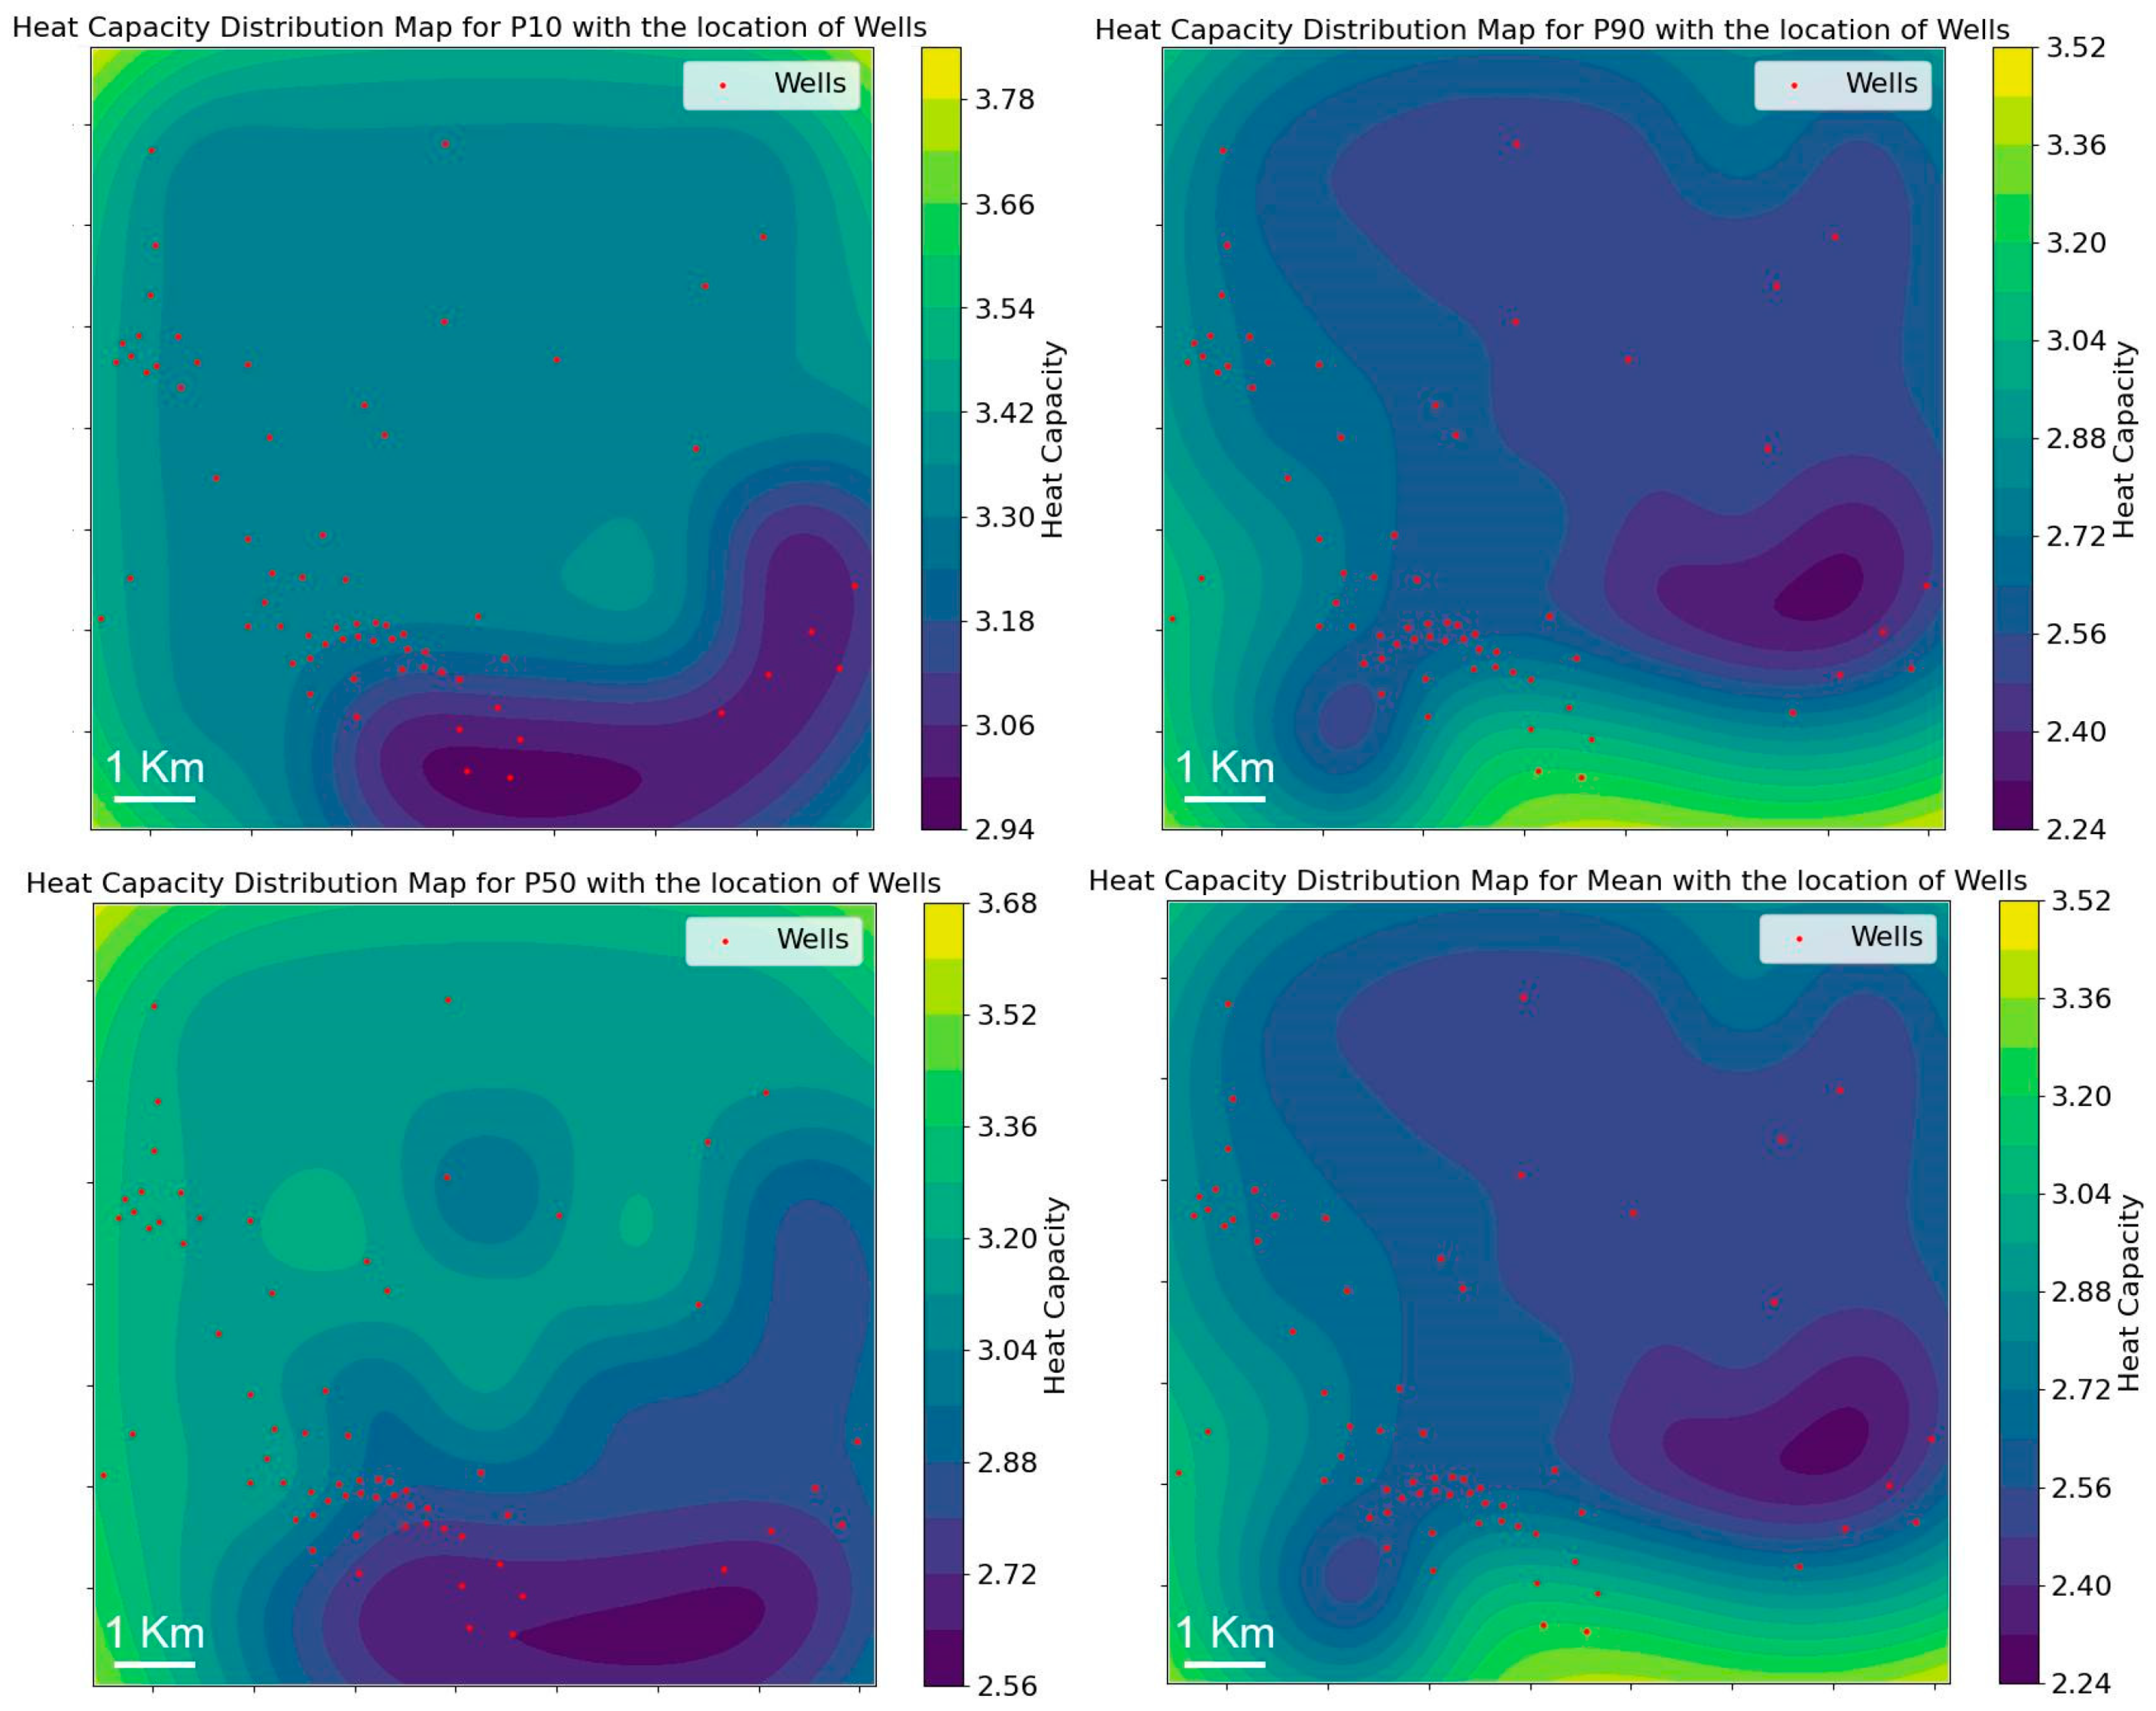
Heat capacity for each block was calculated based on porosity, rock type, density, and estimated specific heat capacity. The formula used for this calculation is as follows:
This formula derives the heat capacity in megajoules per cubic meter (MJ/m
3). This method was applied across different scenarios—P10, P50, and P90—to assess the heat capacity variability in each block (
Figure 14).
3.3.5. Thermal Conductivity
In our study, we referenced the findings of [
38], who reported an average thermal conductivity of 2.03 W/m·K for the Bekes formation, corrected for temperature effects. This average served as a benchmark for comparing our calculated values. Given the variability in lithological characteristics discerned from total Gamma Ray modeling, it was imperative to evaluate how thermal conductivity changes in response to lithology, temperature, and porosity within the formation [
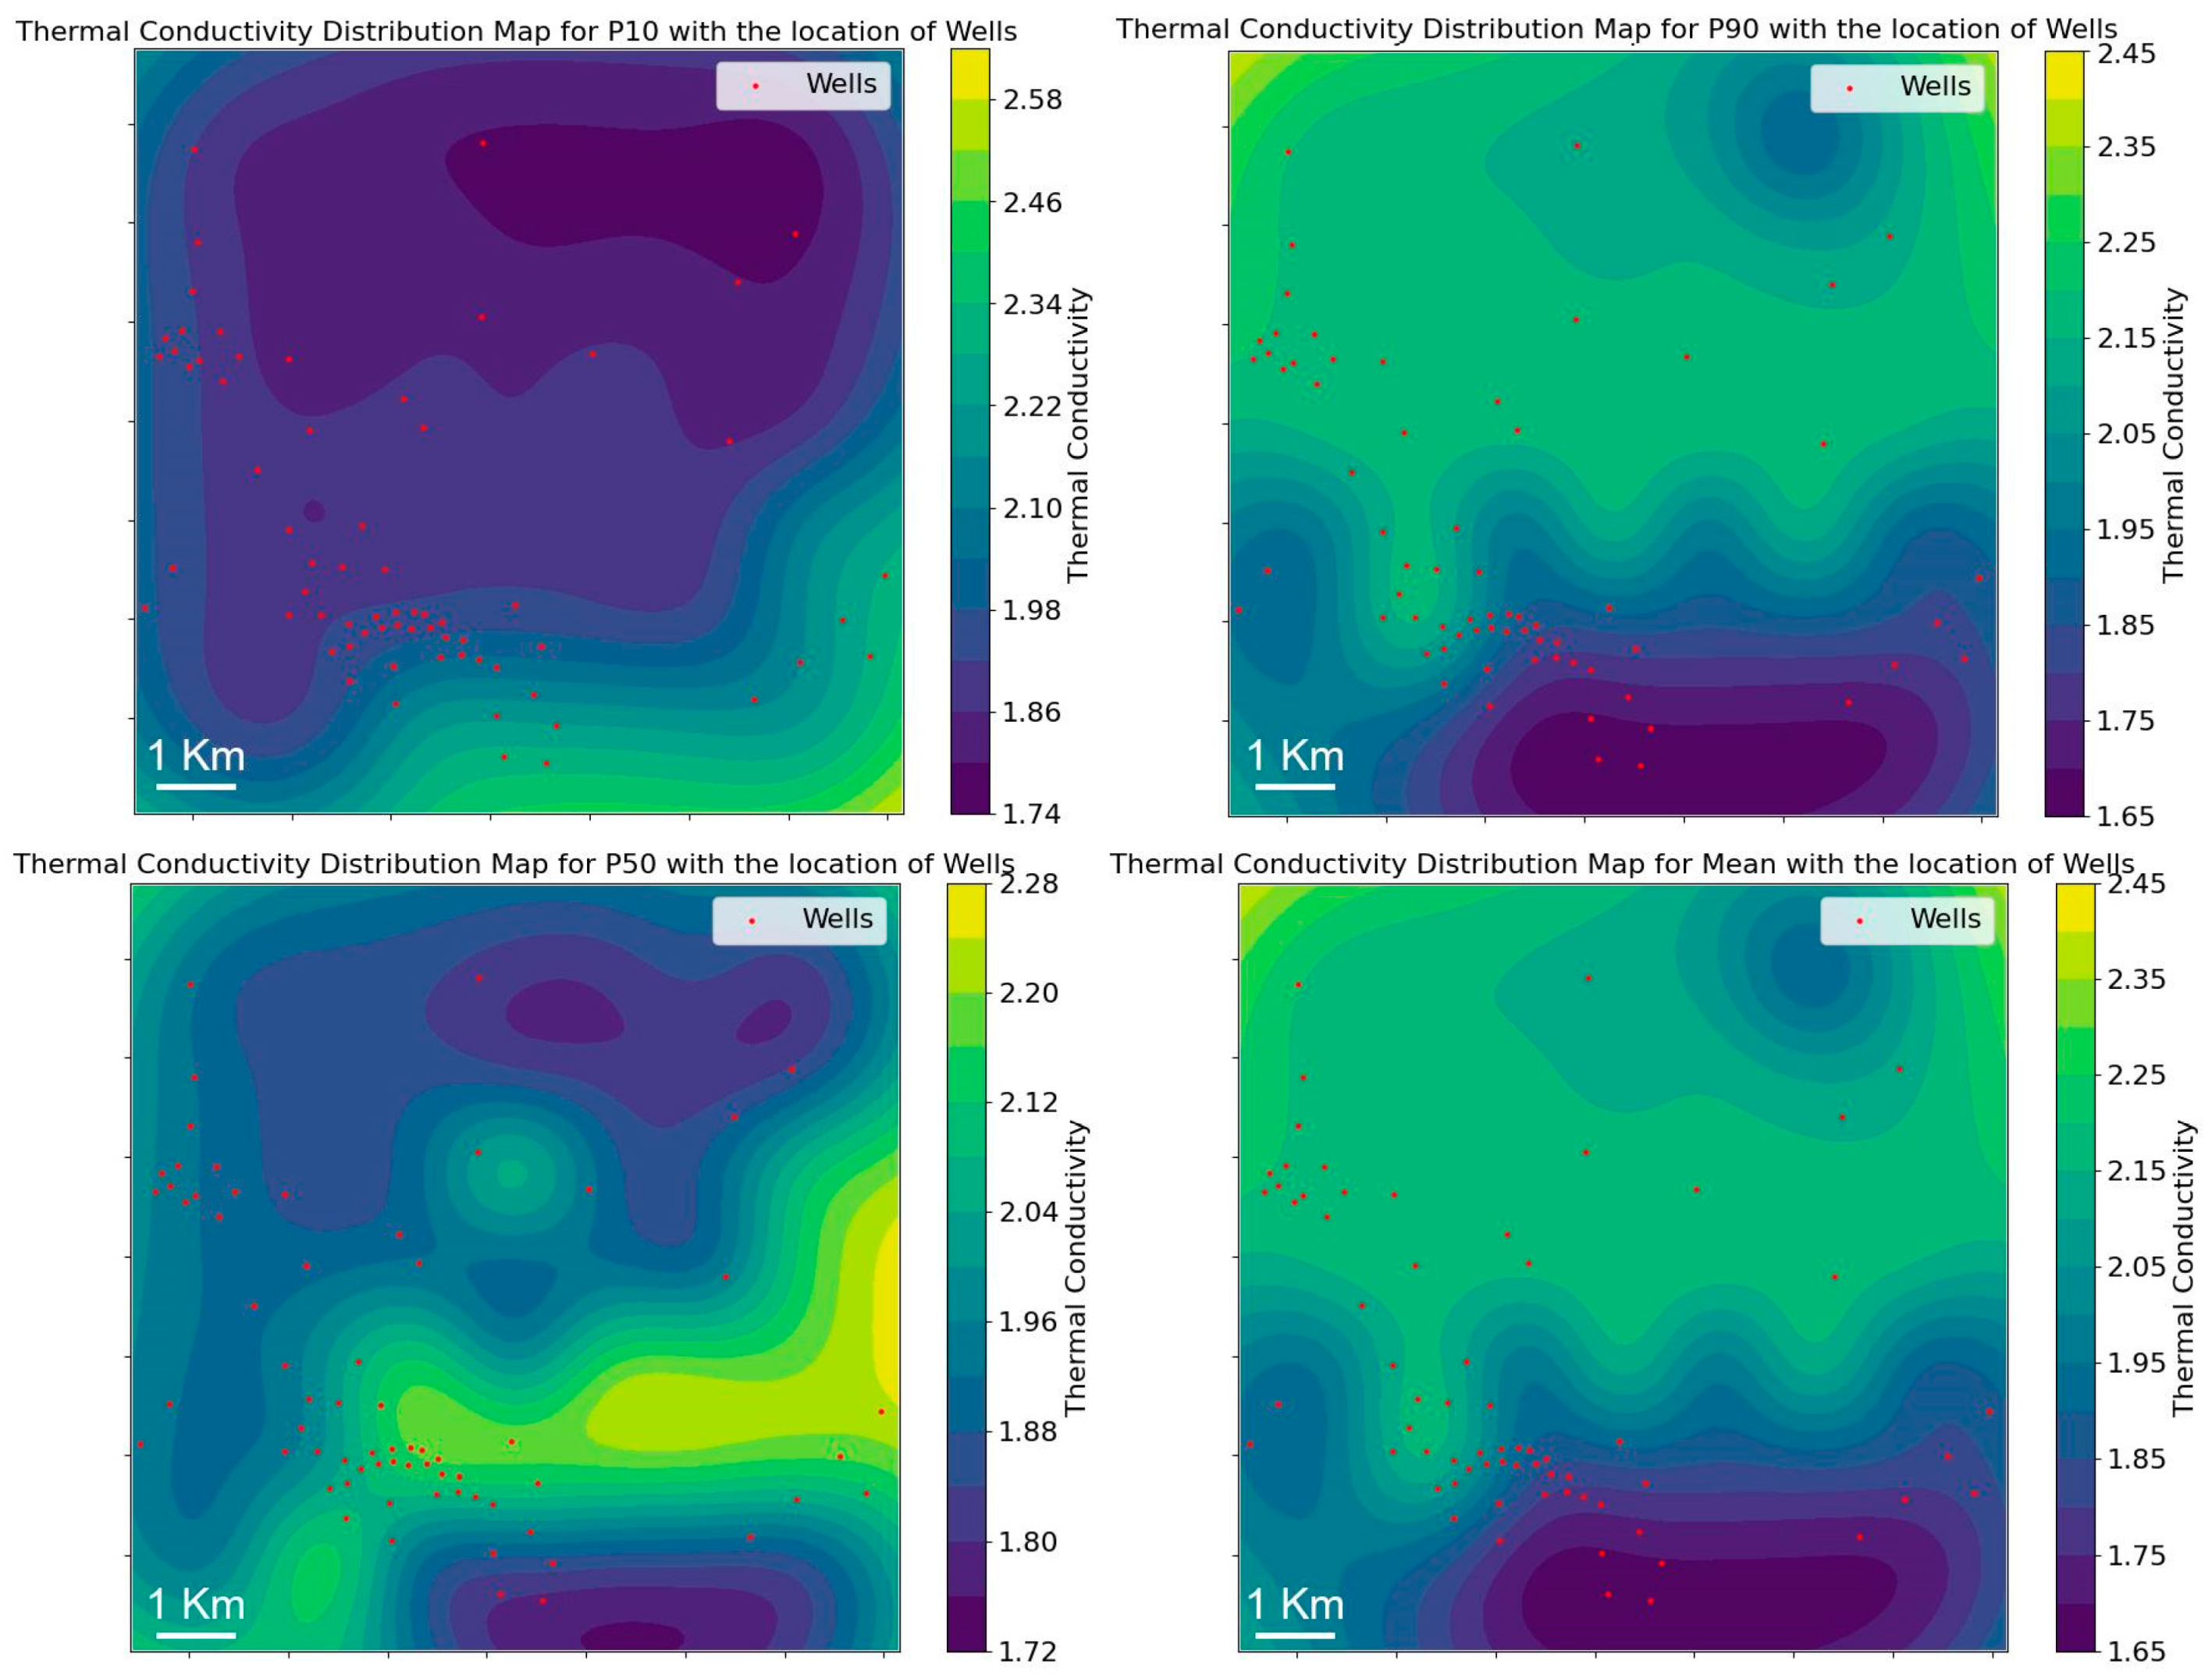
39]. To this end, we established base thermal conductivity values specific to each of the following identified rock types within the formation: Conglomerate, Breccia, Sandy Conglomerate, and Pebbly Sandstone. These values reflect the inherent thermal properties influenced by the geological composition. The thermal conductivity for each geological scenario—P10, P50, and P90—was then adjusted by a factor that accounts for the porosity, reducing conductivity by 10% per unit porosity to model the impact of increased pore space on heat transfer capabilities. Furthermore, we incorporated a temperature correction, decreasing conductivity by 0.2% for every degree Celsius increase above a baseline temperature of 25 °C (
Figure 15). With this methodology, we remained within the average thermal conductivity range of the Bekes Formation. However, we generated local changes in the function of the thermal conductivity equation to estimate the variation of thermal conductivity across the formation, providing a nuanced understanding of how specific geological conditions affect thermal properties.
3.3.6. Criteria Selection
A comprehensive literature review was conducted to select the criteria for the transition of hydrocarbon reservoirs to ATES systems [
4,
16,
17,
23,
40,
41,
42]. This review identified the key factors critical to the assessment of the potential sites: porosity, permeability, reservoir temperature, and thickness, along with heat capacity and thermal conductivity. Additionally, the presence and availability of wells within the reservoir were considered to be essential due to their direct impact on the feasibility of converting the hydrocarbon reservoir for ATES use. A Python script was used for the visualization of the modeled data (
Supplementary Materials S1.5).
3.3.7. Case Study Selection
The selection of this study area for MCDA application is underscored by its distinct geological features, notably within the Bekes Formation, known for its conducive geothermal attributes [
43,
44]. The Lower Pannonian Békés Conglomerate, with an average thickness of 30–40 m and a maximum of 50 m (
Figure 16). The reservoir thickness decreases towards the top of the basement. The reservoir has an average porosity of 25% and a permeability of 400 milliDarcy, with a maximum of 2.5 D. The reservoir pressure is hydrostatic, and the geothermal gradient is 57 °C/km. Oil production from this reservoir is limited to a few wells, with water cut more significantly than 95%. However, the reservoir’s proximity to a potential heat market and a dense well network of over 70 wells make it a potential candidate for geothermal completion. However, no water injection exists, and significant oilfield water production occurs, estimated at 1000–1200 cubic meters per day. The Paleozoic granite–quartz porphyry contains porous rock inclusions resulting from the surface and near-surface corrosion, fracturing, and crack network caused by tectonic movements. Fluid movement is upward, and maximum oil production occurred between 1961 and 63 at 25,000 m
3/year.
3.4. MCDA Application Process
The MCDA process for assessing the suitability of locations for heat storage involves a rigorous and methodical application, incorporating various tools and data sources. Temperature, permeability, and thickness data were critical in filtering potential sites based on predefined criteria tailored to the purpose of HT-ATES or direct high-temperature utilization (
Supplementary Materials S1.3). This selection process was further refined by applying weights and thresholds to evaluate each site’s compatibility with the project goals. The MCDA harnessed Python’s analytical capabilities, particularly its pandas, numpy, and matplotlib libraries, to process and visualize the data, thus providing a comprehensive and clear depiction of the most viable locations for heat storage.
3.5. Sensitivity Analysis
The sensitivity analysis conducted on various criteria, such as porosity, permeability, temperature, thickness, well density, heat capacity, and thermal conductivity, reveals crucial insights into the stability and robustness of these parameters under weight adjustments. This local sensitivity analysis method involved varying one criterion’s weight at a time while proportionally adjusting the others to ensure that the total sum of weights remained 1. The impact of these adjustments on the overall scores was evaluated using variance minimization. The equations used in this analysis include the weighted sum calculation, as follows:
and the variance calculation, as follows:
This analysis was essential in determining the resilience of the heat storage site selection process to changes in evaluation criteria weights (
Table 1).
4. Results
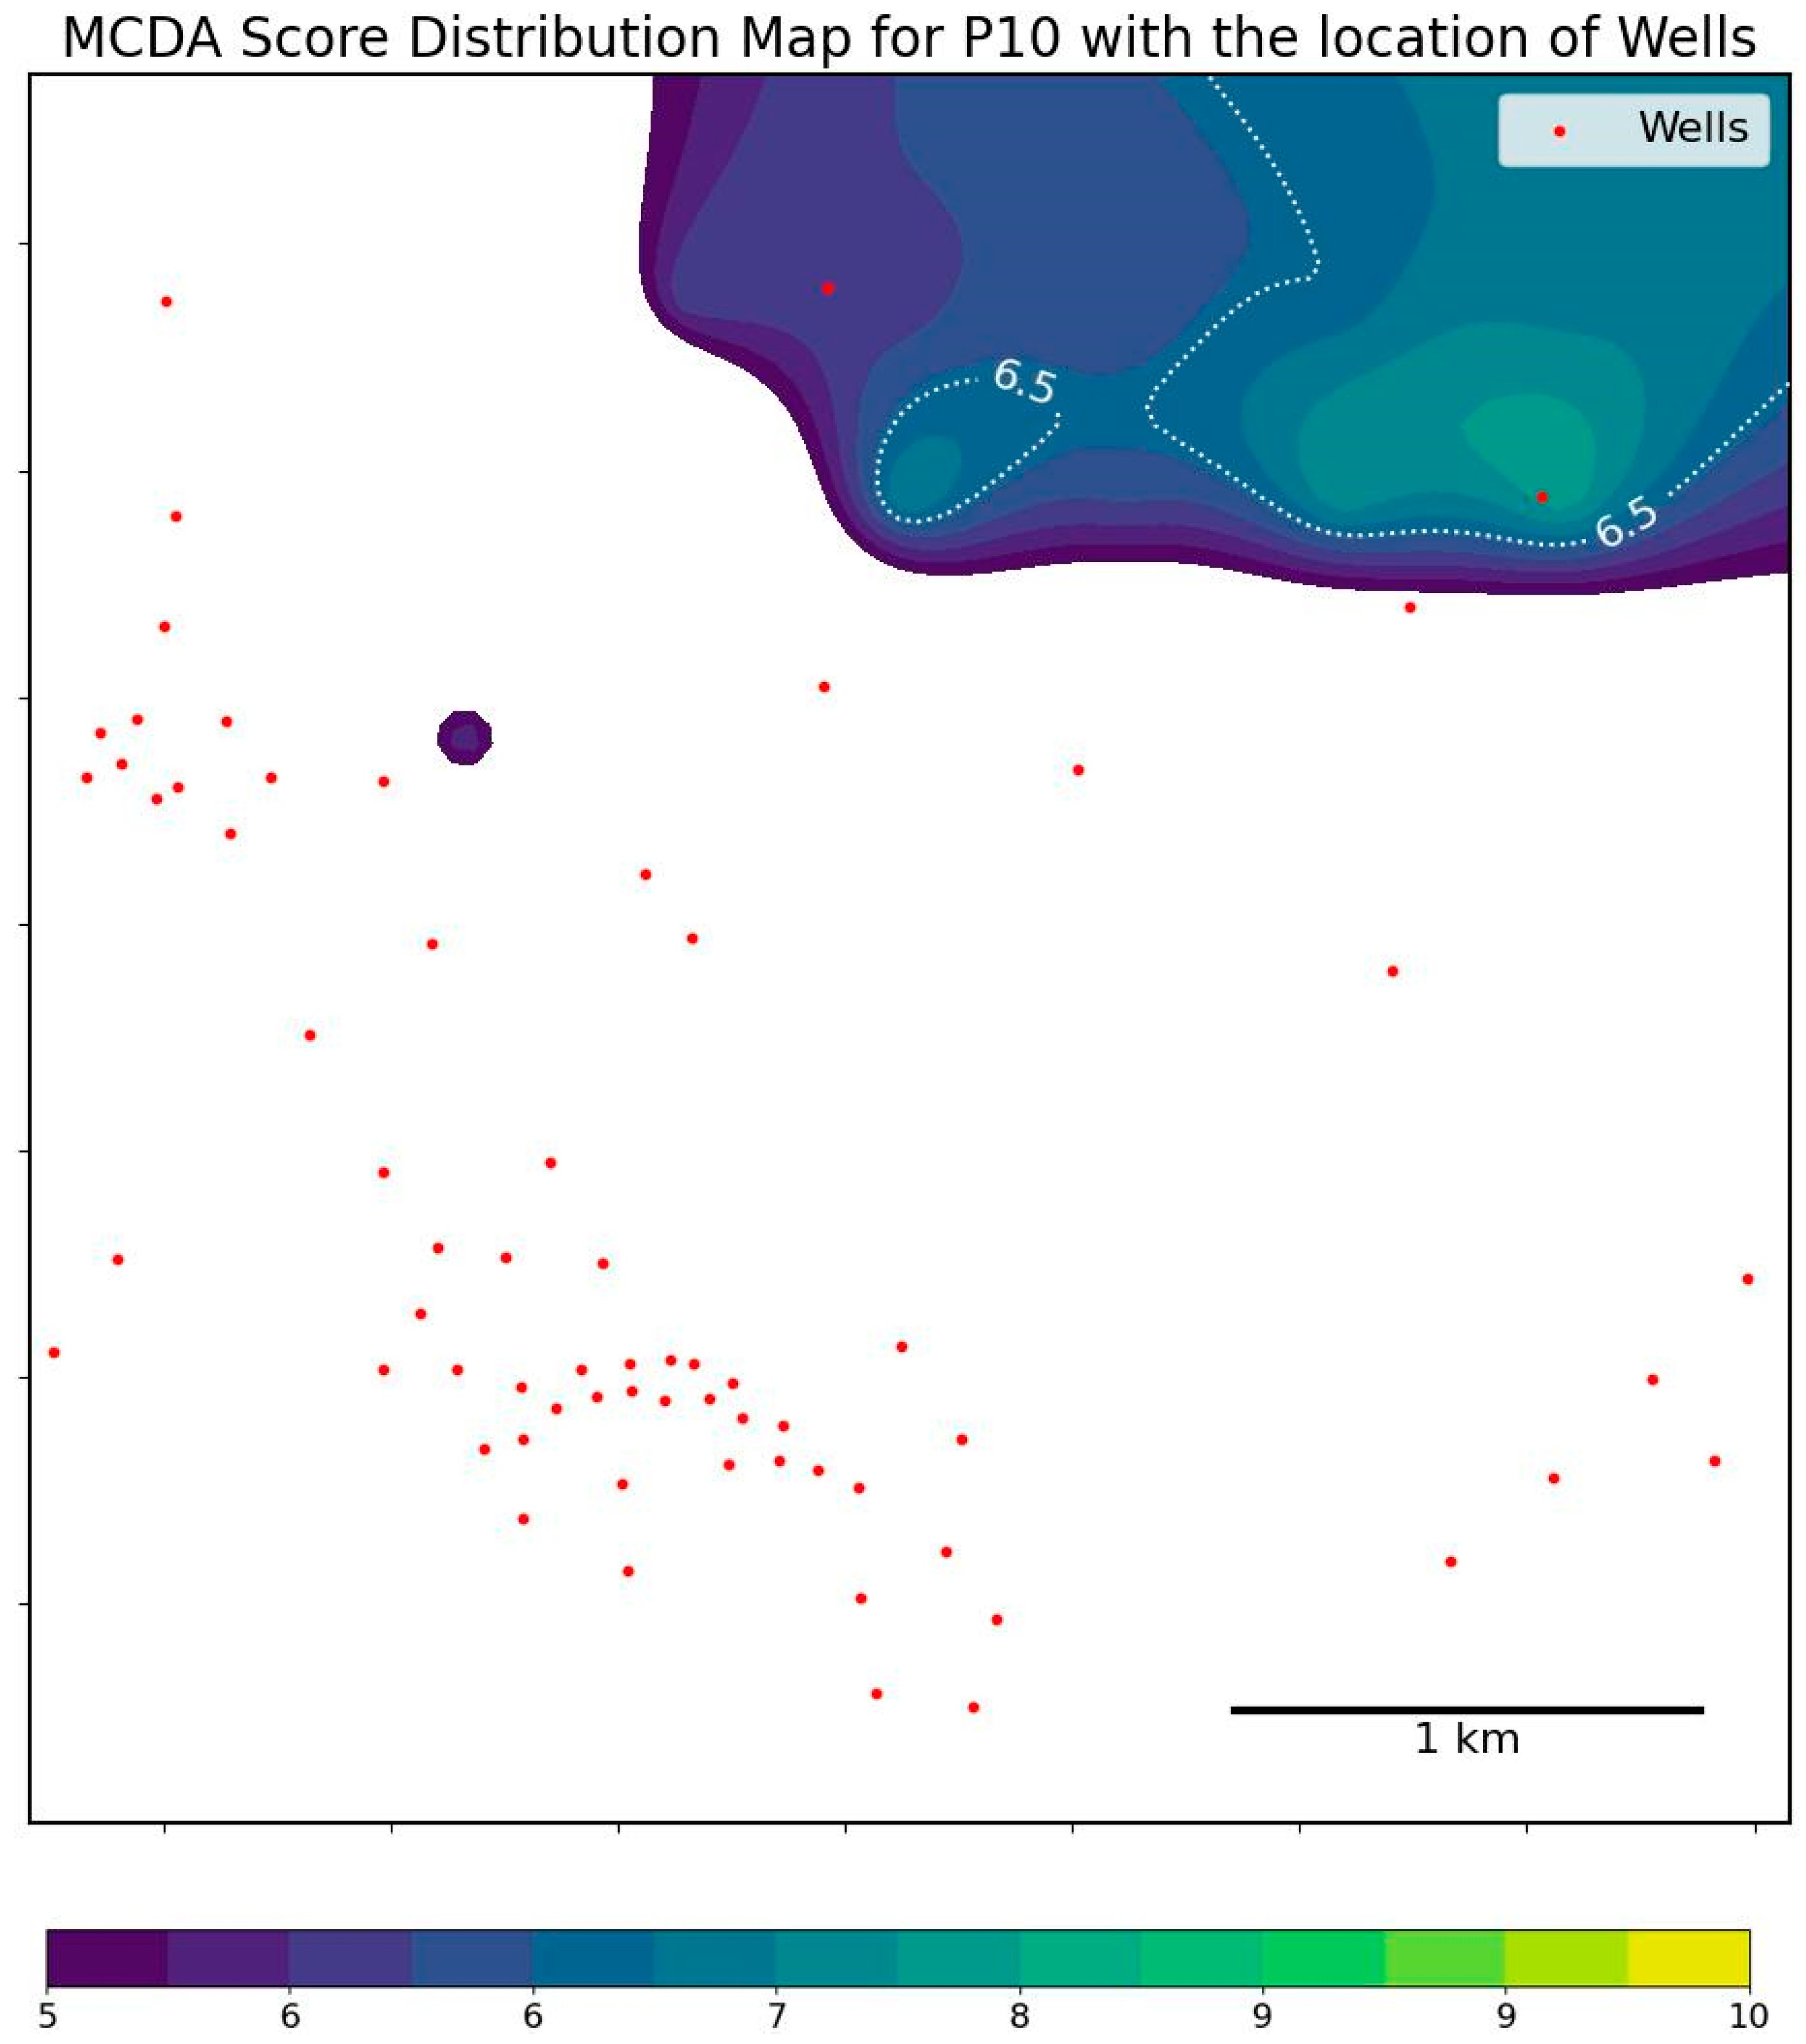
In this Results Section of this MCDA study on heat storage, we focus on evaluating potential locations based on a set of criteria critical for heat storage capabilities. Our analysis reveals that permeability and reservoir temperature are paramount, with acceptable permeability not nearing zero and temperatures set for specific purposes at the outset. The MCDA assigned scores, setting a threshold at 6.5 to distinguish optimal sites. Scores above 6.5 indicated prime locations, while those below 6.4, if not filtered out, appeared as NaN, demonstrating a method to assess potentiality against established criteria rapidly (
Supplementary Material S2).
4.1. HT-ATES
Setting the focus on HT-ATES, we defined critical parameters, including a temperature range of 50 to 70 °C, a minimum thickness of 10 m, and a minimum permeability threshold of 0.1 milliDarcy. Our MCDA framework identified the Bekes Formation as an exemplary candidate for HT-ATES in all scenarios, scoring an outstanding above-threshold repetition in the same area, reflective of its favorable conditions for heat storage (
Figure 17).
4.1.1. Probability Distribution of the Lowest Risk P90
Our assessment of potential heat storage sites, as illustrated in
Figure 18, reveals that no sites were identified under the lowest risk category due to the stringent criteria established prior to the MCDA. The Python script employed in the analysis excluded any blocks that did not meet all of the purpose criteria, effectively functioning as a ‘no-go’ filter. The primary issues identified were temperatures falling outside the desired range of 50.0–75.0 °C and thicknesses consistently below the required 10.0 m threshold, with observed temperatures reaching up to 99.3 °C and thicknesses as low as 0.04 m. This rigorous filtering underscores the challenge of finding suitable heat storage sites and emphasizes the importance of precise criteria in ensuring the selection of viable locations.
Probability Distribution of the Medium Risk P50
In the probability range of P50, three blocks were qualified based on their favorable characteristics, including well densities of 2 and 5, porosities of 0.3 and 0.31, and permeabilities of 411.63 and 795.97 milliDarcy. These blocks also met the criteria with densities of 2.5, temperatures between 70.1 °C and 72.6 °C, thicknesses ranging from 10.35 to 11.8 m, heat capacities from 2.85 to 2.89 MJ/m3·K, and thermal conductivities of 2.19 to 2.2. These parameters highlight their suitability as potential heat storage sites within the P50 probability range.
4.1.2. Probability Distribution of High Values P90
In the high-risk probability range, many blocks were qualified due to their favorable characteristics, including well densities ranging from 2 to 21, porosities between 0.33 and 0.33, and permeabilities from 1728.78 to 2189.89 milliDarcy. These blocks also demonstrated suitable densities of 2.4 to 2.5, temperatures from 66.9 °C to 74.9 °C, and thicknesses between 10.5251 and 28.8116 m. Additionally, their heat capacities ranged from 3.01 to 3.34 MJ/m3 K, and thermal conductivities varied from 1.92 to 2.21. These parameters underscore the potential of these blocks as viable heat storage sites within the high-risk probability range.
4.2. High-Temperature Direct Application
For direct high-temperature utilization, neither P90 (lowest risk) nor P50 (medium risk) were qualified due to not meeting the required criteria of a minimum temperature of 100 °C, maximum temperature of 140 °C, permeability of 0.01, and thickness of 10 m, with observed temperatures ranging from 66.0 °C to 99.3 °C and thicknesses consistently below 10 m. However, several blocks were qualified based on favorable attributes, including well densities ranging from 0 to 2, porosities between 0.34 and 0.34, and permeabilities from 1485.54 to 2004.90 milliDarcy (
Figure 18). These qualified sites also demonstrated densities of 2.4, temperatures from 100.7 °C to 106.1 °C, and thicknesses between 15.80 and 26.51 m. Additionally, the heat capacities ranged from 3.33 to 3.34 MJ/m
3·K, with thermal conductivities varying from 1.78 to 1.80. These parameters underscore the suitability of these blocks for direct high-temperature applications, meeting the required criteria for temperature and thickness.
5. Discussion
Operators accumulate extensive datasets in hydrocarbon extraction, including well data, seismic records, reservoir characteristics, core analyses, and fluid testing results, alongside comprehensive stochastic simulations. These legacy data, crucial for repurposing initiatives, underpin our methodology to strategize the conversion of existing wells, which can be costly to decommission. Our approach leverages stochastic simulation data when available, which is a common asset among hydrocarbon companies. However, even without such data, well data can still facilitate the modeling process, albeit with increased uncertainty in the predictions.
Permeability and reservoir temperature critically influence the viability of HT-ATES systems. The strict threshold for permeability (>0.1 milliDarcy) serves as a fundamental criterion, immediately disqualifying blocks that do not meet this requirement. This is crucial for ensuring fluid can effectively circulate through the reservoir, which is non-negotiable for the operational success of HT-ATES [
46]. Similarly, the temperature criteria, tailored to high-temperature applications, ensure only those blocks capable of providing the necessary thermal conditions are considered [
47]. These parameters ensure a focused selection of potential sites, aligning closely with HT-ATES’s technical demands.
However, this analysis’ current scope primarily centers on subsurface characteristics, omitting surface factors that could significantly influence site feasibility. Integrating geographic and environmental considerations through GIS-based methodologies could enrich the MCDA framework. This addition would enable a more comprehensive assessment, accounting for potential land-use conflicts, proximity to infrastructure, and environmental protection areas, strengthening the decision-making process for HT-ATES site selection.
Our study’s exploration into heat storage capabilities through the MCDA aligns with, and diverges from, the existing literature. Drawing parallels with Jello et al. (2022) and Stricker et al. (2020), we reaffirm the crucial role of subsurface characteristics like permeability and temperature in the site viability for heat storage. However, unlike Stricker et al.’s regional analysis within the Upper Rhine Graben, our approach applies a broader criteria-based MCDA framework. This difference showcases our method’s adaptability, bridging the gap between overarching selection frameworks and specific geological assessments.
The differentiation between the Bekes Formation’s wide range of results, as highlighted in our P10, P50, and P90 results, underscores the subtle understanding our MCDA framework brings to evaluating potential HT-ATES sites. The Bekes Formation, with its consistently high scores and high contrast in the results, emerges as a prime candidate, notably in the P10 scenario, due to its favorable well characteristics. This contrast aligns with the broader criteria emphasized by Jello et al., and also diverges by providing a clear, quantifiable assessment of site suitability across a national landscape.
The MCDA-AHP approach significantly enhances the speed and accuracy of simultaneously evaluating multiple oil fields for various heat storage purposes, setting it apart from traditional methods. Traditionally, potential zone detection relies on time-consuming expert evaluations. However, while efficient, the grid-based analysis used in MCDA-AHP could be further refined. Currently utilizing equidimensional rectangles for grid creation, adopting a grid method that mirrors the reservoir’s structural nuances would yield a more precise evaluation. Implementing such an overlapping grid requires accessible structural data, acknowledging the need for detailed geological insights to optimize the MCDA framework’s efficacy.
The enhanced MCDA-AHP methodology significantly advances the evaluation of oil fields for various applications, including HT-ATES, LT-ATES, electricity generation, and CO2 storage. This approach outperforms traditional methods reliant on expert analysis by streamlining the process, enabling the swift and precise identification of viable zones across various fields.
Moving forward, a detailed examination of these potential locations through advanced modeling and simulation, particularly transient modeling, is crucial. This step is vital for assessing the practical viability of these sites for diverse pore utilization purposes. Improving the gridding process to reflect the intricate structure of reservoirs better will further refine the accuracy of site evaluations. These advancements are poised to inform strategic decisions in energy storage development and policy, setting a foundation for future research and practical applications in the energy sector.
Future research should explore integrating machine learning and artificial intelligence to refine the site selection process for pore utilization. By harnessing these technologies, future studies can overcome current MCDA limitations, enabling predictive analytics and adaptive learning from vast datasets. This approach promises to significantly enhance decision-making accuracy, tailor solutions to specific environmental and economic contexts, and revolutionize how we approach sustainable energy storage and utilization strategies.
6. Conclusions
This methodology paves the way to empower decision-making regarding the repurposing of abandoned hydrocarbon fields, facilitating the transition to renewable energy storage. This study showcases the feasibility and efficiency of employing Multi-Criteria Decision Analysis (MCDA) combined with the Analytic Hierarchy Process (AHP) and geostatistics to identify optimal underground heat storage locations. By leveraging comprehensive data analysis and expert evaluations on parameters like porosity, permeability, and reservoir temperature, this research outlines a strategic pathway for the sustainable utilization of former hydrocarbon sites. Future efforts will focus on refining the MCDA-AHP framework through advanced modeling and by integrating artificial intelligence to enhance the precision of sustainable energy storage solutions, marking a significant advancement in renewable energy.
