Article

Data Acquisition of Logging While Drilling at the Newly Discovered Gas Hydrate Reservoir in Hyuganada Sea, Japan

1
Japan Organization for Metals and Energy Security, Chiba-shi 261-0025, Chiba, Japan
2
Japan Methane Hydrate Operating Co., Ltd., Chiyoda-ku, Tokyo 100-0005, Japan
3
National Institute of Advanced Industrial Science and Technology, Sapporo 062-8517, Hokkaido, Japan
4
National Institute of Advanced Industrial Science and Technology, Tsukuba 305-8560, Ibaraki, Japan
*
Author to whom correspondence should be addressed.
Current address: INPEX Corporation, Minato-ku, Tokyo 107-6332, Japan.
Current address: Japan Petroleum Exploration Co., Ltd., Chiyoda-ku, Tokyo 100-0005, Japan.
Energies 2024, 17(15), 3815; https://doi.org/10.3390/en17153815
Submission received: 29 March 2024 / Revised: 26 April 2024 / Accepted: 26 July 2024 / Published: 2 August 2024

Abstract

:
From December 2021 to January 2022, MH21-S conducted an exploratory drilling campaign using logging-while-drilling tools to confirm the methane hydrate concentrated zone (MHCZ) for future offshore production tests. In a preliminary screening study using seismic survey data, methane hydrate (MH) prospects have been extracted in The Hyuganada Sea, offshore Kyushu. In the exploration drilling site, a previous study had reported that MH prospects were inferred from four indices. We have selected two MH prospects: one with an anticlinal structure and another with a planus structure. As a result of drilling, a resistivity value higher than 3 Ω·m, which was a criterion for interpreting MHCZs from log data, was confirmed at a depth of 336–376 mBSF in the prospect with an anticlinal structure. The MH saturation calculated using Archie’s formula was 12–95% (average saturation of 70%). The average density porosity at the same depth was 52%. P-wave velocities were faster than the upper layers. Compared with those of the MHCZ at Daini Atsumi Knoll, the MH saturation is expected to be higher, the spread of some strong-amplitude reflectors has been interpreted from seismic survey data, and the potential MH resources in this area can be sufficiently expected.

1. Introduction

The Research Consortium for Methane Hydrate Resources in Japan (MH21) was established in 2001 by the Ministry of Economy, Trade, and Industry (METI) based on Japan’s Methane Hydrate R&D Program. MH21 was composed of two organizations, the Japan Organization for Metals and Energy Security (JOGMEC) and the National Institute of Advanced Industrial Science and Technology (AIST), and concluded phase 2 (Japanese fiscal year (JFY) 2009–2015) and phase 3 (JFY 2016–2018) studies of Japan’s Methane Hydrate R&D Program. The program generated numerous outcomes, e.g., (i) the discovery of methane hydrate concentrated zones (MHCZs), which are areas of highly concentrated methane hydrate (MH) deposits in sandy layers of the eastern Nankai Trough, and (ii) onshore and offshore production tests to verify the concept of the depressurization method, which does not require an artificial thermal energy input, as an efficient MH dissociation technique.
However, there are many technical challenges that must be solved to realize a stable and adequate volume of gas production from offshore fields for commercialization. In February 2019, the METI revised the Plan for the Development of Marine Energy and Mineral Resources. This defined the phase 4 (JFY 2019–2022) study as the planning and investigation stage of the next offshore production test. The phase 4 has been extended until JFY 2025. The next offshore production test will be conducted after 2025 and will involve improvement in production techniques, extraction of future candidate test sites in promising MHCZs using marine surveys, and other long-term studies.
JOGMEC, AIST, and Japan Methane Hydrate Operating Co., Ltd., formed the new MH21-S R&D consortium to find solutions to the challenges of pore-filling-type MH deposits in sandy sediments. In JFY 2019, the consortium comprehensively reviewed and analyzed past data and developed the execution plan for phase 4. Regional MH system studies had also been made in the eastern Nankai Trough and Hyuganada sea areas to clarify geological understanding of the generation and migration of biogenic methane and the accumulation of MH deposits [1]. The study results reveal that there are possible MH accumulations in both areas. Exploratory drilling campaigns in the eastern Nankai Trough and Hyuganada sea areas with short-term flow tests for offshore MH have been scheduled in phase 4 of the resource development plan of pore-filling-type MH. This study focuses on an exploratory drilling campaign conducted in the Hyuganada Sea survey area.

2. Outline of the Offshore Survey

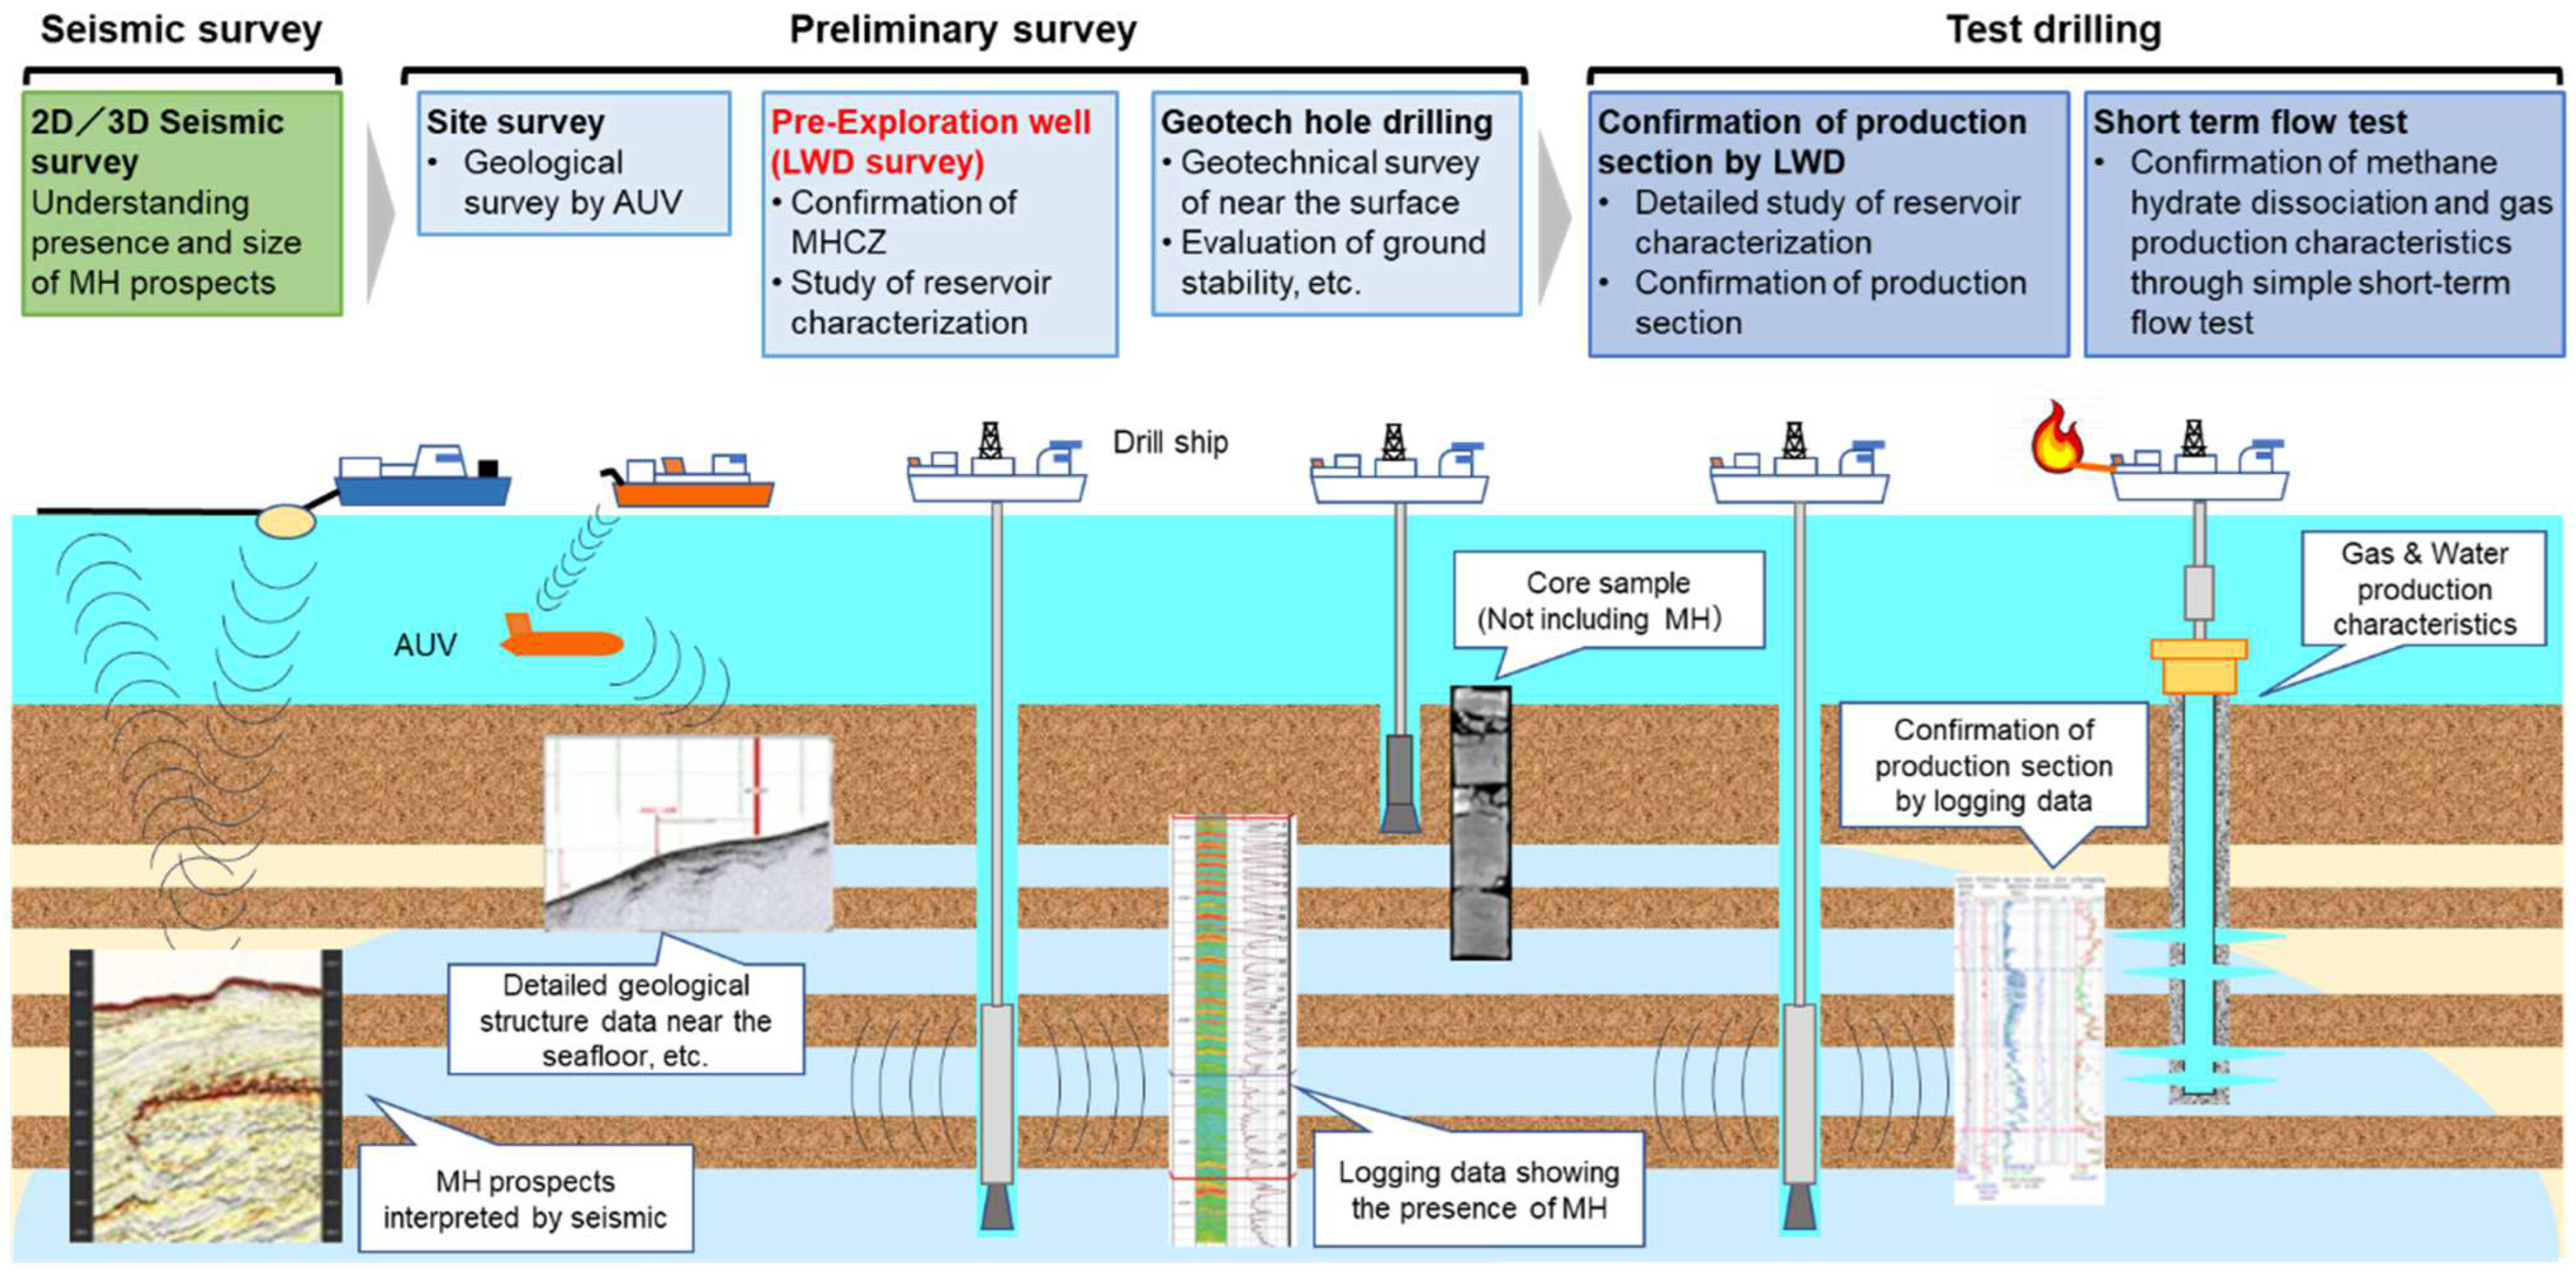
Figure 1 shows a sketch of the key tasks, such as seismic survey, preliminary survey, and test drilling, to fulfill phase 4 of the resource development plan.
The exploratory drilling campaign in the Hyuganada Sea survey area used three types of data acquisition: (1) logging while drilling (LWD), (2) wireline formation testing (WFT), and (3) coring of seafloor sediments. This study describes LWD and coring data acquisitions. The objectives of LWD data acquisition are to confirm the presence of MH and conduct further formation evaluation of MH deposits. The primary objective of coring of shallow seafloor sediments is to analyze their physical and geomechanical properties. In addition to geomechanical study, geological and geochemical measurements were conducted to evaluate the MH system and hydrate reservoir. The objective of the WFT operation is to obtain mobility, formation pressure, and fracture gradient data, the details of which are described in the study by Ohtsuki et al. [2].
Figure 1. Outline of the key tasks in an offshore survey using short-term flow tests.
Energies 17 03815 g001

3. Geology of the Study Area

The Hyuganada Sea survey area is a forearc basin that developed in front of the Southwest Japan Arc and the Ryukyu Arc because of the subduction of the Philippine Sea Plate (Figure 2). With the expansion of the Ryukyu Arc’s back-arc basin that began approximately 6 Ma, the Ryukyu Arc rapidly subducted and expanded due to large-scale left lateral pull-apart tectonics that occurred at the junction of the Southwest Japan Arc and the Ryukyu Arc. The area of this forearc basin is approximately 130 km from northeast to southwest and approximately 100 km from northwest to southeast.
The study area comprises upper Miocene to lower Pleistocene, which includes deep to shallow marine sedimentary successions of the Miyazaki Group overlain on the base Shimanto Super Group. The Hyuganada Group, which is composed of Pleistocene volcaniclastic flow deposits or terrace deposits, unconformably overlies the Miyazaki Group [3].

3.1. Shimanto Super Group

Kato [4] reported that the Hyuganada Group and Nichinan Group, which belong to the Shimanto Super Group, are accretionary deposits of Eocene to Lower Miocene age and are mainly composed of sandstone, mudstone, and alternation of sandstone and mudstone (Figure 3). The Hyuganada Group is exposed in northwestern Miyazaki Prefecture, while the Nichinan Group is exposed in southwestern to southern Miyazaki Prefecture. Both exhibit extremely complex structures, with slump folds and sliding structures evident at many points. They are in contact with each other due to a fault and are covered by the Miyazaki Group with dip unconformity [5,6,7].

3.2. Miyazaki Group

Outer neritic to bathyal turbidite sediments composed mainly of mudstone and sandstone–mudstone alternation overlie the Shimanto Super Group with tilt unconformity across the basal conglomerate. In recent years, the stratigraphy of the Miyazaki Group has been investigated using not only biostratigraphic methods but also sedimentological methods. Research has been conducted to correlate the stratigraphy of the Miyazaki Group with regional tectonics such as the subduction of the Kyushu–Palau ridge and the expansion of the Okinawa Trough [8,9,10] (Figure 2). Furthermore, the formation is a series of upper Miocene to Pliocene to lowermost Pleistocene sediments; it is thought that the depositional field moved northward from the south to the north [9,11,12] (Figure 3).
The structure of the Miyazaki Group on land is generally northeast to southwest in the northern part, north to south in the central part, and northwest to southeast in the southern part. In all areas, the structure is isoclinal, dipping approximately 10°–30° to the east. The same structure can be observed from the land area to the eastern coastal area, but several anticlinal structures with reverse faults are formed in the Miyazaki-oki sedimentary basin further east offshore.
In the southern part of the land, highly consolidated sandstone, mudstone, and alternating beds of sandstone and mudstone are distributed, which is called the “Miyazaki facies.” The Miyazaki facies is a forearc basin filling consisting of a topographically active hinterland, a narrow shelf, a steep submarine slope, and a continuous gentle slope. Sediments from fan deltas are well preserved [10]. The bottom of the Miyazaki facies is comparable with the planktonic foraminiferal fossil zone N17–N18 [8] (Figure 3).
In the northern part of the land, poorly consolidated mudstone is distributed, which is called the “Tsuma facies.” The stratigraphic age of the Tsuma facies has been relatively well studied, and detailed dating is available [3,13,14,15,16]. According to these studies, the bottom of the Tsuma facies is correlated with the planktonic foraminiferal fossil zone N17a, and its uppermost part is comparable with the paleomagnetic stratigraphic C2An.1n zone. From the above, the Tsuma facies is comparable with the upper Miocene to lower Pleistocene.

3.3. Hyuganada Group

The Hyuganada Group is composed of Quaternary Pleistocene pyroclastic flow deposits or terrace deposits and unconformably overlies the Miyazaki Group (Figure 3). Its lower part is mainly composed of alternating layers of silt and sand with slump and contains many shell fragments that are thought to be submarine valley-filling deposits. In addition, lens-shaped gravel is often interspersed. Its upper part is composed of massive silt with some carbonate concretions [3].

3.4. Bottom Simulating Reflector (BSR)
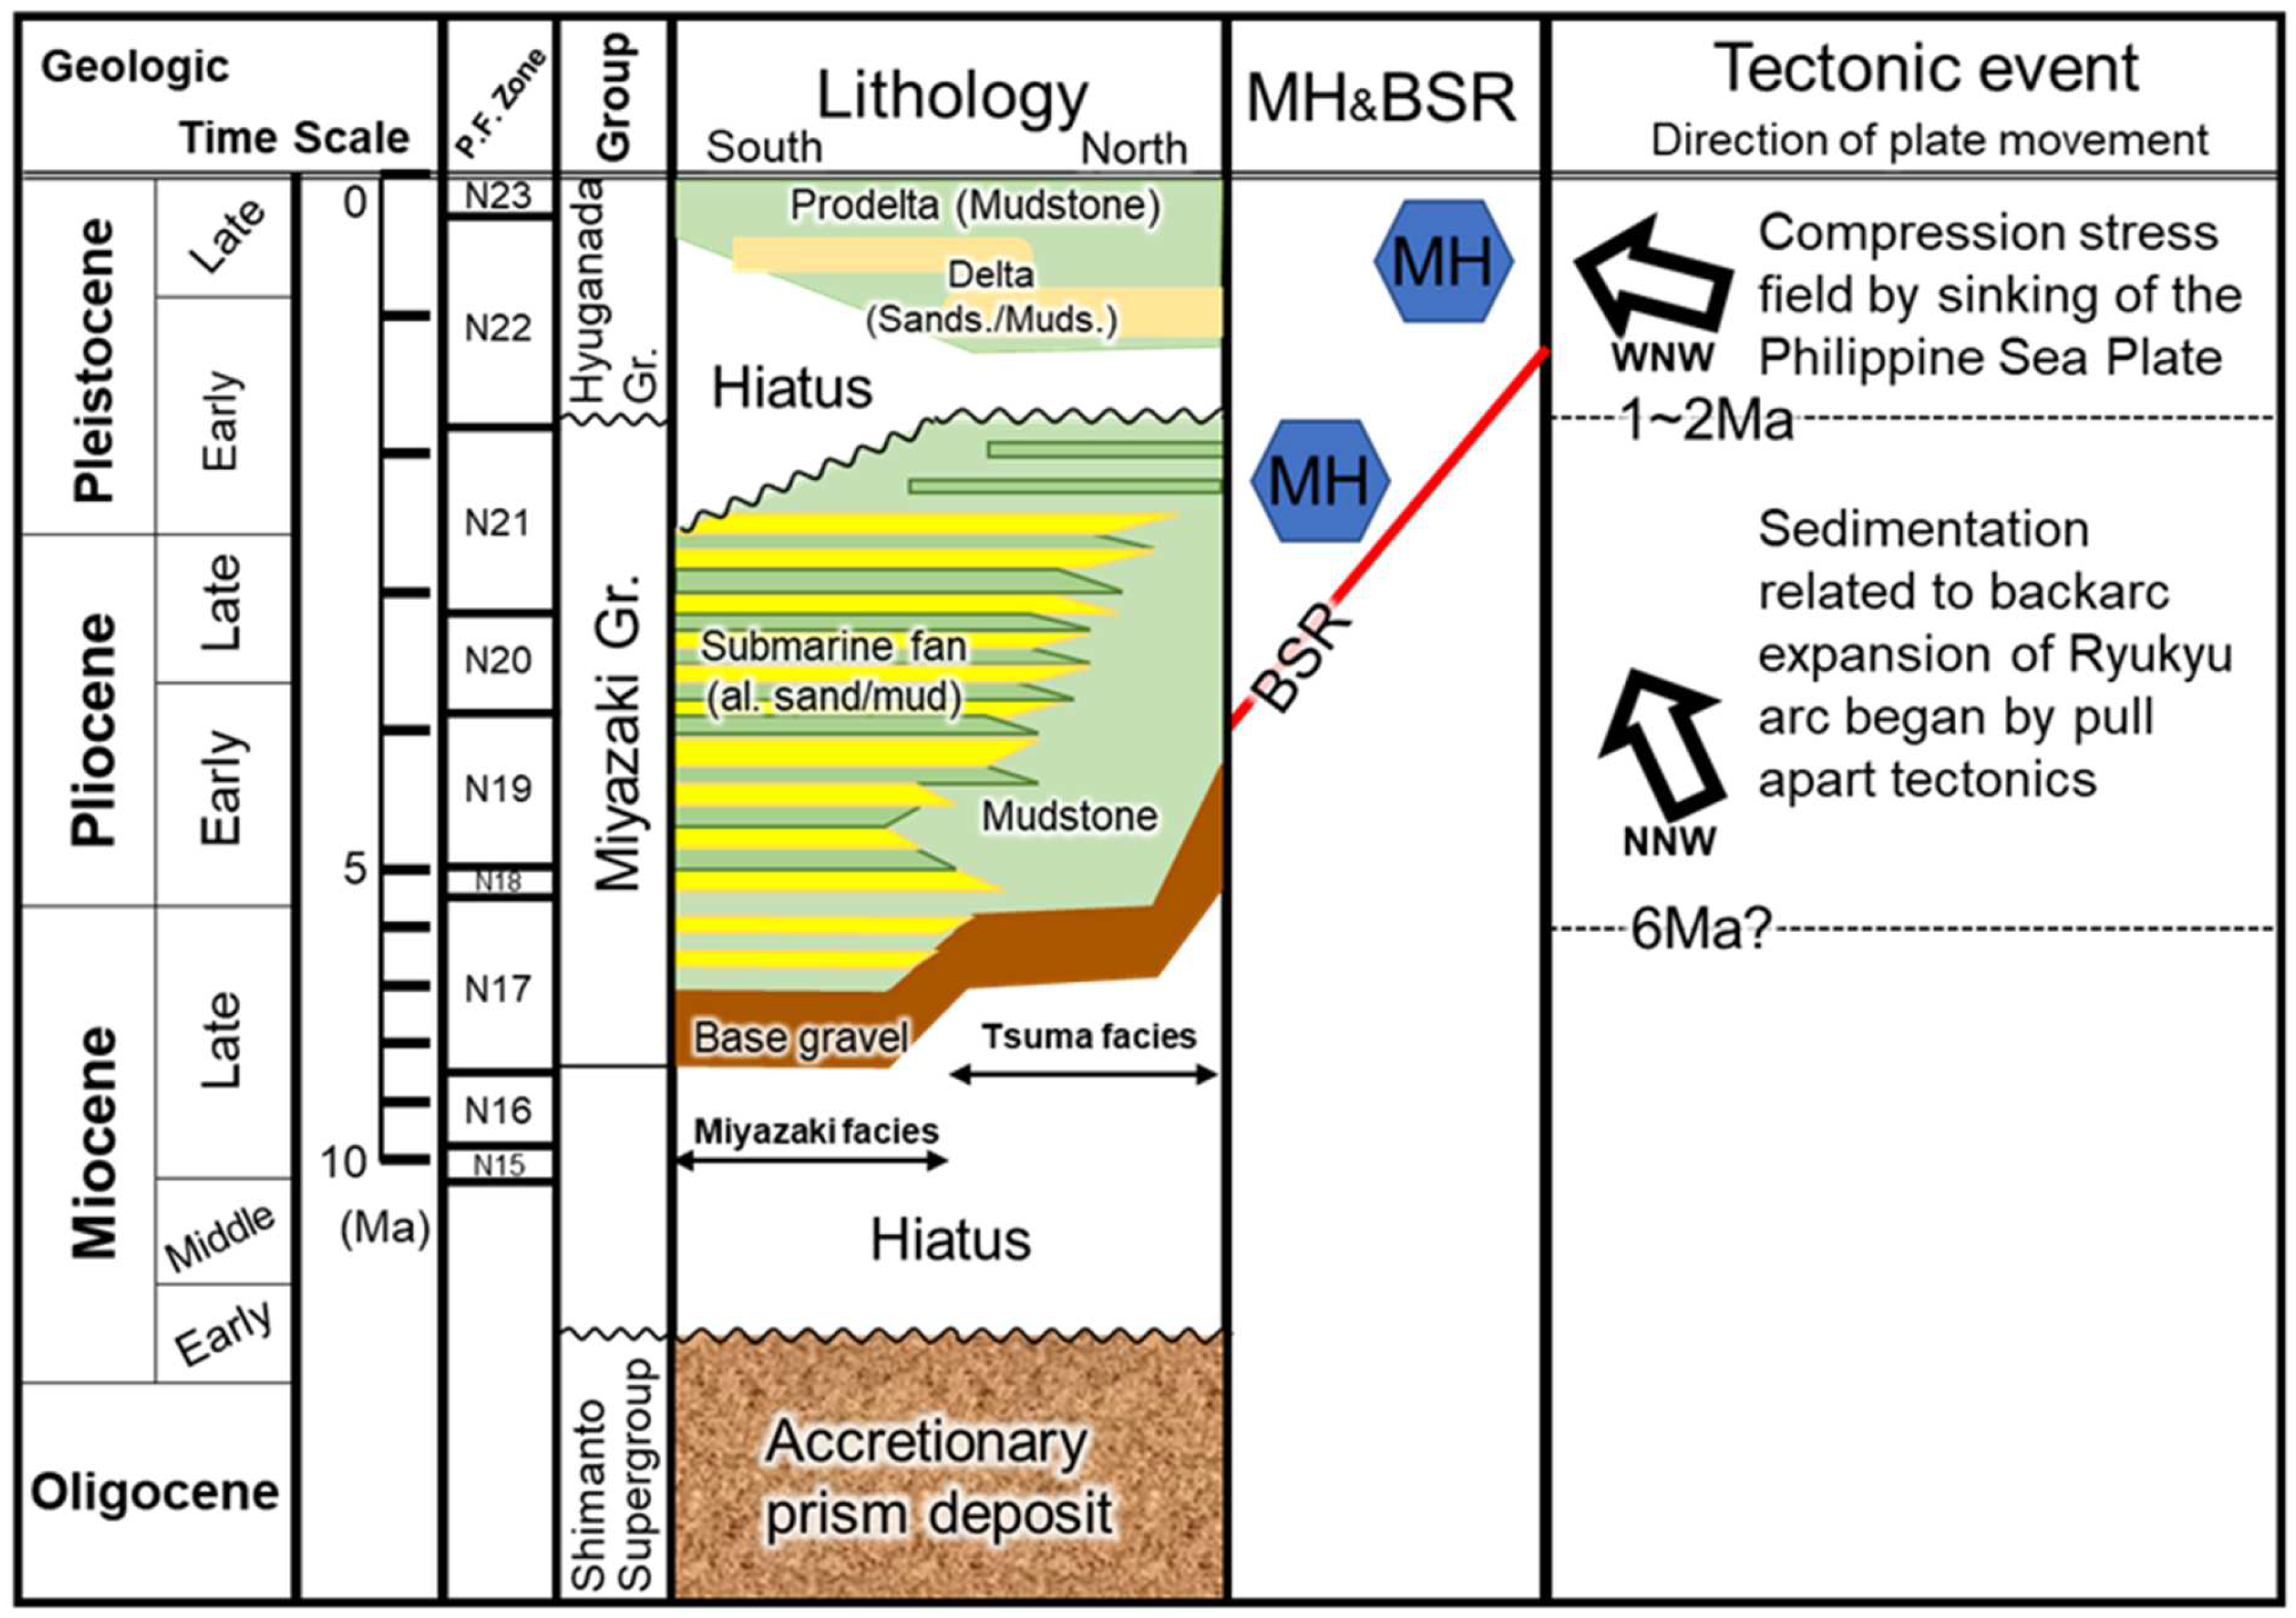
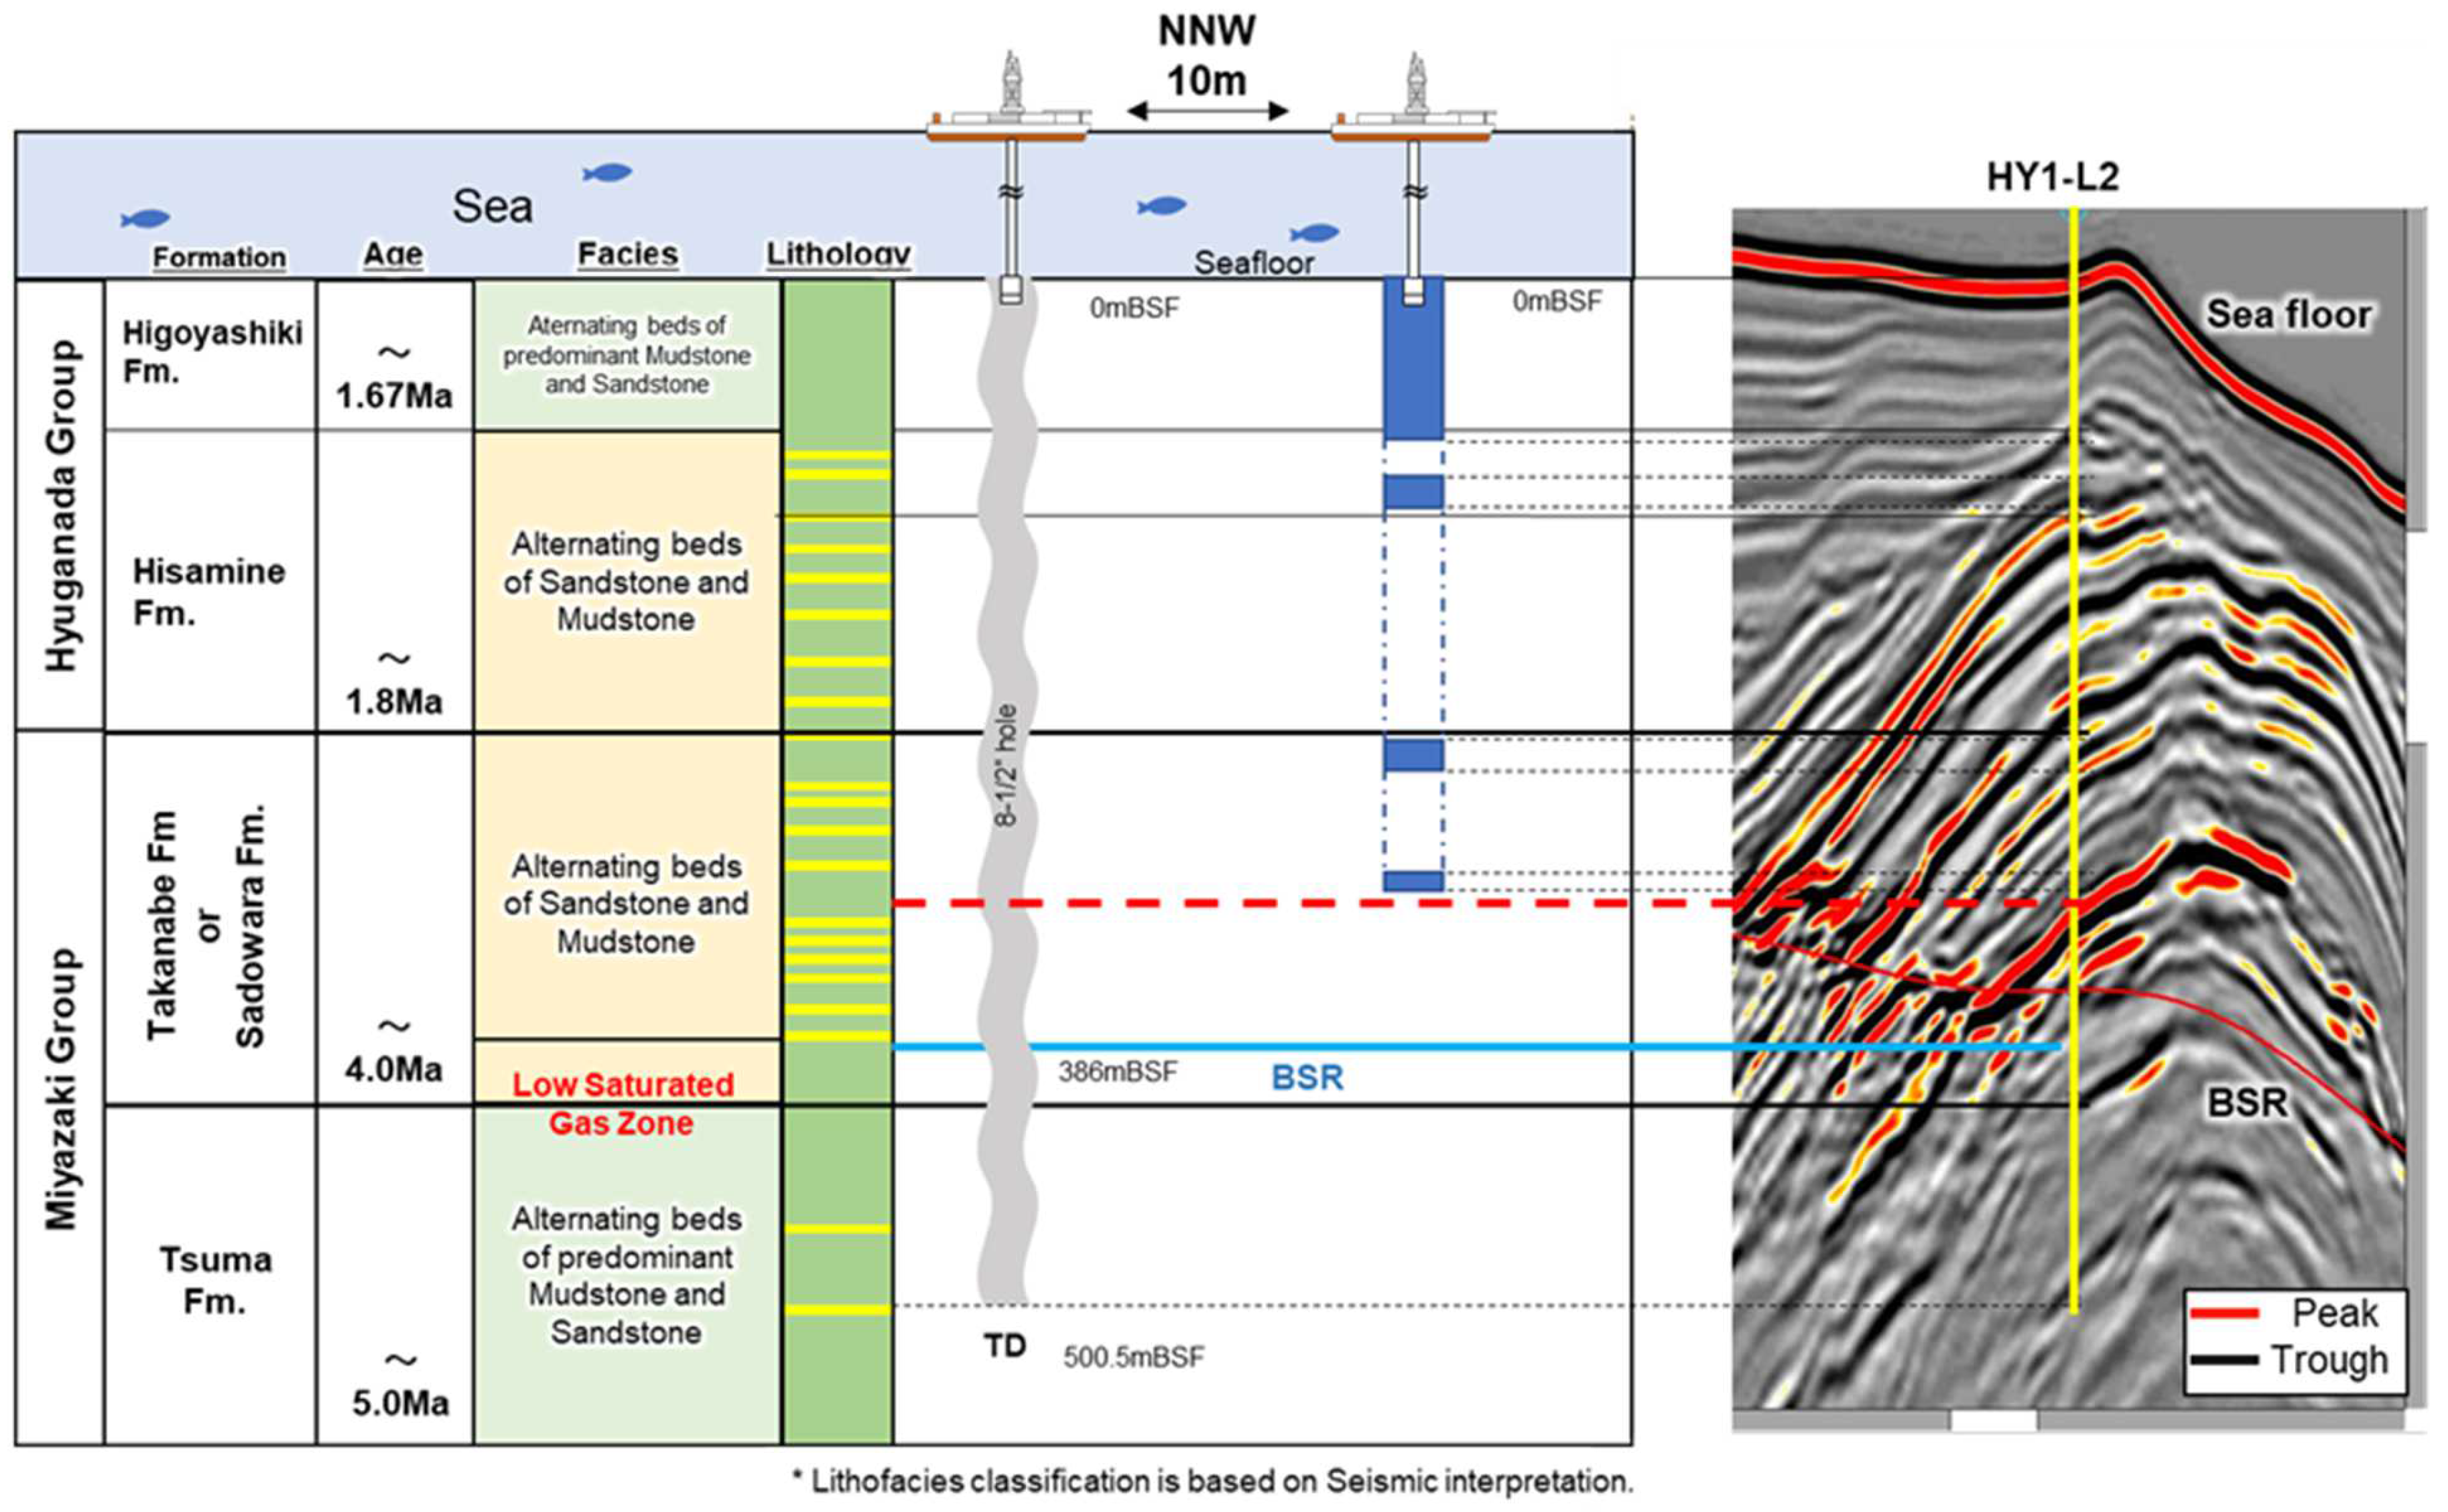
A BSR is widely recognized in this study area and occurs mainly in the upper part of the Miyazaki Group to the lower part of the Hyuganada Group (Figure 3).
Figure 3. Integrated stratigraphy of the surrounding land area and interpretation unit. Stratigraphy and lithology are based on the studies by Oda et al. [3], Kato [4], Nakamura et al. [8], Takashimizu [10], Suzuki [13], Torii and Oda [15], and Iwatani et al. [16]. The planktonic foraminiferal fossil zone is based on the study by Chunllan et al. [17].
Energies 17 03815 g003

4. Drilling Site Selection

The general outline of drilling site selection consists of two tasks: seismic interpretation and preliminary resource assessment of the MH deposit. Seismic interpretation was carefully made using 3D migration seismic data and high-density velocity data. Seismic interpretation was focused on the presence of BSRs, high velocity anomalies, strong amplitude reflectors, and possible sandy turbidite deposits using four indices described by Fujii et al. [18]. In the Hyuganada sea survey area, several prospected areas were interpreted based on seismic data and MH system modeling studies. Among those, two drilling sites, HY1-LM1 and HY1-L2, were selected for the exploratory drilling campaign in the Hyuganada Sea survey area because these two sites fulfilled the required resource volume (10 billion m3) based on the preliminary resource assessment. The geology of the target depth in these two sites corresponds to the late Pliocene of the Miyazaki Group.
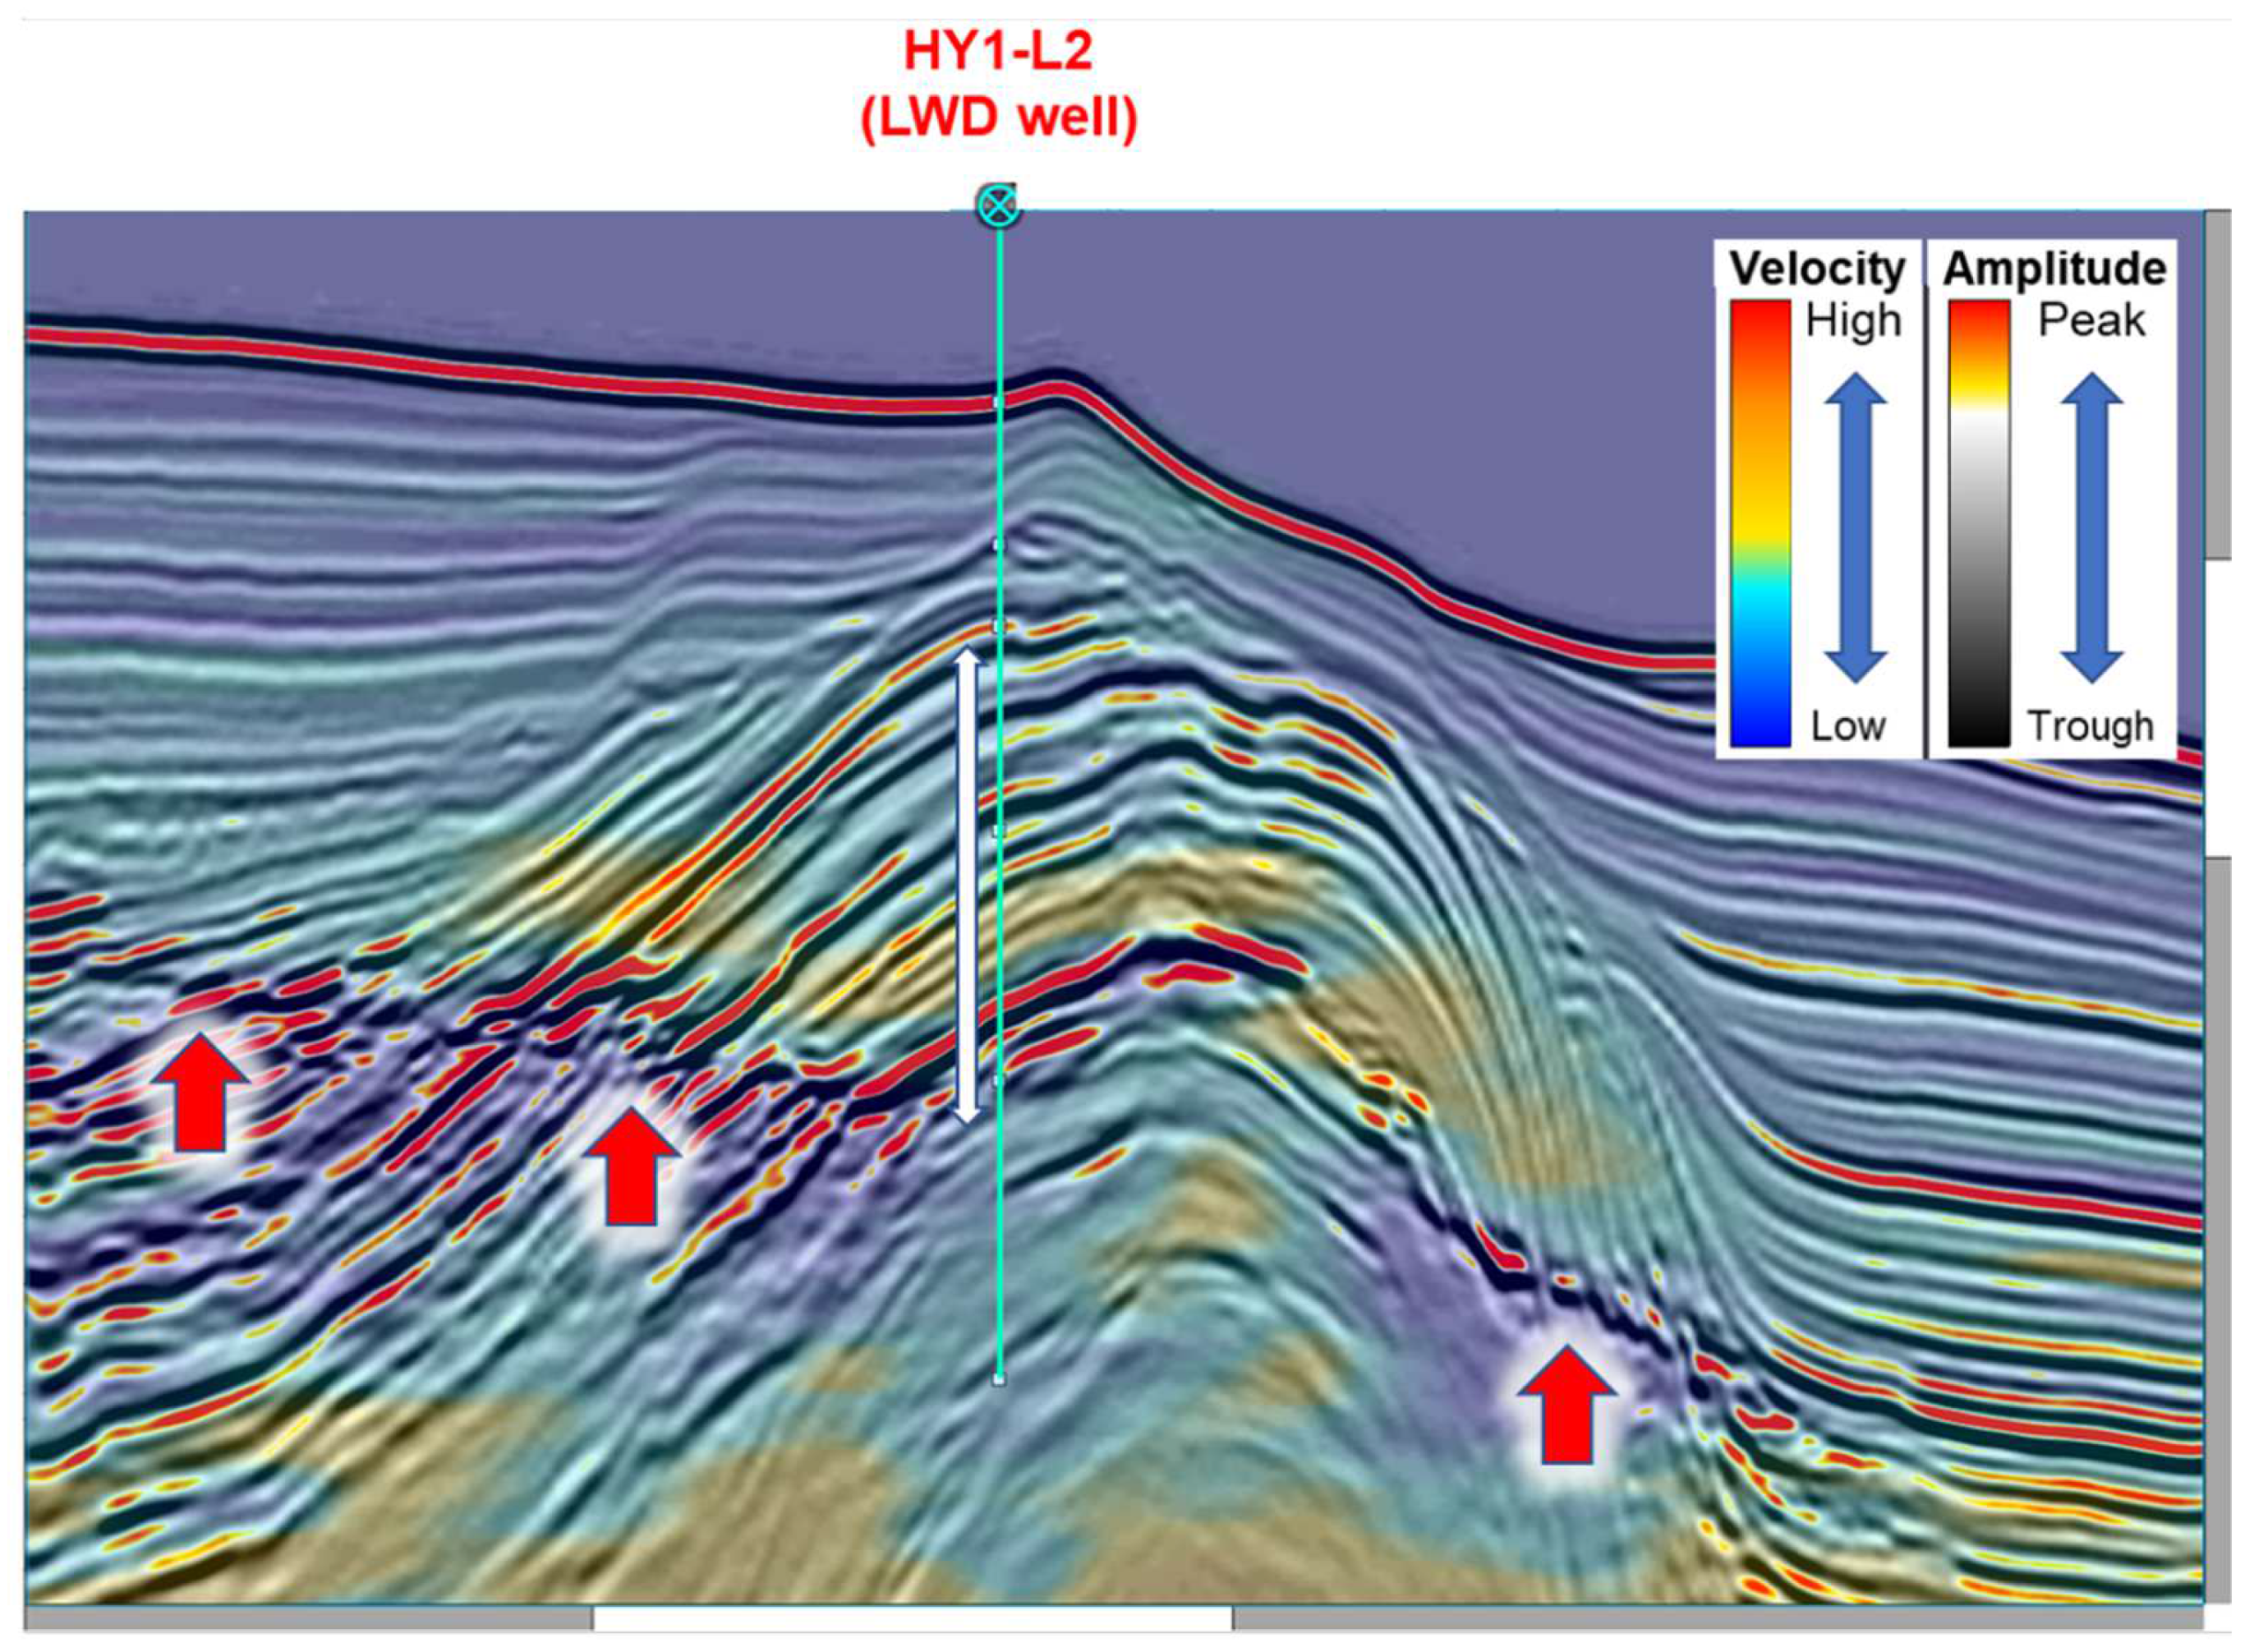
At the HY1-LM1 site, four layers of strong-amplitude reflectors were observed above the BSR (white double-headed arrow in Figure 4). The velocity data also show a high value. We have interpreted these layers as trough-filling turbidite sand layers filled with MH. Above these four layers, a weaker seismic amplitude and a low velocity were observed, indicating the presence of mudstone. In contrast to the planus reflectors at HY1-LM1, an anticlinal structure was observed at the HY1-L2 site. Five strong-amplitude reflectors (white double-headed arrow in Figure 5) and a BSR were interpreted across the anticline (Figure 5). The top of the crest of the anticline with a four-way closure was selected as the drilling site location at the HY1-L2 site. Seismic interpretation revealed that MH-prospected strong-amplitude reflectors at both sites were observed in the upper part of the Miyazaki Group.

5. Selection of Logging Tool

Previous research [18,19,20] has shown that physical properties such as resistivity, sonic logs, density, and porosity are essential to evaluating the properties and resource amount of MH reservoirs. This information is acquired using a logging tool. To decide the logging tool, the tool specifications, measurements, and data quality during the previous drilling campaigns were reviewed. For MH exploration and production tests, several drilling campaigns were carried out in the two decades, such as domestic drilling projects “METI Nankai Trough” and “METI Tokai-oki to Kumano-nada”, which were the first and second offshore MH production tests, respectively, and the Stratigraphic test well (STW) on the long-term onshore MH production test program in Alaska. In all campaigns, SLB’s LWD and wireline tools were used basically. The review results reveal that some minor troubles occurred during the data acquisition of the first production test. Overall, all the logging data were acquired as of the drilling plan, and logging analysis for the formation evaluation of MH deposits was successfully conducted. Thus, we could conduct an appropriate formation evaluation using similar tools to previous logging operations. The tools for LWD data acquisition at the HY1-LM1 and HY1-L2 sites are shown in Table 1.

5.1. Velocity Logging

This tool provides the well seismic velocity, in other words, the checkshot data of the time–depth relationship and the associated average and interval velocities. This relationship is required in seismic-well-tie analysis and time-to-depth conversion. At the MH exploration site, a complex geological structure is expected, considering that many anomalies were found in the 3D seismic data, such as high-velocity anomalies, BSRs, MHCZs, and double BSRs. Therefore, it is difficult to make accurate time-to-depth conversion using only the processing velocity data obtained from 3D seismic survey. Accuracy of correlation between wells is strongly desired in order to understand the lateral distribution of geology of the formation. Consequently, detailed seismic velocity data for LWD wells could be obtained using this logging tool. SeismicVISION by SLB is an example of this tool. This tool was used in the domestic drilling project “METI Tokai-oki to Kumano-nada”.

5.2. Sonic Logging

Sonic, compressional (P wave) velocities, shear wave (S wave) velocities, and stoneley waves usually used detailed hydrate and formation fluid interpretation, seismic inversion, and geophysical analysis. SonicScope by SLB is an example of this tool. SonicScope measures compressional, shear, and stoneley sonic waves. This tool was also used in the STW in Alaska and in the offshore MH production tests. We observed significant P-wave attenuation, slowness, and had difficulty in getting accurate sonic values in the previous logging data. To solve this problem, we performed a special analysis called Leaky-P analysis, which uses sonic leaking slightly from the formation. Leaky compressional mode is a dispersive fluid mode that propagates at formation compressional slowness at low frequencies and mud slowness at high frequencies. In slow formations, estimation of low-frequency asymptote of the leaky mode is one of the common ways to extract formation compressional slowness. Leaky-P wave analysis will provide more accurate formation compressional slowness [21].

5.3. Porosity Logging with Nuclear Magnetic Resonance (NMR) Data and Porosity and Density Logging

Porosity and density are key geophysical properties in calculating MH saturation, effective porosity, and permeability. SLB’s proVISION Plus and NeoScope are examples of these tools. NeoScope uses a pulsed neutron generator (PNG) without any chemical radiation source. Nuclear energy of these emitted neutrons measures porosity, bulk density, natural gamma ray, and elements of formation. Elemental spectroscopy was performed using a short-spaced gamma ray detector. Spectral analysis was performed on the detected gamma values in real time, which provided the results of the formation as dry-weight fractions of quartz, feldspar, mica, clay, calcite, and pyrite. We can make more precise evaluation for geological interpretation if this tool is used in combination with the porosity logging tool with NMR data. This tool is proVISION Plus by SLB. This tool measures traverse longitudinal relaxation time (T2 distribution), bound fluid volume, and free fluid volume. Based on these measurements, accurate permeability evaluation can be made. Therefore, this combination was used in the recent offshore MH drilling campaign.

5.4. Resistivity and Resistivity Image Logging

Resistivity is a prominent electrical property used to interpret the presence of hydrate and amount of MH in combination with other petrophysical properties. To acquire the resistivity logs and images, geoVISION was used in the previous drilling campaigns. For the drilling campaign in the Hyuganada Sea survey area, we selected the high-definition resistivity tool MicroScope, which is a new-generation tool of geoVISION with a higher resolution of sampling rate. We can acquire a higher-resolution resistivity image and evaluate geological properties in detail using this tool. This tool has already been deployed in conventional deep-sea surveys; however, it is used for the first time in hydrate projects in Japan.

6. Results

6.1. LWD Results

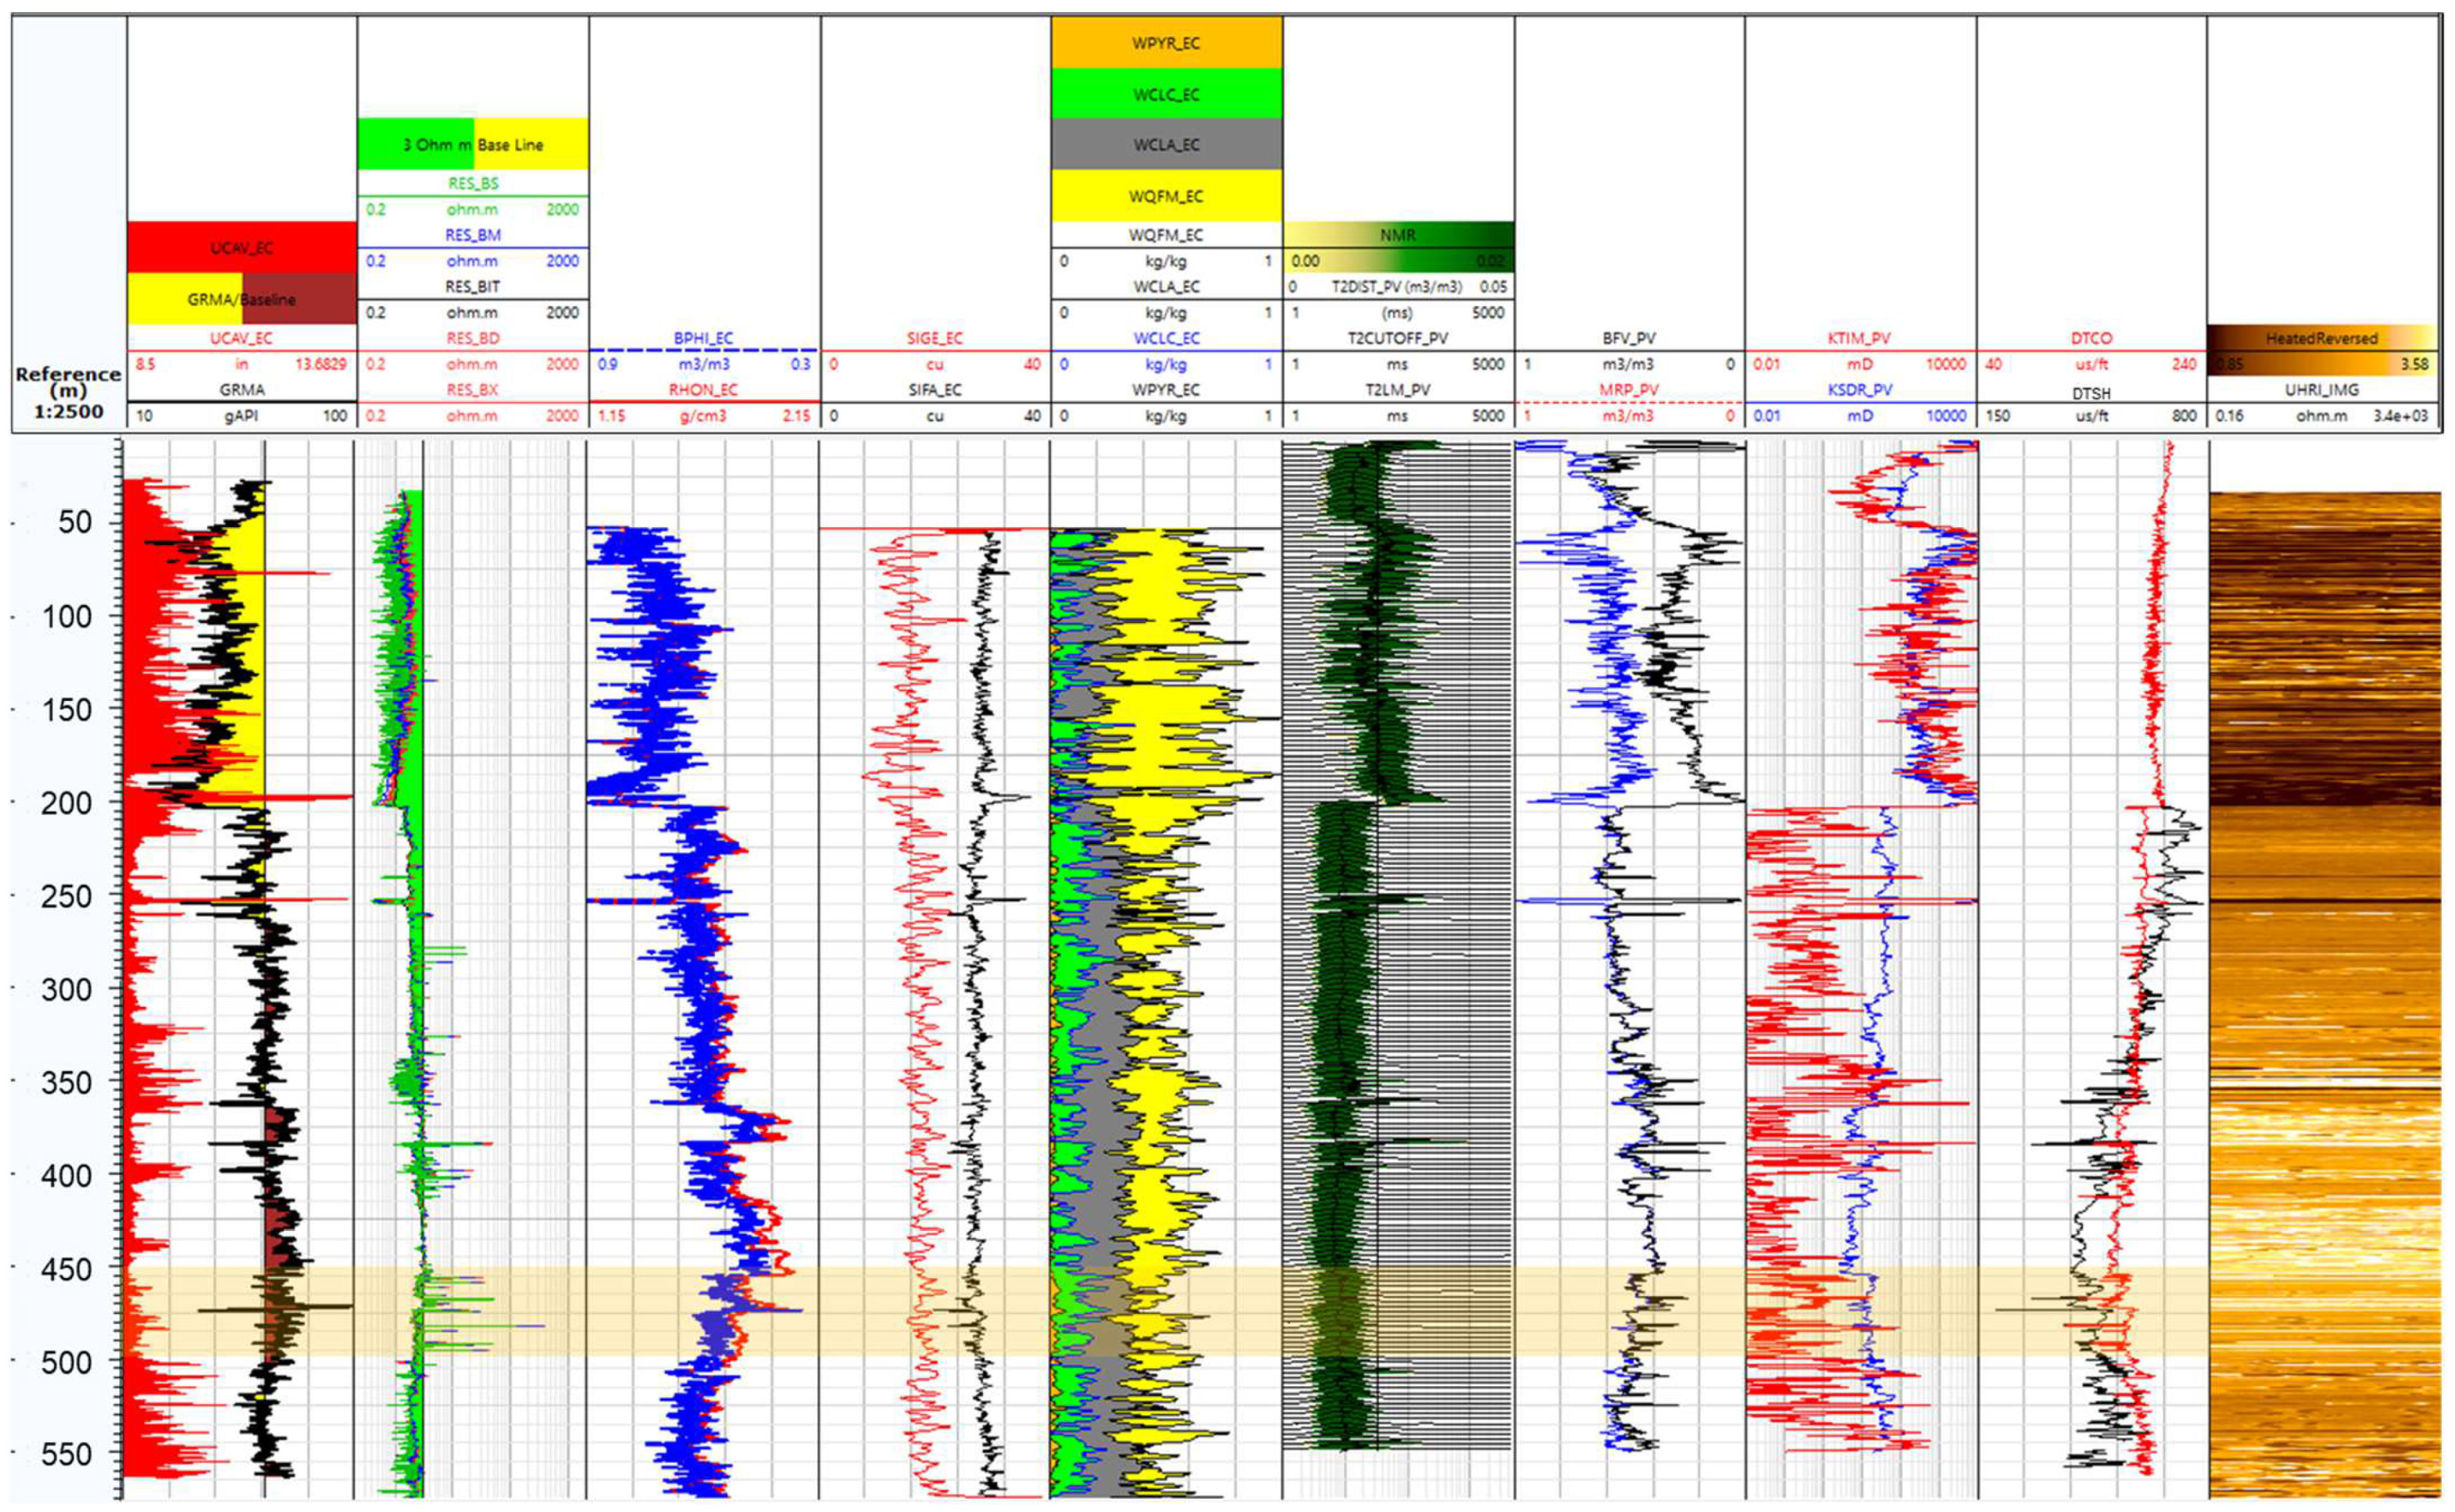
LWD data acquisitions at the HY1-LM1 and HY1-L2 sites were conducted using the selected tools described in the previous section. Fujii et al. [22] determined a sandy layer with a high resistivity of 3 Ω·m or more based on petrophysical logging data and a total net thickness of 10 m or more as criteria for an MHCZ. This cutoff value has been applied in the past in several LWD drilling campaigns conducted in the eastern Nankai Trough. In addition, sand layers with resistivity of 3 Ω-m or more have been sampled with pressure cores to confirm MH bearing [23]. In this project, we also adopted the same criteria. At the HY1-LM1 site, a length from seafloor [0 m below seafloor (mBSF)] to a total depth of 589 mBSF was drilled out, and LWD data were acquired as planned earlier (Figure 6). To make sure of the data quality and have better borehole conditions, the rate of penetration (ROP) was set at 25 m/h from two BHA stands spanning from the interpreted top depth of the MHCZ to the total depth. Figure 6 illustrates the composite log views of the acquired LWD logs. Sharp peaks of deep and extra-deep resistivity log responses (>3 Ω·m) at several depths between 278 and 500 mBSF were observed and interpreted as hydrate-filled layers (Figure 6). These layers were quite thin and sparse and did not have a thickness of 10 m. For these reasons, the MHCZ cannot be identified at the HY1-LM1 drilling site, but hydrate-filled thin layers exist at several depths.
At HY1-L2, a length from seafloor (0 mBSF) to a total depth of 500.5 mBSF was drilled out, and LWD data were acquired (Figure 7). The ROP was the same as that at HY1-LM1. Five strong-amplitude reflectors were interpreted by seismic survey as hydrate-filled prospected layers. However, the drilling results revealed that high resistivity readings (>3 Ω·m) were not recognized in the top three layers. At a depth of 336–376 mBSF, high resistivity readings (>3 Ω·m) were observed from the two bottom reflectors, indicating the presence of MHCZs. The LWD results are shown in Figure 7, and the detailed log response of the MHCZ is illustrated in Figure 8. Low natural gamma ray and high WQFM (weight of quartz, feldspar, and mica) spectroscopy and high resistivity responses reveal that the MHCZ is composed of thick turbidite sand filled with hydrate. In addition, as shown by the red arrows in Figure 8, the NMR porosity is lower and the velocity is higher due to the hydrate at the same depth, which is a good description of the characteristics of the MHCZ.
The rightmost track in Figure 8 is a quick-look interpretation of MH saturation using Archie’s method (1).
S w n = R w / φ m × R t
The MHCZ has an average saturation of 70% and a maximum saturation of up to 95%. Compared with MH saturation at Daini Atsumi Knoll, the MH saturation is expected to be higher. The quality of the MHCZ is considered good enough; hence, the MHCZ can be a candidate for future offshore gas production test sites. For this reason, coring near HY1-L2 was conducted to analyze the geotechnical properties of seafloor and shallow subsurface sediments.
Figure 6. Acquired LWD data at the HY1-LM1 drilling site. Tracks from left to right represent (1) the measured depth (mBSF), (2) natural gamma ray (GRMA) and caliper (UCAV_EC), (3) bit, shallow, medium, deep, and extra-deep resistivity (RES_BIT, BS, BM, BD, and BX), (4) thermal neutron porosity (BPHI_EC) and bulk density (RHON_EC), (5) grain sigma (SIGE) and sigma formation (SIFA_EC), (6) elemental spectroscopy (quartz–feldspar–mica weight fraction: WQFM_EC; clay weight fraction: WCLA_EC; calcite weight fraction: WCLC_EC; pyrite weight fraction: WPYR_EC), (7) NMR T2 distribution, (8) bound fluid volume (BFV_PV) and magnetic resonance porosity (MRP_PV), (9) Timur Coates and Schlumberger Doll Research permeabilities based on the T2 distribution and MRP (KTIM_PV and KSDR_PV), (10) compressional (DTCO) and shear slowness (DTSH), and (11) ultrahigh-resolution resistivity image. The green shading in the resistivity track denotes that the resistivity value is lower than 3 Ω·m. Orange represents the target depth.
Energies 17 03815 g006
Figure 7. Acquired LWD data at the HY1-L2 drilling site. The track is the same as that in Figure 6.
Energies 17 03815 g007
Figure 8. Detailed log response at the HY1-L2 drilling site. The rightmost track is the MH saturation using Archie’s method. In Archie’s method, a = 1, n = 2, and m = 1.8 were applied.
Energies 17 03815 g008

6.2. Geotechnical Core Samples

There are two main objectives for geotechnical core sample acquisition. One is to design a drilling plan for future short-term test wells. Another objective is to evaluate the geomechanical properties of sediments to confirm the stability of wells. As mentioned earlier, MHCZs were confirmed at HY1-L2, so conventional coring was conducted at a location approximately 10 m northwest of HY1-L2. This coring well was named HY1-GT. The coring details are as follows.

6.2.1. Coring Interval

We made a plan to acquire the core samples with a total length of 130 m. These consisted of a continuous 100 m length sample below the seafloor and a 30 m length sample above the top of MHCZs. It is necessary to evaluate the geomechanical properties and assess the foundation strength to installing heavy equipment such as wellhead on the seafloor during production tests, based on the analysis result of a continuous 100 m length sample below the seafloor. Likewise, it is necessary to evaluate the geophysical properties as a sealing layer based on the analysis result of the core samples above the top of MHCZs.
We have used the hydraulic piston coring system (HPCS) and extended shoe coring system (ESCS) for core sampling. The HPCS is usually the first device used to obtain core samples by pushing sampling tube into the soft sediment without drill bit rotation. Relatively good samples on which core liners and sediments were closely contacted have been obtained below the seafloor. On the contrary, the ESCS obtains core samples with drill bit rotation. This device is used where better core recovery and condition are desired from deeper formations, such as consolidated and harder sediments. However, the ESCS may degrade the quality of the core samples, as the rotation of drill bit would induce considerable hydrate dissociation within the thin sand layer. On the basis of these considerations, we decided to use the HPCS below the seafloor and to determine the depth at which to change to the ESCS onboard the ship while observing the advance length. The coring results are shown in Table 2.
Onboard the ship, based on the result of the core recovery and advance length, we decided to perform coring mainly in the mud-dominated layer where the resistivity value is stable (Figure 9). The core recovery rate was low at depths where the resistivity value fluctuated, which could be interpreted as alternating layers of sand and mud. Note that the core intervals in Table 2 are not corrected for flow-in and void gas.
Table 2. Conventional coring well (HY1-GT) location and coring depth. “-” indicates that there is no core data because it is a drill down section.
Run No.TypeTop Depth
[mbsf]
Bottom Depth
[mbsf]
Advance Length
(m)
Core Length
(m)
Core Recovery
(%)
1HPCS0.009.509.509.98105.05
2HPCS9.5018.609.1010.50115.38
3HPCS18.6027.909.3010.96117.85
4HPCS27.9037.109.2010.73116.63
5HPCS37.1038.401.301.2293.85
Drill down without center bit38.4046.50---
6HPCS46.5055.609.1010.49115.27
7HPCS55.6065.009.4010.18108.30
8HPCS65.0068.803.803.2886.32
9HPCS68.8073.104.3010.13235.58
10HPCS78.3082.003.703.73100.81
11HPCS82.1089.507.407.55102.03
Drill down with center bit59.50107.00---
12HPCS107.00111.004.0010.21255.25
Drill down without center bit111.00117.00---
13HPCS117.00123.206.2010.04161.94
Drill down with center bit123.20247.50---
14S-HPCS247.50252.004.505.41120.22
15ESCS252.20260.107.909.62121.77
16S-HPCS260.10264.404.305.44126.51
Drill down with center bit264.40320.40---
17S-HPCS320.40323.403.003.68122.67
18ESCS323.50328.505.009.27185.40

6.2.2. The Geotechnical Core Samples Analysis

The items and purpose of core analysis are listed in Table 3. The main purpose in obtaining geotechnical core samples is to measure the geomechanical properties. These properties will be used to evaluate the foundation strength for installing heavy equipment on the seafloor during short-term flow tests. The obtained core samples will also be analyzed to obtain data that will contribute to reservoir, MH system, and geological evaluation.

7. Discussion

Four indices [18] had been used in the identification of MH prospects from 3D seismic data in the Hyuganada Sea survey area and the selection of the drilling site. Strong positive amplitude reflectors above the BSR were observed in both drilling sites. In terms of MH system, mudstone layers above those reflectors at HY1-LM1 were considered seal formation. Methane gas below the BSR was thought to be migrating through faults in the vicinity of the drilling site. The gas was trapped in those layers and formed MH. Resistivity data responses with sharp high peaks were observed at those reflectors. However, each high-resistivity layer was only a few meters thick. According to the MHCZ criteria in this study, these peaks did not have the required thickness of 10 m. Two reasons for these thin MH layers can be considered. The first reason is that sandy layers themselves are thin at HY1-LM1. Looking at the gamma value of well logging at the same depth, there were many layers with gamma values of 60 or higher, and it is thought that mud deposits were predominant. The second reason is that biogenic methane generation is supposed to be less active compared to that at HY1-L2.
At the HY1-L2 drilling site, an MHCZ thickness of 40 m was confirmed from the resistivity data response corresponding to the two bottom strong-amplitude reflectors, which are distributed across the anticlinal four-way closure. The MHCZ has an average MH saturation of 70% and a maximum saturation up to 95%. Compared with the MH saturation of the MHCZ at Daini Atsumi Knoll in the eastern Nankai Trough, the MH saturation is expected to be higher, the spread of some strong-amplitude reflectors has been interpreted from seismic survey data, and the potential MH resources in this area can be sufficiently expected. All five interpreted reflectors can be sandy layers based on gamma and elemental spectroscopy. Among those, the two bottom reflectors have smaller natural gamma ray values and higher WQFM contents according to elemental spectroscopy (Figure 8). These two bottom reflectors were interpreted as thick sandy layers filled with hydrate and identified as MHCZs at HY1-L2. The WFT operation was also performed at three depths within the MHCZ (see [2] for the details) to obtain mobility, formation pressure, and fracture gradient data. Regarding the top three layers, hydrate deposits cannot be identified because the resistivity readings are lower than 3 Ω·m. It can be considered that the MHCZ is sealing migrated methane gas below the BSR, so the top three layers lack MH due to the lack of methane gas. In Figure 5, the amplitude is stronger and the velocity contrast is clear just over the BSR on the three layers. The difference in hydrate formation between the two sites may be due to the thickness of sandy deposits inferred from the natural gamma ray response and elemental spectroscopy.

8. Conclusions

A preliminary survey with LWD data acquisition was performed at two sites, HY1-LM1 and HY1-L2, of the Hyuganada Sea survey area where seismic responses such as strong-amplitude reflectors, high-velocity anomalies, and BSRs were observed. At HY1-L2, ~40 m of MHCZ thickness was identified with the help of high-resistivity recording (>3 Ω·m). However, at the HY1-LM1 site, thin layers with possible MH concentration were observed and cannot be identified as MHCZs due to the lack of enough thickness. According to Archie’s method, the average MH saturation of the MHCZ at HY1-L2 using the recorded LWD data is ~70% and the average density porosity is 52%. Further detailed analysis of the LWD data will be made in combination with the geotechnical core samples and WFT data.

Author Contributions

All co-authors and S.O. (Shuhei Otomo) contributed with investigation. T.I.; writing—original draft preparation, T.T.A., A.F. and J.Y.; writing—review and editing, S.O. (Satoshi Ohtsuki), K.S. and K.T.; onboard analysis, N.S.; project administration. All authors have read and agreed to the published version of the manuscript.

Funding

This research received no external funding.

Data Availability Statement

No new data were created or analyzed in this study. Data sharing is not applicable to this article.

Acknowledgments

This study was conducted as part of the activities of MH21-S R&D consortium (MH21-S) as planned by the Ministry of Economy, Trade, and Industry (METI), Japan. The authors would like to express their sincere appreciation to MH21-S and METI for providing permission to disclose this study.

Conflicts of Interest

Author Kotaro Tano was employed by Japan Organization for Metals and Energy Security. Authors Takanao Yoshii and Ryugen Sakata were employed by the company Japan Methane Hydrate Operating Co., Ltd. The remaining authors declare that the research was conducted in the absence of any commercial or financial relationships that could be construed as a potential conflict of interest.

Glossary

Since this study includes many abbreviations, table in Glossary summarizes the abbreviations and names.
MH21Research Consortium for Methane Hydrate Resources in Japan
METIMinistry of Economy, Trade, and Industry
JOGMECJapan Organization for Metals and Energy Security
AISTNational Institute of Advanced Industrial Science and Technology
JFYJapanese fiscal year
MHCZsMethane hydrate concentrated zones
MHMethane hydrate
LWDLogging while drilling
WFTWireline formation testing
BSRBottom simulating reflector
P. F. zonePlanktonic foraminiferal fossil zone
WNWWest–northwest
NNWNorth–northwest
STWStratigraphic Test Well
NMRNuclear magnetic resonance
PNGPulsed neutron generator
GRGamma
BHABottom hole assembly
BPHIBest Thermal Neutron Porosity
FFVFormation Fluid Volume
BFVBound Fluid Volume
KTIMPermeability derived using the Timur-Coates model
KSDRPermeability derived using the Schlumberger Doll Research model
T2Transverse relaxation time
mBSFm below seafloor
ROPRate of penetration
WQFMWeight of quartz, feldspar, and mica
GRMANatural gamma ray average
UCAVUltrasonic caliper average
RES_BITBit Resistivity
RES_BSShallow Button Resistivity
RES_BMMedium Button Resistivity
RES_BDDeep Button Resistivity
RES_BXExtra Deep Button Resistivity
RHONBulk Density from Neutron
SIGESigma Matrix from Elements
SIFASigma Formation, Average
WCLADry Weight Clay
WCLCDry Weight Calcite
WPYRDry Weight Pyrite
MRPMagnetic resonance porosity
DTCODelta-T Compressional
DTSHDelta-T Shear Slowness
HPCSHydraulic Piston Coring System
S-HPCSShort Hydraulic Piston Coring System
ESCSExtended Shoe Coring System

References

  1. Aung, T.T.; Tanaka, M.; Fujii, T.; Amo, M. Evaluation of the Methane Hydrate (MH) System; Japan Oil, Gas and Metals National Corporation: Tokyo, Japan, 2017; pp. 165–167. [Google Scholar]
  2. Ohtsuki, S.; Gao, B.; Yoshii, T.; Maehara, Y.; Watanabe, D.; Kannno, T.; Fan, Z. First Successful Wireline Stress Testing in a Gas Hydrate Reservoir in the Hyuganada Sea, Japan. Energies 2024, 17, 2610. [Google Scholar] [CrossRef]
  3. Oda, M.; Chiyonobu, S.; Torii, M.; Otomo, T.; Morimoto, J.; Satou, Y.; Ishikawa, H.; Ashikawa, M.; Tominaga, O. Integrated magnetobiochronology of the Pliocene-Pleistocene Miyazaki succession, southern Kyushu, southwest Japan: Implications for an Early Pleistocene hiatus and defining the base of the Gelasian (P/P boundary type section in Japan). J. Asian Earth Sci. 2011, 40, 84–97. [Google Scholar] [CrossRef]
  4. Kato, T. Stratigraphy of Nichinan Group in southeastern Kyushu, Japan. Contrib. Inst. Geol. Paleontol. Tohoku Univ. 1985, 87, 1–25. [Google Scholar]
  5. Sakai, H. Toi-misaki olistostrome of Southern Belt of the Shimanto Terrane, South Kyushu-1. Reconstruction of depositional environments and stratigraphy before the collapse. J. Geol. Soc. Jpn. 1998, 94, 733–747. [Google Scholar] [CrossRef]
  6. Sakai, H. Origin of the Misaki olistostrome belt and re-examination of the Takachiho orogeny. J. Geol. Soc. Jpn. 1998, 94, 945–961. [Google Scholar] [CrossRef]
  7. Nishi, H. Litho- and biostratigraphy of the Oligocene-Miocene Nichinan Group in Miyazaki prefecture, Kyushu. Mem. Fac. Sci. Kyushu Univ. Ser. D Geol. 1985, 25, 289–317. [Google Scholar] [CrossRef]
  8. Nakamura, Y.; Ozawa, T.; Nobuhara, T. Stratigraphy and molluscan fauna of the upper Miocene to lower Pliocene Miyazaki Group in the Aoshima area, Miyazaki Prefecture, southwest Japan. J. Geol. Soc. Jpn. 1999, 105, 45–60. [Google Scholar] [CrossRef]
  9. Yamaji, A. Slab rollback suggested by latest Miocene to Pliocene forearc stress and migration of volcanic front in southern Kyushu, northern Ryukyu Arc. Tectonophysics 2003, 364, 9–24. [Google Scholar] [CrossRef]
  10. Takashimizu, Y. Ancient submarine-canyon system developed within fore-arc basin fill, Mio-Pliocene “Miyazaki facies”, Miyazaki Group, western Japan. J. Geol. Soc. Jpn. 2009, 115, 559–577. [Google Scholar] [CrossRef]
  11. Saito, M.; Sakaguchi, K.; Komazawa, M. Miyazaki, Geological Map of Japan 1:200,000; Geological Survey of Japan: Tsukuba, Japan, 1997. [Google Scholar]
  12. Iwatani, H.; Iritsuki, T. Geology and fossil ostracode assemblages from the Pliocene Miyazaki Group in the northern part of the Miyazaki Plain, Southwest Japan. Fossils 2008, 84, 61–73. [Google Scholar]
  13. Suzuki, H. Stratigraphy of the Miyazaki Group in the southeastern part of Miyazaki Prefecture, Kyushu, Japan. Contrib. Inst. Geol. Paleontol. Tohoku Univ. 1987, 90, 1–24. [Google Scholar]
  14. Torii, M.; Oda, M.; Itaya, T. K–Ar dating of tuff beds intercalated in the Miyazaki Group, Kyushu, Japan. Bull. Volcanol. Soc. Jpn. 2000, 45, 131–148. [Google Scholar]
  15. Torii, M.; Oda, M. Correlation of the Izaku Pyroclastic Flow Deposit in Kagoshima Prefecture with tuff bed intercalated in the Miyazaki Group: The eruption age of the Izaku-Hisamine tephra based on integrated stratigraphy of the Miyazaki Group and its significance. J. Geol. Soc. Jpn. 2001, 107, 379–391. [Google Scholar] [CrossRef]
  16. Iwatani, H.; Murai, K.; Irizuki, T.; Hayashi, H.; Tanaka, Y. Discovery of the oldest fossil of Argonauta hians in Japan, from the middle Pliocene Sadowara formation, southwest Japan, and its depositional age. J. Geol. Soc. Jpn. 2009, 115, 48–551. [Google Scholar] [CrossRef]
  17. Chunlian, L.; Yi, H.; Jie, W.; Guoquan, Q.; Tingting, Y.; Lianze, X.; Suqing, Z.; Yuan, W.; Min, L. Miocene-Pliocene planktonic foraminiferal biostratigraphy of the Pearl River Mouth Basin, northern South China Sea. J. Palaeogeogr. 2012, 1, 43–56. [Google Scholar]
  18. Saeki, T.; Fujii, T.; Inamori, T.; Kobayashi, T.; Hayashi, M.; Nagakubo, S.; Takano, O. Extraction of methane hydrate concentrated zone for resource assessment in the eastern Nankai Trough, Japan. In Proceedings of the Offshore Technology Conference, Houston, TX, USA, 5 May 2008; p. OTC-19311. [Google Scholar]
  19. Collett, T.S.; Boswell, R.; Kumar, P.; Roy, S.K.; Chopra, K.; Singh, S.K.; Yamada, Y.; Tenma, N.; Pohlman, J.; Zyrianova, M. India national gas hydrate program expedition 02 summary of scientific results: Gas hydrate systems along the eastern continental margin of India. Mar. Pet. Geol. 2019, 108, 39–142. [Google Scholar] [CrossRef]
  20. Shankar, U.; Kumar, P.Y.; Devi, S.; Singh, U.U. Gas hydrate saturation from NGHP 02 LWD data in the Mahanadi Basin. Energy Geosci. 2024, 5, 100218. [Google Scholar] [CrossRef]
  21. Izuhara, W.; Kinoshita, T.; Yamamoto, H. Dispersion characteristics of leaky compressional mode with LWD sonic tool. In Proceedings of the SPWLA 19th Formation Evaluation Symposium of Japan, Chiba, Japan, 26–27 September 2013. [Google Scholar]
  22. Fujii, T.; Nakazimu, M.; Tsuji, Y.; Namikawa, T.; Okui, T.; Kawasaki, M.; Ochiai, K.; Nishimura, M.; Takano, O. Methane-hydrate occurrence and saturation confirmed from core samples, eastern Nankai Trough, Japan. AAPG Memoir 2009, 89, 385–400. [Google Scholar]
  23. Naito, K.; Aung, T.T.; Suzuki, K.; Fujii, T.; Yoneda, J.; Yamamoto, K. Additional data acquisition after second offshore gas production test, eastern Nankai Trough, Japan. In Proceedings of the SPWLA 28th Formation Evaluation Symposium of Japan, Chiba, Japan, 13–14 September 2023. [Google Scholar]
Figure 2. General tectonic setting and location map of the Hyuganada sea survey area. The left shows an enlarged view of the framed places.
Energies 17 03815 g002
Figure 4. Interpreted four strong-amplitude reflectors indicated by the white double-headed arrow, BSR (above the red arrows), and high-velocity anomaly at the HY1-LM1 drilling site.
Energies 17 03815 g004
Figure 5. Interpreted strong-amplitude reflectors indicated by the white double-headed arrow, BSR (above the red arrows), and high-velocity anomaly at the HY1-L2 drilling site.
Energies 17 03815 g005
Figure 9. Conventional coring well (HY1-GT) location and coring depth.
Energies 17 03815 g009
Table 1. List of logging tools.
Logging ToolTool Name
(as of SLB)
Memory Data
Resistivity and Resistivity Image LoggingMicroScope
  • Average Total Gamma-Ray
  • Laterolog resistivity
  • Laterolog resistivity image
Porosity and density loggingNeoScope
  • Average Source-less Neutron Gamma Bulk Density
  • BPHI (Neutron Porosity)
  • Ultrasonic caliper
  • Anulus pressure/Anulus temperature
  • Spectroscopy
  • Formation Sigma
  • Gamma Ray
  • Propagation resistivity
Sonic loggingSonicScope
  • Monopole Compressional Slowness
  • Monopole Shear Slowness
  • Quadrupole Shear Slowness
  • Monopole High Frequency Waveform
  • Monopole Low Frequency Waveform
  • Quadrupole Waveform
  • Monopole Compressional Slowness (Leaky-P)
Velocity loggingSeismicVISION
  • Time-depth relationship, checkshot
Porosity logging with nuclear magnetic resonance dataproVISION Plus
  • NMR standard porosity (total porosity, FFV, BFV)
  • NMR standard permeability (KTIM, KSDR)
  • NMR T2 distribution, X/Y(R) echo train
Table 3. Core analysis items and purposes.
Core Analysis ItemsParameters to Be AnalyzePurposes
Geomechanical TestsUndrained shear strength,
Compaction, etc.
Geomechanical properties
Anelastic Strain Recovery3 dimensional in-situ stressesGeomechanical properties
Reservoir evaluation
PaleomagnetismMagnetic inclination
Anisotropy of magnetic susceptibility
Remanent magnetization
Geomechanical properties
Reservoir evaluation
Geological interpretation
Penetration testPenetration strengthGeomechanical properties
Reservoir evaluation
Vane shear testShear strengthGeomechanical properties
Reservoir evaluation
Gas analysisGas composition
Gas volume
Carbon isotopes of methane
Operational Risk Assessment
Geological interpretation
Reservoir evaluation
MH system
Interstitial water analysispH meter, Salinity,
Alkalinity, Chlorinity, etc.
Reservoir evaluation
MH system
Xray-CTSediment structureGeological interpretation
Reservoir evaluation
Multi sensor core logger Gamma, Density, P-wave velocity
Magnetic susceptibility
Reservoir evaluation
MH system
Core descriptionSediment structure, lithology, etc.Geological interpretation
Reservoir evaluation
MH system
Xray diffractionQuantitative analysis of mineralsGeophysical properties
Reservoir evaluation
MH system
Particle size analysisParticle size distributionReservoir evaluation
Geological interpretation
Bulk and Grain densityDensityGeophysical properties
Reservoir evaluation
Thermal conductivityThermal conductivityReservoir evaluation
MicrofossilGeological age, paleoenvironmentGeological interpretation
MH system
Disclaimer/Publisher’s Note: The statements, opinions and data contained in all publications are solely those of the individual author(s) and contributor(s) and not of MDPI and/or the editor(s). MDPI and/or the editor(s) disclaim responsibility for any injury to people or property resulting from any ideas, methods, instructions or products referred to in the content.