Abstract
In order to enhance the efficiency, extend the service life, and minimize hydrogen consumption of the fuel cell hybrid power system (FCHPS), an adaptive power allocation method considering stack operation performance is proposed. The method utilizes the minimum instantaneous optimization of equivalent hydrogen consumption to achieve power distribution between fuel cells and lithium batteries. Additionally, a power adaptive allocation method is proposed to address performance inconsistencies in PEMFC systems, effectively reducing operating pressure for improved service life and overall system efficiency. This approach ensures stable and efficient operation of high-power vehicle fuel cell hybrid power systems.
1. Introduction
With the rapid development of the national economy, fossil energy is increasingly depleted and environmental pollution is increasingly severe, so the development and utilization of new energy has become one of the hot topics of research [1]. Especially in recent years, with the rapid development of China, new energy has received more widespread attention. Among them, hydrogen energy is considered as the ultimate energy of mankind in the future because it has a wide source, is clean and renewable, has a high calorific value, is pollution-free, and has other outstanding advantages [2]. As a transpose that converts chemical energy into electric energy, fuel cell has been extensively studied by domestic and foreign scholars due to its high power generation efficiency and friendly reaction products, which are not limited by the Carnot cycle [3].
At present, the main issues affecting the large-scale commercial application of PEMFC are cost and longevity [4,5]. Due to the limitations of technology and materials, this leads to disadvantages such as high price and short life [6]. When PEMFC is mass-produced, the cost can be reduced a lot, so the cost problem of PEMFC can be solved to a certain extent. However, in order for PEMFC to meet the commercial needs, the life of PEMFC needs to meet certain conditions. When used as a power source, the minimum life of PEMFC is 5000 h (New European Drive Cycle 2015 target), and when used for distributed generation, the life needs to reach at least 40,000 h (United States Department of Energy (DOE) 2011 target) [7]. Therefore, improving the life span of PEMFC is the key to achieving large-scale commercial application of PEMFC [8]. Besides the above-mentioned issues, the degradation is also hard to predict, which also makes it difficult in terms of prognosis and health management. Hence, improving the accuracy of PEMFC attenuation prediction and being able to predict the accelerated attenuation of fuel cell performance have positive significance for health management. In order to solve these problems, people often use a multi-pile fuel cell hybrid power system to meet the demand for high power. The multi-stack fuel cell hybrid power system is dominated by fuel cells, supplemented by power batteries or supercapacitors. At the same time, the fuel cell system is composed of several low-power fuel cells, which reduces the power level of the fuel cell, avoids the insufficient durability of the fuel cell, and enhances the stability of the system [9,10].
In order to improve system efficiency, reduce system hydrogen consumption, and prolong system life, it is necessary to study the durability of fuel cells. Based on the strategy of minimum equivalent hydrogen consumption, Qiu Junzheng added a load-limiting strategy and start–stop control strategy to realize the restriction of instantaneous power fluctuation of fuel cell output and the control of fuel cell opening and closing [11]. The moving average filter based on fuzzy control and switch control by Zhao Yong conforms to the energy management strategy to effectively avoid battery start and stop, as well as continuous low load and idle speed, alongside reducing the working conditions that cause battery attenuation under the condition of ensuring battery safety [12]. Lin Xinyou used a voltage feedback optimization control strategy to control the output voltage in response to the severe loading and unloading of fuel cells, so as to slow down the overall voltage attenuation of fuel cells [13]. In a hybrid power system, the operating performance of each fuel cell is not consistent, and the better the performance, the slower the aging rate. On the contrary, a fuel cell in a poor performance state for a long time will accelerate its degradation. Considering the consistent performance of multiple piles, a poor fuel cell will reduce the efficiency of the entire system, so it is necessary to adjust the output power according to the fuel cell operating state.
In this paper, an adaptive power allocation method for fuel cell hybrid power systems considering stack performance is proposed. The method is based on the equivalent hydrogen consumption minimum energy management strategy and the power adaptive allocation method of reactor operation performance. The minimum energy management strategy of equivalent hydrogen consumption was adopted to realize the power distribution of fuel cell and power battery. Based on the adaptive power distribution method, the power distribution of the stack is realized, and the running performance of each stack is evaluated, so that the fuel cell with poor performance can bear less output power. In order to verify the feasibility and effectiveness of the proposed method, a multi-stack fuel cell hybrid power generation system consisting of four 100 kW class PEMFC, one lithium battery, four unidirectional DC/DC converters, one bidirectional DC/DC converter, and a control system was constructed in this paper. The actual operating conditions of urban EMU were used as training conditions, and the RT-BOX hardware in the loop (HIL) simulation platform was used to compare the proposed method with the power step-by-step strategy and the power average distribution strategy to verify the superiority of the proposed method.
2. Fuel Cell Hybrid Power System
The structure of FCHPS established in this paper is shown in Figure 1. The system uses fuel cell as the main power supply to provide the main power for the system and meet the load power demand. Due to the soft output characteristics of fuel cells, the voltage at both ends will fluctuate greatly when the output power changes, so it is usually necessary to connect DC/DC converters in practical applications. The lithium battery is connected to the bus by a bi-directional DC/DC converter to recover braking energy, provide peak power, and maintain bus voltage stability. The hybrid fuel cell and lithium battery system can meet the fast power requirements of the load.
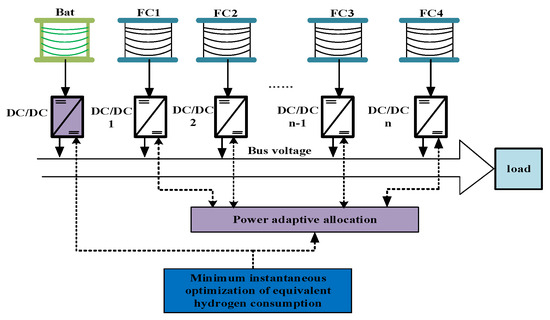
Figure 1.
Hybrid power system topology.
2.1. Polarization Characteristic Curve of PEMFC
This study mainly considers the influence of fuel cell operation performance on a multi-pile fuel cell power generation system. In order to test the effect of this method, this paper used commercial air-cooled PEMFC of Weishi English Technology Co., Ltd. (Baoding, China). which was represented by FC.1, FC.2, FC.3, and FC.4. The four fuel cells were of the same model, FC.1, FC.2, FC.3, and FC.4, with different degrees of aging. The main parameters of the fuel cell used in this study are shown in Table 1, and the polarization characteristic curve is shown in Figure 2.

Table 1.
The individual parameters of the fuel cell.
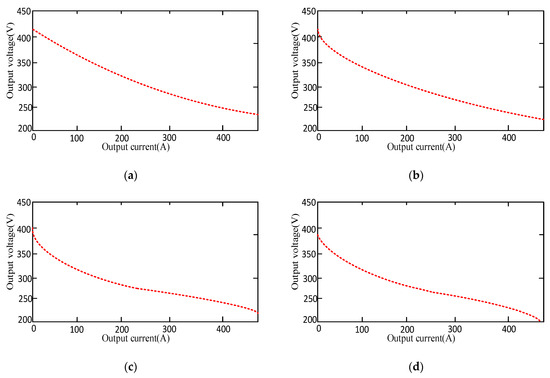
Figure 2.
Polarization characteristic curve of PEMFC. (a) FC1 polarization characteristic curve; (b) FC2 polarization characteristic curve; (c) FC3 polarization characteristic curve; (d) FC4 polarization characteristic curve.
2.2. Charge and Discharge Characteristics of Lithium Titanate Batteries
Because of the slow dynamic response characteristic of fuel cells, they are usually used in practical use with energy storage systems. In this paper, the power battery was used to meet the rapidly changing power demand of the load, recover the braking energy, and maintain the bus voltage. The use of power batteries in fuel cell systems helps to improve system response speed, optimize system efficiency, and extend service life. The parameters of the lithium titanate battery are shown in Table 2. Figure 3 shows the comparison between the simulation results of the module and the actual charging and discharging data of the lithium battery. It can be seen from the figure that the simulation data and the experimental data were in good agreement, and the average error was 0.08%, indicating that the model can simulate the charging characteristics of the lithium titanate battery well.

Table 2.
The individual parameters of the lithium titanate battery.
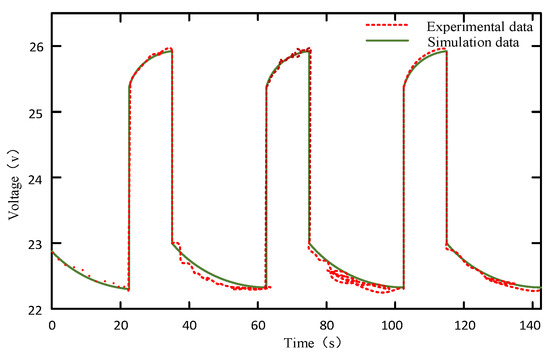
Figure 3.
Charge and discharge characteristics of lithium titanate batteries.
3. Minimum Instantaneous Optimization of Equivalent Hydrogen Consumption
In the fuel cell hybrid power system, many methods have been proposed to allocate system energy, such as fuzzy control [14], approximate minimum principle [15], and model predictive control [16]. L. M. Fernandez et al. proposed a state-based adaptive control energy management strategy. Pablo Garcia et al. proposed an energy management strategy based on state and cascade control [17,18]. Long Rong proposed an energy management strategy based on multi-mode passive control based on vehicle multi-module fuel cells [19]. Yin Zhangwen et al., taking on board ultracapacitors and fuel cells as objects, proposed an energy management strategy for a hybrid power source system composed of multi-module fuel cells and ultracapacitors in parallel based on mode partitioning [20]. In order to improve the average efficiency of the fuel cell hybrid power system for trams, as well as reduce hydrogen consumption and maintain the charged state of the lithium battery system, Li Qi et al. proposed a dual-mode energy management method of the hybrid power system that considered the optimization of the fuel cell efficiency interval [21]. Hong Zhihu et al. proposed an energy management strategy of the fuel cell hybrid power system for locomotives based on the Pontryagin minimum principle (PMP) according to actual hardware system parameters and locomotive working conditions. This energy management strategy can better maintain the SOC of the battery pack according to the actual requirements of the locomotive [22].
In this paper, the equivalent hydrogen consumption minimum instantaneous optimization method was adopted, and the electric energy consumed by the lithium battery was converted into hydrogen consumption, so that it is comparable with the hydrogen consumption of the fuel cell. By controlling the relationship between the output power of the fuel cell and the vehicle demand power, the hydrogen consumption of the system in the unit control period was minimized, so as to obtain the optimal economic performance.
The instantaneous hydrogen optimization problem in fuel cell hybrid powertrain systems involves controlling the output power of the fuel cell and lithium battery to minimize the total hydrogen consumption of the hybrid powertrain system, as shown in Equation (1).
In the equation, Ubatmin and Ubatmax represent the minimum and maximum values of the lithium battery voltage, respectively. Pfcmax denotes the maximum output power of the fuel cell. sh and sl are the upper and lower limits of the state of charge (SOC), respectively. k is a correction factor, and its expression is as follows:
In the equation, μ represents the SOC balance coefficient.
Cfc represents the instantaneous hydrogen consumption of the fuel cell, which is a function of the fuel cell output power. The relationship between them can be equivalently linear, as shown in Equation (3).
In the equation, Cbat represents the instantaneous hydrogen consumption of the lithium battery, which can be calculated according to the following formula:
In the equation, Pbat is the power of lithium battery; and are the average charge and discharge efficiency of the lithium battery, respectively; Pfc_avg and Cfc_avg are the average power and average instantaneous hydrogen consumption of the fuel cell, respectively; and are the charge and discharge efficiency of the lithium battery, respectively, which are functions of SOC.
In the equation, Rdis and Rchg represent the internal resistance of a lithium battery during discharging and charging, respectively, and can be regarded as constants. We made the following definitions:
Substituting Equations (2) and (4)–(6) into Equation (1) and further simplifying, we obtained the analytical solution for solving the instantaneous optimization problem, as shown in Equation (7).
The expression for the fuel cell output power is as follows:
When the parameter μ is a constant, the constraint capability for the initial and final states of the lithium battery SOC is relatively poor. To improve the constraint capability for the lithium battery SOC, μ needs to be adjusted in real-time based on the lithium battery’s output power and SOC, as shown in Equation (9).
4. Adaptive Power Allocation Considering the Operating Performance of the Stack
At present, there are few studies on MFCS, and most of them are aimed at optimizing a certain index (such as efficiency, hydrogen consumption) in the system [23]. Based on the energy management strategy based on filtering, Hu Shuai et al. used a finite state machine to control the adaptive change of filtering frequency to ensure the optimal power distribution under actual operating conditions [24]. In order to optimize MFCS output efficiency and reduce hydrogen consumption, Wei Dong et al. proposed a constrained optimization algorithm based on Karush–Kuhn–Tucker (KKT) conditions [25]. Zhu Yanan et al. focused on the MFCS operating characteristics under the parallel topology, aiming at the shortcomings of fuel cells such as limited output power. A coordinated and optimized control method for multi-stack fuel cell system efficiency based on adaptive power allocation is proposed to optimize the overall efficiency of the system with reasonable power allocation and ensure the efficient and stable operation of MFCS for high-power vehicles [26].
However, the above studies use the same performance of the pile, and they do not consider the difference in the performance of the pile. If the performance difference between monomers is too large, the performance of the fuel cell will be constrained by the monomer in the worst state, that is, the barrel effect. Similarly, for multiple reactors, the performance of each single reactor will affect the performance of the entire fuel cell system, and the overall system performance will be affected by the worst performing single reactor. In order to improve the overall performance and service life of the multi-pile fuel cell system as much as possible, this paper adopted a power adaptive allocation method for the real-time operation performance of the stack, which includes offline data acquisition, single-pile efficiency curve fitting, relative life loss calculation, pile startup control, multi-pile efficiency curve fitting, power allocation, control quantity calculation, and PWM modulation. First, the characteristic curve of single-pile PEMFC system efficiency changing with transmission power was obtained through offline data acquisition. Then, the control system collected the output current of each branch and the bus voltage of the PEMFC system to calculate the relative life loss of the stack. The starting sequence of the stack is determined, the characteristic curve of the efficiency of the multi-stack PEMFC system with the change of transmission power is obtained, and the turning output power is obtained. Finally, the pulse control signal of PEMFC system is generated by PWM control quantity to realize the system control. Figure 4 shows the power generation control structure of the multi-pile fuel cell system.
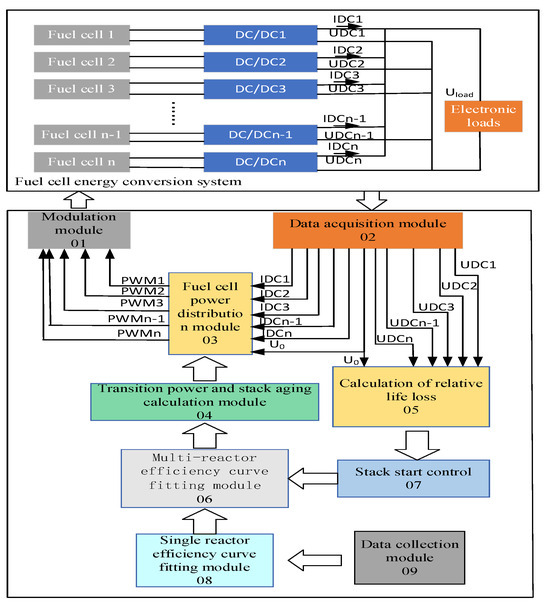
Figure 4.
Schematic diagram of multi-reactor PEMFC power generation structure.
4.1. Single Pile Efficiency Curve Fitting
The least squares polynomial fitting method is used to fit the efficiency and output power data of single-reactor PEMFC to obtain the corresponding function, which is convenient for the analysis and calculation of a multi-reactor PEMF system. The efficiency of a single-reactor PEMFC system varies as a function of output power as follows:
where f(p) is the efficiency curve of the KTH reactor with the output power, and Formula (10) represents the relationship between the efficiency of each reactor and the output power; a, b, c, and d are the fitted parameters.
The coefficients a, b, c, and d corresponding to Equation (10) can be constrained to minimize the sum of squared deviations between the collected points and the fitted curve, as shown in Equations (11) and (12):
Equation (11) can be further expressed as
With the increase in output power, the efficiency of a single PEMFC system first reaches the maximum efficiency point , where the output power is , and then the efficiency decreases with the increase in output power until the output power reaches the maximum. In this paper, four fuel cells with different output characteristics were used to prove that the system can be used for fuel cells with different models and different lives. When the fuel cell fails, the replacement of a new fuel cell does not affect the normal operation of the system. The data points collected by the output power are shown in Figure 5a, Figure 6a, Figure 7a, Figure 8a. The least square polynomial fitting method is used to perform function fitting on the continuous output power points, and the function of the efficiency of the single-reactor PEMFC system changing with the output power is obtained. The fitting curves are shown in Figure 5b, Figure 6b, Figure 7b, Figure 8b.
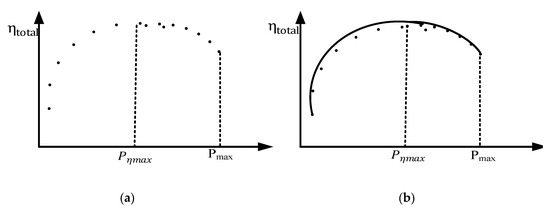
Figure 5.
FC1 efficiency curve characteristics. (a) FC1 efficiency data point collection; (b) curve fitting for FC1 efficiency data.
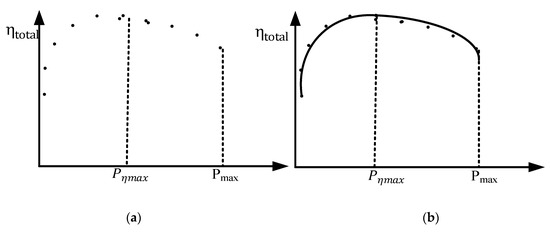
Figure 6.
FC2 efficiency curve characteristics. (a) FC2 efficiency data points collection; (b) curve fitting for FC2 efficiency data.
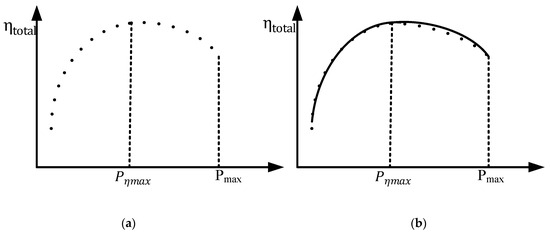
Figure 7.
FC3 efficiency curve characteristics. (a) FC3 efficiency data points collection; (b) curve fitting for FC3 efficiency data.
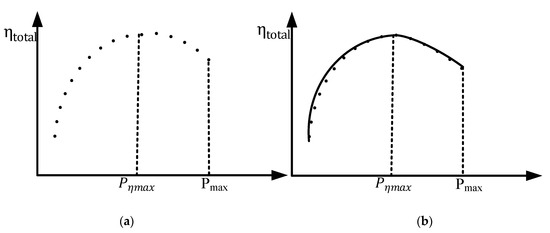
Figure 8.
FC4 efficiency curve characteristics. (a) FC4 efficiency data point collection; (b) curve fitting for FC4 efficiency data.
4.2. Calculation of Relative Life Loss
Due to the wooden barrel effect caused by performance inconsistency between PEMFC systems, in order to effectively reduce the operating pressure of PEMFC systems with insufficient output capacity or poor performance, so as to improve their service life and overall system efficiency, the relative life loss is considered as an indicator to qualitatively measure the superior performance of fuel cells. The greater the output, the greater the power to be borne. In actual cycle operation conditions, fuel cells usually have four operating states [27]: (1) start/stop; (2) low power; (3) high power; (4) add/unload. The low-power state means that the fuel cell power is less than or equal to 10% of the rated power 20%; the high-power state refers to the fuel cell power being greater than or equal to 80% of its rated power. Each operating state causes different degrees of performance attenuation to the fuel cell. Studies have shown that starting/stopping and loading/unloading are the main factors causing fuel cell performance attenuation, accounting for 33% and 56.5% of the attenuation rate, respectively, while low-power and high-power operations only account for 4.7% and 5.8% of the attenuation rate, respectively [28]. For a given fuel cell, the single-chip voltage decay rate under each working condition can be obtained through long-term tests [29]. The single-chip voltage attenuation rate tested in the literature [29] is shown in Table 3.

Table 3.
The single-cell voltage decay rate of PEMFC.
Assuming that the stack voltage has good consistency and the voltage difference between individual cells is small, after operating for a certain period of time, the voltage decay of the fuel cell, denoted as , can be calculated as follows:
In the equation, N represents the number of individual fuel cells, and , , , represent the average voltage decay rates during high-power operation, low power operation, startup/shutdown, and load change, respectively. th and t1 represent the duration of high power and low power operation, nss represents the number of startup/shutdown cycles, and represents the rate of change of stack output power. Under rated current, when the voltage of a single fuel cell decreases to 80% of the rated voltage, the fuel cell reaches its end of life. Therefore, the relative life loss of the fuel cell, denoted as Lfc, is defined as
where Vfc,rate is the rated voltage of the stack, and kfc is an amplification factor used to amplify the decay voltage for comparison purposes. When the amplification factor kfc is set to 1, the range of values for the life loss Lfc is between 0 and 1. When the fuel cell is initially put into use, the life loss Lfc is 0; when the fuel cell reaches its end of life, the life loss Lfc is 1.
The relative life loss of each reactor is calculated, and the starting sequence of the reactor is obtained by comparing the relative life loss of the reactor. The performance of the reactor with small life loss is better, and the priority is to start. In the event of a fault, the relative life loss of the stack is calculated to be zero, and the stack is not started. Reasonably distributing the power of the remaining stack improves the life of the system.
4.3. Multi-Reactor Efficiency Curve Fitting
The relationship between the overall efficiency of the PEMFC power generation system and the load is constrained by Equation (15):
We constructed the Lagrangian function, such that
Therefore, we have
When P1 = P2 = ⋯ = Pn = Pload/n, f(all) obtains a set of optimal solutions, that is, when the number of activated stacks is determined and the real-time output power of each stack is equal, the overall system efficiency is optimal.
For changes in the power demand of high-power vehicles, it is necessary to consider whether to add new branches to provide increased power, that is, to determine which stacks to start in real time. The order of starting stack is determined by the relative life loss, and the transition power diagram of the whole efficiency of starting stack system is obtained. When the starting efficiency of k + 1 low-aging reactor system is equal to the starting efficiency of k low-aging reactor system, the output power corresponding to the equivalent efficiency point is Ptk. When the power Pfc needed to be emitted by the fuel cell pack is greater than the transition power Ptk, a pile branch with low aging degree is added to supply the increased power. When Pfc is less than the transition power Ptk., Pfc is shared by the first k stacks with low aging degree. The efficiency of starting up different stacks is shown in Figure 9. In real time, the system can automatically identify and start several stacks according to the power required by the fuel cell pack and the aging condition of the stacks, thus obtaining the corresponding turning power points.
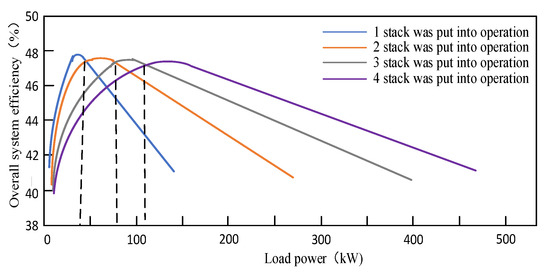
Figure 9.
Transition power diagram.
4.4. Adaptive Power Allocation
The turning point output power is obtained by fitting the multi-reactor efficiency curve, and the overall efficiency of the first k + 1 fuel cell system with low life aging degree is compared with that of the first k + 1 fuel cell system with low life aging degree, which is obtained in real time to obtain the maximum efficiency and determine which reactors to start. When the power Pfc needed to be emitted by the fuel cell pack is greater than the transition power Ptk, a pile branch with low aging degree is added to supply the increased power. When Pfc is less than the transition power Ptk, Pfc is shared by the first k stacks with low aging degree. The power of all reactors is distributed adaptively, and the output power of the reactors that are not started is zero. Figure 10a shows the schematic diagram of adaptive power distribution.
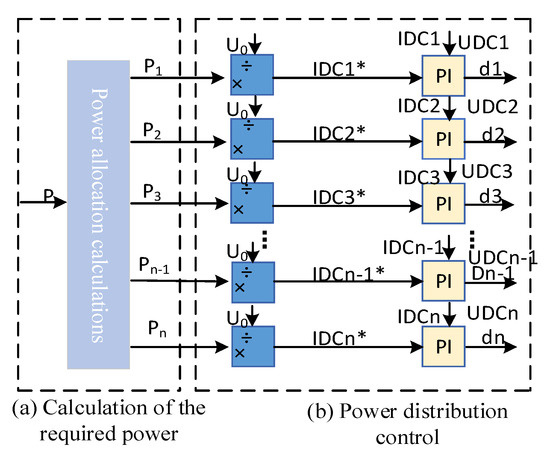
Figure 10.
Fuel cell power distribution diagram.
4.5. Control Quantity Calculation and PWM Modulation
The PWM signal generation module is illustrated in Figure 10b. Based on the power allocation, the real-time output power values (P1, P2, ⋯, Pn) of each PEMFC branch are obtained. Firstly, these power values are divided by the bus voltage to obtain the required output current values (IDC1*, IDC2*, ⋯, IDCn*) for each module. Then, combining with the actual output current of each branch, the control quantity (d1, d2, ⋯, dn) needed for each branch is obtained through a PI controller. The PWM control quantity is then converted into switch control signals to achieve power allocation control for a multi-stack PEMFC system, optimizing the overall system efficiency.
5. Analysis of RT-BOX Real-Time Simulation Platform Test Results
RT-BOX is a real-time simulator that enables rapid simulation of engineering processes. It first converts mathematical models developed in Matlab/Simulink into PLECS models, which are then utilized for real-time simulation, control, and testing through the RT-Box platform. In this testing setup, the control program is written using CODESYS V3.5 SP7 software and burned into the controller. The PLECS program is burned into the RT-Box. The controller and RT-Box are connected via CAN communication to facilitate model simulation, user interaction, and testing of experimental results. Figure 11 depicts the constructed RT-Box semi-physical simulation testing platform.
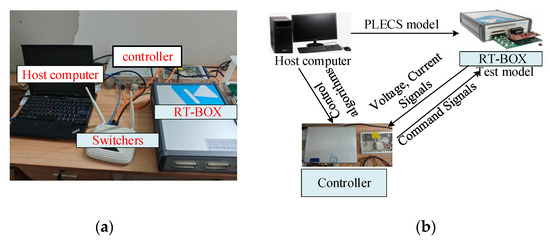
Figure 11.
Established RT-BOX hardware-in-the-loop simulation structure. (a) RT-BOX semi-physical simulation platform; (b) simulation of analog signal transmission.
In this paper, a multi-stack fuel cell hybrid power generation system consisting of four 100 kW class PEMFC, one lithium battery, four unidirectional DC/DC converters, one bidirectional DC/DC converter, and a control system is taken as an example. The line data of a city were selected, with a total of 13 stations; the longest between stations is 1389 m, and the maximum speed limit is 65 kg/h. Maximum acceleration/deceleration speed is 1.2 m/s2. The actual power demand diagram of trams is shown in Figure 12.
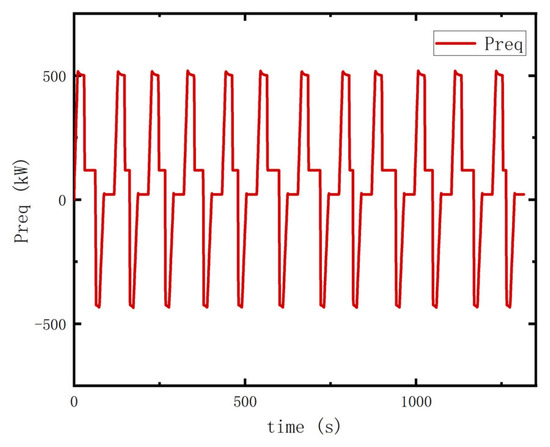
Figure 12.
Total power of the fuel cell pack.
Through the equivalent hydrogen consumption minimum energy management method, the required power is allocated to the fuel cell pack and the power battery. The power distribution diagram of the fuel cell pack and the power battery under actual operating conditions is shown in Figure 13 below.
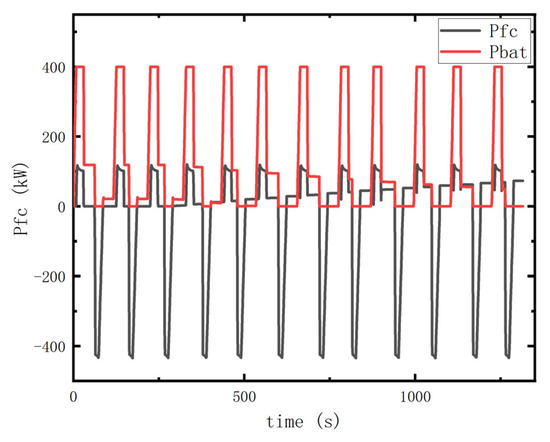
Figure 13.
Fuel cell and power battery power.
After calculating the relative life loss of four fuel cell single piles, the starting sequence of four fuel cell single piles was determined, the multi-pile fitting efficiency curve was obtained, the turning power was obtained, and the power adaptive allocation was carried out for the single fuel cell pile. The relative life loss of the four reactors within a certain time is shown in Table 4. The output power curves of reactor 1 to reactor 4 are shown in Figure 14a–d, respectively. Considering the aging degree of the stack, the algorithm preferentially selects the stack with good running performance and compares the efficiency of k stacks with k + 1 stacks in real time, allocating the output power of each stack in real time. The overall efficiency is significantly improved, and the life of the system is improved to ensure efficient and long-term operation of the vehicle.

Table 4.
Relative lifespan degradation of single-stack fuel cell groups.
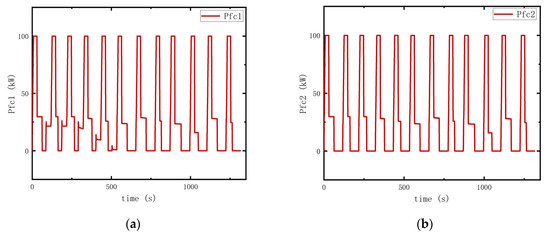
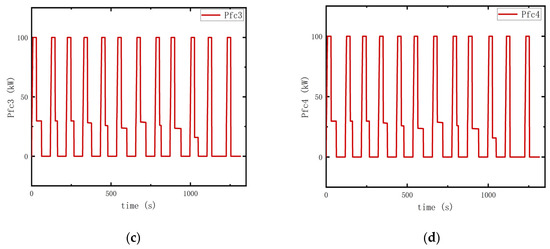
Figure 14.
RT-BOX tests the power distribution result. (a) FC1 output power; (b) FC2 output power; (c) FC3 output power; (d) FC4 output power.
The efficiency curve and hydrogen consumption of this method were analyzed and compared with the step-by-step distribution strategy. The results are shown in Figure 15 and Figure 16.
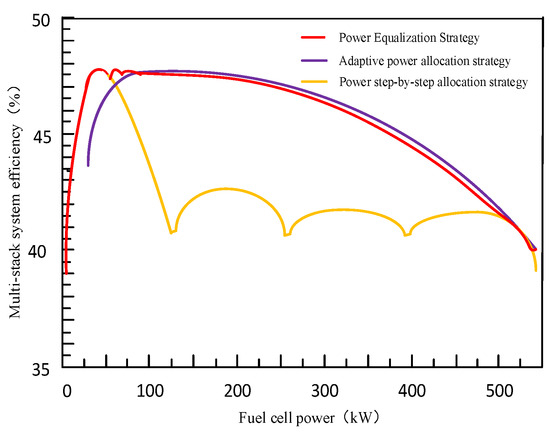
Figure 15.
RT-BOX test efficiency comparison curve.
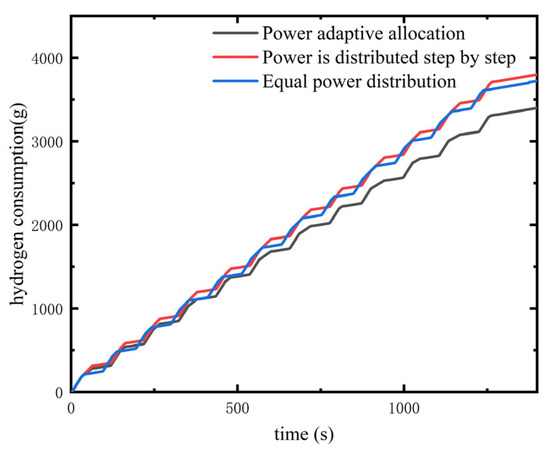
Figure 16.
RT-BOX test hydrogen consumption comparison curve.
In the overall output range of the multi-pile fuel cell hybrid power generation system, both the adaptive power distribution strategy and the step-by-step power distribution strategy can significantly improve the system efficiency and quickly reach the maximum efficiency output. At high power output, the power adaptive allocation strategy is slightly lower than the average allocation strategy, because the power adaptive allocation strategy considers the aging problem of the stack. When the power of the fuel cell bank is gradually increased until all the stacks are started by step-by-step distribution, the efficiency curves of the three power distribution strategies with the output power change intersect. The average distribution strategy has low efficiency in the low power range, and it needs to start all piles at all times, so the cost is high. The stepwise allocation strategy has high efficiency in the low power range and can reach the maximum value during the first reactor operation. With the stepwise increase in power and the commissioning of the next reactor, the overall efficiency of the system first increases and then decreases within the working range of each reactor stage. The power adaptive allocation strategy ensures near-maximum efficiency in the entire output range. Under the same operating condition, the power adaptive allocation strategy consumes the least hydrogen consumption. The stepwise power allocation strategy consumes the most hydrogen. The power adaptive allocation method of the fuel cell hybrid power system considering the operation performance of the stack is used to optimize the efficiency of the hybrid power system, reduce the hydrogen consumption, extend the system life, and significantly improve the performance of high-power vehicles.
6. Conclusions
In this paper, an adaptive power allocation method of a fuel cell hybrid power system considering the operation performance of the stack was designed. The output power of the fuel cell pack and lithium battery was allocated by the equivalent hydrogen consumption minimization method. Through the relative life loss and the stack start control, the transition power calculation adaptively allocates power to the stack. The power adaptive distribution dynamic mathematical model of the fuel cell hybrid power system based on Matlab/Simulink was applied to real-time simulation, control, and test by the RT-Box real-time simulation platform, and the superiority of this method was verified. This method can also be applied to other modular fuel cell hybrid power systems to ensure that each unit in the multi-stack fuel cell system is in the best working state, improve the overall efficiency of the fuel cell hybrid power system, make it work as far as possible in the “high efficiency range”, realize the fuel cost economy, and multi-stack fuel cell adaptive power distribution. The performance of a single stack fuel cell in battery pack is consistent, and the life of a multi-stack fuel cell system is extended. Moreover, the multi-pile structure can improve the stability of the system and increase the redundancy of the system. When a single or part of the fuel cell works abnormally, the multi-pile fuel cell hybrid power system can still continue and stably provide power to high-power vehicles, making them run efficiently and smoothly.
Author Contributions
Conceptualization, writing—original draft, D.J.; methodology, F.H.; software writing—review and editing, A.G.; data curation, L.J. All authors have read and agreed to the published version of the manuscript.
Funding
This research was supported by the National Natural Science Foundation of China: Fault Diagnosis and Life Prediction Method of Rail Transit Multipile Fuel Cell Power System (52077180), the National Railway Administration Project Research Program (SJ2023-006-2) and Research Plan of the National Railway Administration (SJ2023-006-02).
Data Availability Statement
The data that support the findings of this study are available on request from the corresponding author. The data are not publicly available due to privacy or ethical restrictions.
Conflicts of Interest
Authors Dapeng Jin and Fengxu Han were employed by the CRRC Academy (Qingdao) Co., Ltd. The remaining authors declare that the research was conducted in the absence of any commercial or financial relationships that could be construed as a potential conflict of interest.
References
- Chen, W.R.; Zhu, Y.; Li, Q.; Deng, H.W.; Hong, Z.H. Review and prospect of structures, control and detection schemes of multi-stack fuel cell power generation system used in rail traffic. Proc. CSEE 2018, 38, 6967–6980. [Google Scholar]
- Zhao, S.; Wang, B.; Xie, Y.H.; Han, M.; Jia, J.B. Linear temperature sweep experimental study on proton exchange membrane fuel cell without external humidification. Proc. CSEE 2014, 34, 4528–4533. [Google Scholar]
- Li, X.; Cao, G.; Zhu, X. Fuzzy Modeling for PEMFC Stack Temperature Characteristic. J. Shanghai Jiaotong Univ. 2005, 39, 187–188. [Google Scholar]
- Chen, H.; Pei, P. Study on economic life of proton exchange membrane fuel cells for vehicles. Automot. Eng. 2015, 37, 998–1004. [Google Scholar]
- Wang, Y.; Sun, B.; Li, W.; Gao, S.; Yan, J. Energy management strategy for fuel cell electric vehicles based on wavelet rules. J. Jinan Univ. 2021, 35, 322–328. [Google Scholar]
- Liu, J.; Luo, W.; Yang, X.; Wu, L. Robust Model-Based Fault Diagnosis for PEM Fuel Cell Air-Feed System. IEEE Trans. Ind. Electron. 2016, 63, 3261–3270. [Google Scholar] [CrossRef]
- Borup, R.; Meyers, J.; Pivovar, B.; Kim, Y.S.; Mukundan, R.; Garland, N.; Myers, D.; Wilson, M.; Garzon, F.; Wood, D.; et al. Scientific aspects of polymer electrolyte fuel cell durability and degradation. Chem. Rev. 2007, 107, 3904–3951. [Google Scholar] [CrossRef]
- Yao, Y.; Liu, J.; Zou, Z. Attenuation mechanism and anti-aging strategy of membrane electrode in fuel cell. Electrochemistry 2018, 24, 664–676. [Google Scholar]
- Chen, W.; Qian, Q.; Li, Q. Research Status and Development Trends of Fuel Cell Hybrid Electric Trains. J. Sourthwest Jiaotong Univ. 2009, 41, 1–6. [Google Scholar]
- Xie, C.; Xu, X.; Bujlo, P.; Shen, D.; Zhao, H.; Quan, S. Fuel cell and lithium iron phosphate battery hybrid powertrain with an ultracapacitor bank using direct parallel structure. J. Power Sources 2015, 279, 487–494. [Google Scholar] [CrossRef]
- Qiu, J.; Zhao, H.; Liu, X.; Xu, F.; Lu, L. FCEV energy management strategy considering fuel cell durability. J. Qingdao Univ. 2022, 37, 58–63. [Google Scholar]
- Shi, J.; Xie, J.; Zhao, Y. Study on durability control strategy of vehicle fuel cell. Mod. Manuf. Eng. 2021, 8, 56–63. [Google Scholar]
- Lin, X.; Li, X.; Lin, H. FCHEV feedback optimization control strategy considering fuel cell decay. China Highw. J. 2019, 32, 153–161. [Google Scholar]
- Li, Q.; Chen, W.; Li, Y.; Liu, S.; Huang, J. Energy Management Strategy for Fuel Cell/Battery/Ultracapacitor Hybrid Vehicle Based on Fuzzy Logic. Int. J. Electr. Power Energy Syst. 2012, 43, 514–525. [Google Scholar] [CrossRef]
- Qin, D.; Zeng, Y.; Su, L.; Zhan, S. Real time control strategy for plug-in hybrid electric vehicles based on approximate minimum principle. J. Mech. Eng. 2015, 51, 134–140. [Google Scholar] [CrossRef]
- Bambang, R.T.; Rohman, A.S.; Dronkers, C.J.; Ortega, R.; Sasongko, A. Energy Management of Fuel Cell/Battery/Supercapacitor Hybrid Power Sources Using Model Predictive Control. IEEE Trans. Ind. Electron. 2010, 57, 4013–4023. [Google Scholar]
- Garcia, P.; Fernandez, L.M.; Garcia, C.A.; Jurado, F. Energy Management System of Fuel-Cell-Battery Hybrid Tramway. IEEE Trans. Ind. Electron. 2009, 57, 4013–4023. [Google Scholar] [CrossRef]
- Torreglosa, J.P.; Jurado, F.; García, P.; Fernández, L.M. Application of Cascade and Fuzzy Logic Based Control in a Model of a Fuel-Cell Hybrid Tramway. Eng. Appl. Artif. Intell. 2011, 24, 1–11. [Google Scholar] [CrossRef]
- Zhang, J.F.; Zhang, L.Y.; Chen, Q.H. Adaptive passive control of DC/DC in fuel cell EIS detection. Power Electron. 2019, 53, 125–128. [Google Scholar]
- Yin, Z.; Zhang, L.; Chen, Q.; Quan, S. Research on power distribution of multi-module fuel cell hybrid system. China Acad. J. Electron. Publ. House 2018, 42, 1857–1868. [Google Scholar]
- Gan, R.; Li, Q.; Jiang, S.; Meng, X.; Chen, W. A dual-mode energy management method for hybrid system considering fuel cell efficiency interval optimization. Proc. CSEE 2021, 41, 7027–7039. [Google Scholar]
- Hong, Z.; Li, Q.; Chen, W. Energy management strategy of fuel cell hybrid system for locomotive based on PMP. Proc. CSEE 2019, 39, 3867–3879. [Google Scholar]
- Li, Q.; Liu, Q.; Li, Y.; Wang, T. Multi-pile adaptive power allocation method considering aging of fuel cells. J. Sourthwest Jiaotong Univ. 2022, 57, 713–721. [Google Scholar]
- Hu, S.; Yan, H.; Zhao, Y.; Li, Z.; Wei, Y. Research on Multi-energy Management Strategy of Fuel Cell Hybrid System Based on Adaptive Filtering. China Acad. J. Electron. Publ. House 2020, 30, 868–873. [Google Scholar]
- Wei, D.; Zhen, D.; Zhen, L. Optimal performance output control for air cooled proton exchange membrane fuel cell stacks. J. Chem. Eng. 2010, 61, 1293–1300. [Google Scholar]
- Zhu, Y.; Li, Q.; Huang, W.; Shang, W.; Chen, W.; Ding, Y. Coordinated and optimized control of efficiency of multi-stack fuel cell system based on adaptive power allocation. Proc. CSEE 2019, 39, 1714–1722. [Google Scholar]
- Pei, P.; Chen, H. Main Factors Affecting the Lifetime of Proton Exchange Membrane Fuel Cells in Vehicle Applications. Appl. Energy 2014, 125, 60–75. [Google Scholar] [CrossRef]
- Pei, P.; Chang, Q.; Tang, T. A Quick Evaluating Method for Automotive Fuel Cell Lifetime. Int. J. Hydrogen Energy. 2008, 33, 3829–3836. [Google Scholar] [CrossRef]
- Fletcher, T.; Thring, R.; Watkinson, M. An Energy Management Strategy to Concurrently Optimise Fuel Consumption & PEM Fuel Cell Lifetime in a Hybrid Vehicle. Int. J. Hydrogen Energy 2016, 41, 21503–21515. [Google Scholar]
Disclaimer/Publisher’s Note: The statements, opinions and data contained in all publications are solely those of the individual author(s) and contributor(s) and not of MDPI and/or the editor(s). MDPI and/or the editor(s) disclaim responsibility for any injury to people or property resulting from any ideas, methods, instructions or products referred to in the content. |
© 2024 by the authors. Licensee MDPI, Basel, Switzerland. This article is an open access article distributed under the terms and conditions of the Creative Commons Attribution (CC BY) license (https://creativecommons.org/licenses/by/4.0/).