Article

Transition to Low-Carbon Vehicle Market: Characterization, System Dynamics Modeling, and Forecasting

by
Mohammad Pourmatin
1,
Moein Moeini-Aghtaie
2,
Erfan Hassannayebi
3,* and
Elizabeth Hewitt
1,*
1
Department of Technology and Society, Stony Brook University, Stony Brook, NY 11794, USA
2
Department of Energy Engineering, Sharif University of Technology, Tehran 15119-43943, Iran
3
Department of Industrial Engineering, Sharif University of Technology, Tehran 15119-43943, Iran
*
Authors to whom correspondence should be addressed.
Energies 2024, 17(14), 3525; https://doi.org/10.3390/en17143525
Submission received: 17 June 2024 / Revised: 13 July 2024 / Accepted: 14 July 2024 / Published: 18 July 2024
(This article belongs to the Special Issue Climate Change and Sustainable Energy Transition)

Abstract

:
Rapid growth in vehicle ownership in the developing world and the evolution of transportation technologies have spurred a number of new challenges for policymakers. To address these challenges, this study develops a system dynamics (SD) model to project the future composition of Iran’s vehicle fleet, and to forecast fuel consumption and CO2 emissions through 2040. The model facilitates the exploration of system behaviors and the formulation of effective policies by equipping decision-makers with predictive insights. Under various scenarios, this study simulates the penetration of five distinct vehicle types, highlighting that an increase in fuel prices does not constitute a sustainable long-term intervention for reducing fuel consumption. Additionally, the model demonstrates that investments aimed at the rapid adoption of electric transportation technologies yield limited short-term reductions in CO2 emissions from transportation. The projections indicate that the number of vehicles in Iran is expected to surpass 30 million by 2040, with plug-in and hybrid electric vehicles (EVs and PHEVs) comprising up to approximately 2.2 million units in the base scenario. It is anticipated that annual gasoline consumption and CO2 emissions from passenger cars will escalate to 30,000 million liters and 77 million tons, respectively, over the next two decades. These findings highlight the need for a strategic approach in policy development to effectively manage the transition towards a lower-carbon vehicle fleet.

1. Introduction

The global population is expected to reach 9.7 billion by 2050 and 11 billion by 2100. This projected growth will result in an increase in energy demand, leading to a subsequent rise in environmental impacts. Consequently, global temperatures are likely to increase by 1.5 °C between 2030 and 2052 [1]. Energy consumption, environmental impacts, and economic growth are highly interdependent; as such, transportation, which plays a vital role in economic growth, experiences growth in demand as the global economy develops. The transportation sector accounts for 23% of global energy-related CO2 emissions, representing a significant energy-consuming sector [2]. Furthermore, according to the International Energy Agency (IEA), road transport accounts for 75% of CO2 emissions within the transportation sector. Iran faces a number of transportation-related challenges, including a lack of high-efficiency vehicles and a rapidly depreciating transportation fleet, which requires targeted policies aimed at the sustainable development of the transportation sector. A number of other studies demonstrate the impact of the transportation sector on economic growth, and other sectors in Iran are heavily dependent on transportation [3]. Despite the global development of alternative fuels, petroleum products still account for the largest share of Iran’s transportation fuel. Gasoline use in the transportation sector is highly dependent on the number of automobiles, the efficiency of transportation technologies, technology diffusion, and technological growth rate [4].
The main objective of this study is to understand the barriers and drivers of the diffusion of green vehicles in road transportation in order to advance knowledge of EV adoption in the passenger car fleet. The present study proposes a hybrid model that utilizes a blend of top-down and bottom-up approaches, which addresses shortcomings in previous studies. The primary aim of this model is to identify consumer behavior, estimate fuel consumption, evaluate the impact of rising fuel prices, and predict the future market for electric vehicles. In addition, a statistical dynamic model and a discrete choice model are presented to assess the market penetration of new electric transportation options and to forecast trends in road transportation, using Iran as a case study. This model also factors in consumer familiarity, acknowledging it as a key incentive for adopting new technologies and simulating various policies using an SD-based model Theory of Planned Behavior (TPB). The consequences of these policies are analyzed in detail, with a focus on five that were deemed most appealing after testing. Policy implications and consumer responses are also examined. To meet the goals of this study, we first estimate the per capita vehicle distribution in the road transportation fleet to predict the number of vehicles that would populate the fleet. The model then introduces a structure to understand how different technologies would proliferate within the fleet and how consumer choices might be influenced by factors such as vehicle cost, fuel cost, and level of familiarity. Notably, fuel price is recognized as a critical factor in fuel consumption. Although existing literature has incorporated this factor in evaluating fuel consumption in statistical models, the consumer reactions to a price increase—and the implications for their behavior—have yet to be thoroughly assessed.

2. Literature Review

Various studies have analyzed the energy consumption and emissions of transportation using time series and statistical models. Some have determined that factors like income, urbanization, population, price elasticity, and technological change are significant drivers of energy use [5]. These studies indicate that the transportation sector significantly influences carbon emissions. Furthermore, the sector’s share is projected to grow in the future energy market, emphasizing the need to enhance energy consumption within this sector to achieve sustainable road transportation. In this regard, implementing appropriate policies, including improving fuel standards and promoting alternative fuels such as natural gas, electricity, and biofuels, becomes imperative. These measures aim to mitigate energy demand and emissions, facilitating the transition towards energy sustainability in transportation [6]. As a result, numerous studies have focused on the development of EVs and new technologies in transportation, presenting diverse approaches over the past two decades. Shafiei et al. (2015) analyzed alternative fuels in the long-term context of the transportation sector in Iceland. They compared different scenarios to determine the most desirable alternative. The results, based on assumed policies, indicated that electricity is the most beneficial alternative for this sector [7]. Data availability has played a crucial role in determining what methods or methodologies are feasible. As a result, some studies have investigated the impact of different vehicle types and energy efficiency on fuel consumption [8,9].
In this regard, the use of agent-based models for predicting the number of vehicles with alternative fuels in the car market and formulating strategies for adoption has gained significant attention in recent years. However, a consensus on the definition of agent-based models has yet to be reached, as indicated by various reviews of this method. The presence of diverse models and viewpoints poses challenges in presenting effective policies. In the absence of centralized and reliable data, some studies have utilized this method to consider the interaction between agents and parameterize them to promote the adoption of EVs in the market through the long-term implementation of specific policies [10]. Although there may be variations in how researchers define agents, the major components typically include individual drivers, consumers, and manufacturers, as well as regions, governments, fuel producers, and vehicles [11].
Several studies have employed time series and econometric models, capitalizing on the availability of data and a comprehensive understanding of the vehicle market and its saturation level. These models propose symmetric and S-curve models, such as the Gompertz growth curve or Bass model, to forecast the vehicle market within a specific time frame [12]. Alternatively, some researchers have utilized computable general equilibrium models to examine macro- and micro-economic aspects empirically. However, due to a weak theoretical foundation, this method often lacks realistic interpretability [13,14].
An alternative approach that has gained attention in recent decades is the use of SD models. These models enable the solution of multiple differential equations in a dynamic environment through differential approximations [15]. Scholars have extensively explored the application of SD models in transportation and market penetration. Notable features of SD models include their ability to investigate future transportation trends at local or global levels dynamically, incorporate feedback loops with delays, provide expository models, and consider time horizons longer than 20 years [16,17,18,19]. SD models are versatile and can be combined with other methods, such as discrete choice models, Bass models, and agent-based models. Moreover, SD provides a comprehensive framework to address the social and technical aspects of the studied case and bridge the gap between technical possibilities. SD models can easily integrate multiple approaches for a holistic understanding. SD models can be employed to analyze various scenarios and policies to facilitate the market transition [20]. Kieckhäfer et al. (2017) used an SD model along with an agent-based discrete choice model as an integrated model to estimate the adoption of market shares of EVs. In this study, an SD model has been used to model the interactions between consumer choice, consumer awareness, technological improvement, and the availability of service stations. Using an agent-based discrete choice model, this study refines the consumer choice and awareness components [21]. An SD model investigated the fundamental strategies of automobile manufacturers for compliance. In this study, the development of powertrain technologies, vehicle types, customer behavior, and infrastructure coverage during regulatory adjustment in California were considered [22]. Some studies presented agent-based simulation (ABS) to analyze market strategies in the automotive industry to develop alternative fuels and powertrain technologies [23,24]. Thies et al. (2016) developed a dynamic simulation model to evaluate strategies for implementing alternative technologies in long-range passenger cars under competition. This model considered two competing manufacturers, one first-mover and one follower, with each introducing fuel cell (FCV) and plug-in hybrid electric vehicles (PHEV). The authors used a dataset for the car market in Germany to study the significant drivers of the adoption of alternative powertrains [25].
Another study developed a model focused on the European Union’s light-duty vehicle road transportation, providing insights into potential policies and market trends with a specific emphasis on electric mobility by 2050 [26]. Although this study included a number of behavioral inputs, individual behaviors and intentions are often difficult to interpret. Ye et al. (2021) presented an SD model for the post-subsidies era in China, generating simulation results for EV adoption based on a governmental decrease in subsidies for new energy vehicles (NEVs). The results of this study show that supporting measures are the most influential factors in EV adoption in this context. The main limitation of this study was the omission of some important indicators, such as individual behavioral inputs and charging infrastructure loops, which have a significant effect on the development of NEVs [27].
From a vehicle per capita forecasting perspective, another study applied the Gompertz function to foresee the correlation between vehicles per capita and Gross Domestic Production (GDP) in 85 countries over 25 years. This work reported that the vehicle per capita growth rate in Middle Eastern countries will be slower than in other countries. Further, it reported that in most Asian countries, including the Middle East, approximately 15% to 45% of the car ownership saturation level will be acquired by 2030 compared with developed countries, which will have reached saturation level by the same time [28]. Another study applied S-curve models involving logistics, power growth, the Gompertz curve, and indicators such as GDP, car price, and gasoline price to estimate vehicles per capita in Turkey [29]. This study used GDP and car ownership saturation level as independent variables. Results indicated that this was a highly realistic model relative to some of the other studies. Analyzing the correlation between vehicles per capita and income in 14 OECD countries illustrates that there is a long-run cointegrated relationship between these two features [30]. Utilizing Gompertz’s function of GDP and vehicle stock, another study investigated how China’s vehicle ownership has expanded as an S-shaped curve. This study forecasted vehicles per capita in China by 2050 and showed that the inflection point of the increasing curve will become evident around the year 2030 [31]. Despite these existing studies examining vehicles per capita, very few studies provide predictive analysis for developing countries, particularly in the Middle East.
The existing literature concerning fuel consumption and emerging technologies in the transportation sector predominantly employs macroeconomic methods. However, the recommendations and policies resulting from these studies often lack specificity regarding their feasibility and potential side effects [32]. Studies vary widely in their approach to forecasting emerging technologies in transportation systems, but many of them have used diffusion models alongside static models or SD frameworks. While some studies focus on attributes of the vehicle types, i.e., vehicle price, maintenance, and GHG, others consider only particular technologies, such as electric or hybrid, hydrogen fuel cells, biofuels, and natural gas, for instance. Most studies on EV adoption have chosen a long-run trend of at least 20 years to examine uptake. Diffusion models have a long history, and the first was provided by Bass (1969) and later developed and redefined by that author and others [33]. Discrete choice models have been used in several studies in this area for decades. The main goal of these models is to evaluate consumers’ behavior and their attitudes toward alternative vehicles (AFVs). In order to represent the interaction of these behavioral components in a comprehensive way, many studies have increased the complexity of the SD approach, incorporating diffusion models, non-linear relations, and feedback processes through stocks and flows involving endogenous and exogenous variables. Several applications of SD in the field of alternative fuel vehicles are notable, and they vary in their scope and assumptions [34].
Table 1 summarizes the most relevant electrification and AFV studies, including the time horizon, technological factors, level of analysis, policies, scenarios, and explanatory variables, which are separated into factors related to transportation and energy systems. As noted in the table, most of the studies relied on country-level analysis and disaggregated models, and some attributes of energy systems and transportation, including the power grid, energy efficiency, fuel price, and technological improvement, have been given only minimal consideration in this literature. This taxonomy of previous studies outlines the factors that should be considered when developing a model for EV penetration; however, there are several factors that previous studies have not considered or have not made endogenous. By relying on SD tools, as we do in this study, feedback loops can be included, which provide a better understanding of the causal relationships between interacting factors.
The contributions of this study are as follows: First, we present a comprehensive rationale for the use of integrated models, detailing their potential to advance knowledge about market transitions and electrification in transportation. Second, the model presented here enables us to simulate various policies and strategies, thereby deepening our understanding of the relationship between policy interventions and changes in the passenger car fleet and gasoline consumption. Specifically, we examine the effects of a fuel price increase on consumption, factoring in the dynamic behavior of consumers to highlight this policy’s impact. Finally, our analysis provides significant insight into Iran’s energy transition and vehicle market and, thus, advocates for more sustainable energy consumption within the transportation sector of a developing country.
The remainder of this paper is organized as follows: Section 3 elaborates on the mathematical model, which includes elements such as vehicles per capita, vehicle selection, and a causal loop model related to increasing gasoline prices. Section 4 discusses the case study, Section 5 provides simulation results, and Section 6 discusses implications and concluding remarks.

3. Model Description

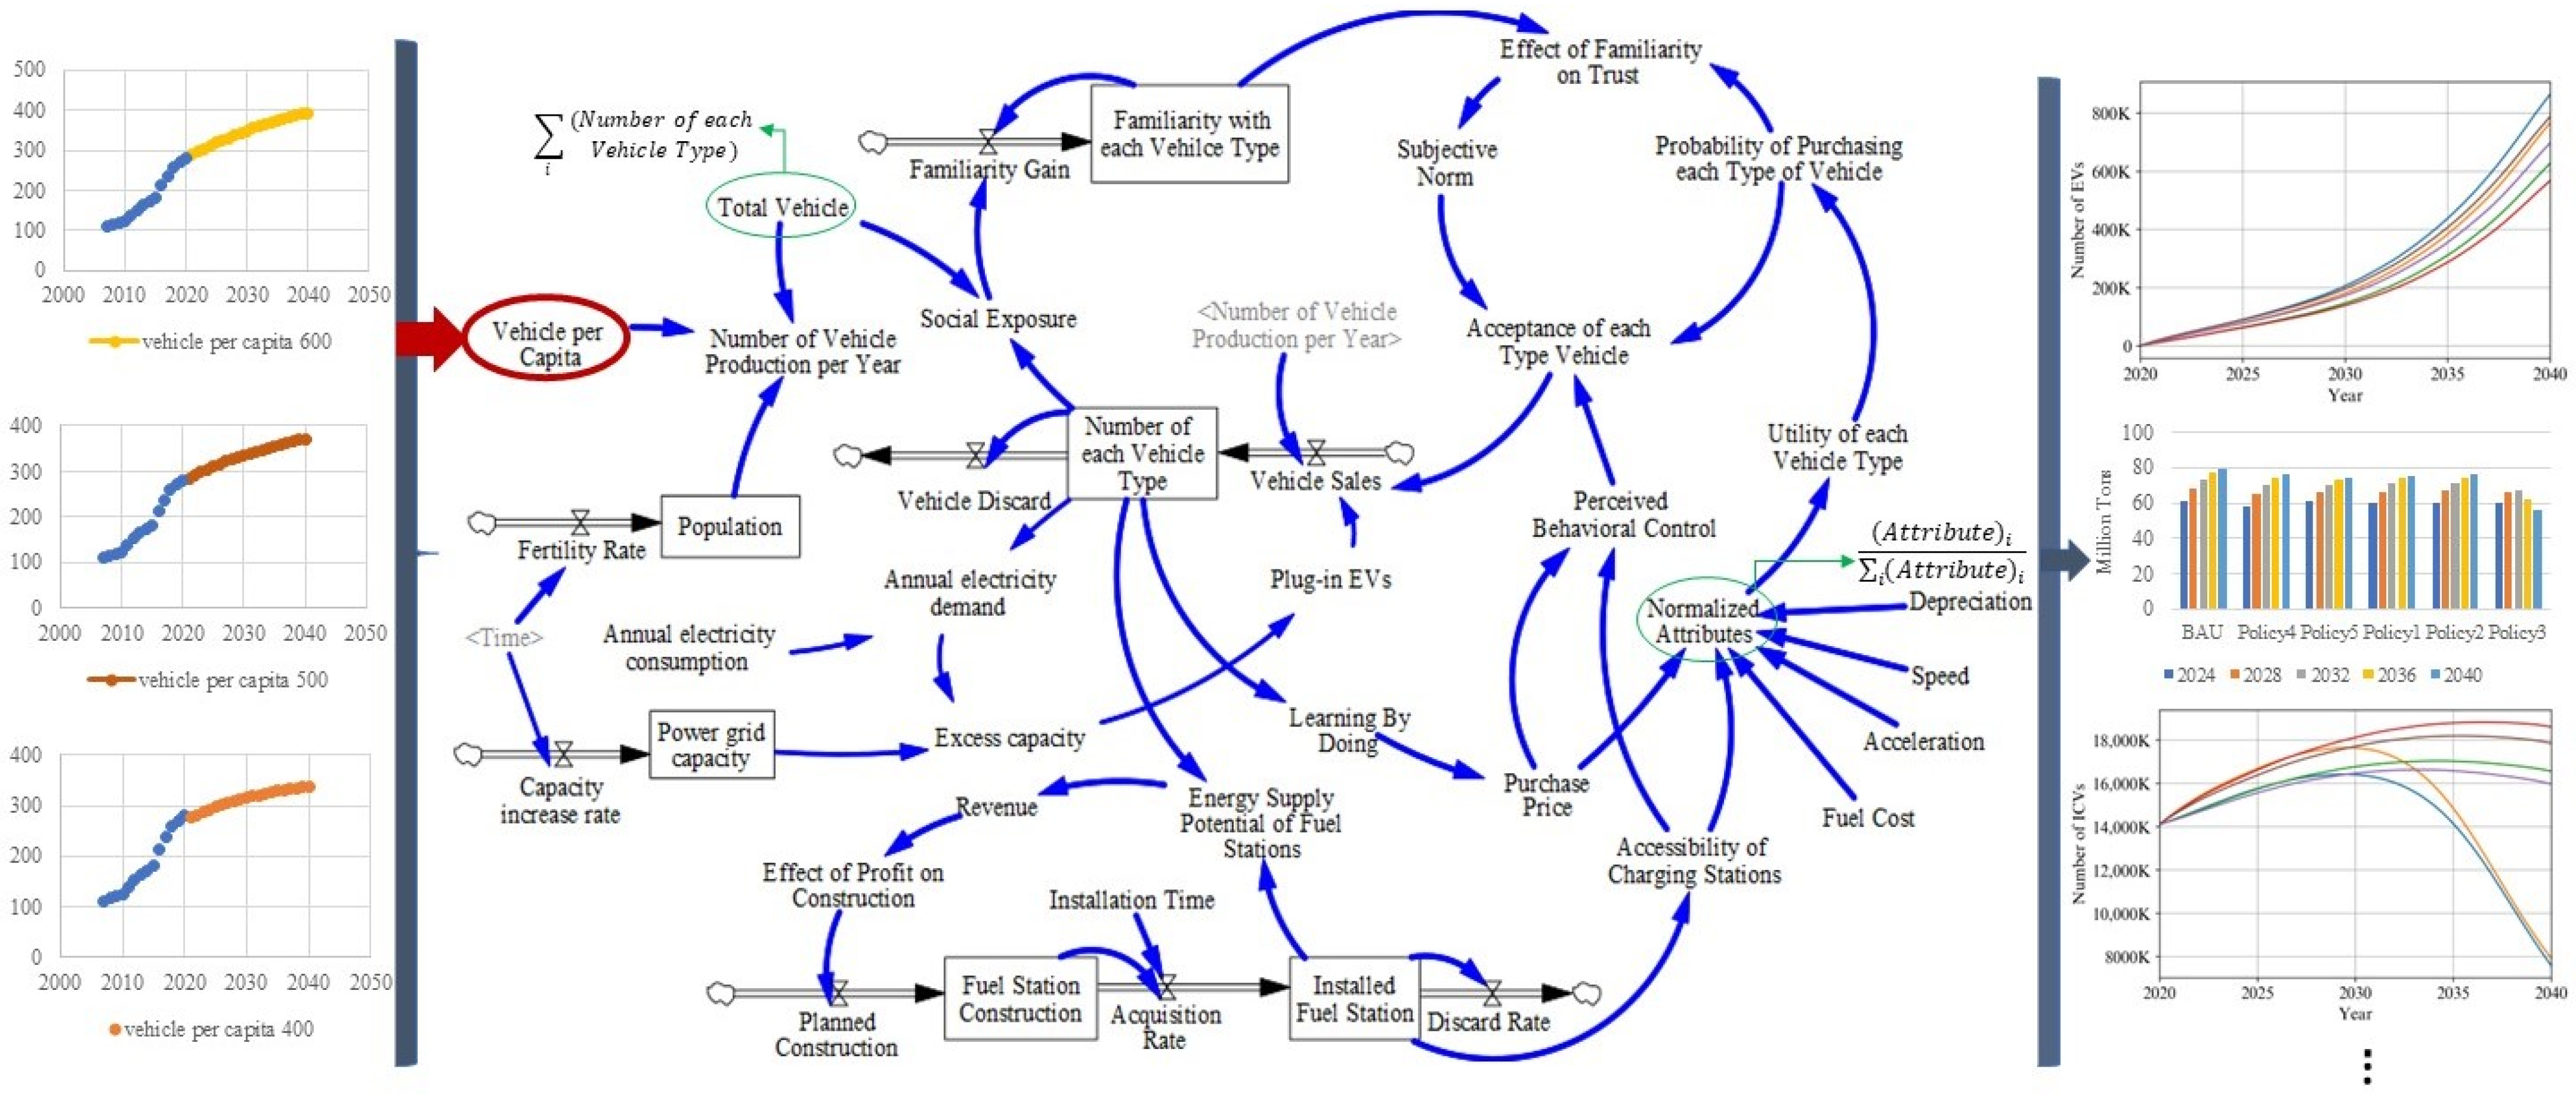
This study examines consumer willingness to pay and interactions with other variables to evaluate the future of EV types, vehicle attributes, and social exposure. Fuel consumption in transportation largely depends on the number of automobiles, technology efficiency, and technology distribution [4]. This study proposes a comprehensive, flexible model for various scenarios and policies. It utilizes a dynamic mathematical approach to estimate and forecast fuel consumption and vehicle markets. The model explores five automobile types: internal combustion vehicles (ICVs), natural gas vehicles (NGVs), hybrid electric vehicles (HEVs), EVs, and PHEVs. The model also incorporates a decision-making system and SD method, factoring in the social attractiveness of products such as car price, fuel cost, accessibility of refueling stations, vehicle depreciation, car acceleration, and vehicle speed [7,34]. These influential variables shape vehicle desirability and thus impact the estimated penetration of any technology. This study proposes a hybrid modeling framework consisting of two main modules: a top-down SD model and a bottom-up data analytics model. The top-down module, which provides a high-level view of the adoption framework, includes an SD model that connects different system characteristics and produces time-series outputs. The bottom-up module comprises data analysis, regression models, and discrete choice models to provide input to the SD model. The structure presented in Figure 1 serves as a decision-support framework for analyzing the diffusion of new technologies in transportation.

3.1. Causal Loop Diagram

Policymaking without a solid understanding of the overall system can lead to ineffective solutions as consumers transition from high-consumption fossil fuel transportation to more sustainable consumption modes, underscoring the importance of understanding the impacts of consumer behavior on market shifts. There are several interconnected reasons why the successful adoption of alternative fuel vehicles is complex and challenging. The widespread and highly entrenched utilization of ICV technology creates a significant advantage for this outdated transportation mode, yielding positive feedback loops that benefit ICVs. These feedback loops include economies of scale that lead to cost reductions and vehicle improvements, learning by doing, and research and development, all of which enhance manufacturing performance, yield, and sales. The diffusion of new vehicles, such as EVs, can be expanded through increased awareness, marketing, and social exposure, thereby boosting market revenue, but customers may be hesitant to adopt these new vehicles without immediate and easy access to refueling. Conversely, without a large-scale demand market, governments and investors may be reluctant to invest in refueling stations and new vehicle infrastructure; thus, the industry faces a ‘chicken or egg’ problem [35].
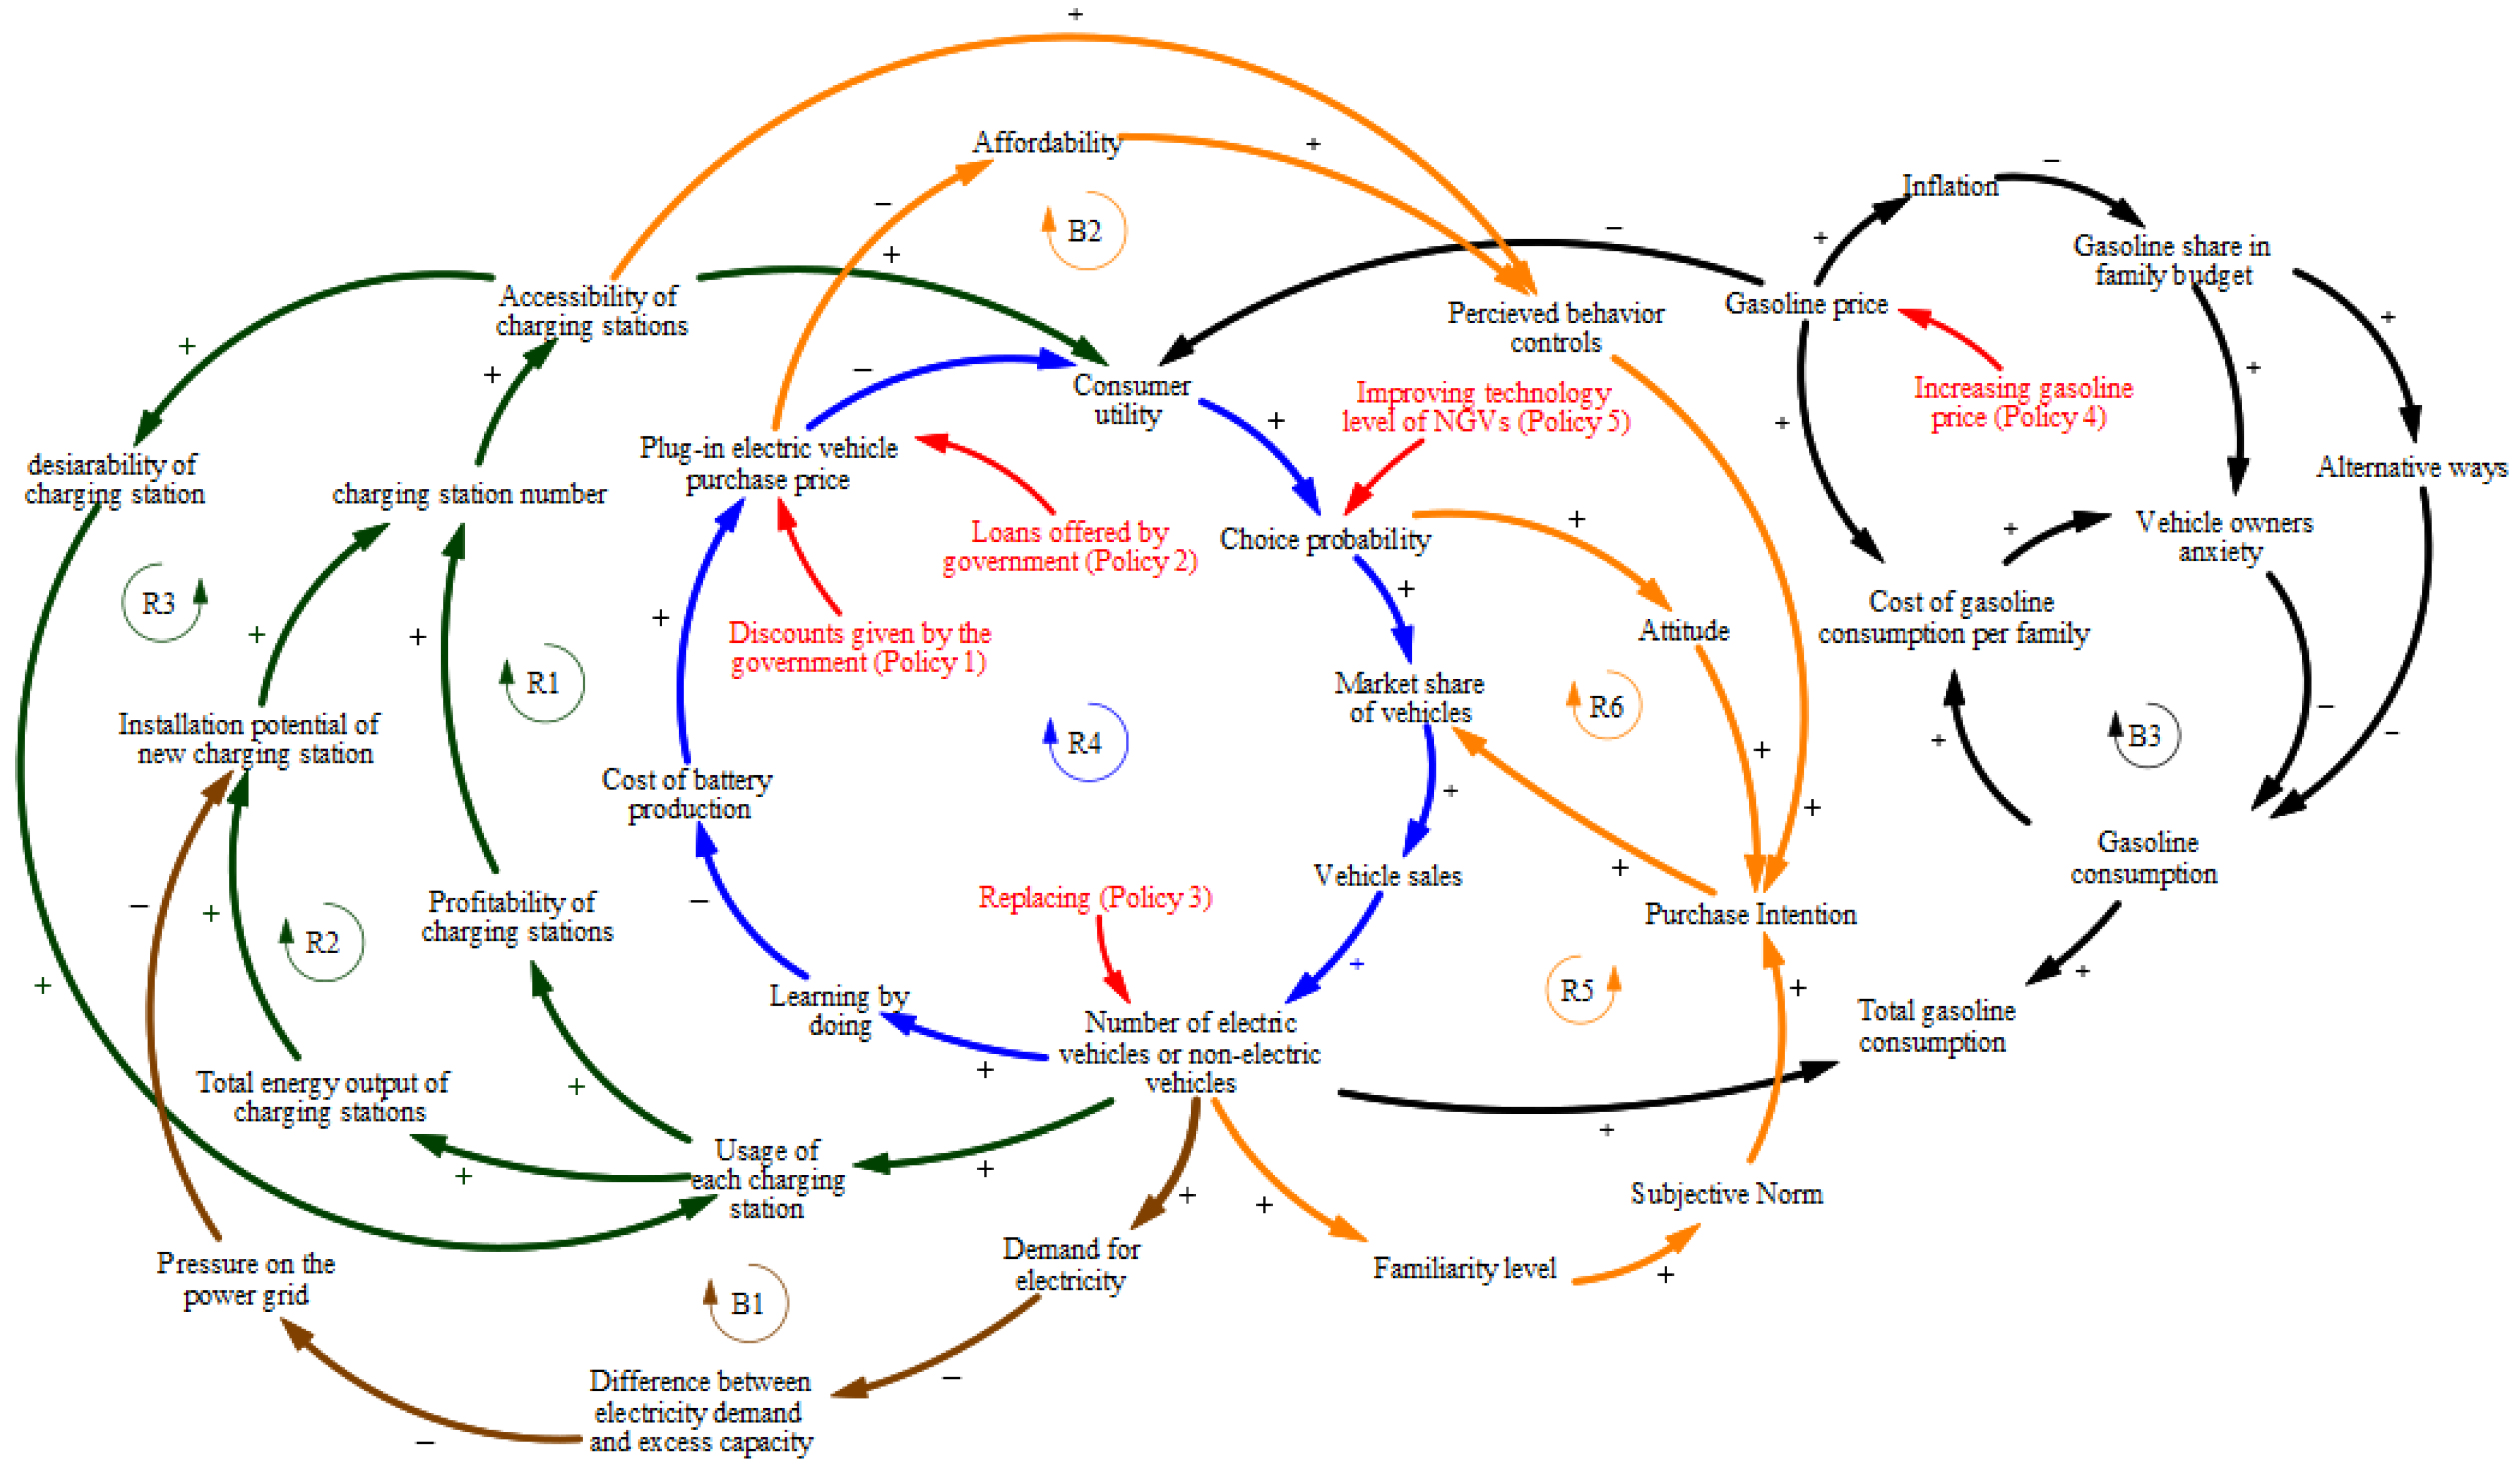
Therefore, given these challenges, the diffusion of new vehicles can be considered a path-dependent process. In this study, we examine path dependence within a behavioral dynamics model, with this section explaining the associated behavioral loops. As shown in Figure 2, feedback loops incorporate a range of characteristics, such as individual and social norms, environmental viewpoints, current attitudes towards transportation, and the effects of their changes. It can be inferred that the prevailing societal belief and attitude regarding vehicle types can be altered by managing social factors [36]. Table 2 summarizes the relationships between the elements and the descriptions of the loops.
As detailed in the following sub-section, a utility function governs buyers’ preferences, laying out the criteria they consider when hypothetically choosing a vehicle type. However, the buyer’s final decision is not solely based on these criteria. A key factor is the level of familiarity people have with each technology. This familiarity can be enhanced in various ways, including social exposure, marketing, and word-of-mouth exchanges between drivers [34]. Figure 2 illustrates how an increase in the number of vehicles of a certain model heightens familiarity and thus raises the likelihood of that vehicle being purchased. While both familiarity and preference, discussed separately, affect the growth of technologies, the ultimate determinant of consumer choice is their trust in the technology they intend to purchase. Familiarity alone does not guide individual decision-making; rather, it functions alongside cognitive information, helping customers form perceptions about the technology, thus shaping the decision-making process. This is the point at which the growth of technology transpires.
Trust, which builds purchase intention, plays a pivotal role in consumer choice; trust is influenced by the utility function, which indicates the likelihood of purchasing and the level of familiarity with the product. Figure 2 underscores purchase intention as a crucial loop in adopting emerging technologies within the transportation sector. A significant factor in the utility function, which impacts buyer preference, is the purchase price. This can dynamically fluctuate over time due to the combined effects of economies of scale, commonly referred to as “learning by doing” or “learning by searching”, which reduces production costs [37]. Consequently, the cost of EV batteries has been observed to decrease over time due to technological learning, as evidenced in several studies on hybrid and full-EVs. This decline in production costs via the technological learning process causes vehicle prices to become a less significant barrier to the market penetration of EV.
As illustrated in Figure 2, this process alters the perceived utility for consumers, thus influencing their choice probability. A major factor affecting EV market penetration is the deployment of adequate EV charging infrastructure to support the increasing EV market share. Furthermore, research indicates that car buyers show a preference for vehicles with a high available range [38]. Therefore, the accessibility of fast-charging stations is a crucial consideration for consumers. In this study, accessibility is defined as the availability of charging stations for PHEV and EV owners. This factor can be gauged by using a standard measure of stations per vehicle. As illustrated in Figure 2, an increase in the number of EVs improves the profitability of charging stations, thereby increasing the availability of fast chargers. Consequently, the utility of these vehicles rises, enhancing their attractiveness to buyers.
Effective policies can significantly influence the proliferation of EVs and emerging technologies. This is particularly relevant for most developing countries that are in the initial stages of adopting these technologies and must compete with established alternatives. Key factors for EV adoption include the availability of charging stations, vehicle efficiency, and individual adoption behavior [39]. In this study, as shown in Figure 2, we introduce crucial mechanisms such as three balance loops (B1, B2, B3) and six reinforcement loops, including developing charging infrastructure (R1, R2, R3), vehicle attributes that embrace the development of the whole market (R4), the familiarity of individuals, and attitudes towards purchase intention (R5, R6), all of which build consumer trust to purchase the technology. The growth and acceptance of EVs depend significantly on the accessibility and development of charging stations. Consequently, we have considered factors such as accessibility, investment, and charging cost, which impact the development of charging stations. Given that the manufacture of EVs in Iran and many developing countries is in its nascent stages, we anticipate reduced associated costs due to experiential improvements in the production process. This change can affect the features and appeal of these vehicles, thereby influencing consumer choice (as depicted in R4 in Figure 2).
Additionally, consumer information and consumer experience significantly impact the diffusion of EVs. Government officials can strategize ways to raise public awareness, thus addressing information gaps about EVs. The first balancing feedback loop (B1) represents the constraint posed by the grid power generation capacity. In some developing countries, insufficient infrastructure and unreliable electricity supply can act as barriers to the market share of EVs [40]. Addressing larger infrastructure issues is a fundamental step in the successful diffusion of EVs in developing countries, including Iran. As one of the largest countries in the Middle East, Iran follows a vehicle growth trend that outpaces many developed countries. The second balance feedback loop (B2), perceived behavioral control, can act as an additional barrier to technology diffusion. This loop can influence the formation of an intention to purchase an EV. Perceived behavioral control is one component of the Theory of Panned Behavior (TPB), which is explained in the next subsection.
To accelerate the adoption of new technologies, stakeholders and policymakers should find effective entry points to intervene in these causal loops with targeted programs and incentives to nudge consumers. For instance, the first policy analyzed here proposes a discount for new buyers of EVs. In contrast, the second policy offers a loan to new buyers to purchase EVs. As illustrated in Figure 2, both policies affect consumer utility and increase the attractiveness of these vehicles. Lastly, the third policy, known as the car replacement plan, allows for the replacement of existing vehicles on the market with imported EVs based on their age. The replacement rate is influenced by familiarity level and choice preference, as demonstrated in Figure 2. Different policies impact each type of vehicle in the market, influencing total fuel consumption and emissions. Thus, to enhance overall fuel efficiency, an additional strategy could be adopted—aside from the increased fuel price policy (fourth policy)—to improve the technology of NGVs (fifth policy). This would enhance the attractiveness of these vehicles by affecting consumer utility, ultimately leading to a reduction in total gasoline consumption. As an essential commodity in the case study country, gasoline prices play a significant economic role in Iran. One of the strategies taken by policymakers in recent years to reduce gasoline consumption is to increase gasoline prices to correct an imbalance between actual and nominal gasoline prices [41]. All households allocate a portion of their income to transportation, some of which goes toward gasoline costs. As shown in the causal loop diagram in Figure 2 (where positive signs indicate direct relationships and negative signs indicate indirect relationships), the share of fuel consumption costs in the household basket of goods will initially increase with a rise in gasoline prices. As a result, family financial stress will increase, the use of personal cars will decrease, and the use of alternatives such as public transportation will increase. Rising gasoline prices and an increase in fuel demand in the household basket of goods lead to an inflationary expectation in society [42]. However, given that gasoline is an essential commodity, inflation occurs, which will reduce the effect of rising gasoline prices, neutralizing this policy. Gasoline is an essential commodity that directly or indirectly contributes to family expenses, and an increase in the price of this energy source affects the standard of living [43]. This paper, therefore, considers both the behavioral dynamics of increasing fuel prices and their effects on fuel consumption trends and vehicle markets. The results represent the effect of changing gasoline prices, how long they will last, and whether the changes will return to their initial state or not. This study uses VENSIM PLE 9.3.2 software to model cause-and-effect diagrams and feedback loops. The core of the developed dynamic simulation system is shown in Figure 3. As stocks and flows interact with one another, a system structure emerges, which is defined by a sequence of connected non-linear differential equations, as stated in Section 3.3.
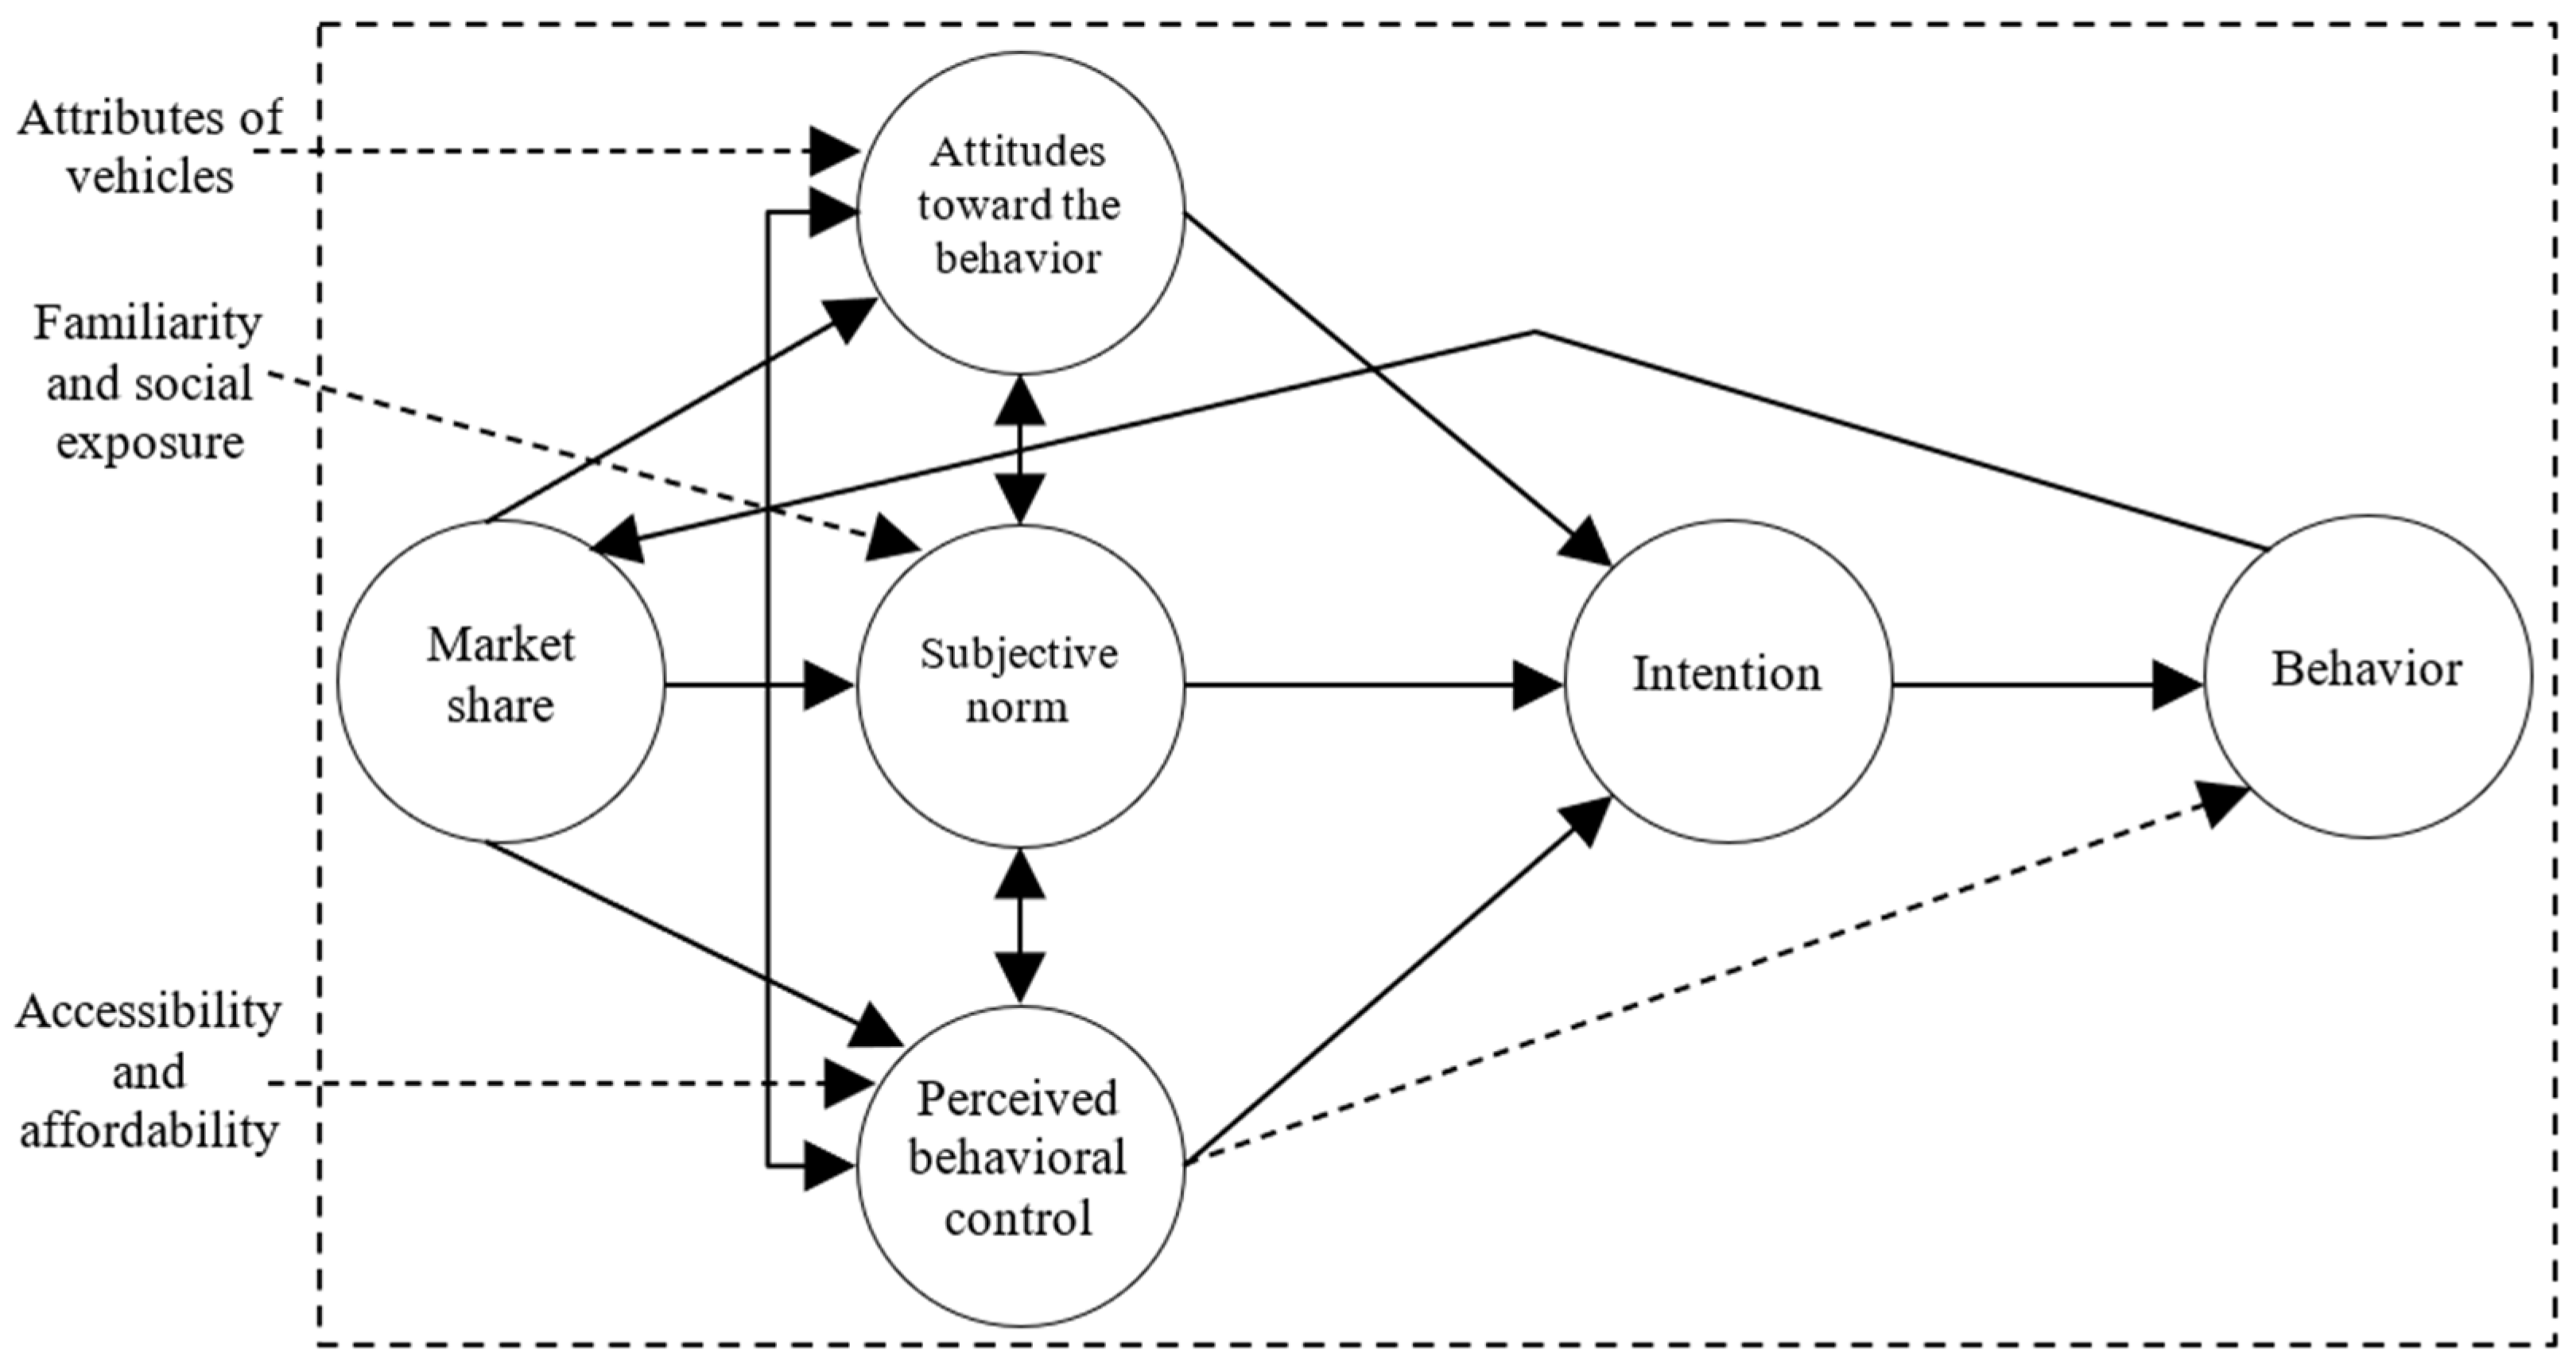
The Theory of Planned Behavior (TPB) was originally developed by Fishbein and Ajzen (1975). The TPB has been widely studied and empirically validated in numerous applications, including mode choice and departure time in transport-related decisions [44]. TPB is one of the most influential theories for understanding the causal chain of variables that lead to consumer behavior and purchasing choices. According to TPB, behaviors and actions can be predicted by the formation of an intention, and intentions are a function of three factors: (1) attitudes, (2) subjective norms, and (3) perceived behavioral control. Figure 4 depicts the primary relationship among the components of the theory. This study integrates an extended TPB with an SD modeling framework. This hybrid structure is constructed based on the assessment and integration of components in TPB through causal feedback loops. In other words, the feedback loops presented in this study illustrate how changes in market share, accessibility to chargers, attributes of vehicles, and so on can affect intentions and behaviors, as shown in Figure 4. As illustrated, the buyer’s choice is ultimately based on these three TPB criteria.
Attitudes towards a behavior can be understood as an individual’s positive or negative feelings about the behavior in question. In this scenario, potential car buyers develop positive or negative attitudes towards vehicles based on attributes such as fuel price, access to fueling stations, purchase price, depreciation cost, and other similar attributes; these attributes are key components in measuring consumer attitudes towards purchasing choices and are crucial in potentially changing these choices. A subjective norm can be understood as social pressure that influences people’s behavior based on the opinions and actions of their perceived peers; subjective norms can strengthen or weaken one’s intention to act. Subjective norms are represented here by the level of familiarity people have attained with each technology, which can be influenced through various peer-based mechanisms, such as social exposure, marketing, and word-of-mouth contact with other drivers [15]. Figure 2 shows that an increase in the number of vehicles intensifies familiarity and thus increases the share of that vehicle model. Although both attitudinal and normative components affect the growth of technologies, a final determinant of consumer choice, as posited by TPB, is perceived behavioral control. Perceived behavioral control refers to an individual’s perception of their ability to successfully undertake an action. Control in this scenario represents consumers’ beliefs about whether they can manage and control the technology that they want to use and, ultimately, whether they can use it successfully. Collectively, these three factors determine consumer choice, and they are influenced by vehicle attributes. Figure 4 positions TPB as an essential causal loop in the adoption process of emerging technologies in the transportation sector.

3.2. Estimation of Vehicles per Capita

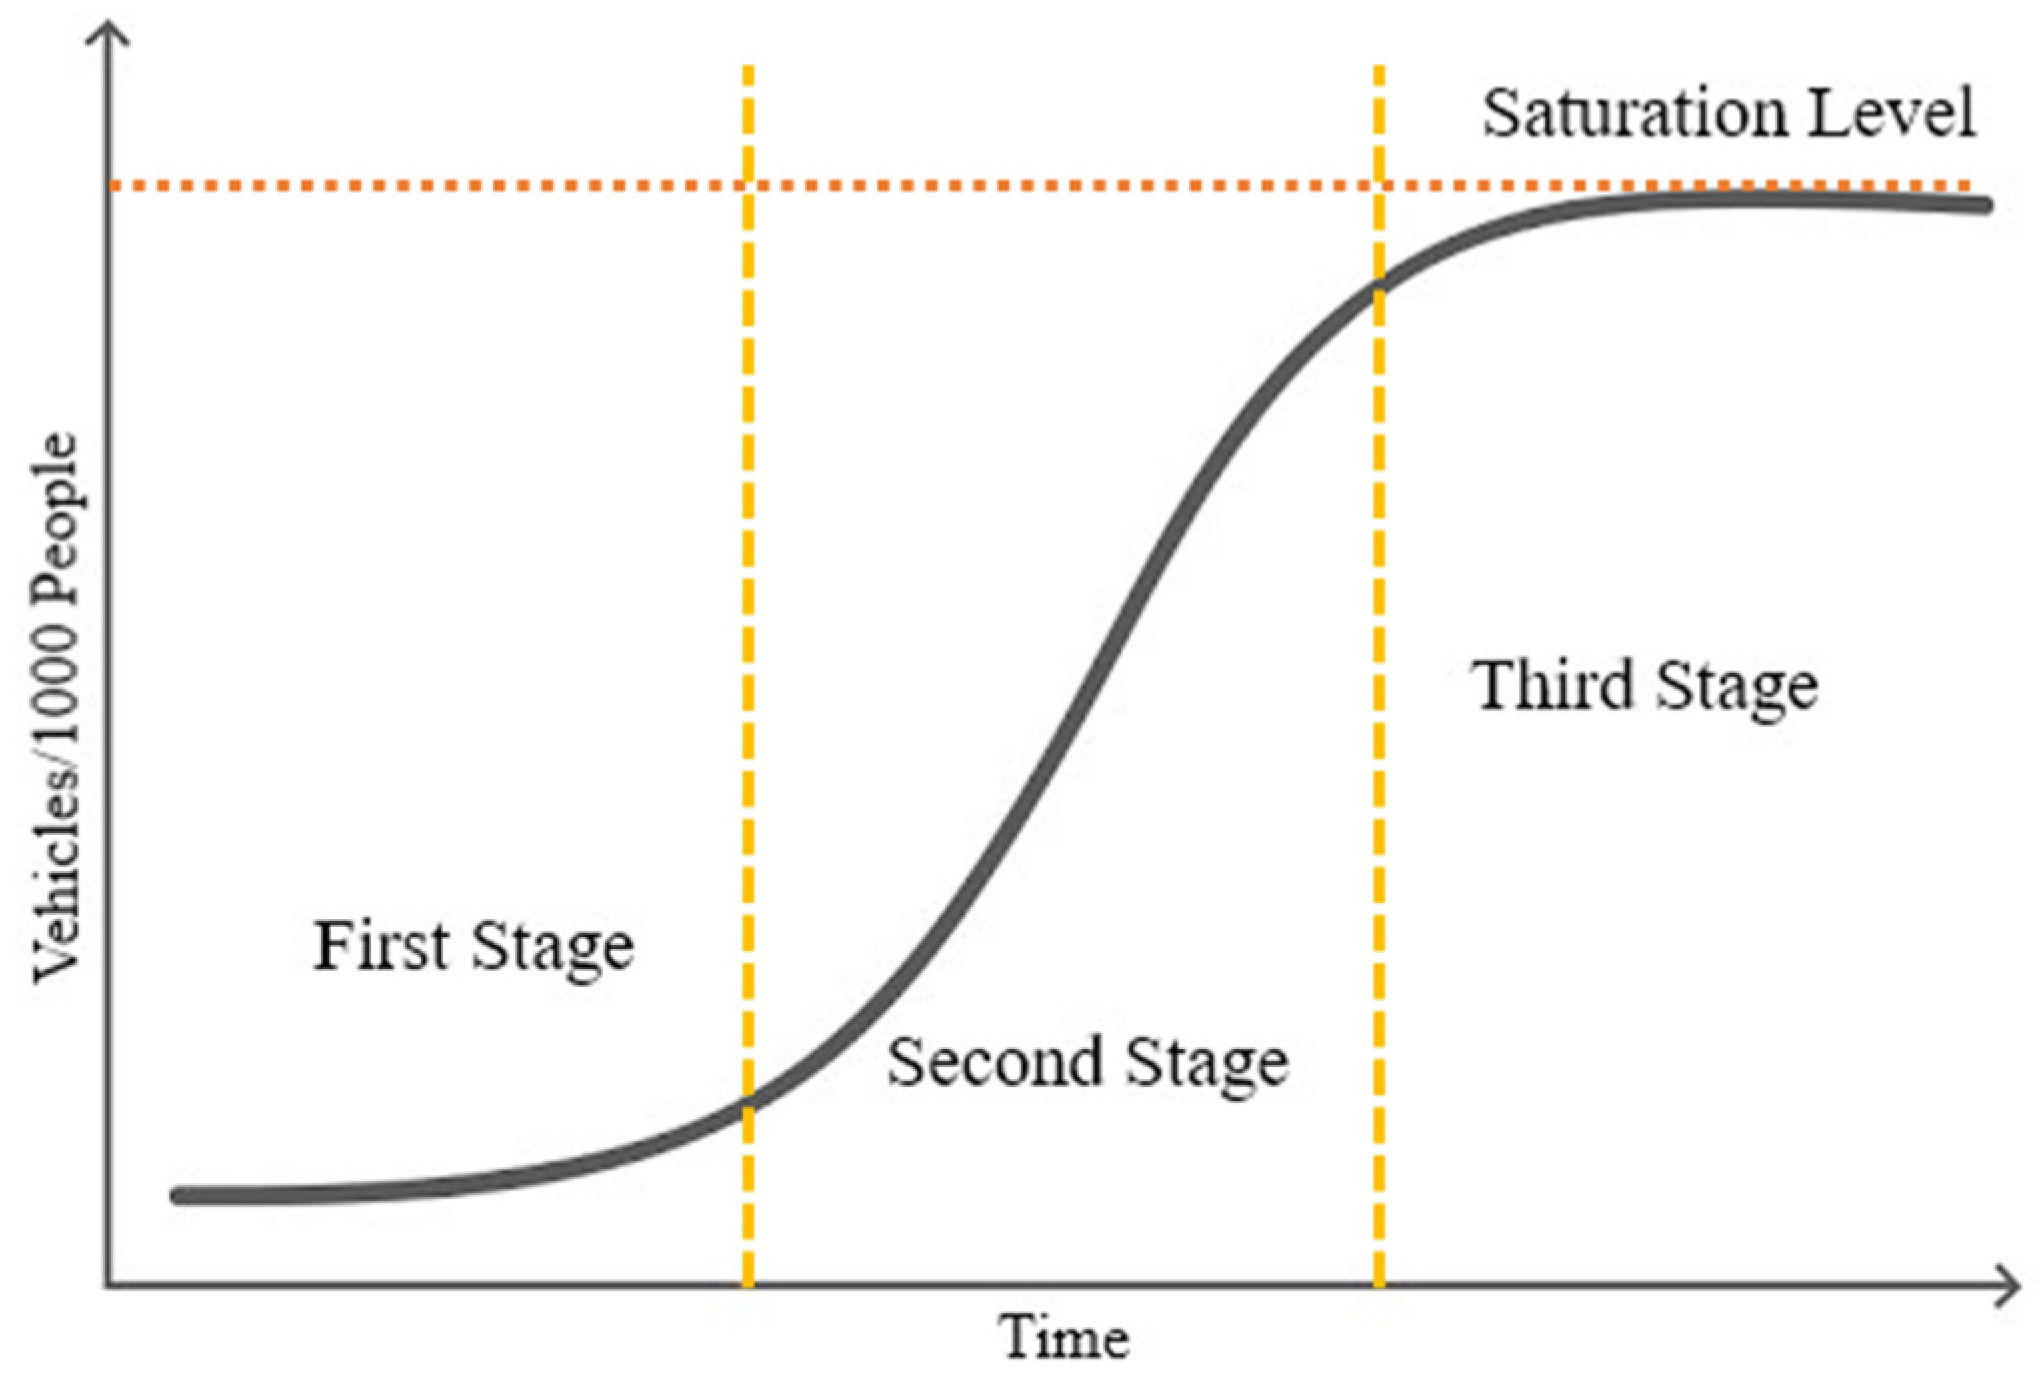
The mathematical models used as inputs for the SD model in this study were selected based on the following criteria: (1) data availability in Iran; (2) compatibility and ease of integrating these mathematical models into SD models; and (3) existing literature in the field, which provides empirical validation of the use of such models and assumptions. To forecast the growth of vehicles per capita, this study employs an S-shaped diagram, as depicted in Figure 5 [45]. This curve consists of three stages. The first stage exhibits rapid growth. In the second stage, growth continues, but the growth rate decreases at the curve’s inflection point, resulting in a slower rate of increase in the number of vehicles. In the final stage, the growth rate approaches zero, indicating a near-saturation point. It is important to highlight that the growth trend in the number of vehicles per 1000 people follows a distinct pattern for each country, influenced by several factors such as the economy, population, geography, and infrastructure. Iran, classified as a developing country, is currently in the initial phase of the second stage, as depicted in the diagram. The number of vehicles per capita can be calculated as a function of people’s income using Equation (1):
V C ( t ) S V C ( t ) = e α · Y β ( t )
where V C ( t ) and S denote the vehicle ownership at the time of t and vehicle capacity, respectively, per 1000 people in the region under study, while Y ( t ) stands for an independent variable denoting the average income of people. Coefficients α and β should be calibrated according to historical data. By taking the logarithm of Equation (1) and making some other changes, it can be linearized as Equation (2):
ln V C ( t ) S V C ( t ) = α + β · ln Y ( t ) )

3.3. Vehicle Selection Model

3.3.1. Vehicle Fleets

We introduced the key elements of the model in the previous sections. In this section, we explain the main equations. To predict the number of various vehicles in the passenger car fleet, estimating the market share of each vehicle type is required. This estimation necessitates an accurate model that reflects customers’ decisions regarding their vehicle purchases. This task is accomplished using the Multinomial Logit (MNL) model, in which customers make their purchase decisions based on their preferences and the attractiveness of each vehicle, as well as other factors such as the level of familiarity or the degree of technology diffusion in society [46]. The vehicle choice model is a core part of the vehicle market used to forecast consumer behavior and the market share of each vehicle type. MNL models are typically used to determine individuals’ preferences and their probability of choosing a particular vehicle type. In this context, different attributes are assigned to the vehicles, and consumers select among them to enhance their utility. Therefore, each type of vehicle can be distinguished by a set of attributes that either attract or deter customers from purchasing the vehicle. The utility function of purchasing vehicles from customers’ viewpoints is based on six different factors, including vehicle cost ($), the fuel cost of the vehicle ($/km), depreciation cost ($/Year), availability of refueling stations (station/1000 vehicle), acceleration of the vehicle, and vehicle speed. The utility function is calculated according to Equation (3), which includes the attractiveness of the vehicle.
U i ( t ) = β 1 , i P P i ( t ) + β 2 , i E P i ( t ) + β 3 , i D P i ( t ) + β 4 , i I A i ( t ) + β 5 , i S i ( t ) + β 6 , i A i ( t )
where β i are the coefficients of the attractiveness factors in the utility function. Consumer choice from the set of attributes can be extracted from the MNL model. According to (4), Pi,t represents the probability of purchasing vehicle i at time t based on the utility function and attractiveness of vehicles [34].
P i ( t ) = exp ( U i ( t ) ) i exp ( U i ( t ) )
To calibrate the utility coefficients, this study relies on a synthetic logit framework, in which basic economic assumptions are utilized to discover the market shares of vehicle types [47]. In this way, as in Equation (5), the purchase price coefficient can be calculated using the elasticity data for vehicle demand. Then, the purchase price coefficient is used as a criterion for finding the other coefficients.
β 1 , i = μ i P i × ( 1 S i )
where β 1 indicates the coefficient of the purchase price, the average purchase price of each type of vehicle is shown by P i , and S i is the market share of vehicle i at the beginning of the period.
Other coefficients of the utility function can be calculated using the total present value of each factor ( T i ) :
β i = β 1 × T i
The present value of the fuel cost and depreciation cost for a vehicle is considered the current value of a future stream of cash flows over the vehicle’s lifetime. The refueling station coefficient is derived from the present value of the lack of fuel availability. In the same vein, the acceleration and vehicle speed coefficients are estimated using the value of an increase in horsepower, which can lead to a reduction in acceleration time and an increase in maximum speed. The estimated utility coefficients are presented in Appendix A.
We formulated the cumulative evolution of vehicles over time using an integral function. Symbolizing the overall count of vehicles within a system, variable N V stands for stock. Equation (7) models the accumulation of vehicles in a system, accounting for sales and discard rates, with an initial value (IV). These variables relate as follows:
N V = ( S R P E V D R P E V ) d t + IV
A set of integral functions determines the number of CVs and NGVs, which characterizes vehicles’ complicated progression over time. N C V is the sum total of ICVs in Equation (8). The equation has multiple integrals, each dealing with a specific age range. The integral functions consider the sales rate of ICVs, aging rates within 1–5, 5–10, 10–15, 15–20, 20–25, and 25–30-year age brackets, and the discarding rate for ICVs. These three factors affect how many vehicles their owners discard at these ages. It is a complex model showing what happens to the overall stock of vehicles in each age category under these various forces. This helps us understand how sales are influenced by aging and scrap, which contributes significantly to understanding what happens within different life stages that affect life spans and trends in fleet composition for conventional vehicles and NGVs. Other vehicle types are also modeled.
N C V = ( S R C V A R C V ( 1 5 ) ) d t + ( S R C V ( 1 5 ) A R C V ( 5 10 ) ) d t + ( S R C V ( 5 10 ) A R C V ( 10 15 ) ) d t      + ( S R C V ( 10 15 ) A R C V ( 15 20 ) ) d t + ( S R C V ( 15 20 ) A R C V ( 20 25 ) ) d t      + ( S R C V ( 20 25 ) A R C V ( 25 30 ) ) d t + N C V 0
To consider P i as the probability of vehicle i being chosen at time t, it is necessary to know the consumers’ tendency towards NGVs, ICVs, and HEVs. Therefore, the mechanism of acquiring a perception of a particular technology is a cumulative process in every society that introduces familiarity to choosing a vehicle [7]. Since the level of familiarity improves in response to human exposure, in this study, we assume that the social diffusion of vehicles follows the share of each vehicle type in the passenger car fleet. Therefore, familiarity is formulated using Equation (9), which shows the subjective norm ( S N i ( t ) ) :
d F i ( t ) d t = V i ( t ) T V × ( 1 F i ( t ) ) S N i ( t ) = F i ( t )
where F i ( t ) indicates the familiarity of the drivers with vehicle i at time t, V i ( t ) the number of existing vehicles of type i at time t, and TV represents the total vehicles in society. Subjective norms exert influence in several ways, such as social exposure, promotion, and word-of-mouth contact between drivers. Adopting new technologies is highly dependent on the impact of social influences on consumer decisions. A type of vehicle is more likely to be purchased if a sizeable number of vehicles have been adopted, because consumers evaluate their perceptions of vehicle types based on their familiarity with them. Perceived behavioral control, or self-efficacy, is a function of beliefs and intentions. In this study, because affordability and accessibility are conceptualized as potential obstacles, perceived behavioral control is formulated via Equation (10):
P B C i t = A f f i t + A c c i ( t )
A f f i ( t ) and A c c i ( t ) represent affordability and accessibility of vehicles. In practice, according to TPB, attitudes, subjective norms, and perceived behavioral controls collectively influence the formation of an intention, which is an indicator of an intent to purchase a type of vehicle. In other words, although a type of vehicle might be attractive from an attribute perspective, it will not be chosen if the level of familiarity with this type is low. The level of familiarity with a given vehicle type can be increased in several ways, such as wide advertisement, word of mouth, etc. Therefore, the share of any vehicle is defined as the product of the subjective norm, the probability of the customer’s preferences, and the perceived behavioral control, which is formulated as shown in the following Equation (11):
T P i ( t ) = S N i ( t ) × P i ( t ) × P B C i ( t ) i T P i ( t ) = 1
where T P i ( t ) represents the share of a vehicle at time t.
Since vehicle growth is assumed to be dependent on the pattern of changes in vehicles per capita, adoption continues to grow to the saturation point for vehicles per capita. The number of each vehicle type at time t is calculated according to Equation (12), which results from the integral of the difference between rates of purchased vehicles and vehicle breakdown at any moment:
d V i ( t ) d t = S i ( t ) D i ( t )
where S i ( t ) and D i ( t ) represent the new vehicle sales and discards, respectively.
In this paper, the age structure of the fleet is also addressed. Aging refers to vehicles transitioning from a younger group, which comprises several stock flows known as cohorts. Equation (13) represents the process of calculating the cohort:
V i t = V i 0 + 0 t ( S i ( t ) + V i t 1 , t D i t V i t , t + 1
Vehicles that are in age cohort t come into cohort t + 1 with a transfer rate of V i t , t + 1 . Overall, the transfer rates can be either positive or negative (a negative transfer rate means that vehicles come from cohort t + 1 to cohort t).
Discards depend on the age of vehicles, while sales in this study are formulated as yearly sales that consist of multiplying increasing total vehicles at any moment by the probability of purchasing the vehicle at time t, which is indicated as follows in Equation (14):
S i ( t ) = T P i t × R V ( t )
where R V ( t ) is the number of added vehicles in the system at any moment, which is calculated according to Equation (15):
R V ( t ) = V C ( t + 1 ) × P o p u l a t i o n ( t ) / 1000 T V ( t )
V C ( t ) has been obtained through Equation (2).

3.3.2. Fuel Consumption and CO2 Emission

Fuel consumption of each type of vehicle is calculated by multiplying the number of vehicles ( V i ) by the distance covered by vehicles in a year (VTM) by the energy efficiency of vehicles per kilometer ( E E F i ) . The equation is as follows:
F u e l   U s e   ( i ) = V T M × E E F i × V i
To estimate the fuel consumption efficiency of vehicles per kilometer, we utilize recorded statistics for vehicles on an annual basis, taking into account the vehicles’ fuel consumption throughout their lifetimes. By doing so, we can calculate the weighted average fuel consumption efficiency for vehicles in Iran using Equation (17):
E E F i ( t ) = j = 1980 V i , j t T V t × A E j t
Equation where V i , j ( t ) , T V t , and A E j ( t ) represent the number of registered vehicles of type i at time t that were produced in year j , the number of total vehicles, and the average fuel efficiency of produced vehicles in year j at time t , respectively.
For the sake of evaluating the effect of changing gasoline prices, Equation (18) is employed, in which the repercussions of anxiety levels, AN(t), can be measured by dividing the cost of fuel consumption, CF(t), by the sum of transportation share in the family budget, ST(t), and additional expenses due to inflation, EIF(t).
A N ( t ) = C F ( t ) E I F t + S T ( t )
CO2 emissions are calculated according to Equation (19) by the GHG factors.
C O 2 E m i s s i o n   ( i ) = F u e l   U s e   ( i ) × G F i × V i

3.3.3. Refueling Stations

In order to develop fast-charging stations, ensuring profitability is crucial. Therefore, aside from needing sufficient demand for these charging stations, it is also imperative that the installation costs and electricity prices are set at levels that ensure profitability for the investor [17]. In this study, the profitability of charging stations is assessed by calculating the Net Present Value (NPV) as follows:
N P V = t C ( t ) ( 1 + r ) t C 0
where C ( t ) and C 0 show the net cash inflow and initial investment, and r is considered the rate of return. According to this formula, if the NPV is positive, installing a new station is profitable. The charging station loop affects the inducements for installing a new charging station. Charging station profitability is applied to exemplify charging station viability. A positive gap between the estimated NPV and the required level of NPV gives rise to an escalating construction rate.
For accessibility formulation, we assume that it consists of two segments. The first segment presents the ratio of the exposure hours of EV and PHEV owners per week to each charging station selected ( N H i ) to the charging duration of the EVs per week at each charging station ( T i ). Since the charging stations considered in this paper are in different places, the exposure time of EV owners can vary from place to place, so the first segment indicates the number of times each charging station can charge an EV from a timing viewpoint. The second segment indicates the ratio of the total energy capacity of each charging station and the total energy demand from that charging station by EV owners. In other words, the second segment analyzes accessibility from the viewpoint of sufficient energy demand, thus indicating the number of times each charging station can charge an EV from its energy capacity viewpoint [48]. Therefore, accessibility can be quantitatively formulated as Equation (21):
A i = N H i T i × t o t a l   c a p a c i t y   o f   o p t i o n   i t o t a l   e n e r g y   d e m a n d   f r o m   e a c h   o p t i o n   i
When EV owners want to choose among the available options to charge their vehicle, the four factors previously presented should be considered in their utility function. An EV owner’s utility function can be described as Equation (22):
U C i ( t ) = α × A i ( t ) γ × C C i ( t )
In Equation (22), U C i ( t ) represents an EV or PHEV owner’s utility function for option i at time t. The energy charging cost is denoted by C C i . δ stands for the coefficients of these parameters and α is the coefficient of the accessibility variable. This paper considers a criterion to determine which option the EV owner chooses. The criterion determines the selection probability of each option by the EV owner to charge their car. The selection probability of charging station i at time t depends on consumers’ utility function and is formulated based on the MNL model. This criterion is shown in Equation (23).
P C i ( t ) = exp ( U C i ( t ) ) i exp ( U C i ( t ) )  
The number of charging stations increases with new construction and decreases with the end of the lifetime. The rate of requesting charging stations can change according to Equation (24):
R C t = D P t × ( M A X ( 0 , D C t E C t )
The decision to install a new charging station, DP(t), depends on the profitability of constructing a new charging station resulting from the NPV. The number of required charging stations stems from the difference between the demanded charging station, DC(t), and the existing charging station, EC(t). The maximization function ensures that the needed charging station remains non-negative. The installation of a new charger can also be restricted by having pressure on the power grid, which can be introduced by Equation (25).
P P G t = 1 ( 0.25 ( D E C   ( t ) T C   ( t ) ) × 10 )
In Equation (25), P P G t stands for the constraint of acquiring permission to install a new charger. D E C   ( t ) and T C   ( t ) represent the difference between total capacity and electricity consumption, and total capacity, respectively. The ratio between D E C ( t ) and T C t in Equation (25) shows the percentage of excess capacity needed that is considered to be under 25%. The difference between these two numbers accounts for the reliability of having access to electricity. A 1% decrease in power reliability can reduce permission to install charging stations by 10%.

4. Description of Case Study and Assumptions

The proposed model simulates Iran’s road transportation sector and the adoption of new technologies by 2040. The transportation sector in Iran accounts for a substantial portion of the country’s energy consumption. In 2015, cars consumed 190 million barrels of oil equivalent, which represented 10% of the total energy use and 56% of the total energy consumption within the transportation sector. With a population exceeding 81 million, Iran is one of the leading countries in the Middle East and ranks among the top ten global greenhouse gas emitters. Fuel consumption per capita in Iran is significantly higher than that of developed countries. This can be attributed to factors such as improper pricing policies, low vehicle efficiency, the aging state of Iran’s transport fleet, and taxation policies. In this paper, the cost difference between ICVs and NGVs is assumed to be 250 million rials, reflecting that NGVs are more expensive. HEVs are significantly more costly for customers than ICVs and NGVs due to import costs and high taxes on imported vehicles. We assume the cost of an HEV to be 3.5 times greater than that of a conventional vehicle. However, the prices of EVs and PHEVs drop as a function of production level, from 3.5 times higher than a conventional vehicle to 1.5 times. Considering the extensive data available on NGVs in the domestic market, it is estimated that the depreciation and repair costs of these vehicles are twice as high as those of ICVs. The number of refueling stations per 1000 vehicles for ICVs and NGVs is reported as 4000 gasoline stations and 2500 gas stations, according to transportation statistics in Iran. The number of charging stations depends on electricity sales, which depends on the number of EVs and PHEVs. In this study, the ideal number of charging stations is estimated at 35 stations per 100 plug-in EVs. To compare NGVs with ICVs and HEVs based on practical observations and experiences, we assume the optimal speed for NGVs to be 95 km/h, while for ICVs it is 110 km/h, and HEVs, EVs, and PHEVs can reach up to 120 km/h. Moreover, the initial acceleration of HEVs, EVs, and PHEVs is 20% higher than that of ICVs, while NGVs’ acceleration is 25% lower than that of ICVs.
Table 3 presents historical data on income per capita, the number of cars per 1000 people, and the total number of cars. We also consider two scenarios for population growth in Iran as presented in Table 4: the first projects relatively rapid population growth with a fertility rate of 2.6, while the second assumes a significant decrease in population growth rate with a fertility rate of 1.5 (Statistical Center of Iran). Vehicle fuel consumption at any time is influenced by the lifespan of the vehicle as a depreciation criterion. Vehicles exist in different age intervals in the transport fleet, the shares of which are presented in Table 5. Additionally, efficiency levels in the transport fleet vary uniquely over time due to different vehicle technology levels. Factors such as the aging of vehicles, lack of proper maintenance, and insufficient high-quality fuel supply in the market contribute to a decrease in vehicles’ fuel consumption efficiency. The transportation fleet’s CO2 emissions in this study comprise emissions from gasoline, compressed natural gas (CNG), and electricity. As presented in Table 6, the corresponding amount of carbon dioxide released from one liter of gasoline is 0.0023 tons, and from one m3 of CNG is 0.0027 tons. As electricity in Iran is produced by combined-cycle power plants, thermal power stations, gas power plants, and diesel generators, the average carbon dioxide emission by these power plants is equivalent to 0.00064 tons per kWh (Iran Ministry of Energy). Table 7 demonstrates the data related to charging points considered in this study [48,49,50].

5. Simulation Results

5.1. Behavioral and Structural Validation

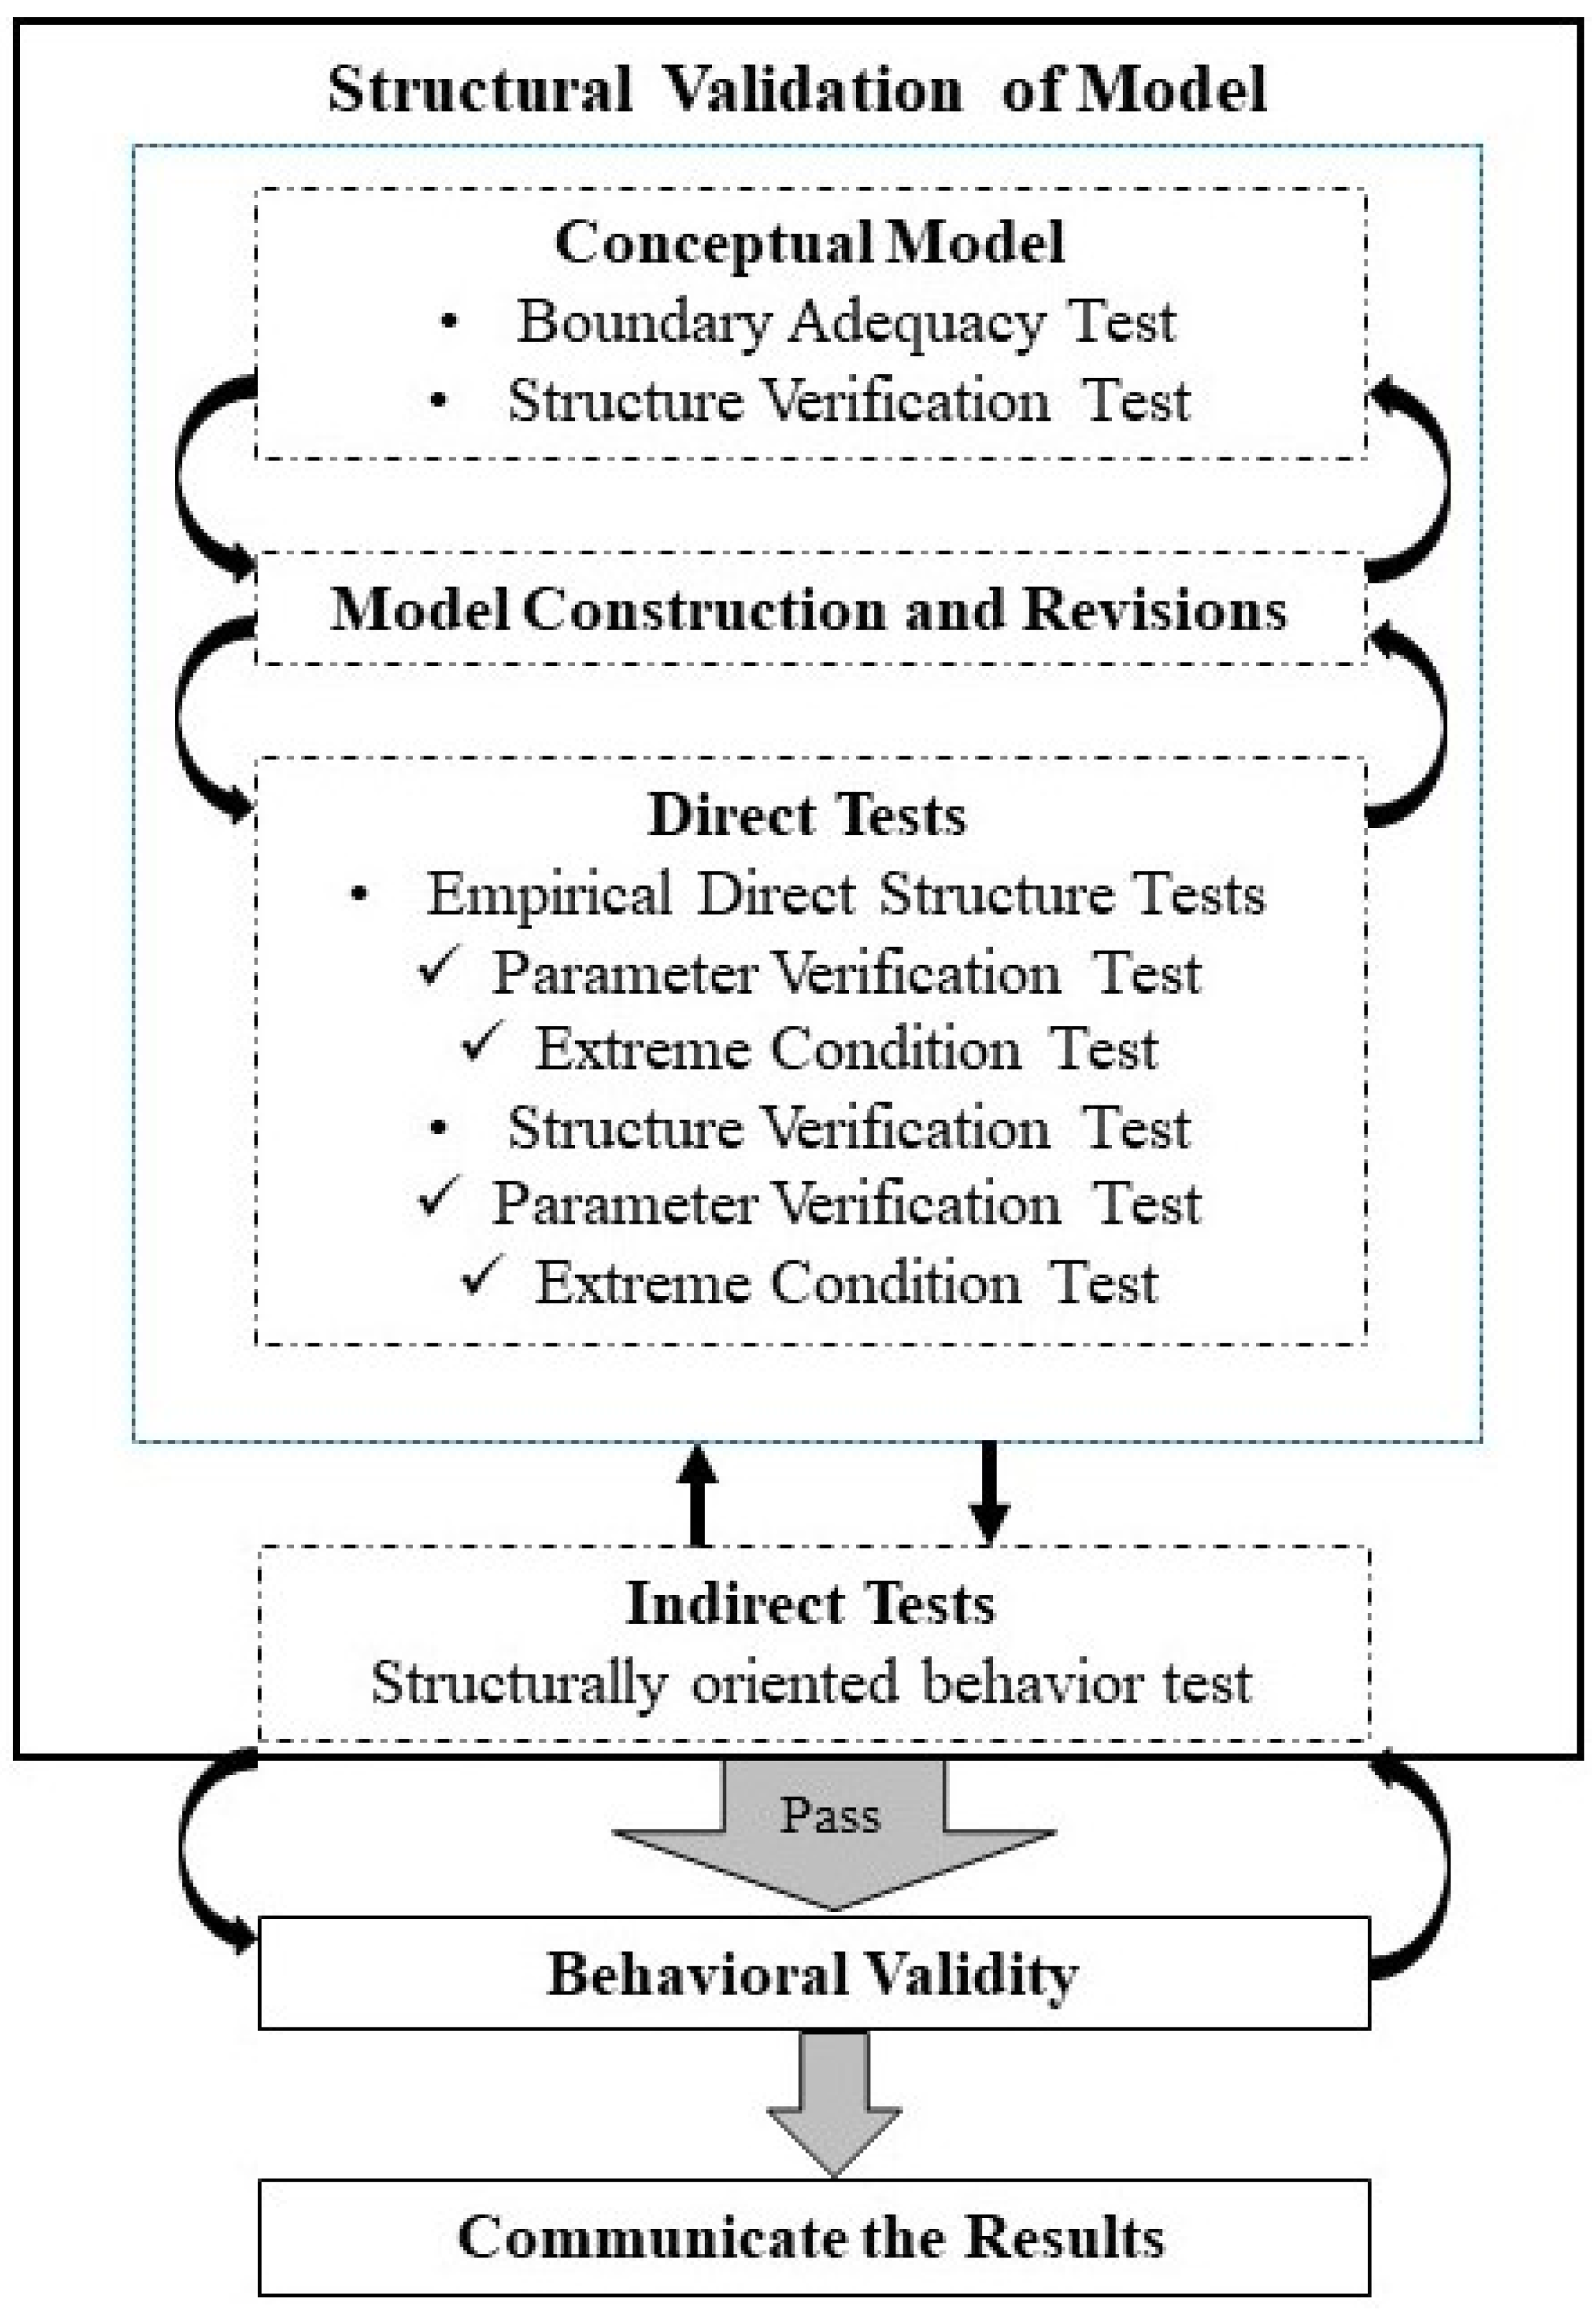
Model validation is a crucial factor in confirming findings. We discuss the steps and validation methods of SD models in the following paragraphs [51]. Both behavioral and structural validation procedures are applied to the model. Figure 6 illustrates the steps of the model validation incorporated in this study. The process begins initially with conceptual model development, which defines the problem and examines available data; this allows for an assessment of boundary adequacy and structure verification. These tests assess the model’s structural validity, which involves a parameter verification test and an extreme condition test. The parameter verification test can be used both as a theoretical test and an empirical test, which means evaluating the accuracy of the constant parameters concerning the knowledge of the system from both conceptual and numerical standpoints. The direct extreme condition test is another direct test through which the validity of equations can be evaluated under extreme conditions. This test uses knowledge of the real system and the predictive capacity of the model to determine outcomes under such conditions in real life. For example, if the population were zero, there would be no vehicle production rate. Thus, each model equation can be tested with extreme values and compared with the real situation.
Another important structural validation is a structurally oriented behavior test, which can be applied to the entire model or sub-models. They allow a behavioral sensitivity test to be conducted to determine parameters to which the simulated model is sensitive and to find out whether the real system demonstrates such sensitivity to these parameters [52]. As can be seen in Figure 6, the validity tests are interconnected; as such, they can provide feedback to one another.

5.1.1. Structural Validity

Boundary Adequacy

The model’s adequacy was checked according to the literature and discussions with experts. Consistent with forecasting the future of the vehicle market, all important factors, including the total vehicle number, EV number, familiarity, tendency to purchase a vehicle, charging station installation capacity, tendency to invest in charging infrastructure, vehicle attributes, the cost of EV batteries, and gasoline consumption, are obtained endogenously. Vehicles per capita and total population are exogenous variables.

Extreme Condition Tests

In the extreme condition test, the extreme values of selected variables are compared with either the anticipated or reference behavior of the system under the same extreme conditions. The model presented in this study was tested using extreme conditions for the number of vehicles, which revealed that the model’s results were consistent with the real system under these extreme conditions. The time frame for changing the rate of familiarity with EVs was extended to more than 10 years, whereas the real model assumes a yearly rate. As a result, the model showed a significant decrease in the number of EVs and a lack of inclination to purchase EVs. These outcomes are reasonable and predictable. Furthermore, the perceived behavioral control for EVs was set at zero, resulting in no growth for EVs. These findings strongly align with the TPB, as the factors explained in Section 2 can directly influence changes in purchasing intention, and perceived behavioral control can act as a limiting factor. Another test pertains to the power grid constraints that could restrict the installation of charging stations. This outcome can be anticipated through the causal loop diagram, and the model test can validate this behavior.

Parameter Verification

In this study, most values assigned to the parameters stem from numerical data and data from Iran. For instance, factors related to vehicle age, along with CO2 emission factors, are presented in Table 5. For the remainder of the variables, data availability was low because of the infancy of EVs in Iran; thus, best guesses are used as needed.

Structurally Oriented Behavior Test

This test was conducted to understand how the model’s behavior varies in response to changes in parameter values. Employing this test can provide assurance that the fundamental behavior patterns of key variables, including the counts of different vehicle types, gasoline consumption, and CO2 emissions, served as incentives for modifying the system parameters. In this context, sharp and slight parameter increases and decreases were tested. However, these changes only affect the numerical values of trends, resulting in outcomes such as higher peaks, delayed take-offs, or earlier take-offs. They do not, however, modify the general behavior of the variables.

5.1.2. Behavioral Validity

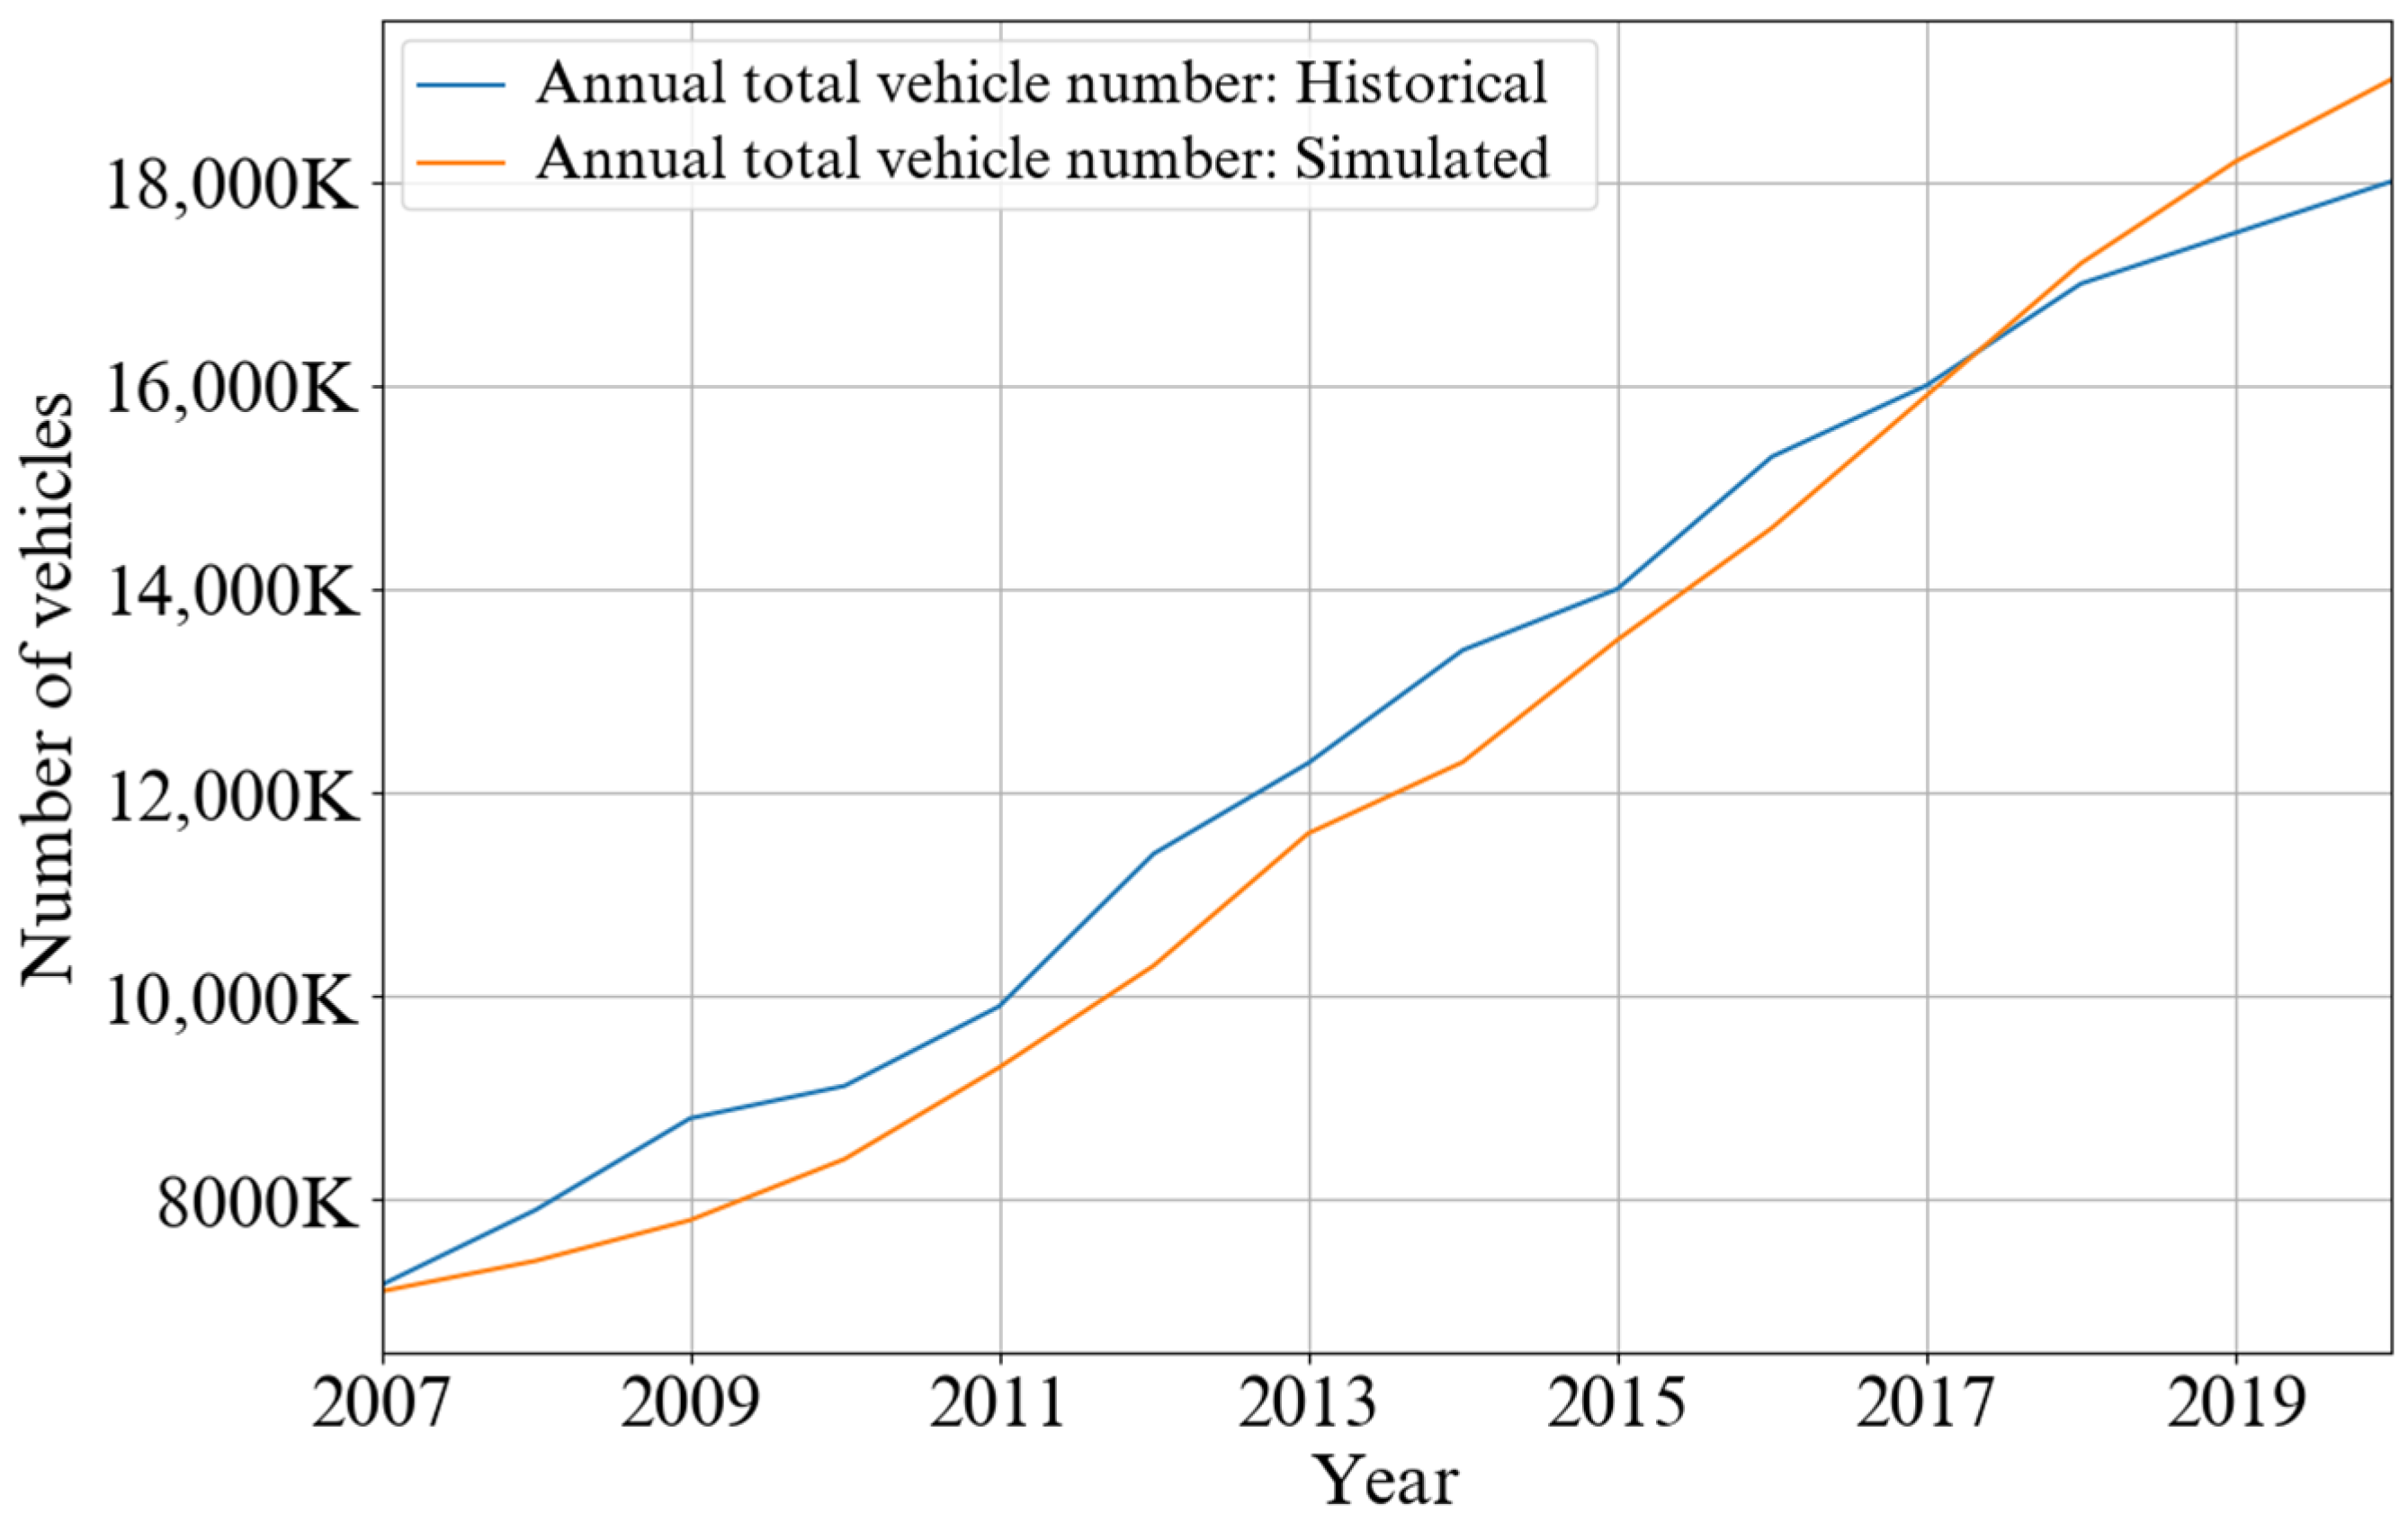
In addition to the structural validity outlined in the prior subsection, it is also crucial to compare the results of the model to historical data to determine how well the model aligns. As illustrated in Figure 7, the number of passenger cars in Iran was used as reliable historical data. Compared with the historical data, the simulation results accurately reproduce the growth trend of passenger cars. The initial value of 7.1 million passenger cars in 2007 is closely aligned with real-world data. The size of Iran’s vehicle fleet has increased from 10 to more than 18 million vehicles in the last ten years, and the model results correspond well to the real-world scenario. Following this comparison of simulated and actual data, the error analysis of the regression models is presented in Table 8. The root mean squared percent error (RMSPE) and mean squared error (MSE) present a normalized estimation of the magnitude of the error and an estimation of the total error, respectively. While the small number of errors complies with the model’s accuracy, large errors likely indicate an inconsistency in the suggested model [53]. According to the results, RMSPE for all data is less than 10%, which means that this model reproduces the behavior accurately. Considering saturation levels of 600 vehicles per capita, R2 equals 0.958, which indicates a strong capability for the model fit to replicate historical data.

5.2. Results

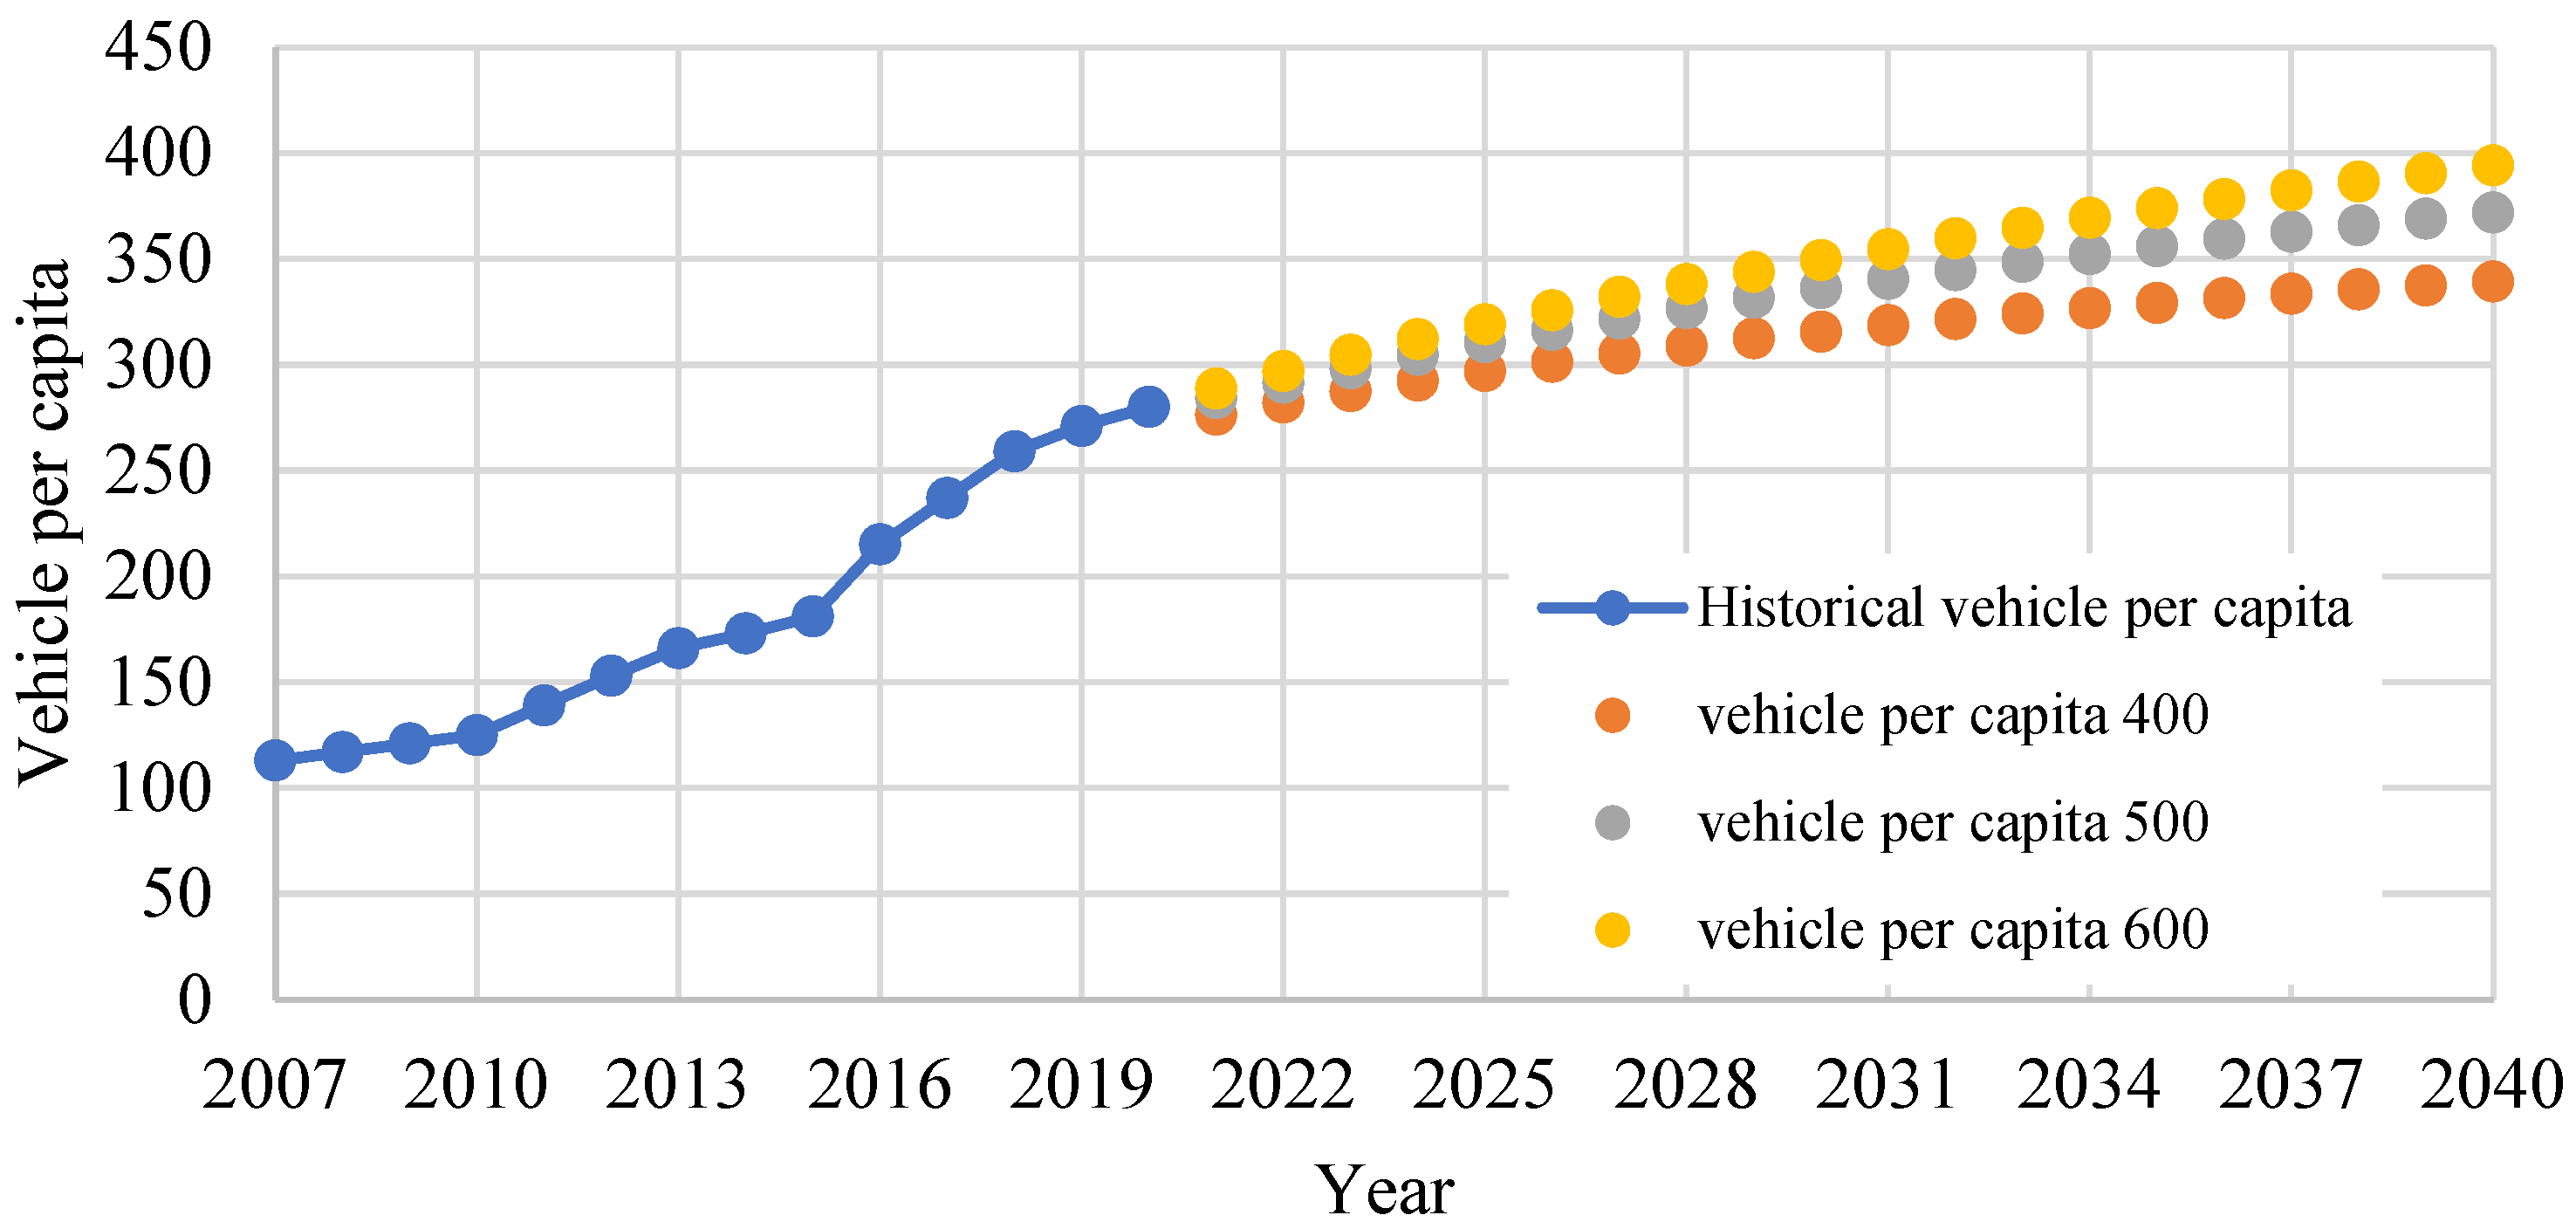
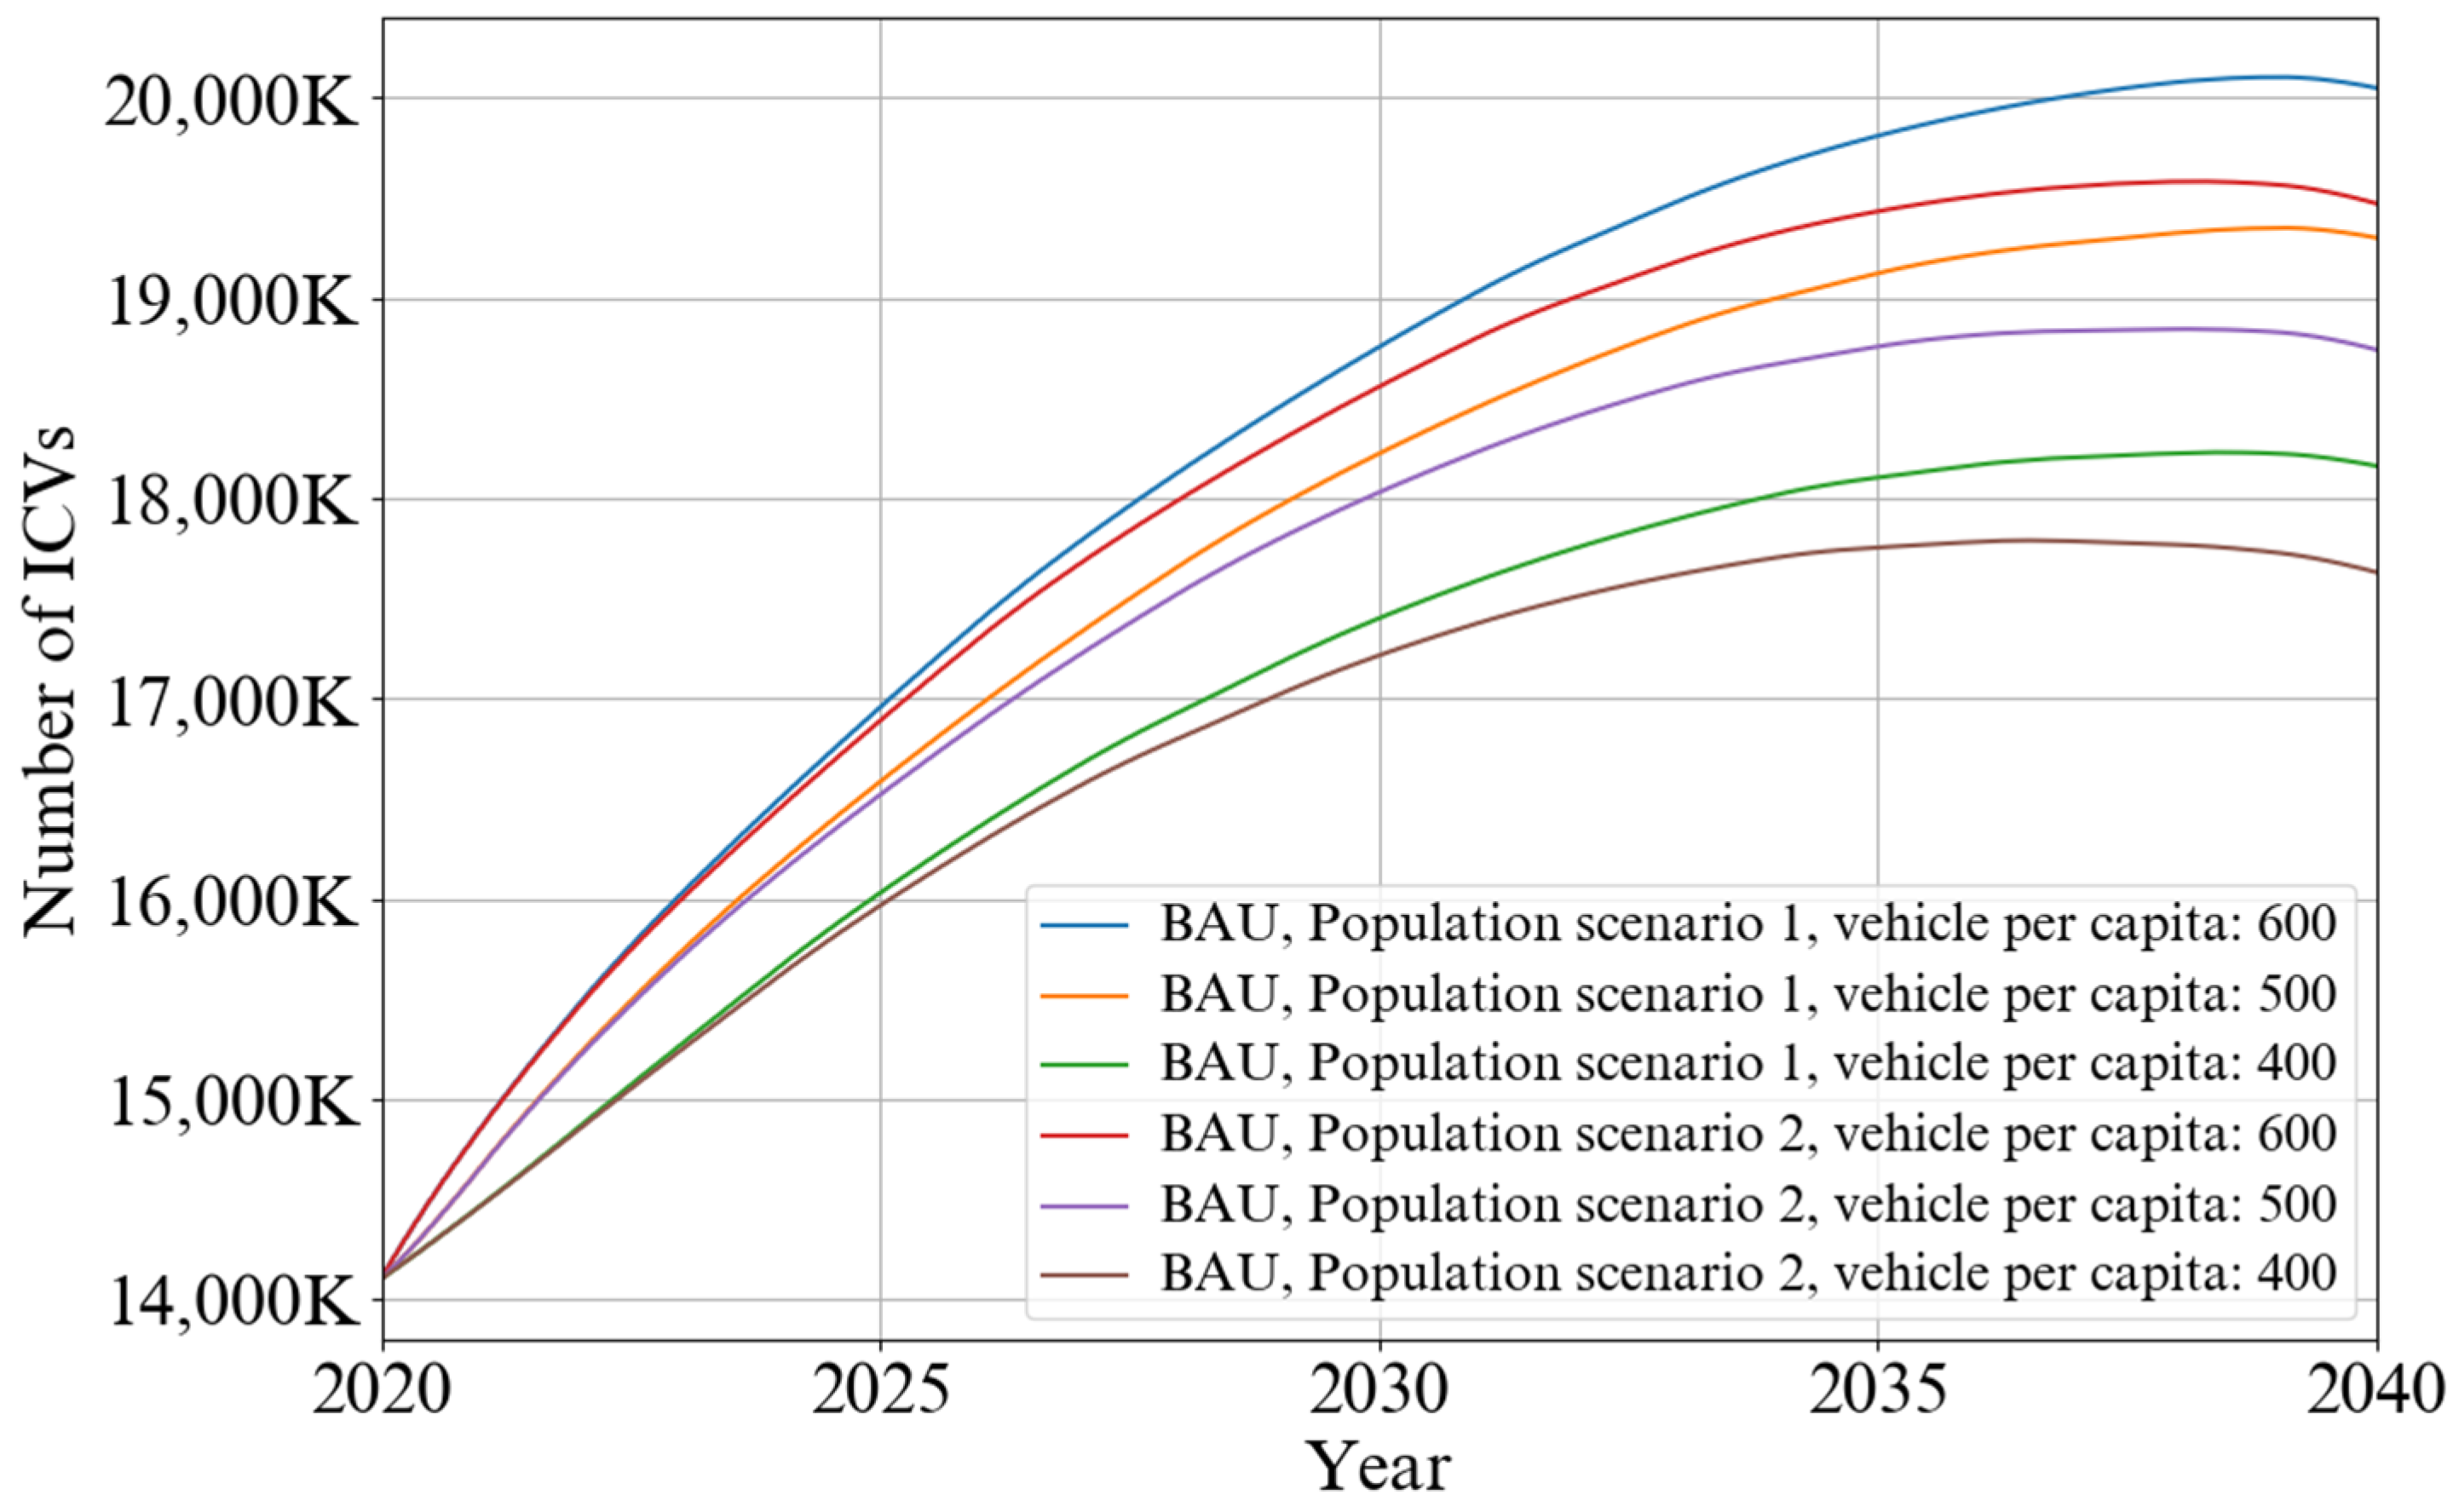
The primary aim of this study was to explore and forecast the pathway for vehicle transportation in Iran along with fuel consumption and CO2 emissions trends, when considering different scenarios and policies. The derived number of vehicles per capita, assuming saturation levels of 400, 500, and 600, is shown in Figure 8. The forecasts show that vehicle ownership in Iran will continue to rise, reaching saturation levels by 2040. Figure 9, Figure 10, Figure 11, Figure 12 and Figure 13 illustrate the trend of ICV, NGV, HEV, PHEV, and EV by 2040 in the BAU case. In this study, we consider two scenarios for population growth and three scenarios for vehicle saturation levels in Iran. As displayed in Figure 9, the number of gasoline-fueled vehicles is projected to continue growing with a relatively steep slope until 2030. After that point, this technology enters its third phase of growth, or the technology maturity phase, where its growth rate decreases compared to previous phases. Even though the curve approaches the saturation level, it does not exhibit a negative slope until 2040. According to this study, with certain assumptions, including a saturation level of 600 cars per 1000 people and a growth in per capita income, we anticipate that the number of gasoline vehicles will peak by 2040 under the first population scenario, reaching 20 million vehicles. In contrast, the lowest projected number of gasoline vehicles is 17.7 million, expected under the second population scenario with a saturation level of 400 vehicles per 1000 people. As shown in Figure 9, the growth rate of this technology is not anticipated to be significant after 2030. Figure 10 represents the projected number of CNG vehicles until 2040.
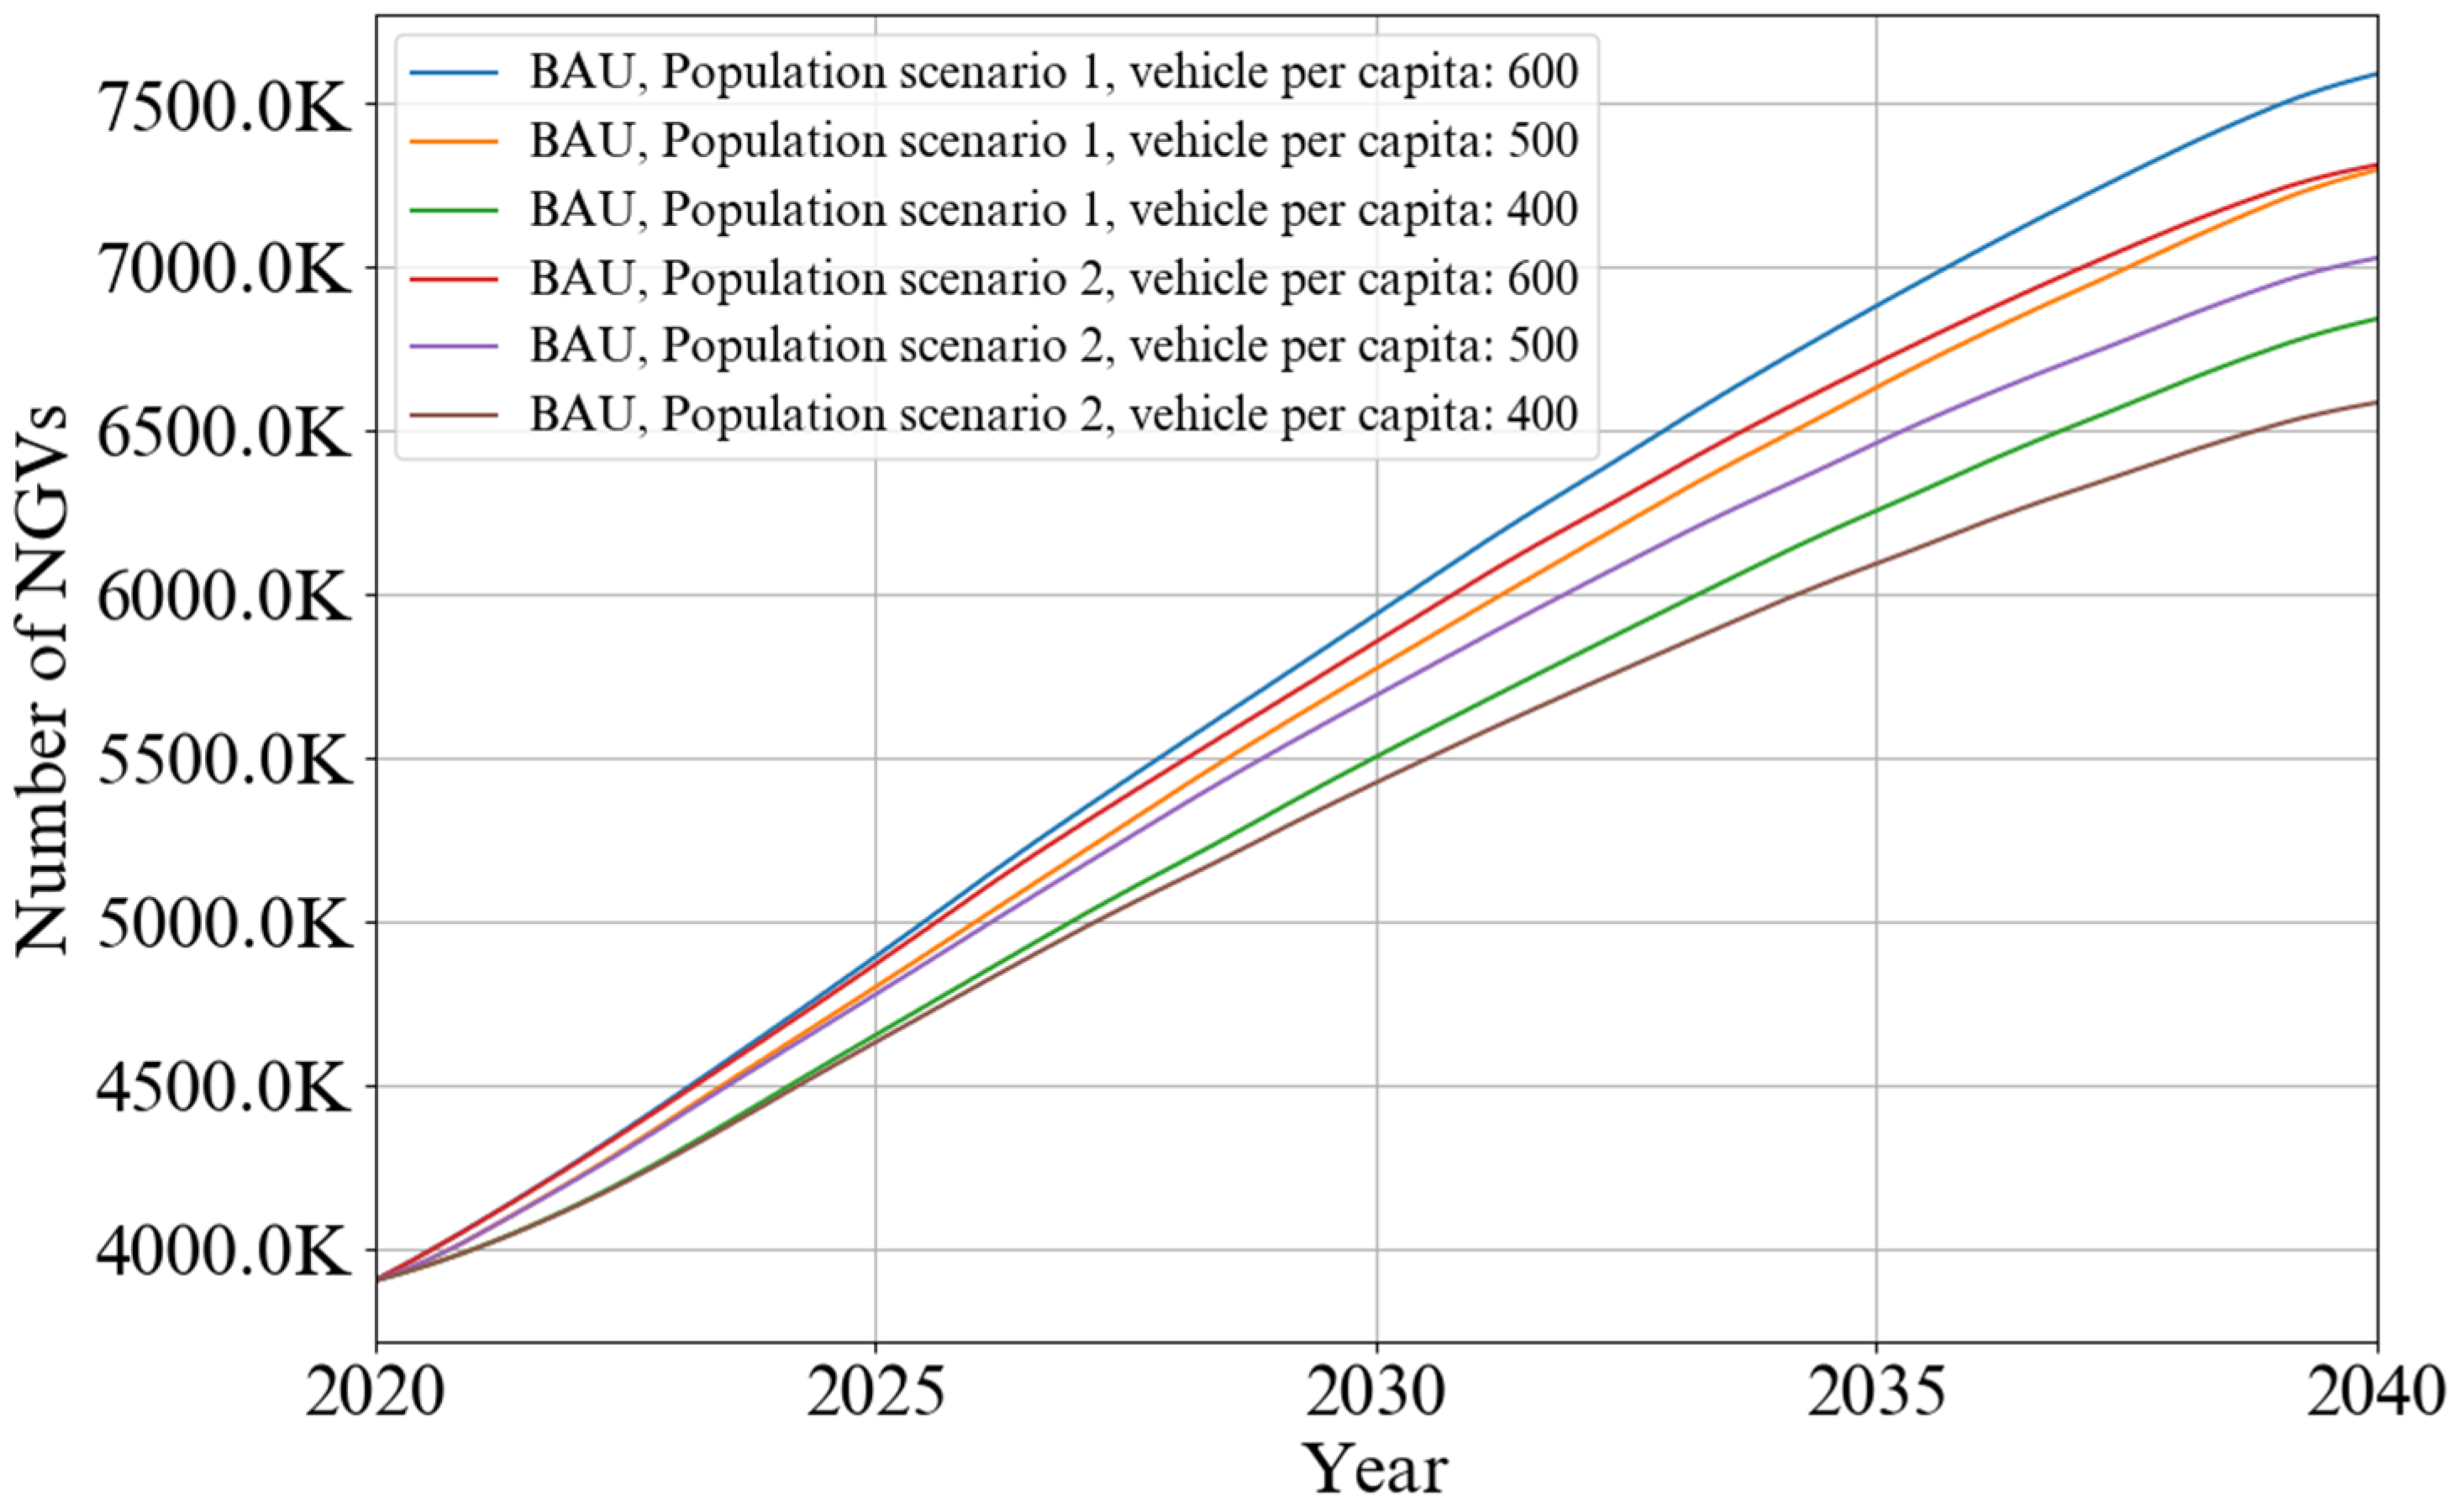
Considering the high depreciation of these vehicles and the difference in price between CNG and gasoline, consumer dissatisfaction with this technology has increased in recent years; thus, the growth expectations for these types of vehicles are limited. According to the projections of the proposed model, the maximum number of these vehicles under the first population scenario is predicted to reach approximately 7.5 million vehicles by 2040, assuming a saturation level of 600 vehicles per 1000 people. Conversely, the minimum number under the second population scenario is projected to reach 6.55 million vehicles, with a saturation level of 400 vehicles per 1000 people. As indicated, the growth trajectory of this technology is steeper than that of gasoline vehicles since they have not yet reached their societal maturity phase. This will allow them to continue their market growth beyond 2030. Figure 11, Figure 12 and Figure 13 present the projected numbers of HEVs, PHEVs, and EVs in the future market, respectively.
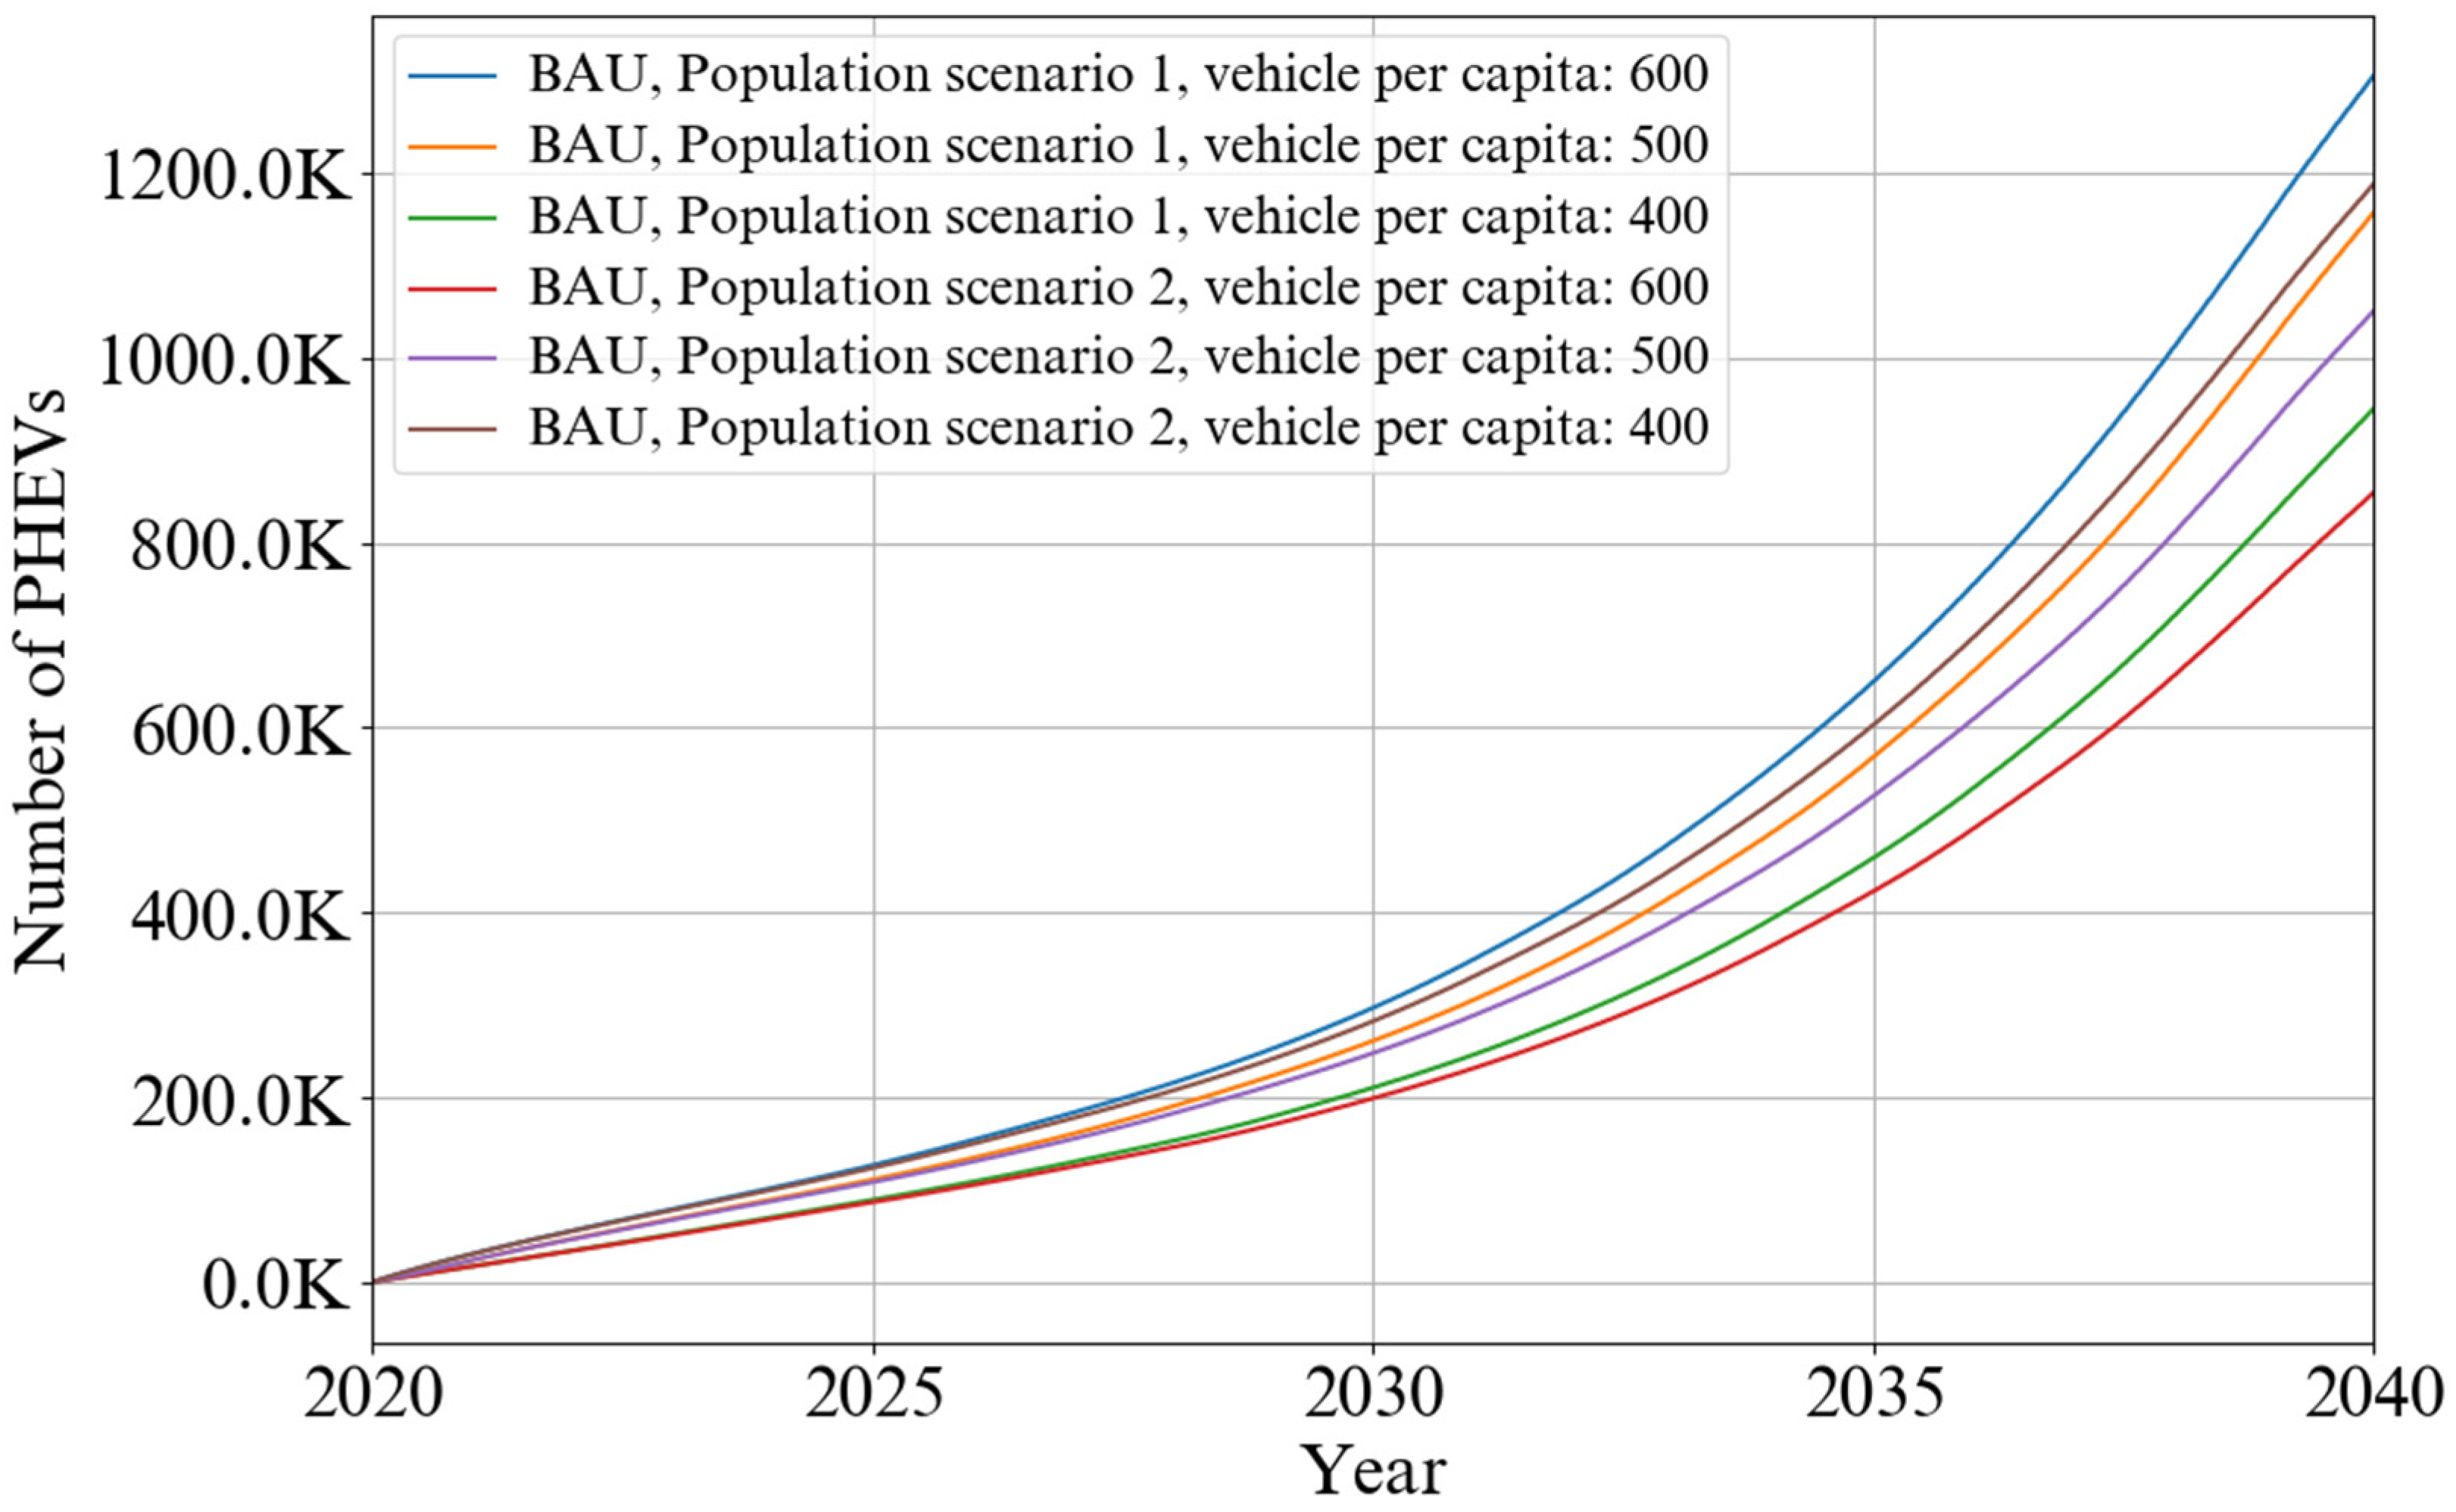
HEVs, which are imported at higher prices relative to conventional cars, have seen insufficient growth due to a lack of awareness, low buyer familiarity with this technology, and high purchase prices. Currently, there are about 180,000 HEVs. As illustrated in Figure 11, under the first population scenario with a saturation level of 600, the number of HEVs in the country is expected to reach 1.7 million by 2040. Under the second population scenario with a saturation level of 400, the number is projected to reach 1.2 million vehicles. Figure 12 and Figure 13 illustrate that, due to similarities between PHEVs, EVs, and HEVs, these technologies are in their first phase in Iran and just beginning to grow. Despite being in the early years of their introduction to the market, they exhibit positive—albeit slow—growth until 2035. Additionally, the learning curve decreases the cost of these vehicles over time, enhancing their appeal and setting them up for popularity in the future. Therefore, under the most complete scenario, the numbers of PHEVs and EVs by 2040 are projected to reach 1.26 million and 860 thousand, respectively. Conversely, under the minimum scenario, these numbers could reach 800 thousand for PHEVs and 600 thousand for EVs.
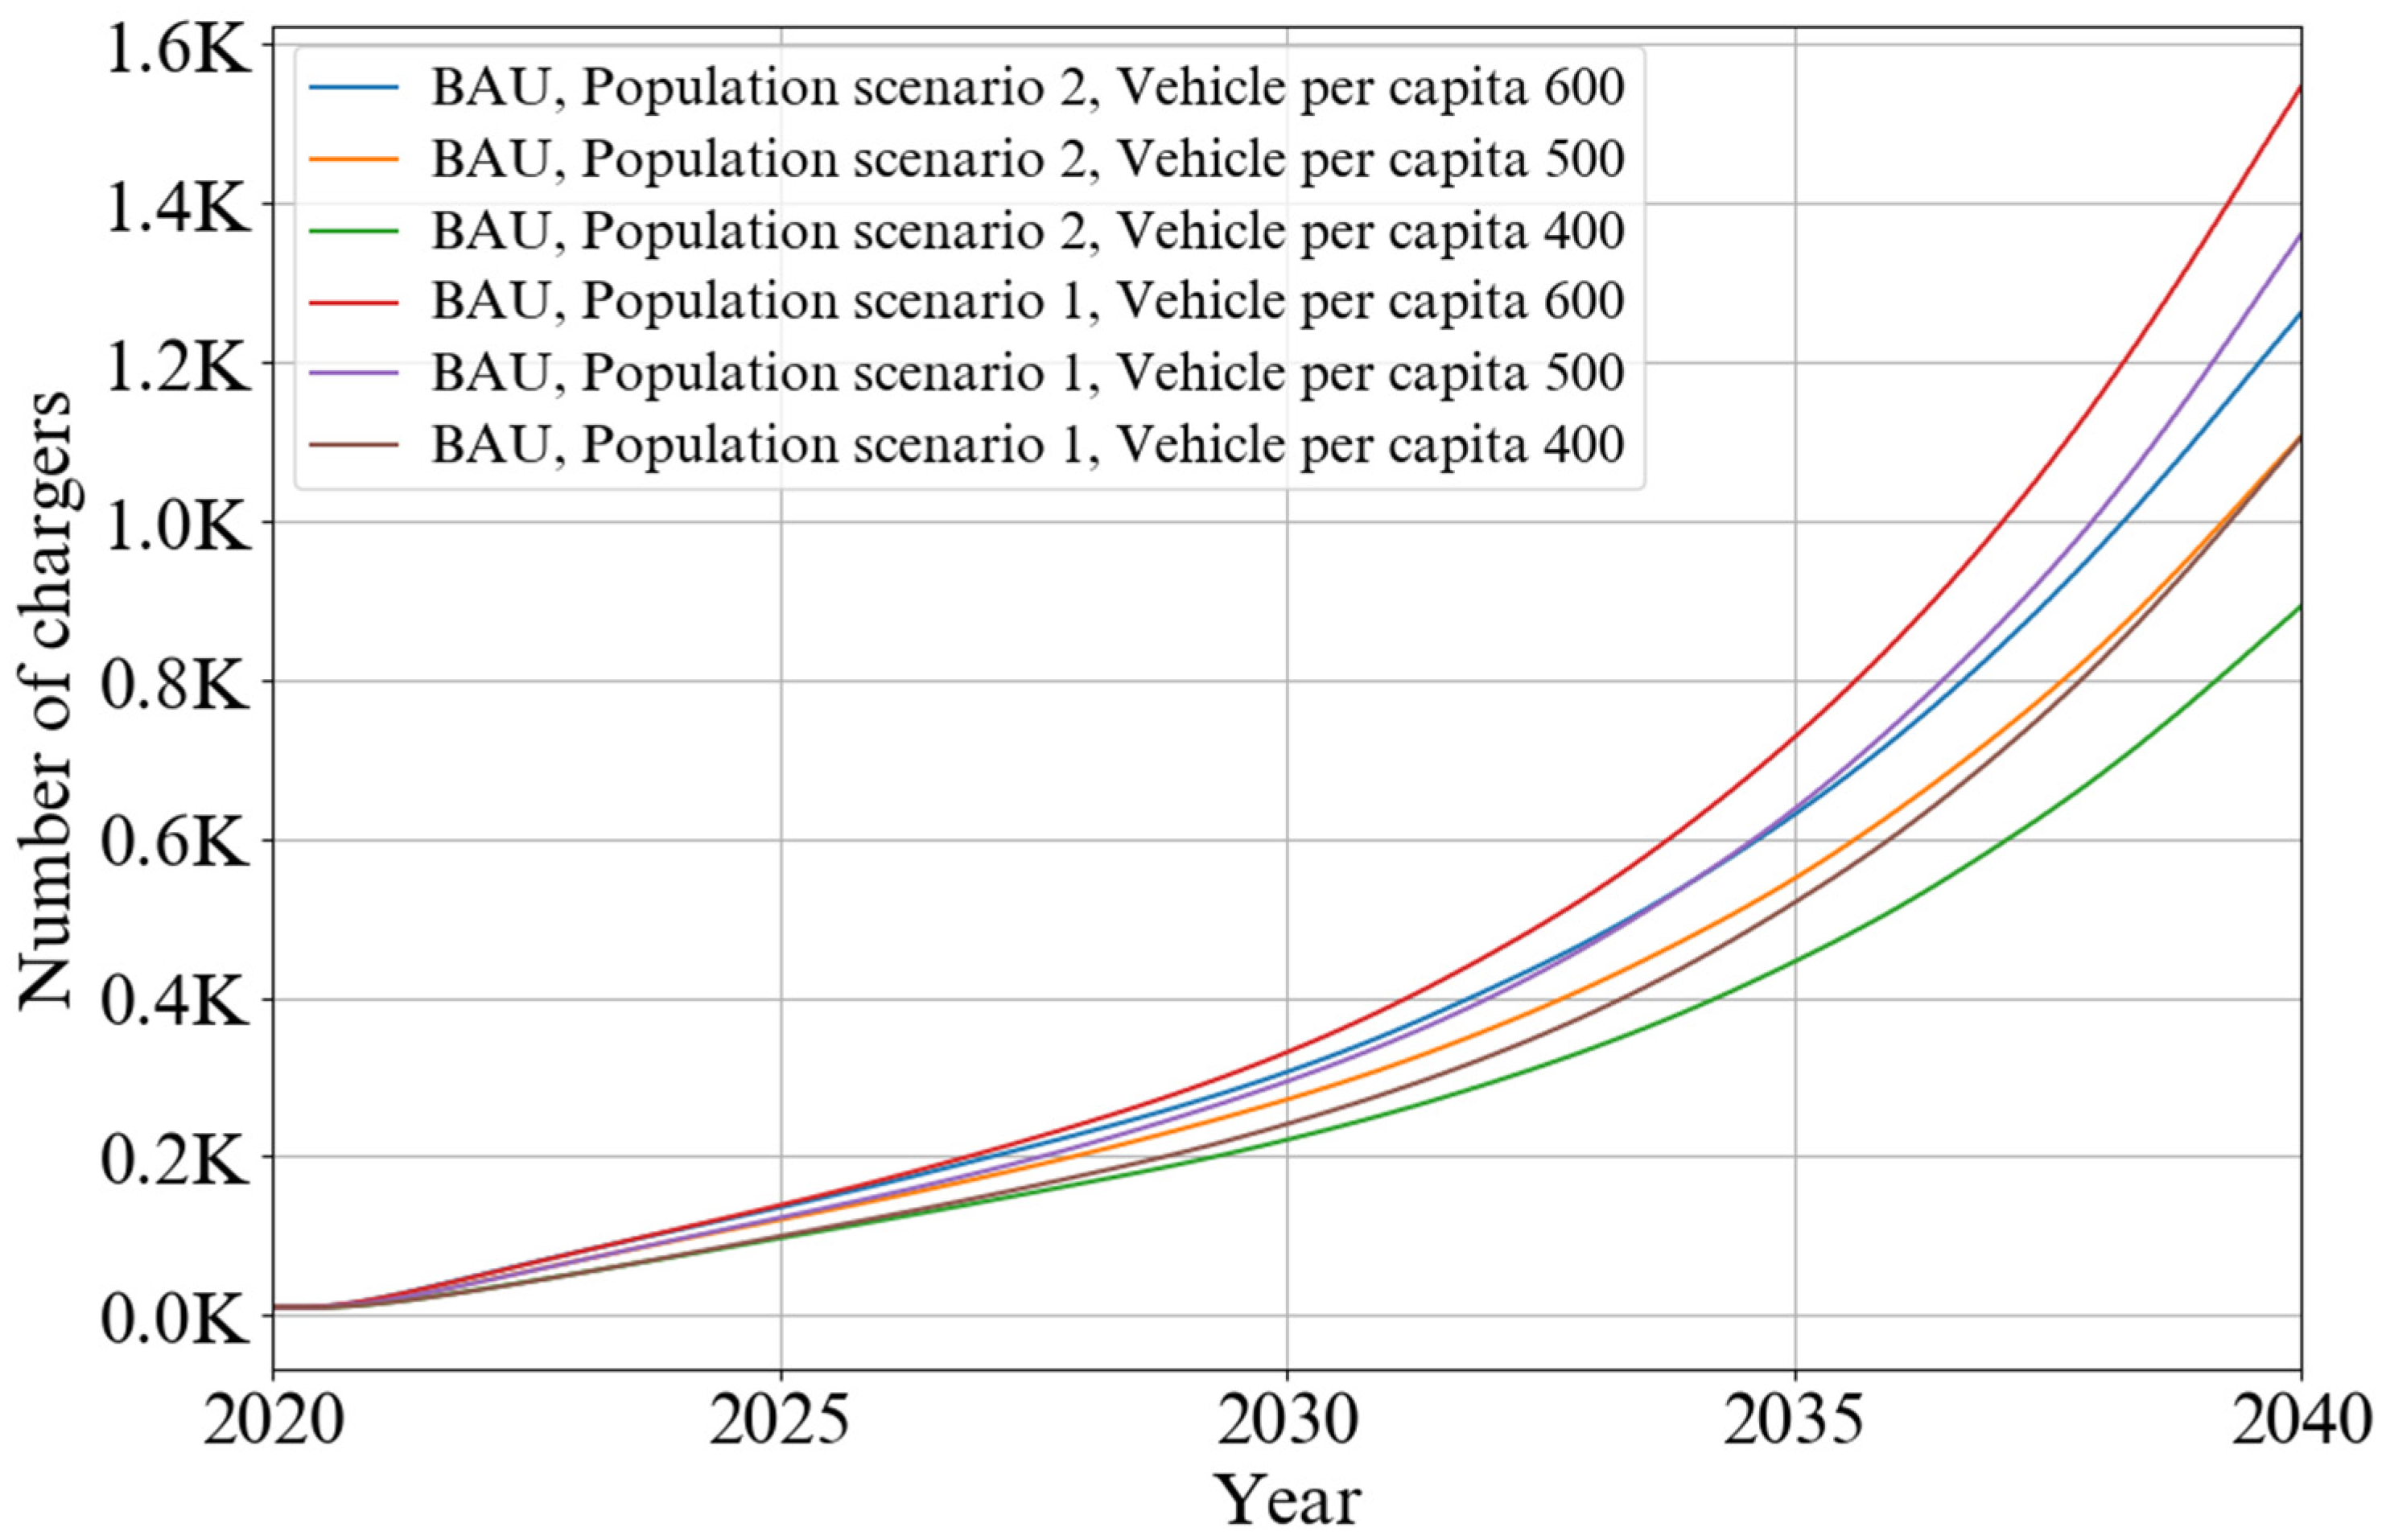
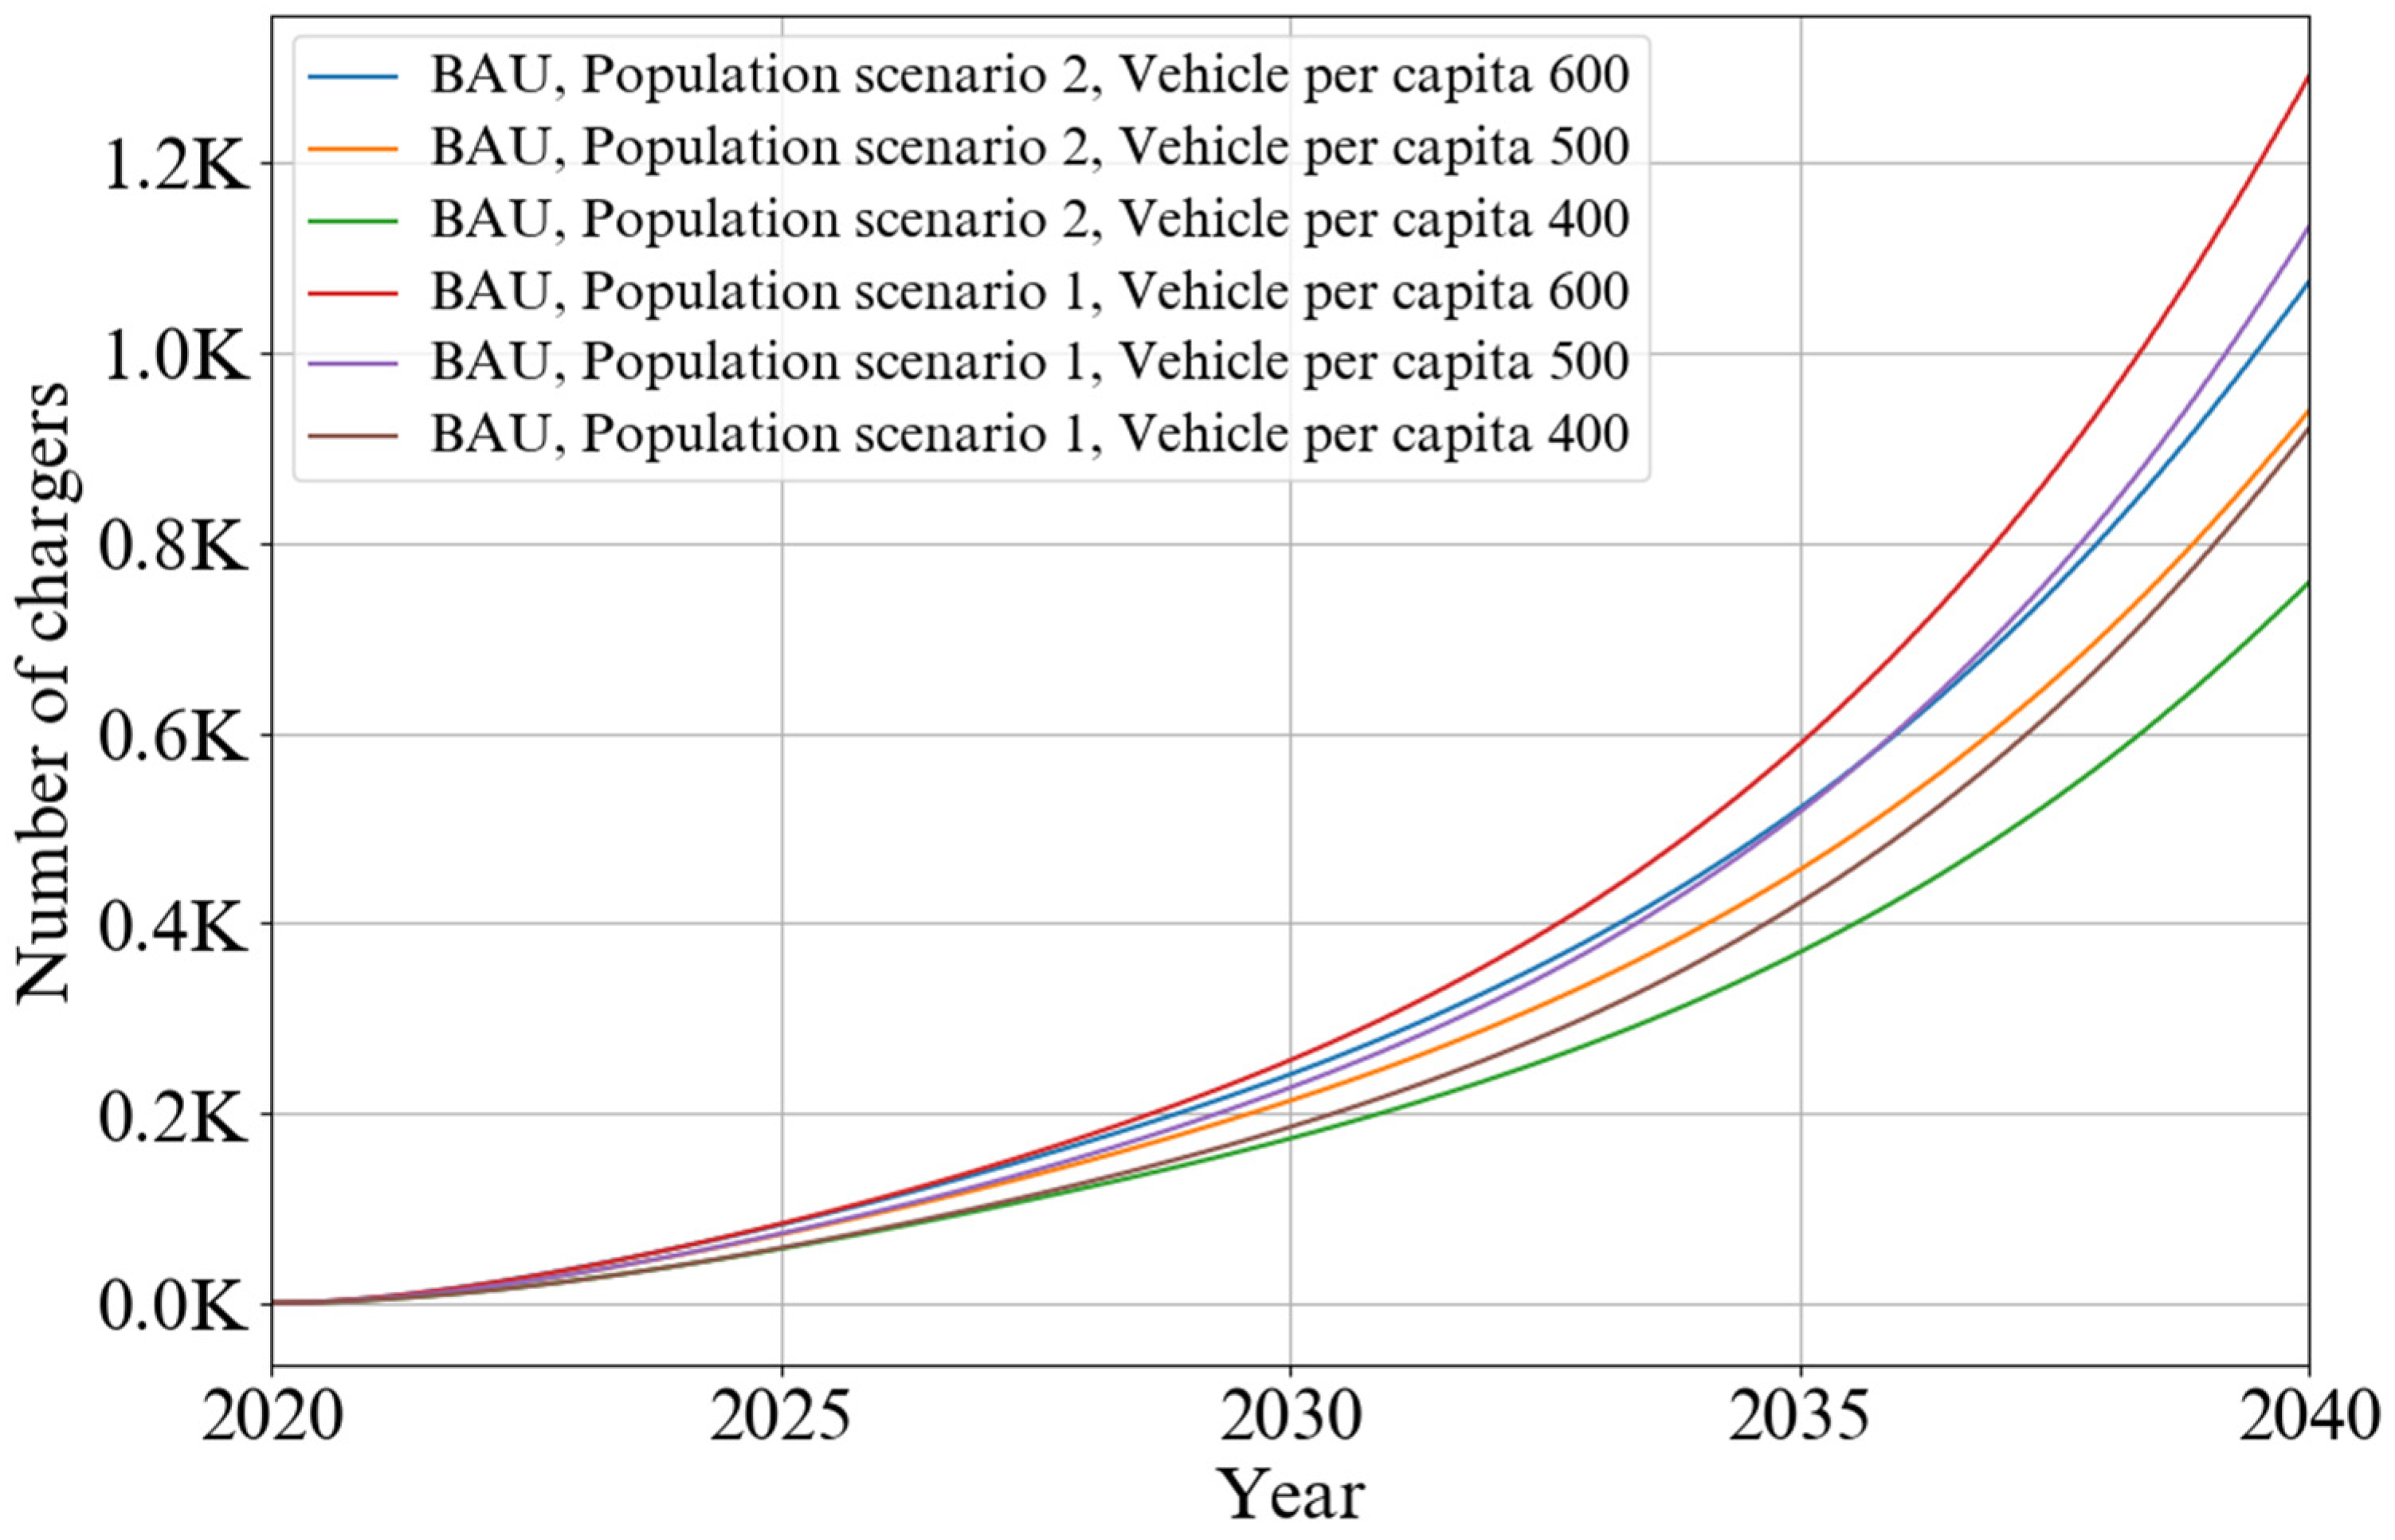
According to the results presented in Figure 14 and Figure 15, the trend of level 2 and 3 public stations shows more significant growth. Low investment is a significant reason for the motivation to develop such projects. Moreover, these trends are similar to the growth rate of the EV fleet, which indicates that investors’ motivation for installing public stations mainly depends on people’s eagerness to buy plug-in EVs.
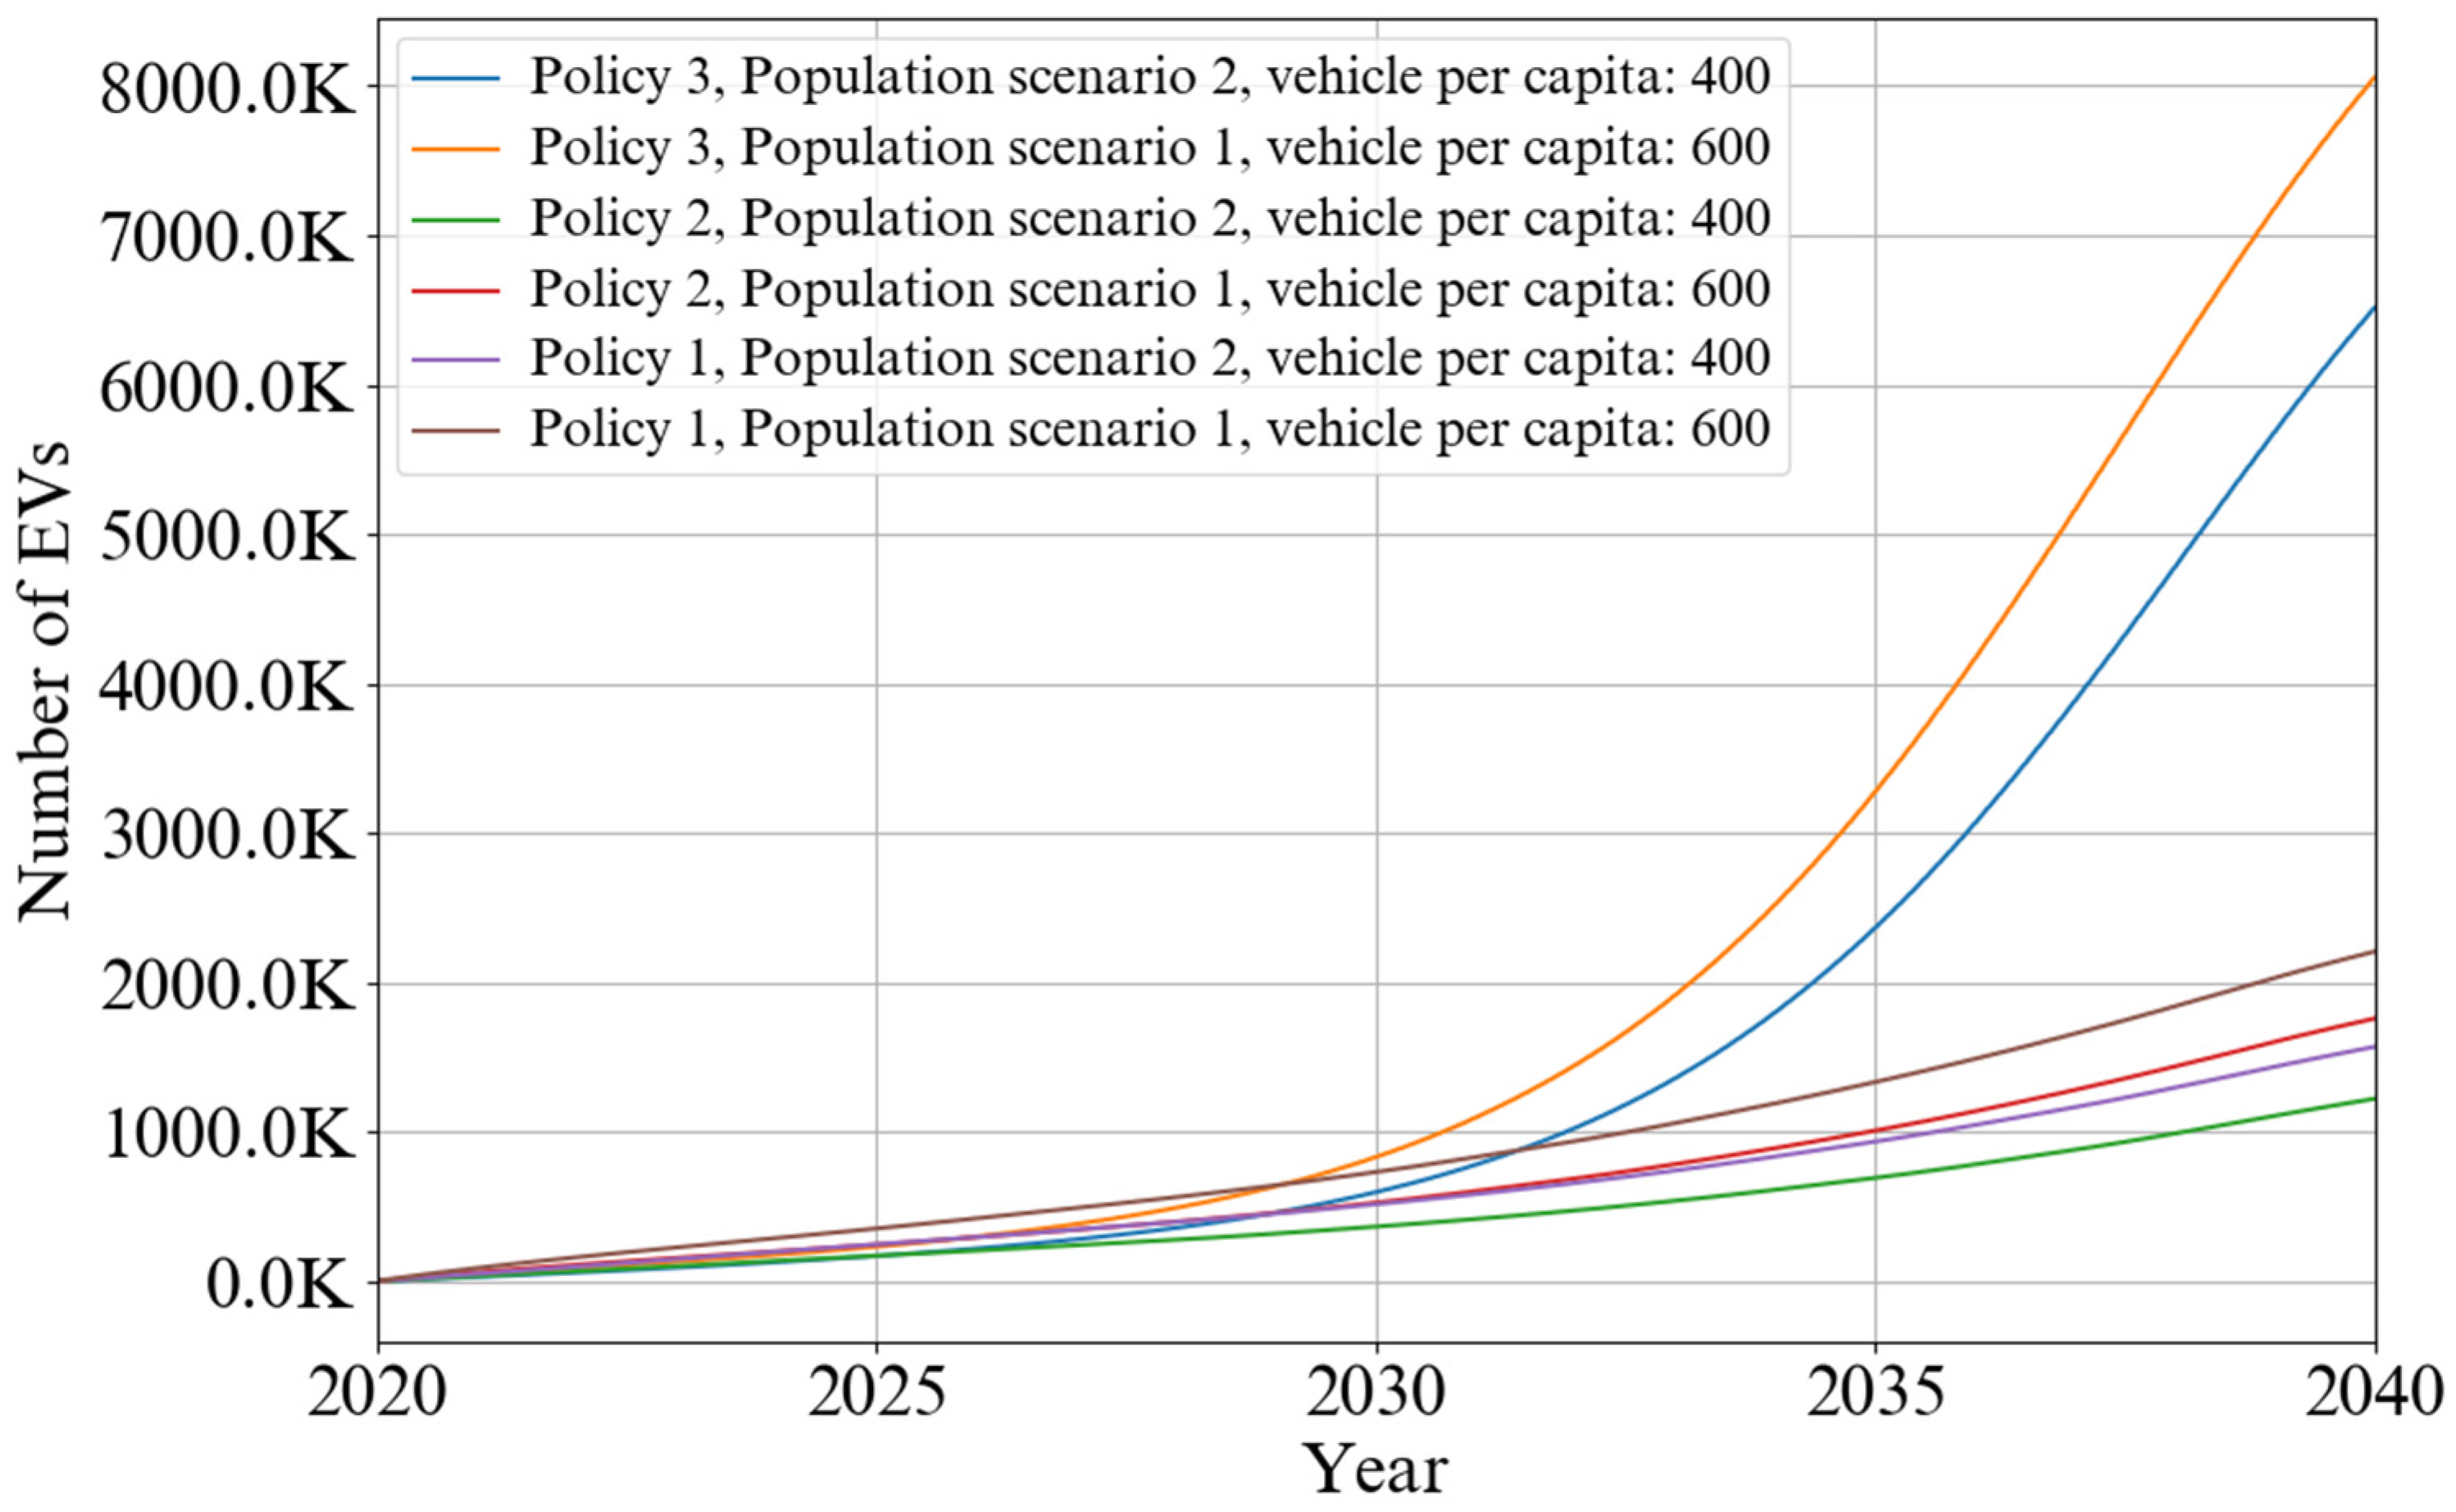
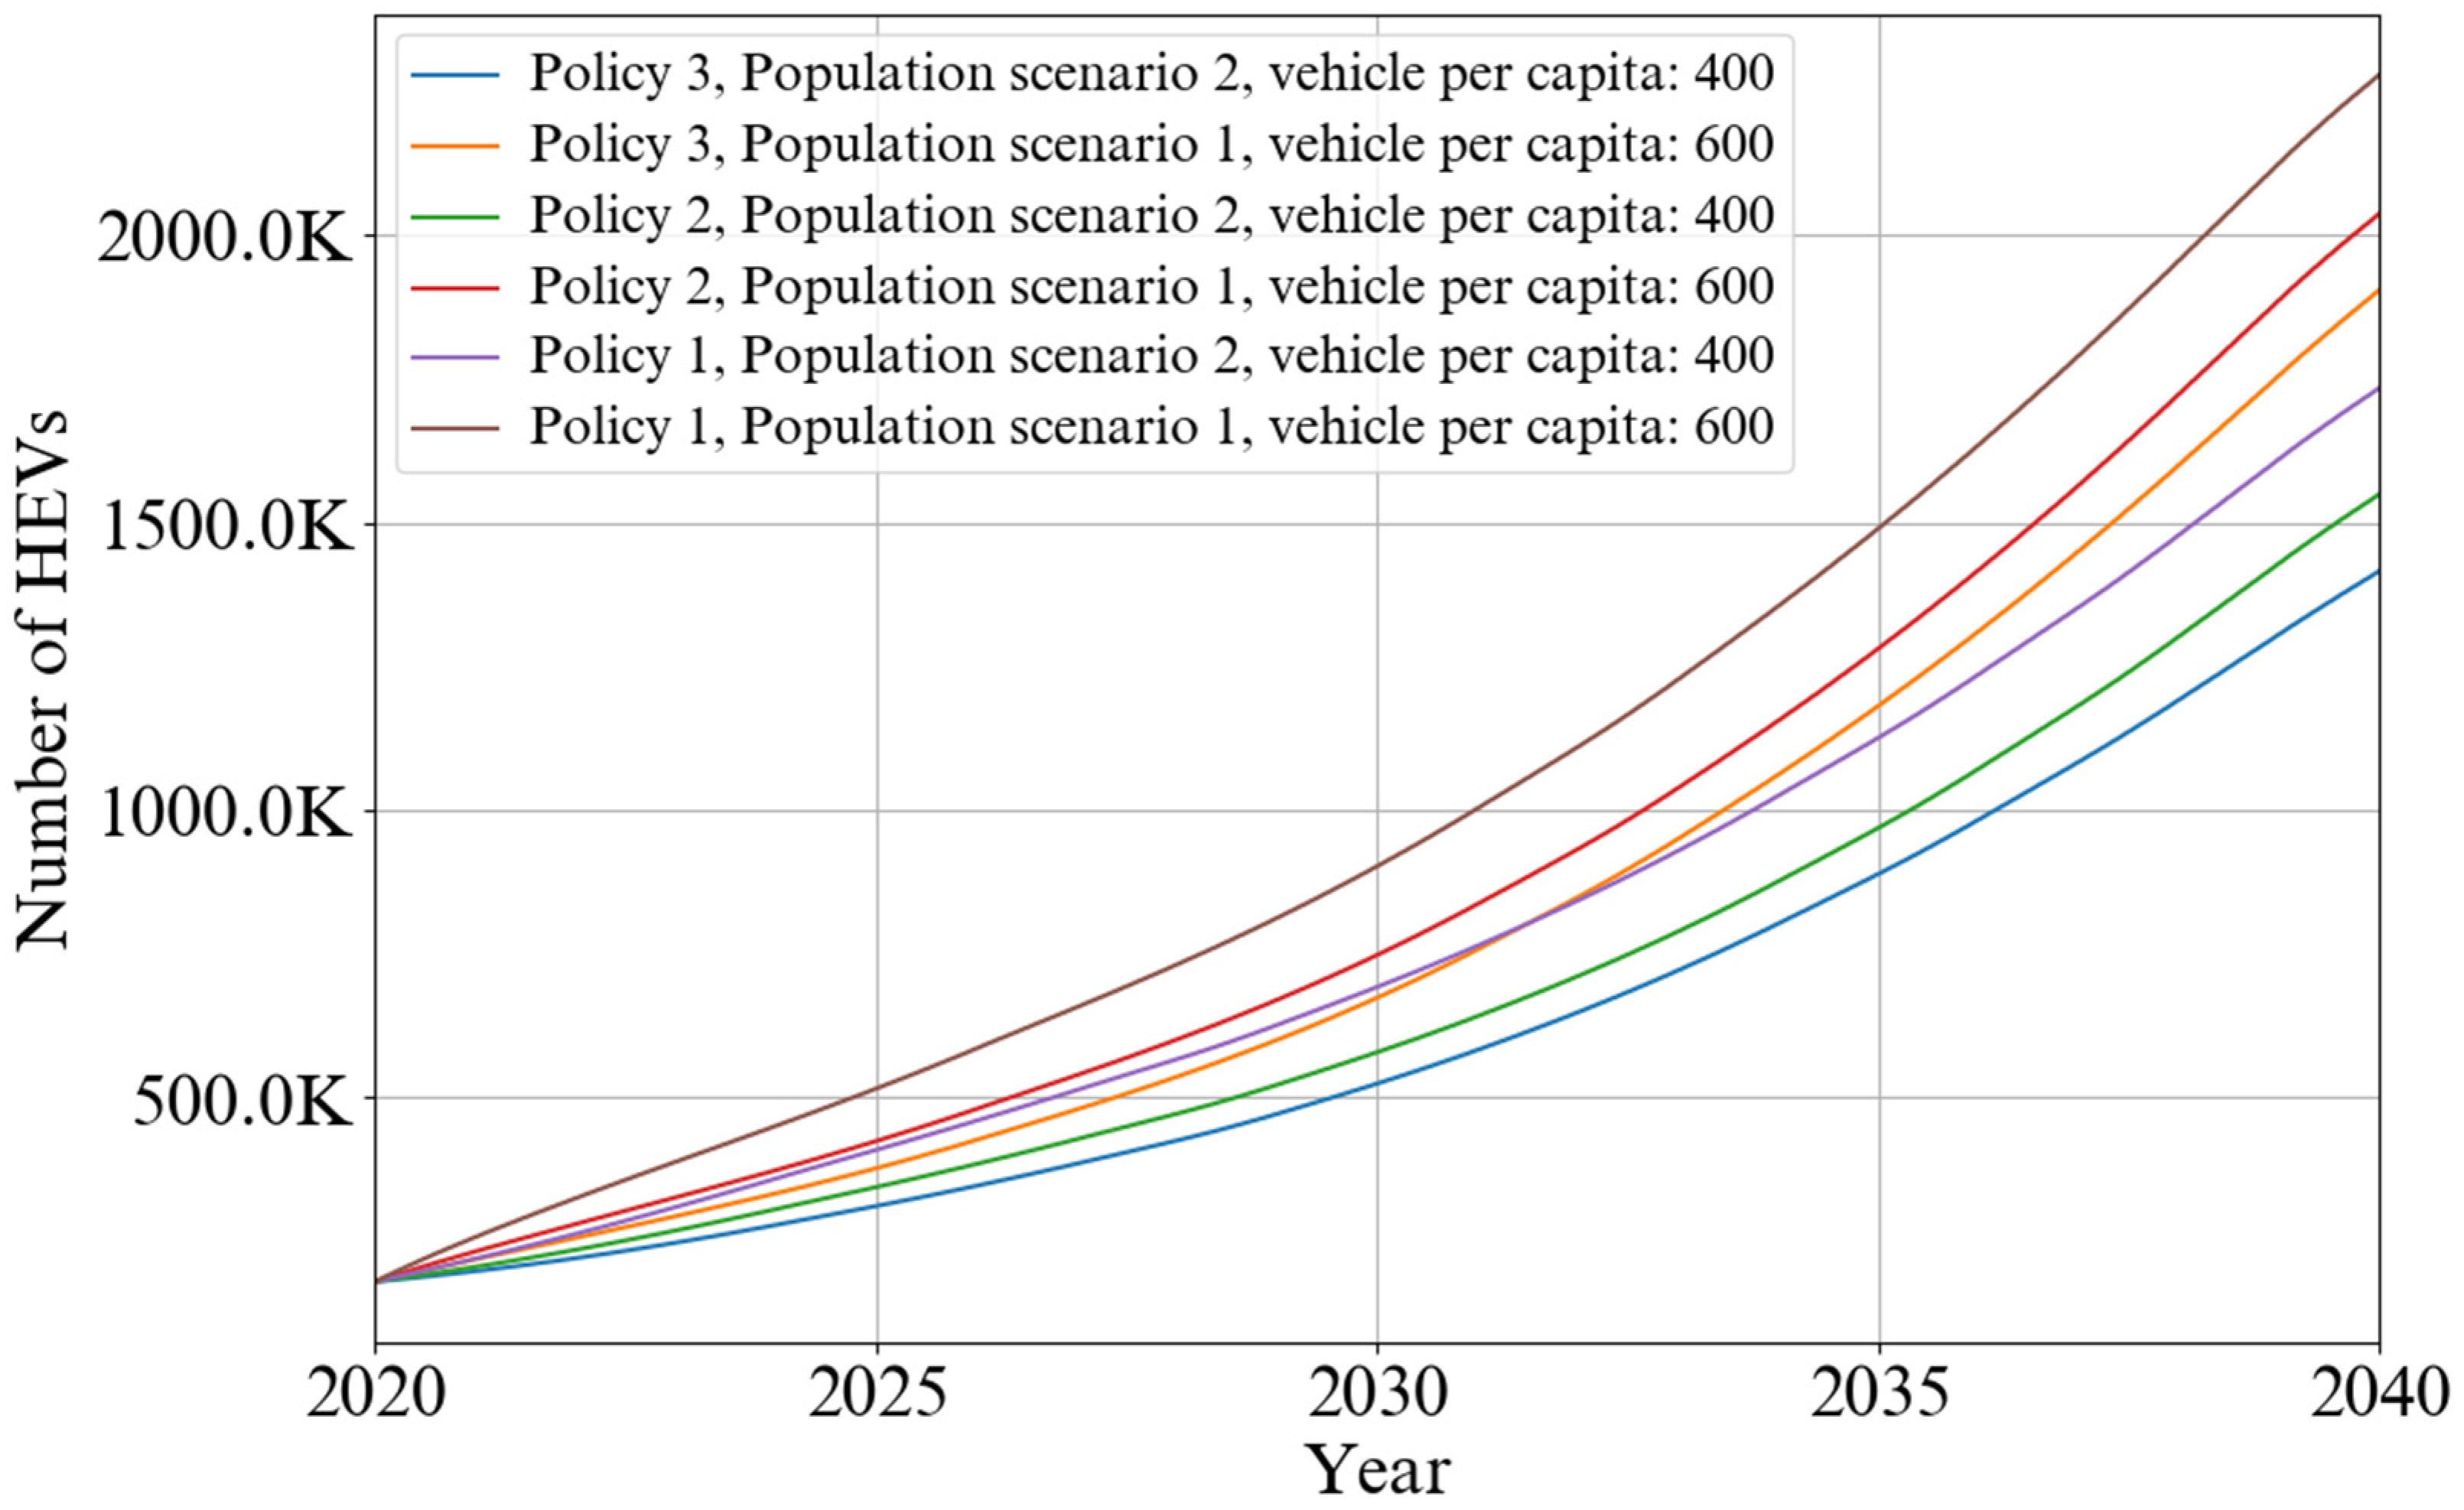
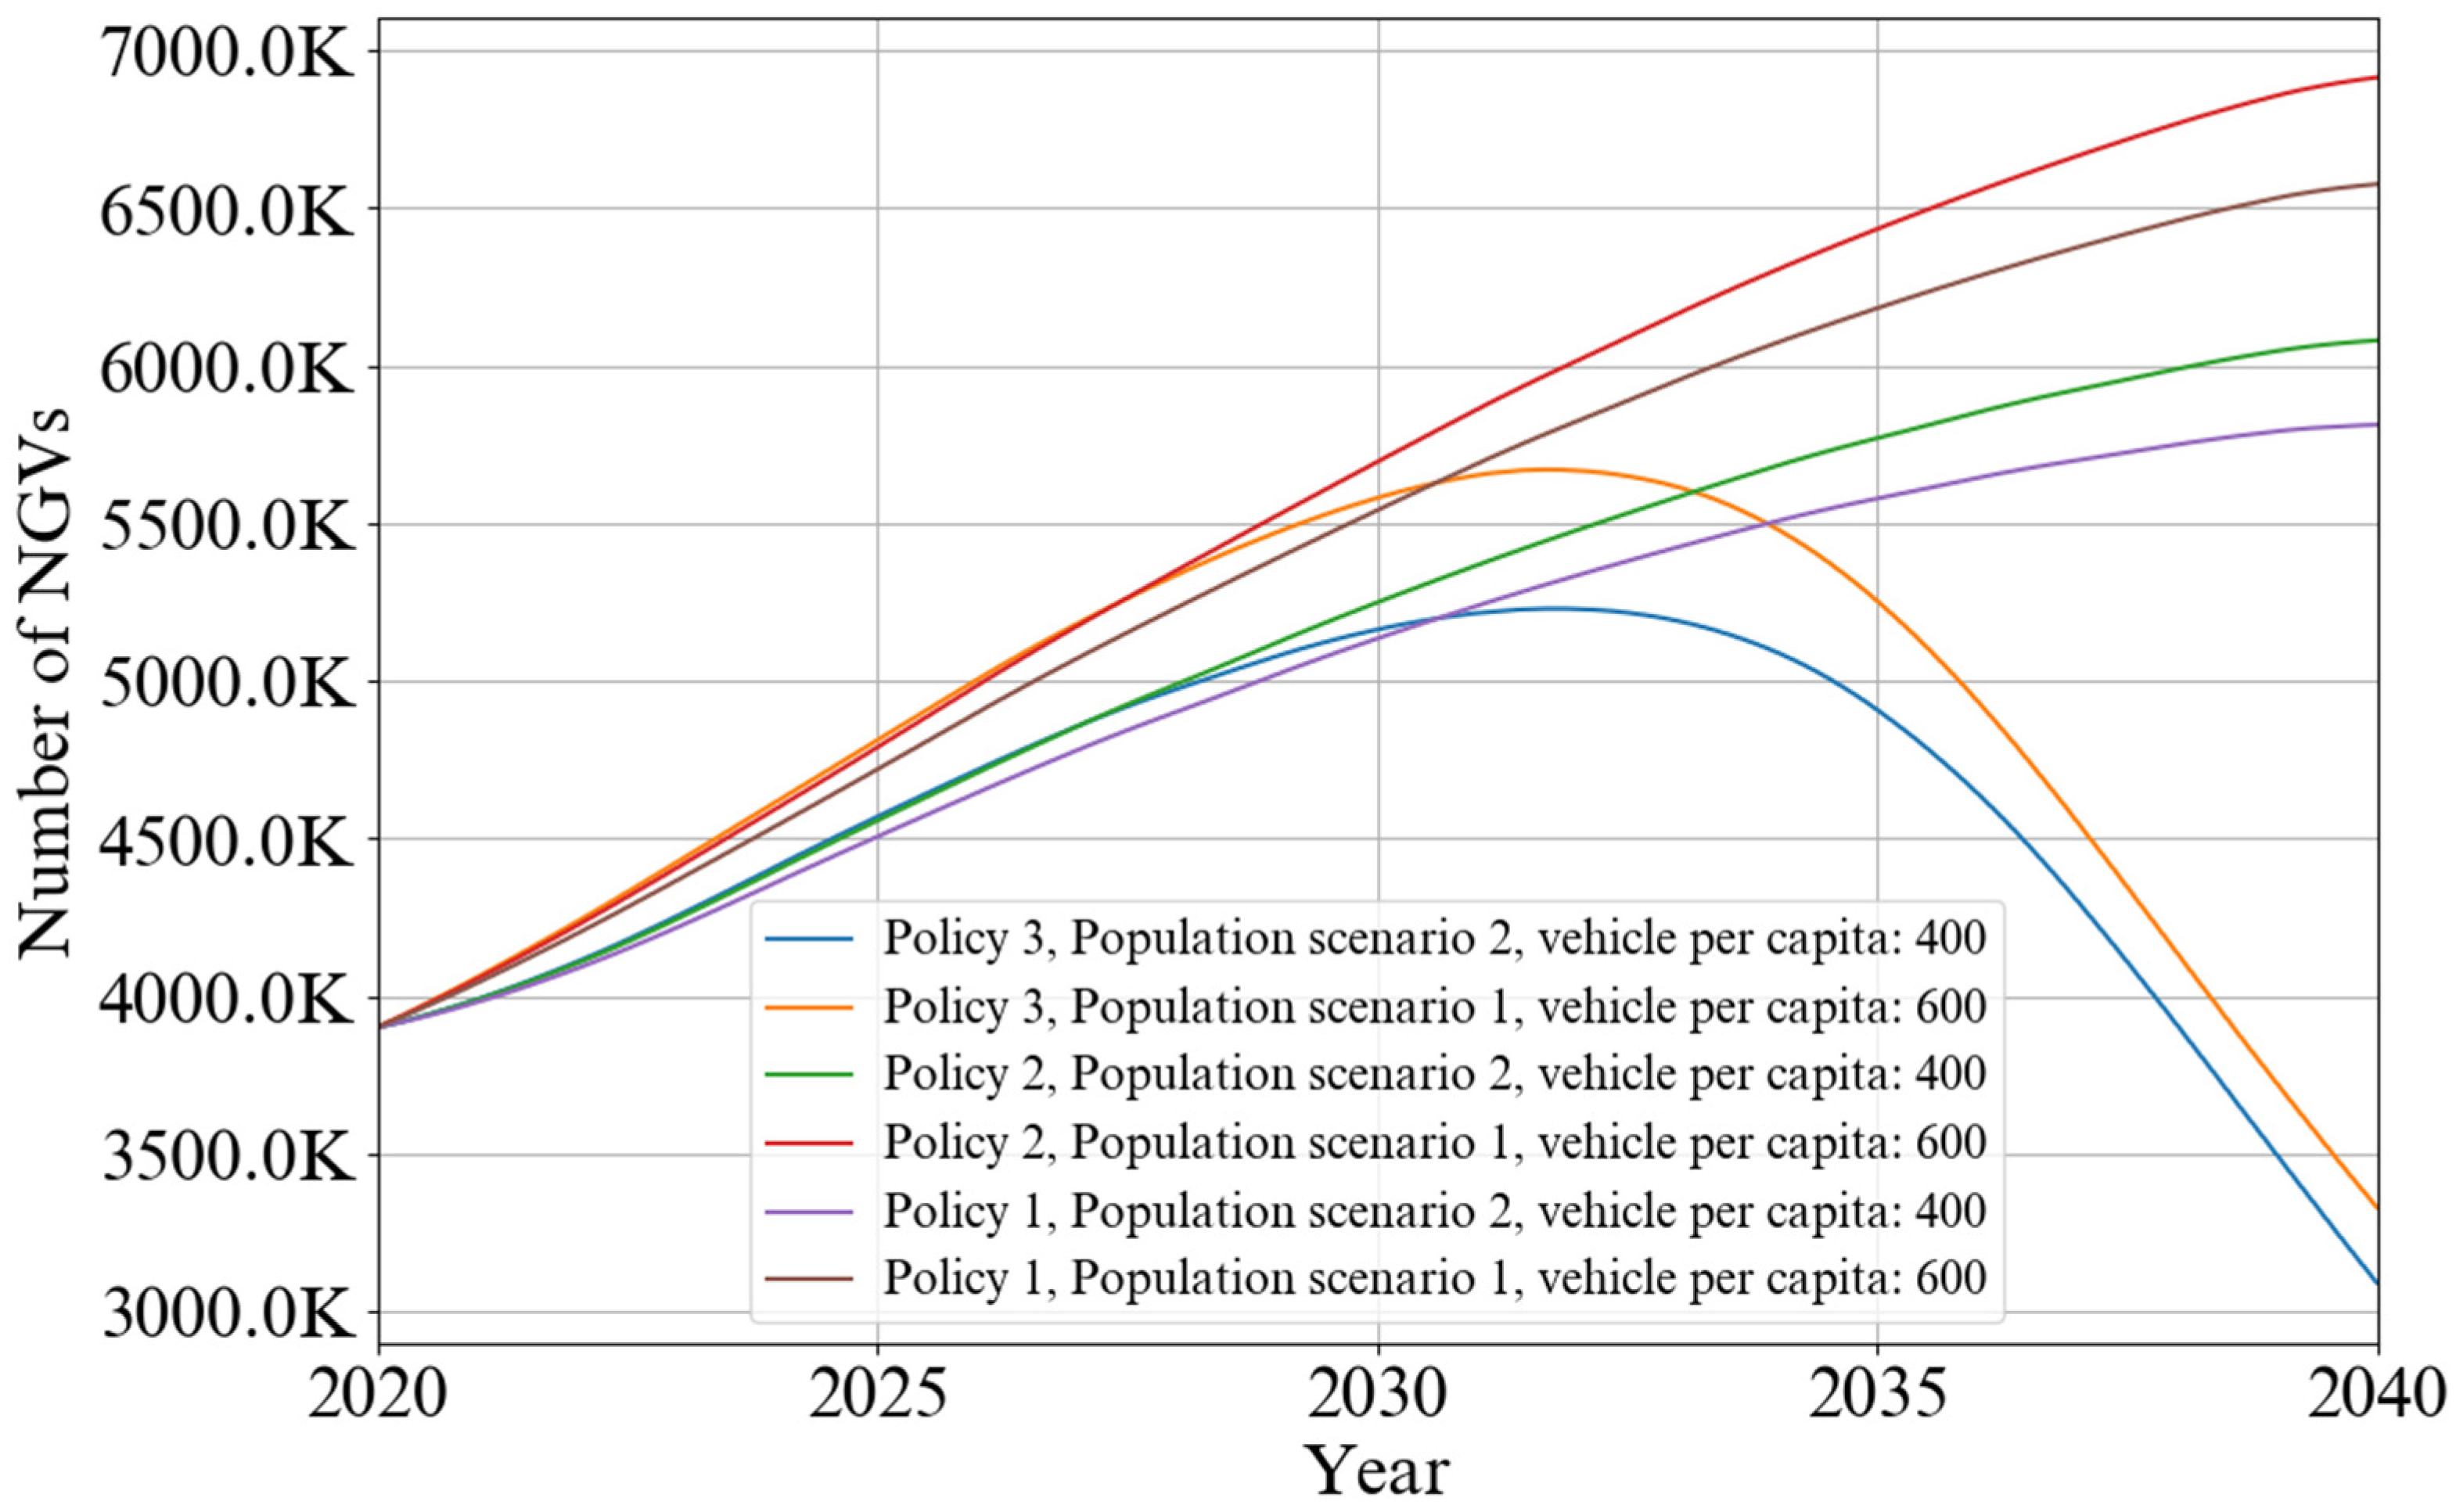
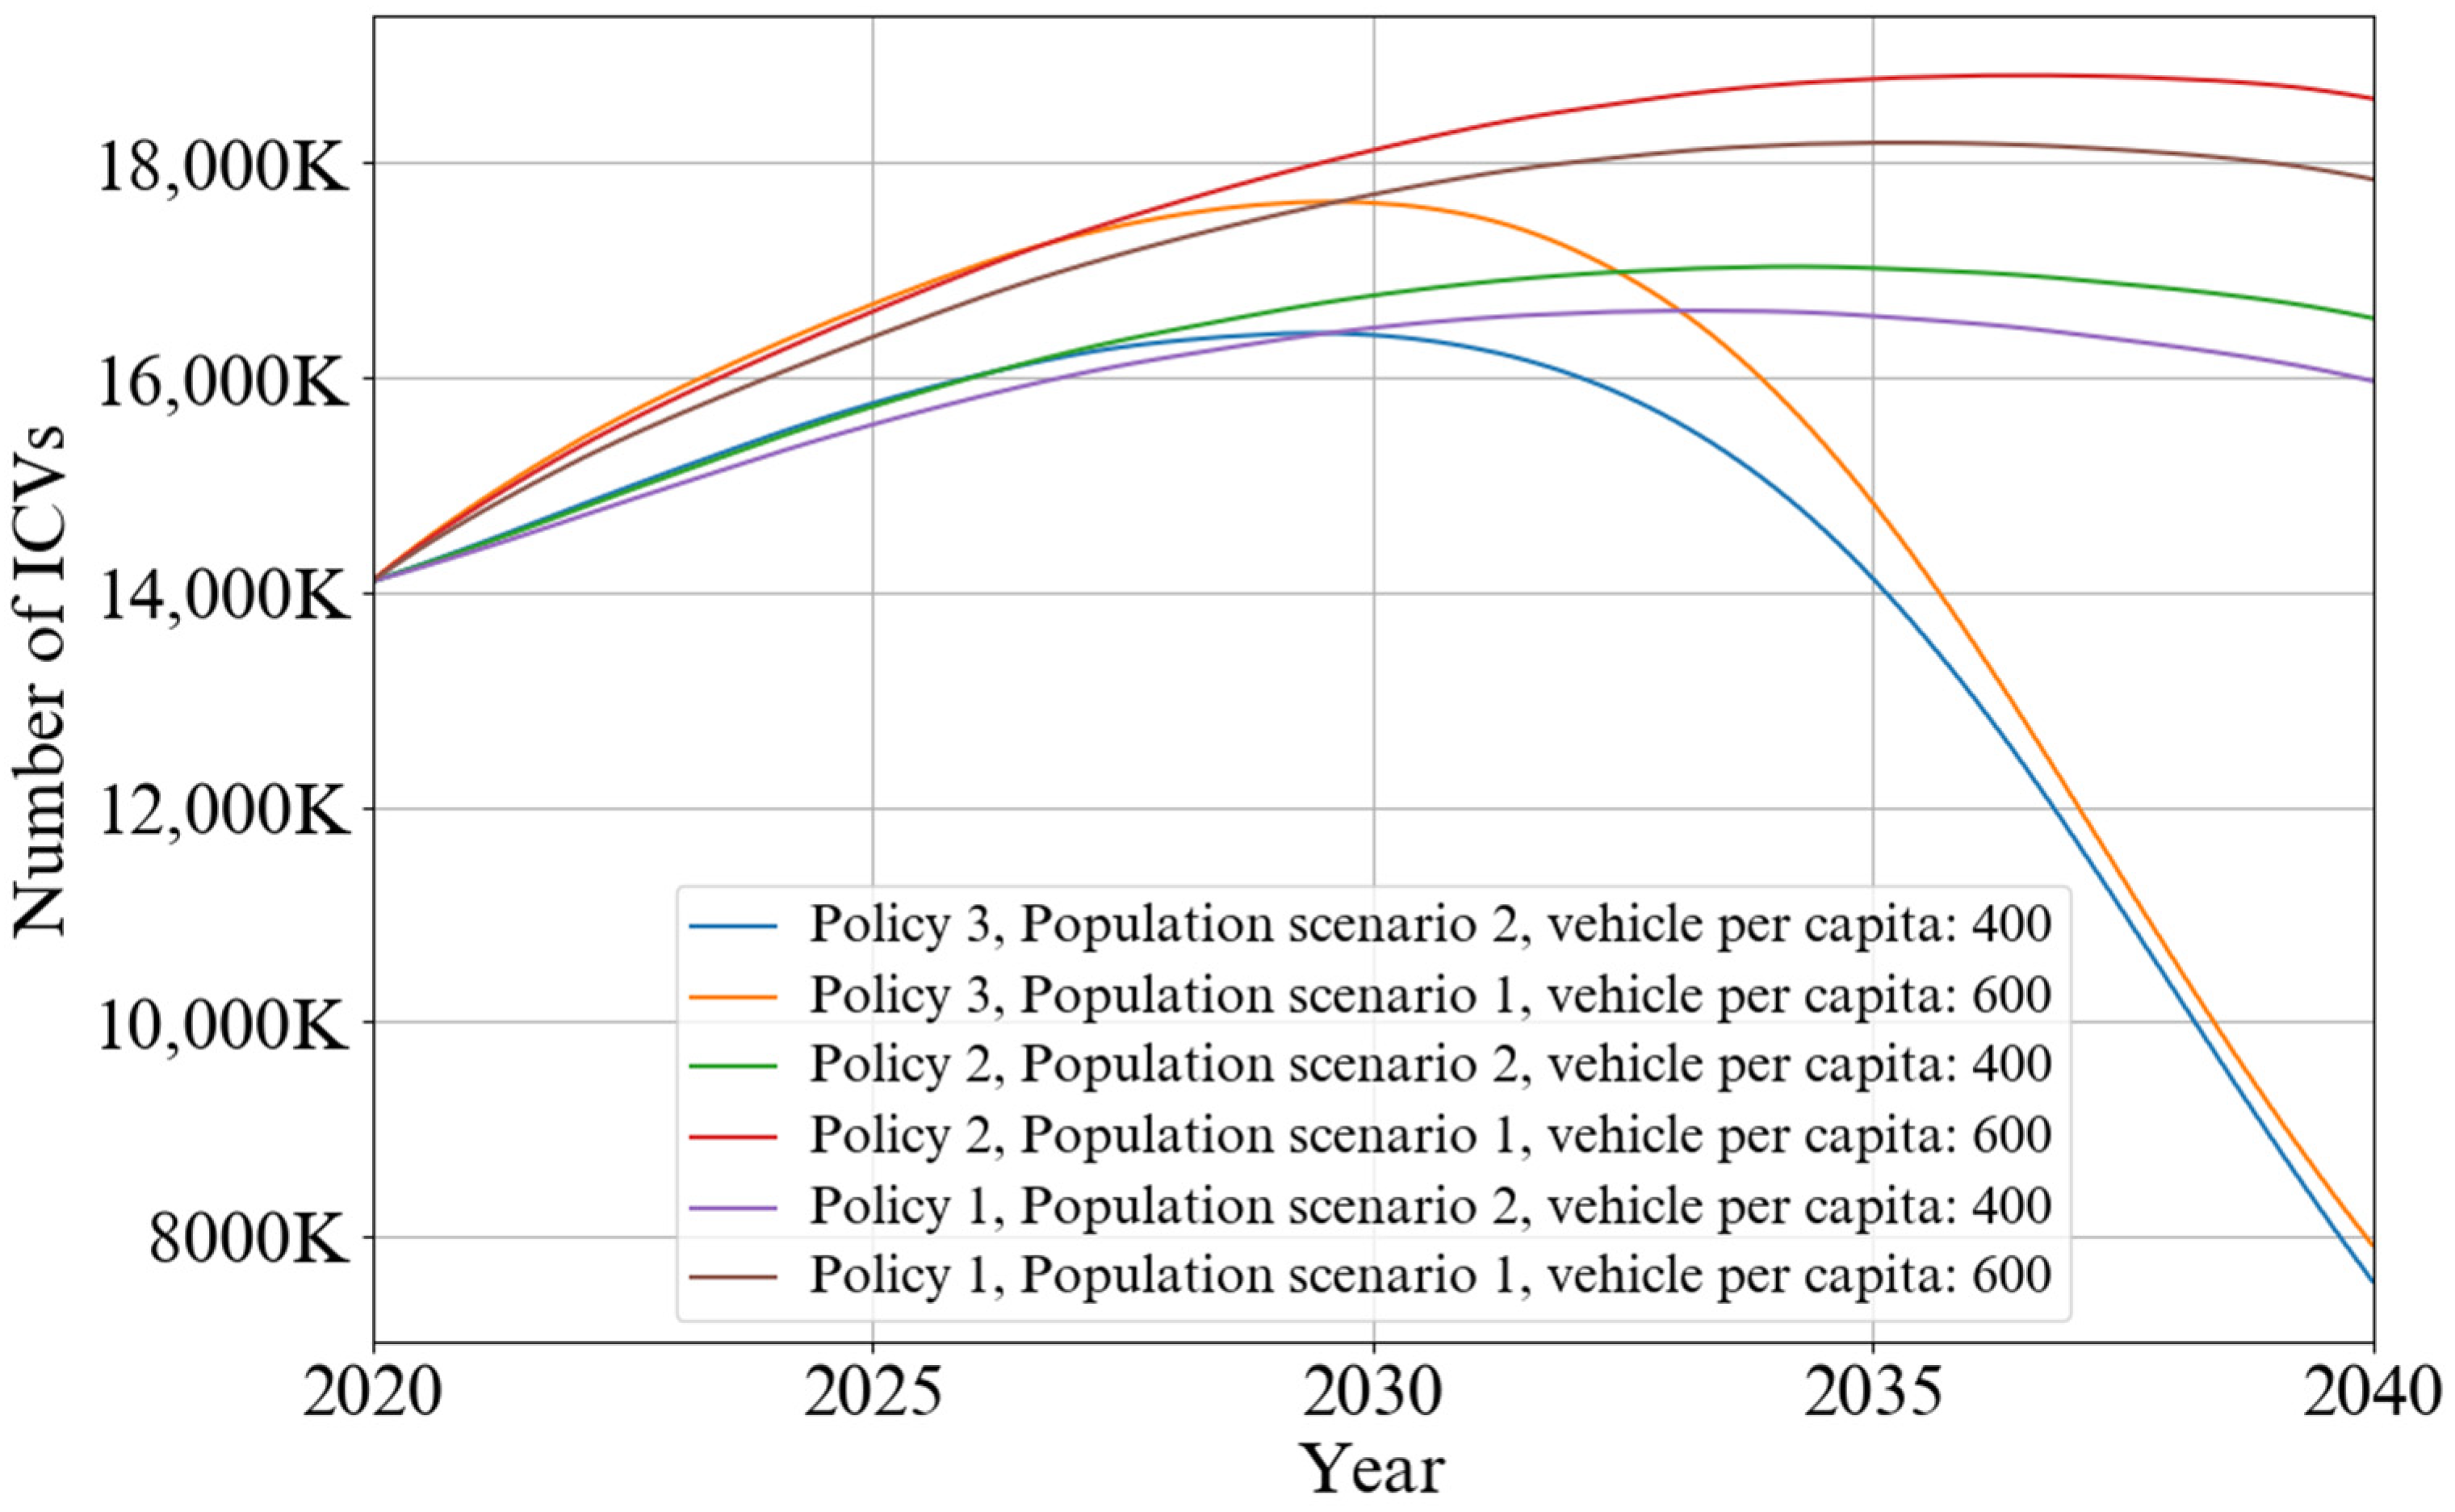
We also examined the effectiveness of the policies outlined in Section 2. Policy 1, which involves offering discounts to buyers of EVs or PHEVs, leads to a decrease in the purchase price of these vehicles to 1.1 times that of CVs. Meanwhile, Policy 2 considers loans for purchasing EVs and PHEVs, equivalent to the discount, to be repaid over seven years. Lastly, the third policy advocates for replacing conventional vehicles with EVs and PHEVs. Figure 16, Figure 17, Figure 18, Figure 19 and Figure 20 show the predicted growth trends of different technologies under these various policies, considering two scenarios, maximum and minimum, for sensitivity analysis. As demonstrated in the trials under policies 1 and 2, EVs and PHEVs initially grow slowly, similar to the BAU scenario, but increase their growth rate and exceed 2 million by 2040 (Policy 1). This is because, in addition to altering consumer preferences through changing purchase prices, the level of familiarity with these technologies will also evolve, thus enhancing the penetration of these vehicles over time.
However, changing preferences and familiarity levels takes considerable time. Given the slow process of building trust in these technologies, their market penetration will not increase sharply, and they will not entirely replace CVs and NGVs within this time horizon. Consequently, under policies 1 and 2, the growth of EVs will remain in the first stage, as illustrated in Figure 5, entering its second phase only by 2040. Furthermore, the third policy considers a scenario where CVs and NGVs could be replaced by EVs and PHEVs based on their age group. Governments could advertise to encourage people to buy new technologies, allowing vehicle owners to replace their existing vehicles with EVs and PHEVs. However, as shown in Figure 16 and Figure 17, the growth of these technologies will remain in the initial stage until 2030 and does not appear to be significant. This is because the technology has not yet gained sufficient trust at the onset of its introduction, despite the trust-building process of replacement. Nevertheless, post-2030, the development of trust, being a cumulative process, will result in a sharp growth in EVs. The number of HEVs, as depicted in Figure 18, will also change under these policies. As trust in EVs and PHEVs increases, the number of HEVs will be impacted, with projections indicating a range of 1.5 to 2.6 million under these policies. By 2040, these technologies will enter the third phase of their market penetration, effectively replacing CVs and NGVs. As per Figure 19 and Figure 20, the number of NGVs and CVs under Policy 3 will significantly shift, with CVs and NGVs dwindling to as few as 8 million and 3.5 million, respectively, by 2040.
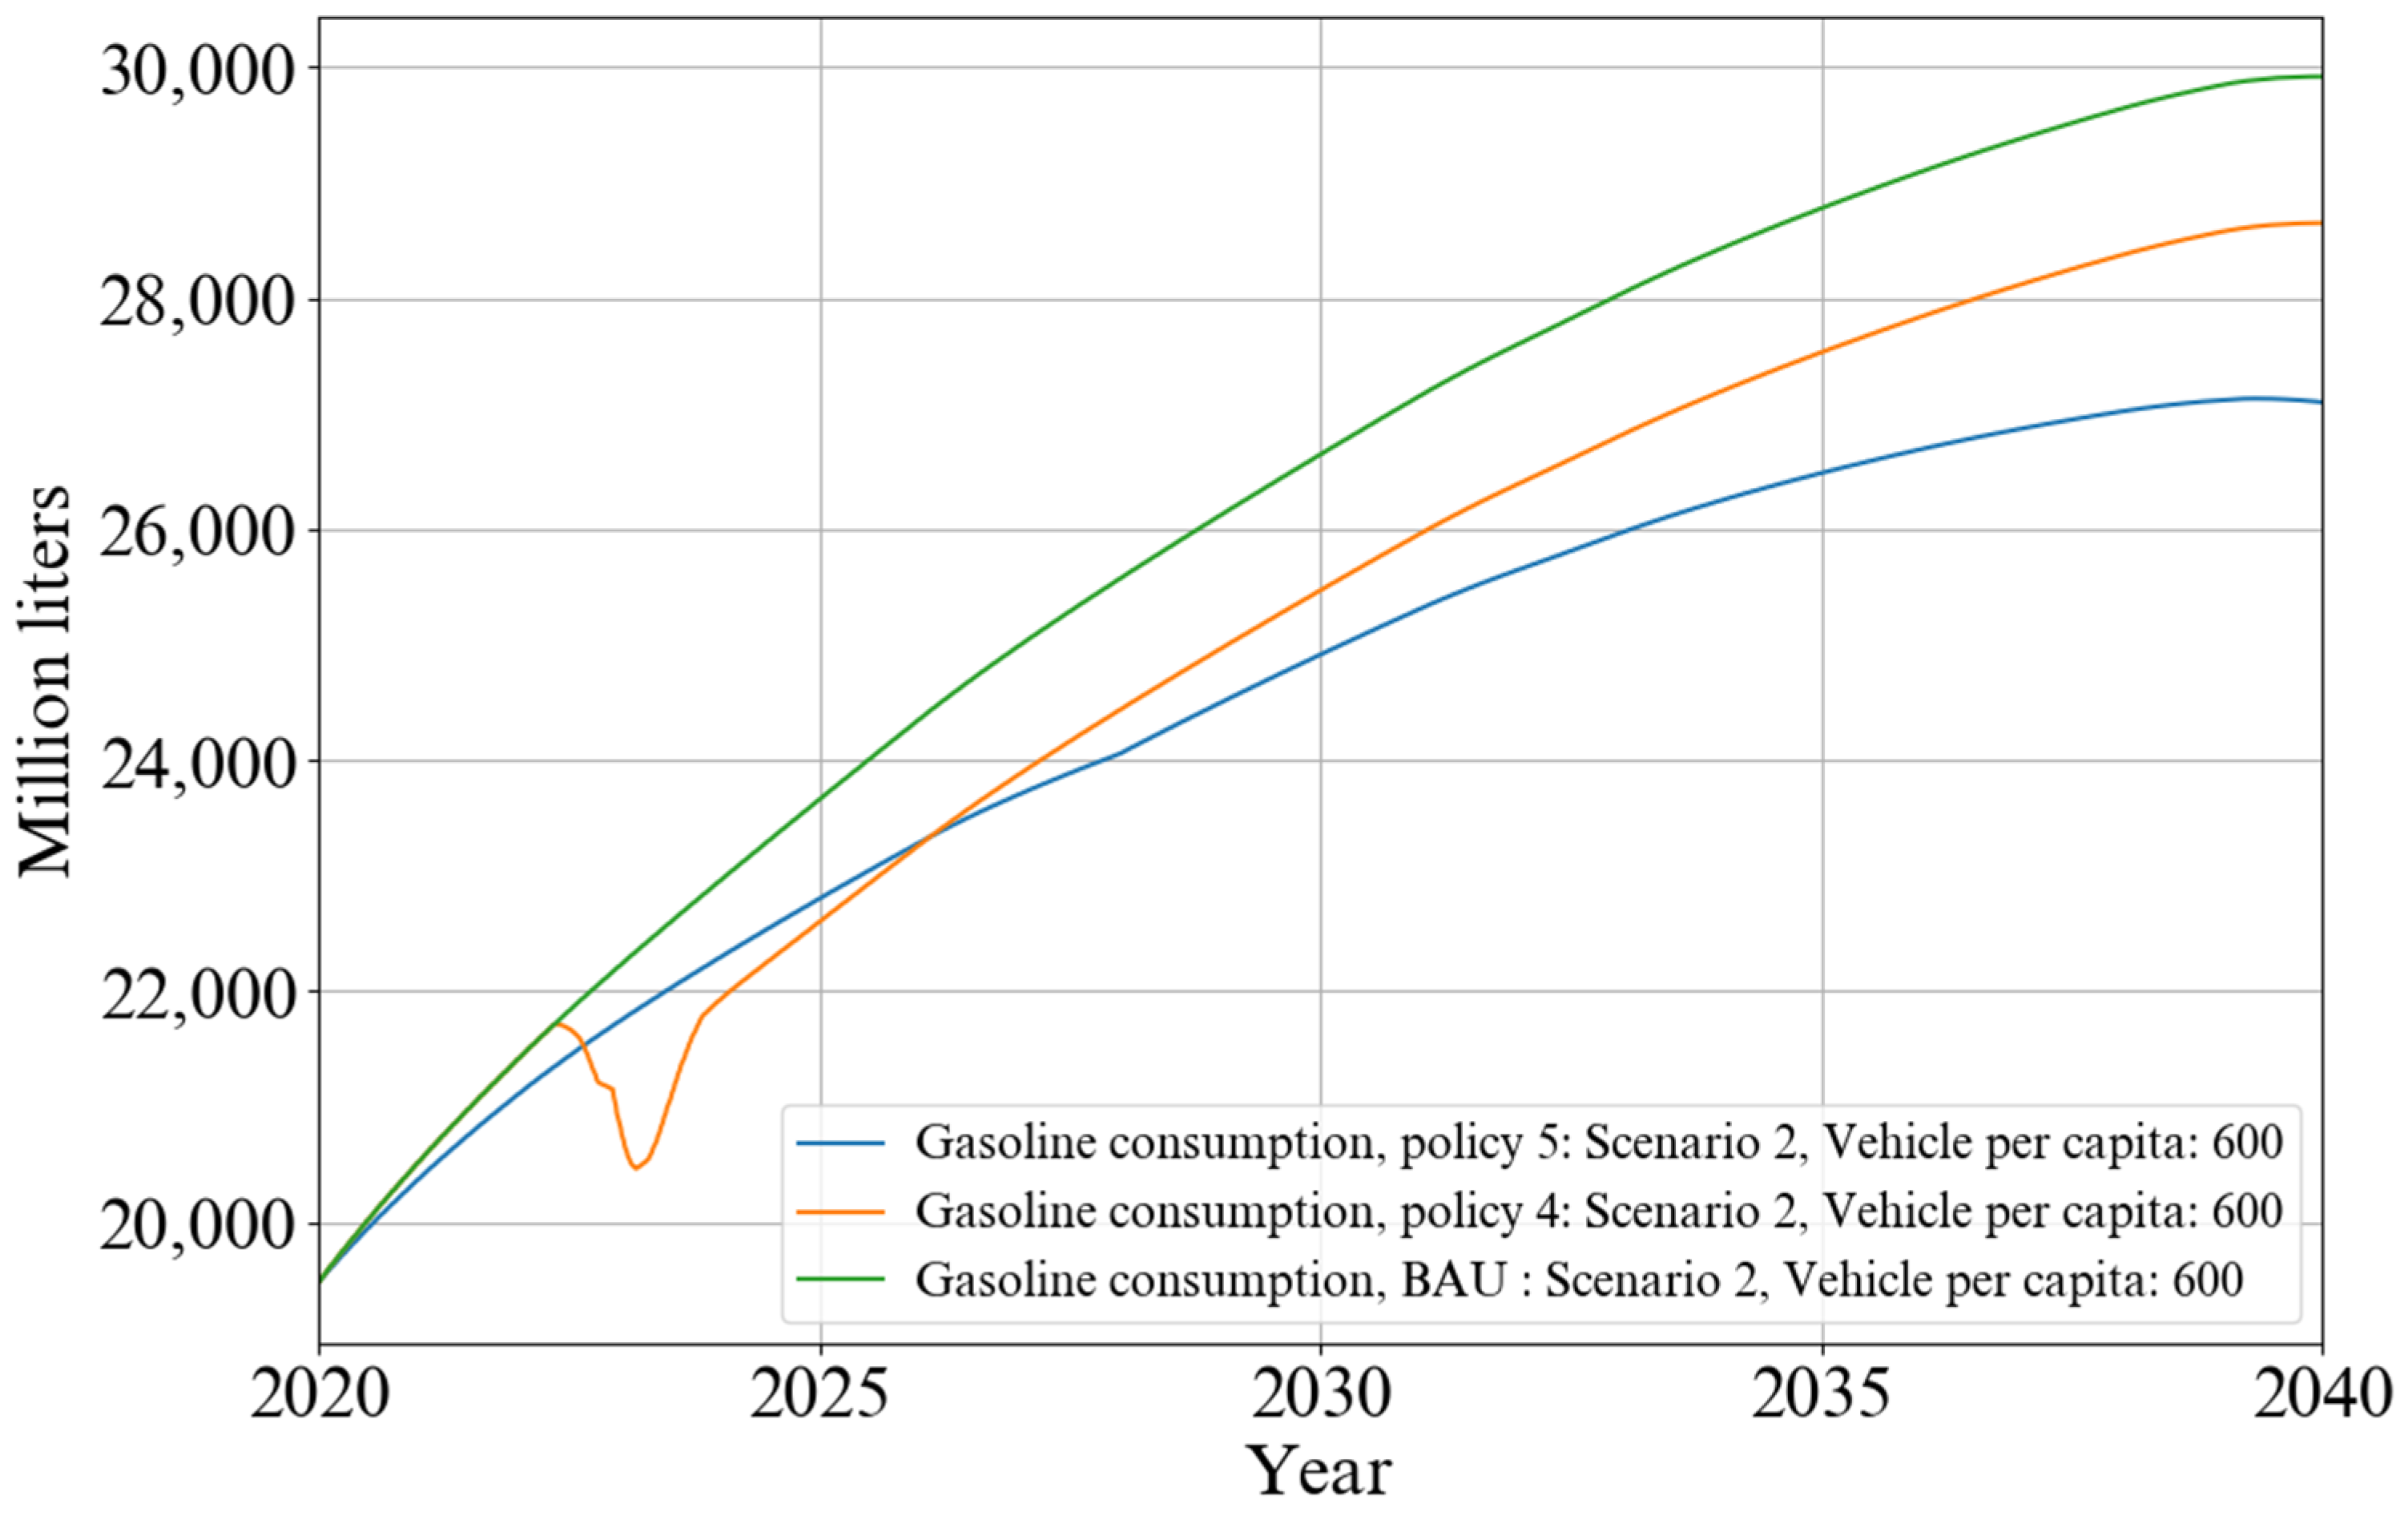
Figure 21 presents the growth and fluctuations of gasoline consumption by cars in Iran under existing conditions and the fourth and fifth policies. These graphs are generated based on population scenario two and an assumed rate of 600 vehicles per capita. They demonstrate that gasoline consumption will increase at a relatively steep rate until 2028. However, the growth rate starts to decrease thereafter due to the expansion of hybrid vehicles, EVs, and gas-fueled vehicles, coupled with a reduction in the number of gasoline vehicles. It is important to note that fuel consumption in Iran has been on an upward trajectory in recent years due to various factors, including the number of vehicles, their technological level and type, and household consumption patterns.
An essential aspect regarding NGVs that demands attention is their depreciation, which can be mitigated through various strategies, including routine servicing and spare part replacements. Additionally, enhancing combustion in their engines and installing engine protection systems to boost their speed and acceleration to match that of gasoline vehicles can incentivize owners to purchase more NGVs. Consequently, this could contribute to an increase in NGVs by over two million more than the base case by 2040. As discussed in previous sections, one policy to reduce gasoline usage involves increasing gasoline prices. This, however, leads to nationwide inflation, as depicted in Figure 2, and imposes economic pressure on consumers. According to Figure 21, a price hike in gasoline would temporarily curtail consumption, but usage rates would return to their initial state within a year. Figure 21 compares the trend of gasoline consumption in the base case (the current trend) with a scenario where the gasoline price triples from its current price in 2022 and NGV technology improves. As shown, escalating gasoline prices cannot serve as a long-term strategy due to the adverse effects; hence, further investigation and evaluation regarding this policy are needed. Based on this study, it can be concluded that initiatives such as enhancing the efficiency of domestic vehicles, developing HEVs, investing in NGVs and improving their technology, and complying with international production standards can be the most effective strategies to control gasoline consumption in the coming years.
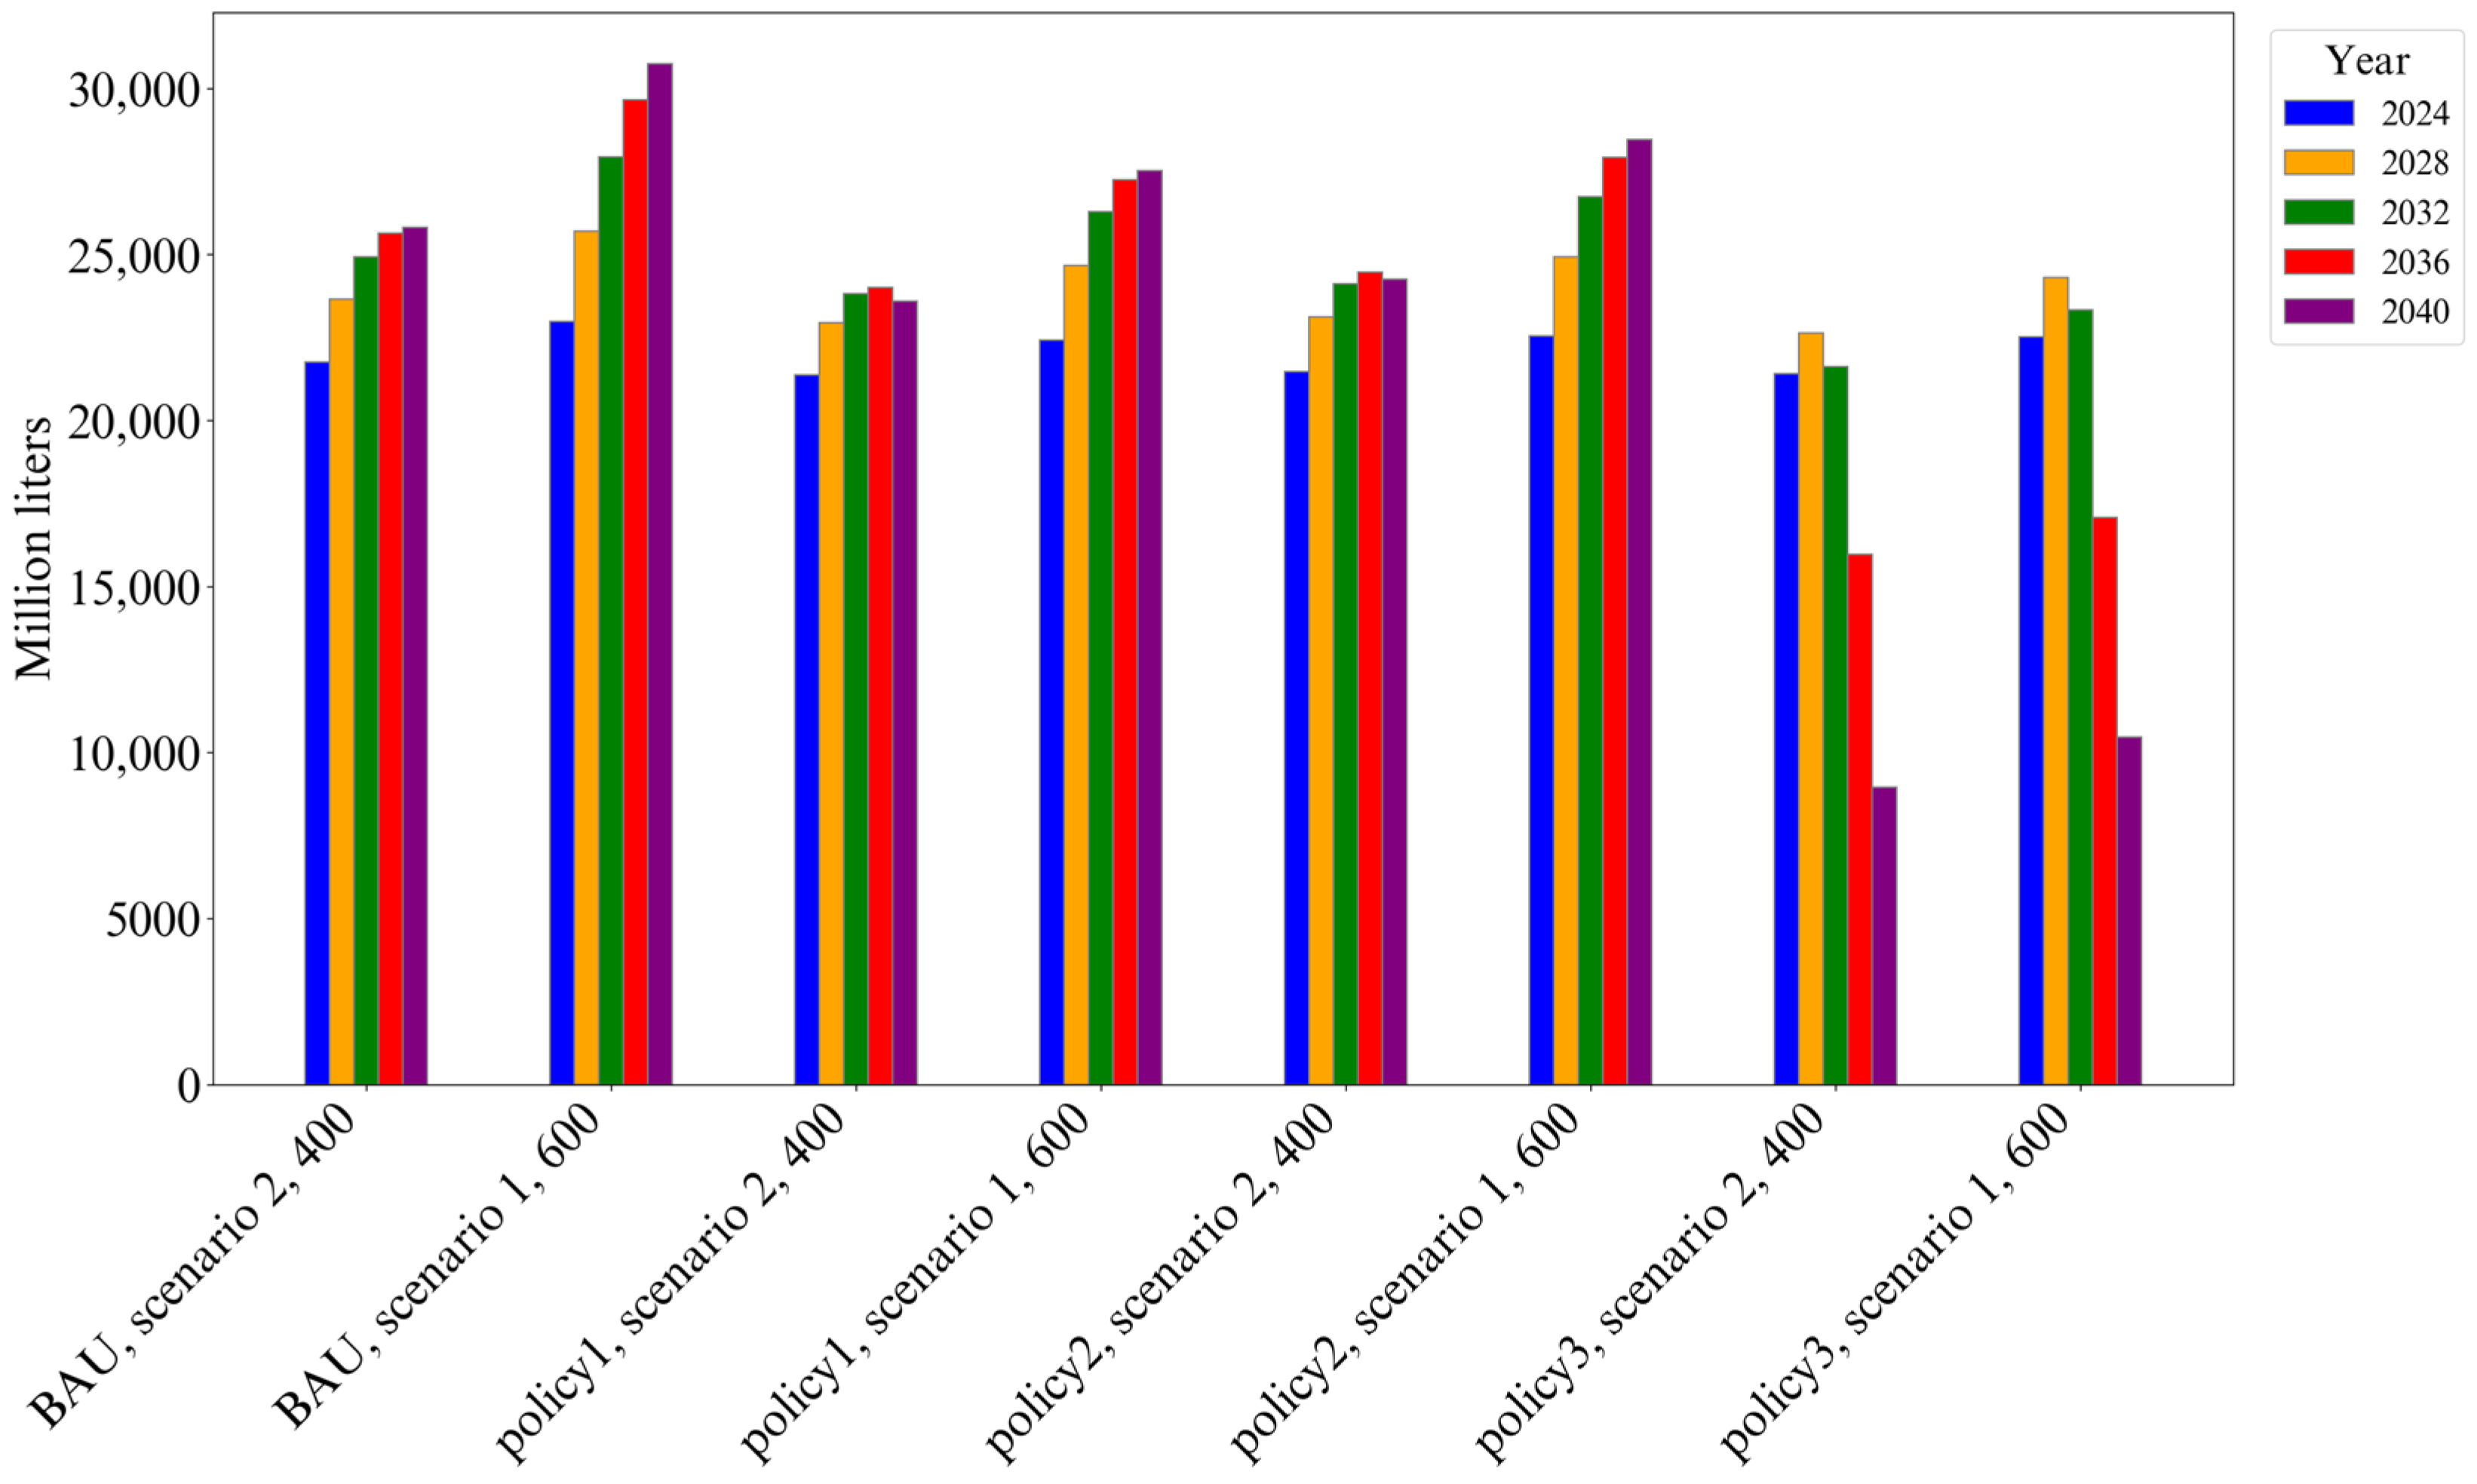
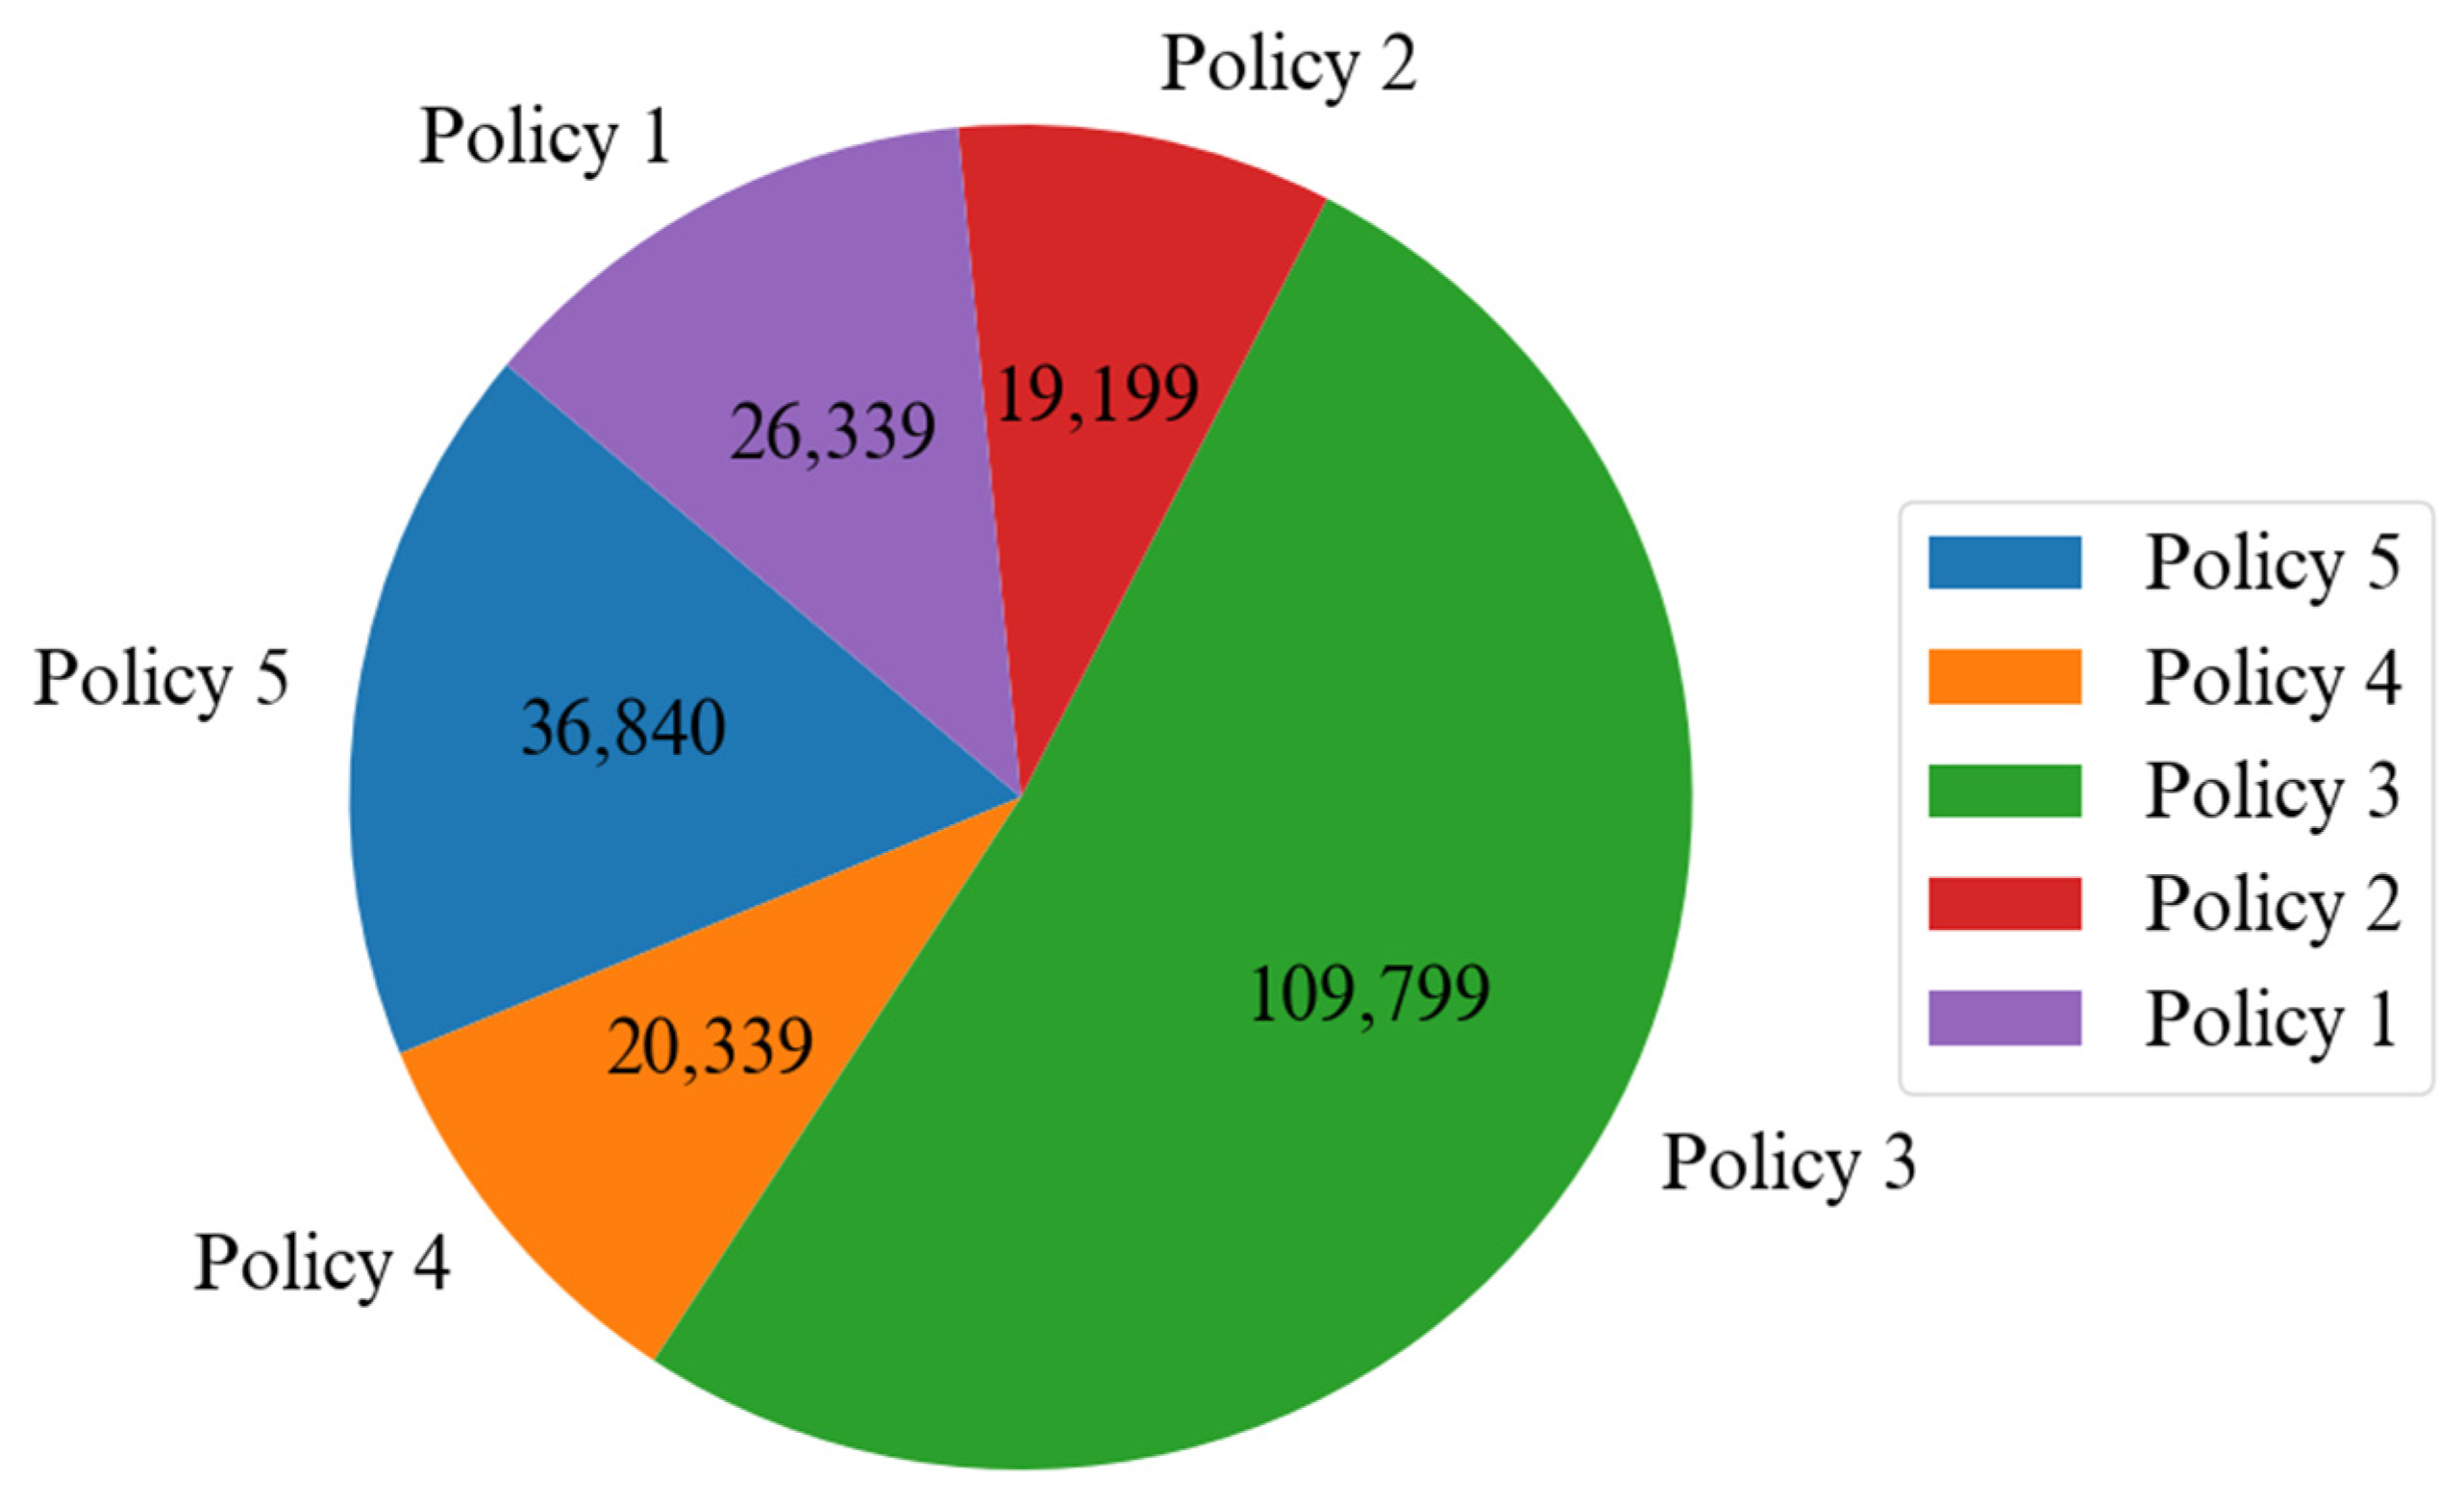
According to Figure 22 and Figure 23, gasoline consumption does not exhibit significant annual variations compared to previous years in the base scenario during the 20-year time horizon, because efficient, new technologies such as HEVs grow slowly within Iran’s transportation fleet. Therefore, Policy 3 is the most effective at accelerating improvements in Iran’s transportation fleet efficiency, with Policy 1 as the second most favorable.
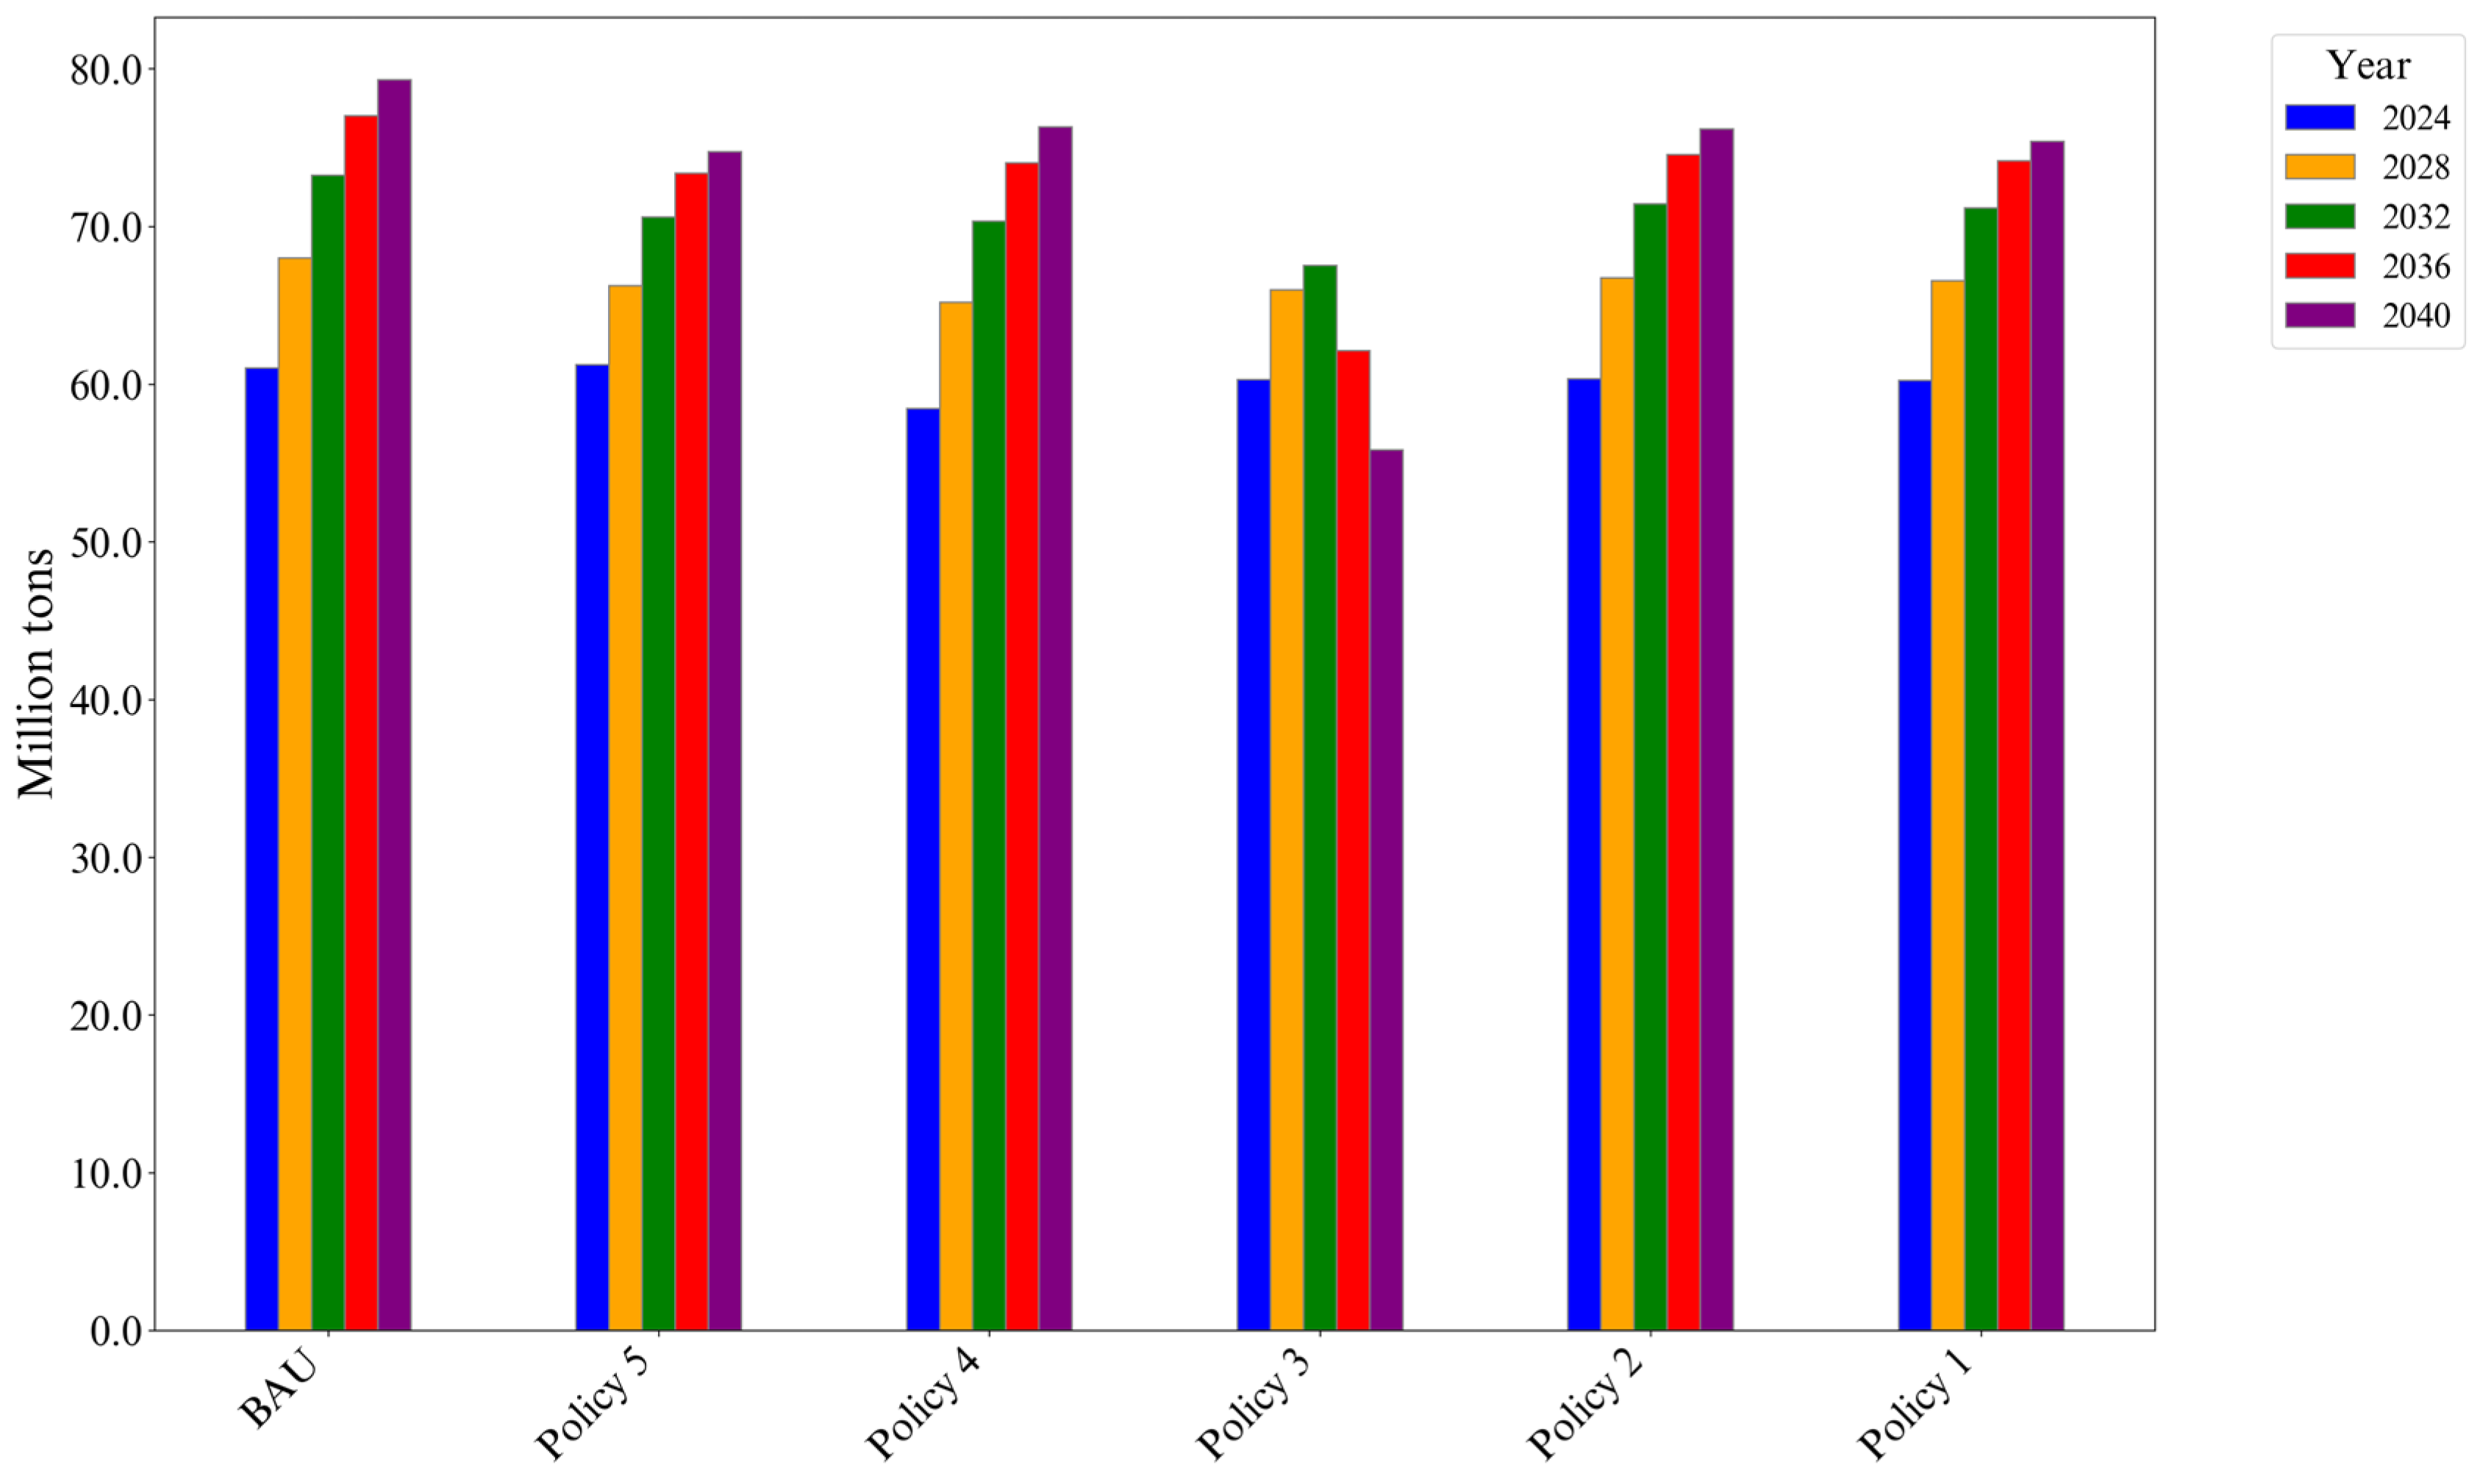
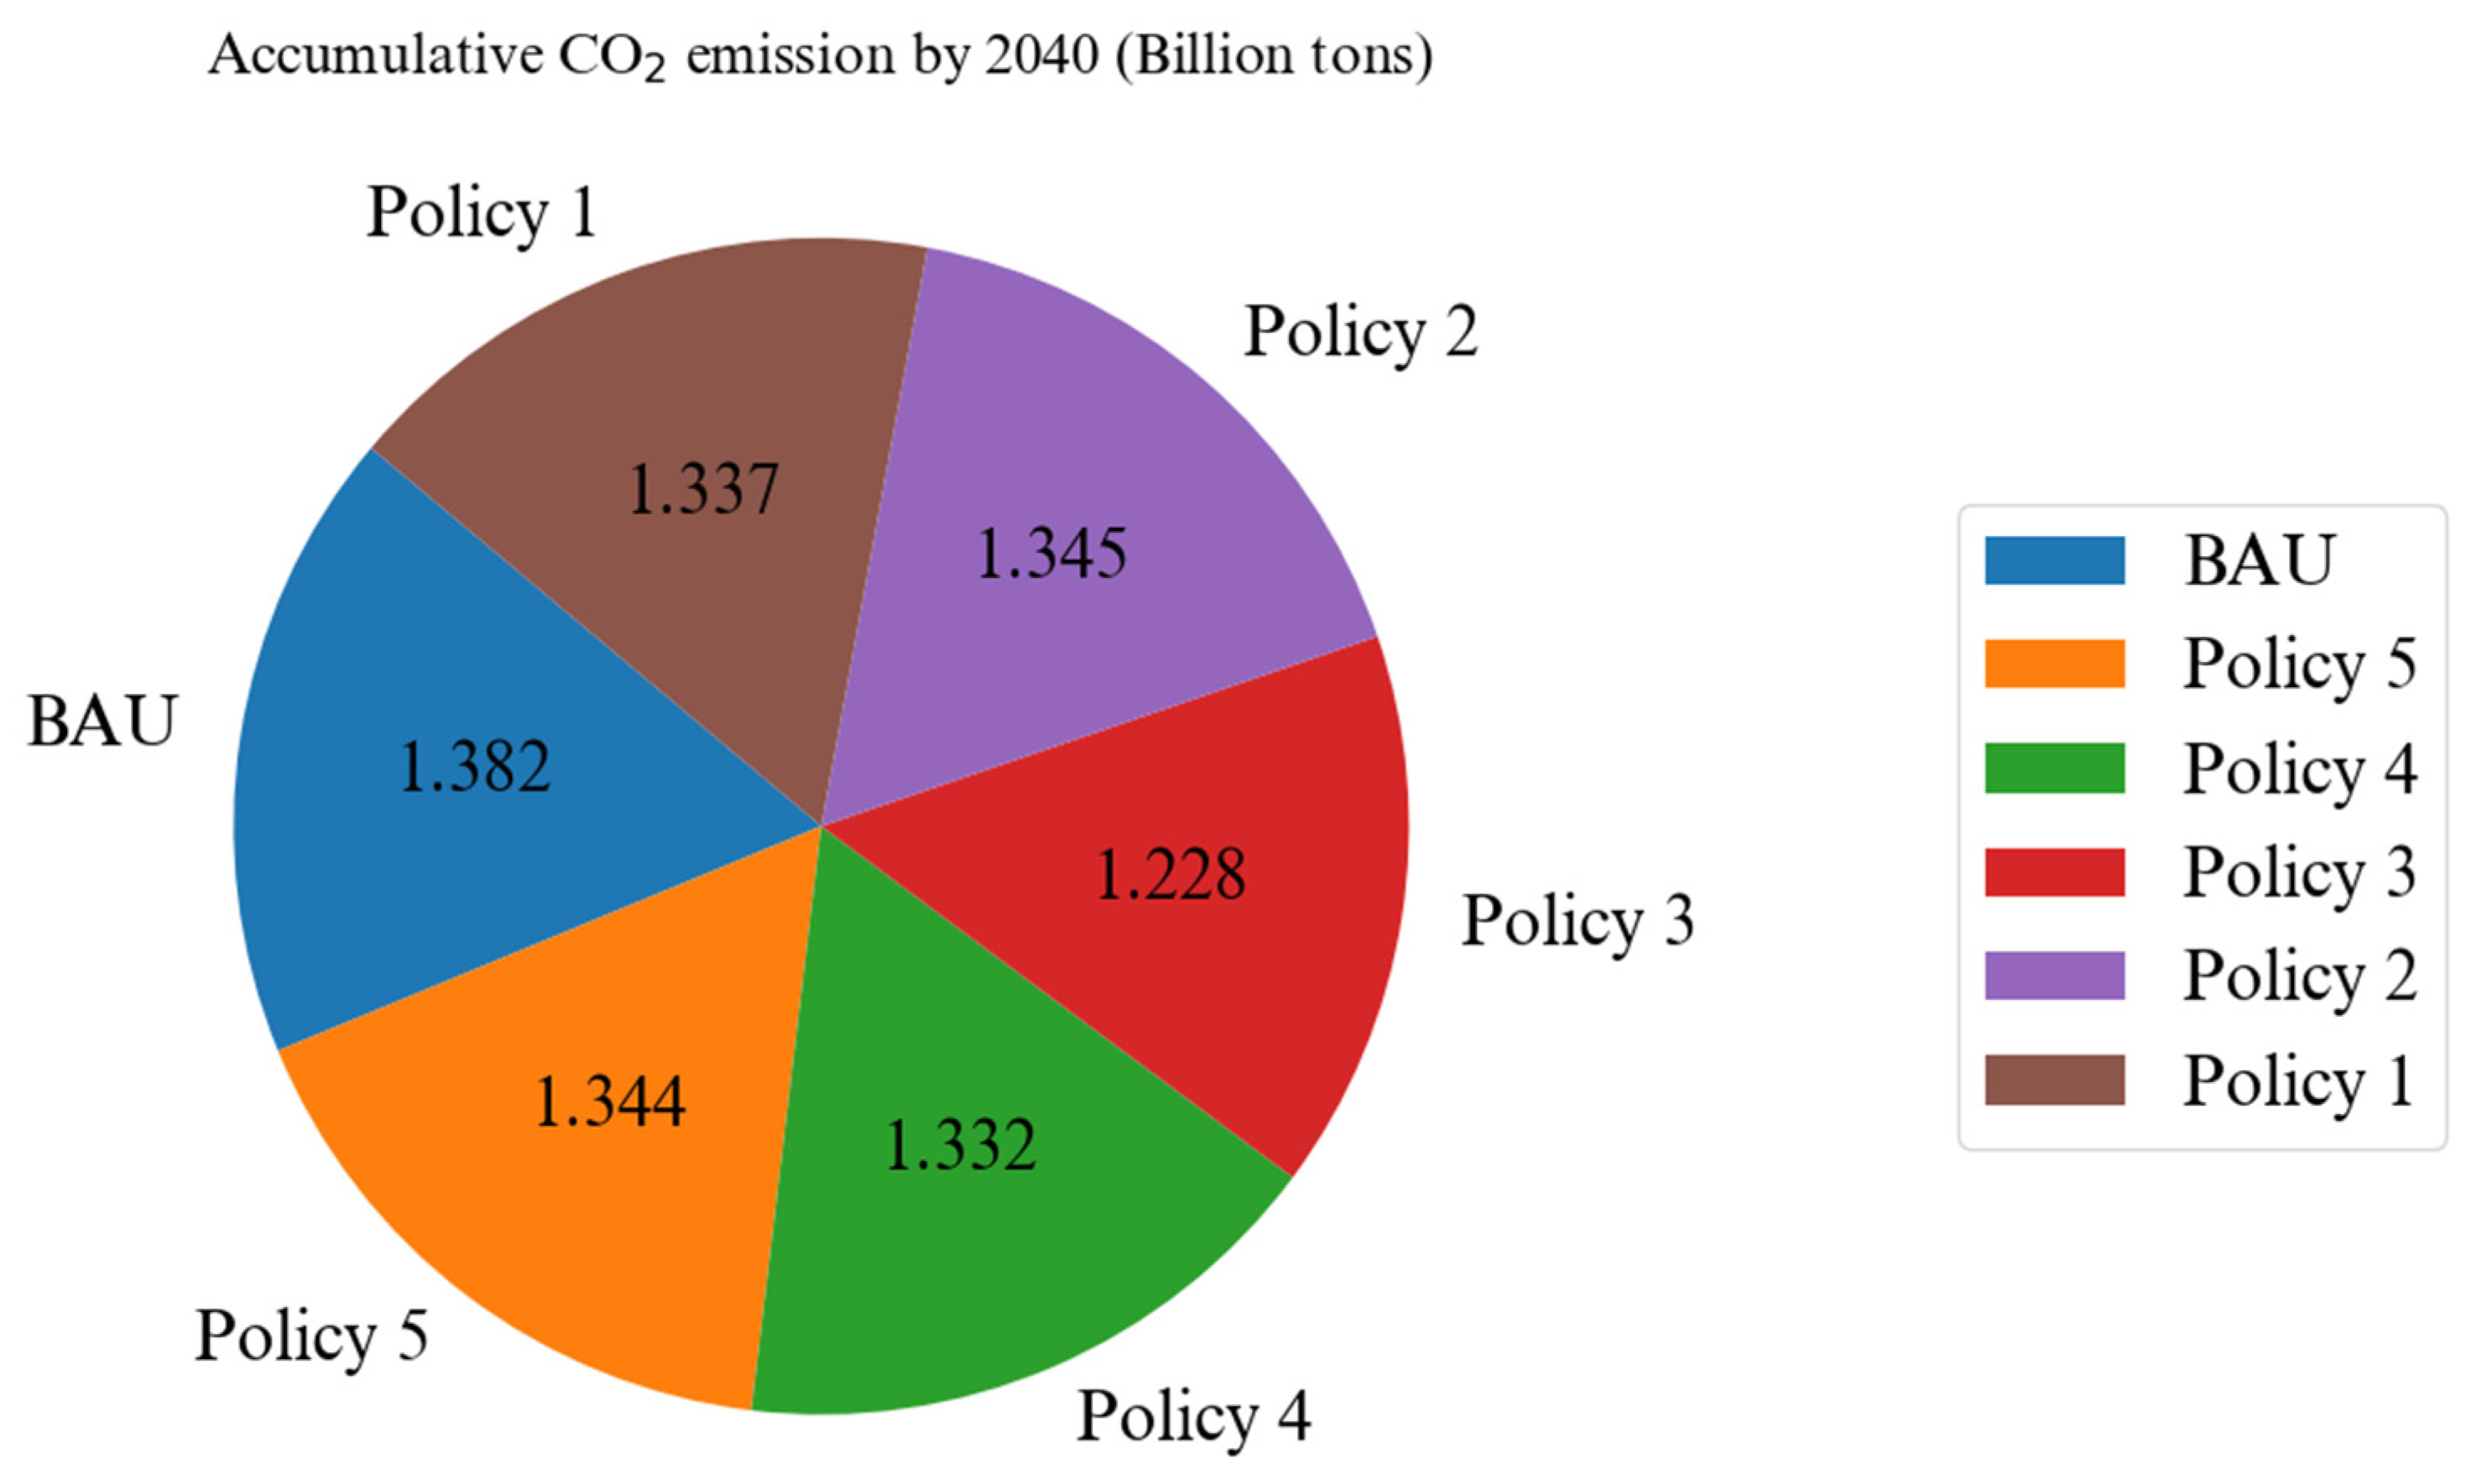
Furthermore, the transportation sector contributes 23% of the total carbon dioxide emissions in Iran, with road transportation responsible for 87% of this contribution. This underscores the importance of analyzing the impact of various policies on CO2 emissions. According to Figure 24, the widespread adoption of EVs could significantly reduce annual CO2 emissions. However, as the diagram illustrates, it is only under Policy 3 and after 2032 that the growth of EVs and PHEVs becomes extensive and CO2 emissions begin to decline. Figure 25 depicts the total CO2 emissions accumulated between 2020 and 2040. Even though the widespread adoption of EVs in the road transportation fleet can enhance the annual CO2 emission rates, the total accumulated CO2 under none of the policies will significantly decrease.

6. Conclusions

The examination and comparison of different scenarios and policies offer insight into the diffusion patterns of alternative fuel vehicles. According to population and vehicle per capita scenarios, gasoline-fueled vehicles could reach about 20 million vehicles by 2040 under the base case scenarios. The findings illustrate that ICVs and NGVs will constitute most of the market by 2030. Because of the current EV and PHEV technology in Iran, there is no expectation that these vehicle types will increase significantly. The results suggest that HEVs could be an attractive alternative compared to EVs and PHEVs, with both HEVs and NGVs having the potential to become dominant alternative fuel vehicles in the country. The potential gasoline consumption in road transportation will be 1.5 times greater than the current consumption. Among the three cases of (1) increasing gasoline prices, (2) replacing a vehicle, and (3) improving the technology of NGVs to reduce gasoline consumption, the replacement policy is the most effective. Post-2030, under the fifth policy (replacement policy), PHEVs and EVs could see a significant increase in market share due to their competitive pricing. Additionally, the replacement policy eliminates buyer concerns over the purchase price. The results also confirm that offering loans and discounts will not drive significant growth in EVs and PHEVs by 2035. The early dominance of NGVs and ICVs results in a low level of familiarity with other types of EVs and limited accessibility of charging stations. As a result, their market shares increased slowly in the initial stage. However, the growth of EVs will continue due to reinforcement loops between market share and buyer familiarity or willingness, as well as between market share and charging station accessibility. These reinforcement loops should be leveraged as mechanisms for EV market penetration in developing countries. In contrast, increased electricity demand due to the growth of EVs presents a negative feedback loop that could hinder the development of these technologies. Nonetheless, from a macro perspective, due to the gap between plans for increasing power grid capacity and the increasing amount of electricity required by EVs, this has not adversely affected the development of these technologies in this study. Based on the analysis of policies related to reducing gasoline consumption, improving NGV technology emerges as the most effective short-term solution. In contrast, increasing gasoline prices would not be a viable solution for long-term gasoline consumption reduction, with its impact on gasoline savings being negligible. However, the growth rate of gasoline consumption is expected to rise quickly until 2030, after which it will decrease due to the growth in hybrid vehicles, EVs, and gas-fueled vehicles, and a reduction in the number of gasoline vehicles. As gasoline is the primary energy source for transportation in Iran, it is also the main contributor to emissions in the transport sector. Without any action and fuel economy improvement, gasoline consumption and, consequently, CO2 emission trends will increase, posing a significant policy and environmental challenge. This study confirms that there are feasible transition pathways for reaching CO2 emission mitigation targets in the transportation sector over the long term. Boosting EVs as an alternative fuel vehicle could help regulate and mitigate CO2 emissions after 2035. Other policies are not as effective in mitigating CO2 emissions because the primary source of electricity generation in Iran is a combined cycle gas turbine plant and developing EVs cannot significantly reduce the accumulated CO2 emissions until 2040. The electrification of the transportation sector will not improve CO2 emissions in the short term unless this technology attains extensive reach, which will not occur before 2035. To conclude, the proposed model helps understand the impact of realistic transport electrification scenarios on various aspects of the transportation fleet and the potential applicability of different scenarios in adopting new technologies in the fleet. This study suggests that developing countries like Iran should use methodological tools like structural models to examine the behavior of impactful parameters to obtain a better understanding of the process of acceptance or rejection of new vehicle technology, which is necessary for policymaking and planning toward sustainable transportation. Furthermore, a vital variable in gasoline consumption is the number of vehicles. Given the growing number of vehicles per capita in Iran, urgent policies aimed at vehicle technology development, investment in gas and electric transportation, improvements in efficiency, and expansion of the fuel basket in transportation should be implemented to contain gasoline consumption.
However, these transition plans are sensitive to certain uncertainties, such as oil prices and economic crises. Additional uncertainties include the future costs of technologies and vehicle attributes. The data used for EV batteries and manufacturing EVs may be somewhat controversial because these technologies have not been commercially produced in Iran. Further research could include analyzing EV charging patterns in the event of significant EV diffusion. Battery replacement costs could significantly impact the market penetration of EVs, so the assumption of a lifetime battery lasting as long as the EV itself could be adjusted. Furthermore, the performance deterioration of the battery could be included in the model. The accuracy of the results could be improved by conducting experiments and sensitivity analyses on exogenous variables such as vehicle technology efficiencies and costs. One main limitation in many previous studies is the linear association of consumer choice modeling with vehicle market share. In this study, however, consumer decision-making regarding new vehicle adoption depends on a complex process of social influences alongside consumer choice modeling. In short, transitions to sustainable and low-carbon transportation systems in Iran, regardless of uncertainties, appear unattainable until 2030, and the successful diffusion of EVs requires significant policy support. The validity of the results can be enhanced by further sensitivity analyses of some exogenous variables and by applying more policies and scenarios. The proposed model serves as a testing ground for policies in developing countries to gain insight into the best strategies for promoting new vehicle technologies and reducing carbon emissions and fuel consumption. In this regard, our research continues to extend its boundaries with more flexible methods for estimating the optimal fuel basket in the transport sector and endogenizing related variables.
Therefore, the recommended policies of this study that are complementary to the price increase strategy and can result in reasonable control of gasoline consumption and CO2 emission are as follows:
  • First, electrification of the governmental transportation fleet represents a low-hanging fruit with high visibility that could raise public awareness about electric vehicles and consequently accelerate diffusion.
  • Second, policy should support the investment in research and development to increase the efficiency of vehicles.
  • Third, regular free engine tuning services could be offered to reduce CO2 emissions and gasoline consumption.
  • Fourth, investments should be made in the development of NGVs and the improvement of technology in these vehicles.
  • Fifth, importing HEVs into the country during the first stage could assist with diffusion and could help make EV and PHEV prices competitive with ICVs.
  • Finally, charging infrastructure should be developed in the country.
This study contributes knowledge about transport electrification adoption scenarios and the impact of various policies on aspects of the transportation fleet. This study suggests that detailed structural models can be used to examine the behavior of influential parameters and to obtain a better understanding of the process of acceptance or rejection of new vehicle technology, which is necessary for effective policymaking. The case study results and analysis highlight the need to have a reasonably good understanding of how to allocate an optimal fuel basket to different segments of the fleet, which was not addressed in this study but toward which it provides a pathway for future work.

Author Contributions

Conceptualization, M.M.-A. and M.P.; methodology, M.P. and M.M.-A.; software, M.P.; validation, M.P. and E.H. (Erfan Hassannayebi); formal analysis, M.P.; investigation, M.P.; resources, M.P., E.H. (Erfan Hassannayebi) and E.H. (Elizabeth Hewitt); data curation, M.P.; writing—original draft preparation, M.P.; writing—review and editing, E.H. (Elizabeth Hewitt) and E.H. (Erfan Hassannayebi); visualization, M.P. and E.H. (Erfan Hassannayebi); supervision, M.M.-A. All authors have read and agreed to the published version of the manuscript.

Funding

This research received no external funding.

Data Availability Statement

The original contributions presented in the study are included in the article, further inquiries can be directed to the corresponding author.

Conflicts of Interest

The authors declare no conflicts of interest.

Appendix A. Utility Coefficients

Table A1. Estimated utility coefficients.
AttributesCoefficientCoefficient Value
ICVNGVEVPHEVHEV
Vehicle cost β 1 −0.533−0.496−0.213−0.225−0.238
Fuel cost of the vehicle β 2 −0.69−0.27−0.23−0.59−0.5
Depreciation cost β 3 −3.14−3.32−2.62−2.73−2.66
Availability of refueling stations β 4 0.1360.1360.4630.360.136
Vehicle speed β 5 0.50.50.50.50.5
Acceleration of the vehicle β 6 −0.5−0.4−0.70.8−0.7

References

  1. Gu, D.; Andreev, K.; Dupre, M.E. Major Trends in Population Growth Around the World. China CDC Wkly. 2021, 3, 604. [Google Scholar] [CrossRef] [PubMed]
  2. Mustapa, S.I.; Bekhet, H.A. Analysis of CO2 emissions reduction in the Malaysian transportation sector: An optimisation approach. Energy Policy 2016, 89, 171–183. [Google Scholar] [CrossRef]
  3. Saidi, S.; Shahbaz, M.; Akhtar, P. The long-run relationships between transport energy consumption, transport infrastructure, and economic growth in MENA countries. Transp. Res. Part A Policy Pract. 2018, 111, 78–95. [Google Scholar] [CrossRef]
  4. Paravantis, J.A.; Georgakellos, D.A. Trends in energy consumption and carbon dioxide emissions of passenger cars and buses. Technol. Forecast. Soc. Chang. 2007, 74, 682–707. [Google Scholar] [CrossRef]
  5. Javanmard, M.E.; Tang, Y.; Wang, Z.; Tontiwachwuthikul, P. Forecast energy demand, CO2 emissions and energy resource impacts for the transportation sector. Appl. Energy 2023, 338, 120830. [Google Scholar] [CrossRef]
  6. Zhang, T.; Burke, P.J.; Wang, Q. Effectiveness of electric vehicle subsidies in China: A three-dimensional panel study. Resour. Energy Econ. 2024, 76, 101424. [Google Scholar] [CrossRef]
  7. Shafiei, E.; Davidsdottir, B.; Leaver, J.; Stefansson, H.; Asgeirsson, E.I. Comparative analysis of hydrogen, biofuels and electricity transitional pathways to sustainable transport in a renewable-based energy system. Energy 2015, 83, 614–627. [Google Scholar] [CrossRef]
  8. Sierra, J.C. Estimating road transport fuel consumption in Ecuador. Energy Policy 2016, 92, 359–368. [Google Scholar] [CrossRef]
  9. Tzeiranaki, S.T.; Economidou, M.; Bertoldi, P.; Thiel, C.; Fontaras, G.; Clementi, E.L.; De Los Rios, C.F. The impact of energy efficiency and decarbonisation policies on the European road transport sector. Transp. Res. Part A Policy Pract. 2023, 170, 103623. [Google Scholar] [CrossRef]
  10. Kangur, A.; Jager, W.; Verbrugge, R.; Bockarjova, M. An agent-based model for diffusion of electric vehicles. J. Environ. Psychol. 2017, 52, 166–182. [Google Scholar] [CrossRef]
  11. Noori, M.; Tatari, O. Development of an agent-based model for regional market penetration projections of electric vehicles in the United States. Energy 2016, 96, 215–230. [Google Scholar] [CrossRef]
  12. Fluchs, S. The diffusion of electric mobility in the European Union and beyond. Transp. Res. Part D Transp. Environ. 2020, 86, 102462. [Google Scholar] [CrossRef]
  13. Illmann, U.; Kluge, J. Public charging infrastructure and the market diffusion of electric vehicles. Transp. Res. Part D Transp. Environ. 2020, 86, 102413. [Google Scholar] [CrossRef]
  14. Karplus, V.J.; Paltsev, S.; Reilly, J.M. Prospects for plug-in hybrid electric vehicles in the United States and Japan: A general equilibrium analysis. Transp. Res. Part A Policy Pract. 2010, 44, 620–641. [Google Scholar] [CrossRef]
  15. Sterman, J.D. Learning in and about complex systems. Syst. Dyn. Rev. 1994, 10, 291–330. [Google Scholar] [CrossRef]
  16. Saraf, N.; Shastri, Y. System dynamics-based assessment of novel transport options adoption in India. Clean Technol. Environ. Policy 2023, 25, 799–823. [Google Scholar] [CrossRef] [PubMed]
  17. Keith, D.R. Essays on the Dynamics of Alternative Fuel Vehicle Adoption: Insights from the Market for Hybrid-Electric Vehicles in the United States. Ph.D. Thesis, Massachusetts Institute of Technology, Cambridge, MA, USA, 2012. [Google Scholar]
  18. Shepherd, S.; Bonsall, P.; Harrison, G. Factors affecting future demand for electric vehicles: A model based study. Transp. Policy 2012, 20, 62–74. [Google Scholar] [CrossRef]
  19. Pasaoglu, G.; Harrison, G.; Jones, L.; Hill, A.; Beaudet, A.; Thiel, C. A system dynamics based market agent model simulating future powertrain technology transition: Scenarios in the EU light duty vehicle road transport sector. Technol. Forecast. Soc. Chang. 2016, 104, 133–146. [Google Scholar] [CrossRef]
  20. Selvakkumaran, S.; Ahlgren, E.O. Impacts of social innovation on local energy transitions: Diffusion of solar PV and alternative fuel vehicles in Sweden. Glob. Transit. 2020, 2, 98–115. [Google Scholar] [CrossRef]
  21. Kieckhäfer, K.; Wachter, K.; Spengler, T.S. Analyzing manufacturers’ impact on green products’ market diffusion—The case of electric vehicles. J. Clean. Prod. 2017, 162, S11–S25. [Google Scholar] [CrossRef]
  22. Walther, G.; Wansart, J.; Kieckhäfer, K.; Schnieder, E.; Spengler, T.S. Impact assessment in the automotive industry: Mandatory market introduction of alternative powertrain technologies. Syst. Dyn. Rev. 2010, 26, 239–261. [Google Scholar] [CrossRef]
  23. Buchmann, T.; Wolf, P.; Fidaschek, S. Stimulating E-Mobility Diffusion in Germany (EMOSIM): An Agent-Based Simulation Approach. Energies 2021, 14, 656. [Google Scholar] [CrossRef]
  24. Brown, M. Catching the phever: Simulating electric vehicle diffusion with an agent-based mixed logit model of vehicle choice. JASSS 2013, 16, 5. [Google Scholar] [CrossRef]
  25. Thies, C.; Kieckhäfer, K.; Spengler, T.S. Market introduction strategies for alternative powertrains in long-range passenger cars under competition. Transp. Res. Part D Transp. Environ. 2016, 45, 4–27. [Google Scholar] [CrossRef]
  26. Vilchez, J.J.G.; Thiel, C. The Effect of Reducing Electric Car Purchase Incentives in the European Union. World Electr. Veh. J. 2019, 10, 64. [Google Scholar] [CrossRef]
  27. Ye, R.K.; Gao, Z.F.; Fang, K.; Liu, K.L.; Chen, J.W. Moving from subsidy stimulation to endogenous development: A system dynamics analysis of China’s NEVs in the post-subsidy era. Technol. Forecast. Soc. Chang. 2021, 168, 120757. [Google Scholar] [CrossRef]
  28. Dargay, J.; Gately, D. Modelling Global Vehicle Ownership. In Proceedings of the Ninth World Conference on Transport Research, Seoul, Korea, 22–27 July 2001; pp. 22–27. Available online: https://www.kth.se/social/upload/52a4c976f276547043781cfb/DargayGately2001.pdf (accessed on 30 May 2024).
  29. Ceylan, H.; Baskan, O.; Ozan, C. Modeling and Forecasting Car Ownership Based on Socio-Economic and Demographic Indicators in Turkey. TeMA-J. Land Use Mobil. Environ. 2018, 1, 47–66. [Google Scholar] [CrossRef]
  30. Liddle, B. The systemic, long-run relation among gasoline demand, gasoline price, income, and vehicle ownership in OECD countries: Evidence from panel cointegration and causality modeling. Transp. Res. Part D Transp. Environ. 2012, 17, 327–331. [Google Scholar] [CrossRef]
  31. Wu, T.; Zhao, H.; Ou, X. Vehicle Ownership Analysis Based on GDP per Capita in China: 1963–2050. Sustainability 2014, 6, 4877–4899. [Google Scholar] [CrossRef]
  32. Moshiri, S. Consumer responses to gasoline price and non-price policies. Energy Policy 2020, 137, 111078. [Google Scholar] [CrossRef]
  33. Bass, F.M. A New Product Growth for Model Consumer Durables. Manag. Sci. 1969, 15, 215–227. [Google Scholar] [CrossRef]
  34. Struben, J.; Sterman, J.D. Transition Challenges for Alternative Fuel Vehicle and Transportation Systems. Environ. Plan. B Plan. Des. 2008, 35, 1070–1097. [Google Scholar] [CrossRef]
  35. Sterman, J.D.; Forrester, J.W.; Standish, J.S. All models are wrong: Reflections on becoming a systems scientist. Dyn. Rev. 2012, 18, 501–531. [Google Scholar] [CrossRef]
  36. Jansson, J.; Nordlund, A.; Westin, K. Examining drivers of sustainable consumption: The influence of norms and opinion leadership on electric vehicle adoption in Sweden. J. Clean. Prod. 2017, 154, 176–187. [Google Scholar] [CrossRef]
  37. Weiss, M.; Zerfass, A.; Helmers, E. Fully electric and plug-in hybrid cars—An analysis of learning rates, user costs, and costs for mitigating CO2 and air pollutant emissions. J. Clean. Prod. 2019, 212, 1478–1489. [Google Scholar] [CrossRef] [PubMed]
  38. Franke, T.; Krems, J.F. What drives range preferences in electric vehicle users? Transp. Policy 2013, 30, 56–62. [Google Scholar] [CrossRef]
  39. Anable, J.; Brand, C.; Tran, M.; Eyre, N. Modelling transport energy demand: A socio-technical approach. Energy Policy 2012, 41, 125–138. [Google Scholar] [CrossRef]
  40. Khan, I. A survey-based electricity demand profiling method for developing countries: The case of urban households in Bangladesh. J. Build. Eng. 2021, 42, 102507. [Google Scholar] [CrossRef]
  41. Scott, K.R. Demand and price uncertainty: Rational habits in international gasoline demand. Energy 2015, 79, 40–49. [Google Scholar] [CrossRef]
  42. Olanipekun, I.; Olasehinde-Williams, G.; Akadiri, S.S. Gasoline prices and economic policy uncertainty: What causes what, and why does it matter? Evidence from 18 selected countries. Environ. Sci. Pollut. Res. 2019, 26, 15187–15193. [Google Scholar] [CrossRef] [PubMed]
  43. de Abreu, M.W.; Ferreira, D.V.; Pereira, A.O.; Cabral, J.; Cohen, C. Household energy consumption behaviors in developing countries: A structural decomposition analysis for Brazil. Energy Sustain. Dev. 2021, 62, 1–15. [Google Scholar] [CrossRef]
  44. Thorhauge, M.; Haustein, S.; Cherchi, E. Accounting for the Theory of Planned Behaviour in departure time choice. Transp. Res. Part F Traffic Psychol. Behav. 2016, 38, 94–105. [Google Scholar] [CrossRef]
  45. Comin, D.; Mestieri, M. Technology Diffusion: Measurement, Causes, and Consequences. Handb. Econ. Growth 2014, 2, 565–622. [Google Scholar] [CrossRef]
  46. Habib, K.N. Rational inattention in discrete choice models: Estimable specifications of RI-multinomial logit (RI-MNL) and RI-nested logit (RI-NL) models. Transp. Res. Part B Methodol. 2023, 172, 53–70. [Google Scholar] [CrossRef]
  47. Shafiei, E.; Davidsdottir, B.; Leaver, J.; Stefansson, H.; Asgeirsson, E.I. Energy, economic, and mitigation cost implications of transition toward a carbon-neutral transport sector: A simulation-based comparison between hydrogen and electricity. J. Clean. Prod. 2017, 141, 237–247. [Google Scholar] [CrossRef]
  48. Mohammad, P.; Fayaz-Heidari, A.; Moeini-Aghtaie, M.; Hassannayebi, E.; Basirati, M. Investigating the Sustainable Development of Charging Stations for Plug-in Electric Vehicles: A System Dynamics Approach. In IFIP International Conference on Advances in Production Management Systems; Springer Nature: Cham, Switzerland, 2023; pp. 400–416. [Google Scholar]
  49. Goli, P.; Shireen, W. PV powered smart charging station for PHEVs. Renew. Energy 2014, 66, 280–287. [Google Scholar] [CrossRef]
  50. McCoy, D.; Lyons, S. Consumer preferences and the influence of networks in electric vehicle diffusion: An agent-based microsimulation in Ireland. Energy Res. Soc. Sci. 2014, 3, 89–101. [Google Scholar] [CrossRef]
  51. Senge, P.M.; Jay, W.F. Tests for building confidence in system dynamics models. Syst. Dyn. TIMS Stud. Manag. Sci. 1980, 14, 209–228. [Google Scholar]
  52. Barlas, Y. Multiple tests for validation of system dynamics type of simulation models. Eur. J. Oper. Res. 1989, 42, 59–87. [Google Scholar] [CrossRef]
  53. Qudrat-Ullah, H.; Seong, B.S. How to do structural validity of a system dynamics type simulation model: The case of an energy policy model. Energy Policy 2010, 38, 2216–2224. [Google Scholar] [CrossRef]
Figure 1. A hybrid bottom-up and top-down modeling framework for SD simulation.
Energies 17 03525 g001
Figure 2. Causal loop diagram of the proposed model ((+) indicates a positive relation and (−) means a negative relation).
Energies 17 03525 g002
Figure 3. The core stock-flow diagram of the presented SD model.
Energies 17 03525 g003
Figure 4. System boundary and causal diagram of the extended TPB.
Energies 17 03525 g004
Figure 5. S-curve diagram of vehicle growth.
Energies 17 03525 g005
Figure 6. Selected steps of model validation.
Energies 17 03525 g006
Figure 7. Simulated and historical vehicle trends.
Energies 17 03525 g007
Figure 8. Estimated vehicle per capita.
Energies 17 03525 g008
Figure 9. The trend of ICVs (BAU).
Energies 17 03525 g009
Figure 10. The trend of NGVs (BAU).
Energies 17 03525 g010
Figure 11. The trend of HEVs (BAU).
Energies 17 03525 g011
Figure 12. The trend of PHEVs (BAU).
Energies 17 03525 g012
Figure 13. The trend of EVs (BAU).
Energies 17 03525 g013
Figure 14. The trend of charger level 3.
Energies 17 03525 g014
Figure 15. The trend of charger level 2.
Energies 17 03525 g015
Figure 16. The trend of EVs (different policies).
Energies 17 03525 g016
Figure 17. The trend of PHEVs (different policies).
Energies 17 03525 g017
Figure 18. The trend of HEVs (different policies).
Energies 17 03525 g018
Figure 19. The trend of NGVs (different policies).
Energies 17 03525 g019
Figure 20. The trend of ICVs (different policies).
Energies 17 03525 g020
Figure 21. Annual gasoline consumption over the 20 years in the first and second policies.
Energies 17 03525 g021
Figure 22. Gasoline consumption in different policies and scenarios.
Energies 17 03525 g022
Figure 23. Total gasoline saved in different policies (million liters).
Energies 17 03525 g023
Figure 24. Carbon dioxide emission under different policies in some selected years.
Energies 17 03525 g024
Figure 25. Comparing total carbon dioxide emission in different policies by 2040.
Energies 17 03525 g025
Table 1. A taxonomy of studies on AFVs penetration.
AuthorsScaleTime HorizonTechnologyLevel of AnalysisTransportation Model SpecificationsFeedback LoopsImpact AssessedEnergy and Transport InteractionPolicies and Scenarios
Charging Infrastructure DevelopmentTechnology ImprovementSocio-Economic FactorsFactors Related to Social InfluencesLevels of EV ChargingFuel ConsumptionAttitudinal, Normative, and Control ComponentsFamiliarityRecharging InfrastructureEmission StandardsModel InnovationEnergy UseCostCO2 EmissionThe Constraint of the Power GridThe Energy Efficiency of VehiclesEnvironmental EffectFuel PriceFuel ConsumptionMonetary Policies (Tax, Financial Incentive, etc.)Non-Financial Scenarios (Demographic, Age, etc.)
Saraf and shastri, 2023 [16]Country2050EV, CNG, E85DXX -X X XXX XXXX
Buchmann et al., 2021 [23]Country2030ICV, BEV, FCEVDX X - XX X XX
Ye et al., 2021 [27]Country2025NEVDX X X X X X
Sarah Fluchs, 2020 [12]World2050BEVA X - X XX
Illmann and Kluge, 2020 [13]Country2030EV, PHEVDXX - X X
Gómez Vilchez et al., 2019 [26]World region2024BEV, PHEVDXXXX- XX X XXXXX
Kieckhäfer et al., 2017 [21]Country2030Gasoline, BEV, HEV, PHEV, Diesel, FCEVA, DXX X- XXX X X X X
Noori and Tatari, 2016 [11]Country2030BEVDX XX- X XXX X
Pasaoglu et al., 2016 [19]World region2050LPG, CNG, Biofuels, HEV, PHEV, BEV, FCEVAXX X- X XX XXXXX
Shafiei et al., 2015 [7]Country2030EVDX XX3 XX X XXXX
Brown, 2013 [24]Metropolitan2030PHEV, BEVDX X 2 X XXXXX
Keith, 2012 [17]Country2050CNG, HEV, PHEV, BEVDX XX3 XX XX X
Shepherd et al., 2012 [18]Country2050PHEV, BEVD X- X XX X
Karplus et al., 2010 [14]World region2100Biofuels, PHEVD X - XXX X X X
Struben and Sterman 2008 [34]Country region60 yearsHEV, CNG, Biofuels, FCEVDXXXX- XX X XXX X
This studyCountry2040EV, PHEV, HEV, CV, NGVA, DXXXX2, 3XXXX XXXXXXXXXX
Note: Level of analysis: A = aggregated, D = disaggregated. X indicates that the factor is considered in the study. 2 and 3 refer to the level of charging station.
Table 2. Detailed explanations and meanings of feedback loops are presented in Figure 2.
Loop IDLoop NameElements InvolvedDescription of Relationships
R1Charging station growthCharging station number, Accessibility of charging stations, Installation potential, Profitability, Total energy outputAs the number of charging stations increases, their accessibility and profitability improve, which encourages the installation of more charging stations and enhances total energy output.
R2Installation potentialInstallation potential, Charging station number, Profitability, Total energy output, Grid pressure, Usage of charging stationsIncreased installation potential boosts the number of charging stations, improving profitability and total energy output while influencing grid pressure and usage patterns.
R3The desirability of charging stationsDesirability of charging stations, Charging station number, Accessibility, ProfitabilityAs charging stations become more desirable, their numbers increase, leading to greater accessibility and profitability.
R4Government incentivesDiscounts by the government, Loans offered by the government, Plug-in EV purchase price, Choice probability, Vehicle sales, Learning by doingGovernment incentives such as discounts and loans reduce the purchase price of plug-in EVs, increasing their choice probability and sales. This enhances learning by doing and further reduces costs.
R5Purchase intention and familiarityPurchase intention, Market share, Vehicle sales, Familiarity level, Subjective normIncreased purchase intention raises vehicle market share and sales, which boosts familiarity and strengthens subjective norms, further enhancing purchase intention.
R6Perceived behavior controlsPerceived behavior controls, Attitude, Market share, Vehicle sales, Purchase intentionImproved perceived behavior controls positively influence attitudes, increasing market share and sales and boosting purchase intention.
B1Electricity demand and supplyDemand for electricity, Total energy output, Grid pressure, Usage of charging stationsHigher demand for electricity from charging stations increases grid pressure, which affects total energy output and charging station usage.
B2Affordability and consumer utilityAffordability, Consumer utility, Perceived behavior controls, Gasoline price, Vehicle owners’ anxietyIncreased affordability and consumer utility reduce anxiety about gasoline prices and perceived behavior controls, stabilizing consumption patterns.
B3Gasoline consumption dynamicsGasoline price, Inflation, Gasoline share in family budget, Vehicle owners’ anxiety, Alternative waysRising gasoline prices lead to higher inflation and gasoline share in family budgets, increasing anxiety and promoting alternative ways, which eventually reduce gasoline consumption.
Table 3. Historical data of vehicle per capita, number of passenger cars, and GDP.
YearNumber of Cars per 1000 PeopleNumber of CarsDollar Price (Toman)GDP per Capita
2007 1136,437,8729283765
2008 1177,162,3519574905
2009 1218,023,8209835460
2010 1258,058,82710366140
2011 1399,968,78511006790
2012 15311,178,68112267050
2013 16611,867,08112267875
2014 17312,391,83124005966
2015 18113,150,17028005562
2016 21514,042,77032004887
2017 23715,197,98135005230
2018 25916,539,55842005462
201927118,152,33642003277
202028019,015,65562004091
Table 4. Considered population scenarios.
YearScenario 1: High Increase in Fertility RateScenario 2: Fertility Reduction with Steep Slope
(2.6 Children)(1.5 Children)
2015–2020 1.25 1.16
2020–2025 1.11 0.87
2025–2030 0.98 0.58
2030–2035 0.93 0.35
2035–2040 0.91 0.23
Table 5. Percentage of each vehicle age interval.
Vehicle AgeUnder 5 Years6–10 Years11–15 Years16–20 Years21–25 Years26–30 Years31–35 YearsOver 36 Years
Percent 49.71 32.21 8.86 3.65 1.32 3.28 0.76 0.21
Table 6. CO2 emission factors.
FuelUnitsGreenhouse Factor
GasolineTonne CO2/liter0.0023
ElectricityCO2/Kwh Tonne0.00064
CNGTonne CO2/m30.0027
Table 7. Parameters and values for chargers.
Type of ParameterResidential ChargerLevel II PublicLevel III Public
Equipment cost0900$15,000$
Installation cost0600$10,000$
Charging prices0.11 $/Kwh0.162 $/Kwh0.34 $/Kwh
Power output3.7 Kw19.2 Kw50 Kw
Available hours during the week 10 h3 h3 h
Available hours on the weekend15 h5 h5 h
Table 8. Error analysis of the model.
VariableR2MSERMSPE (%)
Vehicle Per Capita 6000.958170.49.53
Vehicle Per Capita 5000.93110.72
Vehicle Per Capita 4000.8972.131.12
Disclaimer/Publisher’s Note: The statements, opinions and data contained in all publications are solely those of the individual author(s) and contributor(s) and not of MDPI and/or the editor(s). MDPI and/or the editor(s) disclaim responsibility for any injury to people or property resulting from any ideas, methods, instructions or products referred to in the content.