Article

Study on Heat and Mass Transfer Performance of Ultra-Thin Micro-Heat Pipes

by
Yuming Xiang
1,
Yonghua Sun
2,
Guolin Li
2,
Xiangjuan Liu
1,3,
Lin Liu
1,4,*,
Fangwei Zhao
1,* and
Xibing Li
1,*
1
College of Mechanical and Electrical Engineering, Fujian Agriculture and Forestry University, Fuzhou 350002, China
2
Department of Intelligent Manufacturing, Shandong Labor Vocational and Technical College, Jinan 250022, China
3
College of Computer and Control Engineering, Qiqihar University, Qiqihar 161000, China
4
School of Management, Fujian University of Technology, Fuzhou 350118, China
*
Authors to whom correspondence should be addressed.
Energies 2024, 17(14), 3426; https://doi.org/10.3390/en17143426
Submission received: 11 June 2024 / Revised: 5 July 2024 / Accepted: 8 July 2024 / Published: 11 July 2024
(This article belongs to the Topic Applied Heat Transfer)

Abstract

:
With increased heat control requirements for high-heat-flux products in a narrow heat dissipation space, the ultra-thin micro-heat pipe (MHP) with high heat transfer performance has become an ideal heat dissipation component. In this study, the computational fluid dynamics (CFD) method is used to conduct three-dimensional modeling based on the geometric structure characteristics of an ultra-thin MHP. The capillary pressure of the sintered wick is represented by the modified parameter, and a simple and valuable heat and mass transfer model of the ultra-thin MHP is established by fitting the real experimental data through parameter modification. The flow situation of the working medium inside the ultra-thin MHP is analyzed based on the abovementioned parameters. The results show that when the modified parameter is α = 1.5, the temperature equalization requirements of the ultra-thin MHP can be met to the best degree. Moreover, with an increase in heating power, the error value between the surface temperature data of the model and the experimental data of the ultra-thin MHP sample decreases. Under different heating powers, the working medium inside the ultra-thin MHP has the same flow trend. In addition, a 40% increase in temperature difference is found at the junction of the heating section and the adiabatic section, leading to a fluctuation in the temperature gradient on the heat pipe surface. The research results provide a theoretical basis for the model establishment, heat and mass transfer performance investigation, and parameter optimization of ultra-thin MHPs.

1. Introduction

Microelectronic and optoelectronic technologies have become the core technologies of current high-tech and information industries and the basic industry of the new economic era. The continuously decreasing size of electronic products results in the narrow heat dissipation space of internal electronic devices and the high heat flux, increasing the requirements for heat transfer. Using high-efficiency heat dissipators to reduce the heat flux of the chip and accelerate the heat transfer process has become one of the key technologies for developing and applying micro-electronic devices [1]. An ultra-thin micro-heat pipe (MHP) can transfer heat through phase changes of the working liquid inside. It has the advantages of high thermal conductivity, an excellent temperature equalization property, and high stability; hence, it is widely used in various complex working conditions. However, the heat transfer efficiency of the heat pipe is restricted by many factors, such as internal working medium, liquid wick structure, and gas–liquid channel structure [2]. Heat pipes’ commonly used working media include deionized water, ethanol, acetone, and nanofluids [3]. Common wick structures include a powder-sintered wick [4,5], wire mesh wick [6], grooved wick [7], and a composite wick comprising two or more structures [8]. Since heat pipe manufacturing under different factors requires specific conditions, the experimental cost is high, and the experimental period is long. In many cases, experiments cannot fully demonstrate the internal working mechanism. Under these circumstances, the numerical simulation method becomes the first choice.
Huang et al. [9] established a numerical model and analyzed the effects of gas–liquid channel height on the vapor velocity, vapor pressure drop, and total heat resistance of a vapor chamber (VC). Jung et al. [10] conducted steady-state analysis of an MHP, obtained the shape of the gas–liquid interface by a modified Laplace–Young formula, and predicted the heat and mass transfer region of the liquid and vapor according to the thickness of the gas–liquid interface. Koito conducted three-dimensional numerical modeling of the vapor flow and heat transfer characteristics in ultra-thin MHPs. The authors obtained the internal working medium’s velocity, pressure, and temperature distribution. Moreover, they analyzed the influences of the off-center position of the wick structure on the heat transfer performance of the ultra-thin heat pipe based on an established numerical model [11,12]. Zhang et al. [13] designed a new type of grooved VC and established a two-dimensional heat transfer model based on the VC structure to analyze the temperature field and velocity field in the VC. The authors compared the results obtained with those of the experimental ones. Lu et al. [14] proposed a thermohydraulic model to analyze the performance of a VC with different sintered central columns. Moreover, the authors discussed the influences of central column diameter on VC performance. Wang et al. [15] proposed a simplified numerical model to investigate the thermal performance of a composite porous VC (CPVC). They explored the influences of wick structure, wick porosity, and powder size on the thermal performance of the CPVC. Fang et al. [16] developed a three-dimensional pore-scale Boltzmann model to be coupled with the heat transfer model. In addition, the authors explored the transient characteristics of heat pipes. Huang et al. [17] established a three-dimensional transient numerical ultrathin VC (UTVC) model. The authors explored the variation in saturation pressure with saturation temperature. They discussed the influences of the Marangoni effect on the boundary conditions. Patankar et al. investigated the transient thermal behaviors of a VC using a low-cost three-dimensional transient semi-analytic transport model. The authors identified three key heat transfer mechanisms, providing references for the subsequent design of a VC [18,19]. Rabiee [20] developed a numerical model via OpenFOAM 4.0 to investigate the heat transfer process in boiling and condensation. The authors experimentally validated the feasibility of the numerical model. Liu et al. [21] developed a reduced-order thermal fluid model to predict the effects of heat flux and liquid charge on the thermal performance of their overall device. Lastly, the authors experimentally validated the simulation results via a prototype device.
The above studies show that the existing models mostly conduct numerical modeling of heat pipes based on given parameters and known boundary conditions. Then, heat pipes’ heat and mass transfer situation and the corresponding influencing factors are analyzed. The flow state of the inner working medium should be analyzed for the ultra-thin heat pipe samples, and the research method of inverse heat transfer problems can be used. Specifically, the measured temperature information can enable the inversion of the system’s internal characteristics or boundary conditions [22]. This method is usually applied to calculate thermal stresses and strains on the aircraft surface [23] or to detect internal defects of equipment [24] quantitatively.
This paper establishes a three-dimensional model based on ultra-thin heat pipes’ heat and mass transfer theory and the grid independence test. The simulation results are fitted with the experimental temperature data of ultra-thin MHP samples through user-defined functions using a research method similar to the method of inverse heat transfer problems. Finally, a simple heat and mass transfer model of the ultra-thin MHP is established to analyze the flow state of the internal working medium.

2. Establishing the Ultra-Thin MHP Model

2.1. Establishing the Heat and Mass Transfer Performance Test Platform

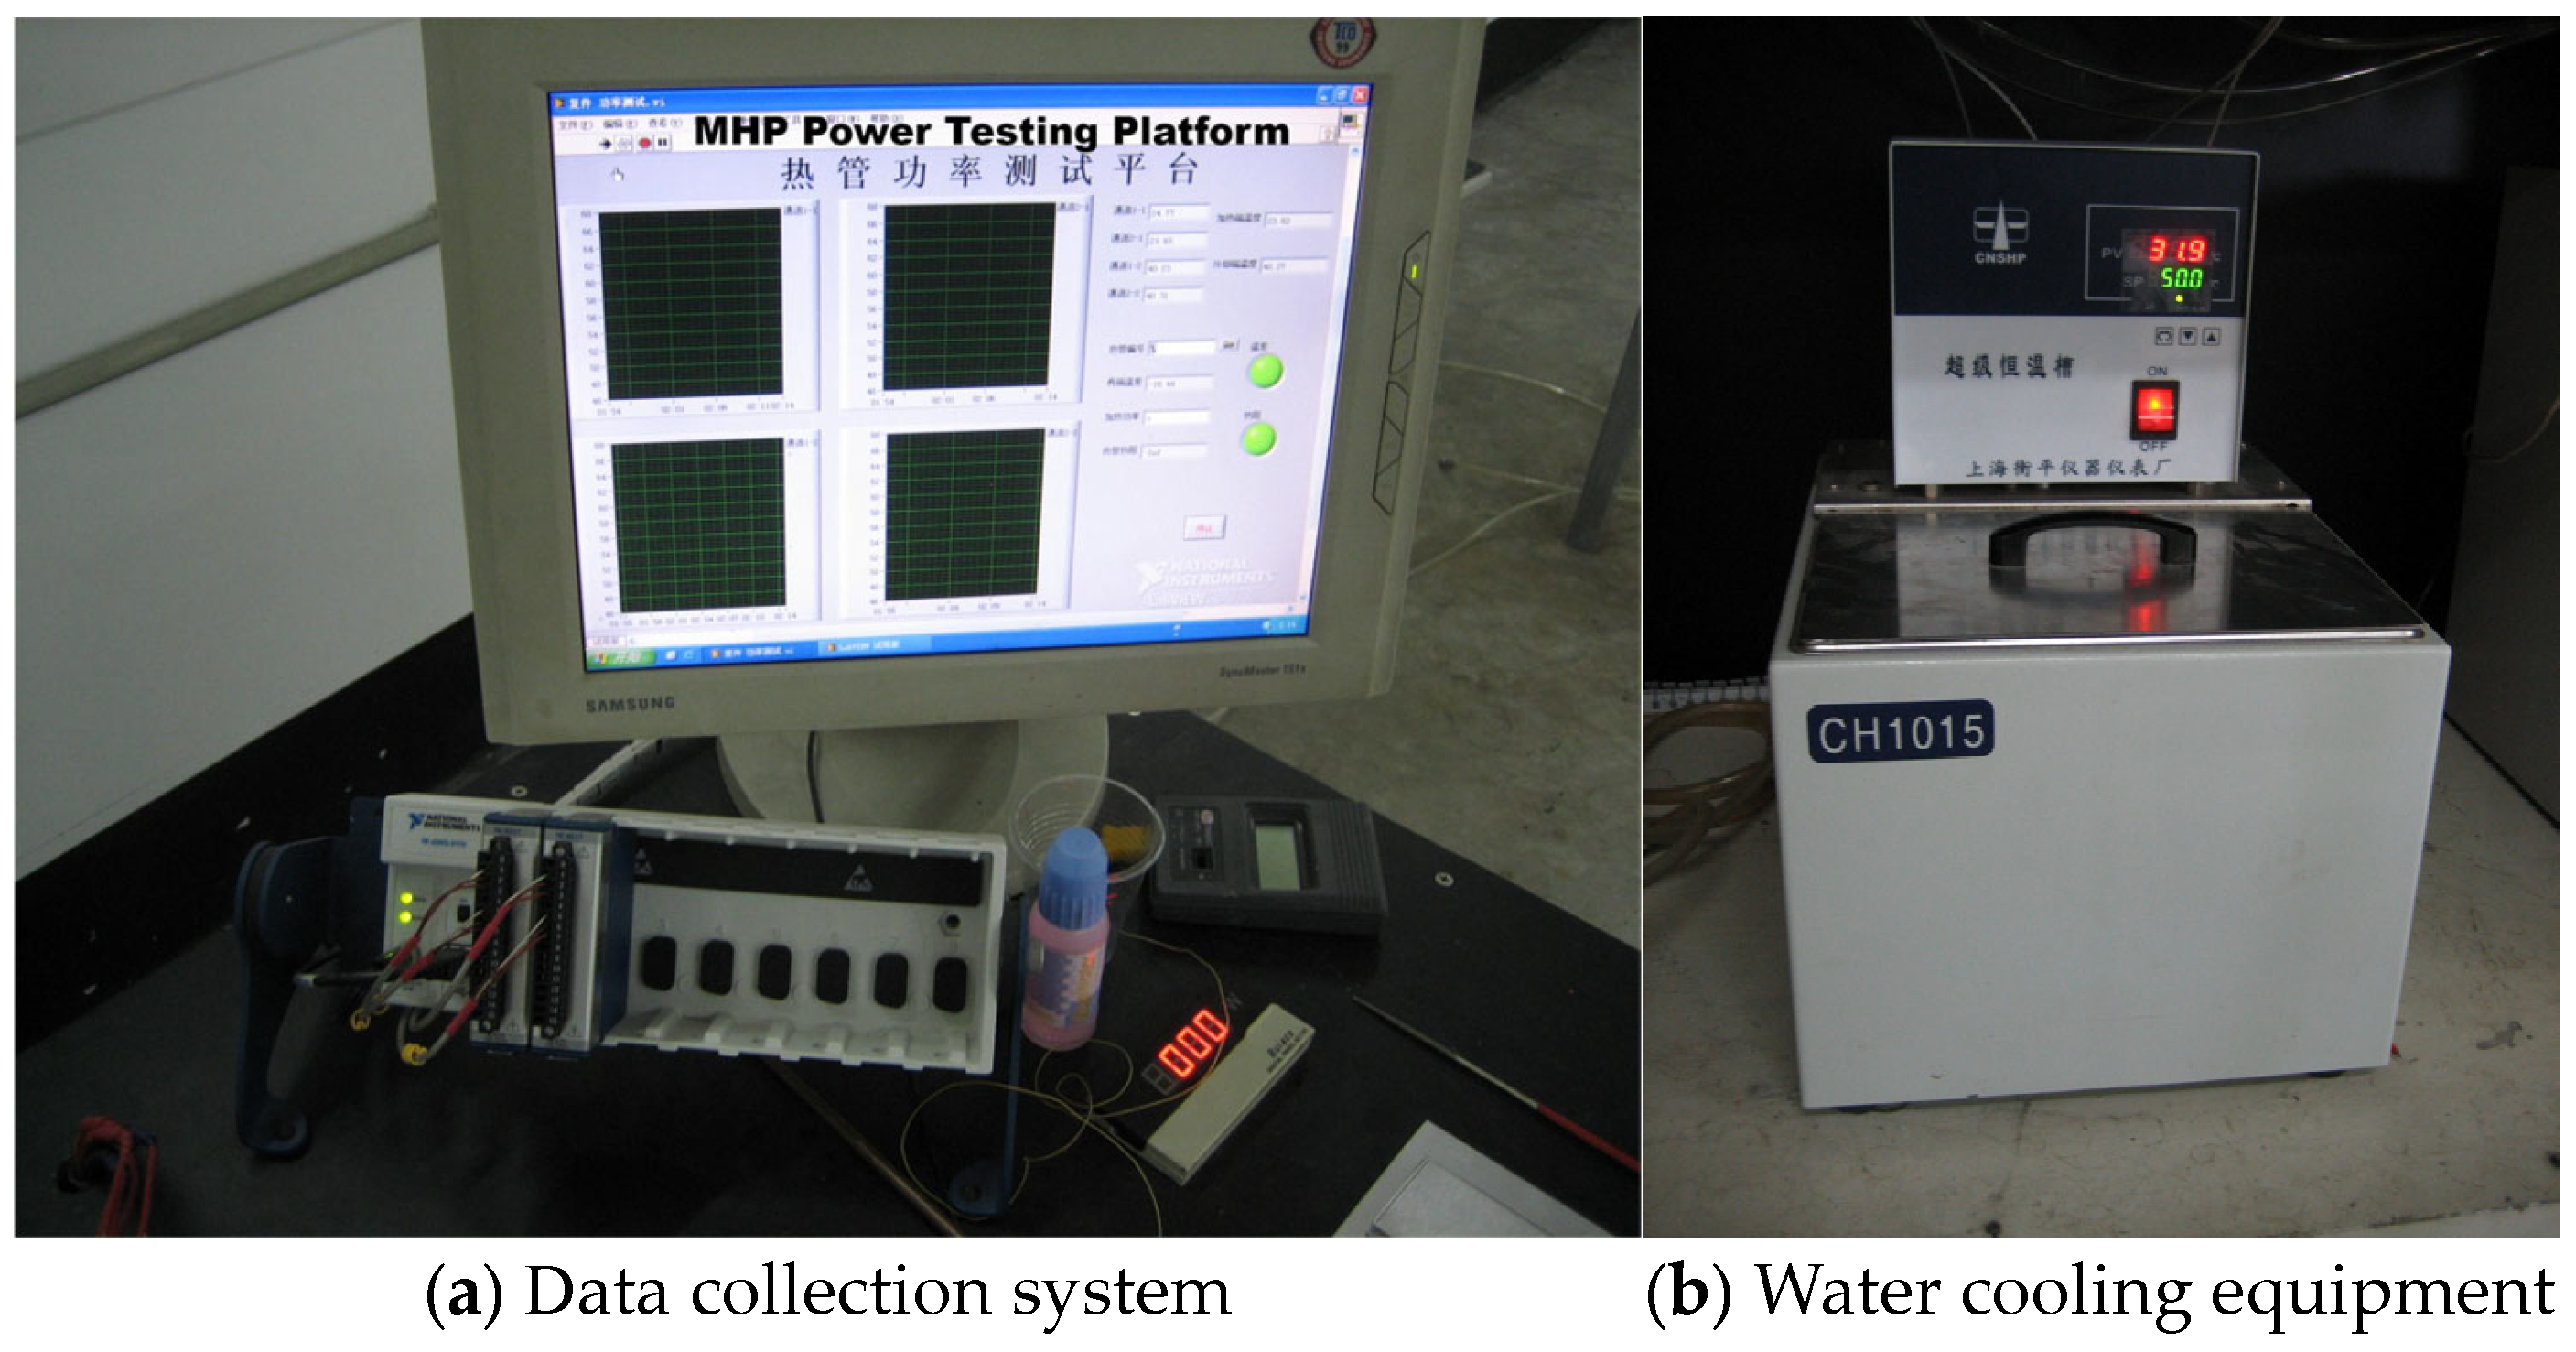
The heat transfer performance of an ultra-thin MHP with a length of 110 mm and a width of 10 mm was tested by a self-established experimental platform. The thickness of the ultra-thin MHP is 1 mm, the pipe wall material is copper, the interior is a powder-sintered wire-mesh wick, and the working medium is water. The temperature measurement experiment was conducted on the sintered ultra-thin MHP under different heating powers, as shown in Figure 1. The images of the test computer and the water cooling equipment are shown in Figure 2.
During the experiment, the test system’s heating and cooling modules were installed in two grooves of the test bench to ensure the accuracy of the experimental data (heat conductivity coefficient is less than 0.3 W/(m·°C)). Moreover, the bench base exterior was wrapped with thermal insulation cotton with a heat conductivity coefficient of less than 0.05 W/(m·°C). The experiment environment was artificially controlled, and insulation foam plastic was used to wrap the adiabatic section exposed to air and the parts in contact with the air of the heating copper block and the cooling copper block, preventing heat exchange between these exposed parts and the air. Moreover, insulation foam was placed around the entire experimental device to ensure that most heat from the heating copper block was transferred to the cooling copper block through the ultra-thin MHP and removed by the cooling water through heat convection.
The temperature data acquisition module mainly comprises a thermocouple, acquisition card kit, and test computer. An Omega T-type chip thermocouple was used, with a measuring range of 500 °C and a test error of 0.1 °C. Acquisition card kits used for the test were NI9217 and NI cDAO-9172, connected to the thermocouple and the test computer (shown as Figure 2 (a)), respectively. Seven temperature acquisition data points were used, among which two test points (T1 and T2) were distributed in the heating section, three (T5, T6, and T7) were in the cooling section, and two (T3 and T4) were in the adiabatic section.

2.2. Establishing the Three-Dimensional Model

The ultra-thin MHP comprises a pipe wall, wick, and working medium cavity. The pipe wall and wick material are copper, and the working medium is deionized water, which physical properties can be referenced in Table 1. The operation of the MHP follows an axial heat transfer mode. The heating section of the heat pipe is heated, and the inner working medium is heated and vaporized to fill the VC with vapor. The temperature difference in the condensing and heating sections causes different pressures inside the VC. Under such pressure difference, the gas in the VC flows from the evaporation section to the condensing section and releases heat in the condensing section, condensing into liquid. The liquid working medium returns to the heating section of the heat pipe under the combined action of the capillary pressure of the wick, the pressure difference, and the gravity effect, completing an entire thermal cycle.
The wick is filled with deionized water with a filling rate of 100%. The outer length of the ultra-thin MHP is 110 mm, and the outer width is 9 mm. The thickness of the copper wall is 0.2 mm, and the width of the inner sintered wick is 4 mm. The heating and condensing sections are located at the two ends of the MHP. The length of the heating section is 15 mm, and the length of the condensing section is 40 mm. The remainder of the outer wall’s surface is adiabatic, and the interfaces between the wick and the working medium cavities at both sides are set as gas–liquid surfaces. The overall structure of the three-dimensional model based on the sintered ultra-thin MHP structure is illustrated in Figure 3, with its dimensional values detailed in Table 2.

2.3. Settings of Governing Equations and Boundary Conditions

The basic assumptions of the ultra-thin MHP in operation are as follows:
(1)
The heat pipe does not fail under different heating powers.
(2)
The evaporation and condensation occur at the gas–liquid interface. The radiative heat transfer is ignored, and only conductive and convective heat transfer are considered.
(3)
The flow states of liquid and gaseous working media are both laminar, and the fluids are incompressible.
(4)
The wick is an isotropic porous medium filled with a liquid working medium.
(5)
The vapor pressure inside the heat pipe equals the saturated vapor pressure at the corresponding temperature.
The governing equation can be obtained based on the above assumptions. The mass conservation, momentum conservation, and energy conservation equations of the gaseous working medium inside the heat pipe are as follows:
ρ v c p , v u v T v = k v T v ,
u v = 0 ,
ρ v u v u v = P v + μ v 2 u v .
where ρ is the density, Cp is the specific heat capacity at constant pressure, k is the equivalent heat conductivity coefficient, u is the velocity vector, P is the pressure, μ is the dynamic viscosity, T is the temperature, and subscript v indicates that the working medium is water vapor.
The influences of the internal porous medium on the water flow inside the heat pipe wick can be neglected. The water flow satisfies the hypothesis of a continuous medium, and the influences of the structure of the porous medium on the internal fluid flow can be corrected by Darcy’s law. Then, the mass conservation, momentum conservation, and energy conservation equations of the liquid working medium inside the wick porous medium can be obtained as follows:
ρ w c p , w u l T l = k w T l ,
u l = 0 ,
ρ l K μ l P l = q m .
where kw represents the equivalent heat conductivity coefficient, qm is the mass flow rate, K is the permeability of the wick, and subscripts w and l refer to the wick’s and the liquid’s working medium, respectively.
The heat transferred from the wick in the evaporation section to the cavity of the heat pipe is balanced with the heat transferred from the cavity of the heat pipe to the wick in the condensation section. According to the energy conservation law and Fourier heat conduction law:
i = 0 M k i A i Δ l / 2 T i T v = j = 0 N k j A j Δ l / 2 T v T j ,
At the gas–liquid interface, the relationship between the saturated pressure of the working medium and the saturated temperature can be determined via the Clausius–Clapeyron equation:
T s a t = 1 T r e f R g h f g ln P s a t P r e f 1 .
where Rg is the universal gas constant, hfg is the latent heat of vaporization, subscript sat refers to the saturation state, subscript ref refers to the reference value, and reference pressure Pref and reference temperature Tref are 0.1 MPa and 373.15 K, respectively.
The mass conservation boundary conditions at the gas–liquid interface are:
ρ l u l = ρ v u v .
Constant heat flux is used for heating in the evaporation section, and convective heat transfer is adopted in the condensation section:
q = Q S e L e ,
h c = Q S c L c T T .
where q represents the heat flux in the evaporation section, hc represents the convective heat transfer coefficient in the condensation section, S represents the surface area of the ultra-thin MHP, L represents the length of the corresponding section, subscripts e and c correspond to the evaporation section and condensation section, respectively, and T∞ represents the incoming water temperature of the condensing water bath.

2.4. Settings of the Modified Parameter

Porosity and permeability are two important porous media parameters. In the capillary rise experiment, the liquid working medium will flow in the direction anti-opposite to the gravity direction under the capillary pressure of the wick porous medium. According to the Laplace–Young equation, the capillary pressure of the wick can be obtained as follows:
Δ P c a p = 2 σ cos θ R p .
where Rp is the pore radius of the wick, θ is the contact angle between the working medium and the porous medium, and σ is the surface tension of the working medium. However, since Rp is difficult to measure in practice, the above formula (Equation (12)) can usually be expressed by the effective capillary radius Reff:
Δ P = 2 σ R e f f .
In a CFD calculation, the transmission of the working medium in porous media is defined by the source term. The liquid is heated and evaporated in the wick, and the liquid working medium fills the grids where the gaseous working medium is located. Hence, it can be assumed that the capillary pressure exists at the gas–liquid interface. Moreover, the wick interior is assumed to be filled with the working medium. Then, the working medium is characterized by the most obvious transport effect at the junction of the wick edge and the gaseous cavity. In the definition statement of the source term, the expression for the capillary pressure is:
α C _ t h 1 C _ t h 2 σ cos θ 3 ε r .
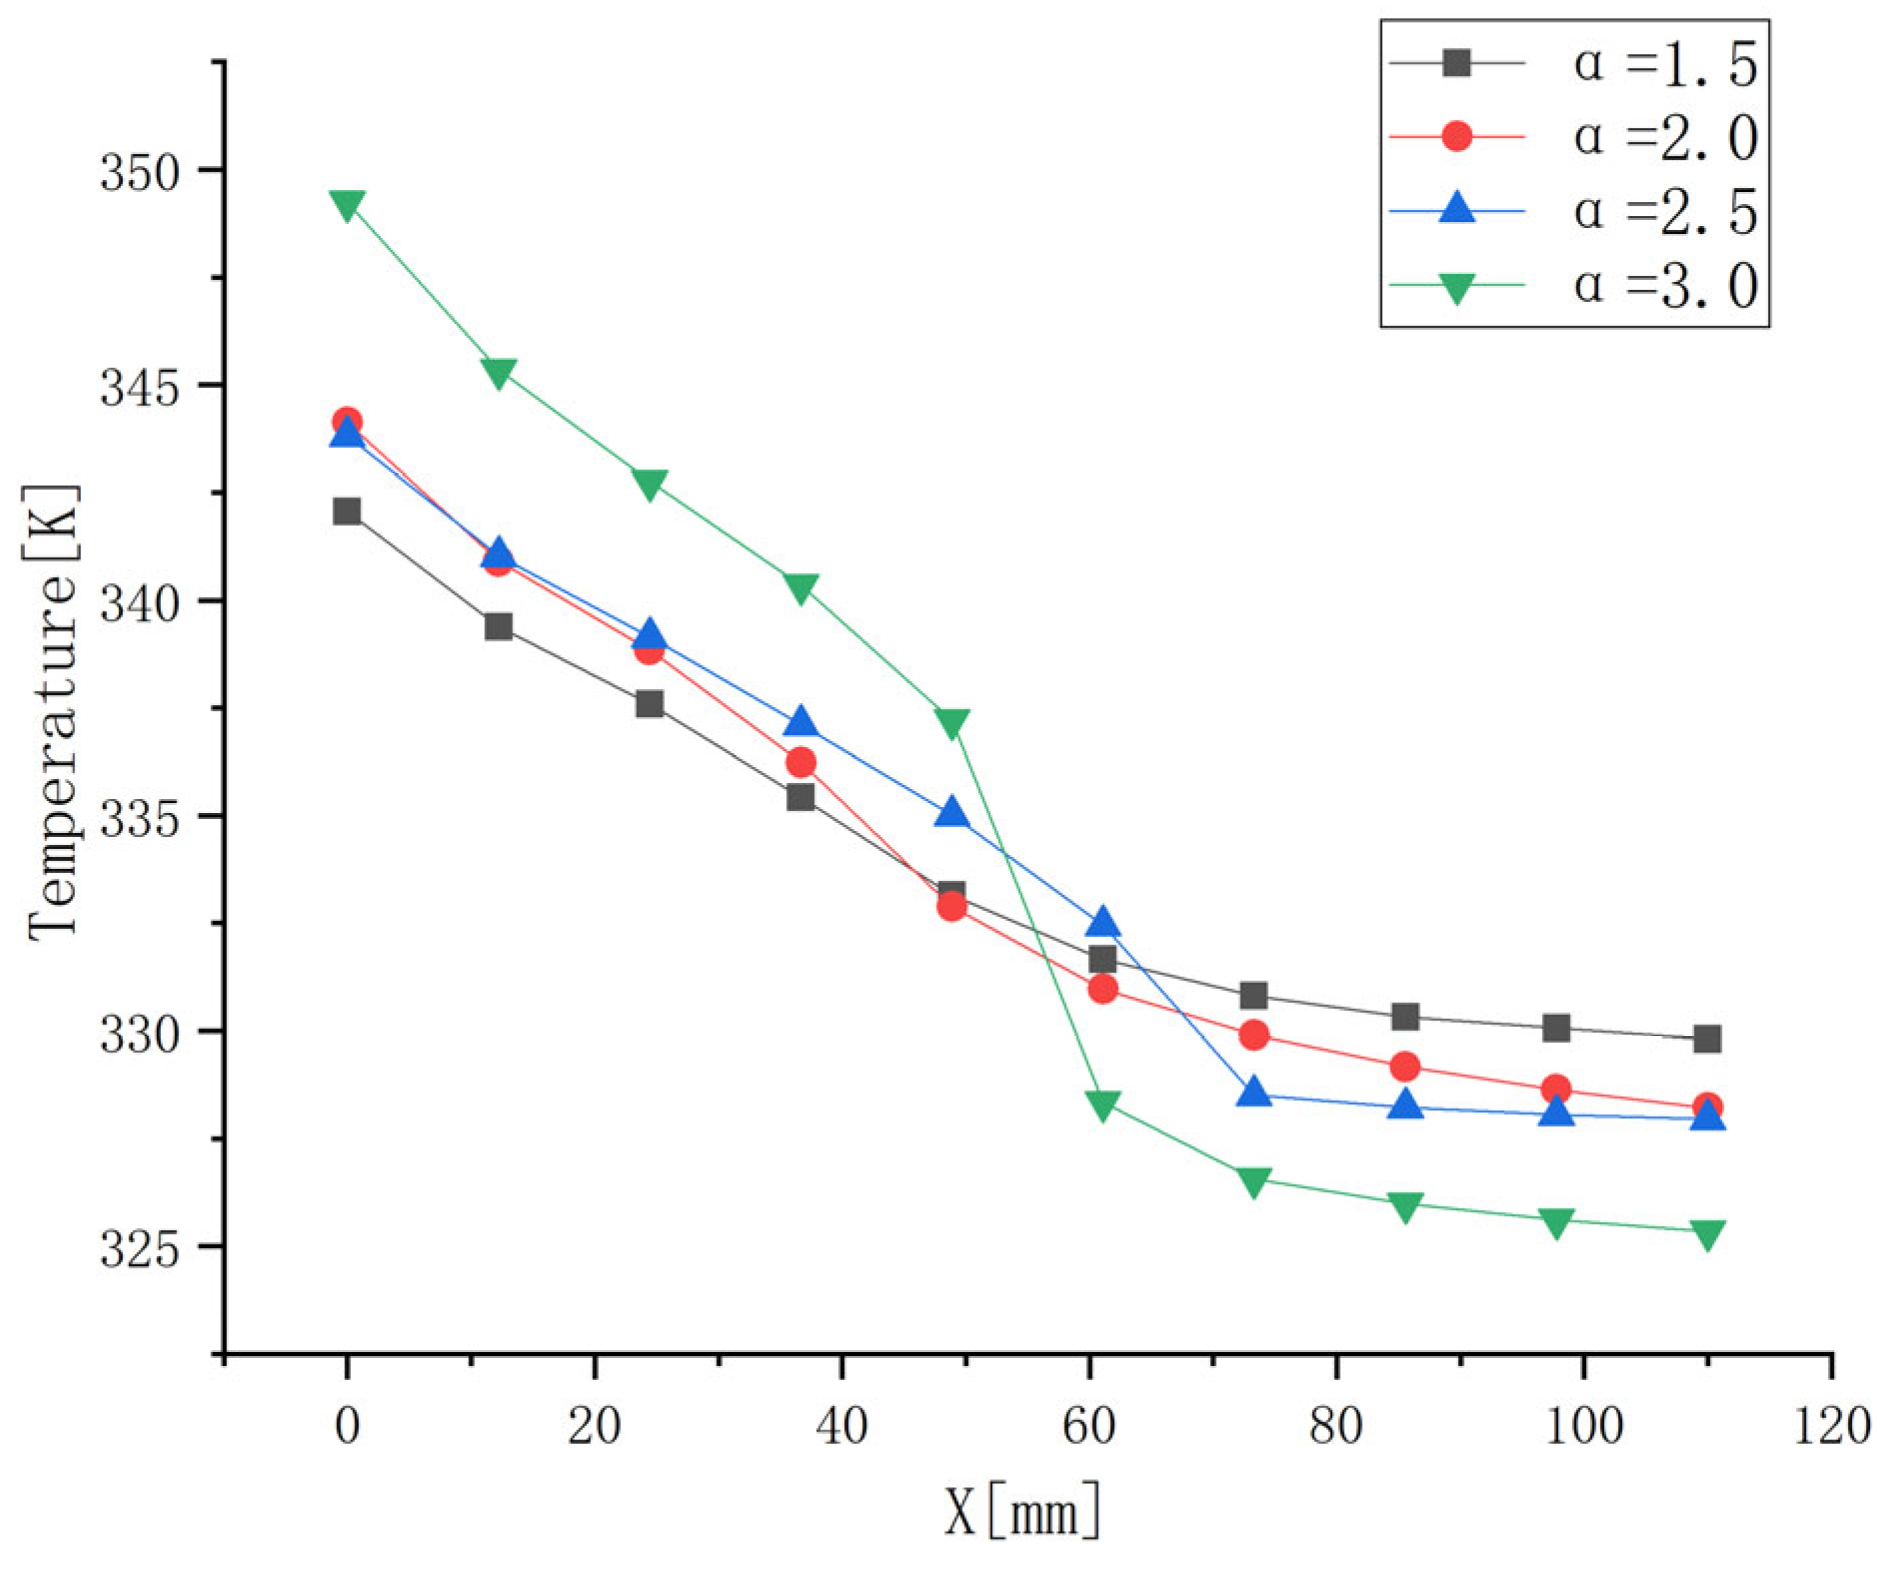
where α is the modified parameter of the expression for the capillary pressure. The controlling effect of C _ t h 1 C _ t h on the capillary force exists only at the grids corresponding to the gas–liquid junction. According to the preliminary simulation, if α is set to a larger value, the ultra-thin MHP model cannot reach a stable state. In this case, the maximum temperature difference keeps an increasing trend, and the flow state of the inner working medium is disturbed, which does not conform to the actual physical phenomenon of heat transfer in heat pipes. Therefore, the value of α is set to 1.5, 2, 2.5, and 3 to simulate and analyze the influences of wick parameters on the heat transfer performance of the heat pipe.

2.5. Grid Independence Test

Space Claim was used to build the three-dimensional model, and ICEM was used to partition the hexahedral-structured grid and improve computational accuracy. In the grid independence test, the maximum temperature on the surface of the heat pipe is selected as the reference to analyze the relationship between the maximum temperature and the grid quantity. As shown in Figure 4, the maximum temperature presents a downward trend with an increase in grid quantity but finally stabilizes within a small range. Since the grid quantity significantly affects the computational time, selecting an excessive grid quantity is inappropriate. When the grid quantity reaches 379,906 or above, the surface temperature of the heat pipe fluctuates within the scope of 0.1% with an increase in grid quantity, meeting the requirement of computational accuracy. Hence, the grid quantity is finally determined as 379,906.

3. Heat and Mass Transfer Performance Analysis of the Ultra-Thin MHP

3.1. Influences of α on Temperature Distribution

Figure 5 shows the temperature distribution on the surface of the heat pipe for different α values of the capillary pressure expression under the same heating power. The temperature distribution on the surface of the heat pipe is similar for different α values. Moreover, the temperature shows a downward trend from the heating section to the condensation section. A high-temperature zone is mainly concentrated in the evaporation section, the middle adiabatic section shows a large temperature gradient, and the temperature distribution is uniform in the condensation section.
With an increase in α, the overall temperature distribution of the heat pipe changes more dramatically. When α = 3, the overall maximum temperature of the heat pipe reaches 64.51 °C, and the maximum temperature difference reaches 23.91 °C; when α = 2.5, the overall maximum temperature of the heat pipe decreases by 7.13%, and the maximum temperature difference decreases by 33.71%. When α further decreases, the deviation value of the maximum temperature is reduced to 2.9%, and the overall temperature difference of the heat pipe decreases to 4.91 °C; the heat pipe model shows a greatly improved temperature equalization performance.
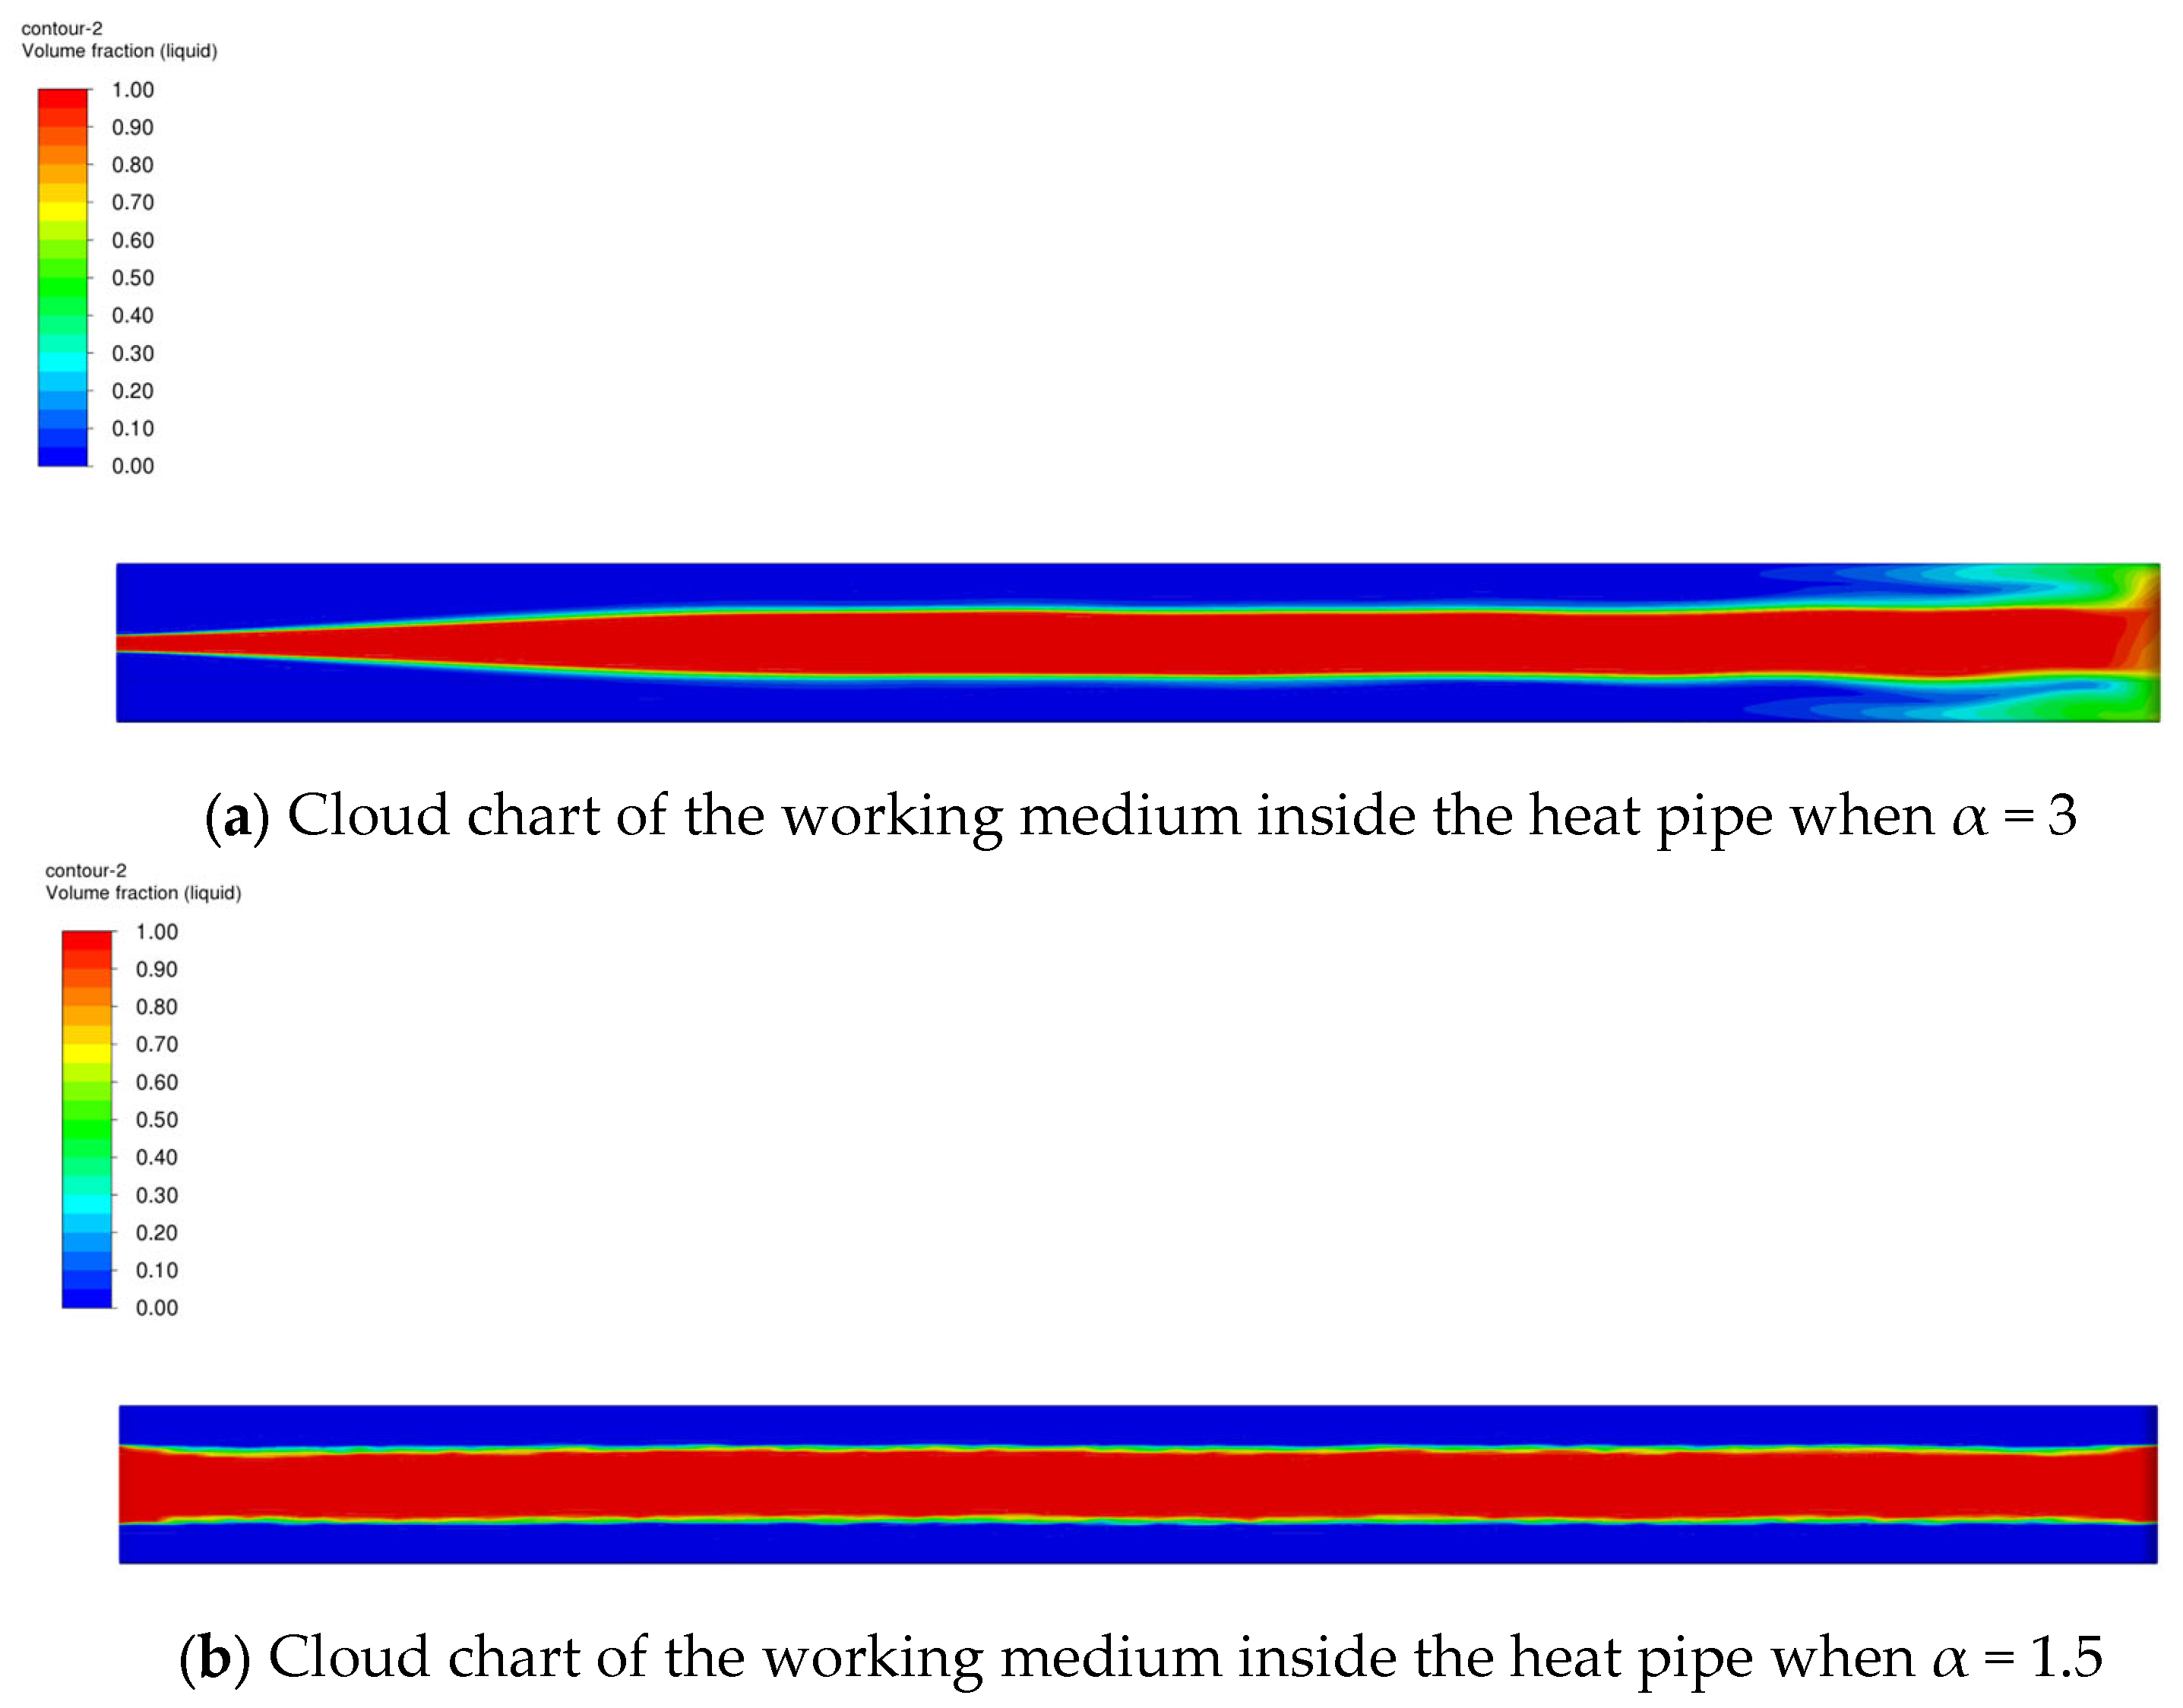
Figure 6 shows the distribution contours of the inner working medium of the ultra-thin MHP model under the same heating power when α = 3 and α = 1.5. The wick presents better transport performance for the liquid working medium at the higher α value of three. However, this transportation process transports the liquid working medium without complete heat exchange to one end of the heat pipe, leading to “liquid accumulation”. As a result, the temperature equalization property of the ultra-thin MHP model is degraded, and the temperature gradient is increased. Hence, α = 1.5 is chosen as the best modified parameter value.

3.2. Model Reliability Analysis

During measurement, the temperature data at different temperature measurement points were read directly through the computer. When the measured temperature fluctuation was less than 1 °C within 10 min, the heat pipe had reached the heat balance state. If the temperature difference between two adjacent points in the axial direction was too large (>30 °C) under the current heating power or the operating temperature of the heat pipe exceeded 100 °C, the experiment was stopped. At this moment, the temperature distribution of the heat pipe had deviated greatly from the actual working conditions, and there was no research value. In this case, the corresponding heating power was recorded as the limit power of the heat pipe.
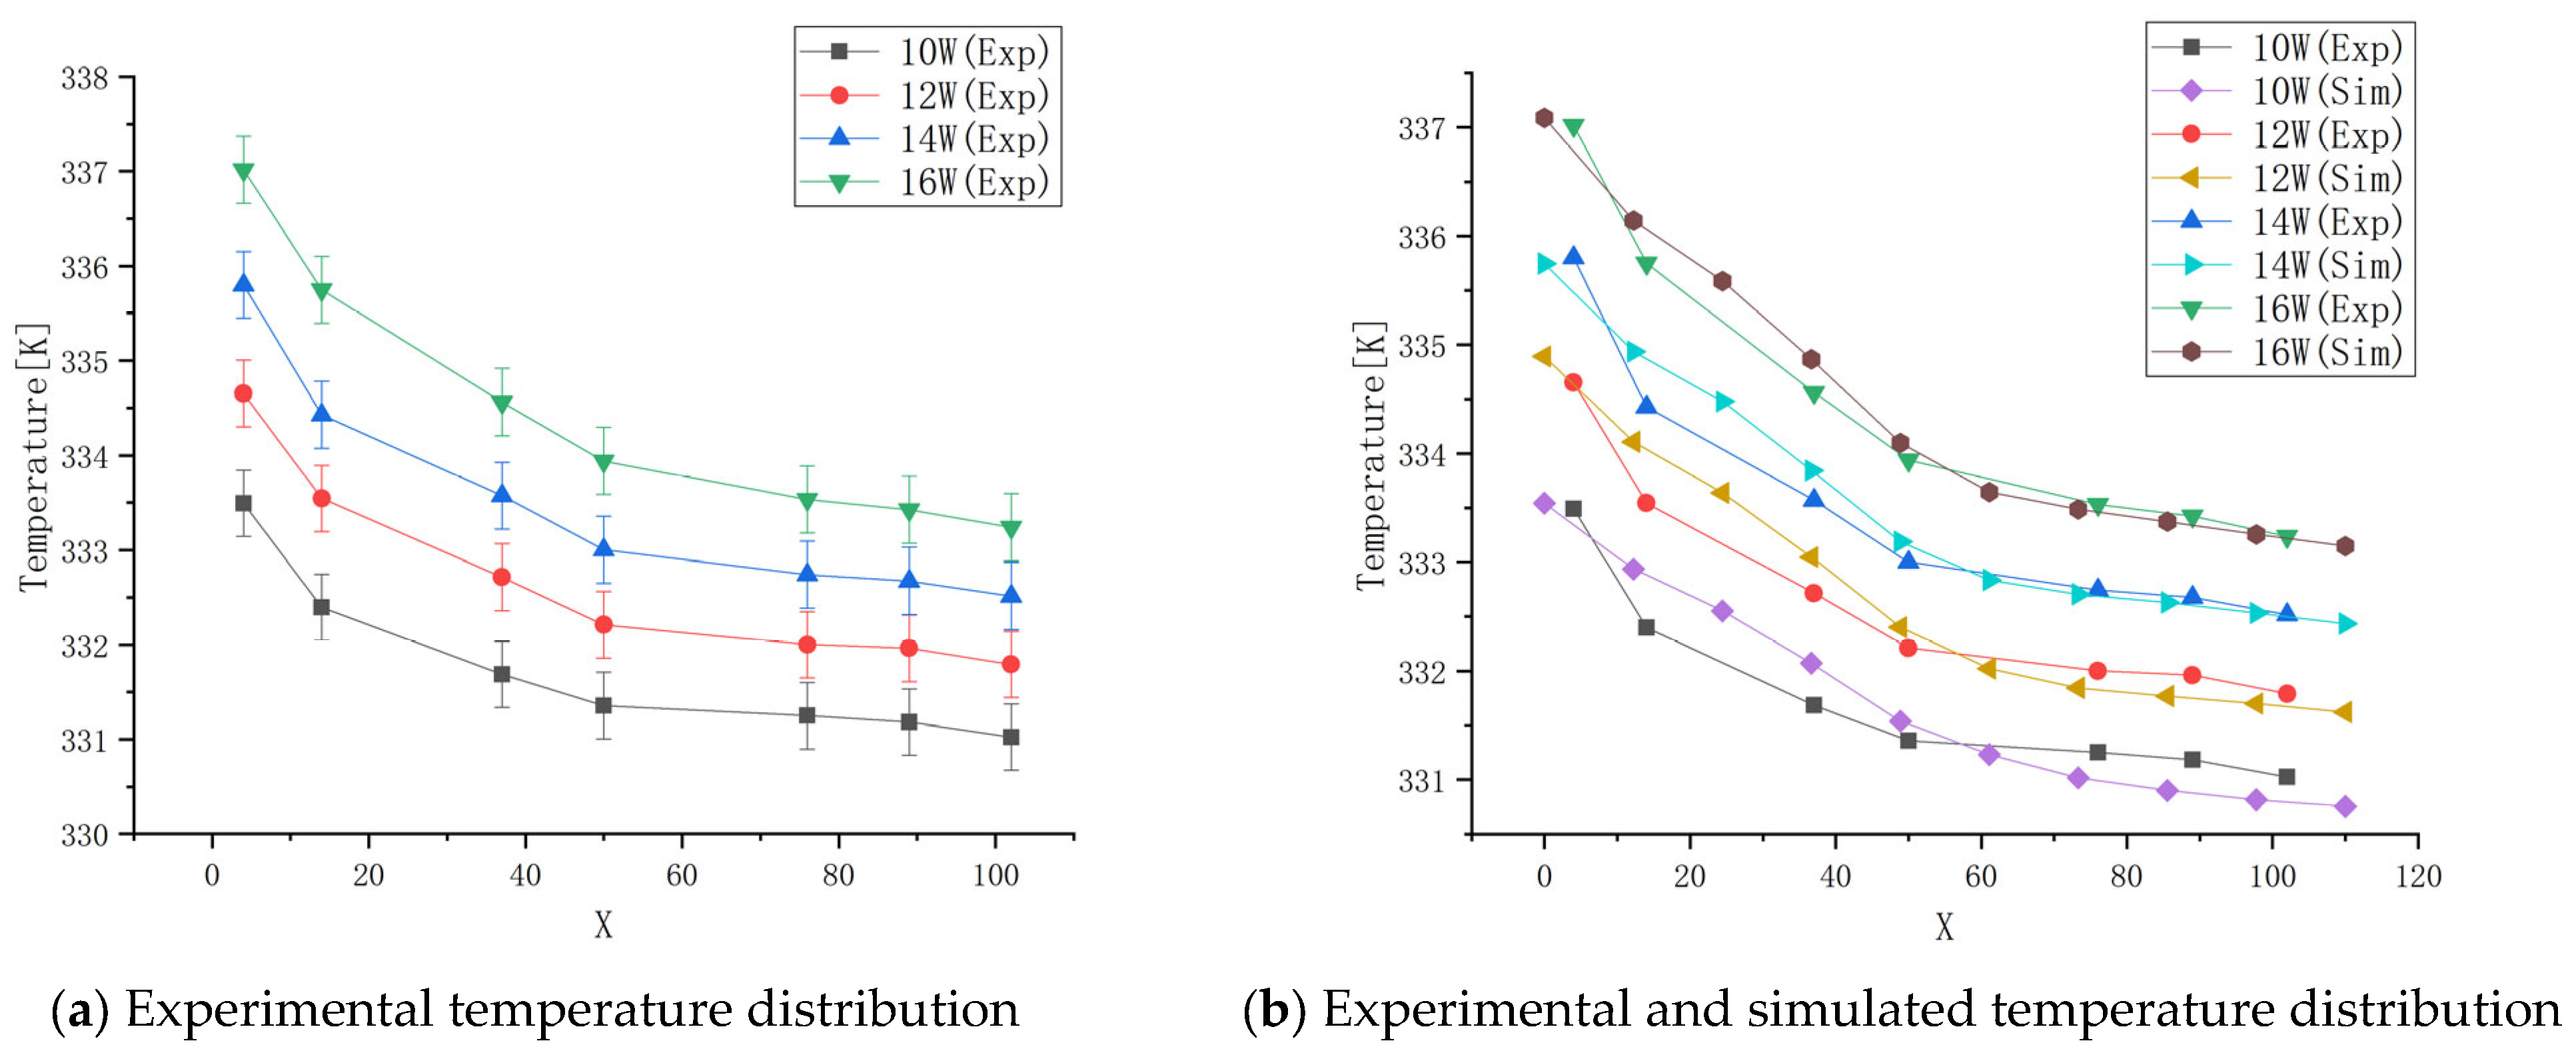
Figure 7 shows the temperature distribution of the ultra-thin MHP under different heating powers. The temperature data at each test point are compared by changing the heating power of the heating module. The temperature at various test points overall shows a decreasing trend for any heating power, and the temperature at the test points farther away from the evaporation section decreases. Apart from T1, the temperature difference between the other two adjacent test points is within 1 °C; the temperature at the seven test points shows an increasing trend with heating power.
As shown in Figure 7, as the heating power increases, the data obtained by the simulation approach the experimental data. The radial heat resistance of the pipe shell in the evaporation section, the radial heat resistance of the pipe shell in the condensation section, and the heat resistance caused by the liquid-filled wick can be observed for the real ultra-thin MHP. The heat resistance is mainly determined by heat conductivity, thickness, heat transfer area, heat conduction performance, heat transfer paths, and the actual shape of the material. When the heating power is relatively small, the temperature difference between the heating and condensation sections of the heat pipe is also small. Consequently, the heat resistance is relatively large, resulting in a large error between the simulated and experimental values. Increased heating power gradually reduces the error between the simulated and experimental values. Therefore, it can be concluded that the simulated data of the ultra-thin MHP model are consistent with the experimental data.

3.3. Influences of Heating Power on the Vapor Velocity Distribution

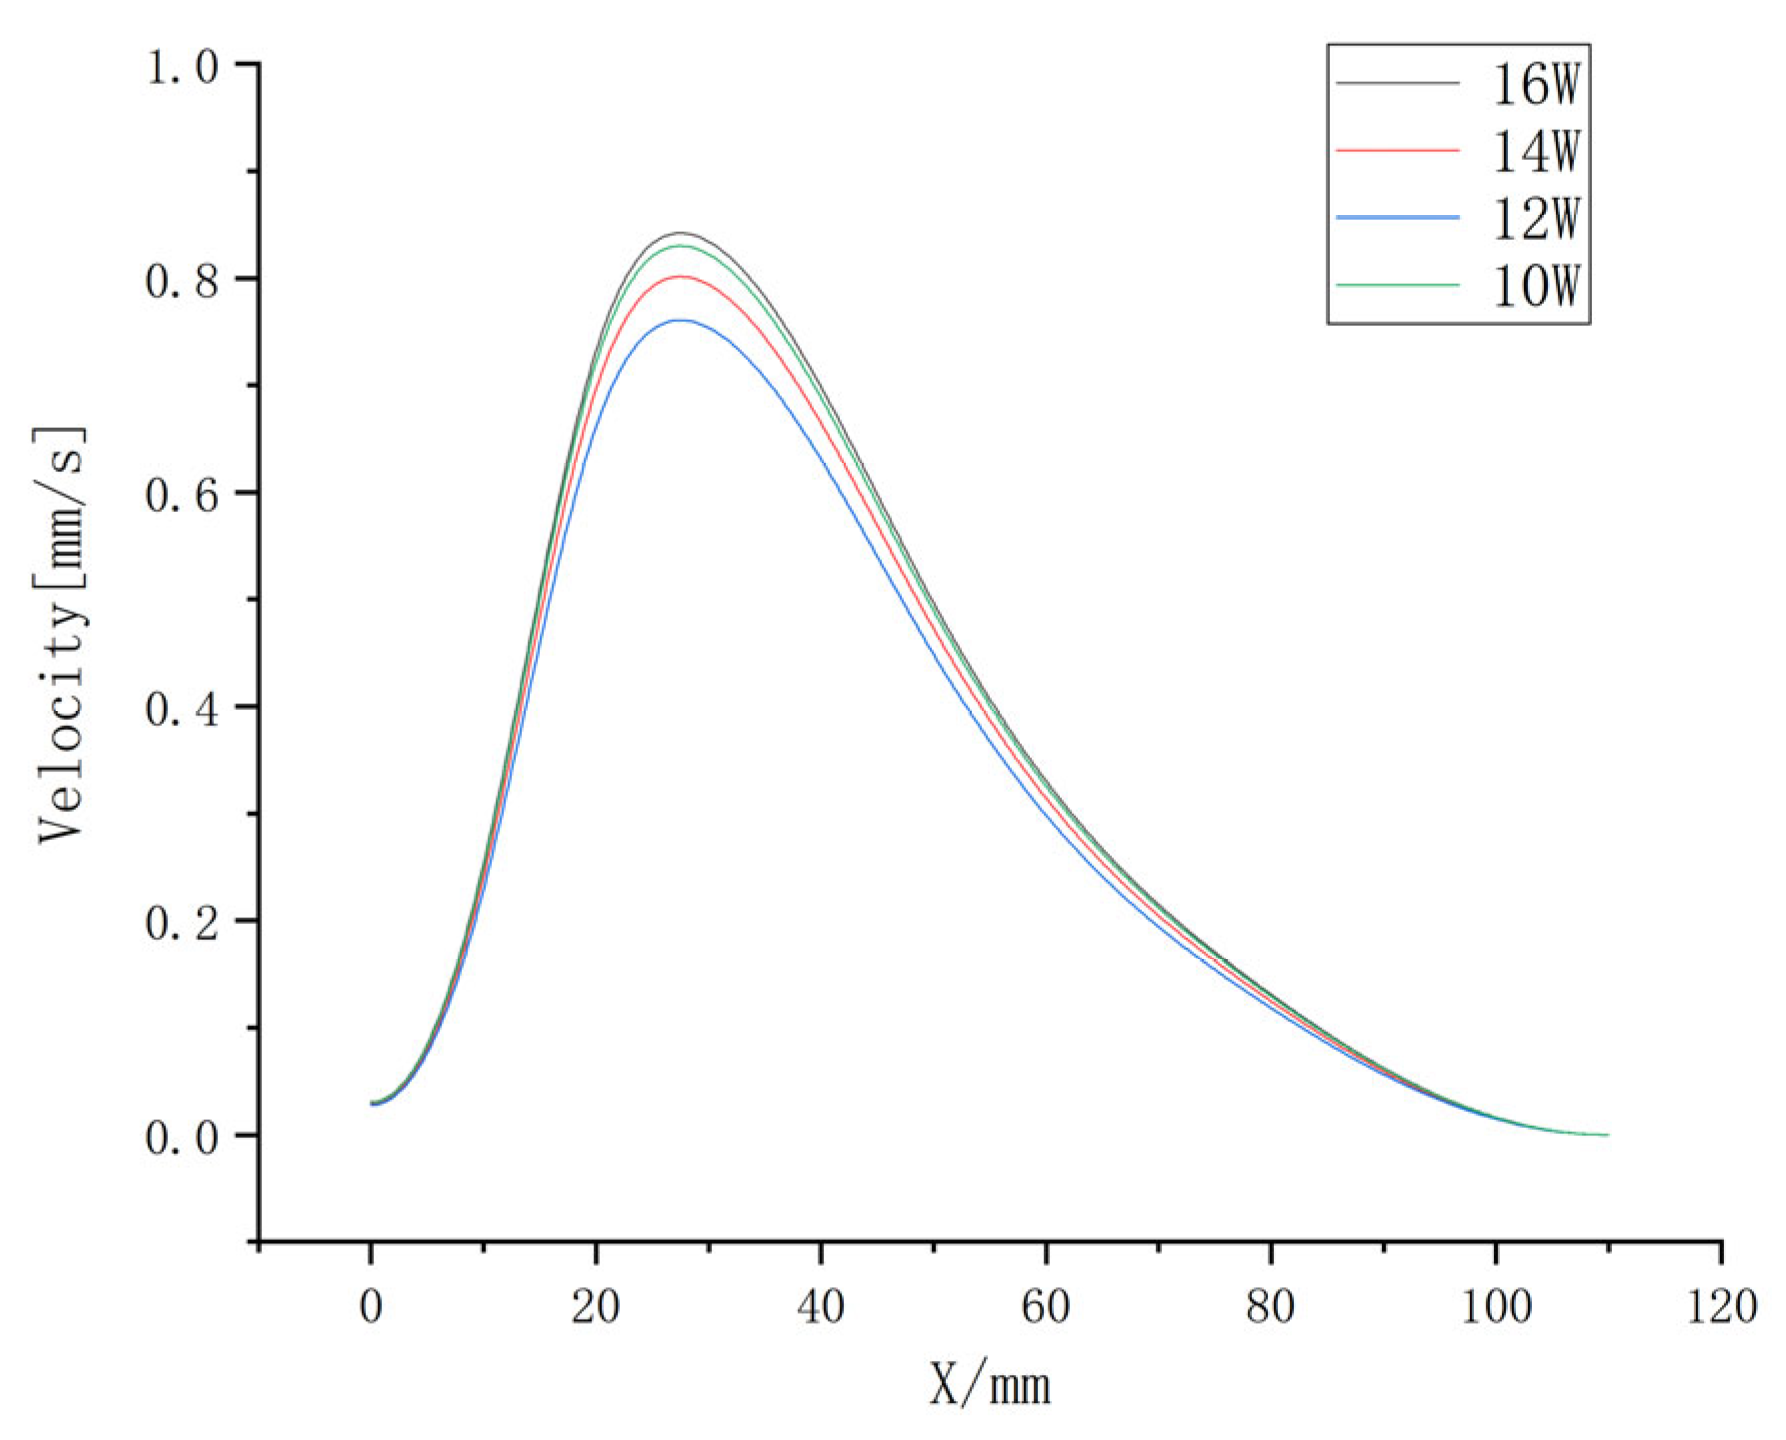
The parameter value of α = 1.5 was selected as the corresponding simulation parameter, and the ultra-thin MHP model was simulated under different heating powers. Figure 8 shows the relationship between the vapor velocity distribution along the length direction of the VC in the heat pipe model and the heating power of the heat pipe. The flow velocity of vapor in the internal working medium cavity increases first. Then, it decreases along the length direction of the VC, finally dropping to the lowest level around 0 m/s in the condensation section. When the heating power is 10 W, the overall flow velocity of the internal VC is the smallest, and the maximum vapor velocity Vmax is only 0.83 m/s. When the heating power increases to 16 W, the maximum vapor velocity increases by 1.45% to 0.842 m/s.
Figure 8 shows the maximum vapor velocity at the interface between the evaporation and adiabatic sections. A large amount of vapor accumulates in the evaporation section due to the heat evaporation of the working medium; when the accumulated amount reaches the maximum, the vapor velocity at this position also increases to the maximum value. The vapor releases heat and liquefies to a liquid working medium as the vapor moves to the condensation section. As a result, the amount of vapor and the vapor flow decrease continuously. When the vapor flow reaches the center of the condensation section, the vapor is completely cooled into a liquid state, and the vapor velocity drops to 0 m/s.
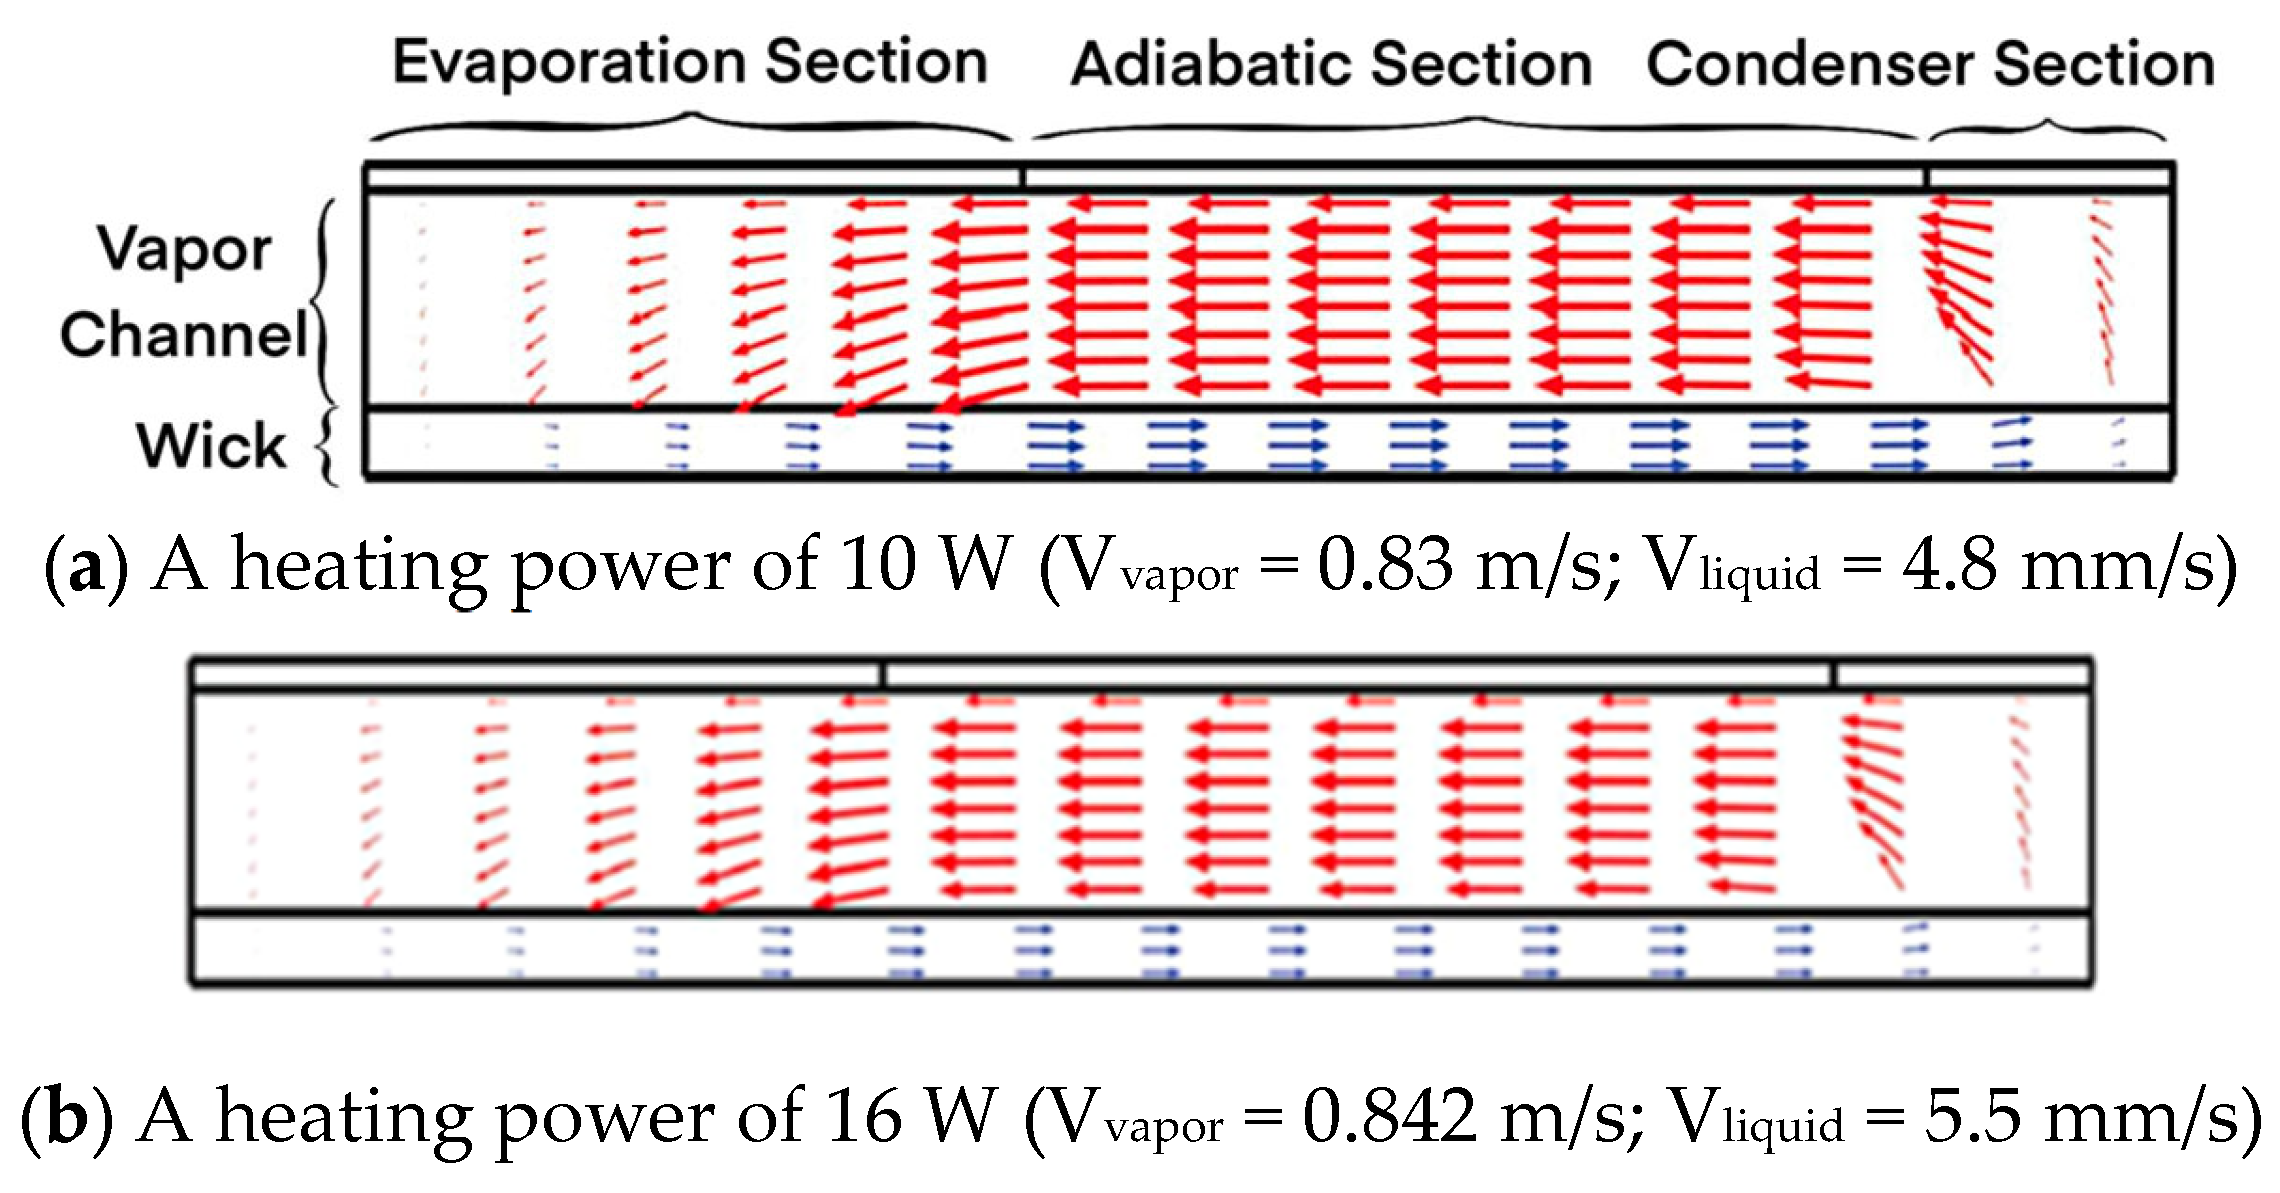
Figure 9 shows the velocity vector diagrams of the inner working medium in the ultra-thin MHP model under different heating powers. The red arrows indicate the flow of gases, while the blue arrows indicate the flow of liquids. The gas–liquid distribution characteristics of the working medium in the model are similar under different heating powers. The vapor is generated at the gas–liquid interface of the evaporation section, quickly passes through the adiabatic section, and condenses in the condensation section. With an increase in heating temperature, the vapor velocity inside the VC and the liquid flow velocity in the wick increase. In the condensation section, when the condensation temperature is fixed, a higher heating power can result in a greater pressure drop at both ends of the vapor cavity, increasing the vapor flow velocity. Moreover, with an increase in heating power, the evaporation rate of the liquid working medium increases, generating additional bubbles in the wick of the evaporation section. Thus, under the action of the capillary force, the liquid can be transported from the condensation section to the evaporation section faster. Therefore, the gas- and liquid-phase working media’s velocity increases.

3.4. Influences of Heating Power on Temperature Distribution

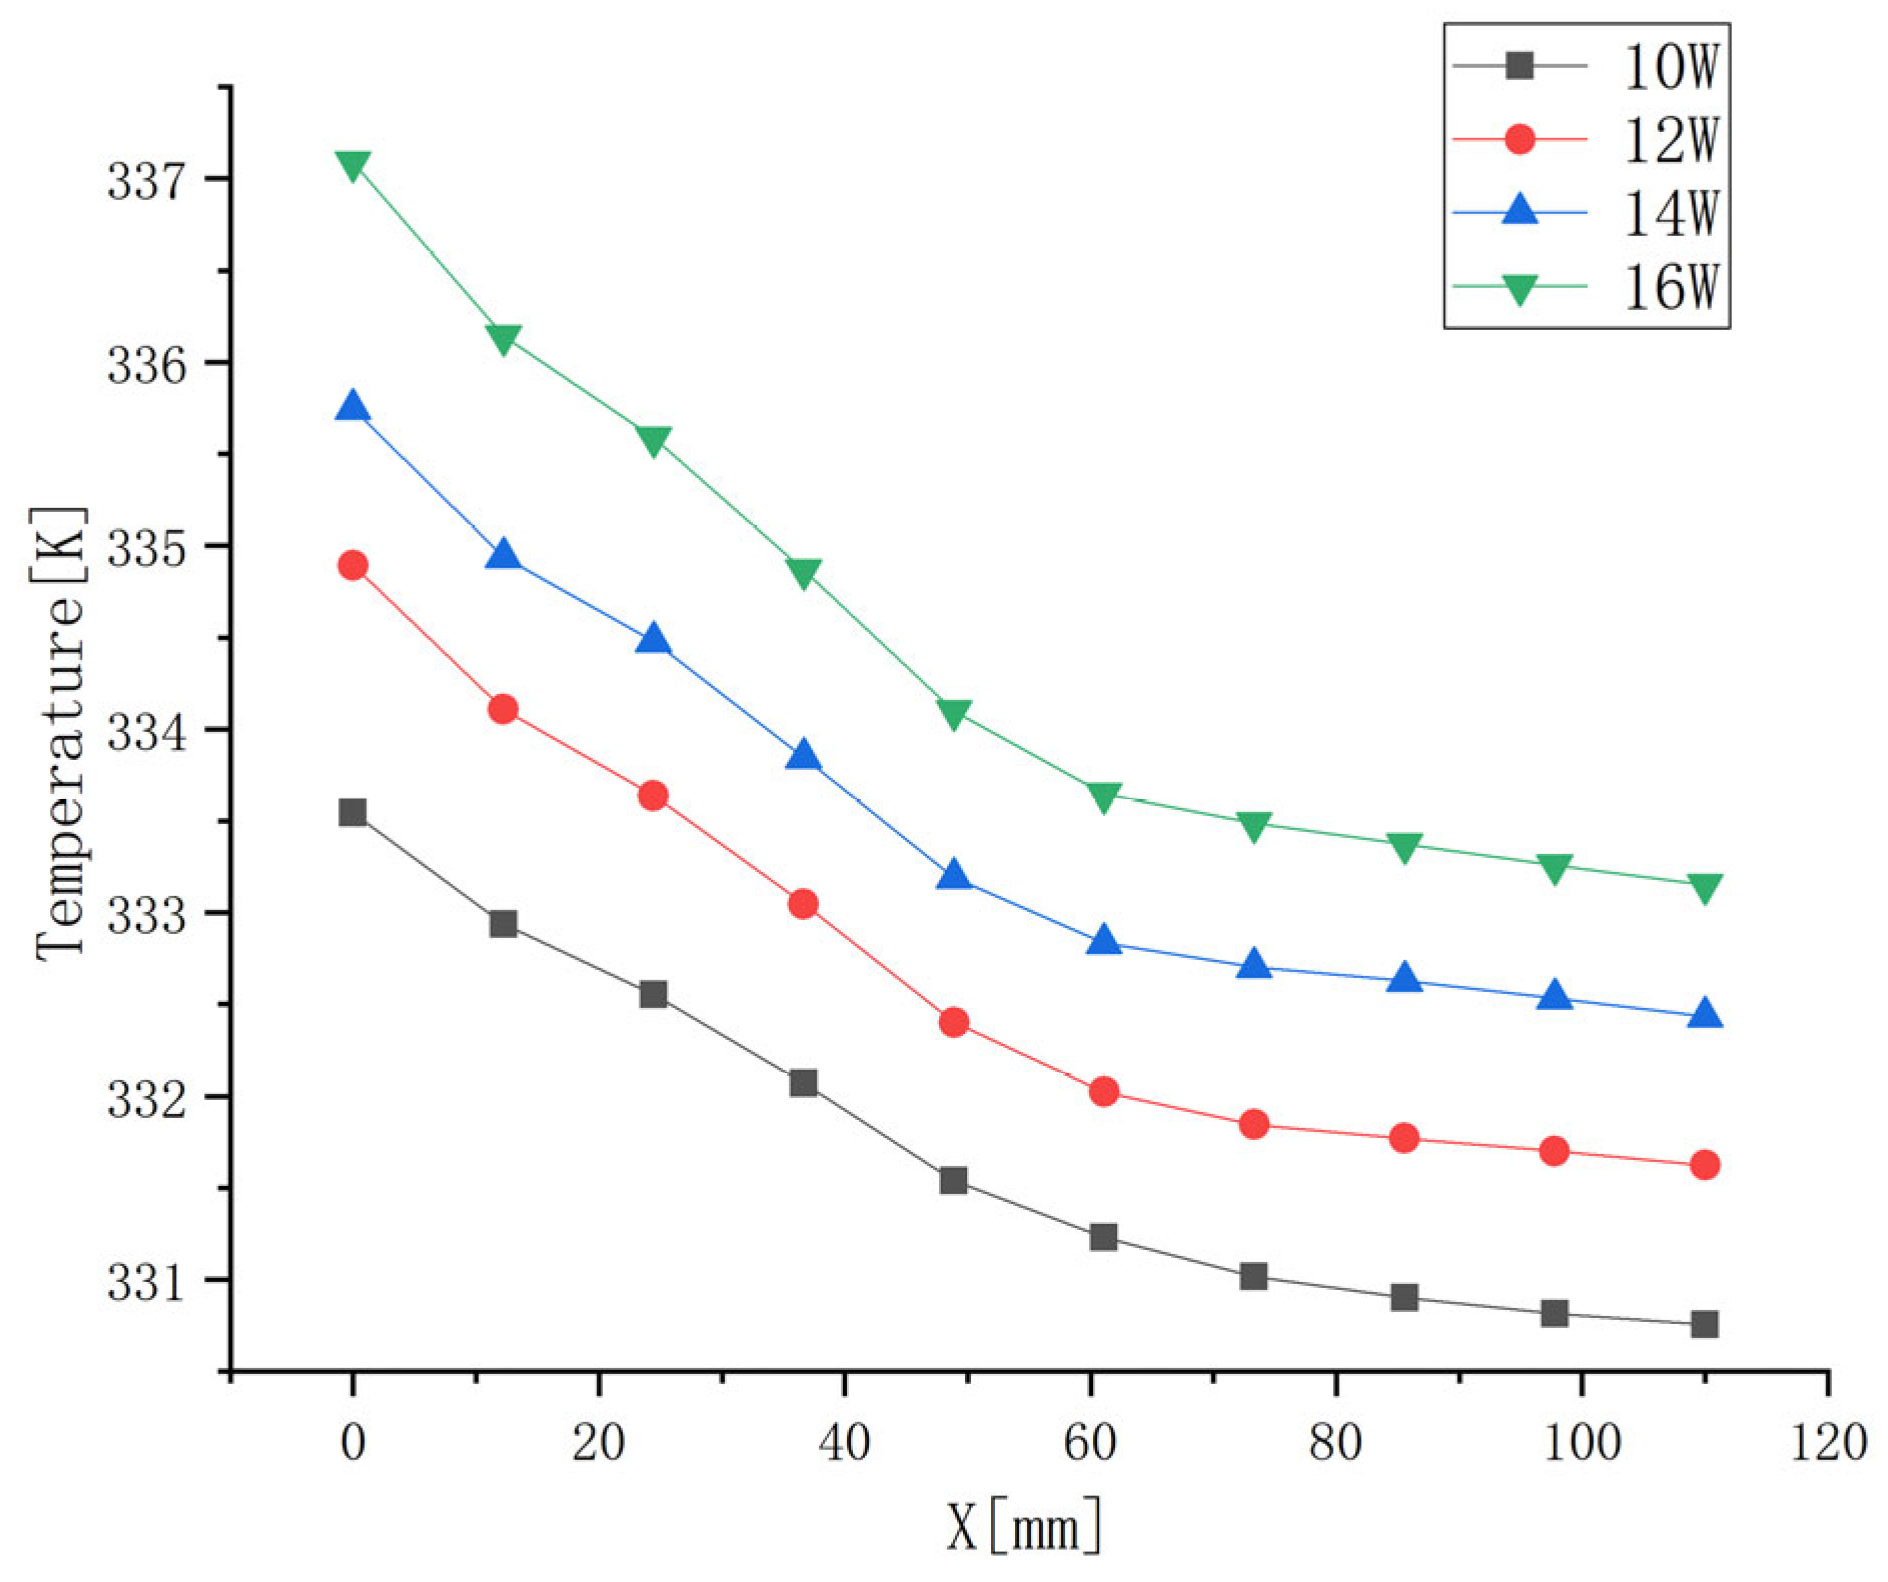
Figure 10 shows the temperature distribution on the surface of the heat pipe under different heating powers when the model parameter value is selected as α = 1.5. The temperature distribution rules of the heat pipe model are almost the same under different heating powers, showing a decreasing trend from the heating section to the adiabatic section. The temperature distribution gradient is relatively stable, and the temperature is almost constant in the condensation section. The temperature gradient fluctuates the junction of the adiabatic and heating sections, and the fluctuation amplitude increases with heating power.
According to the analysis in Section 3.3, the vapor velocity in the working medium cavity reaches its maximum value at the junction of the heating and adiabatic sections. This point is relatively close to the position where the temperature distribution on the surface of the heat pipe is chaotic under different heating powers. The vapor temperature at the position where the vapor velocity is maximum cannot be fully transmitted through the pipe wall to the model surface due to the fluctuation in the internal vapor velocity. As a result, the temperature gradient of the corresponding surface is smoother than that of the adjacent heating section or adiabatic section. The vapor velocity is no longer the main influencing factor of temperature near the adiabatic and condensation sections, and the overall temperature tends to be uniform here. The vapor content decreases due to exothermic liquefaction, and the vapor velocity gradually approaches zero. The heat exchange between the heat pipe model and the heat sink is the main factor influencing temperature in the current region.
As the heating power decreases, the fluctuation in the temperature gradient worsens. In addition to the reduction in velocity difference of the internal vapor working medium, the heat transported by the heat pipe is also decreased. Moreover, the temperature difference between the heat source and the heat sink decreases under the setting of the same incoming flow temperature in the condensation section. In addition, the vapor convection and the transport velocity of the working medium inside the heat pipe are considerably reduced. Although the heat pipe shows a better temperature equalization property, this rule has no value in further analysis.

4. Discussion

The heat and mass transfer processes of the ultra-thin MHP are analyzed using the CFD method. The simulation of the ultra-thin MHP under different working conditions can be conducted by adjusting the α parameter of the model and modifying the constraint equations and boundary conditions. The visualization study for the mass transfer situation inside the heat pipe is also limited to the distribution of the gas–liquid interface at different time points [25,26,27], as well as the evaporation and boiling phenomena of the working medium and the movement of bubbles inside the wick [28,29]. There is no good observation method for the vapor flow in the gaseous cavity; it can only be analyzed by model simulation.
The Brooks–Corey model is commonly used in CFD simulations for the capillary pressure simulation of porous media. However, this computational model is slightly different from the Laplace–Young equation, commonly used for calculating the wick of heat pipe capillary pressure. Hence, this model cannot be used to simulate the actual ultra-thin MHP. In the established ultra-thin MHP model, the expression for the capillary pressure of the wick in the heat pipe was modified in Section 2.3. After preliminary simulation analysis, four parameter values were selected for subsequent simulation. Then, according to the simulation results in Section 3.1, the parameter value that met the temperature equalization requirement was determined, which was used to establish a numerical model associated with the actual ultra-thin heat pipe. The reliability of the model was verified in Section 3.2. The liquid working medium inside the heat pipe refluxes under the actions of capillary pressure and gravity, and the gaseous working medium is naturally convective under the pressure difference. In the following three subsections, the simulation results were analyzed. Moreover, the flow state of the inner working medium and the surface temperature of the model were used to ensure that the model complies with the physical law.

5. Conclusions

This paper established a three-dimensional model based on the heat and mass transfer theory of ultra-thin heat pipes. Moreover, a grid independence test was carried out. The model’s simulation results were fitted with the experimental temperature data of ultra-thin MHP samples through user-defined functions using a research method similar to the method of inverse heat transfer problems. Furthermore, a simple heat and mass transfer model of an ultra-thin MHP was established to analyze the flow state of the inner working medium. The main conclusions are drawn as follows:
(1)
Although the wick porous medium model presents a better transport capacity for the liquid working medium, an excessive α value significantly affects the calculation accuracy and stability of the model. In the given range of α values, when α = 3, the “liquid accumulation” phenomenon appears on the heat pipe model, significantly decreasing the temperature equalization property, which does not meet the temperature requirements. When α = 1.5, the heat pipe model meets the temperature requirements to the best degree; this parameter value was selected for subsequent analysis.
(2)
An experimental platform was built to conduct heat transfer performance experiments on ultra-thin MHP samples. The model’s reliability was verified by fitting the heat pipe samples’ surface temperature to the simulation model’s surface temperature under the same heating powers. It was found that the error between the experimental value and the simulation value decreases gradually with an increase in heating power. The deviation value is caused by the heat resistance between the wick and the pipe wall, the heat resistance between the pipe surface and the thermocouple, and the heat dissipation in the adiabatic section.
(3)
The flow states of the inner vapor working medium under different heating powers were analyzed by using the established ultra-thin MHP model. Under different heating powers, the vapor velocity in the inner cavity of the heat pipe model always increases first and then decreases; the maximum vapor velocity appears at the junction of the heating section and the adiabatic section. The working medium in the heating section is heated to evaporate, and a large amount of vapor is accumulated in the evaporation section. Therefore, the flow rate also reaches the maximum value. The maximum vapor velocity reaches 0.842 m/s under the heating power of 16 W. In addition, the flow rate drops to 0 m/s when approaching the central position of the condensation section.
In summary, a three-dimensional model of an ultra-thin MHP was established in this study. Similar to inverse heat transfer problems, the research method was used to fit the simulation results with the real experimental data by user-defined functions. The model’s reliability was verified, and the flow state of the working medium inside the heat pipe was displayed. The research provides a simple and reliable method for the model establishment of ultra-thin MHPs. The established model can be used to analyze the heat and mass transfer of heat pipes and is helpful to the parameter optimization of ultra-thin MHPs, which has a certain reference value for the research of ultra-thin MHPs.

Author Contributions

Conceptualization, Y.X. and X.L. (Xibing Li); methodology, Y.X., L.L. and X.L. (Xibing Li); investigation, Y.X., Y.S. and G.L.; data curation, Y.X. and F.Z.; writing—original draft, Y.X.; writing—review and editing: Y.X., X.L. (Xiangjuan Liu), L.L. and X.L. (Xibing Li); visualization, Y.X. and F.Z. All authors have read and agreed to the published version of the manuscript.

Funding

This research was funded by the Fujian Provincial Natural Science Foundation of China (No. 2022J01609); the general project of basic scientific research funds for provincial universities in Heilongjiang Province, Study on Crop Yield Change by Intelligent Analysis of Agricultural Climate Data, (No. 145109142); and the open project of Heilongjiang Agricultural Multidimensional Sensor Information Perception Engineering Technology Research Center, Analysis and research on field microclimate based on multidimensional intelligent sensing information cognition,(No. DWCGQKF202101).

Data Availability Statement

The original contributions presented in the study are included in the article, further inquiries can be directed to the corresponding authors.

Conflicts of Interest

The authors declare no conflict of interest.

References

  1. Tang, H.; Tang, Y.; Wan, Z.; Li, J.; Yuan, W.; Lu, L.; Tang, K. Review of applications and developments of ultra-thin micro heat pipes for electronic cooling. Appl. Energy 2018, 223, 383–400. [Google Scholar] [CrossRef]
  2. Gan, Y.H.; Xiong, T.; Luo, Q.L.; Liang, J.L.; Dong, D.W.; Li, Y. Influence of Vapor-Liquid Passage Structure on the Performance of an Ultra-Thin Heat Pipe. J. Tianjin Univ. (Sci. Technol.) 2022, 55, 965–972. [Google Scholar]
  3. Guptaa, N.K.; Arun, K.T.; Subrata, K.G. Heat transfer mechanisms in heat pipes using nanofluids—A review. Exp. Therm. Fluid Sci. 2018, 90, 80–100. [Google Scholar] [CrossRef]
  4. Li, P.; Chen, C.; Qin, Q.; Tian, X.; Yan, R.; Fang, Y.; Jun, J.; Zhi, M. Sintering microstructure and properties of copper powder prepared by electrolyzation and atomization. J. Cent. South Univ. 2021, 28, 1966–1977. [Google Scholar] [CrossRef]
  5. Huang, D.; Jia, L. Study on the Capillary Performance of Sintered Copper Powder Wick. J. Eng. Thermophys. 2021, 42, 494–503. [Google Scholar]
  6. Yan, W.; Yang, X.; Liu, T.; Wang, S. Numerical Simulation of Heat Transfer Performance for Ultra-Thin Flat Heat Pipe. J. Therm. Sci. 2023, 32, 643–649. [Google Scholar] [CrossRef]
  7. Meijie, L. Study on Capillary Driving and Heat Transfer Performance of Micro Heat Pipe Based on Different Channels. Master’s Thesis, Lanzhou Jiaotong University, Lanzhou, China, April 2021. [Google Scholar]
  8. Yi, F.; Gan, Y.; Xin, Z.; Li, Y.; Chen, H. Experimental study on thermal performance of ultra-thin heat pipe with a novel composite wick structure. Int. J. Therm. Sci. 2023, 193, 108539. [Google Scholar] [CrossRef]
  9. Huang, Z.; Tang, X.; Luo, Q.; Gan, Y.; Liang, J.; Li, R.; Xiong, T.; Liu, J.; Ma, L.; Dong, D.; et al. Numerical analysis on heat transfer characteristics of a multi-vapor channel vapor chamber with novel ultra-thin composite wick. Case Stud. Therm. Eng. 2021, 26, 101035. [Google Scholar] [CrossRef]
  10. Jung, E.G.; Booj, H. A numerical modeling for the steady-state performance of a micro heat pipe using thin liquid film theory. Int. J. Heat Mass Transf. 2018, 126, 557–566. [Google Scholar] [CrossRef]
  11. Koito, Y. Numerical analyses on heat transfer characteristics of ultra-thin heat pipes: Fundamental studies with a three-dimensional thermal-fluid model. Appl. Therm. Eng. 2019, 148, 430–437. [Google Scholar] [CrossRef]
  12. Koito, Y. A numerical analysis on the effect of deviation from a centered wick structure in an ultra-thin flattened heat pipe. Front. Heat Mass Transf. 2021, 16, 1–7. [Google Scholar] [CrossRef]
  13. Ming, Z.; Zhongliang, L.; Guoyuan, M. The experimental and numerical investigation of a grooved vapor chamber. Appl. Therm. Eng. 2009, 29, 422–430. [Google Scholar] [CrossRef]
  14. Lu, L.; Xie, Y.; Zhang, F.; Liao, H.; Liu, X.; Tang, Y. Influence of a sintered central column on the thermal hydraulic performance of a vapor chamber: A numerical analysis. Appl. Therm. Eng. 2016, 103, 1176–1185. [Google Scholar] [CrossRef]
  15. Wang, Q.; Zhao, H.; Xu, Z.; Li, J.; Deng, D. Numerical analysis on the thermal hydraulic performance of a composite porous vapor chamber with uniform radial grooves. Int. J. Heat Mass Transf. 2019, 142, 118458. [Google Scholar] [CrossRef]
  16. Fang, W. Numerical simulations of the liquid-vapor phase change dynamic processes in a flat micro heat pipe. Int. J. Heat Mass Transf. 2020, 147, 119022. [Google Scholar] [CrossRef]
  17. Huang, Z.; Li, D.; Zhao, J.; Jian, Q. Thermal and hydraulic analysis of ultra-thin vapor chamber with copper columns considering Marangoni effect. Int. J. Heat Mass Transf. 2022, 184, 122343. [Google Scholar] [CrossRef]
  18. Patankar, G.; Weibel, J.A.; Garimella, S.V. On the transient thermal response of thin vapor chamber heat spreaders: Governing mechanisms and performance relative to metal spreaders. Int. J. Heat Mass Transf. 2019, 136, 995–1005. [Google Scholar] [CrossRef]
  19. Gaurav, P.; Weibel, J.A.; Garimella, S.V. On the transient thermal response of thin vapor chamber heat spreaders: Optimized design and fluid selection. Int. J. Heat Mass Transf. 2020, 148, 119106. [Google Scholar]
  20. Rabiee, R.; Rajabloo, B.; Désilets, M.; Proulx, P. Heat transfer analysis of boiling and condensation inside a horizontal heat pipe. Int. J. Heat Mass Transf. 2019, 139, 526–536. [Google Scholar] [CrossRef]
  21. Liu, T.; Dunham, M.T.; Jung, K.W.; Chen, B.; Asheghi, M.; Goodson, K.E. Characterization and thermal modeling of a miniature silicon vapor chamber for die-level heat redistribution. Int. J. Heat Mass Transf. 2020, 152, 119569. [Google Scholar] [CrossRef]
  22. Özisik, M.N.; Orlande, H.R.B. Inverse Heat Transfer: Fundamentals and Applications; CRC Press: Boca Raton, FL, USA, 2021. [Google Scholar]
  23. Shuang, L. Active Cooling Mechanism and Cooling Capacity Evaluation of Thermal Protection Systems for Hypersonic Vehicle. Ph.D. Thesis, Harbin Institute of Technology, Harbin, China, June 2010. [Google Scholar]
  24. Chang, M.H.; Cheng, C.H. Non-destructive inverse method for determination of irregular internal temperature distribution in PEMFCs. J. Power Sources 2005, 142, 200–210. [Google Scholar] [CrossRef]
  25. Bu, Z.; Li, S.; Jiao, B.; Wang, B.; Gan, Z. Visualization study on a nitrogen pulsating heat pipe under different condenser temperatures. Chem. Ind. Eng. Prog. 2023, 42, 4167–4181. [Google Scholar]
  26. Yong, Y.; Yang, H.; Lu, X.; Zhang, M. Research on visualization mechanism of pulsating heat pipe based on surfactant aqueous solution. Energy Conserv. 2023, 42, 37–42. [Google Scholar]
  27. Zhao, J.; Wang, Z.; Xu, W.; Liu, Y. Investigation on the Flow Pattern Evolution and Heat Transfer Characteristics of an Embedded Heat Pipe. J. Eng. Thermophys. 2022, 43, 2659–2666. [Google Scholar]
  28. Yu, F.; Yu, C.; Cao, J.; Chen, Y. Experimental analysis of the evaporation regimes of an axially grooved heat pipe at small tilt angles. Int. J. Heat Mass Transf. 2018, 126, 334–341. [Google Scholar] [CrossRef]
  29. Wang, C.; Yao, F.; Shi, J.; Wu, L.; Zhang, M. Visualization Study on Thermo-Hydrodynamic Behaviors of a Flat Two-Phase Thermosyphon. Energies 2018, 11, 2295. [Google Scholar] [CrossRef]
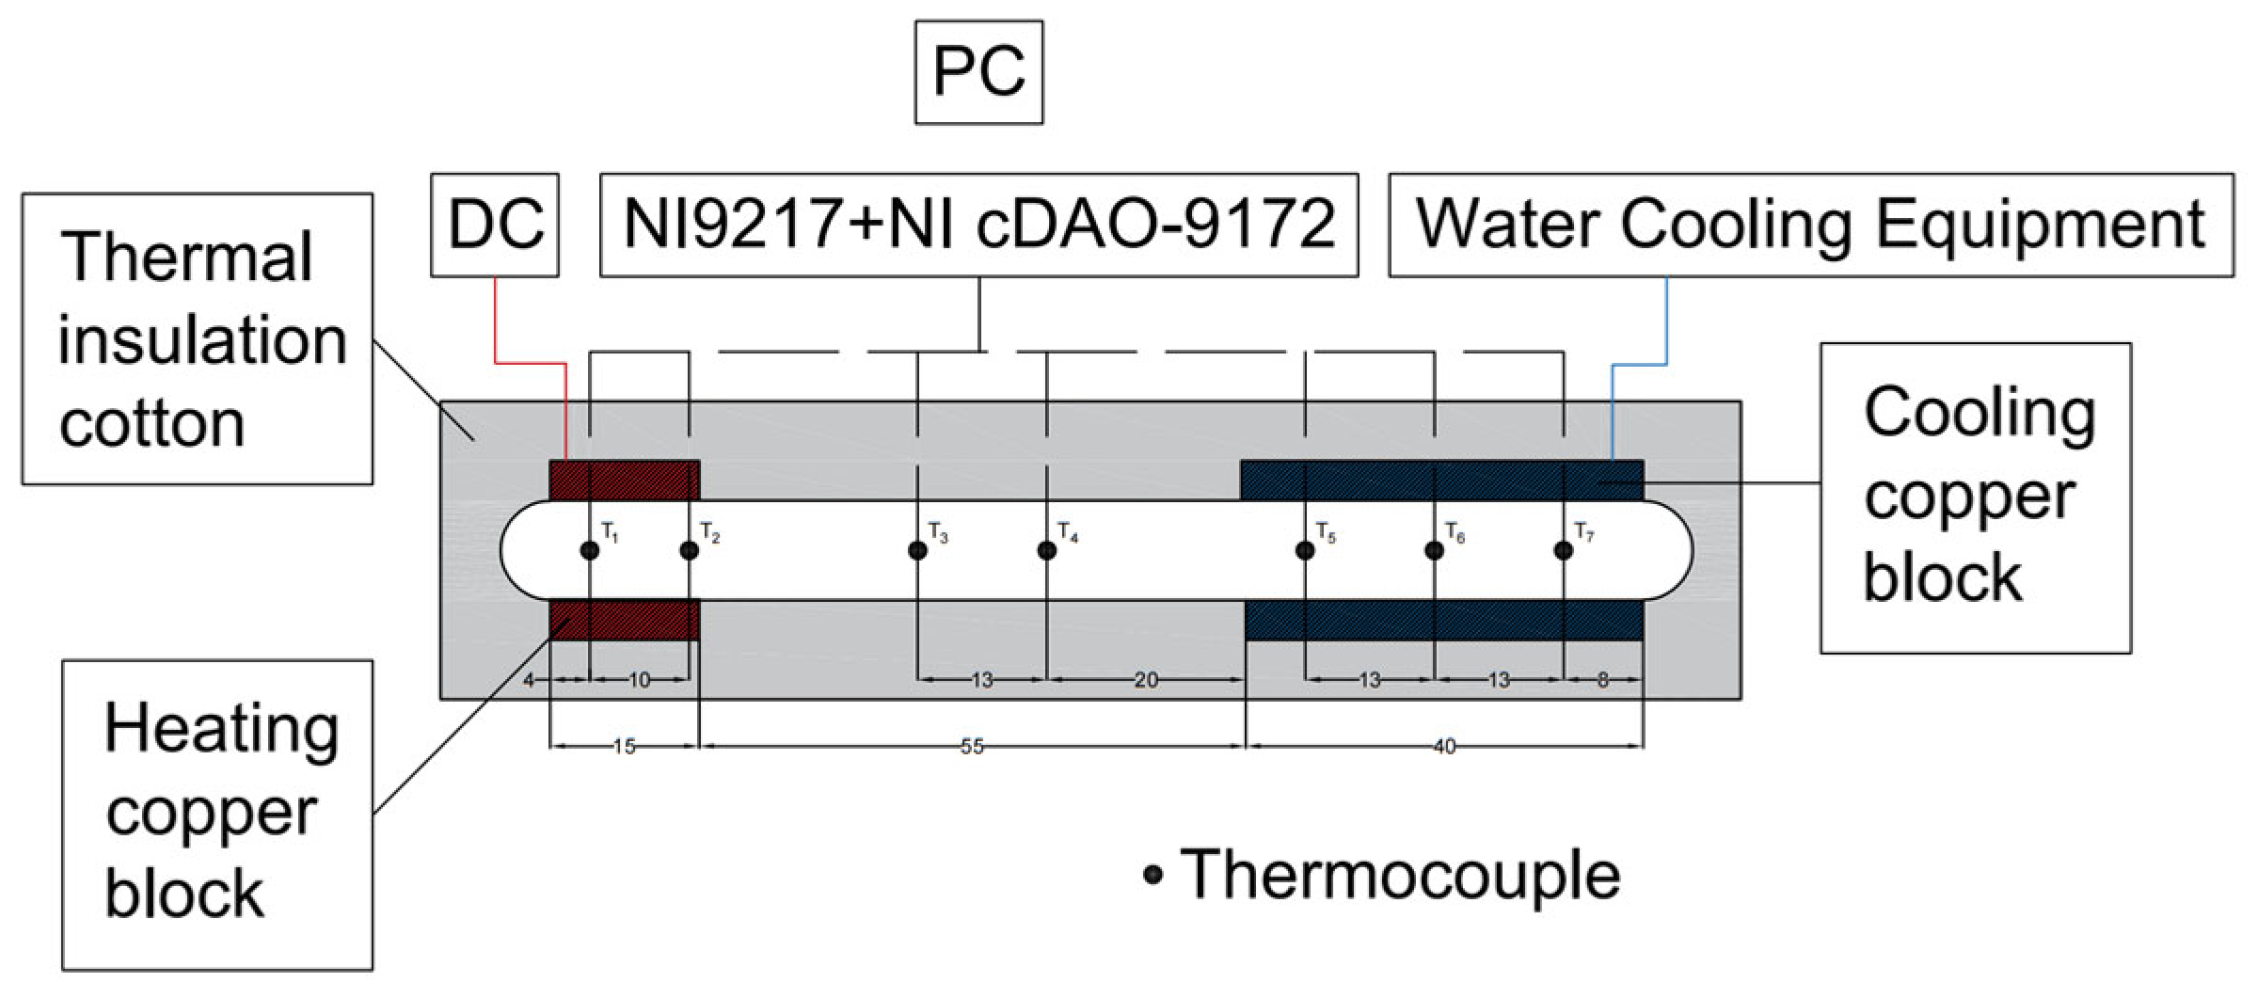
Figure 1. Schematic diagram of the platform for heat transfer performance test of the ultra-thin MHP (unit: mm).
Energies 17 03426 g001
Figure 2. Digital images of the equipment for heat transfer performance test of the ultra-thin MHP.
Energies 17 03426 g002
Figure 3. Three-dimensional structural model of the ultra-thin MHP (unit: mm).
Energies 17 03426 g003
Figure 4. Grid independence test results.
Energies 17 03426 g004
Figure 5. Temperature distribution on the surface of the heat pipe for different α parameter values.
Energies 17 03426 g005
Figure 6. Cloud charts of the working medium inside the heat pipe at different α values.
Energies 17 03426 g006
Figure 7. Experimental and simulated temperature distribution under different heating powers.
Energies 17 03426 g007
Figure 8. Vapor velocity distribution along the axial direction of the VC under different heating powers.
Energies 17 03426 g008
Figure 9. Velocity vector diagrams of the working medium under different heating powers.
Energies 17 03426 g009
Figure 10. Temperature distribution on the surface of the heat pipe under different heating powers.
Energies 17 03426 g010
Table 1. Basic physical properties of deionized water (20 °C).
ParameterValue
Density998.2 [kg·m−3]
Specific heat capacity4.102 [J·(kg·K)−1]
Heat conductivity0.602 [W·(m·K)−1]
Viscosity1.0015 [mPa·S]
Surface tension0.073 [N·m−1]
Table 2. Structural parameters of the ultra-thin MHP.
ParameterValue
Length110.0 [mm]
Thickness1.0 [mm]
Width10.0 [mm]
Wall thickness0.2 [mm]
Evaporator section length15.0 [mm]
Condenser section length40.0 [mm]
Disclaimer/Publisher’s Note: The statements, opinions and data contained in all publications are solely those of the individual author(s) and contributor(s) and not of MDPI and/or the editor(s). MDPI and/or the editor(s) disclaim responsibility for any injury to people or property resulting from any ideas, methods, instructions or products referred to in the content.