Abstract
The internal combustion engine continues to be the main source of power in various modes of transport and industrial machines. This is due to its numerous advantages, such as easy adaptability, high efficiency, reliability and low fuel consumption. Despite these beneficial qualities of internal combustion engines, growing concerns are related to their negative environmental impacts. As a result, environmental protection has become a major factor determining advancements in the automotive industry in recent years, with the search for alternative fuels being one of the priorities in research and development activities. Among these, fuels of plant origin, mainly alcohols, are attracting a lot of attention due to their high oxygen content (around 35%). These fuels differ from diesel oil, for instance, in kinematic viscosity and density, which can affect the formation of the fuel spray and, consequently, the proper functioning of the compression–ignition engine, as well as the performance and purity of the exhaust gases emitted into the environment. The process of spray formation in direct injection compression–ignition engines is extremely complicated and requires detailed analysis of the fast-changing variables. This explains the need for using complicated research equipment enabling visualisation tests and making it possible to gain a more accurate understanding of the processes that take place. The present article aims to present the methodology for alternative fuel visualisation tests. To achieve this purpose, sprays formed by diesel–ethanol blends were recorded. A visualisation chamber and a high-speed camera were used for this purpose. The acquired video provided the material for the analysis of the changes in the vertex angle of the spray formed by the fuel blends. The test was carried out under reproducible conditions in line with the test methodology. The shape of the fuel spray is impacted by an increase in the proportional content of ethanol in the diesel and dodecanol blend. Based on the present findings, it is possible to note that the values of the vertex angle in the spray produced by the diesel–ethanol blend with the addition of dodecanol are most similar to those produced by diesel oil at an injection pressure of 100 MPa. The proposed methodology enables an analysis of the injection process based on the spray macrostructure parameters, and it can be applied in the testing of alternative fuels.
1. Introduction
Compression–ignition engines are widely used in motor vehicles and agricultural machinery [1]. This results from their easy adaptability, relatively high efficiency and reliability [2,3].
Such engines, however, are associated with certain drawbacks, e.g., emissions of pollutants such as nitrogen oxides (NOx), particulate matter (PM), carbon monoxide (CO) and other harmful substances. The emissions of NOx produced by diesel engines constitute 70% of the total emissions from combustion engines [4]. For this reason, increasingly stringent rules and regulations are being introduced worldwide with regard to the emissions of toxic compounds in exhaust gases [5]. The search for clean and renewable fuels is of key importance for mitigating the energy crisis and protecting the environment [6].
In an attempt to cut down the consumption of fossil fuels and reduce emissions of CO2 and other pollutants generated by internal combustion engines, a shift from internal combustion engines to electric drive systems has been proposed. However, this solution presents drawbacks adversely affecting advancements in this area; these include long charging times, a lack of charging infrastructure, short range compared to internal combustion engines and the high cost of these vehicles [7]. As a result, compression–ignition engines are still widely used in transport, construction machinery and agriculture [8]. Therefore, it is necessary to carry out research in order to reduce the pollution generated by the combustion of fossil fuels. One solution for reducing toxic emissions lies in the advancement of biofuels that can be produced from biodegradable domestic, industrial and agricultural waste. The main objective of research and development operations related to this issue is to find fuels that are environmentally friendly and present an economic advantage over petroleum-based fuels. In the short term, the goal is to develop fuel blends based on diesel oil with increasing proportional contents of bio-components so that in the medium and long term, it will be possible to produce clean fuels without the use of petroleum products. According to the International Energy Agency, bioenergy production is expected to reach 100 EJ by 2050 [9].
Alternative fuels attracting a lot of attention include alcohols (ethanol, methanol and butanol) [10,11,12]. This is associated with a number of advantages presented by these liquids, such as high oxygen content and low viscosity. They are produced using biomass fermentation [13,14]. when used in blends with diesel oil, ethanol presents better characteristics than methanol. It blends more effectively into diesel oil and has a higher cetane number and superior lower calorific value [15]. Moreover, compared to methanol–diesel blends, the combustion of ethanol–diesel blends produces exhaust gas with a lower number of toxic compounds [16,17].
Ethanol can, for example, be produced from lignocellulose acquired from food industry waste, forestry waste (wood and waste from paper industry and logging waste), secondary waste (waste from food production and municipal solid waste) and agricultural waste [18]. On the other hand, ethanol has a low cetane number and lubricity compared to diesel oil, so it is beneficial to use ethanol in a mixture with diesel [17,19,20]. Blends of this type can be used in compression–ignition engines designed to run on typical diesel fuel [21].
Ethanol–diesel blends differ from diesel oil in physical properties such as density, viscosity and surface tension [22]. Density affects the mass of fuel injected and, consequently, fuel consumption [23]. Viscosity, in turn, impacts the range of the fuel spray [24], whereas a change in surface tension affects the size of droplets in the fuel spray [25]. Experimental studies have shown that an increase in the proportional volume of ethanol in the blend corresponds to a decrease in the cetane number, kinematic viscosity and calorific value [26,27].
Many studies assessing the effects of ethanol–diesel blends on exhaust emissions have reported reduced CO, NOx and PM [28,29]. The use of these blends also affects engine performance, leading to an increase in specific fuel consumption, a slight decrease in engine power and an increase in exhaust gas temperature [30,31].
The fuel atomisation process plays an important role in the effective operation of internal combustion engines. The quality and precision of the fuel spray largely determine the course of the combustion process. The atomisation process affects economic efficiency as well as exhaust toxicity and engine noise [32,33].
The process of fuel injection may be assessed by taking into account the indicators of fuel spray geometry. These indicators are most commonly measured during injection into the ambient air or into a chamber filled with air or nitrogen, where the back-pressure conditions reflect the true conditions in the combustion chamber [34].
Fuel spray can be recorded using machine vision systems. These are various testing methods designed to record an image of an object or a process emitting internal light or reflecting light that originates from an independent source on a photosensitive or magnetic medium in an analogue or digital format. The recorded object can be assessed in terms of its qualitative and quantitative characteristics as well as geometric and physical parameters (e.g., shape, changes in shape, brightness, and colour). Machine vision systems are an important tool enabling the analysis of liquid atomisation and, in particular, the spray formation and decomposition processes. These techniques include direct photography, where the object is illuminated directly or from behind, as well as filming with high-speed cameras. In the latter case, the image is recorded with a photo camera with fast shutter speed or using video technology. Illumination with diffuse light is usually applied. Depending on the operating speed of the camera, it is possible to record, with a sufficient resolution, phenomena such as the formation of a fuel spray, the effect of droplet disintegration, etc. Another type used for this purpose is ultra-high-speed photography, reaching 1.25 million frames per second.
Another type of direct photography is microphotography. It can be used to capture a very small area and to identify extremely fine details. It makes it possible to observe a flame inside the combustion chamber and changes in fuel spray. Another photography technique applies backlighting. In this case, a diffused light source is placed behind the object, as a result of which the background is white and the photographed objects are black. It has been used to obtain images of fuel spray and clouds of soot [35]. The specific varieties of backlight photography include silhouette microphotography and shadow photography. The measuring system in silhouette photography consists of lighting and recording units. The former is used to provide a high level of brightness and a short illumination time. Flash lamps, stroboscopic lamps or flash generators are used as a source of light. The recording system is a photo camera in which a microscope system is installed instead of a photo lens. The dimensions of the objects observed depend on the resolving power of the microscope. In this method, the following parameters are important: exposure time, distance of the camera from the fuel spray, sharpness of the droplet image and the depth of field of the microscope. Possible ways to avoid contamination include using protection with air flow or an aperture that opens together with the lighting unit [36].
Shadow photography involves examining the distribution of the refractive index of isotropic media. This method makes it possible to record the shadow created against a bright background by an object illuminated from behind. Light focused on the object is used for illumination. The shadow method can be used to examine the density distribution and to visualise the distribution of fuel vapour; it is sensitive to the medium concentration gradient. The trailing method, on the other hand, is additionally sensitive to the density and temperature gradients in the medium. It can be used to observe the structure of the injected fuel spray, the concentration of the air–fuel mixture, droplet diameters and the concentration of the non-vapourised fuel spray [37].
The high-speed photography method is characterised by short exposure times, achieved either by reducing the duration of the light flash or by using a camera for high-speed shooting in continuous light. High-speed imaging cameras have a variety of designs, depending on the required shooting frequency. Continuous high-speed recording of a stream of droplets enables the internal structure of the spray to be examined in time and space. In this way, it is possible to acquire dynamic characteristics comprising processes such as the development of the liquid spray pattern at the outlet of the atomiser, the breakdown of the fuel into droplets, the formation of inhomogeneities in the structure of the spray pattern and the separation of smaller droplets in large vortex structures, etc.
The purpose of this study is to measure the vertex angle of the fuel spray in a tray injection system, using direct high-speed photography. The vertex angle is one of the parameters defining fuel spray. It determines the degree of fuel distribution in the combustion chamber and depends on a number of factors such as the fuel discharge velocity, the back pressure of the medium, the dimensions of the outlet aperture and the physical properties of the fuel. So far, no uniform analytic formula has been adopted to determine this type of angle. Therefore, to enable measurement of the vertex angle, it is necessary to conduct experimental research. Due to the non-stationary nature and a lack of local homogeneity of the injection process, machine vision systems are particularly well-suited for recording spray macrostructure parameters [37]. In view of this, measurement of the fuel spray vertex angle was performed using an optical method, which involves filming the fuel spray in a constant-volume chamber with a high-speed camera. As an advantage, this is a non-contact recording method, as a result of which the injection process is not disturbed.
The main purpose of this paper is to present a methodology and a workstation for visualisation tests enabling assessments of alternative fuels. The study also aims to determine the fuel spray vertex angle relative to the proportional volume of ethanol in the blends investigated. This issue has been selected for this research following a review of numerous studies of ethanol–diesel blends, which mainly focused on their physical properties and toxic emissions in the exhaust gas. Unfortunately, there are few studies evaluating the effect of ethanol on the geometric parameters of the spray, which is key to establishing the optimum operating conditions for engines running on this type of fuel.
2. Methodology of the Research
The study examined the atomisation of various fuel blends injected using a five-hole spray nozzle. The visualisation tests were performed at the workstation shown in Figure 1, comprising the following components:
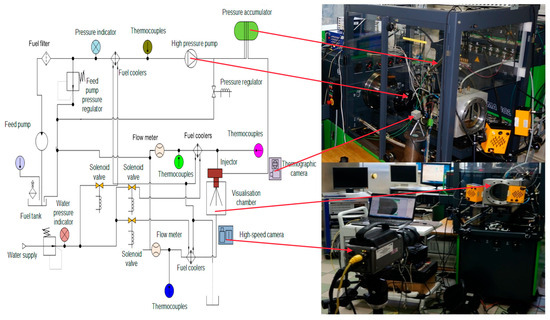
Figure 1.
Schematic representation of the workstation for fuel spray visualisation testing.
- Testing bench (basic unit of the station).
- Hydraulic feed system.
- Common Rail injection system.
- Injection visualisation chamber.
- High-speed camera to film the injection process.
The basic components of the system responsible for executing the injection include a low-pressure circuit, a high-pressure circuit and a controller.
A low-pressure fuel circuit could not be used because the test bench manufacturer permits only the use of the dedicated test oil. Therefore, the tests were performed using a separate hydraulic system, which enables the precise measurement of the injected fuel output through the injector and from the overflow. Apart from measuring the fuel output, the flowmeters applied also enable measurement of the basic parameters of the injected fuel, such as temperature and density. Furthermore, the system provides cooling to maintain a constant temperature of the fuel subjected to testing and to ensure stable conditions for the discharge of fuel by the high-pressure pump. For this, it is necessary to maintain the defined temperature in the tank, for instance, by means of a cooler for the fuel returning from the overflow of the high-pressure pump.
The test bench manual pressure valves were used to ensure adequate feed and overflow pressure of the high-pressure pump. Manometers with appropriate measuring ranges were used to control the defined pressure.
The high-pressure system mounted on the test bench consists of a high-pressure pump, a fuel tank, an injector installed in the visualisation chamber and high-pressure piping. An electric fuel pump transfers fuel from the tank to the high-pressure pump. The feed pressure of the high-pressure pump is regulated by an adjustable valve and measured by a manometer, similar to the pressure at the pump overflow, which is also set using an adjustable valve and controlled by a manometer. The fuel from the overflow passes through the cooler and into the tank. The flow of water through the cooler is regulated by a solenoid valve based on information about the temperature of the returning fuel.
The high-pressure pump forces the fuel into the tank, where the pressure is measured; the pressure regulators in the pump and in the busbar are controlled based on this information. The fuel is forced from the tank to the injector, which then discharges it into the visualisation chamber. In the tests, an electromagnetic injector marked 0445 110 083 is used and the diameter of the nozzle holes is 0.15 mm. The injected fuel flow rate and overflow volume are measured using flowmeters. The water flow in the coolers is regulated by means of solenoid valves monitored by the test bench control unit.
The injector is monitored by a microprocessor controller, making it possible to change the following control signal parameters:
- Duration of the entire signal controlling the aperture of the injector.
- Duration of the sustained signal.
- Frequency of the sustained signal.
- Fullness of the sustained signal.
The controller enables up to three fuel doses to be injected during one revolution of the crankshaft, and it also makes it possible to apply continuous and single injections. The input signals of the injection control system, i.e., the position and speed signals of the high-pressure pump, are emitted by an encoder mounted on the shaft of the motor driving the pump. Based on these data and information provided by the user via the computer, the controller produces and sends the appropriate signal driving the solenoid injector.
The parameters of the injector control signal can be changed via the dialogue box provided by the software. A thermographic camera was used to monitor the injector temperature. The temperature of the injector was measured in the area marked with a white rectangle (Figure 2).
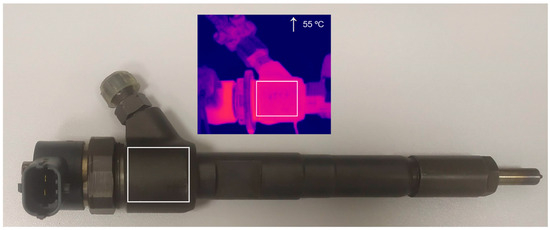
Figure 2.
Image of injector frame taken with thermographic camera during the test.
The basic components enabling optical testing include the visualisation chamber and the recording system. The visualisation chamber (Figure 3) consists of the body and glass panes, making it possible to adequately illuminate the spray. On the inner wall of the chamber, visible through the front glass pane, there is a disc with a graduation in the form of coaxial circles aligned with the injector; its purpose is to help quickly estimate the range of the fuel spray. The smallest circle has a diameter of 20 mm, and each subsequent circle is 20 mm larger in diameter.
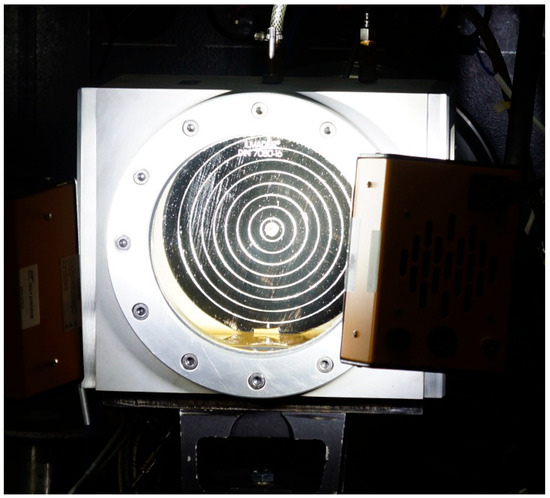
Figure 3.
Illuminated visualisation chamber.
By using high-strength glass inside the chamber, it is also possible to apply back-pressure of the medium (up to approximately 3 MPa), into which the fuel is injected, to better replicate the conditions within the engine chamber.
A high-speed camera was used to record the image of the fuel spray injected into the chamber containing air with atmospheric pressure. In order to perform tests that require high-speed filming, it is necessary to apply adequate illumination; for this purpose, two LED illuminators, 100 W each, were used. It is also important to select a lens that makes it possible to achieve adequate-quality recordings of the injected fuel spray. Hence, a full-frame, wide-angle lens with a fixed focal length of 20 mm and a maximum diameter of aperture of f/1.4 was used for this purpose.
Visualisation tests were performed to measure the vertex angle of the spray for seven samples of flammable liquids with different proportional volume contents of ethanol in diesel fuel blends (Table 1).

Table 1.
List of the fuel blends tested.
Each mixture with an ethanol content in the range of 5% to 30% v/v was supplemented with 5% dodecanol in order to obtain homogenous blends [14]. The samples were prepared from diesel oil, whose selected parameters are shown in Table 2, as well as denatured and dehydrated ethanol, whose main properties are shown in Table 3. Selected parameters of dodecanol, applied to improve the mixture’s stability, are shown in Table 4.

Table 2.
Selected properties of diesel oil [38].

Table 3.
Selected ethanol parameters [39].

Table 4.
Selected dodecanol parameters [40].
The specified blends were subjected to visualisation tests designed to measure the vertex angle of the fuel spray. During the tests, atmospheric pressure was maintained in the constant-volume chamber. The program of the tests performed at the workstation was realised by the following sequence of activities:
- Cleaning the hydraulic system with compressed air and filling the system with the investigated fuel.
- Setting the appropriate injection pressure and time.
- Performing a procedure of heating the fuel in the system to a temperature of 40 °C ± 2 °C and the injector to a temperature of 55 °C ± 2 °C (the required temperatures are obtained through operation of the system under the specified test conditions).
- Performing a single injection into the visualisation chamber and recording it with the high-speed camera.
- Repeating the measurements a specified number of times to obtain results for statistical processing.
- Repeating the measurements for all the specified values of pressure in the system.
- After each experiment, the chamber was rinsed to prevent the formation of background fog from the previously sprayed fuel.
- After the tests had been completed, removing the fuel and flushing the system.
The recorded fuel sprays were examined by observation of individual frames to measure the vertex angle of the fuel spray. The measurement was performed for the frame preceding the end of the injection, defined as the spray breaking away from the atomiser. The vertex angle of the spray was measured between the two straight lines tracing the spray (Figure 4).
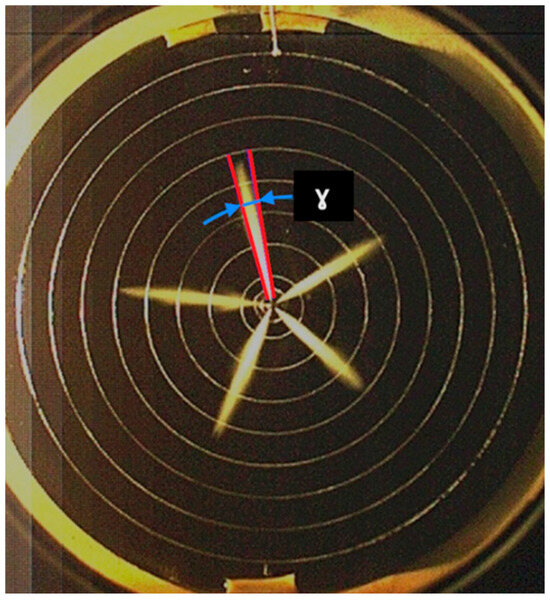
Figure 4.
The method for measuring the vertex angle of the first spray: ɣ—the vertex angle measured for the first spray.
The basic parameters of the fuel blends, defined based on the authors’ own measurements, are shown in Table 5. The related methodology has been reported in other publications [14,41].

Table 5.
Selected parameters of the fuel blends [14,41].
As a result of a review of the related literature, which suggests that at least 5 to 10 measurements [42] should be performed to reduce uncertainty, the authors ultimately decided to carry out 7 trials.
Statistical analysis was applied to determine the measurement uncertainty. An expanded uncertainty was also calculated [43], with the expansion coefficients determined from Student’s t-tables for a confidence interval of α = 0.05.
3. Results and Analysis
To assess all the blend samples prepared, the evolution of the spray produced by fuel injected into the visualisation chamber was filmed; based on that, it was possible to analyse the parameters of the sprays. The image was recorded with a speed of 24,096 fps and a resolution of 192 × 192. The tests were performed for three different values of injection pressure (75, 100 and 125 MPa). The injection time was selected in such a way as to ensure the fuel spray would not have an excessively large range and would not bounce off the walls of the visualisation chamber. The injection parameters applied during the tests are shown in Table 6.

Table 6.
Parameters defined for fuel spray visualisation tests.
The film with the recorded fuel spray can be replayed as a video sequence, making it possible to examine the continuity of the fuel injection. Another method that can be used to make assessments involves viewing the individual frames in order to evaluate the geometric parameters of the spray (the spray vertex angle and the range of the spray tip). The vertex angle of the spray was measured at the maximum range of the spray tip. Selected images recorded during the fuel spray visualisation for some fuel blends are shown in Figure 5, Figure 6, Figure 7, Figure 8, Figure 9, Figure 10 and Figure 11.
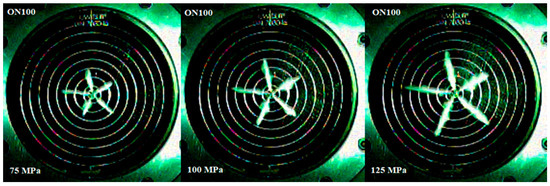
Figure 5.
The recorded maximum range of spray for diesel oil at an injection pressure of 75, 100 and 125 MPa.

Figure 6.
The recorded maximum range of spray for diesel blend with 5% v/v content of ethanol at an injection pressure of 75, 100 and 125 MPa.
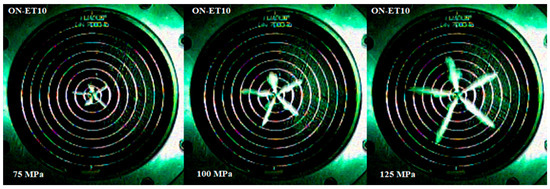
Figure 7.
The recorded maximum range of spray for diesel blend with 10% v/v content of ethanol at an injection pressure of 75, 100 and 125 MPa.
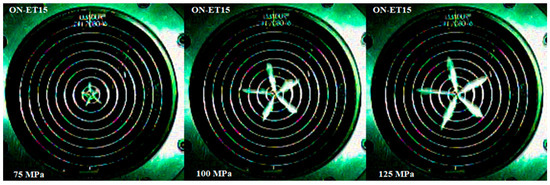
Figure 8.
The recorded maximum range of spray for diesel blend with 15% v/v content of ethanol at an injection pressure of 75, 100 and 125 MPa.
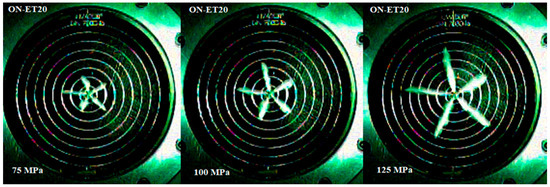
Figure 9.
The recorded maximum range of spray for diesel blend with 20% v/v content of ethanol at an injection pressure of 75, 100 and 125 MPa.
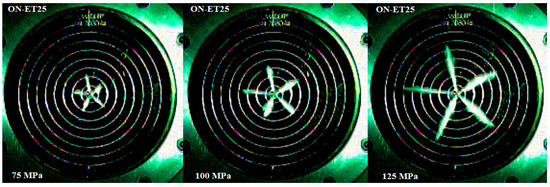
Figure 10.
The recorded maximum range of spray for diesel blend with 25% v/v content of ethanol at an injection pressure of 75, 100 and 125 MPa.
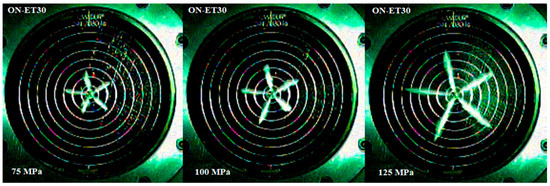
Figure 11.
The recorded maximum range of spray for diesel blend with 30% v/v content of ethanol at an injection pressure of 75, 100 and 125 MPa.
The mean values of the fuel spray vertex angle are presented in Figure 12. The findings show that in the case of injection pressure of 75 MPa, the lowest value of the spray vertex angle, i.e., 5.8°, was identified in ON–ET30, and the largest spray vertex angle of 12.5° was shown in ON–ET10. At an injection pressure of 100 MPa, the largest angle of 8.8° was identified in the case of ON–ET5, and the smallest of approximately 5.4° was found for ON–ET30. In the case of an injection pressure of 125 MPa, the findings show the smallest value of the vertex angle of approximately 3.6° produced by ON–ET30, whereas the largest value of 10.5° was identified for ON–ET5. It is possible to observe that in the tests with an injection pressure of 75 MPa, the spray vertex angle increases with the higher proportional volume of ethanol, up to a content of approximately 10%. After that, the spray vertex angle at this injection pressure decreases. In the case of an injection pressure of 100 MPa, the spray vertex angle decreases when the ethanol content in the blend is higher. At an injection pressure of 125 MPa, the spray vertex angle increases in the sample with a 5% v/v content of ethanol and then decreases with the higher contents. In the case of the blends with an ethanol content higher than 15% v/v, the spray is more concentrated, as reflected by the lower value of the spray vertex angle. At an injection pressure of 75 MPa, the highest value of the spray vertex angle amounting to 12.5° was identified in the case of the blend with 10% v/v content of ethanol; compared to diesel oil, this is an increase of approximately 50.7%. The lowest value of the angle, i.e., 5.8°, was measured in the sample with a 30% v/v content of ethanol, which is a nearly 30.2% decrease relative to diesel oil. In the tests with an injection pressure of 100 MPa, the smallest spray vertex angle of 5.41° was identified for the ON–ET30 fuel sample; this value was nearly 30.7% lower than the vertex angle shown for diesel oil. In the case of the ON–ET5 sample, the angle was 8.8°, which was nearly 13% higher than the ON sample. On the other hand, at an injection pressure of 125 MPa, there was a 69% increase in the spray vertex angle in the case of the sample with a 5% v/v content of ethanol in which the value of the vertex angle amounted to 10.5°. The smallest angle of 3.6° was identified in the case of the blend with a 30% v/v content of ethanol; this value was 73% lower than diesel oil.
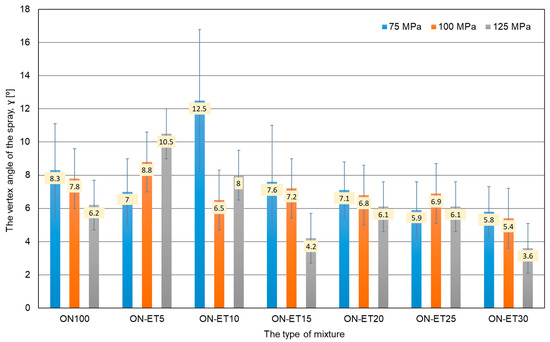
Figure 12.
The compared mean values of the vertex angle of spray produced by flammable liquids investigated at different values of pressure in the injector system.
4. Conclusions
The characteristics of the fuel injection process in compression–ignition engines significantly impact the combustion process and all the resulting engine parameters, i.e., both the operational (engine torque, engine power, and specific fuel consumption) and environmental properties. These parameters are impacted by the macrostructure of the fuel spray, which depends on a number of factors, including the physical and chemical properties of the fuel (e.g., density and viscosity), the parameters of the injection process (e.g., injection pressure and the spray structure) and the design and precision engineering of the injector components.
The spray formation in direct injection compression–ignition engines is an extremely complicated process with a number of fast-changing variables that must be analysed in detail. Because of this, it is necessary to use advanced research equipment enabling visualisation tests and providing more accurate insight into the processes that take place. The proposed methodology enables such analysis and can be used to assess the macrostructure parameters of spray produced by alternative fuels, such as blends of diesel oil and alcohol.
Analysis of the findings based on the visualisation tests shows that:
- At an injection pressure of 75 MPa, only the ON–ET10 sample was shown to produce a spray vertex angle that was larger than commercial diesel oil (by approximately 50.7%), whereas the smallest vertex angle was identified in the case of ON–ET30 (the value was approximately 30% lower than the baseline diesel oil).
- At an injection pressure of 100 MPa, only the sample of the ON–ET5 blend was found to have a larger spray vertex angle than the diesel oil sample (by approximately 13%).
- The smallest spray vertex angle, at an injection pressure of 100 MPa, was identified in the case of ON–ET30; the value was approximately 31% lower than diesel oil.
- At an injection pressure of 125 MPa, a larger vertex angle than that produced by commercial diesel oil was identified in the case of the blends with 5% and 10% contents of ethanol; for the remaining blends, the value of this parameter was lower.
- At an injection pressure of 125 MPa, the largest spray vertex angle, compared to that produced by the baseline diesel oil, was identified in the case of the ON–ET5 blend (the value was approximately 69% higher).
- The smallest spray vertex angle at an injection pressure of 125 MPa was identified in the case of the ON–ET30 blend; the value was approximately 42% lower than the baseline fuel.
The present findings suggest that an increase in the proportional content of ethanol in blends with diesel oil and dodecanol may affect the shape of the fuel spray. It has also been shown that the values of the spray vertex angle identified in the case of ethanol–diesel blends with the addition of dodecanol are most similar to those observed in the case of diesel oil in the tests performed at an injection pressure of 100 MPa. Therefore, these blends can be used in compression–ignition engines since, in a wide range of operating conditions, the pressure values most commonly applied in typical injection systems roughly correspond to this value.
Author Contributions
Conceptualization, A.K. and A.U.; methodology, A.K. and A.U.; software, A.K. and A.U.; validation, A.U.; formal analysis, A.K. and A.U. investigation, A.U.; resources, A.K. and A.U.; data curation, A.K. and A.U.; writing—original draft preparation, A.K.; writing—review and editing, A.K. and A.U.; visualization, A.K.; supervision, A.U. All authors have read and agreed to the published version of the manuscript.
Funding
This research received no external funding. The APC was funded by Rzeszow University of Technology.
Institutional Review Board Statement
Not applicable.
Informed Consent Statement
Not applicable.
Data Availability Statement
Data are contained within the article.
Conflicts of Interest
The authors declare no conflicts of interest.
Abbreviations
| CO | Carbon monoxide |
| CO2 | Carbon dioxide |
| HC | Hydrocarbons |
| NOx | Nitrogen oxides |
| PM | Particulate matter |
References
- Zhang, Z.; Li, J.; Tian, J.; Dong, R.; Zou, Z.; Gao, S.; Tan, D. Performance, combustion and emission characteristics investigations on a diesel engine fueled with diesel/ ethanol /n-butanol blends. Energy 2022, 249, 123733. [Google Scholar] [CrossRef]
- Li, X.; Liu, Q.; Ma, Y.; Wu, G.; Yang, Z.; Fu, Q. Simulation Study on the Combustion and Emissions of a Diesel Engine with Different Oxygenated Blended Fuels. Sustainability 2024, 16, 631. [Google Scholar] [CrossRef]
- Huang, Z.; Huang, J.; Luo, J.; Hu, D.; Yin, Z. Performance enhancement and emission reduction of a diesel engine fueled with different biodiesel-diesel blending fuel based on the multi-parameter optimization theory. Fuel 2022, 314, 122753. [Google Scholar] [CrossRef]
- Zhang, Z.; Ye, J.; Tan, D.; Feng, Z.; Luo, J.; Tan, Y.; Huang, Y. The effects of Fe2O3 based DOC and SCR catalyst on the combustion and emission characteristics of a diesel engine fueled with biodiesel. Fuel 2021, 290, 120039. [Google Scholar] [CrossRef]
- Valeika, G.; Matijošius, J.; Orynycz, O.; Rimkus, A.; Kilikevičius, A.; Tucki, K. Compression Ignition Internal Combustion Engine’s Energy Parameter Research Using Variable (HVO) Biodiesel and Biobutanol Fuel Blends. Energies 2024, 17, 262. [Google Scholar] [CrossRef]
- Channappagoudra, M.; Ramesh, K.; Manavendra, G. Comparative study of standard engine and modified engine with different piston bowl geometries operated with B20 fuel blend. Renew. Energy 2019, 133, 216–232. [Google Scholar] [CrossRef]
- Di Iorio, S.; Catapano, F.; Magno, A.; Sementa, P.; Vaglieco, B.M. The Potential of Ethanol/Methanol Blends as Renewable Fuels for DI SI Engines. Energies 2023, 16, 2791. [Google Scholar] [CrossRef]
- Sitnik, L.J.; Sroka, Z.J.; Andrych-Zalewska, M. The Impact on Emissions When an Engine Is Run on Fuel with a High Heavy Alcohol Content. Energies 2021, 14, 41. [Google Scholar] [CrossRef]
- Zheng, F.; Cho, H.M. The Effect of Different Mixing Proportions and Different Operating Conditions of Biodiesel Blended Fuel on Emissions and Performance of Compression Ignition Engines. Energies 2024, 17, 344. [Google Scholar] [CrossRef]
- EL-Seesy, A.I.; Waly, M.S.; He, Z.; El-Batsh, H.M.; Nasser, A.; El-Zoheiry, R.M. Enhancement of the combustion and stability aspects of diesel-methanol-hydrous methanol blends utilizing n-octanol, diethyl ether, and nanoparticle additives. J. Clean. Prod. 2022, 371, 133673. [Google Scholar] [CrossRef]
- Gad, M.S.; El-Shafay, A.S.; Abu Hashish, H.M. Assessment of diesel engine performance, emissions and combustion characteristics burning biodiesel blends from jatropha seeds. Process. Saf. Environ. Prot. 2021, 147, 518–526. [Google Scholar] [CrossRef]
- López Núñez, A.R.; Rumbo Morales, J.Y.; Salas Villalobos, A.U.; De La Cruz-Soto, J.; Ortiz Torres, G.; Rodríguez Cerda, J.C.; Calixto-Rodriguez, M.; Brizuela Mendoza, J.A.; Aguilar Molina, Y.; Zatarain Durán, O.A.; et al. Optimization and Recovery of a Pressure Swing Adsorption Process for the Purification and Production of Bioethanol. Fermentation 2022, 8, 293. [Google Scholar] [CrossRef]
- Nour, M.; Kosaka, H.; Bady, M.; Sato, S.; Abdel-Rahman, A.K. Combustion and emission characteristics of DI diesel engine fuelled by ethanol injected into the exhaust manifold. Fuel Process. Technol. 2017, 164, 33–50. [Google Scholar] [CrossRef]
- Krzemiński, A.; Ustrzycki, A. Effect of Ethanol Added to Diesel Fuel on the Range of Fuel Spray. Energies 2023, 16, 1768. [Google Scholar] [CrossRef]
- Yilmaz, N.; Sanchez, T.M. Analysis of operating a diesel engine on biodiesel-ethanol and biodiesel-methanol blends. Energy 2012, 46, 126–129. [Google Scholar] [CrossRef]
- Hansen, A.C.; Zhang, Q.; Lyne, P.W.L. Ethanol–diesel fuel blends—A review. Bioresour. Technol. 2005, 96, 277–285. [Google Scholar] [CrossRef] [PubMed]
- Kuszewski, H.; Jaworski, A.; Ustrzycki, A. Lubricity of ethanol–diesel blends—Study with the HFRR method. Fuel 2017, 208, 491–498. [Google Scholar] [CrossRef]
- Li, D.; Zhen, H.; Lu, X.; Zhang, W.; Yang, J. Physico-chemical properties of ethanol–diesel blend fuel and its effect on performance and emissions of diesel engines. Renew. Energy 2005, 30, 967–976. [Google Scholar] [CrossRef]
- Laza, T.; Bereczky, A. Basic fuel properties of rapeseed oil-higher alcohols blends. Fuel 2011, 90, 803–810. [Google Scholar] [CrossRef]
- Torres-Jimenez, E.; Svoljšak Jerman, M.; Gregorc, A.; Lisec, I.; Pilar Dorado, M.; Kegl, B. Physical and chemical properties of ethanol–diesel fuel blends. Fuel 2011, 90, 795–802. [Google Scholar] [CrossRef]
- Pratas, M.J.; Freitas, S.V.D.; Oliveira, M.B.; Monteiro, S.C.; Lima, Á.S.; Coutinho, J.A.P. Biodiesel Density: Experimental Measurements and Prediction Models. Energy Fuels 2011, 25, 2333–2340. [Google Scholar] [CrossRef]
- Kuszewski, H. Experimental investigation of the effect of ambient gas temperature on the autoignition properties of ethanol–diesel fuel blends. Fuel 2018, 214, 26–38. [Google Scholar] [CrossRef]
- Anand, K.; Ranjan, A.; Mehta, P.S. Estimating the Viscosityof Vegetable Oil and Biodiesel Fuels. Energy Fuels 2010, 24, 664–672. [Google Scholar] [CrossRef]
- Song, Y.; Li, R.; Qian, Y.; Zhang, L.; Wang, Z.; Liu, S.; Pei, Y.; An, Y.; Yue, H.; Meng, Y. Study on spray characteristics of biodiesel alternative fuels for in-cylinder environment of diesel engine. J. Energy Inst. 2024, 113, 101507. [Google Scholar] [CrossRef]
- Lapuerta, M.; Rodríguez-Fernández, J.; Fernández-Rodríguez, D.; Patiño-Camino, R. Modeling viscosity of butanol and ethanol blends with diesel and biodiesel fuels. Fuel 2017, 199, 332–338. [Google Scholar] [CrossRef]
- Murcak, A.; Haşimoğlu, C.; Cevik, İ.; Kahraman, H. Effect of injection timing to performance of a diesel engine fuelled with different diesel–ethanol mixtures. Fuel 2015, 153, 569–577. [Google Scholar] [CrossRef]
- Barabás, I. Predicting the temperature dependent density of biodiesel–diesel–bioethanol blends. Fuel 2013, 109, 563–574. [Google Scholar] [CrossRef]
- Masera, K.; Hossain, A.K.; Davies, P.A.; Doudin, K. Investigation of 2-butoxyethanol as biodiesel additive on fuel property and combustion characteristics of two neat biodiesels. Renew. Energy 2021, 164, 285–297. [Google Scholar] [CrossRef]
- Kwanchareon, P.; Luengnaruemitchai, A.; Jai, S. In Solubility of a diesel–biodiesel–ethanol blend, its fuel properties, and its emission characteristics from diesel engine. Fuel 2007, 86, 1053–1061. [Google Scholar] [CrossRef]
- Guarieiro, L.L.N.; de Almeida Guerreiro, E.T.; dos Santos Amparo, K.K.; Manera, V.B.; Regis, A.C.D.; Santos, A.G.; Ferreira, V.P.; Leao, D.J.; Torres, E.A.; de Andrade, J.B. Assessment of the use of oxygenated fuels on emissions and performance of a diesel engine. Microchem. J. 2014, 117, 94–99. [Google Scholar] [CrossRef]
- Tutak, W.; Jamrozik, A.; Pyrc, M.; Sobiepański, M. A comparative study of co-combustion process of diesel-ethanol and biodiesel ethanol blends in the direct injection diesel engine. Appl. Therm. Eng. 2017, 117, 155–163. [Google Scholar] [CrossRef]
- Lapuerta, M.; Armas, O.; Herreros, J.M. Emissions from a diesel–bioethanol blend in an automotive diesel engine. Fuel 2008, 87, 25–31. [Google Scholar] [CrossRef]
- Pielecha, I.; Czajka, J.; Wisłocki, K.; Borowski, P. Research-based assessment of the influence of hydrocarbon fuel atomization on the for-mation of self-ignition spots and the course of pre-flame processes. Combust. Engines 2014, 157, 22–35. [Google Scholar] [CrossRef]
- Hentschel, W. Optical diagnostics for combustion process development of direct-injection gasoline engines. Proc. Combust. Inst. 2000, 28, 1119–1135. [Google Scholar] [CrossRef]
- Kamimoto, T.; Ahn, S.K.; Chang, Y.J.; Kobayashi, H.; Matsuoka, S. Measurement of Droplet Diameter and Fuel Concentration in a Non-Evaporating Diesel Spray by Means of an Image Analysis of Shadow Photographs. SAE 1984, 93, 372–380. [Google Scholar] [CrossRef]
- Wisłocki, K. Studium Wykorzystania Badań Optycznych do Analizy Procesów Wtrysku i Spalania w Silnikach o Zapłonie Samoczynnym; Wydawnictwo Politechniki Poznańskiej: Poznań, Poland, 2004; Volume 387. [Google Scholar]
- Orzechowski, Z.; Prywer, J. Wytwarzanie i Zastosowanie Rozpylonej Cieczy; Wydawnictwa Naukowo—Techniczne: Warsaw, Poland, 2008; ISBN 978-83-204-3416-3. [Google Scholar]
- Available online: https://www.orlen.pl/pl/dla-biznesu/produkty/paliwa/oleje-napedowe/ekodiesel-ultra-klasa-2 (accessed on 13 June 2024).
- Safety Data Sheet: Ethyl Alcohol Completely Contaminated; Alpinus: Solec Kujawski, Poland, 2016.
- Available online: https://www.carlroth.com/pl/pl/aliphatic-alcohols/1-dodecanol/p/9853.3 (accessed on 13 June 2024).
- Krzemiński, A.; Jaworski, A.; Kuszewski, H.; Woś, P. A comparative study on selected physical properties of diesel–ethanol–dodecanol blends. Combust. Engines 2024, 196, 99–105. [Google Scholar] [CrossRef]
- Przewodnik Głównego Urzędu Miar: Wyrażanie Niepewności Pomiaru (Guide of the Central Office of Measures: Expressing Measurement Uncertainty); Central Office of Measures: Warszawa, Poland, 1999.
- Zięba, A. Pracownia Fizyczna Wydziału Fizyki i Techniki Jądrowej; AGH: Kraków, Poland, 2002. [Google Scholar]
Disclaimer/Publisher’s Note: The statements, opinions and data contained in all publications are solely those of the individual author(s) and contributor(s) and not of MDPI and/or the editor(s). MDPI and/or the editor(s) disclaim responsibility for any injury to people or property resulting from any ideas, methods, instructions or products referred to in the content. |
© 2024 by the authors. Licensee MDPI, Basel, Switzerland. This article is an open access article distributed under the terms and conditions of the Creative Commons Attribution (CC BY) license (https://creativecommons.org/licenses/by/4.0/).