Article

Comparison between Direct and Indirect Heat Flux Measurement Techniques: Preliminary Laboratory Tests

by
Luca Evangelisti
1,*,
Leone Barbaro
1,
Claudia Guattari
2,
Edoardo De Cristo
1,3,
Roberto De Lieto Vollaro
1 and
Francesco Asdrubali
4
1
Department of Industrial, Electronic and Mechanical Engineering, Roma TRE University, Via Vito Volterra 62, 00146 Rome, Italy
2
Department of Philosophy, Communication and Performing Arts, Roma TRE University, Via Ostiense 139/10, 00154 Rome, Italy
3
Department of Engineering, Niccolò Cusano University, Via Don Carlo Gnocchi 3, 00166 Rome, Italy
4
Department of International Human and Social Sciences, Perugia Foreigners’ University, Piazza Fortebraccio 4, 06122 Perugia, Italy
*
Author to whom correspondence should be addressed.
Energies 2024, 17(12), 2961; https://doi.org/10.3390/en17122961
Submission received: 27 May 2024 / Revised: 12 June 2024 / Accepted: 14 June 2024 / Published: 16 June 2024

Abstract

:
Direct and indirect approaches can be employed for estimating the heat flow through components in different application fields. In the building sector, the thermometric method is often applied by professionals for thermal transmittance evaluations. However, miscalculations can derive from inaccurate total heat transfer coefficients, and a consensus regarding the appropriate value to employ remains to be determined. Here, an apparatus was realized for laboratory tests and heat flux measurements were performed following direct and indirect approaches. Data acquired through a common heat flow sensor were compared with those computed through a post-processing based on radiative and convective estimations. The results were affected by the specific correlation adopted for computing the convective coefficients, with the percentage differences ranging from −9.8% to −0.4%. New measurement systems could be designed for automatically computing heat fluxes through indirect approaches, thus providing alternative solutions in the panorama of non-destructive tests for building energy diagnosis.

1. Introduction

More energy efficiency and less environmental impact are the key elements for the renovation of the building sector [1]. Political and technical choices have emphasized the significance of adopting systems and solutions able to reduce polluting emissions and, above all, energy consumption [2]. In particular, some interventions have been encouraged, among which are the use of generators with increasingly higher efficiency in order to reduce the atmospheric pollutants emissions; the production of energy from renewable and clean sources, to reduce dependence on traditional ones, which are generally more expensive, causing an impact on the environment; and the use of technical solutions and specific materials to increase the insulating capacity of building envelopes, with the aim of reducing heating and cooling energy needs [3,4,5]. All these aspects point toward a holistic vision of the problem, within which active and passive solutions are key elements for both new buildings and old constructions in need of retrofit [6,7].
Within a holistic approach, multiple elements must be brought together for a common goal. The constant attention to the environment and human health has led to an increasingly rapid evolution of sustainable construction [8]. It is worth observing that the transition to sustainable construction is no longer a choice but a requirement for improving citizens’ quality of life, reducing the energy demand, giving homes greater value, cutting emissions and lowering environmental impacts [9].
However, the sustainability concept related to buildings is not new, as it was developed as early as the 1970s in response to the energy crisis and growing concerns about the environment [10]. Starting from this, it is possible to understand the importance of the energy requalification of the building heritage in old countries, such as Italy. In existing buildings, technical data may be lost and modifications over time can make calculations difficult to perform. The heat transfer characteristics of building components are evaluated by quantifying the extent of the heat loss through established coefficients [11]. Assessing these coefficients can pose challenges due to insufficient technical data and the impacts of material aging and weathering [12,13].
Errors in evaluating the heat transfer coefficients may hinder interventions aimed at improving the energy performance of buildings or result in the implementation of unnecessary and costly energy efficiency solutions [14,15,16]. Consequently, experimental investigations become essential for better evaluating the thermal performance of building elements. Applying sensors for acquiring heat fluxes, temperatures and air velocity can be a useful and viable solution within on-site experimental assessment procedures, such as the heat flow meter (HFM) method, the simple hot box HFM method (SHB-HFM), the quantitative infrared thermography approach (QIRT) and the so-called thermometric (THM) method [17].
Efforts in the literature were made to review and compare different experimental methods for assessing the building envelopes’ thermal behavior [17,18,19]. The comparison encompassed measurement techniques and instrumentation, accuracy and precision, ease of use, cost-effectiveness, practical applicability, and frequency of use. Among the various techniques, standardized HFM turns out to be the most commonly used approach due to its direct measurements of heat fluxes and low sensor costs [19]. Over time, thermography has become increasingly widespread due to its versatility in a wide range of applications [20,21,22]. In particular, the QIRT technique has gained popularity in recent years as a non-destructive and non-contact method for assessing the thermal behavior of walls [23,24,25,26]. However, this approach requires specific environmental conditions and expensive equipment, which may limit its widespread implementation [18,19].
Additionally, while the SHB-HFM approach received attention in the literature for its potential in accurate heat flux measurement [27,28], it faces issues due to the high costs associated with the sensors and instrumentation [18]. Furthermore, implementing this technique could be unfeasible for large-scale studies or real-world applications due to problems related to the installation of measurement systems, the number of measurements needed, and the high processing costs [17,18,29].
In contrast, the THM method has received less attention and validation [18,30]. This approach allows for indirect assessment of heat fluxes crossing the walls by solely relying on temperature measurements, offering a more straightforward, cost-effective, and quicker manner than the HFM method. These properties make the THM technique a promising alternative for assessing heat fluxes in building envelopes. However, this technique still requires further investigation and validation to establish its accuracy and reliability compared to the HFM method. Much progress is necessary for collecting more data to draw firm conclusions, because the main issue is represented by the operator’s ability to arbitrarily select the heat transfer coefficient for the indirect calculation of the heat flows.
Another fundamental aspect is related to the measuring instrument and sensor costs. Based on the authors’ experience, the HFM method requires an investment of about EUR 2000.00 for the instrumentation. The SHB-HFM method requires more than EUR 4000.00, plus the cost of creating the simple hot box. The QIRT method needs an infrared camera, with costs that can exceed EUR 30,000.00. Finally, the THM method appears to be the cheapest, requiring an investment of about EUR 1300.00. More details about the sensor costs are reported in [18].
Finally, it is important to consider the possible surface damage caused by the adhesive tapes used to keep sensors fixed to the wall. Common heat flux sensors are characterized by a weight, including the cable, of approximately 0.5 kg. On the other hand, surface temperature probes are characterized by lighter weights. This is reflected in a smaller amount of adhesive tape and a reduced risk of damage.
Starting from this, direct and indirect approaches can be employed for estimating the heat flow through components in different application fields. In the building sector, the thermometric method is often applied by professionals. Being an indirect approach, heat fluxes are computed as a function of the constant heat transfer coefficients that can be set by the operator, which is often based on the simplest choice of the value suggested by ISO 6946 [31]. The present work aims at supporting an alternative approach to the THM method, thus overcoming the problem of selecting a heat transfer coefficient that may not be suitable for the purpose of thermal characterization of the component being analyzed. Here, an apparatus was realized for laboratory tests and preliminary heat flux measurements were performed following direct and indirect approaches. The core idea was to provide experimental evidence of a methodological approach for heat flow estimation with an indirect approach capable of freeing users from arbitrary choices.
The aim and scope of the research are described in detail in Section 2, highlighting the novelty of this research. Section 3 provides information and data related to the experimental apparatus. The methodological approach in provided in Section 4. The findings are outlined and analyzed in Section 5. Finally, Section 6 draws the conclusions.

2. Aim and Scope

Today, several noteworthy measurement approaches exist, and the pros and cons can be identified in terms of the applicability and costs. Considering the widely used standardized HFM method, some issues have been emphasized in the literature [32,33,34]. It has been observed that the measurement uncertainty is principally related to the heat flux sensor [35,36].
On the other hand, considering the THM technique, the main advantage is the absence of heat flow sensors, so its measurement errors can be prevented. The measurement system is characterized by temperature probes, and errors correlated to these sensors can only be associated. Being an indirect method that requires the calculation of heat fluxes, miscalculations can be made by applying inaccurate heat transfer coefficients. A value equal to 7.69 W/m2K [37] (suggested by the standard ISO 6946), 2.5 W/m2K [29] or other approximations potentially not representative of the real heat transfer conditions has been used in the literature. The primary concern revolves around the overall heat transfer coefficient. A consensus regarding the appropriate value to employ remains to be determined. However, a methodological approach to help professionals who use this method could be valuable, including from the perspective of avoiding arbitrary (and potentially inadequate) choices.
As mentioned before, this work belongs to a long-term project whose vision is to support the improvement of the THM method. In this work, a new apparatus was built and preliminary tests were conducted under laboratory conditions. Heat flux measurements were performed following direct and indirect approaches. Heat fluxes acquired through a common heat flow sensor were compared with those computed through an indirect approach based on a data post-processing leading to radiative and convective estimations, including examining the more suitable correlation for computing convective heat transfer coefficients.
There are potentialities and scientific and environmental impacts related to an improved THM method. The scientific impact is strictly related to the proposal of an alternative data post-processing, which represents the core idea of an enhanced version of the method for building wall thermal characterization. The methodological approach proposed here can free users from choices that may be inappropriate, going beyond the scientific debate relate to suitable heat transfer coefficient values. From an environmental point of view, the methodology here proposed aims at providing a new contribution for the thermal characterization of building walls, suggesting an alternative solution for existing structures, including for buildings of historical, architectural, or cultural relevance.

3. Experimental Apparatus

3.1. Insulating System Construction

In this work, a new hand-made system was built to thermally insulate a square wooden sample to create a consistent, stable temperature difference between the sample and the environment. Extruded polystyrene (XPS) panels, with a thickness of 0.05 m, were formed and arranged to construct an insulating framework capable of accommodating the sample. The XPS assembly was characterized by the same height and width, equal to 0.6 m, and a thickness of 0.10 m. To ensure greater structural stability, the XPS assembly was enclosed by wooden panels. The sample was made of poplar wood, and it had a square shape, characterized by a height of 0.3 m, a width of 0.3 m and a thickness of 0.015 m. An electric heating mat was installed in the central part of the structure. It consisted of a polyester flexible heating film made by screen printing with silver and carbon paste, manufactured by ALPER. It worked at a low constant temperature and the voltage and wattage were equal to 230 V and 16 W, respectively. The heating mat was characterized by dimensions equal to 0.28 × 0.28 m, with a thickness of 0.001 m. The assembly had been designed allowing the removal of a part to facilitate the placing of the sample.
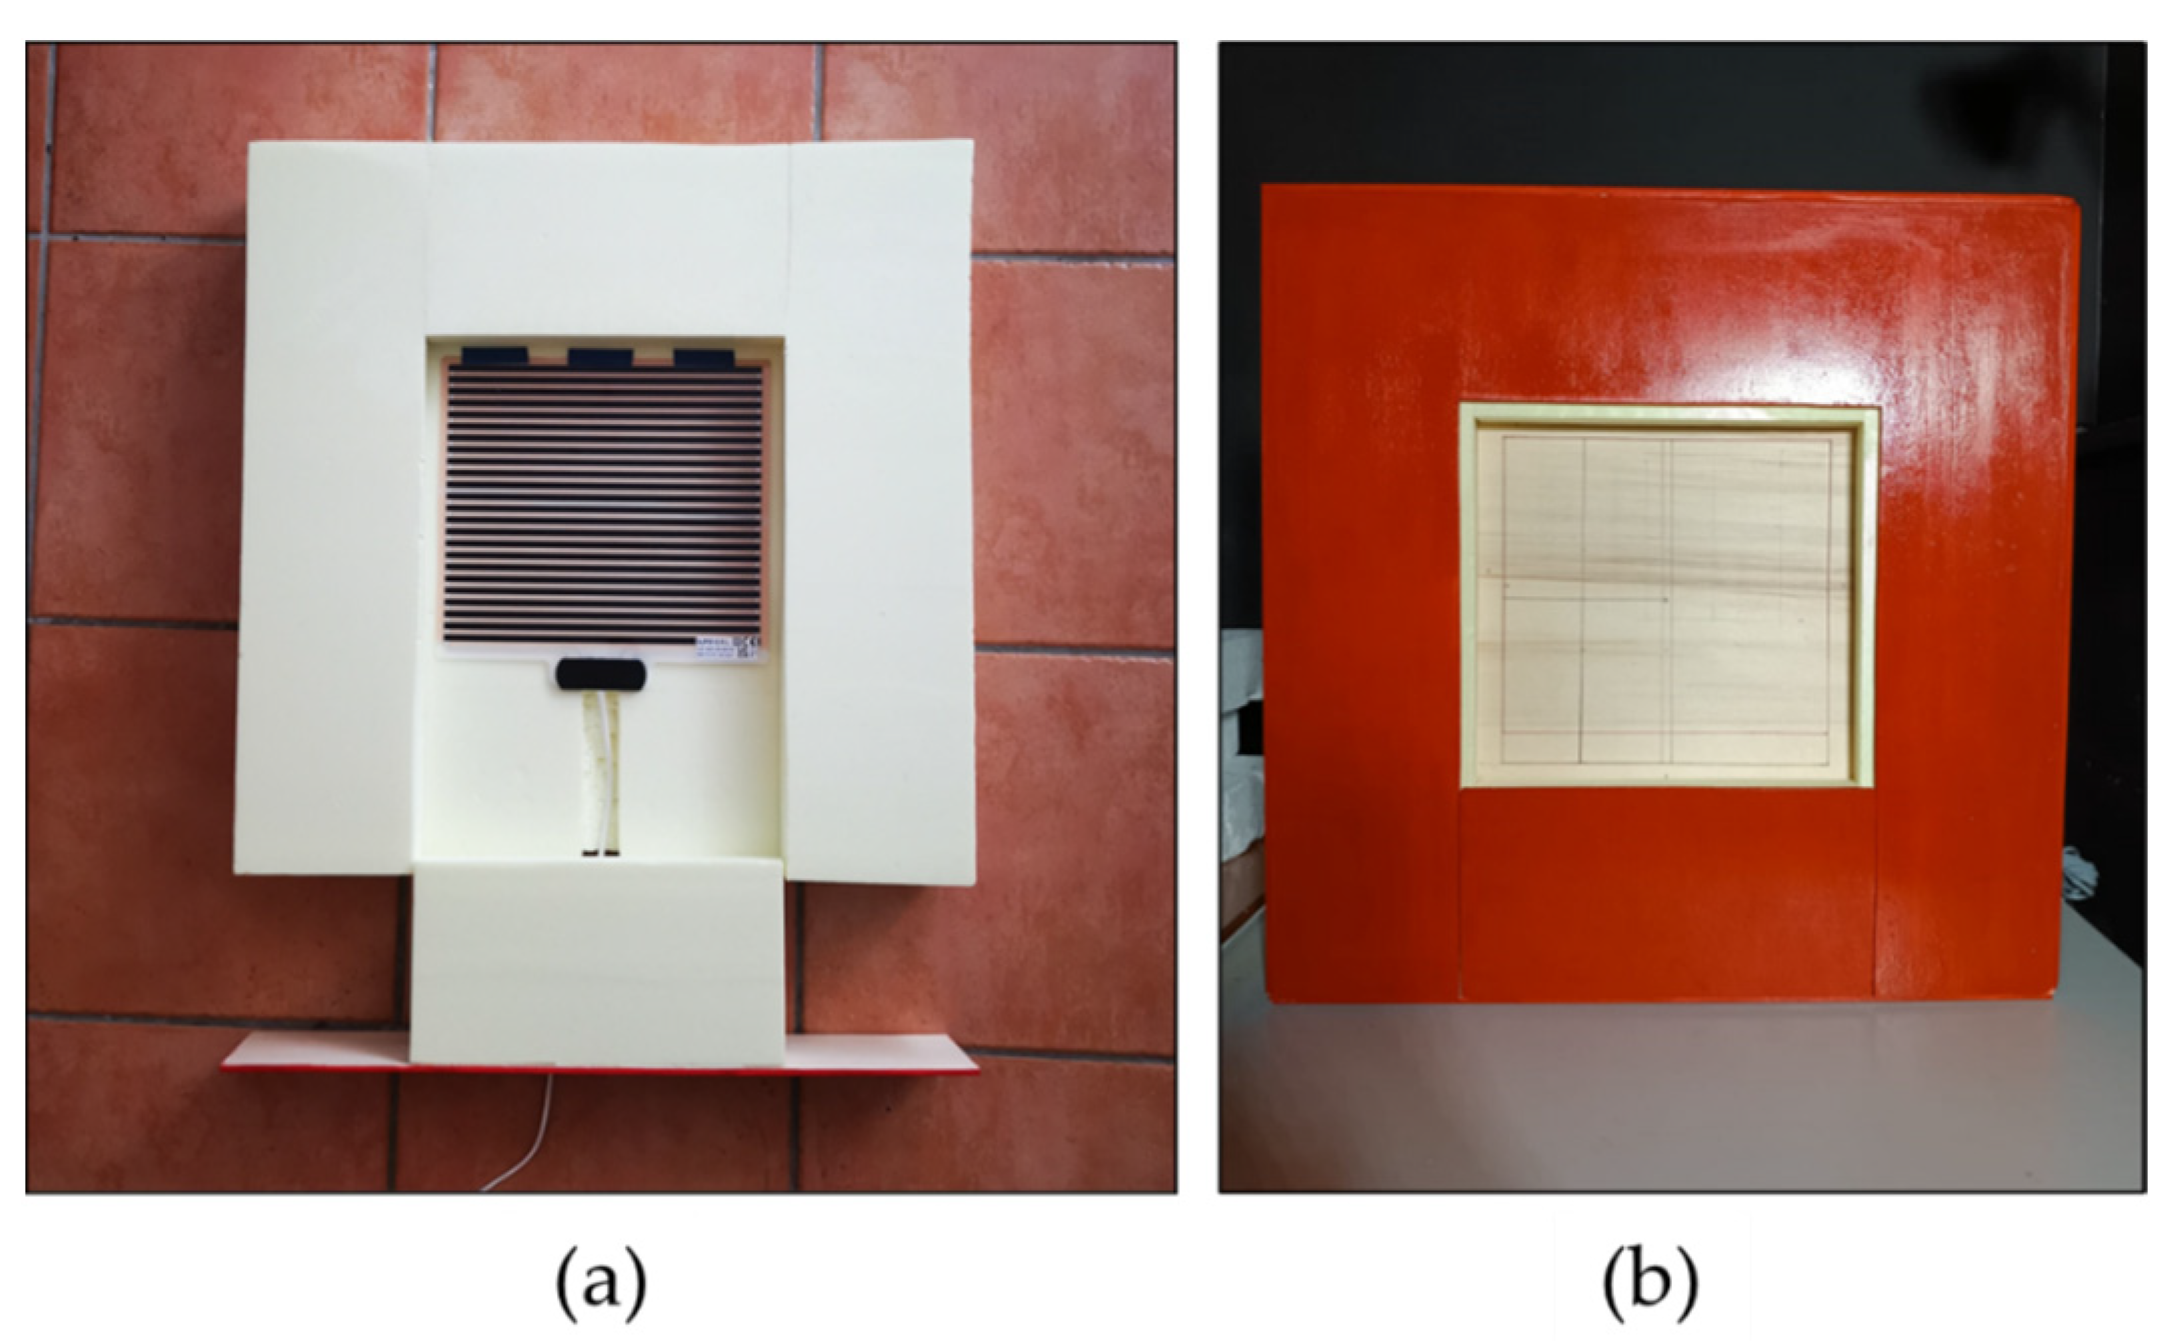
Figure 1 shows the 3D exploded view of the structure and the dimensions of the apparatus. The inner thermal insulation made of shaped and assembled XPS panels and the whole assembly are shown in Figure 2.

3.2. Experimental Setup

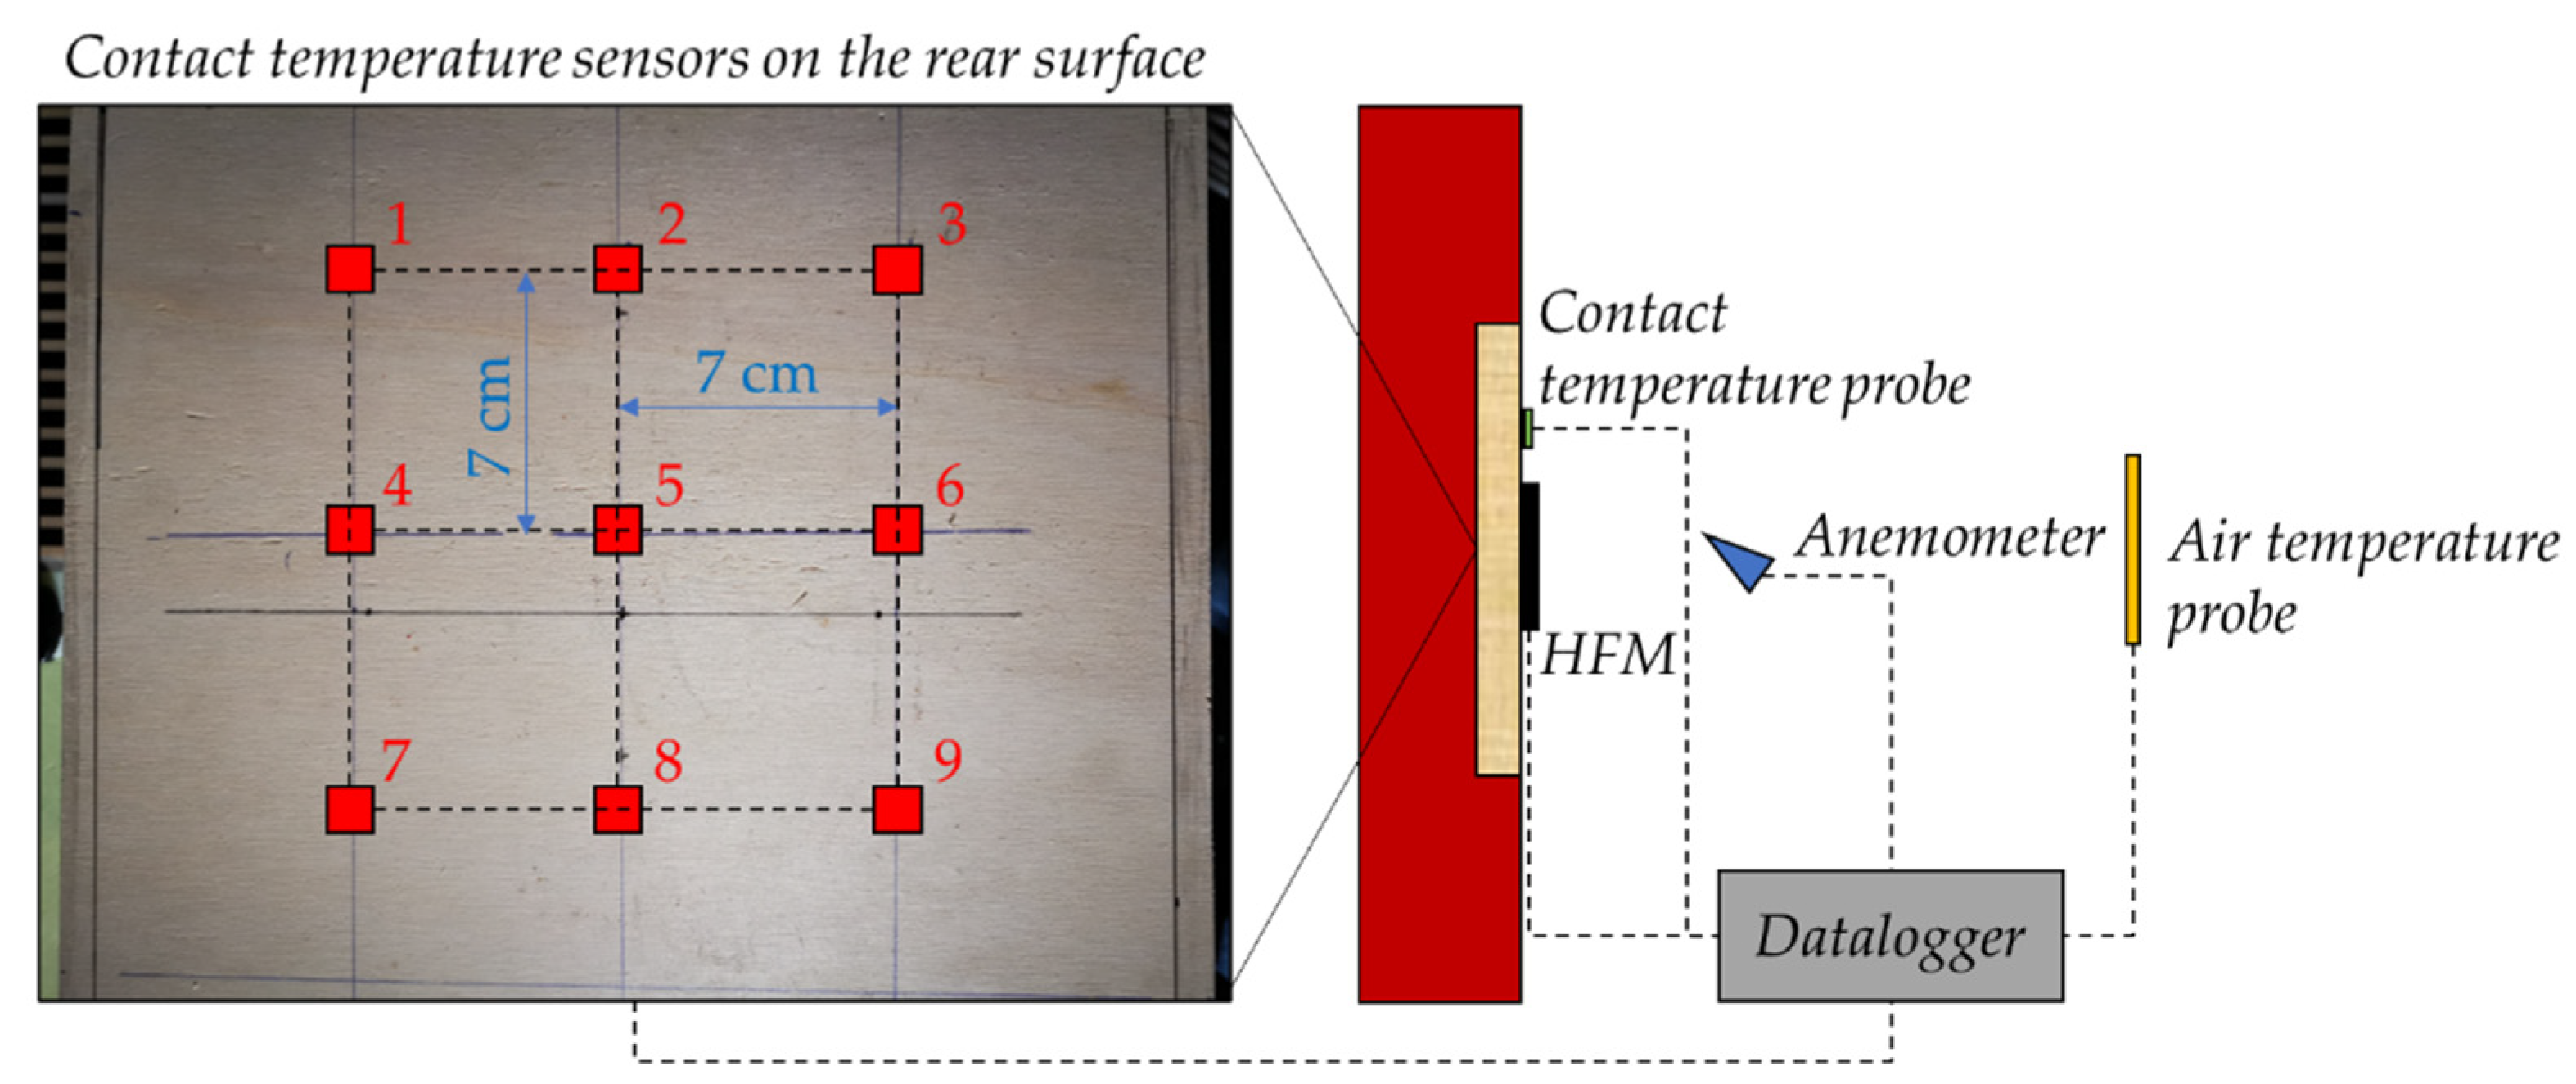
The heated sample was equipped with sensors for performing heat flux measurements through direct and indirect approaches. On the back surface of the sample, contact temperature probes were applied for evaluating the homogeneity of the sample heating. Specifically, nine sensors were applied within a matrix with a spacing of 0.07 m, with three equidistant sensors on three equidistant lines. On the front free surface of the sample, 1 heat flux sensor and 1 contact temperature probe were installed for the direct heat flux and surface temperature measurements, respectively. An anemometer (hot-wire type) was placed in front of the sample, at different distances, to monitor the air velocity. Finally, a thermal imaging camera was employed for evaluating the overall front surface temperature. Table 1 outlines the key technical specifications of the equipment, while Figure 3 illustrates the experimental configuration.

4. Methodology

As already mentioned, the heated wooden sample was equipped with several sensors for logging data related to the heat fluxes, temperatures, and air speed. All the physical parameters were employed in a methodology characterized by the following steps:
  • Achievement of stationary conditions and temperature data evaluation: During this step, the sample was heated through the heating mat until steady-state conditions were reached. During the heating phase, the surface temperature probes, mounted on the rear part of the sample, recorded data while the thermal imaging camera, placed in front of the apparatus, monitored the free surface. To correctly measure the surface temperatures by means of infrared thermography, the so-called reflected temperature and the emissivity (ε) of the sample need to be quantified. Therefore, the reflector-based approach was employed, and the reflected temperature was evaluated by constructing a reflector with a crumpled and then flattened aluminum sheet applied to a piece of cardboard. The diffuse reflector was positioned on the free surface of the sample and its temperature was measured by setting ε = 1 in the camera, obtaining a reflected temperature of 21.60 °C. Subsequent comparisons between the surface temperature values, acquired via a contact temperature sensor, and the infrared camera outcomes enabled the determination of the sample’s emissivity (ε). Starting from an emissivity equal to 1, the ε in the thermal imaging camera was gradually lowered until the temperature measured through the contact sensor had become the same as that measured by the infrared camera. An emissivity of 0.84 was thus obtained.
  • Identification of thermal inhomogeneities effects and positioning of the sensors for the heat flux evaluation: The effects of thermal non-uniformities must be assessed in relation to the deviation of the heat flux from one-dimensional conditions. This condition can affect the results, and the magnitude of the possible heat flux distortions can be analyzed by creating a bidimensional simulation model. Here, Comsol Multiphysics was used, and different 2D models of the sample were created, considering the back surface temperature sensors, due to the experimented thermal inhomogeneities. The thermal image obtained through the infrared camera was processed to evaluate the temperature distribution on the sample, thus identifying the hottest part and the zones characterized by reduced thermal inhomogeneity. The experimental investigation revealed specific areas of the wooden sample with higher temperatures than others. Consequently, the sections shown in Figure 4a were modeled, where S(1–3) identifies the section associated with the sensors 1, 2 and 3, S(2–8) identifies the section associated with the sensors 2, 5 and 8, and finally, S(3–9) identifies the section associated with the sensors 3, 6 and 9. Figure 4b shows the thermal boundary conditions set in the models in terms of the heat flux, temperatures and adiabatic conditions. The temperature differences among the 9 points and their spatial distribution allowed us to calculate a temperature difference per centimeter (∆T/cm), which was used for calculating the temperature distributions along the Y and Z axes (see Figure 4c). A thermal conductivity of the poplar wood equal to 0.12 W/mK was preliminarily assigned, then adjusted to 0.09 W/mK [38]. A heat flux across boundaries condition was set for the free surface of the sample, with a preliminary total heat transfer coefficient of 7.69 W/m2K, then changed to 9.67 W/m2K. It is worth observing that these changes were performed within an initial iterative process based on the experimental data. Once the model was completed, the consistency of the analysis was associated with the ratio between the horizontal heat flux component (x component) and the other ones (y and z components). The requirement applied in this study was that these ratios must be less than 5% [39].
  • Comparison between different methods for measuring heat flows: During this step, the direct and the indirect heat fluxes were compared. One approach involved the direct application of a conventional heat flux sensor (HFS) on the sample, while the other approach entailed determining the total heat transfer coefficient for the subsequent application of Newton’s cooling law within the indirect method (hereinafter defined as THM). After achieving steady-state conditions, the convective heat transfer coefficient was determined by analyzing the dimensionless groups using the surface and air temperatures and air velocities [40]. Aiming at evaluating the impact of the anemometer position, the experimental data were acquired, considering different positions of the measuring instrument. Distances from 5 to 9 cm were investigated, considering changes equal to 1 cm. Due to the spherical protecting structure of the anemometer, which does not allow the sensor to be brought close to the sample, smaller distances have not been verified. However, the theory of heat transfer by convection (dimensional group approach) specifies evaluating the free stream velocity of the fluid (therefore, at a distance such as to be outside the boundary layer).
In the context of thermal convection, the Richardson number (Ri) serves as a measure of the dominance of natural convection in comparison to forced convection. It is defined as the ratio of the Grashof (Gr) number to the Reynolds (Re) number. In the building physics field, Ri is also known as the Archimedes (Ar) number. Natural convection is characterized by an Ar much greater than 10. To obtain the convective heat transfer coefficient (hc), the Nusselt (Nu) number has to be calculated as a function of specific correlations. When natural convection arises, the following formulas available in the literature for vertical plates can be applied:
N u = 0.825 + 0.387   R a 1 6 1 + 0.492 P r 9 16 8 27 2 ,   R a  
N u = 0.68 + 0.670 R a 1 4 1 + 0.492 P r 9 16 4 9 ,   R a 10 9
N u = 0.59 × R a 1 4 ,   10 4 < R a < 10 9
N u = 0.10 × R a 1 3 ,   10 9 < R a < 10 13
where Ra is the Rayleigh number and Pr is the Prandtl number. Equation (1) was proposed by Churchill and Chu [27]. Although Equation (1) is suitable for most engineering applications, slightly better accuracy may be obtained for laminar flow by using Equation (2) [27].
Nu quantifies the heat transfer at the surface, and the thermal conductivity of air (λ) and the geometric characteristic length (L) are necessary to compute it. Here, L is the sample vertical dimension. It is known that Gr, Re and Nu depend on specific thermophysical properties. Consequently, the film temperature was progressively computed and, in turn, the thermal conductivity, kinematic viscosity, thermal expansion coefficient and Pr number were calculated using the Fluid Properties Calculator of the University of Waterloo [41].
The radiative component ( h r ) was calculated by applying the next equation:
h r = 4 ε σ T m 3
where ε is the emissivity of the sample, σ is the Stefan–Boltzmann constant and T m is the average temperature of the surface and the surrounding surfaces (here, the average between the wooden sample surface temperature and the air temperature), expressed in Kelvin [31].
The total coefficient ( h t o t ), calculated as the sum of h c and h r , was finally used for applying the Newton law of cooling within the indirect approach:
q T H M = h t o t · ( T s T a i r )
where Ts is the temperature of the free surface of the sample and T a i r is the air temperature. The comparison between the direct and indirect methods for measuring heat flows was finally carried out.
It is noteworthy to highlight that the thermal conductivity of poplar wood was adjusted using a retrospective approach based on the heat flux measured by the heat flux sensor and the temperature differential between the front and back surfaces. Additionally, the heat flux data and the temperature of the sample’s free front surface, along with air temperature data, were utilized to refine the total coefficient.
The uncertainty analysis related to the direct measurements was performed by applying a statistical approach and the propagation of uncertainty was carried out following Holman’s method for complicated data reduction [42]. The result Y is a given function of the independent variables x1, x2, , xn. Assuming that it is possible to obtain values of the uncertainties in the primary measurements, one may perturb the variables by Δx1, Δx2, …, Δxn, thus obtaining:
Y x 1 = Y ( x 1 ,   x 2 , ,   x n )
Y x 1 + x 1 = Y ( x 1 + x 1 ,   x 2 , ,   x n )
Y x 2 = Y ( x 1 , x 2 , , x n )
Y x 2 + x 2 = Y ( x 1 ,   x 2 + x 2 , ,   x n )
For small enough values of Δx, partial derivatives can be approximated as:
𝜕 Y 𝜕 x 1 Y x 1 + x 1 Y ( x 1 ) x 1
𝜕 Y 𝜕 x 2 Y x 2 + x 2 Y ( x 2 ) x 2
The uncertainty in the result can be calculated as:
w Y = 𝜕 Y 𝜕 x 1 · w 1 2 + 𝜕 Y 𝜕 x 2 · w 2 2 + + 𝜕 Y 𝜕 x n · w n 2
where w 1 ,   w 2 ,     ,   w n are the uncertainties in the independent variables. The uncertainty is reported with a coverage factor of 2, indicating a confidence of approximately 95%. A block diagram of the overall methodology is represented in Figure 5.

5. Results and Discussion

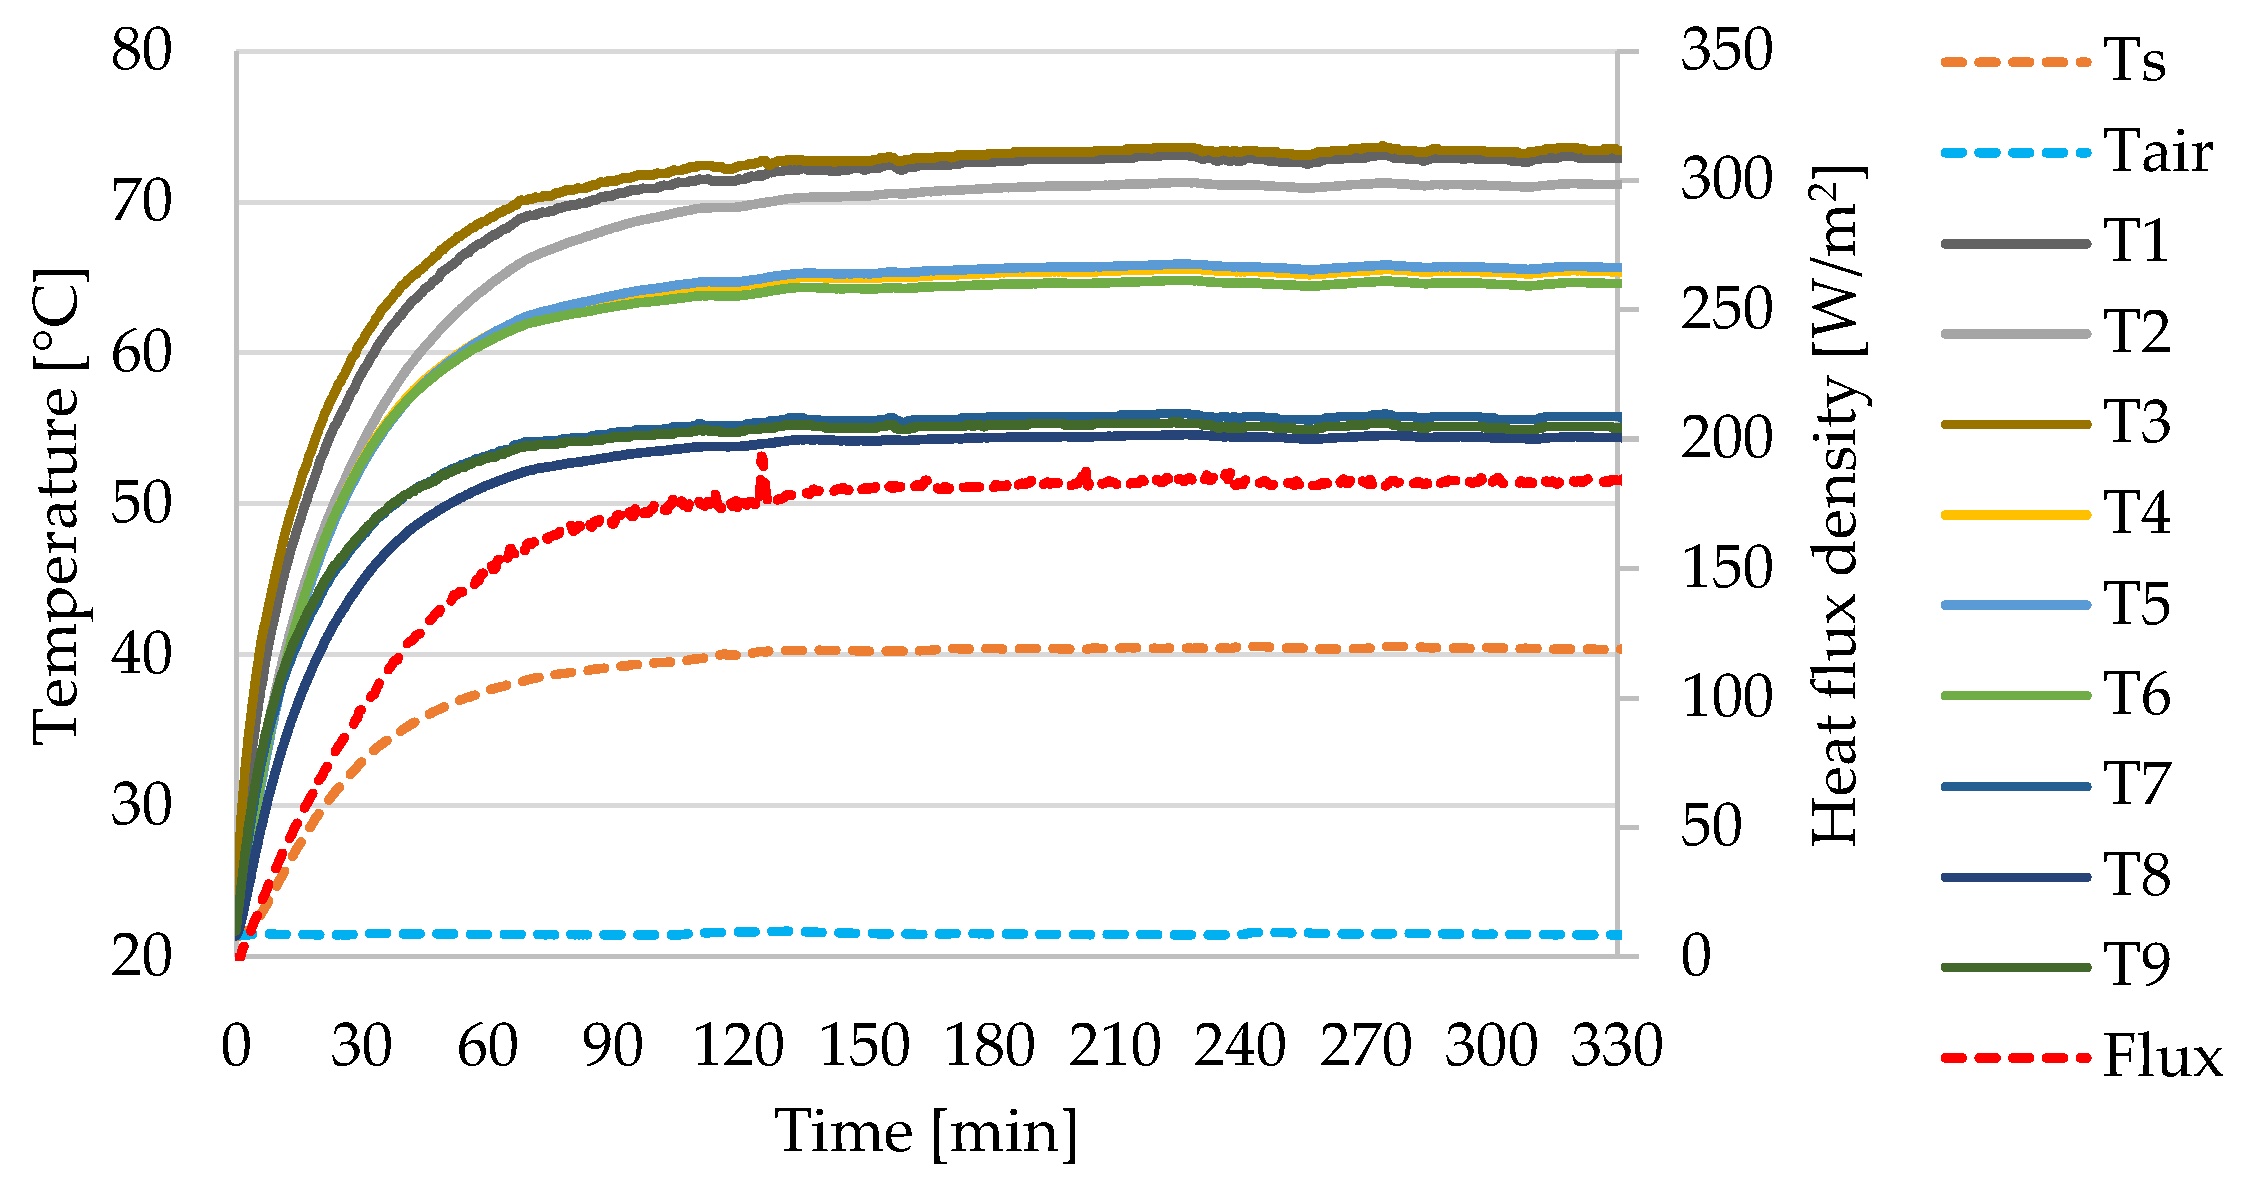
In Step 1, the heating mat was activated until reaching a state of thermal equilibrium. Figure 6 presents the experimental rear surface temperatures, and a progressive stabilization can be noticed. However, the temperature trends highlight the inhomogeneous heating of the wooden sample.
This needed Step 2, which involved constructing 2D thermal models to gain deeper insights into how temperature fluctuations impact deviations in the heat flow from one-dimensional conditions. The temperature values of the rear surface were used as input, and Figure 7 shows the results deriving from the simulations performed through Comsol. Thermal inhomogeneities caused variations in terms of the x component of the heat flux, but the temperature values reached on the rear surface of the sample produced negligible z and y components of the heat fluxes. Figure 7a, related to section S(1–3), shows Z/X heat flux ratios ranging from −0.54% to 0.41%. Figure 7b, related to S(2–8), shows Y/X ratios in the range between −5.28% and 0.10%. Finally, Figure 7c related to S(3–9), shows Y/X ratios between −4.09% and 0.08%. The highest values are associated with the lower part of the sample, characterized by less heating by the mat. Despite the thermal inhomogeneity, the temperatures reached on the back surface allow for a much greater horizontal heat flux than the components relating to the other directions.
As a further test, the experimental and simulated heat flux, and the experimental and simulated surface temperature, were compared. According to the model geometry and its boundary conditions, the simulation provided a heat flux x component ranging from 169.76 W/m2 to 177.72 W/m2, where the heat flux sensor was installed, while the experimental average value was 182.56 W/m2. By comparing the simulated and experimental heat fluxes, the percentage differences ranged from −7.01% to −2.65%. Moreover, the simulated surface temperatures, where the surface temperature probe was installed, ranged from 39.06 °C to 39.89 °C. The experimental average surface temperature of 40.39 °C allowed us to compute percentage variations ranging from −4.00% to −1.24%. The results in terms of the percentage differences allowed us to appreciate the representativeness of the model.
The thermal image obtained through the infrared camera allowed us to identify the temperature distribution of the sample and the area characterized by higher temperatures (see Figure 8a) and a reduced thermal inhomogeneity where the heat flux plate and the surface temperature probe were mounted (see Figure 8b).
Experimental data were logged during the Step 3 for the subsequent calculation of the convective and radiative coefficients. Table 2 and Table 3 list the data related to the operating conditions of the tests and the average values of the dimensionless numbers, respectively. Average surface and air temperatures equal to 40.39 °C and 21.51 °C led to an average heat flux density of 182.56 W/m2. Fairly constant air velocity values have been recorded, with an average value of 0.08 m/s.
The values of Ar identified natural convection conditions, with Ra ranging from 4.47 × 10⁷ to 4.54 × 10⁷. Consequently, Equations (1)–(3) were applied (Equation (4) does not satisfy the conditions in terms of the Ra) and Figure 9a shows the outcomes related to the convective coefficients. On the other hand, Equation (5) was applied for computing the radiative coefficients and the total coefficients were computed as the sum of the convective and radiative parts. The total coefficients within the indirect approach were obtained as a function of the different equations applied for computing the convective components (different green lines in Figure 9a).
As already mentioned, different distances of the anemometer were considered (distance identified by the black line in Figure 9a). The negligible influence of the distance of the anemometer is demonstrated by the flat trend of the curves. The total coefficients were also found by calculating the ratio between the data measured by the heat flux sensor and the surface air temperature differences (red line in Figure 9a, labeled htot(HFM)). No noteworthy differences were noted.
The heat fluxes obtained through the direct and indirect approaches are shown in Figure 9b. By comparing the red line (HFM) and the green line (THM), quite similar values can be observed, with slightly lower heat fluxes for the indirect approach when Equation (3) is applied. On the other hand, lower values can be observed when Equations (1) and (2) are employed, although in the literature the two correlations are defined as more accurate.
The total coefficients as a function of the sample–anemometer distance are listed in Table 4 as summary results. The position of the anemometer does not affect the obtained results. Almost constant convective coefficients equal to 3.37 W/m2K, 3.77 W/m2K and 4.26 W/m2K were obtained by applying Equations (1)–(3), respectively. On the other hand, an almost constant radiative coefficient of about 5.36 W/m2K was found. By considering the average total heat transfer coefficients, taking as a reference the total coefficient found by the HFM data, it is possible to identify average percentage variations equal to approximately −10% when applying Equation (1), −6% when applying Equation (2) and −1% when applying Equation (3).
The comparison between the direct and indirect methods is presented in Table 5 as a function of the distance of the anemometer. By applying the well-known formula suggested by Churchill and Chu (i.e., Equation (1)) for the calculation of Nu, the highest variations between the THM and the HFM methods were identified, showing percentage differences between approximately −9.8% and approximately −9.5%. Employing Equation (2), the percentage differences are slightly reduced, ranging from about −5.7% to about −5.4%. The use of Equation (3) returns the flow values most similar to those of the HFM method, with extremely low percentage deviations of less than 1%.
Moving from 5 cm to 9 cm, the anemometer position does not affect the results obtained. It will be necessary to carry out tests taking into consideration closer positions of the anemometer to the sample surface.

6. Conclusions

This experimental investigation aimed to provide a methodological approach for the processing of data acquired during thermal investigations, attempting to overcome the disagreement related the total heat transfer coefficient through an empirical approach based on dimensionless numbers. As a result, a hand-made setup was built for laboratory tests and direct and indirect heat flux measurements were carried out. The heat fluxes acquired through a widely used heat flux sensor were compared with those calculated through a post-processing procedure.
It was observed that the results are affected by the specific correlation adopted for computing the convective heat transfer coefficients. Satisfying results were obtained by applying the simplest equation for calculating the Nusselt number (i.e., Equation (3)), showing very low percentage differences (from −0.71% to −0.38%) if compared with the heat flow meter method. On the contrary, by applying the well-known equation proposed by Churchill and Chu (i.e., Equation (1)), higher variations were identified (from −9.82% to −9.53%). The preliminary results obtained here highlighted that applying Equation (3) is possible to accurately estimate the convective heat transfer coefficients, and in turn, the total coefficients. On the contrary, the obtained results have highlighted that the widely used Equations (4) and (5) exhibit lower accuracy in estimating the heat transfer coefficients.
Due to the anemometer’s protection cage, the minimum distance considered was found to be 5 cm, showing that the position of the sensor has no influence. Lower distances need to be examined to better assess this aspect.
These results allow us to conclude that the indirect method has room for improvement, requiring further evaluations both in laboratory conditions and in real case studies, in order to be applied within nondestructive tests, such as the thermometric method for building walls’ thermal characterization. Based on the data processing analyzed in this work, new measurement systems could be designed for automatically computing heat fluxes through an indirect approach, thus providing alternative measurement systems in the panorama of non-destructive tests. On the other hand, an improved thermometric method needs more parameters (materials emissivity and air velocity) to be evaluated. Finally, the methodological approach needs to be experimented with, considering lower temperature differences between the sample and the environment, and used in real case studies for building physics applications.

Author Contributions

Conceptualization, L.E. and C.G.; methodology, L.E., L.B., E.D.C. and C.G.; writing—original draft, L.E. and C.G.; supervision, L.E., R.D.L.V. and F.A.; investigation, L.B. and E.D.C.; formal analysis, L.B.; visualization, E.D.C. and R.D.L.V.; resources, R.D.L.V. and F.A.; writing—review and editing, F.A. All authors have read and agreed to the published version of the manuscript.

Funding

This research received no external funding.

Data Availability Statement

Data will be made available on request.

Conflicts of Interest

The authors declare no conflicts of interest.

Nomenclature

hcConvective heat transfer coefficient [W/m2K]
hrRadiative heat transfer coefficient [W/m2K]
htotTotal heat transfer coefficient [W/m2K]
qHeat flux density [W/m2]
TairAir temperature [K, °C]
TmAverage thermodynamic temperature [K]
wUncertainty in the independent variable
xIndependent variable
Acronym
HFMHeat flow meter
HFSHeat flux sensor
THMThermometric
Dimensionless numbers
ArArchimedes [-]
GrGrashof [-]
NuNusselt [-]
PrPrandtl [-]
RaRayleigh [-]
ReReynolds [-]
Greek symbols
εEmissivity [-]
σStefan–Boltzmann constant [W/m2K4]

References

  1. De Cristo, E.; Evangelisti, L.; Battista, G.; Guattari, C.; De Lieto Vollaro, R.; Asdrubali, F. Annual Comparison of the Atmospheric Urban Heat Island in Rome (Italy): An Assessment in Space and Time. Buildings 2023, 13, 2792. [Google Scholar] [CrossRef]
  2. Carvalho, J.P.; Bragança, L.; Mateus, R. Sustainable Building Design: Analysing the Feasibility of BIM Platforms to Support Practical Building Sustainability Assessment. Comput. Ind. 2021, 127, 103400. [Google Scholar] [CrossRef]
  3. Le, D.L.; Salomone, R.; Nguyen, Q.T. Circular Bio-Based Building Materials: A Literature Review of Case Studies and Sustainability Assessment Methods. Build Environ. 2023, 244, 110774. [Google Scholar] [CrossRef]
  4. Qu, D.; Cheng, L.; Bao, Y.; Gao, Y.; Zheng, X.; Qin, G. Enhanced Optical Absorption and Solar Steam Generation of CB-ATO Hybrid Nanofluids. Renew. Energy 2022, 199, 509–516. [Google Scholar] [CrossRef]
  5. Bao, Y.; Huang, A.; Zheng, X.; Qin, G. Enhanced Photothermal Conversion Performance of MWCNT/SiC Hybrid Aqueous Nanofluids in Direct Absorption Solar Collectors. J. Mol. Liq. 2023, 387, 122577. [Google Scholar] [CrossRef]
  6. Gan, V.J.L.; Deng, M.; Tse, K.T.; Chan, C.M.; Lo, I.M.C.; Cheng, J.C.P. Holistic BIM Framework for Sustainable Low Carbon Design of High-Rise Buildings. J. Clean. Prod. 2018, 195, 1091–1104. [Google Scholar] [CrossRef]
  7. Yang, Z.; Zhu, C.; Zhu, Y.; Li, X. Blockchain Technology in Building Environmental Sustainability: A Systematic Literature Review and Future Perspectives. Build. Environ. 2023, 245, 110970. [Google Scholar] [CrossRef]
  8. Hafez, F.S.; Sa’di, B.; Safa-Gamal, M.; Taufiq-Yap, Y.H.; Alrifaey, M.; Seyedmahmoudian, M.; Stojcevski, A.; Horan, B.; Mekhilef, S. Energy Efficiency in Sustainable Buildings: A Systematic Review with Taxonomy, Challenges, Motivations, Methodological Aspects, Recommendations, and Pathways for Future Research. Energy Strategy Rev. 2023, 45, 101013. [Google Scholar] [CrossRef]
  9. Abdallah, M.; El-Rayes, K. Optimizing the Selection of Building Upgrade Measures to Minimize the Operational Negative Environmental Impacts of Existing Buildings. Build. Environ. 2015, 84, 32–43. [Google Scholar] [CrossRef]
  10. Hubbert, M.K. Nuclear Energy and the Fossil Fuels; Shell Development Company, Exploration and Production Research Division: Houston, TX, USA, 1956. [Google Scholar]
  11. Azkorra-Larrinaga, Z.; Erkoreka-González, A.; Martín-Escudero, K.; Pérez-Iribarren, E.; Romero-Antón, N. Thermal Characterization of a Modular Living Wall for Improved Energy Performance in Buildings. Build. Environ. 2023, 234, 110102. [Google Scholar] [CrossRef]
  12. Lucchi, E. Thermal Transmittance of Historical Brick Masonries: A Comparison among Standard Data, Analytical Calculation Procedures, and in Situ Heat Flow Meter Measurements. Energy Build. 2017, 134, 171–184. [Google Scholar] [CrossRef]
  13. Nardi, I.; de Rubeis, T.; Perilli, S. Ageing Effects on the Thermal Performance of Two Different Well-Insulated Buildings. Energy Procedia 2016, 101, 1050–1057. [Google Scholar] [CrossRef]
  14. Antonyová, A.; Korjenic, A.; Antony, P.; Korjenic, S.; Pavlušová, E.; Pavluš, M.; Bednar, T. Hygrothermal Properties of Building Envelopes: Reliability of the Effectiveness of Energy Saving. Energy Build. 2013, 57, 187–192. [Google Scholar] [CrossRef]
  15. Staszczuk, A.; Kuczyński, T. The Impact of Wall and Roof Material on the Summer Thermal Performance of Building in a Temperate Climate. Energy 2021, 228, 120482. [Google Scholar] [CrossRef]
  16. García de Diego, M.D.L.; Gómez Muñoz, G.; Román López, E. Towards New Energy Accounting in Residential Building. Inf. Constr. 2015, 67, m028. [Google Scholar] [CrossRef]
  17. Teni, M.; Krstić, H.; Kosiński, P. Review and Comparison of Current Experimental Approaches for In-Situ Measurements of Building Walls Thermal Transmittance. Energy Build. 2019, 203, 109417. [Google Scholar] [CrossRef]
  18. Evangelisti, L.; Scorza, A.; De Lieto Vollaro, R.; Sciuto, S.A. Comparison between Heat Flow Meter (HFM) and Thermometric (THM) Method for Building Wall Thermal Characterization: Latest Advances and Critical Review. Sustainability 2022, 14, 693. [Google Scholar] [CrossRef]
  19. Bienvenido-Huertas, D.; Moyano, J.; Marín, D.; Fresco-Contreras, R. Review of in Situ Methods for Assessing the Thermal Transmittance of Walls. Renew. Sustain. Energy Rev. 2019, 102, 356–371. [Google Scholar] [CrossRef]
  20. Swain, A.; Das, M.K. Flow Boiling of Distilled Water over Plain Tube Bundle with Uniform and Varying Heat Flux along the Height of the Tube Bundle. Exp. Therm. Fluid Sci. 2017, 82, 222–230. [Google Scholar] [CrossRef]
  21. Sun, C.-Z.; Liu, L.; Li, Y.-X.; Zhu, J.-L. Research on the Falling Film Flow and Heat Transfer Characteristics of FLNG Spiral Wound Heat Exchanger under Sea Conditions. Pet Sci. 2022, 19, 1276–1290. [Google Scholar] [CrossRef]
  22. Xue, W.; Wang, Y.; Liang, Y.; Wang, T.; Ren, B. Efficient Hydraulic and Thermal Simulation Model of the Multi-Phase Natural Gas Production System with Variable Speed Compressors. Appl. Therm. Eng. 2024, 242, 122411. [Google Scholar] [CrossRef]
  23. Ohlsson, K.E.A.; Olofsson, T. Quantitative Infrared Thermography Imaging of the Density of Heat Flow Rate through a Building Element Surface. Appl. Energy 2014, 134, 499–505. [Google Scholar] [CrossRef]
  24. Fokaides, P.A.; Kalogirou, S.A. Application of Infrared Thermography for the Determination of the Overall Heat Transfer Coefficient (U-Value) in Building Envelopes. Appl. Energy 2011, 88, 4358–4365. [Google Scholar] [CrossRef]
  25. Nardi, I.; Lucchi, E.; de Rubeis, T.; Ambrosini, D. Quantification of Heat Energy Losses through the Building Envelope: A State-of-the-Art Analysis with Critical and Comprehensive Review on Infrared Thermography. Build. Environ. 2018, 146, 190–205. [Google Scholar] [CrossRef]
  26. Tejedor, B.; Casals, M.; Gangolells, M. Assessing the Influence of Operating Conditions and Thermophysical Properties on the Accuracy of In-Situ Measured U -Values Using Quantitative Internal Infrared Thermography. Energy Build. 2018, 171, 64–75. [Google Scholar] [CrossRef]
  27. Roque, E.; Vicente, R.; Almeida, R.M.S.F.; Mendes da Silva, J.; Vaz Ferreira, A. Thermal Characterisation of Traditional Wall Solution of Built Heritage Using the Simple Hot Box-Heat Flow Meter Method: In Situ Measurements and Numerical Simulation. Appl. Therm. Eng. 2020, 169, 114935. [Google Scholar] [CrossRef]
  28. Asdrubali, F.; Baldinelli, G. Thermal Transmittance Measurements with the Hot Box Method: Calibration, Experimental Procedures, and Uncertainty Analyses of Three Different Approaches. Energy Build. 2011, 43, 1618–1626. [Google Scholar] [CrossRef]
  29. Andújar Márquez, J.; Martínez Bohórquez, M.; Gómez Melgar, S. A New Metre for Cheap, Quick, Reliable and Simple Thermal Transmittance (U-Value) Measurements in Buildings. Sensors 2017, 17, 2017. [Google Scholar] [CrossRef]
  30. Evangelisti, L.; Barbaro, L.; De Cristo, E.; Guattari, C.; D’Orazio, T. Towards an Improved Thermometric Method: Convective and Radiative Heat Transfer for Heat Flux Measurement through an Indirect Approach. Therm. Sci. Eng. Prog. 2024, 49, 102479. [Google Scholar] [CrossRef]
  31. ISO 6946:2017; Building Components and Building Elements Thermal Resistance and Thermal Transmittance Calculation Methods. ISO: Geneva, Switzerland, 2017.
  32. Peng, C.; Wu, Z. In Situ Measuring and Evaluating the Thermal Resistance of Building Construction. Energy Build. 2008, 40, 2076–2082. [Google Scholar] [CrossRef]
  33. Cesaratto, P.G.; De Carli, M.; Marinetti, S. Effect of Different Parameters on the in Situ Thermal Conductance Evaluation. Energy Build. 2011, 43, 1792–1801. [Google Scholar] [CrossRef]
  34. Meng, X.; Yan, B.; Gao, Y.; Wang, J.; Zhang, W.; Long, E. Factors Affecting the in Situ Measurement Accuracy of the Wall Heat Transfer Coefficient Using the Heat Flow Meter Method. Energy Build. 2015, 86, 754–765. [Google Scholar] [CrossRef]
  35. Hoffmann, C.; Geissler, A. The Prebound-Effect in Detail: Real Indoor Temperatures in Basements and Measured versus Calculated U-Values. Energy Procedia 2017, 122, 32–37. [Google Scholar] [CrossRef]
  36. Trethowen, H. Measurement Errors with Surface-Mounted Heat Flux Sensors. Build. Environ. 1986, 21, 41–56. [Google Scholar] [CrossRef]
  37. Bienvenido-Huertas, D. Assessing the Environmental Impact of Thermal Transmittance Tests Performed in Façades of Existing Buildings: The Case of Spain. Sustainability 2020, 12, 6247. [Google Scholar] [CrossRef]
  38. Çavuş, V.; Şahin, S.; Esteves, B.; Ayata, Ü. Determination of Thermal Conductivity Properties in Some Wood Species Obtained from Turkey. Bioresources 2019, 14, 6709–6715. [Google Scholar] [CrossRef]
  39. Guattari, C.; Evangelisti, L.; Gori, P.; Asdrubali, F. Influence of Internal Heat Sources on Thermal Resistance Evaluation through the Heat Flow Meter Method. Energy Build. 2017, 135, 187–200. [Google Scholar] [CrossRef]
  40. Bergman, L.; Lavine, S.; Incropera, P.; Dewitt, P. Fundamentals of Heat and Mass Transfer, 7th ed.; John Wiley & Sons: Hoboken, NJ, USA; ISBN 13 978-0470-50197-9.
  41. Fluid Properties Calculator. Available online: http://www.mhtl.uwaterloo.ca/old/onlinetools/airprop/airprop.html (accessed on 8 April 2024).
  42. Holman, J.P. Experimental Methods for Engineers, 8th ed.; McGraw-Hill Series in Mechanical Engineering; McGraw Hill Higher Education: New York, NY, USA, 2012. [Google Scholar]
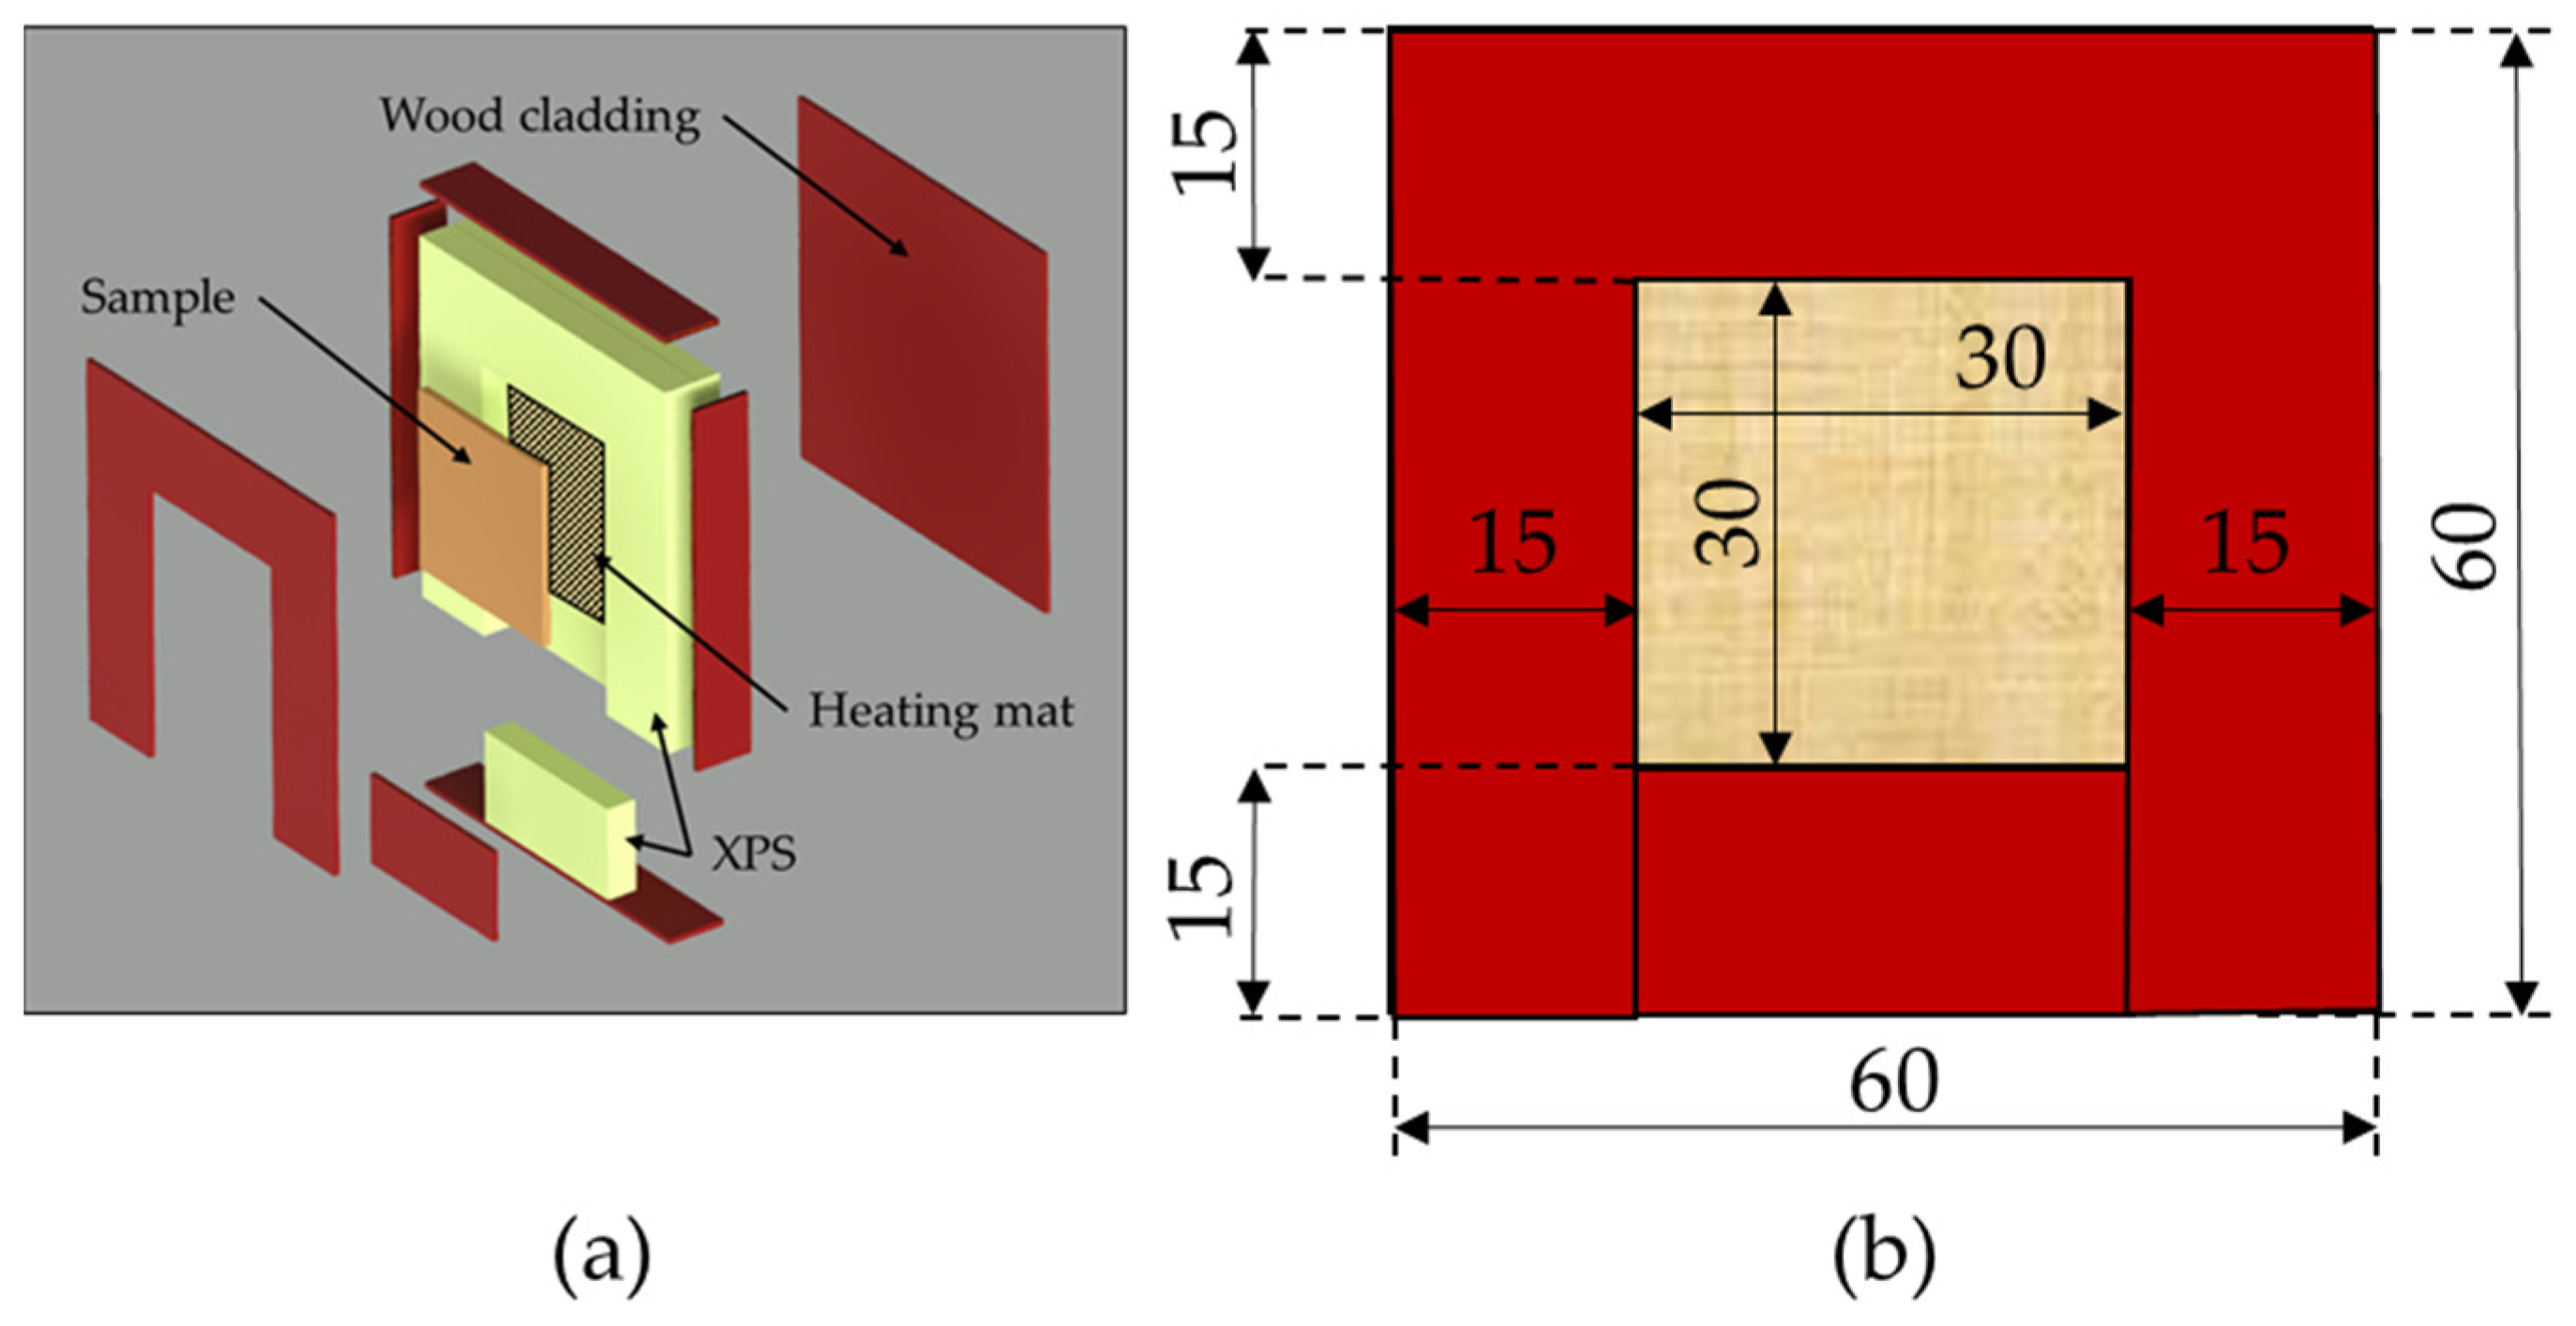
Figure 1. The 3D exploded view of the structure (a); dimensions of the apparatus in cm (b).
Energies 17 02961 g001
Figure 2. Internal insulating structure made of XPS (a) and the whole assembly (b).
Energies 17 02961 g002
Figure 3. Schematic depiction of the experimental configuration showcasing the positioning of the contact temperature sensors across the rear surface of the specimen.
Energies 17 02961 g003
Figure 4. Sections associated with the rear sensors (a); thermal boundary conditions set in the simulation model (b); temperature distribution applied as input in the simulation model (c).
Energies 17 02961 g004
Figure 5. Flowchart of the methodology.
Energies 17 02961 g005
Figure 6. Rear temperatures and heat flux density data while the heating mat is on.
Energies 17 02961 g006
Figure 7. Heat flux components and heat flux ratio for the modeled sections: (a) section S(1–3); (b) section S(2–8); and (c) section S(3–9).
Energies 17 02961 g007
Figure 8. (a) Thermal image obtained through the infrared camera: the scale specifies the temperature range from 20.3 °C to 42.0 °C; point marker at 39.98 °C; rectangle marker shows a variation from 38.87 °C to 42.01 °C. (b) Sensors’ position.
Energies 17 02961 g008
Figure 9. (a) Convective, radiative and total coefficients, and (b) the heat flux density obtained through the THM and HFM approaches.
Energies 17 02961 g009
Table 1. Technical specifications of the equipment.
Sensor/Measurement InstrumentManufacturerModelMeasuring RangeResolution
Heat flux sensorHuksefluxHFP01−2000 to 2000 W/m260 × 10−6 V/(W/m2)
Surface temperature sensorLSIEST124−60 to +80 °C0.01 °C
Air temperature sensorLSIEST033−50 to 70 °C0.01 °C
Hot-wire anemometerTESTO0628 01520 to 5 m/s0.01 m/s
Thermal imaging cameraFlukeTi480 PRO−10 to 1000 °C0.1 °C
Table 2. Operating conditions during the measurements.
Anemometer
Distance [cm]
Heat Flux HFM
[W/m2]
Surface
Temperature [°C]
Air
Velocity [m/s]
Air
Temperature [°C]
5180.34 ± 0.3740.27 ± 0.010.08 ± 0.0121.57 ± 0.02
6182.33 ± 0.3440.39 ± 0.010.08 ± 0.0121.50 ± 0.01
7183.78 ± 0.2340.43 ± 0.010.08 ± 0.0121.45 ± 0.01
8182.89 ± 0.1540.44 ± 0.010.07 ± 0.0121.55 ± 0.01
9183.47 ± 0.1340.42 ± 0.010.08 ± 0.0121.48 ± 0.01
Table 3. Dimensionless groups’ average values.
Anemometer
Distance
[cm]
GrPrReArRaNu (Equation (1))Nu (Equation (2))Nu (Equation (3))
56.27 × 1077.14 × 10−11.40 × 1033.42 × 1014.47 × 1073.82 × 1014.28 × 1014.82 × 101
66.33 × 1077.14 × 10−11.42 × 1033.41 × 1014.52 × 1073.83 × 1014.29 × 1014.84 × 101
76.36 × 1077.14 × 10−11.43 × 1033.39 × 1014.54 × 1073.84 × 1014.29 × 1014.84 × 101
86.33 × 1077.14 × 10−11.37 × 1033.58 × 1014.51 × 1073.83 × 1014.29 × 1014.84 × 101
96.34 × 1077.14 × 10−11.42 × 1033.37 × 1014.53 × 1073.84 × 1014.29 × 1014.84 × 101
Table 4. Heat transfer coefficients as a function of the sample–anemometer distance.
Anemometer
Distance
[cm]
Total
THM Equation (1)
[W/m2K]
Total
THM Equation (2)
[W/m2K]
Total
THM Equation (3)
[W/m2K]
Total
HFM
[W/m2K]
58.72 ± 0.019.12 ± 0.019.60 ± 0.019.64 ± 0.01
68.73 ± 0.019.13 ± 0.019.62 ± 0.019.65 ± 0.02
78.74 ± 0.019.13 ± 0.019.62 ± 0.019.68 ± 0.01
88.73 ± 0.019.13 ± 0.019.62 ± 0.019.68 ± 0.01
98.74 ± 0.019.13 ± 0.019.62 ± 0.019.69 ± 0.01
Table 5. Heat flux comparison: direct (HFM) and indirect (THM) approaches and average percentage variations.
Anemometer Distance
[cm]
Heat Flux HFM
[W/m2]
Heat Flux THM
Equation (1) [W/m2]
Heat Flux THM
Equation (2) [W/m2]
Heat Flux THM
Equation (3) [W/m2]
5180.34 ± 0.37163.11 ± 0.52170.60 ± 0.54179.64 ± 0.56
6182.33 ± 0.34164.99 ± 0.24172.51 ± 0.24181.67 ± 0.25
7183.78 ± 0.23165.83 ± 0.17173.37 ± 0.18182.59 ± 0.19
8182.89 ± 0.15165.05 ± 0.55172.58 ± 0.57181.74 ± 0.60
9183.47 ± 0.13165.45 ± 0.36172.99 ± 0.38182.18 ± 0.39
Disclaimer/Publisher’s Note: The statements, opinions and data contained in all publications are solely those of the individual author(s) and contributor(s) and not of MDPI and/or the editor(s). MDPI and/or the editor(s) disclaim responsibility for any injury to people or property resulting from any ideas, methods, instructions or products referred to in the content.