Article

Analysis of Pressure Fluctuation of a Pump-Turbine with Splitter Blades on Small Opening in Turbine Mode

1
Pumped-Storage Technological & Economic Research Institute State Grid Xinyuan Company Ltd., Beijing 100053, China
2
China Institute of Water Resources and Hydropower Research, Beijing 100048, China
3
State Key Laboratory of Hydroscience and Engineering, Department of Energy and Power Engineering, Tsinghua University, Beijing 100084, China
*
Author to whom correspondence should be addressed.
Energies 2024, 17(12), 2957; https://doi.org/10.3390/en17122957
Submission received: 8 May 2024 / Revised: 6 June 2024 / Accepted: 11 June 2024 / Published: 15 June 2024
(This article belongs to the Section A3: Wind, Wave and Tidal Energy)

Abstract

:
Unstable flow in a pump-turbine can cause pressure pulsation, and the resulting vibration deteriorates the stability and operating safety of the unit. This study conducted three-dimensional numerical calculations of the overall flow passage of a pump-turbine with splitter blades under the small guide vane opening, and the unsteady flow characteristics of the turbine were investigated. The results showed that the pressure fluctuation was more severe at lower head operating conditions with lower efficiency, especially in the vaneless area (the runner blade passages). Under the lower head condition, the proportion of 12 times the rotational frequency (12 f/fn) increased in the vaneless area, and the amplitude of 1 f/fn as well as 2 f/fn became larger in the runner blade channel, with more space occupied by vortices and reflux areas. A spiral vortex rope formed in the draft tube, increasing the proportion of 0.4 f/fn and 0.7 f/fn pressure pulses.

1. Introduction

With the incorporation of a net zero target into its integrated plan for ecological development, China’s energy structure is transforming towards a low-carbon orientation [1,2,3]. The prosperous development of renewable wind, solar, and hydraulic energy will greatly contribute to China’s energy revolution [4,5]. However, due to inconsistency in power generation, the limitations of wind and solar power have become an inevitable issue in the development of renewable energies [6]. Pumped storage power stations could regulate and stabilize the power grid, and play an important role in stabilizing a new power system where large-scale wind and solar energy are integrated with hydropower [7,8,9]. As for hydropower units, researchers have concluded that the dominant frequency component of pressure pulsation is the key factor inducing vibration within hydro units and even power stations, so the analysis of pressure pulsation is of great practical significance [10,11,12,13,14].
In studies focusing on splitter blade runners, Kazumasa Kubota [15] analyzed Toshiba’s splitter blade runners and pointed out that the splitter blades helped reduce the size of the unit, and improved its efficiency as well as cavitation performance. Kassanos et al. [16,17] suggested that small changes to the shape of the splitter blades could effectively improve their performance under partial loads, thus minimizing the impact of the vortex zone in the draft tube. Meng et al. [18] found that efficiency was highest when the length ratio of the splitter blade to the long blade was 0.75, and the pressure pulsation performance significantly improved at length ratio 0.825, when taking hydraulic efficiency into account. Song et al. [19] suggested better efficiency with an array combining six long blades with six splitter blades, and the optimal ratio of the long blade bone line outlet edge diameter to the splitter blade bone line outlet edge diameter was 2/3, based on which Hu et al. [20,21] performed an in-depth study of the influence of various parameters on the pressure pulsation characteristics as well as the S characteristics of splitter blade pump-turbines, coming up with a summary of general design laws of splitter blades.
In studies focusing on pressure pulsation, Yin et al. [22] suggested that the amplitude and frequency characteristics of pressure pulsation caused by rotor-stator interaction (RSI) could be accurately predicted by using the sliding surface model for unsteady simulation. Wang et al. [23] mainly studied pressure pulsation in the vaneless area, and found the pressure pulsation amplitude in the vaneless area decreased with increasing load while increasing with speed at a constant load. Wang et al. [24] pointed out that when considering compressibility, the pressure pulsation amplitude in the vaneless area of S characteristics was larger than the case excluding compressibility, while the pressure pulsation amplitude first increased and then dropped as the unit flow decreased. A practical k-ε turbulence model could gain more accuracy in predicting pressure pulsation for large openings. They also found that the dominant frequency of pressure pulsation in the vaneless area was the high-frequency component of the vane frequency, while the dominant frequency of the draft tube vortex zone was lower [24]. Researchers [25,26,27,28,29] considered that the internal flow characteristics were closely related to pressure pulsation, and the reflux and vortex generated in the flow could lead to violent pressure pulsation.
In this paper, numerical simulation has been conducted to analyze the flow characteristics and pressure pulsation of the splitter blade runner for a pumped storage unit under different water heads. The causes of unstable flow are discussed to further optimize pressure pulsation performance.

2. Numerical Model and Mathematical Model

2.1. Computational Domain

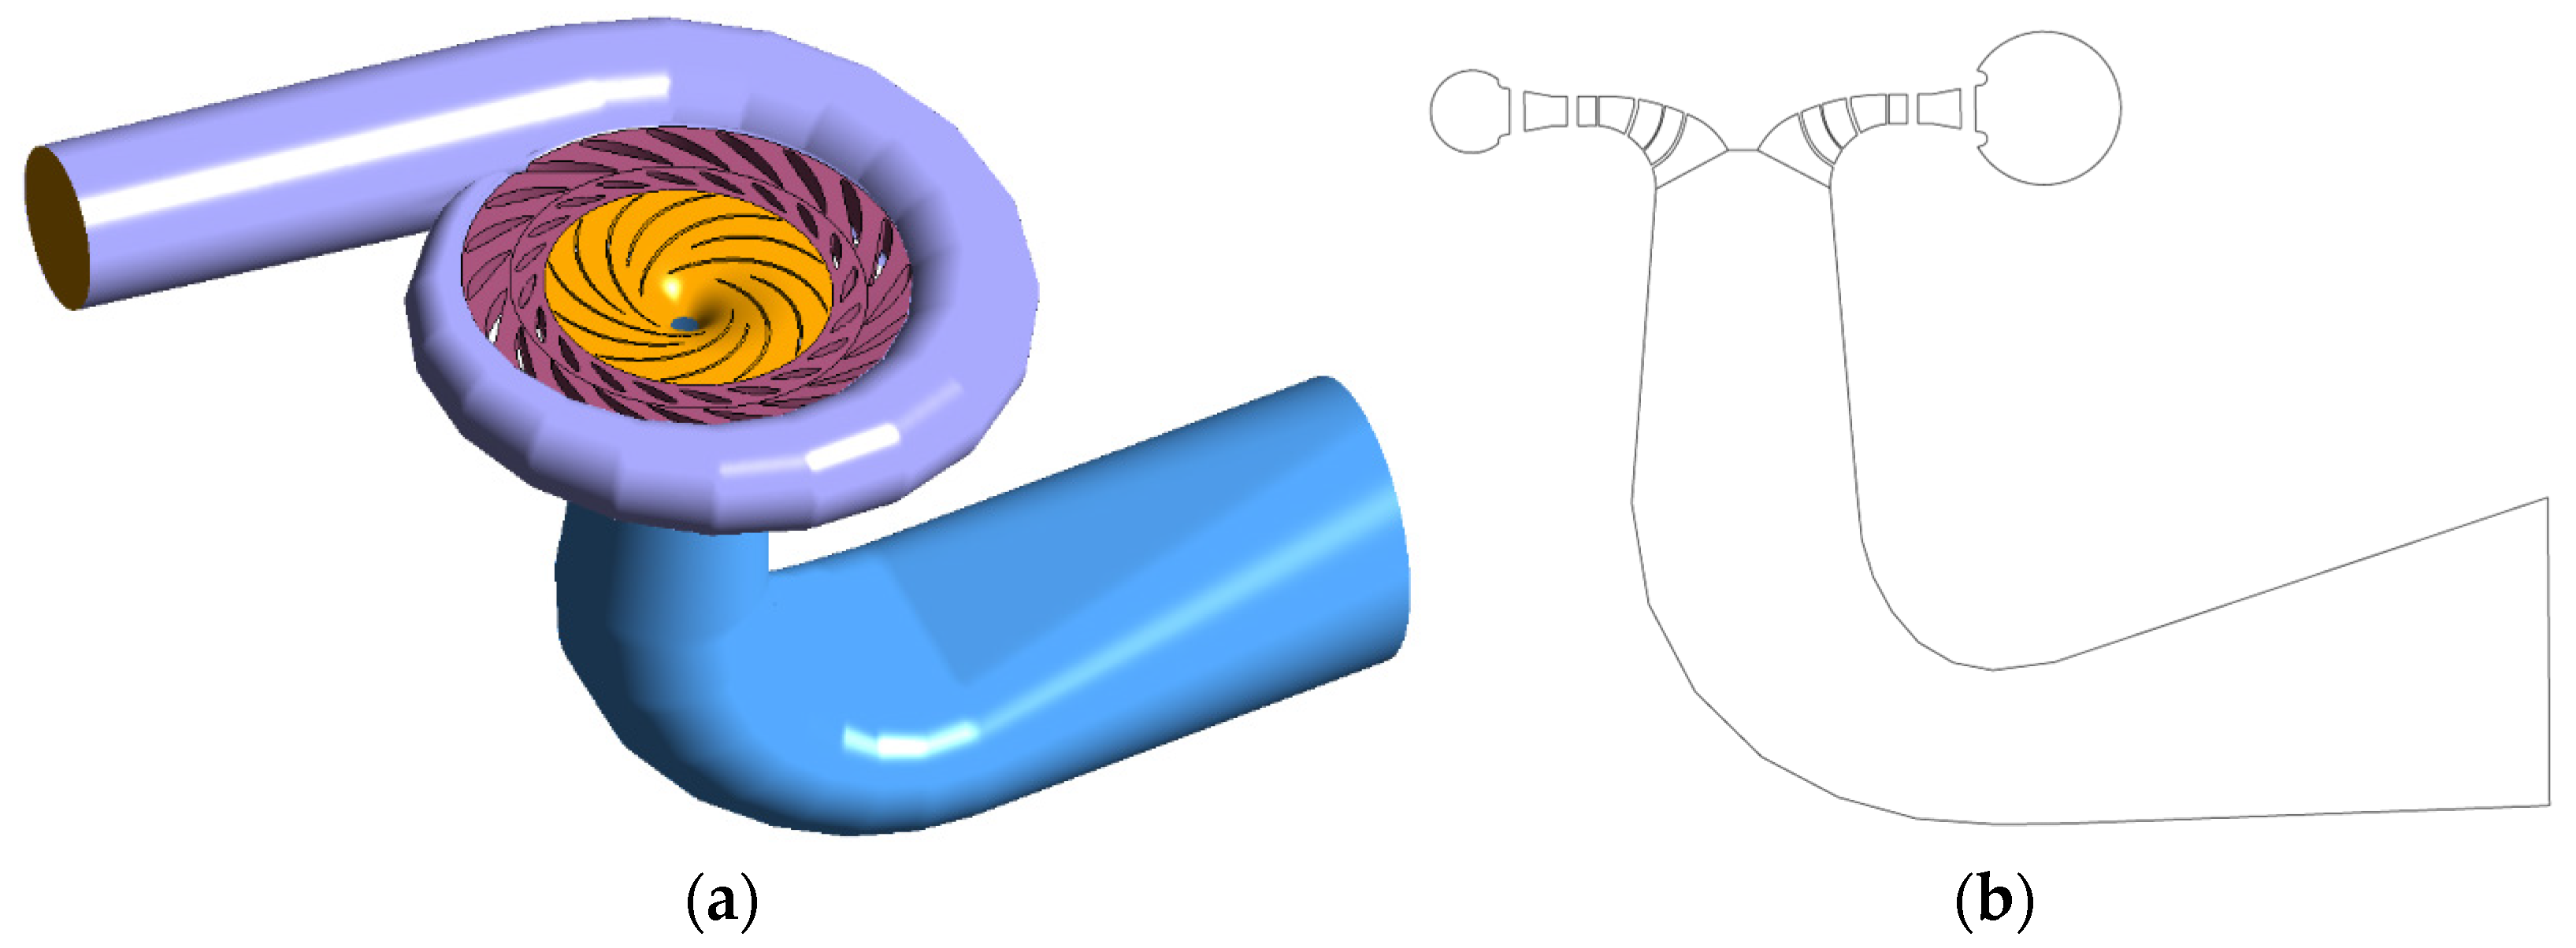
A pump-turbine with 6 splitter blades was set up based on a prototype pumped storage unit. The prototype runner diameter is 3.89 m, with 12 blades, 20 guide vanes and 20 stay vanes. The guide vane distribution diameter is 4.43 m, the runner shroud diameter is 2.31 m, the runner inlet height is 0.38 m, and the suction head of the pumping mode is about 7 m. The rated discharge and the rated power of the pump-turbine are 68 m3/s and 300 MW, respectively. In turbine mode, the design head is 500 m, while the head in pump mode ranges between 520 m and 545 m. The rated speed is 500 rpm. The flow passage of the turbine with splitter blades includes the volute, guide vanes, stay vanes and draft tube domains. The entire 3D flow passage and the meridional section is shown in Figure 1.
The optimal guide vane opening was 22° for turbine mode. Five operating conditions of the turbine mode were selected with a small opening of 18°. The predicted and experimental head-efficiency curve of the turbine with splitter blades was obtained by steady simulations, as shown in Figure 2. The turbine hydraulic efficiency was about 93% in the small-opening operating condition where the optimal efficiency point is at a head of 1.12 H, in which H is the design operating head. The efficiency rapidly decreased with a head lower or larger than H. The trend of predicted and experimental results is in good agreement. Under the design head and large head conditions, the efficiency error is small. The smaller the operating head is, the larger the hydraulic efficiency error of prediction and test will be. Therefore, the two operating conditions of H and 0.9 H head in Figure 2 were selected for unsteady simulation to analyze the reasons for the rapid decline of hydraulic efficiency and the pressure pulsation in the overall flow domain. The parameters of the two conditions are shown in Table 1.

2.2. Mesh and Boundary Conditions

The volute was meshed with unstructured tetrahedral elements, while the draft tube, stay vane, guide vane and runner were all meshed with hexahedral meshes. The grid independence verification took efficiency as the reference index to ensure that the efficiency of the calculated pump-turbine varied less than 0.2% with different densities of grids. Finally, a grid scheme of 5.41 million was configured, in which 1.49 million elements for volute, 1.12 million elements for stay vane, 0.85 million elements for guide vanes, 1.56 million elements for the runner and 0.39 million elements for the draft tube was set. The grids for flow components are shown in Figure 3.
The commercial software CFX was used to perform numerical simulation. For steady simulation, it was assumed that all the pump-turbine walls are hydraulically smooth. The non-slip boundary condition was adopted. The sliding mesh model was applied at the interface to simulate the rotor-stator relative motion. To close the RANS equations, the standard k-epsilon turbulence model was applied in the unsteady simulation. The y+ of the first layer of the mesh near the wall was in the range of 30~100 to ensure the application of the wall function. In the turbine condition where the volute served as the inflowing component, the inlet boundary condition was the pressure inlet. The draft tube served as the outflowing component, and the outlet boundary was configured with zero average static pressure.
The initial condition for the unsteady simulation was the entire case data of the flow domain after the convergence of the steady simulation. The time step of the unsteady simulation was ΔT = 0.0012 s, which was 1/100 of the runner rotational period. The sampling frequency was ΔT, which meant that the required data file was saved for each unsteady simulation step. To correctly predict irregular flow behavior in the overall flow passage, an unsteady simulation of about 2000 time steps was performed at each operating condition. The data of the last 1000 steps of the simulation time were processed and analyzed. The pressures were converted to heads at various frequencies. The dominant relative frequency (f/fn) and the pulse amplitude at this frequency were then calculated by fast Fourier transforms (FFT).

2.3. Arrangement of the Pressure Pulsation Monitor Points

The setup of pressure monitor points was performed to monitor the pressure pulsation at key locations in the flow channel in unsteady simulations. In Figure 4a, the gv monitor points are in the vaneless area between the guide vane and the runner. The sgv monitor points are located between the stay vane and the guide vane. The sv monitor points are located inside the stay vane domain. The four monitor points of gv1 to gv4 are distributed at the same radial position, with a phase difference of 90° between adjacent points. The layout of sgv and sv monitor points is similar to that of gv monitor points.
The distribution of pressure monitor points in the rotating runner is shown in Figure 4b. The six long blades are named R1–R6 counterclockwise. Only the monitoring points in the channel on both R1 sides are listed in Figure 4b, while the distribution of monitor points are identical for the rest of the long blade channels, in which RP1A-RP1H and RS1A-RS1H monitor points are arranged from the runner inlet to the outlet, where the RP1 series represents the blade pressure side and the RS1 series represents the blade suction side. All monitor points in the runner and guide vane are on the 0.5-span turbo surface.
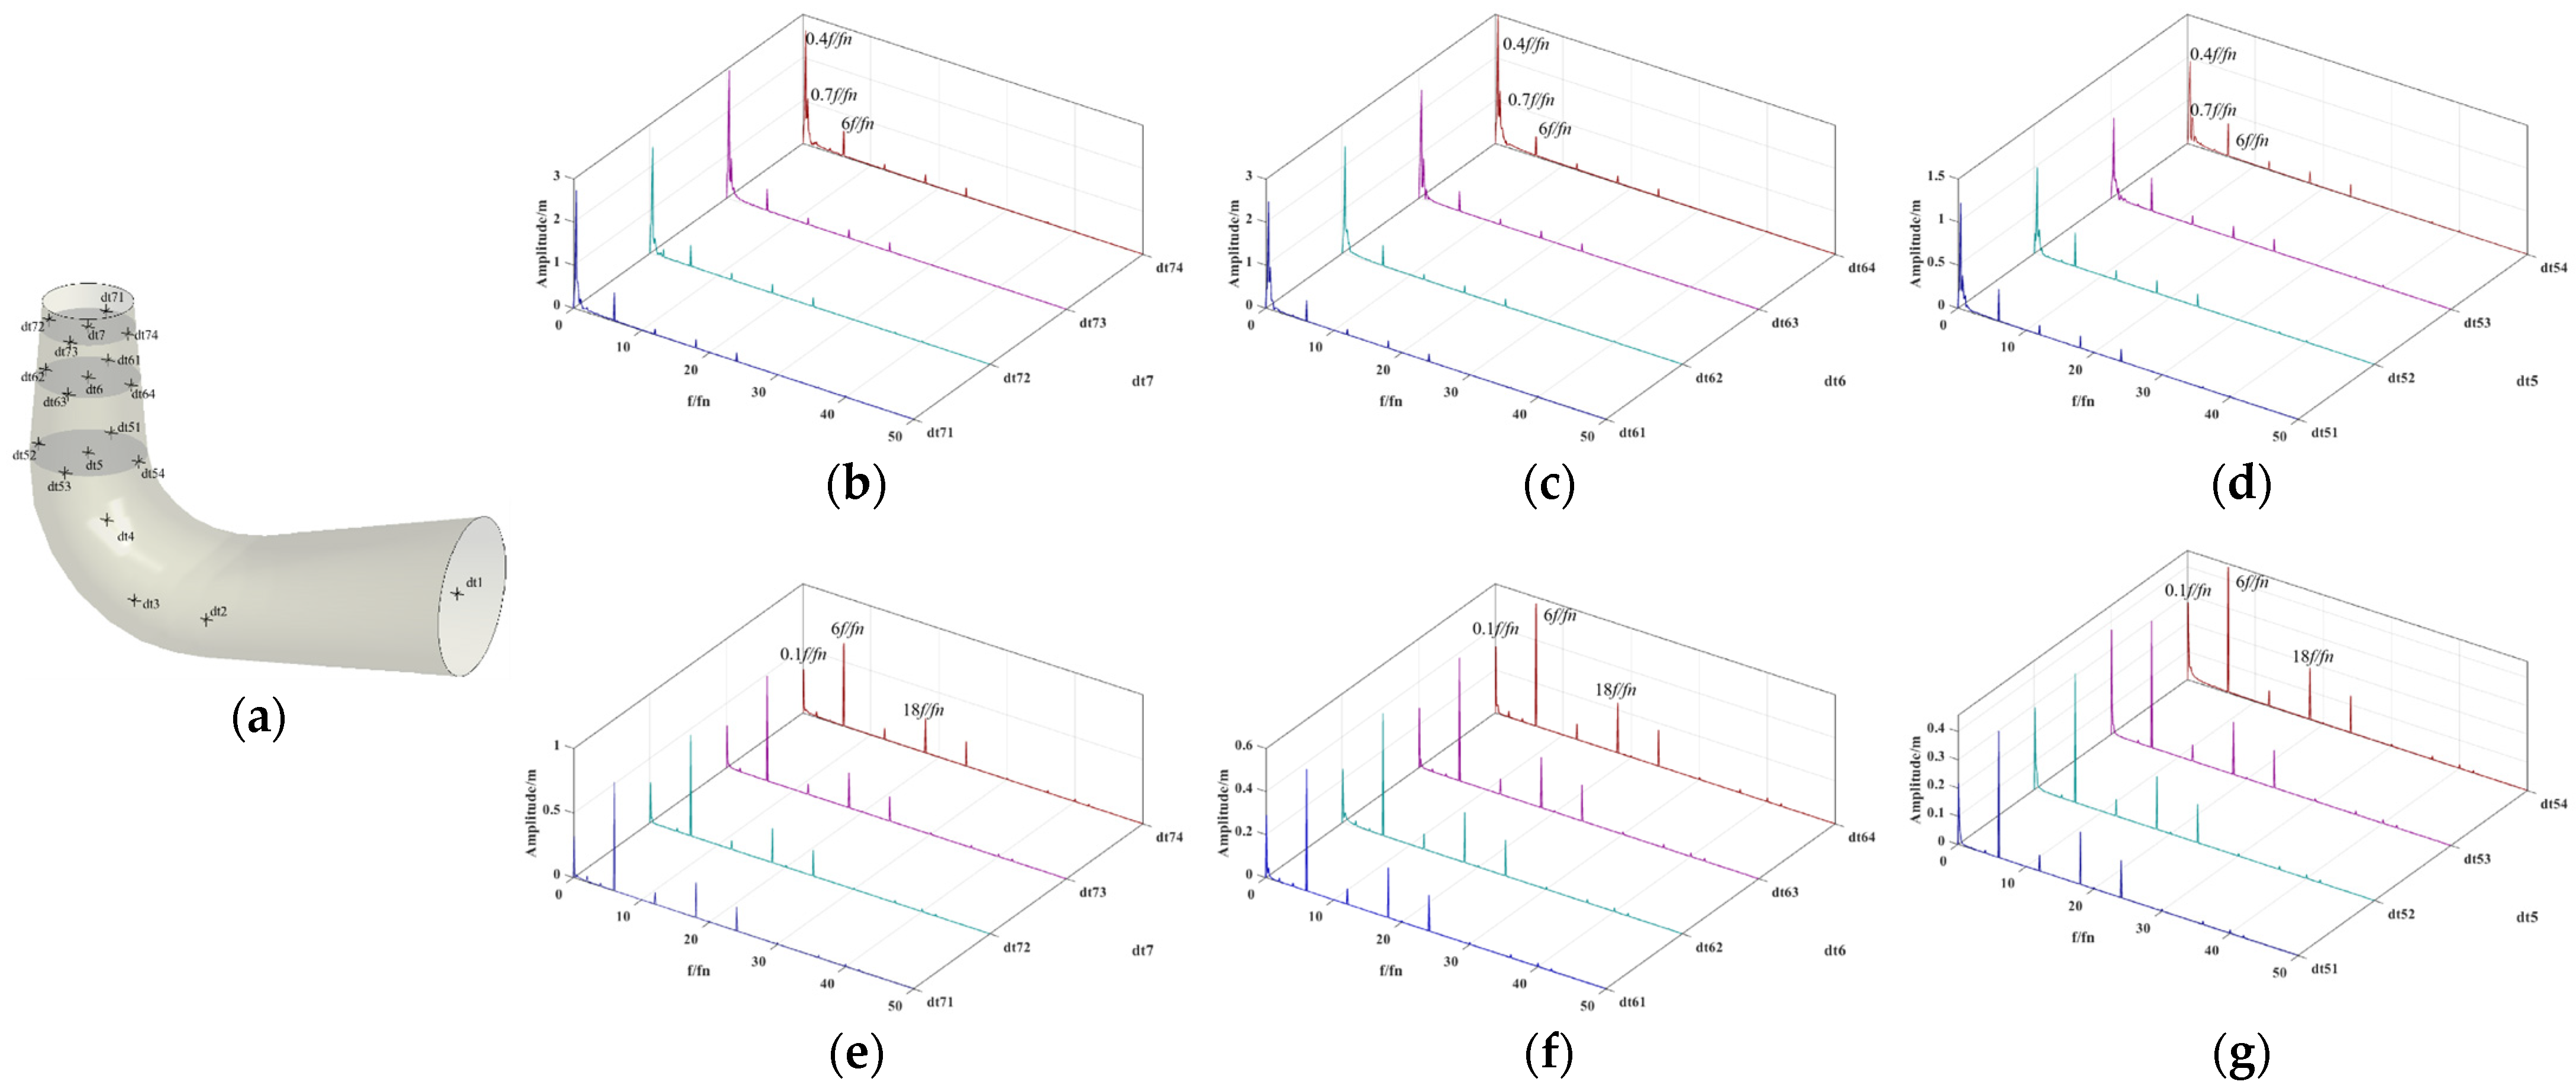
Figure 4c shows the distribution of monitor points in the draft tube, which are named DT7–DT1 from the inlet to the outlet. All the monitor points in the draft tube are on the meridian surface of the draft tube. Four more monitor points located on the wall of the draft tube are arranged on the cross-section where the three monitor points of DT7–DT5 are located, such as DT71–DT74.

3. Comparison and Analysis of the Results

3.1. The Flow Behavior of the Steady Numerical Simulation

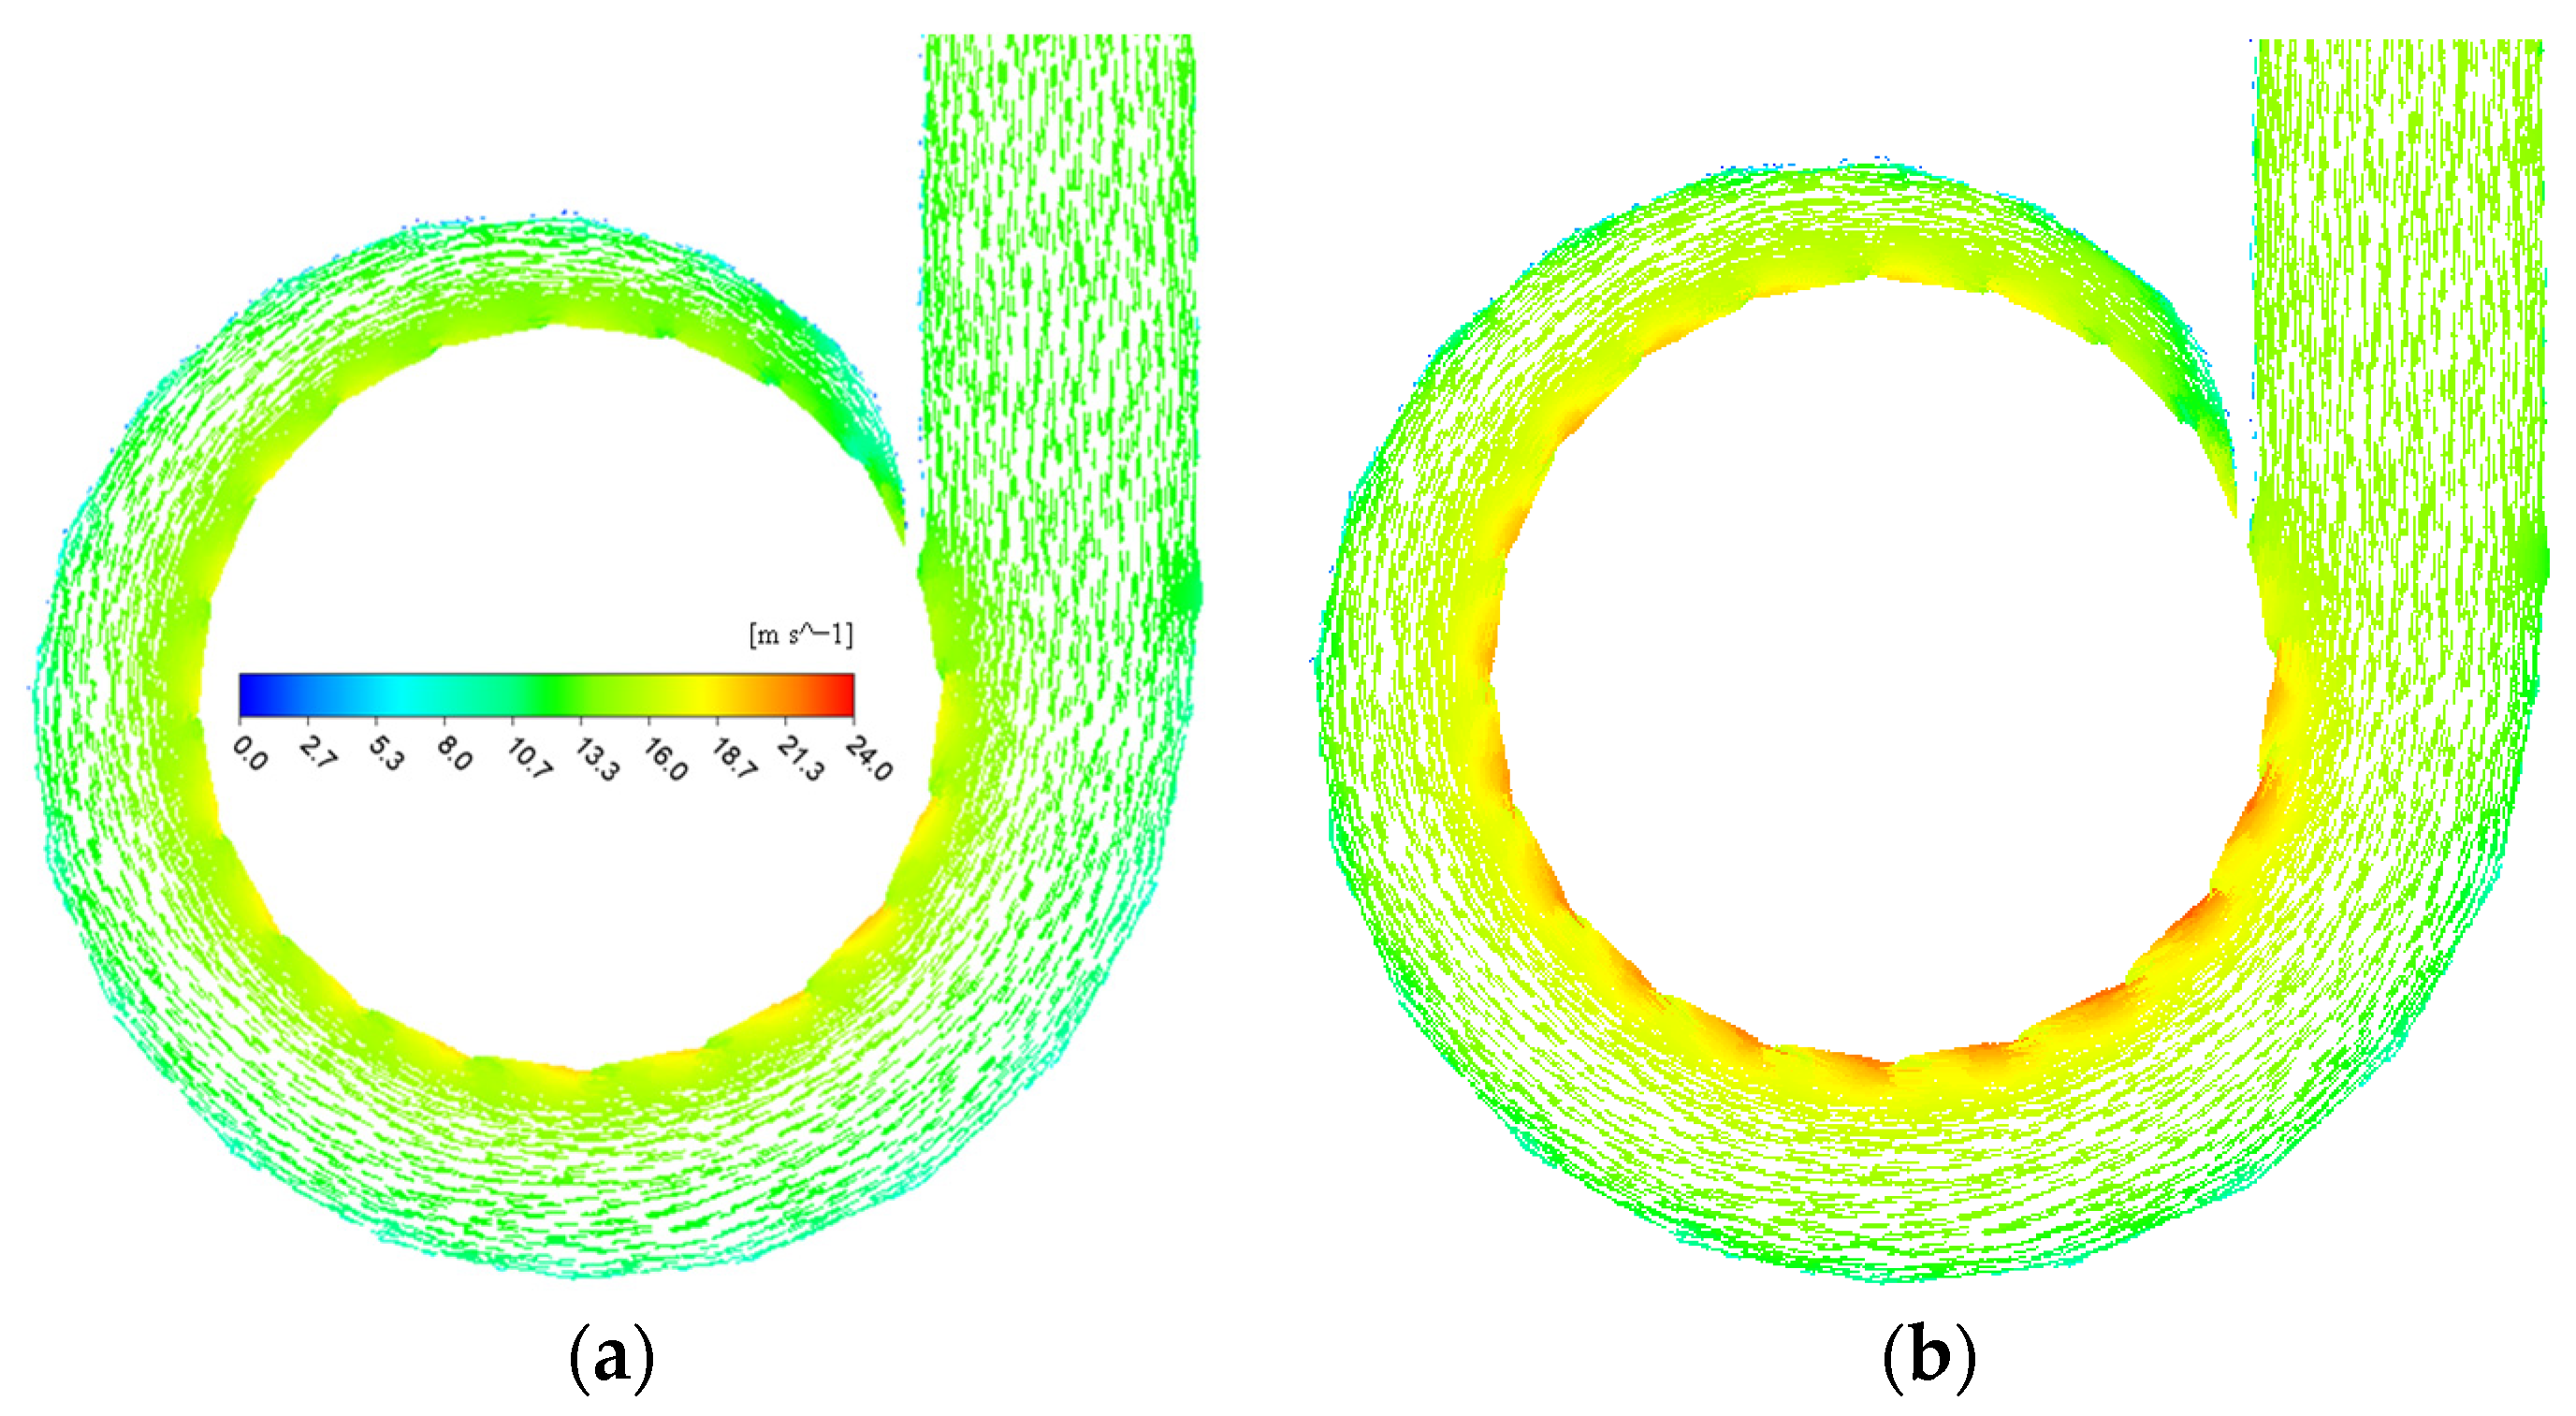
Figure 5 shows the velocity distribution in the volute. As the inflowing component of the turbine condition, the flow status in the volute was rather uniform and smooth. Along the flow direction, the velocity increased gradually as the area of the flowing section decreased. At the outlet of the volute, the flow velocity was unevenly distributed due to the obstruction of the stay vanes. Because the head was higher for case TH1.0P0.92 than TH0.9P0.72, the velocity in the volute was generally a bit larger, while both cases still shared a similar velocity distribution pattern.
Figure 6 shows the velocity distribution of the stay vanes and the guide vanes. The flow was uniform in the stay vane and the guide vane area. The velocity increased gradually along the flow direction and reached its maximum in the vaneless area close to the runner region. There was no significant difference in the velocity distribution between TH1.0P0.92 and TH0.9P0.72.
The largest velocity occurred at the vaneless area close to the runner, and the velocity distribution in the vaneless area along the circumferential direction is shown in Figure 7. Tangential velocity was selected to be positive in the same rotational direction, while radial velocity was selected to be positive in the flowing direction into the runner blades. The radial velocity fluctuated in the range of 0 to 30 m/s, and there was also a small amount of outflow from the runner. The tangential velocity of TH0.9P0.72 was mainly in the range of 40 m/s to 80 m/s, while the tangential velocity of TH1.0P0.92 was relatively unstable, and the velocity at some positions exceeded 100 m/s.
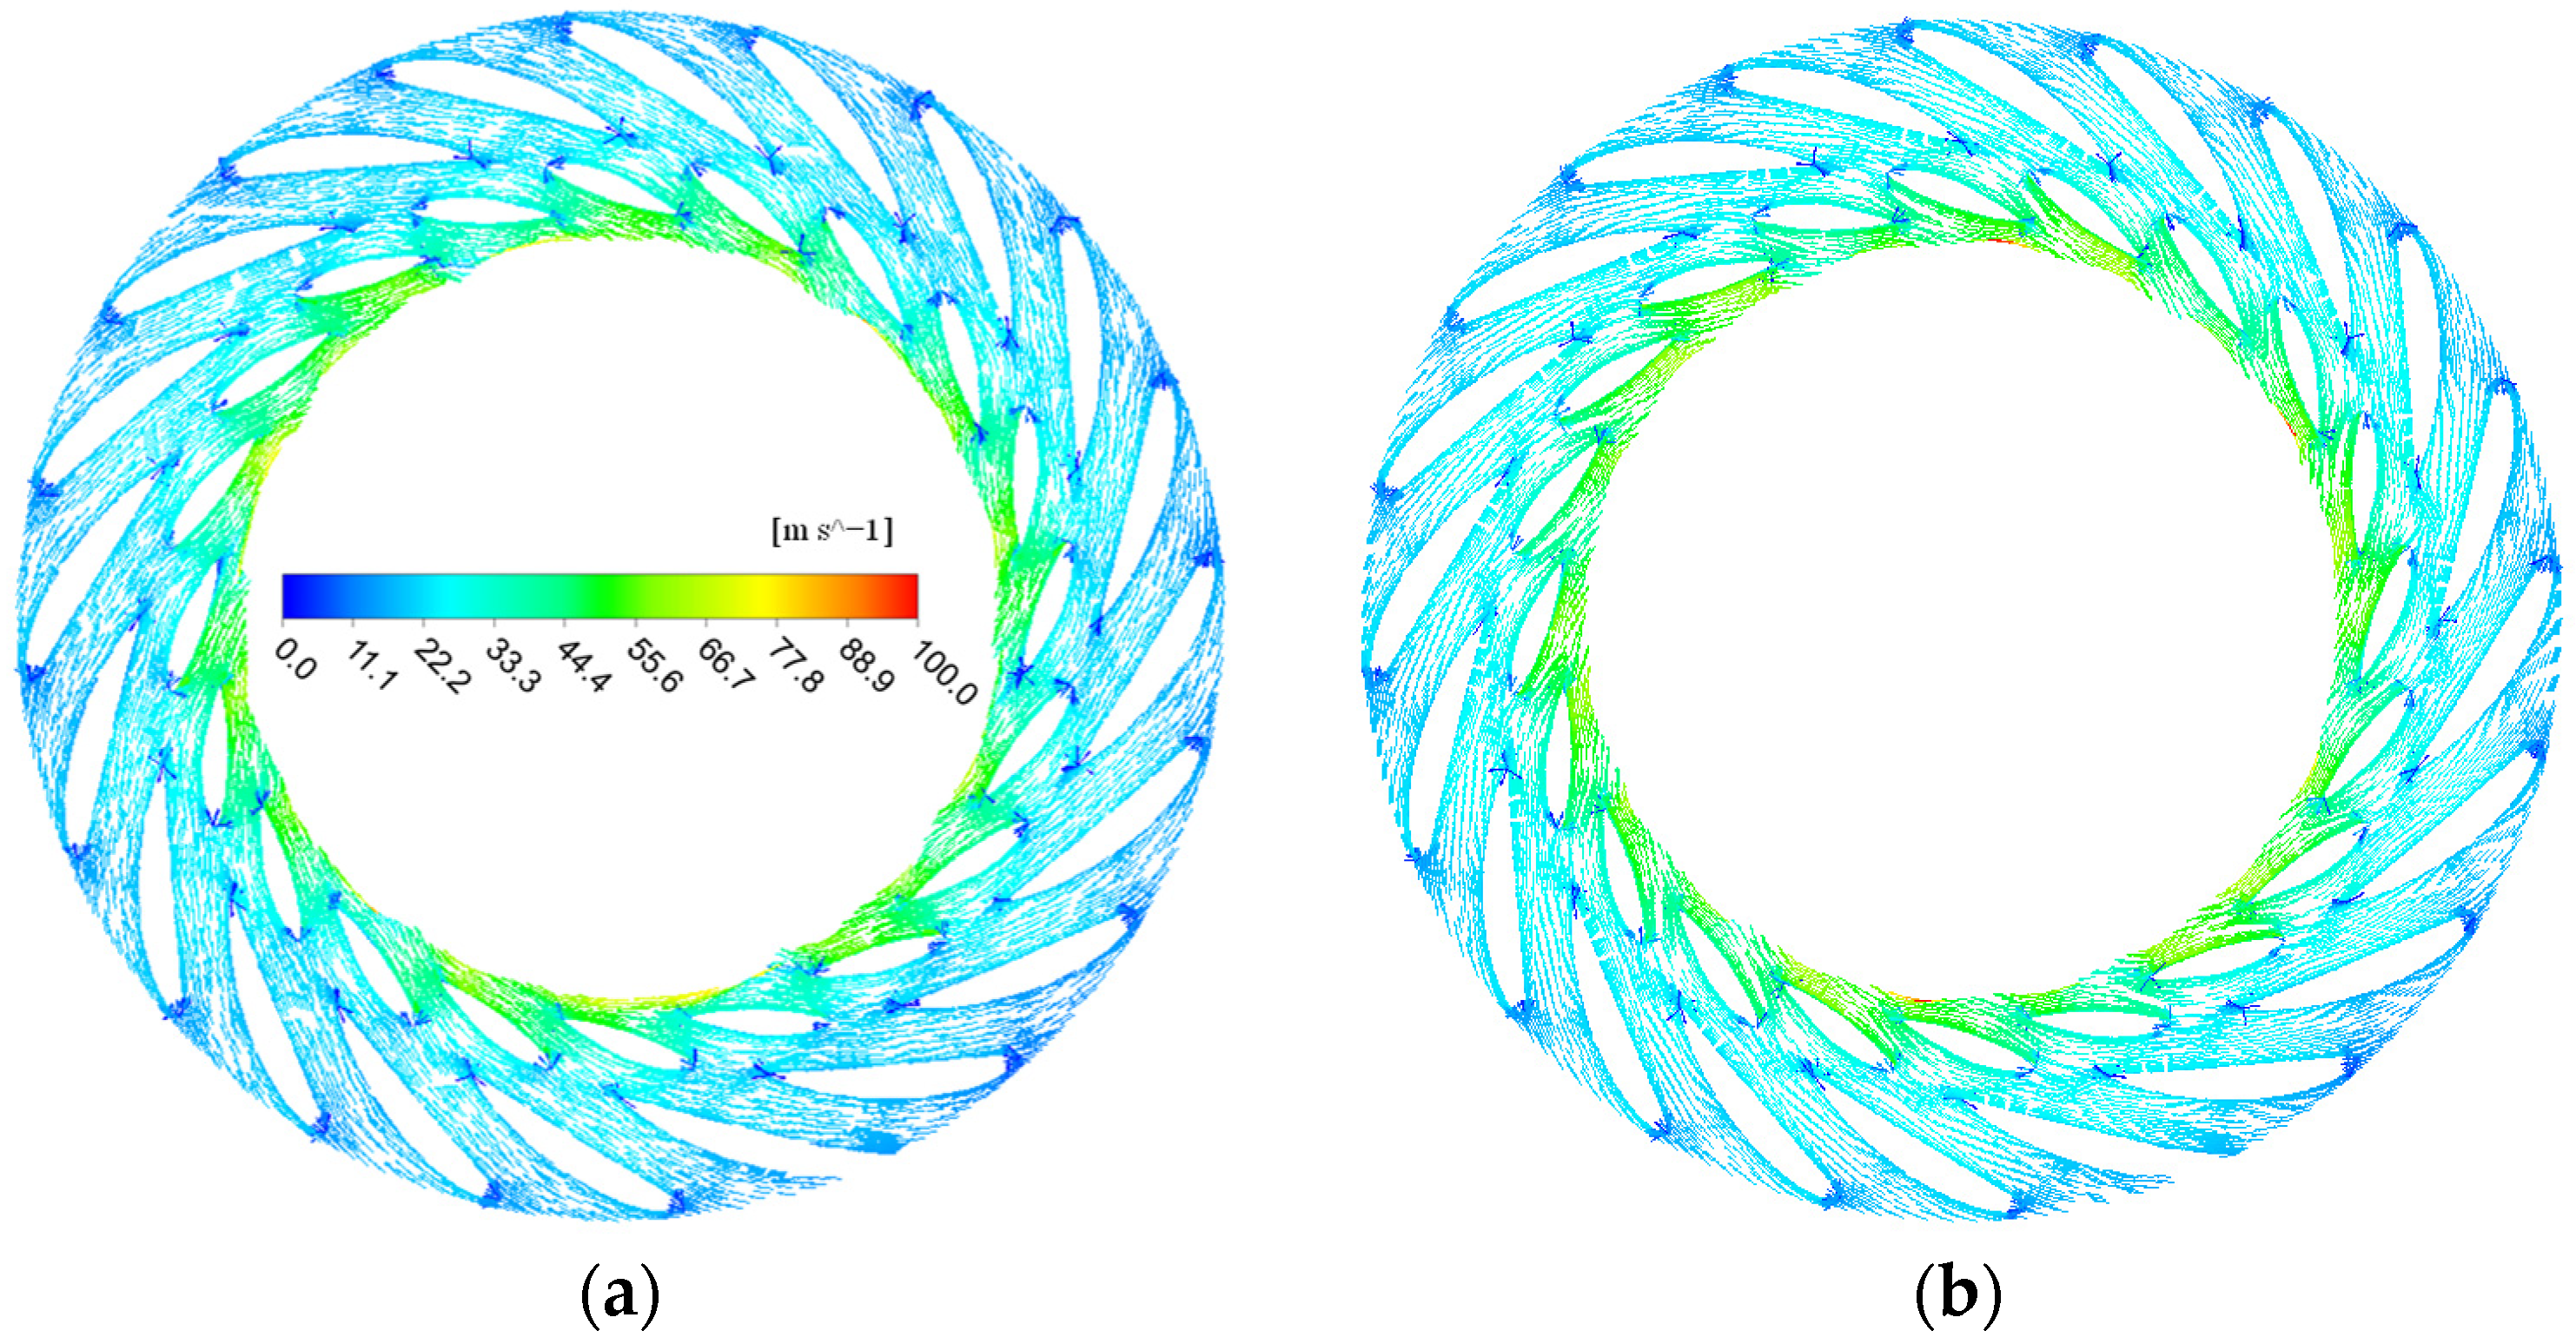
The flow in the runner channel was shown to be the most unstable. Figure 8 shows the velocity in the runner blades channel of the 0.5 span-turbo surface. The situation was the same in both TH0.9P0.72 and TH1.0P0.92: there was remarkable asymmetry of the flow in channels of splitter blades. This asymmetry showed a smooth flow state on the pressure side of the long blade, while the flow on the suction side of the long blade was chaotic. The asymmetry of flow was caused by the characteristics of the turbine and the existence of splitter blades. There was a large negative attach angle where the flow entered the runner from the guide vanes, and the existence of a negative attach angle would block the flow, forming a vortex and a low velocity region. The splitter blades made the channel asymmetrical, which resulted in asymmetric flow in the runner blades channels.
Compared with TH1.0P0.92, the flow status of case TH0.9P0.72 grew even worse. A low velocity area existed in the flow channel on the pressure side of all long blades, and occupied most of the area of the flow channel, so the flow rate in different blades channels was also asymmetrical. The flow of TH1.0P0.92 under working conditions was relatively good; a low velocity area only existed in the flow channel on the pressure side of a few long blades, and the low velocity area was smaller than that of the TH0.9P0.72 case.
Figure 9 is the velocity vector diagram of the draft tube. The inlet of the draft tube was closer to the runner outlet and had a higher flow velocity. Due to the hydraulically smooth wall, the larger the radius of the draft tube, the greater the velocity in the circumferential direction would be. In general, the velocity near the draft tube wall was greater than that at the central position. The flow in case TH1.0P0.92 was relatively uniform, and the velocity direction was well distributed along the flow direction. By contrast, the velocity in the TH0.9P0.72 case was not distributed in a perfectly uniform manner along the flow direction, and the vertical velocity component was larger in the elbow tube and the cone tube, but there was no vortex and backflow.
According to the entire passage flow behavior of the turbine, the flow under TH1.0P0.92 and TH0.9P0.72 cases in the volute and guide vanes was generally smooth with no obvious difference. The flow in the runner channel was complex, and the difference between the two cases was also obvious. The flow in the draft tube of TH1.0P0.92 was smooth, while the vertical velocity of TH0.9P0.72 in the elbow tube and the cone tube was larger, but there was no vortex and reflux on the draft tube.

3.2. Unsteady Flow Characteristics in the Vanes

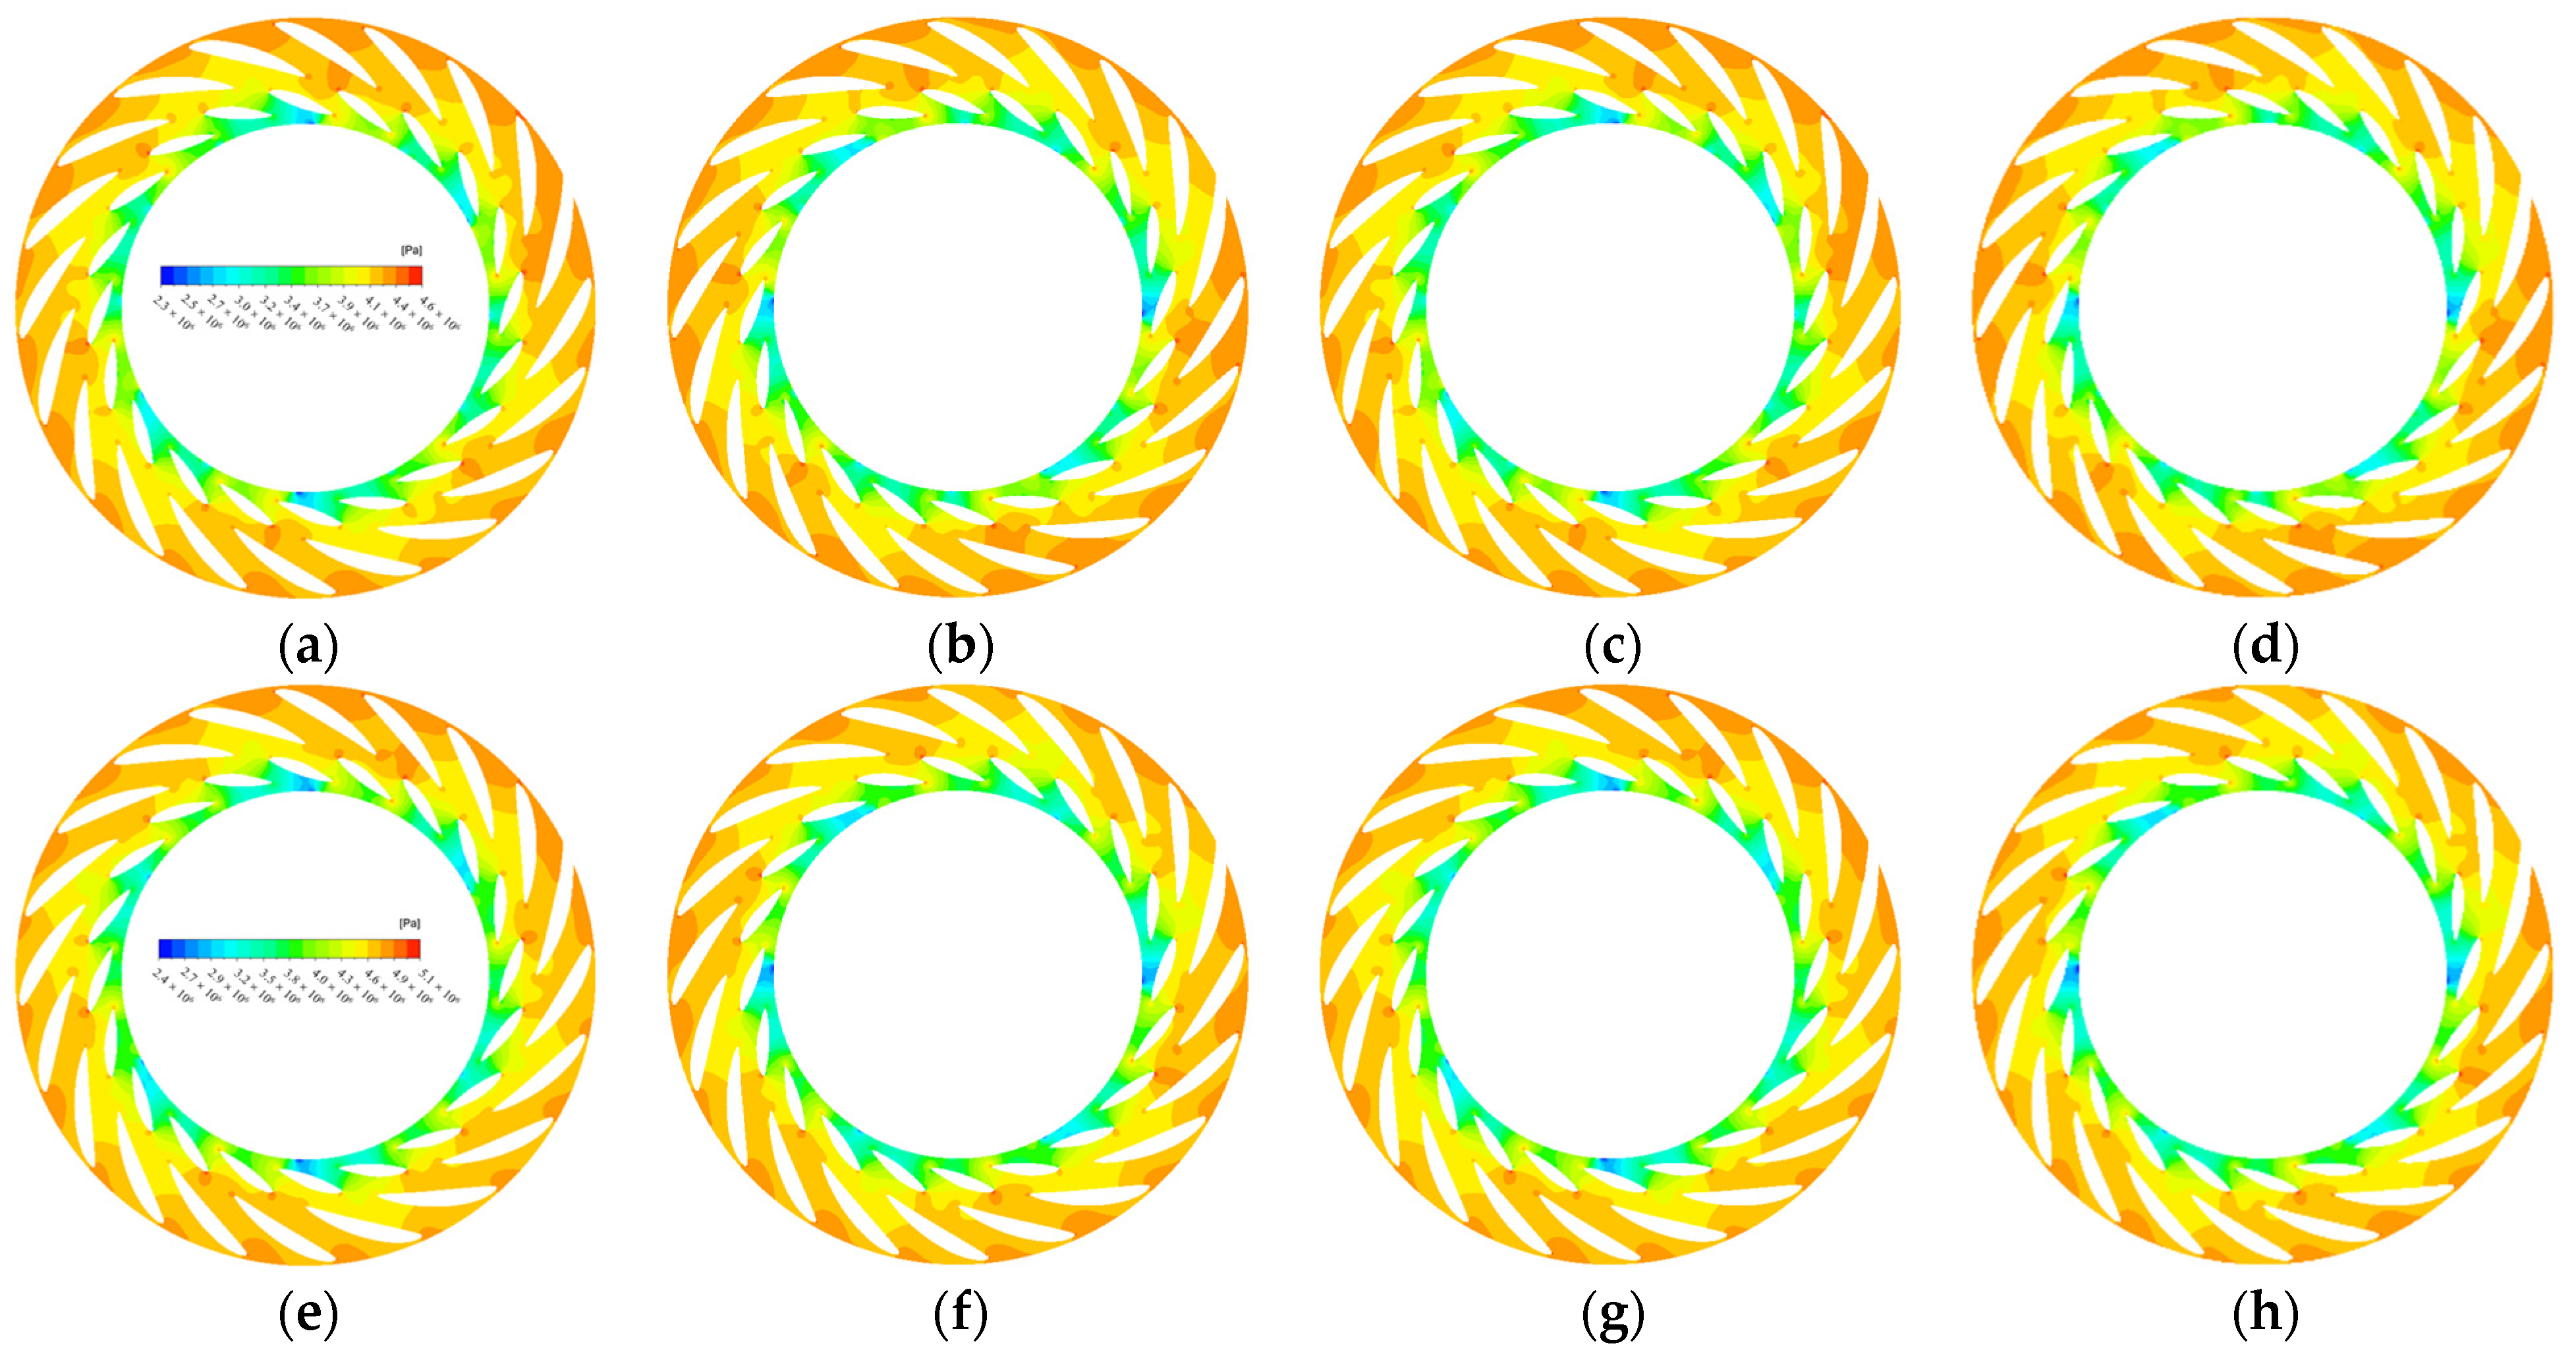
Figure 10 shows the guide vanes pressure during a rotation cycle on the 0.5-span turbo plane. Here, (a)–(d) represent the change in the guide vane pressure of case TH0.9P0.72, and (e)–(h) that of case TH1.0P0.92, over a rotation period. The head of case TH0.9P0.72 was relatively lower, and the pressure in the guide vane channel was also slightly lower than that of TH1.0P0.92.
The pressure distribution in the stay vane could reflect the velocity distribution, as regions with higher pressure were accompanied with lower velocity. The guide vane area of the turbine mode was the inlet of the runner, while the pressure distribution was uniform except for the vaneless area. The closer to the runner, the smaller the pressure, the greater the velocity. The pressure distribution was almost the same under different heads. The pressure in the vaneless region was unevenly distributed along the circumferential direction, and there were two positions with extremely low pressure in both cases. The extremely low-pressure areas moved with the rotation of the runner, and the angular velocity of its movement was equal to the runner rotation velocity, which showed that the flow status at the runner blade inlet had an important influence on the vaneless area.

3.3. Unsteady Flow Characteristics in the Runner

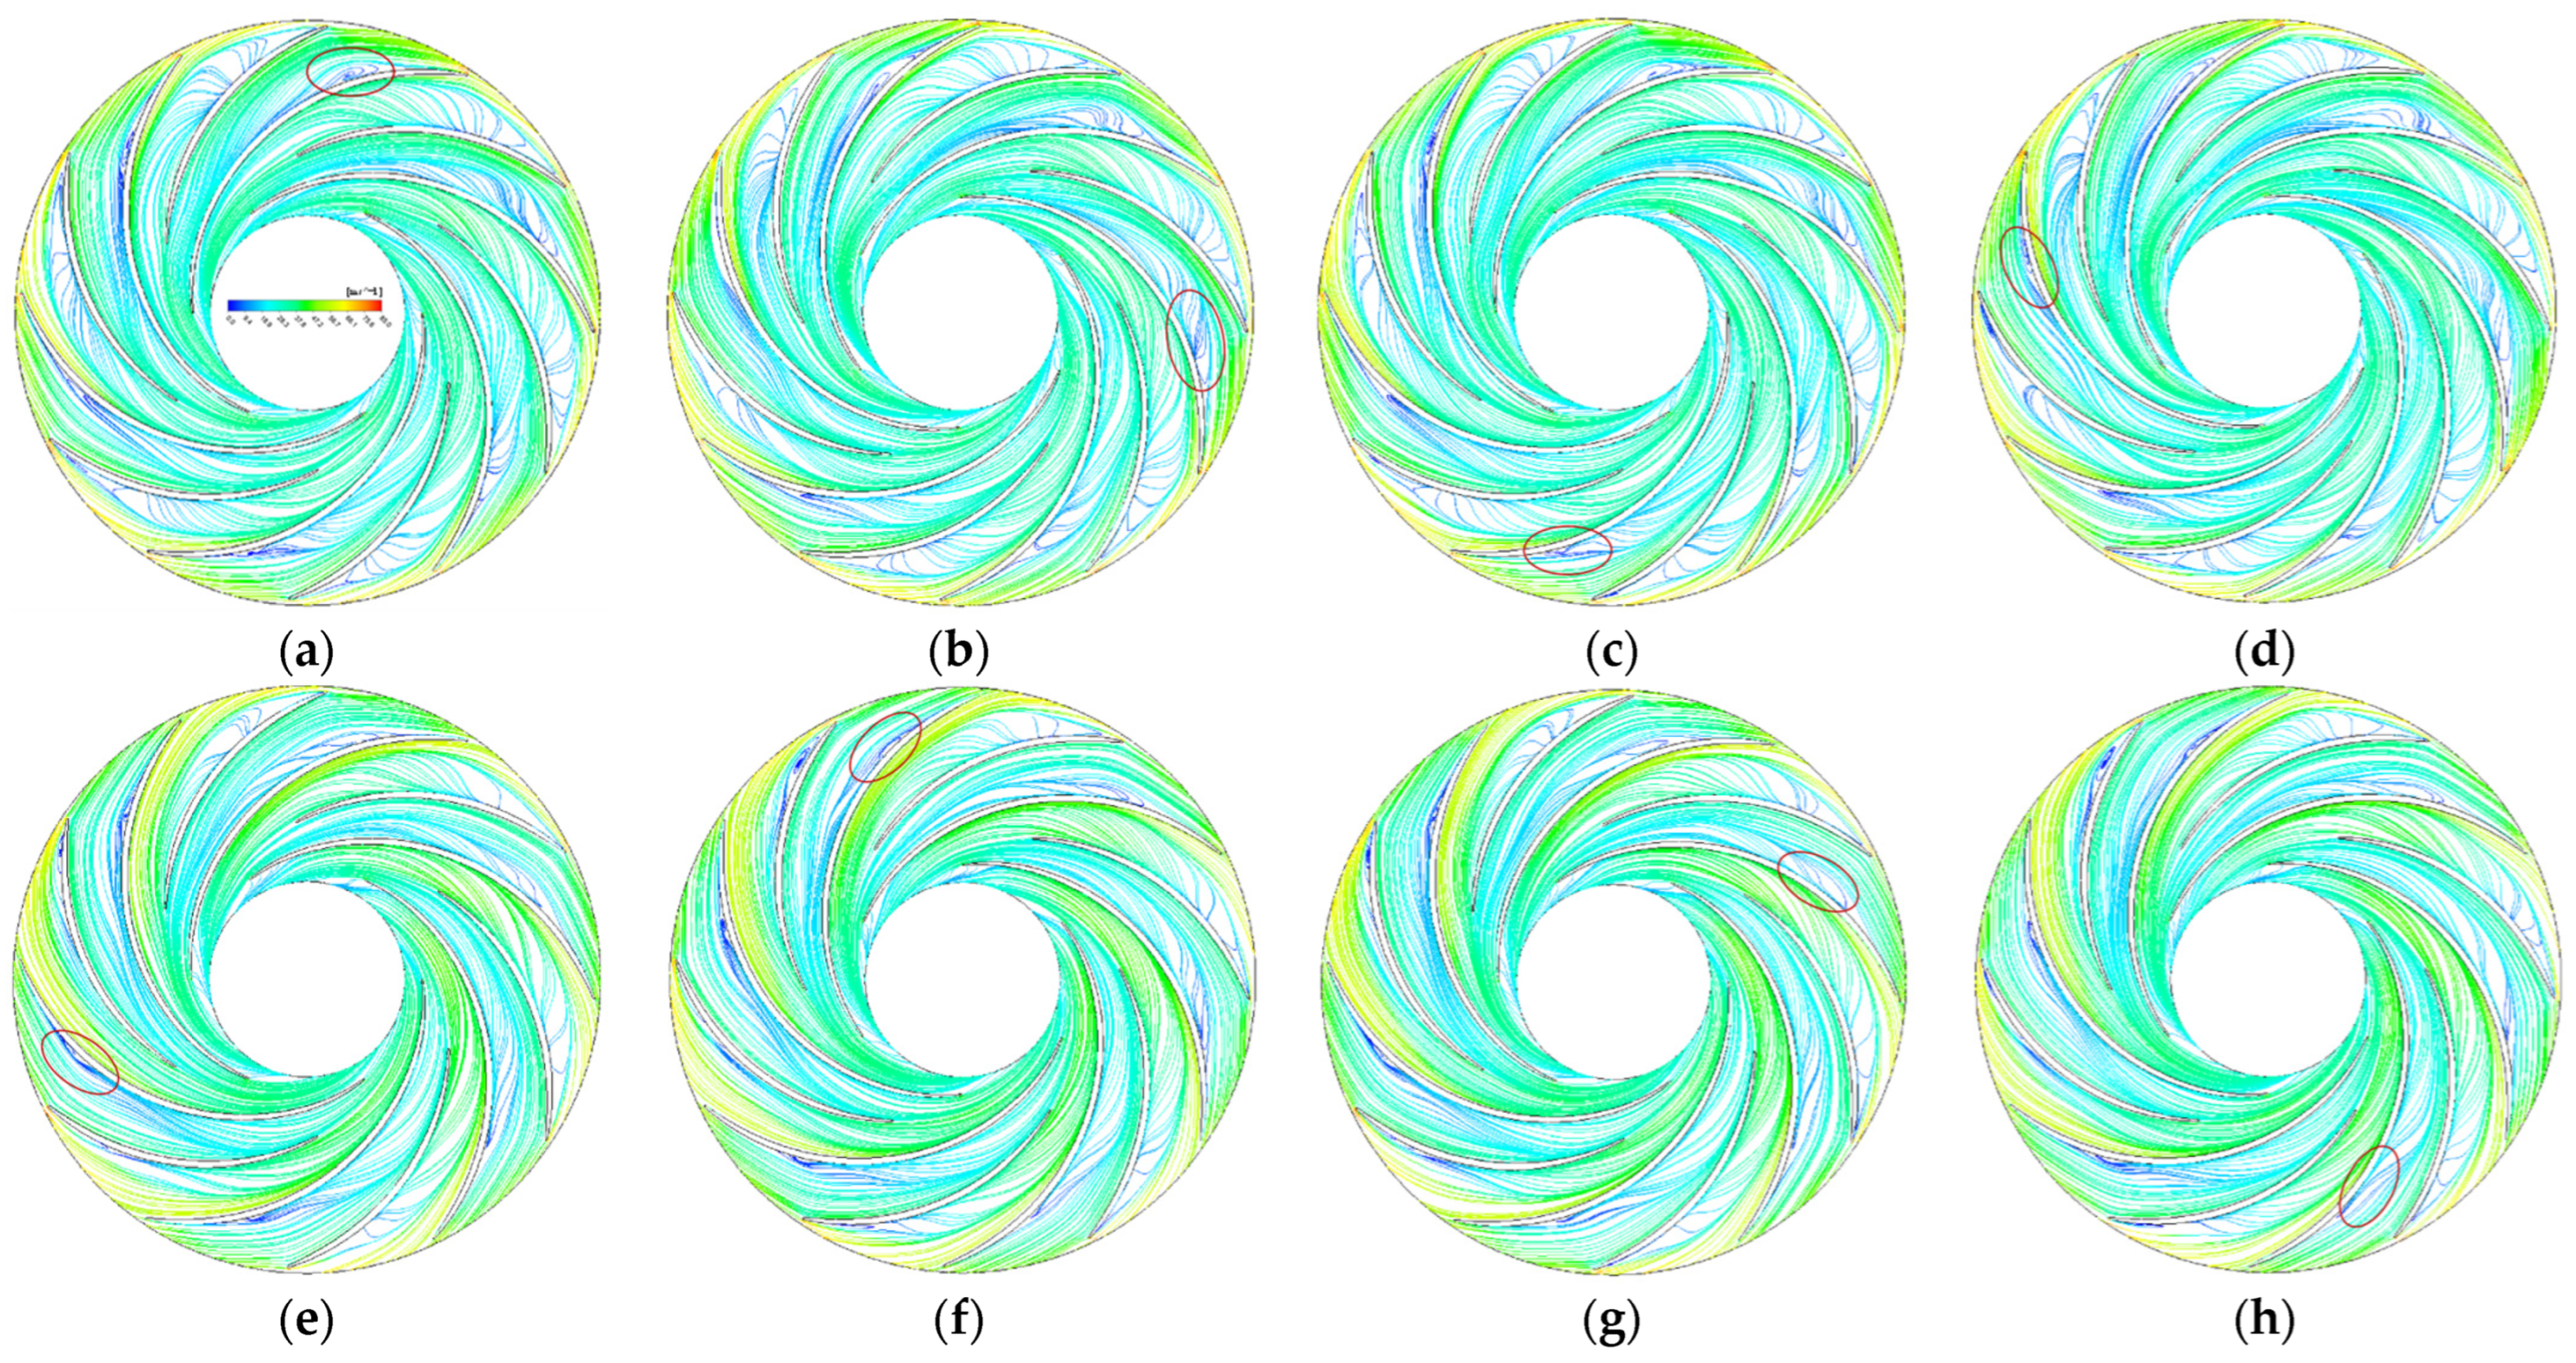
Figure 11 shows the velocity streamline on the 0.5-span turbo surface during a rotation period. Here, (a)–(d) and (e)–(h) represent the changes of the TH0.9P0.72 and TH1.0P0.92 cases, respectively, and the interval was a quarter of a rotation period. The red circle in the figure indicates the position of the same region in one rotation period.
Two cases had similar complex flow status in the runner channel. Taking the red circle in the figure as an example, an unstable vortex structure was formed at the blade pressure side. The vortex caused by the negative attack angle at the blade’s inlet continued to generate and collapse over time, which was the main reason for the flow instability in the runner blade channel. As for the runner inlet velocity, along the long blade pressure side it was low, while the flow in the runner channel was slightly better than that on the suction side; the velocity on the long blade suction side was larger. This was due to the existence of a larger range of vortices and backflows in the suction side channel, which blocked the water from entering the runner. Therefore, energy conversion was hindered, and as a result, the circumferential velocity became larger, forming a larger tangential velocity water ring. This also explained why the outlet velocity of the guide vane in Figure 10 showed a periodic distribution.
Compared with the case of TH1.0P0.92, the hydraulic efficiency of case TH0.9P0.72 was lower, and its internal flow status was more disordered. The low-velocity zone and the recirculation zone existed in all runner channels, occupying most blade channels. The flow resistance was larger especially at the runner inlet, with a more obvious phenomenon of recirculation. Therefore, it can be considered that with the decrease in operating head, the deterioration of the flow in the runner channel was one of the reasons accounting for the sharp decrease in hydraulic efficiency.

3.4. Analysis of Draft Tube Vortex Stripe

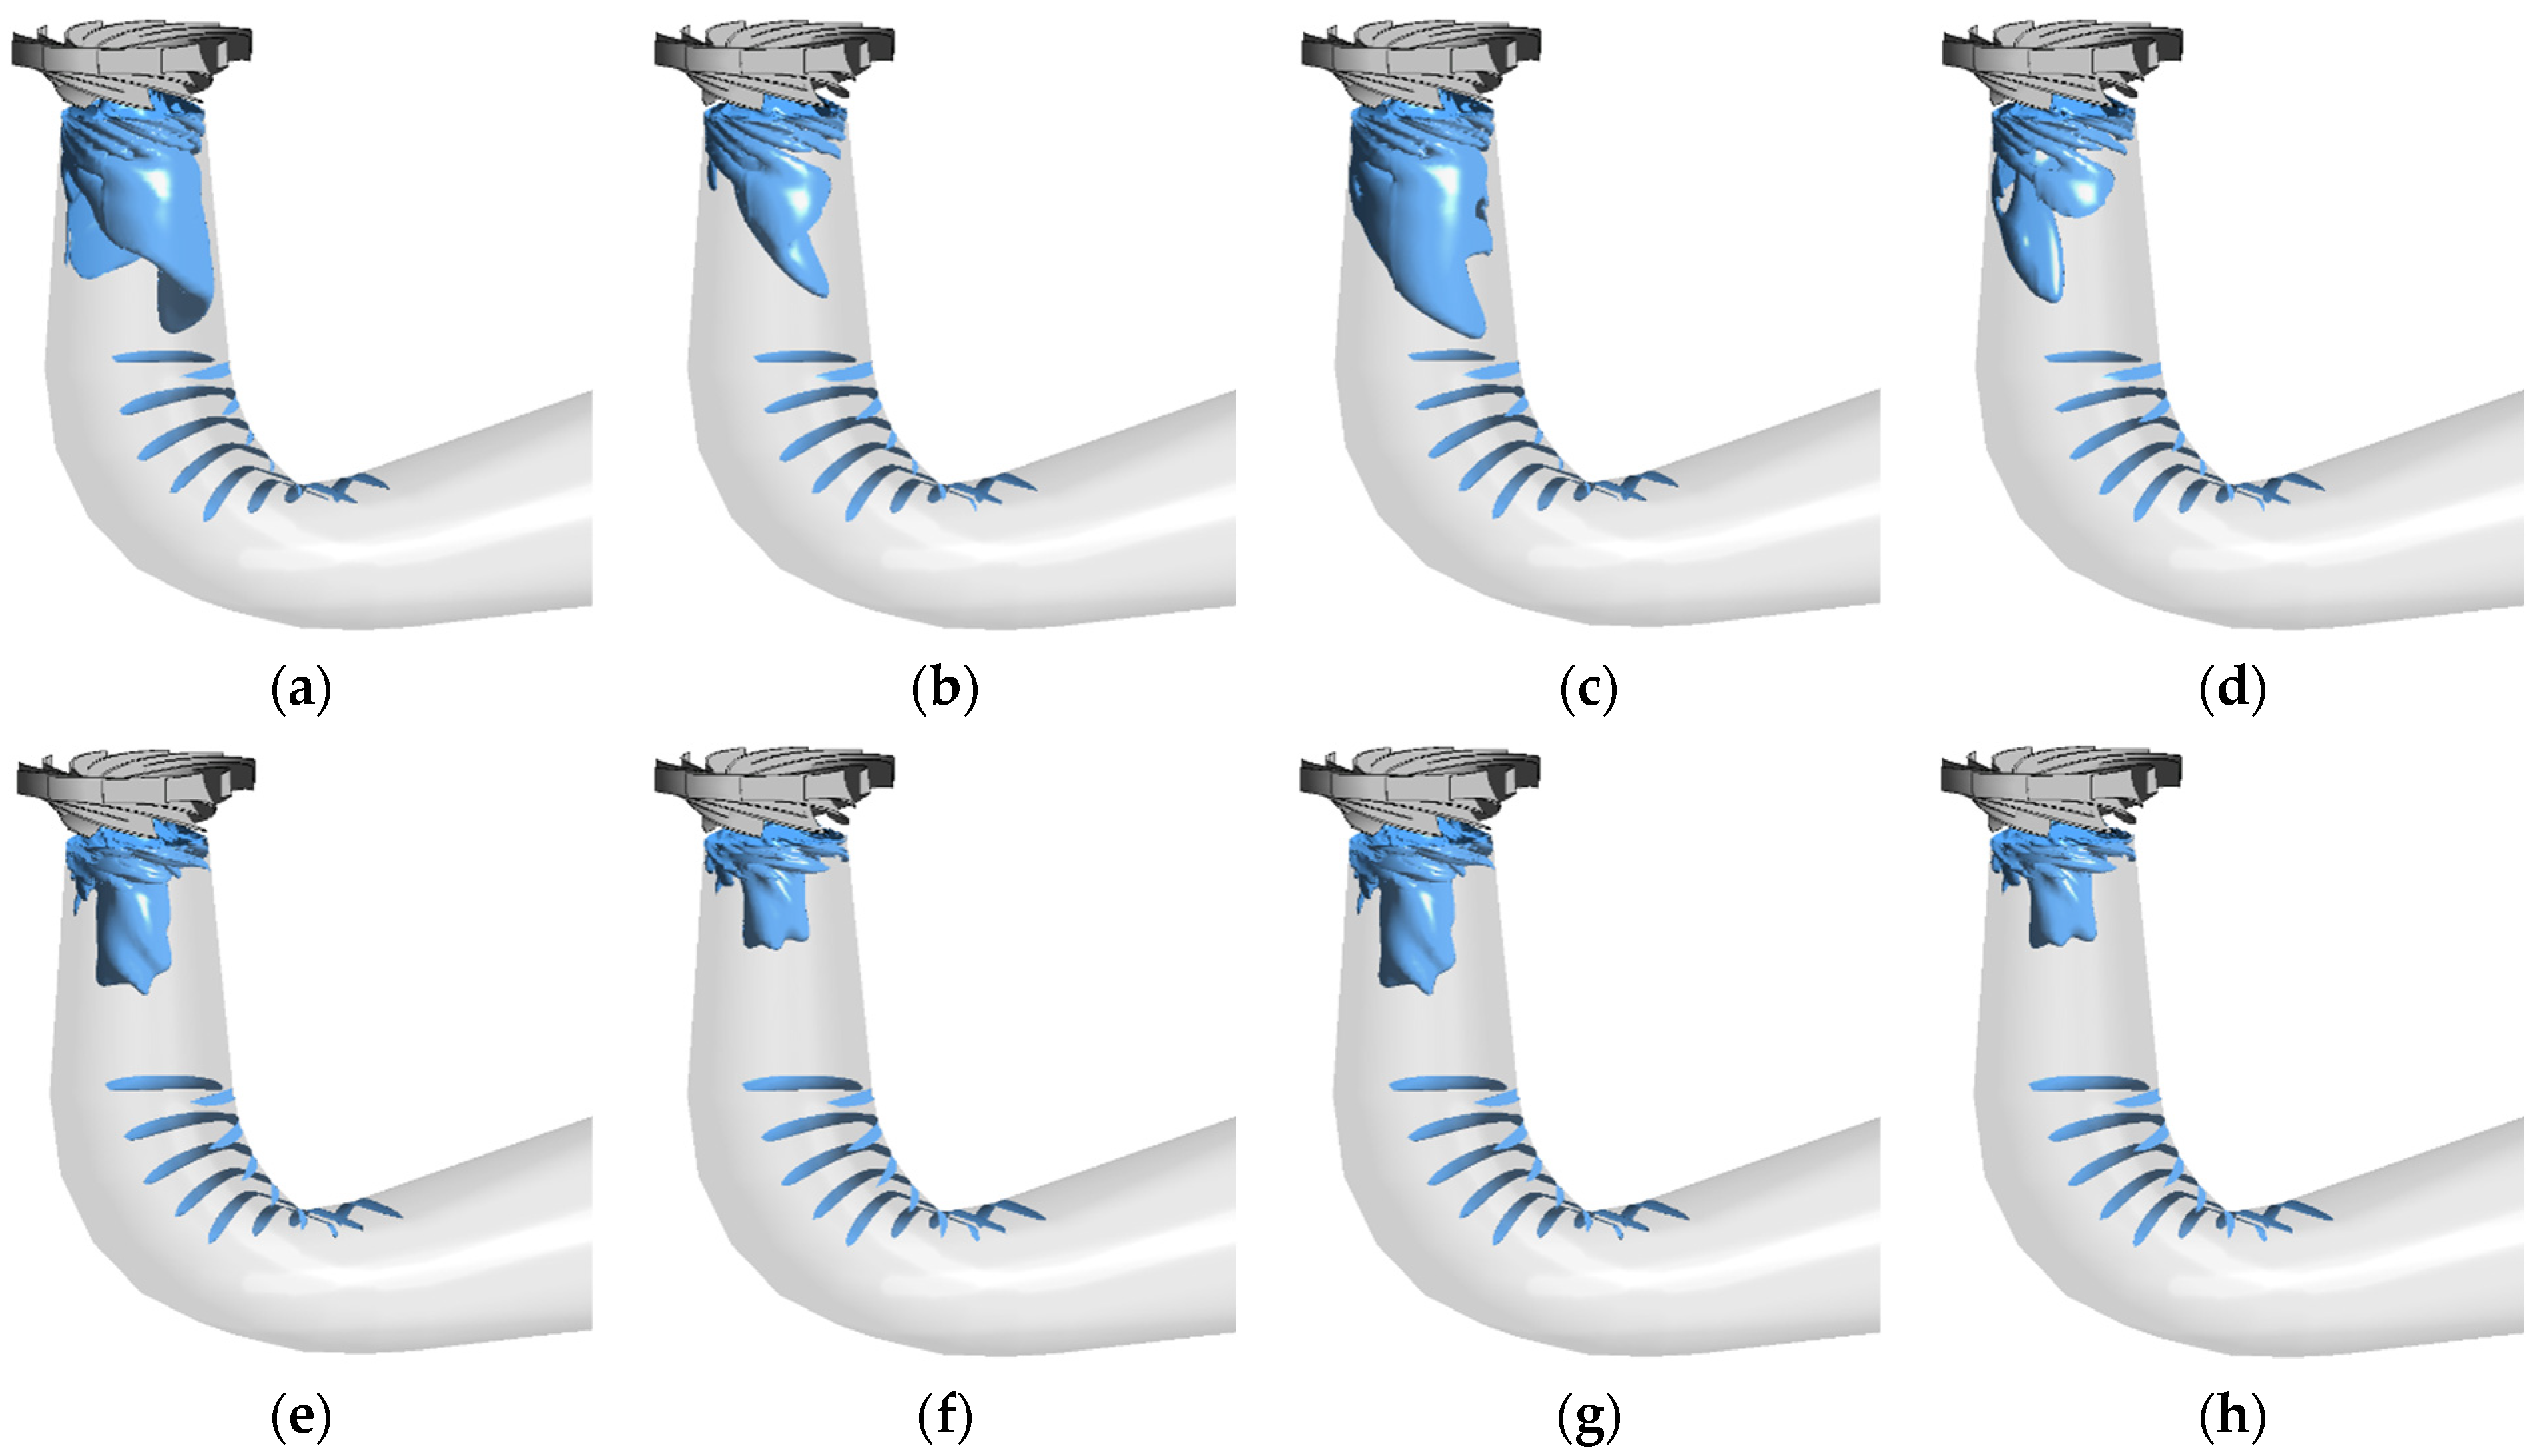
Figure 12 shows the vortex stripe in the draft tube represented by the vortex core region. Figure 12a–h represent the changes of the TH0.9P0.72 and TH1.0P0.92 cases in one period, respectively. There was a vortex core area caused by the elbow section of the draft tube, which was located on the inner edge of the elbow bend pipe. There were significant differences for the draft tube vortex rope in the two cases. The vortex stripe of case TH0.9P0.72 with low water head and low efficiency was a spiral eccentric vortex band, the rotation direction of which was consistent with the runner rotation. The shape of the vortex band slightly varied in one period as it swung with the rotation of the runner.
The draft tube vortex of the TH1.0P0.92 case had not yet developed into a vortex band. Specifically, it was in the cylindrical vortex core area on the downstream of the runner outlet. The position of the vortex core area was almost fixed and did not swing with the runner rotation, but its size would also change slightly in one period. Comparing the two cases, the farther the deviation from the optimal head, the more obvious the draft tube vortex band became, and the greater the pressure pulsation or vibration would be. Meanwhile, the existence of the draft vortex band resulted in a larger circumferential velocity in the draft tube, and the kinetic energy recovering ability of the draft tube would decline, exerting a negative impact on the turbine’s hydraulic efficiency.

3.5. Analysis of Pressure Pulsation Characteristics at Monitor Points

3.5.1. Comparison and Analysis of the Pressure Pulsation

The relative peak-to-peak amplitude of pressure pulsation reflects the intensity of pressure pulsation. In the turbine mode, the water sequentially passed through the sv, sgv, gv monitor points around the vanes, the RP1A to RP1H (or RS1A to RS1H) monitor points in the runner, and reached monitor points dt7 to dt1 in the draft tube. By recording the peak-to-peak values of all operation points and converting into water head, the relative peak-to-peak value of the monitor point was derived after division by the operating head, as shown in Figure 13, Figure 14 and Figure 15.
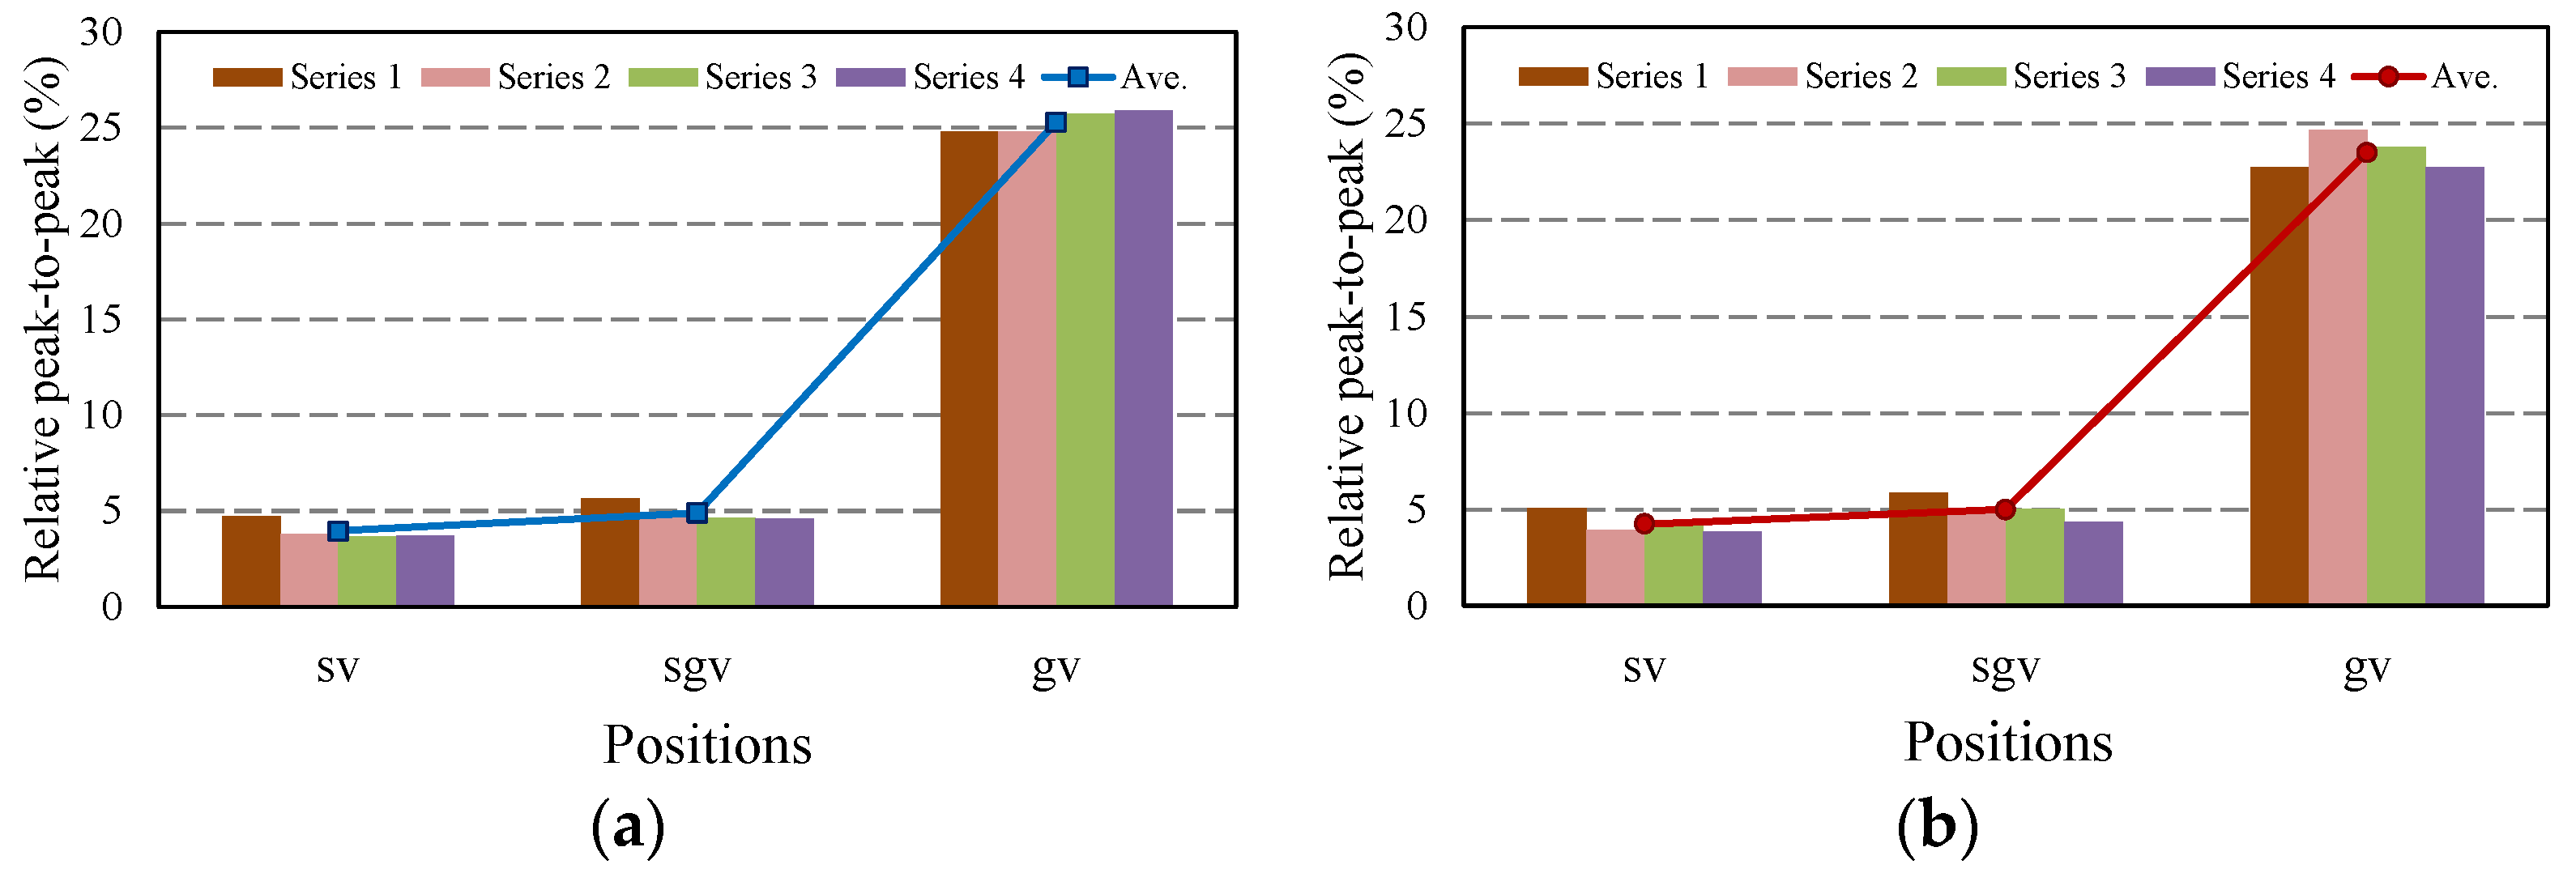
Figure 13 shows the peak-to-peak values at the vane positions, where Series 1, 2, 3, and 4 represent four phases with an interval of 90°. In addition, the Ave. curve represents the average value of pressure pulsations for each set of monitor points. The pressure pulsation trends of both operation conditions, TH0.9P0.72 and TH1.0P0.92, were almost the same. The flow at operation points of the sv and sgv series was stable, with relative peak-to-peak values at a lower level. The gv operation point was located at the vaneless area, its peak-to-peak value rose sharply compared to the upstream sgv operation points, and the relative peak-to-peak value of the low-head operating condition was slightly larger than that of the high-head operating condition. The peak-to-peak values under different phase angles were slightly different, but the differences from the average value were all less than 2%.
In Figure 14a, for the long blade pressure side channel point RP1, apart from the RP1A monitor point, the peak-to-peak values of the two cases show a downward trend along the flow direction from RP1B to RP1H. Figure 14b shows the long blade suction side channel points. Apart from the RS1A monitor point, it shows a downward trend, and the relative peak-to-peak value under the low-head case TH0.9P0.72 at RS1D and RS1E was much larger than that under the case TH1.0P0.92. Comparing Figure 14a,b, the peak-to-peak pressure amplitude at the RS1A monitor point was smaller than that at the RP1A. Combined with the flow fields in Figure 8 and Figure 11, the velocity at the RS1A point was generally larger than that at RP1A; that is, on the suction side of the long blade at the runner inlet, peak-to-peak amplitude of pressure pulsation was lower at the position with a larger circumferential speed.
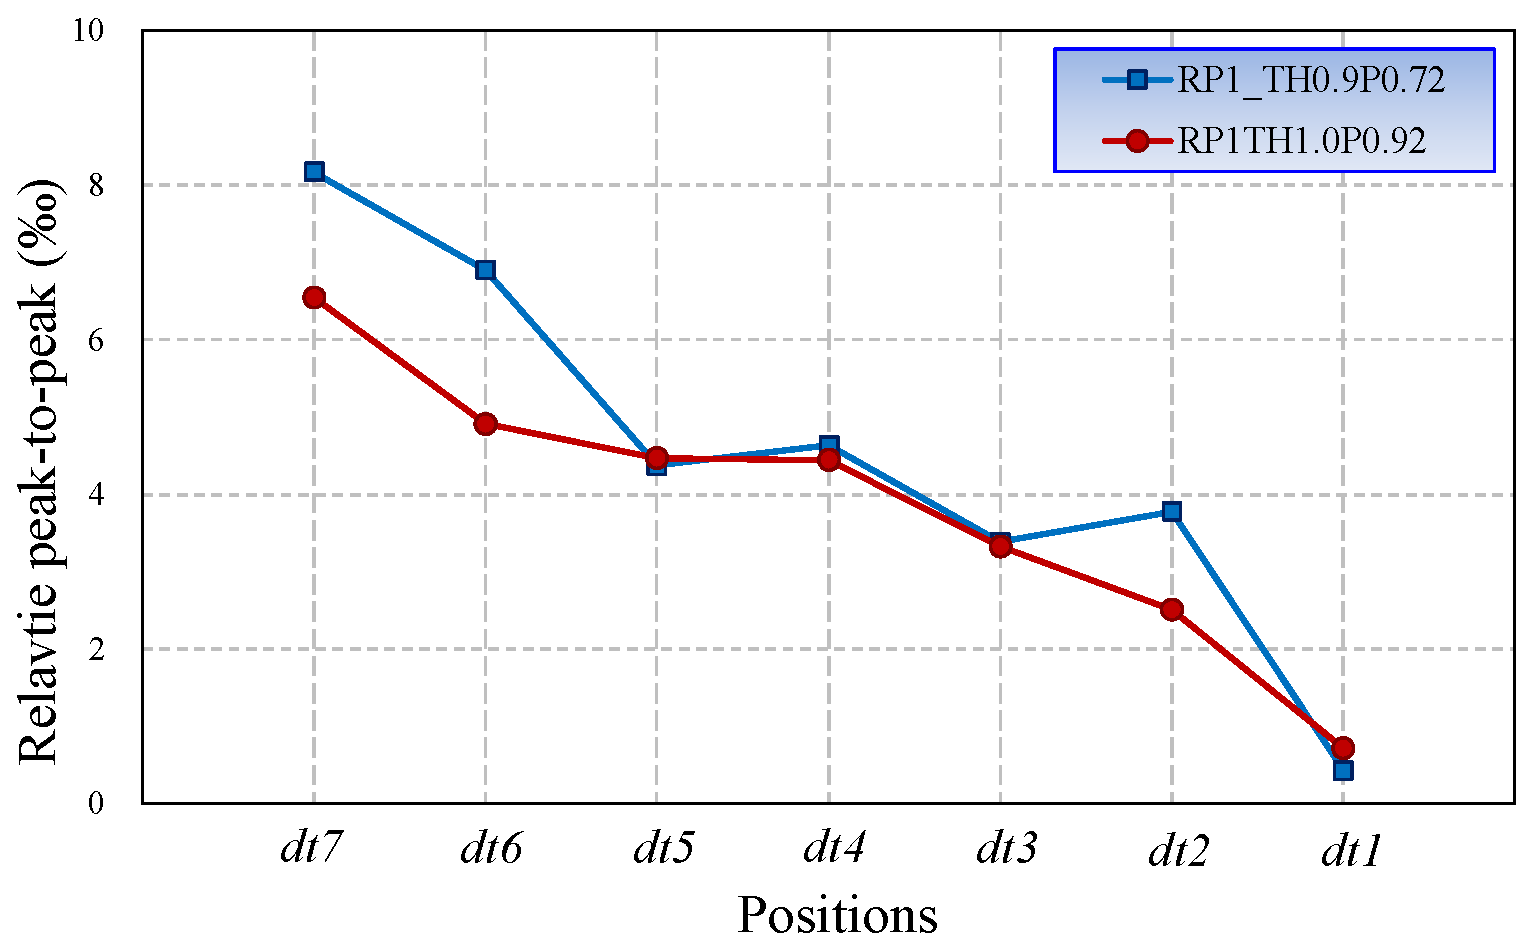
In Figure 15, the peak-to-peak values at the monitor points of the draft tube are generally lower, and the relative peak-to-peak values are represented in permille (‰). Along the flow direction from dt7 to dt1, the peak-to-peak values show a gradually decreasing trend. The relative peak-to-peak values of most monitor points under the low-head case TH0.9P0.72 were larger than those under the case of TH1.0P0.92, indicating that the draft tube was greatly affected by the runner and the pressure pulsation was more intense under the low-head condition.
In summary, the pulsations at the vanes’ sv and sgv points were low with stable variation; the peak-to-peak values were the highest at gv points in the vaneless area, far higher than other monitor points, and the pressure pulsations were the most intense; the pulsation situation at the rotating monitor points in the runner channel was more complex, and the relative peak-to-peak values at the vaneless area showed abnormal phenomena. The relative peak-to-peak values in the channel on the suction side of the long blade under low head were much larger than the values under high head, corresponding to a complex flow situation in the runner. Compared with other monitor points on the entire flow passage, the pressure pulsation peak-to-peak value in the draft tube was the lowest.

3.5.2. Pressure Pulsation Spectrum Analysis

From the previous analysis, it could be concluded that the pressure pulsation in the vaneless area was the most intense, the flow and pulsation characteristics in the runner channel were the most complex, and there was vortex in the draft tube. Therefore, the gv series monitor points in the vaneless area, the RP1 and RH1 series monitor points in the runner channel, and the points on the draft tube cone were selected for spectrum analysis, by taking advantage of the Fast Fourier Transform (FFT) method. According to the methodology stated in Section 2.2, the sampling frequency was 100 times that of the runner rotation frequency fn, by which 1000 samples in total were equally recorded from 10 runner rotations for spectrum analysis.
As shown in Figure 16, the main frequency of pressure pulsation was 6 f/fn (six times the rotation frequency) in both cases of TH1.0P0.92 and TH0.9P0.72, which was half of the blade passing frequency, and also equaled the number of long blades. Other frequencies with large amplitudes are multiples of the frequency 6 f/fn. Apart from the blade frequency and its multiples, all the remaining frequencies together contributed little, indicating that under the turbine mode, the pressure pulsation in the vaneless area was mainly affected by RSI. However, compared with the case TH1.0P0.92, the main frequency 6 f/fn had a smaller amplitude under the low-head case TH0.9P0.72, while the secondary frequency 12 f/fn had a larger amplitude. This indicates that, with the increase in efficiency and head, the influence of the blade frequency 12 f/fn on the vaneless area declined, and the influence of splitter blade frequency 6 f/fn was strengthened.
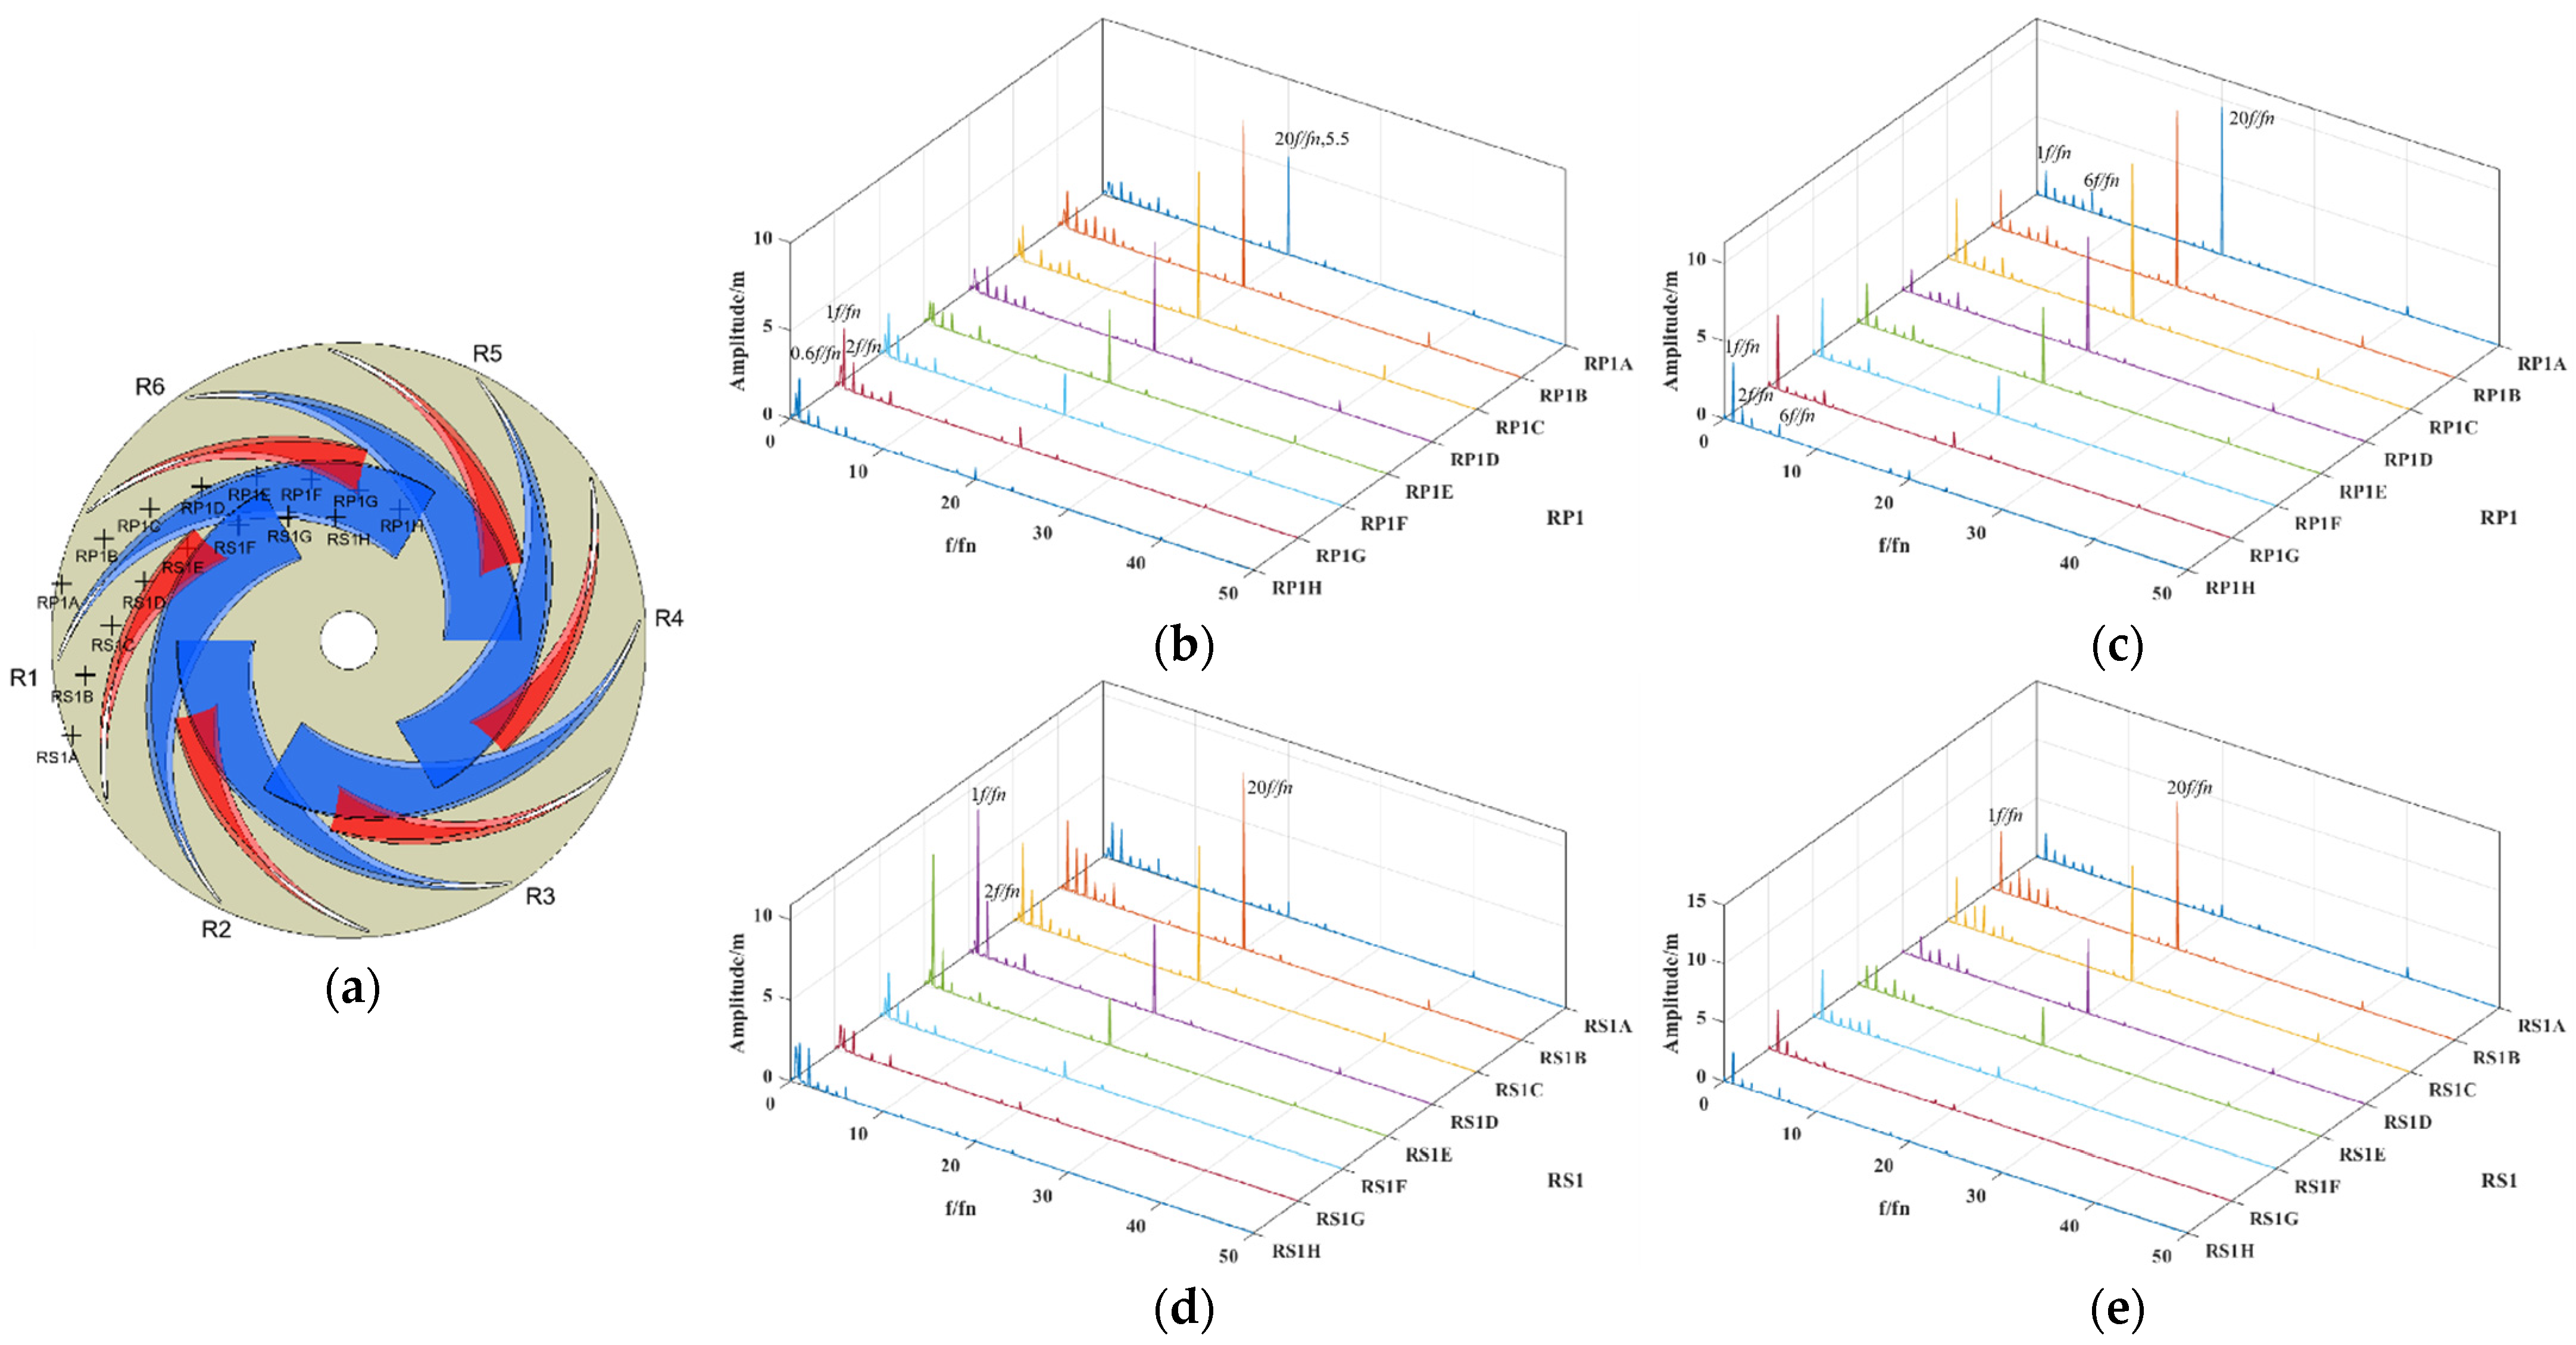
Figure 17b,c shows the pressure pulsation spectrum in the RP1 channel on the long blade pressure side, and Figure 17d,e shows the pressure pulsation spectrum in the RS1 channel on the suction side of the long blade. Apart from the RP1A and RS1A points, RSI effect was observed to gradually weaken in the direction away from the vaneless area with a gradually decreased amplitude of 20 f/fn, while the amplitude of low-frequency components such as 1 f/fn and 2 f/fn went up slightly. The low amplitude at RS1A accounted for the low pressure pulsation peak-to-peak value shown in Figure 14. This point was located at the edge of the runner, where the circumferential speed was high and was not directly affected by RSI.
For the RP1 channel on the pressure side of the long blade, the frequency and amplitude of pressure pulsation were similar under both heads. For the RS1 channel, under the low-head TH0.9P0.72 case, the amplitude of 1 f/fn and 2 f/fn at the RS1D and RS1E points were abnormally large, corresponding to the abnormally large peak-to-peak value at the corresponding monitor points in Figure 14b. The pressure pulsation in the vaneless area was mainly affected by RSI, and the distribution pattern on the four phases along the circumferential direction showed good symmetry. The main frequency component of the vaneless area pulsation was 6 f/fn, or half of the runner blade frequency, and other frequencies were also multiples of 6 f/fn. Under low-head conditions, the proportion of blade frequency 12 f/fn would increase.
For the runner blade channels, the frequency distribution of the RP1 channel was similar under different heads, while there was a sudden increase in the proportion of 1 f/fn and 2 f/fn in the RS1 channel under low head. As the location of monitor points moved away from the vaneless area, the influence of RSI weakened and the proportion of 20 f/fn gradually decreased, except for the RP1 and RS1 points close to the vaneless area, and the proportion of 20 f/fn was relatively low, for the pressure pulsation was closely related to the flow characteristics. The flow state at the runner inlet was stable, so that the pressure pulsation was also weak.
Figure 18b–g are the pressure pulsation spectrum diagrams in the draft tube for two cases, among which the dt7 series points were closest to the runner, following by the dt6 and dt5 series points, as shown in Figure 18a. The amplitude of pressure pulsation under the TH0.9P0.72 condition in which the vortex band appeared in the draft tube was much larger than that under the case of TH1.0P0.92. The first three orders of frequency under case TH0.9P0.72 were 0.4 f/fn, 0.7 f/fn, and 6 f/fn, while the first three orders of frequency under the case TH1.0P0.92 were 6 f/fn, 0.1 f/fn, and 18 f/fn. In comparison, the TH0.9P0.72 case contained all the frequency components present in case TH1.0P0.92, and had two additional low frequencies, 0.4 f/fn and 0.7 f/fn, which occupied a larger proportion. It could be asserted that the appearance of these two low frequencies was due to the presence of the vortex band in the draft tube.
In summary, both cases had an increased proportion of 12 f/fn in the vaneless area, an increased proportion of 1 f/fn and 2 f/fn in the runner blade channels, and an increased proportion of 0.4 f/fn and 0.7 f/fn in the draft tube, resulting in an overall increase in pressure pulsation under the TH0.9P0.72 operating condition.
The concerned frequencies and the largest normalized amplitude for a certain frequency at monitor points mentioned in Figure 16, Figure 17 and Figure 18 above are all shown in Table 2, Table 3, Table 4, Table 5, Table 6 and Table 7.

4. Conclusions

The flow and pressure pulsation characteristics of a pump-turbine with splitter blade runner on the small opening with two different head values were analyzed by simulation, and conclusions were drawn as follows:
Compared with the high-water head condition, the flow inside the runner channel worsened under the low-water head condition with a large range of vortexes as well as backflow areas observed, which was the main reason for the drop in hydraulic efficiency. The efficiency of TH0.9P0.72 condition and TH1.0P0.92 condition was about 10% and 3% lower than the optimal hydraulic efficiency, respectively.
The overall pressure pulsation was more intense in the low-efficiency TH0.9P0.72 condition than the TH1.0P0.92 condition. The positions with obvious pressure pulsation were the gv monitor points in the vaneless region and the RS1D, RS1E monitor points in the runner, but not the draft tube monitor points. The pressure pulsation frequencies in the vaneless region were mainly 6 and 12 times the rotation frequency. The proportion of 12 times rotation frequency would become larger under the low head case of TH0.9P0.72, and the relative peak-to-peak value of the pressure pulsation was about 2% higher than that under the TH1.0P0.92 condition.
On the runner suction side of the long blade channel, the relative peak-to-peak value of the pressure pulsation at RS1D and RS1E monitor points under the TH0.9P0.72 condition was about 2% higher than that under the TH1.0P0.92 condition, which was caused by the abnormal rise of the 1- and 2-times rotation frequency at that spot. The monitor point of the runner inlet was located at the edge of the runner, where the circumferential velocity of the fluid was large, and thus was not directly affected by the RSI, showing an unusual phenomenon of weak pressure pulsation. A vortex rope appeared in the draft tube in case TH0.9P0.72. In comparison with the TH1.0P0.92 case, the 0.4 and 0.7 times of rotation frequency in the cone tube occupied a larger proportion. Meanwhile, the pressure pulsation relative peak-to-peak value of dt7 and dt6 at the cone tube in the TH0.9P0.72 condition was 1.5‰~2‰ higher than that in the TH1.0P0.92 condition.

Author Contributions

W.X. conceived the idea and study design; S.R. conceived the idea and took part in the study design and supervision; L.C. performed the simulations, and prepared the manuscript; B.Y. and Z.L. did the literature review and the writing; Y.X. took part in the study design and supervision. All authors have read and agreed to the published version of the manuscript.

Funding

The State Grid Xinyuan Company LTD Science and Technology Project (No. SGXYKJ-2022-043) is gratefully acknowledged for supporting the present work.

Data Availability Statement

Data is contained within the article.

Conflicts of Interest

The authors declare no conflicts of interest.

References

  1. Li, Z.; Cheng, C.; Yan, S.; Peng, S.; Ma, B. Theoretical analysis of entropy generation at the blade Interface of a tubular turbine under cooperative conditions. Front. Energy Res. 2021, 9, 788416. [Google Scholar] [CrossRef]
  2. Li, W.; Li, Z.; Zhao, Q.; Yan, S.; Wang, Z.; Peng, S. Influence of the solution pH on the design of a hydro-mechanical magneto-hydraulic sealing device. Eng. Fail. Anal. 2022, 135, 106091. [Google Scholar] [CrossRef]
  3. Lu, Y.; Yang, F. Design and research of multi-energy complementary power generation system based on pumped storage under the goal of carbon emission peak and carbon neutrality. Hydropower Pumped Storage 2021, 7, 40–44. (In Chinese) [Google Scholar]
  4. Jiang, L.; Liu, X.; Ge, Q.; Cui, L.; Du, X. Research on the trends and countermeasures of China’s energy structure transformation. Energy China 2020, 42, 15–19. (In Chinese) [Google Scholar]
  5. Yang, B. Analysis on the development direction of future main energy in energy transition. Energy Energy Conserv. 2020, 6, 49–50. (In Chinese) [Google Scholar]
  6. Zhou, Q.; Wang, N.; Ran, L.; Shen, H.; Lv, Q.; Wang, M. Analysis of the Reasons and Prospects for the Abandonment of Wind and Light in China’s New Energy Industry. Electr. Power 2016, 49, 7–12+159. (In Chinese) [Google Scholar]
  7. Wang, X.; Virguez, E.; Xiao, W.; Mei, Y.; Patiño, E.D.; Wang, H. Clustering and dispatching hydro, wind, and photovoltaic power resources with multiobjective optimization of power generation pulsations: A case study in southwestern China. Energy 2019, 189, 116250. [Google Scholar] [CrossRef]
  8. Jiang, G.; Peng, Y.; Ji, C.; Luo, S.; Yu, X. Hydro-wind-solar power complementary short-term optimal scheduling considering participation of price-based demand response. J. Hydroelectr. Eng. 2023, 42, 1–12. (In Chinese) [Google Scholar]
  9. Ruppert, L.; Schürhuber, R.; List, B.; Lechner, A.; Bauer, C. An analysis of different pumped storage schemes from a technological and economic perspective. Energy 2017, 141, 368–379. [Google Scholar] [CrossRef]
  10. Zhang, L.; Li, J. Characteristic analysis of pressure pulsation in the non-blade area of a pump-turbine under turbine Condition. Large Electr. Mach. Hydraul. Turbine 2017, 1, 60–63. (In Chinese) [Google Scholar]
  11. Yuan, S.; Fang, Y.; Yuan, J.; Zhang, J. Review on vibration problems of power units in commissioned pumped storage projects in China. J. Hydroelectr. Eng. 2015, 34, 1–15. (In Chinese) [Google Scholar]
  12. Tian, Z. Key technology development of high head pump turbine. Hydropower Pumped Storage 2017, 3, 39–45+54. (In Chinese) [Google Scholar]
  13. Zhao, Y.; Zhang, F.; Chen, S.; Xu, Y. Amplitude Characteristic of Vaneless Zone Pressure in Load Rejection Process for Pumped-Storage Units. Yellow River 2023, 45, 134–139. (In Chinese) [Google Scholar]
  14. Huang, W.; Bi, H.; Ye, Y.; Zhang, S.; Yin, X.; Huang, X.; Wang, Z.; Jin, Z. Study on hydraulic performance of pump-turbine in startup process. J. Hydroelectr. Eng. 2023, 42, 97–104. (In Chinese) [Google Scholar]
  15. Kazumasa, K. Advantages of using long and short blade runners in ultra-high head and large capacity water pump-turbines. Guowai Dadianji 2007, 2, 55–58. [Google Scholar]
  16. Kassanos, I.; Chrysovergis, M.; Anagnostopoulos, J.; Papantonis, D.; Charalampopoulos, G.S.T.; Tsitouras, C. Numerical Performance Evaluation of Design Modifications on a Centrifugal Pump Impeller Running in Reverse Mode. AIP Conf. Proc. 2016, 1738, 480084. [Google Scholar]
  17. Kassanos, I.; Anagnostopoulos, J.; Papantonis, D. Numerical investigation of draft tube pressure pulsations in a Francis turbine with splitter blades. J. Phys. Conf. Series. IOP Publ. 2017, 813, 012049. [Google Scholar] [CrossRef]
  18. Meng, L.; Zhang, S.; Zhou, L.; Wang, Z. Study on the pressure pulsation inside runner with splitter blades in ultra-high head turbine. IOP Conf. Ser. Earth Environ. Sci. 2014, 22, 032012. [Google Scholar] [CrossRef]
  19. Song, X.; Mao, X.; Lu, J.; Zhang, X. CFD-based optimal design of pump-turbine runner with long and short blades. Water Resour. Hydropower Eng. 2021, 52, 115–123. (In Chinese) [Google Scholar]
  20. Hu, J.; Zhao, Z.; He, X.; Zeng, W.; Yang, J.; Yang, J. Design techniques for improving energy performance and S-shaped characteristics of a pump-turbine with splitter blades. Renew. Energy 2023, 212, 333–349. [Google Scholar] [CrossRef]
  21. Hu, J.; Yang, J.; Zeng, W.; Yang, J. Effect of the Speed Factor on the Amplitude of the Blade Passing Frequency in the Vaneless Space of a Pump Turbine in Turbine Mode. J. Fluids Eng. 2021, 143, 111203. [Google Scholar] [CrossRef]
  22. Yin, J.; Wang, D.; Wang, L.; Wei, X. Advances in CFD flow simulations for pump-turbine. J. Hydroelectr. Eng. 2013, 32, 233–238+243. (In Chinese) [Google Scholar]
  23. Wang, X.; Liu, D.; Liu, X.; Tang, W.; Xu, L. Analysis on flow structures and pressure pulsation in vaneless space of reversible pump turbine. J. Hydroelectr. Eng. 2021, 40, 59–72. (In Chinese) [Google Scholar]
  24. Wang, L.; Liao, W.; Lu, J.; Luo, X.; Ruan, H.; Zhao, Y.; Wang, J. Pressure pulsations in pump turbines in S zone based on weakly compressible modeling. J. Hydroelectr. Eng. 2017, 36, 69–78. (In Chinese) [Google Scholar]
  25. Zhao, X.; Xiao, Y.; Wang, Z.; Luo, H.; Soo-Hwang, A.; Yao, Y.; Fan, H. Numerical analysis of non-axisymmetric flow characteristic for a pump-turbine impeller at pump off-design condition. Renew. Energy 2018, 115, 1075–1085. [Google Scholar]
  26. Hasmatuchi, V.; Roth, S.; Botero, F.; Avellan, F.; Farhat, M. High-speed flow visualization in a pump turbine under off-design operating conditions. IOP Conf. Ser. Earth Environ. Sci. 2010, 15, 032042. [Google Scholar] [CrossRef]
  27. Wang, H.; Wang, J.; Gong, R.; Shang, C.; Li, D.; Wei, X. Investigations on pressure pulsations in the S-shaped region of a pump–turbine. Energies 2021, 14, 6683. [Google Scholar] [CrossRef]
  28. Xia, L.; Cheng, Y.; Cai, F.; Zhang, X. Pressure pulsation characteristics of a model pump turbine operating in the S-shaped region: CFD simulations. Int. J. Fluid Mach. Syst. 2017, 10, 287–295. [Google Scholar] [CrossRef]
  29. Zhang, W.; Chen, Z.; Zhu, B.; Zhang, F. Pressure pulsation and flow instability in S-shaped region of a reversible pump-turbine. Renew. Energy 2020, 154, 826–840. [Google Scholar] [CrossRef]
Figure 1. The pump-turbine with splitter blades runner: (a) entire flow passage, (b) the meridional section.
Energies 17 02957 g001
Figure 2. Predicted and experimental H-η curve of the 18° opening turbine mode.
Energies 17 02957 g002
Figure 3. Mesh of the pump-turbine with splitter blades: (a) spiral case, (b) stay vane and guide vane, (c) runner, (d) draft tube.
Energies 17 02957 g003
Figure 4. Distribution of the pressure monitor points: (a) stay vane and guide vane, (b) the runner with splitter blade, (c) the draft tube.
Energies 17 02957 g004
Figure 5. Velocity graph of the volute for two cases: (a) TH0.9P0.72, (b) TH1.0P0.92.
Energies 17 02957 g005
Figure 6. Velocity vector graph of guide vanes: (a) TH0.9P0.72, (b) TH1.0P0.92.
Energies 17 02957 g006
Figure 7. Velocity distribution along the circumferential direction in the vaneless area.
Energies 17 02957 g007
Figure 8. Velocity graph of the splitter blades channel for two cases: (a) TH0.9P0.72, (b) TH1.0P0.92.
Energies 17 02957 g008
Figure 9. Velocity vector graph of draft tube: (a) TH0.9P0.72, (b) TH1.0P0.92.
Energies 17 02957 g009
Figure 10. Pressure in vanes during a rotation cycle for two cases: (a) 0T TH0.9P0.72, (b) 1/4T TH0.9P0.72, (c) 2/4T TH0.9P0.72, (d) 3/4T TH0.9P0.72, (e) 0T TH1.0P0.92, (f) 1/4T TH1.0P0.92, (g) 2/4T TH1.0P0.92, (h) 3/4T TH1.0P0.92.
Energies 17 02957 g010
Figure 11. Velocity streamlines in the impeller during a rotation cycle: (a) 0T TH0.9P0.72, (b) 1/4T TH0.9P0.72, (c) 2/4T TH0.9P0.72, (d) 3/4T TH0.9P0.72, (e) 0T TH1.0P0.92, (f) 1/4T TH1.0P0.92, (g) 2/4T TH1.0P0.92, (h) 3/4T TH1.0P0.92.
Energies 17 02957 g011
Figure 12. Vortex rope in the draft tube during a rotation cycle for two cases: (a) 0T TH0.9P0.72, (b) 1/4T TH0.9P0.72, (c) 2/4T TH0.9P0.72, (d) 3/4T TH0.9P0.72, (e) 0T TH1.0P0.92, (f) 1/4T TH1.0P0.92, (g) 2/4T TH1.0P0.92, (h) 3/4T TH1.0P0.92.
Energies 17 02957 g012
Figure 13. Peak-to-peak pressure pulse on the vanes monitor points: (a) TH0.9P0.72, (b) TH1.0P0.92.
Energies 17 02957 g013
Figure 14. Peak-to-peak pressure pulse on the rotating runner blade channel monitor points: (a) RP1 series, (b) RP2 series.
Energies 17 02957 g014
Figure 15. Peak-to-peak pressure pulse on the draft tube monitor points.
Energies 17 02957 g015
Figure 16. Pressure pulsation spectrum in vaneless area for two cases: (a) monitor points, (b) TH0.9P0.72, (c) TH1.0P0.92.
Energies 17 02957 g016
Figure 17. Pressure pulsation spectrum of the runner blade channel monitor points: (a) monitor points, (b) TH0.9P0.72, (c) TH1.0P0.92, (d) TH0.9P0.72, (e) TH1.0P0.92. The blades colored by red and blue stands for the short and long blades in a splitter blade pump-turbine unit.
Energies 17 02957 g017
Figure 18. Pressure pulsation spectrum of the draft tube monitor points: (a) monitor points, (b) TH0.9P0.72 dt7, (c) TH0.9P0.72 dt6, (d) TH0.9P0.72 dt5, (e) TH1.0P0.92 dt7, (f) TH1.0P0.92 dt6, (g) TH1.0P0.92 dt5.
Energies 17 02957 g018
Table 1. Parameters of two operation points for unsteady simulation.
Operating ConditionHead (m)Power/Pdes (%)Efficiency (%)
TH1.0P0.921.0 H92.389.6
TH0.9P0.720.9 H72.482.9
Table 2. gv series.
Table 2. gv series.
Casegv1gv2gv3gv4
f/fnA (m)f/fnA (m)f/fnA (m)f/fnA (m)
TH0.9P0.726, 12, 2435.36, 12, 2435.26, 12, 2432.66, 12, 2433.4
TH1.0P0.926, 12, 1844.26, 12, 1840.96, 12, 1839.96, 12, 1839.8
Table 3. RP1 series.
CaseRP1ARP1BRP1CRP1DRP1ERP1FRP1GRP1H
f/fnA (m)f/fnA (m)f/fnA (m)f/fnA (m)f/fnA (m)f/fnA (m)f/fnA (m)f/fnA (m)
TH0.9P0.72205.5209.8208.6206.3204.31, 202.51, 23.80.62.8
TH1.0P0.921, 6, 2010.91, 2011.31, 2010.0208.31, 205.21, 204.415.51, 24.5
Table 4. RS1 series.
CaseRS1ARS1BRS1CRS1DRS1ERS1FRS1GRS1H
f/fnA (m)f/fnA (m)f/fnA (m)f/fnA (m)f/fnA (m)f/fnA (m)f/fnA (m)f/fnA (m)
TH0.9P0.721, 22.41, 2011.21, 208.31, 2, 209.11, 2, 208.512.80.6, 1, 21.50.6, 1, 22.4
TH1.0P0.9212.21, 2012.51, 209.92, 206.41, 2, 203.214.113.712.8
Table 5. dt7 series.
Casedt71dt72dt73dt74
f/fnA (m)f/fnA (m)f/fnA (m)f/fnA (m)
TH0.9P0.720.4, 62.70.4, 62.50.4, 0.7, 63.00.4, 0.7, 62.7
TH1.0P0.920.1, 6, 180.90.1, 6, 180.80.1, 6, 180.80.1, 6, 180.6
Table 6. dt6 series.
Casedt61dt62dt63dt64
f/fnA (m)f/fnA (m)f/fnA (m)f/fnA (m)
TH0.9P0.720.4, 62.50.4, 62.50.4, 0.7, 62.60.4, 0.7, 63.0
TH1.0P0.920.1, 6, 180.60.1, 6, 180.60.1, 6, 180.60.1, 6, 180.6
Table 7. dt5 series.
Casedt51dt52dt53dt54
f/fnA (m)f/fnA (m)f/fnA (m)f/fnA (m)
TH0.9P0.720.4, 0.7, 61.20.4, 0.7, 61.00.4, 60.90.4, 0.7, 60.9
TH1.0P0.920.1, 6, 180.40.1, 6, 180.40.1, 6, 180.40.1, 6, 180.4
Disclaimer/Publisher’s Note: The statements, opinions and data contained in all publications are solely those of the individual author(s) and contributor(s) and not of MDPI and/or the editor(s). MDPI and/or the editor(s) disclaim responsibility for any injury to people or property resulting from any ideas, methods, instructions or products referred to in the content.