Article

Modeling of a Solar Thermal Plant to Produce Hot Water and Steam for a Brewery Factory

by
Kalo G. Traslosheros-Zavala
1,
Ivett Zavala-Guillén
1,
Alexis Acuña-Ramírez
2,
Manuel Cervantes-Astorga
3,
Daniel Sauceda-Carvajal
1,* and
Francisco J. Carranza-Chávez
1,4,*
1
Renewable Energy Laboratory, Applied Physics Division, Centre for Scientific Research and Higher Education of Ensenada (CICESE), 3918 Ensenada-Tijuana Hwy., Ensenada 22860, BC, Mexico
2
Faculty of Engineering, Autonomous University of Baja California (UABC), Benito Juárez Boulevard, Mexicali 21280, BC, Mexico
3
Manufacturing Technologies Engineering, Polytechnic University of Baja California (UPBC), Claridad Avenue, Mexicali 21376, BC, Mexico
4
National Council for Humanities, Sciences and Technologies (CONAHCYT), 1582 Insurgentes Sur Av., Benito Juárez, CDMX 03940, Mexico
*
Authors to whom correspondence should be addressed.
Energies 2024, 17(10), 2300; https://doi.org/10.3390/en17102300
Submission received: 9 April 2024 / Revised: 30 April 2024 / Accepted: 4 May 2024 / Published: 10 May 2024
(This article belongs to the Section A2: Solar Energy and Photovoltaic Systems)

Abstract

:
The environmental impact caused by the intensive exploitation of fossil fuels to generate heat and electricity has already reached a critical level. Also, as the industrial sector is the largest energy consumer, mainly in the form of heat, it has then become compulsive to implement the use of renewable solar heat in industrial processes, such as those found in the food processing and beverages industries, which do not require high temperatures. Consequently, this study examines the viability of supplying heat as hot water at 80 °C and saturated steam at 160 °C to a medium-sized brewery factory through a hybrid solar plant composed of flat plate and parabolic trough collectors and sensible thermal energy storage. The study was conducted numerically using the meteorological conditions of a city different from that where the factory is located because it benefits from higher insolation levels. The mean annual solar fractions achieved were 49.9% for hot water production and 37.3% for steam generation, at a levelized cost of heat of 0.032 USD/kWh, which can be considered competitive if compared against the values reported in other similar solar projects. Also, the decrease in fossil fuel consumption allowed an annual reduction of 252 tons of carbon dioxide emissions.

1. Introduction

The environmental impact caused by the consumption of fossil fuels to generate heat and electricity has already reached a critical level, putting the world at risk of serious climate change. Industry and electricity generation are the sectors with the largest energy consumption and, as a consequence, with the largest carbon dioxide (CO2) emissions as well [1]. Among the different industrial sectors, the non-energy-intensive manufacturing sector is considered the largest consumer of energy worldwide [2]. This sector comprises industries like pharmaceuticals, pulp and paper, textiles, food processing and beverages, paint and coatings, etc. Within these industries, there is a significant number of processes whose operating temperatures lie in the interval 40–260 °C [3], which is suitable for well-developed and commercial solar thermal technologies such as flat plate collector (FPC), evacuated-tube collector (ETC), and parabolic trough collector (PTC) [4].
In general, it has been estimated that 74% of the global consumption of energy by industry is heat, from which 30% corresponds to low-temperature heat (<150 °C), 22% to medium-temperature heat (150–400 °C), and 48% to high-temperature heat (>400 °C) [5]. Provided that FPC and ETC collectors are capable of delivering low-temperature heat, and PTC collector delivers medium-temperature heat [3,6], there is an ideal scenario to promote the use of solar heat for industrial processes (SHIP), especially in the non-energy-intensive manufacturing sector, where the industry of beer production has strategic importance, given the fact that it is the most consumed alcoholic drink in the world [7].
In a brewery, the demand for heat can exceed 70% of the total energy consumed [8]. A significant portion of this heat is spent during the mashing and wort boiling processes [7,8,9]. Mashing needs hot water between 71–82 °C [7], temperatures easily attainable with a field of FPC or ETC collectors. On the other hand, the boiling of the wort occurs at around 100 °C [9], thus it could be powered with steam of higher temperature, achievable with an arrangement of PTC collectors. Hot water and steam are also needed for other operations, such as washing, cleaning, and sterilization. Eiholzer et al. [10] have made a detailed analysis of the amounts of heat and temperatures required by the different operations of a medium-sized brewery.
Just like for any other industrial process, the integration of solar heat into a brewing process can be performed at the supply level or process level. Supply-level integration is usually easier because the solar heat is supplied to the central boiler for hot water or steam production, providing more flexibility for the set temperature of the solar thermal system [11]. In addition to the field of solar collectors, the integration project will also need a thermal energy storage system (TES) because solar radiation is intermittent by nature. The most straightforward way to store thermal energy is as sensible heat; however, it can also be stored as latent heat or thermochemically. These last two offer the advantage of considerably higher stored energy density. However, according to Koçak et al. [2], only sensible thermal energy storage (STES) offers cost-effective solutions for medium- to high-temperature industrial applications. Nonetheless, it has the disadvantage of requiring large volumes to accumulate a given amount of heat [2,12]. Yet, expenses can be reduced if low-cost storage materials are employed.
The integration of solar heat at the supply level to feed the processes requiring hot water at 80 °C in a brewery located in Scotland, UK, has been studied by Eiholzer et al. [10]. They analyzed the replacement of the central boiler by a field of either FPC or ETC collectors, a stratified hot water storage tank, and an auxiliary heater. Solar fractions of 6.8% and 7.7% were obtained for each collector type. They argued that without government restrictions on the solar plant capacity, the solar fraction with ETC collectors could rise to 13.6%. Mauthner et al. [13] investigated the technical feasibility of integrating solar heat for the processes of mashing (58–78 °C), can pasteurizing (63–65 °C), and malt drying (35–55 °C) in three breweries located in Goess, Austria, Valencia, Spain, and Vialonga, Portugal. The integration was performed at the process level with FPC collectors and STES tanks, using water as heat transfer fluid (HTF) and storage material. Simulations produced solar fractions of 30%, 45%, and 20% for each process, correspondingly.
The number of studies dealing with the incorporation of solar heat into a brewing process is limited; however, additional works can be found on the use of solar heat in other food processing and beverages industries. At supply level integration, Silva et al. [14] achieved an average annual solar fraction of 34.9% in the production of steam at 120 °C for a tomato preservation factory in Andalucía, Spain, making use of stratified STES and PTC collectors. Bolognese et al. [15] obtained 23% of the solar fraction by combining PTC collectors with an STES tank to supply pressurized hot water at 135 °C for the drying process of a pasta factory in Molina, Italy. Biencinto et al. [16] modeled the heat demand at 85 °C to pasteurize milk, employing PTC collectors and latent thermal energy storage (LTES) at two locations, Graz, Austria, and Almería, Spain, obtaining annual solar fractions of 27% and 52%, respectively.
It is evident from the works reviewed that both schemes of solar heat integration in the food processing and beverages industries can lead to important energy savings and reductions in CO2 emissions as a consequence. Particularly for breweries, the use of FPC or ETC collectors to generate hot water has been addressed successfully; however, the simultaneous production of hot water and steam through a hybrid system composed of two types of collectors has not been conducted despite the potential benefits that it could convey, as demonstrated by Tian et al. [17], who modeled a hybrid solar field made of FPC and PTC collectors for district heating. Therefore, it is the objective of this work to evaluate the capability of a hybrid solar plant composed of FPC and PTC collectors, stratified STES tanks, an economizer, and a steam generator to meet the hot water and steam requirements of the medium-sized brewery analyzed by Eiholzer et al. [10], but at the weather conditions of Ensenada, Mexico, provided that this city hosts a flourishing brewing industry and experiences high levels of solar insolation. Stratified tanks were used for sensible heat storage as they provide a well-developed and practical solution in this type of industry, as well as a straightforward approach in terms of numerical implementation.

2. Heat Demand and Proposed Solar Plant

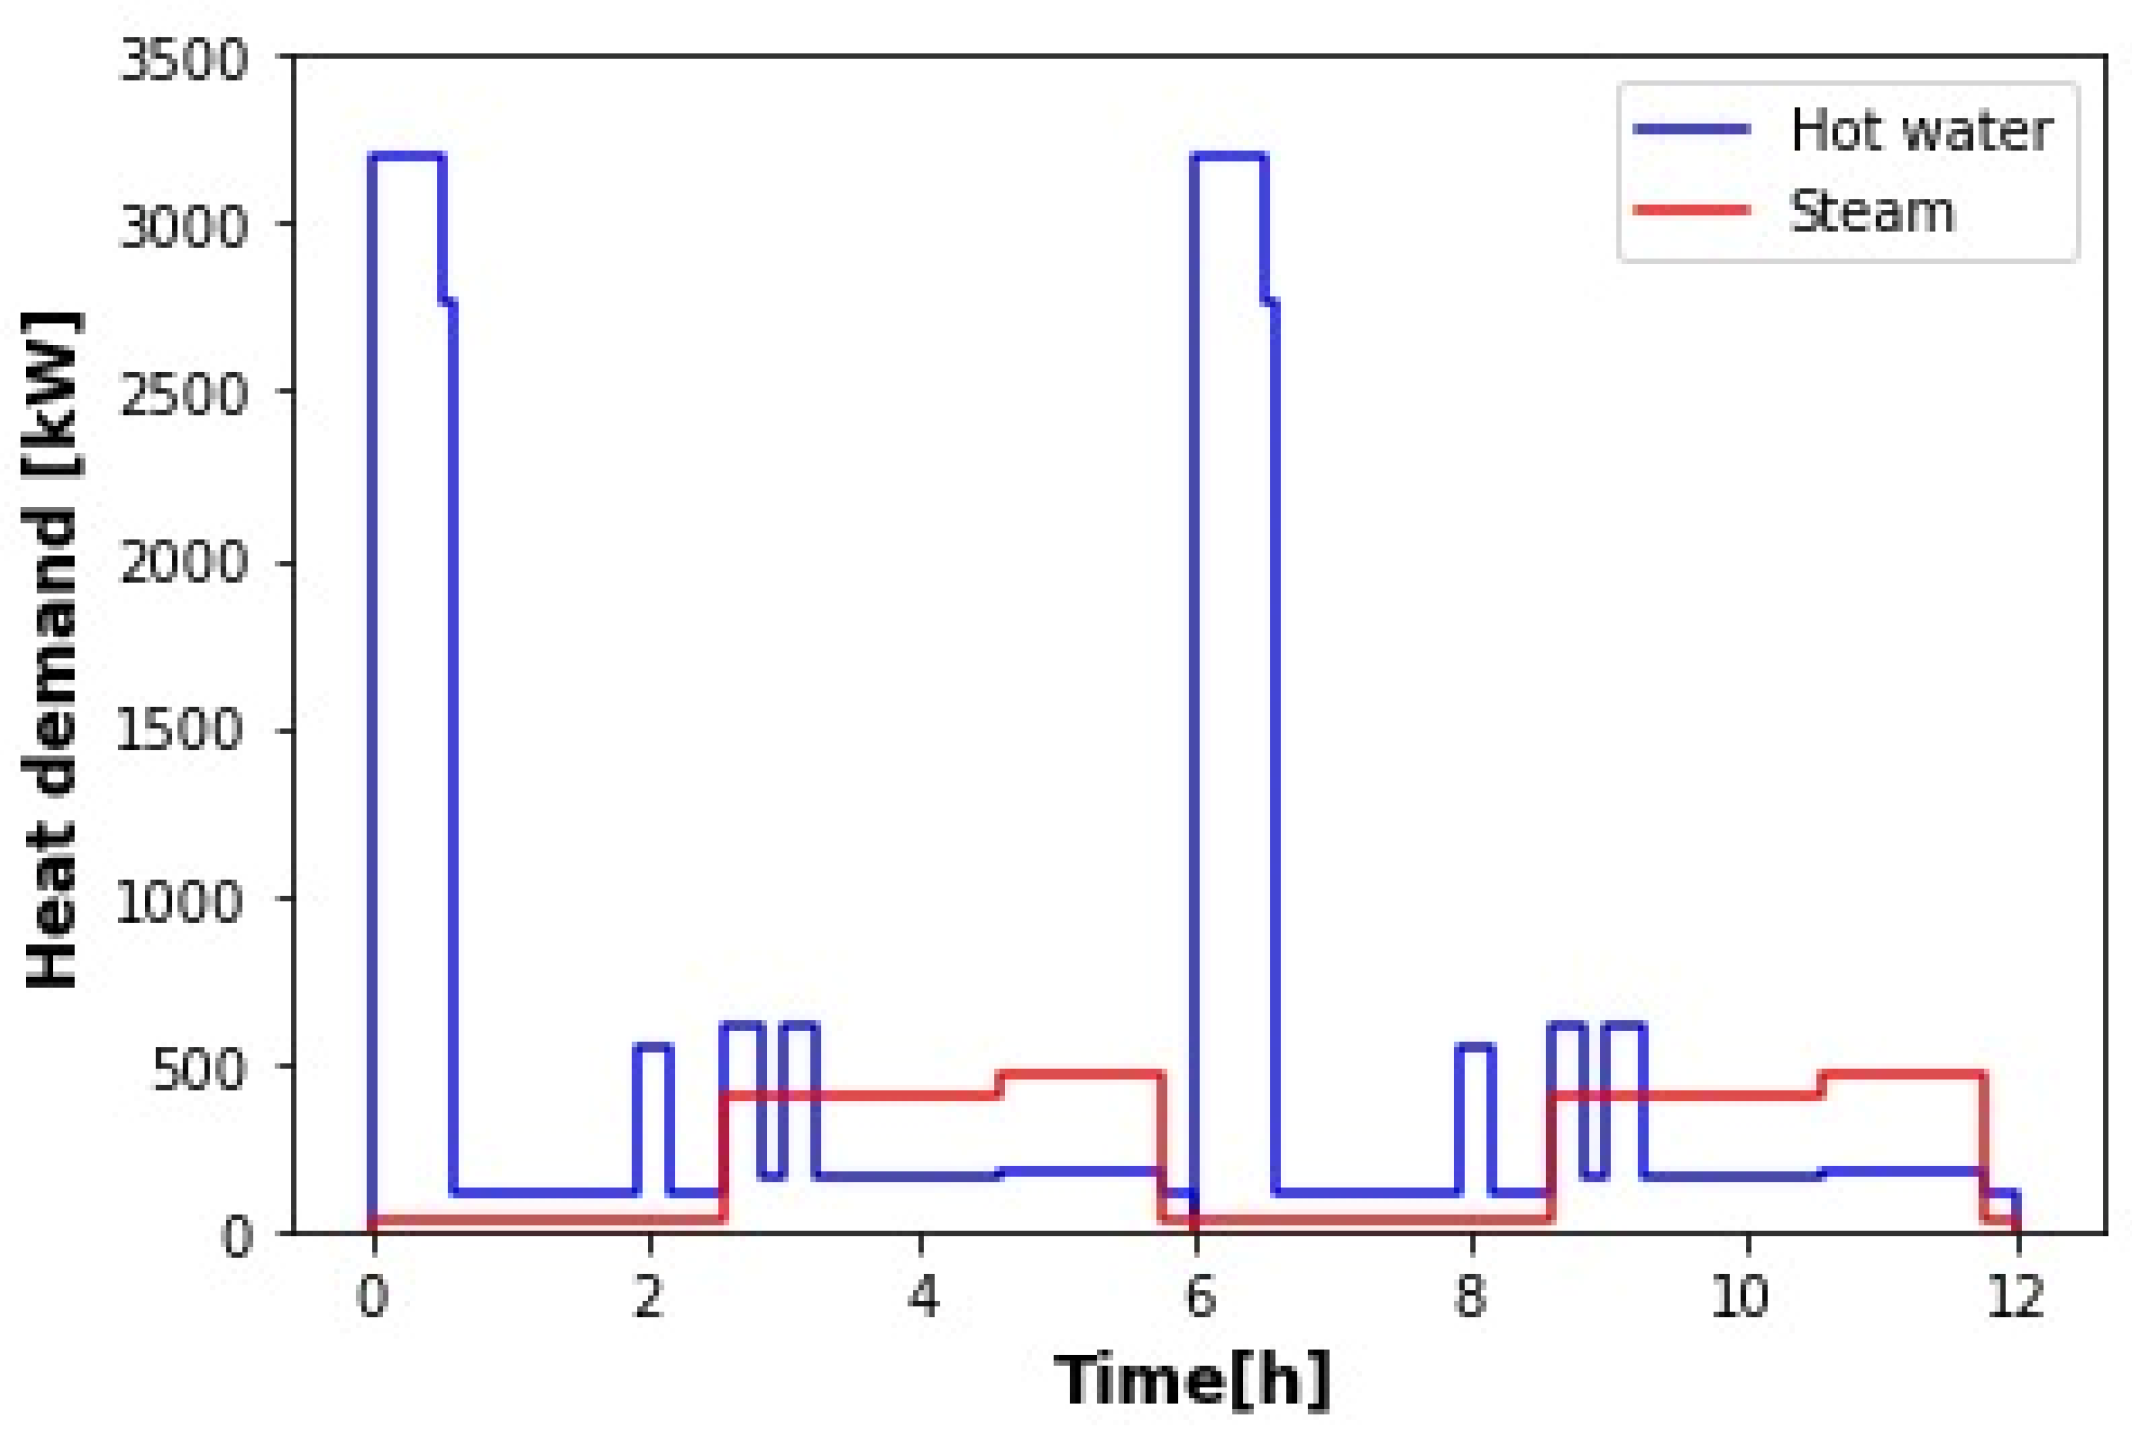
The description of each step of the brewing process selected for this study and the corresponding amounts of heat, mass flow rates, and temperatures required for each stream have already been given by Eiholzer et al. [10]. The brewery works 300 days a year and processes four batches per day. Each batch is completed in 6 h. Considering only the operations that require heating (mashing, wort preheating and boiling, cleaning, and keg washing), the heat demand consists then of the production of hot water at 1 bar and 80 °C and saturated steam at 6 bar and 160 °C. The authors only examined the supply of hot water with solar energy. For steam generation, flue gas was used. As the purpose of this work is to produce both hot water and steam with solar energy, then, from the data provided by the authors, the curves of heat demand were determined. They are shown in Figure 1. Only two batches were considered (diurnal operation), starting at 6 a.m. The times and mass flow rates ( m ˙ ) used to calculate the heat demands ( Q ˙ ) per batch are listed in Table 1.
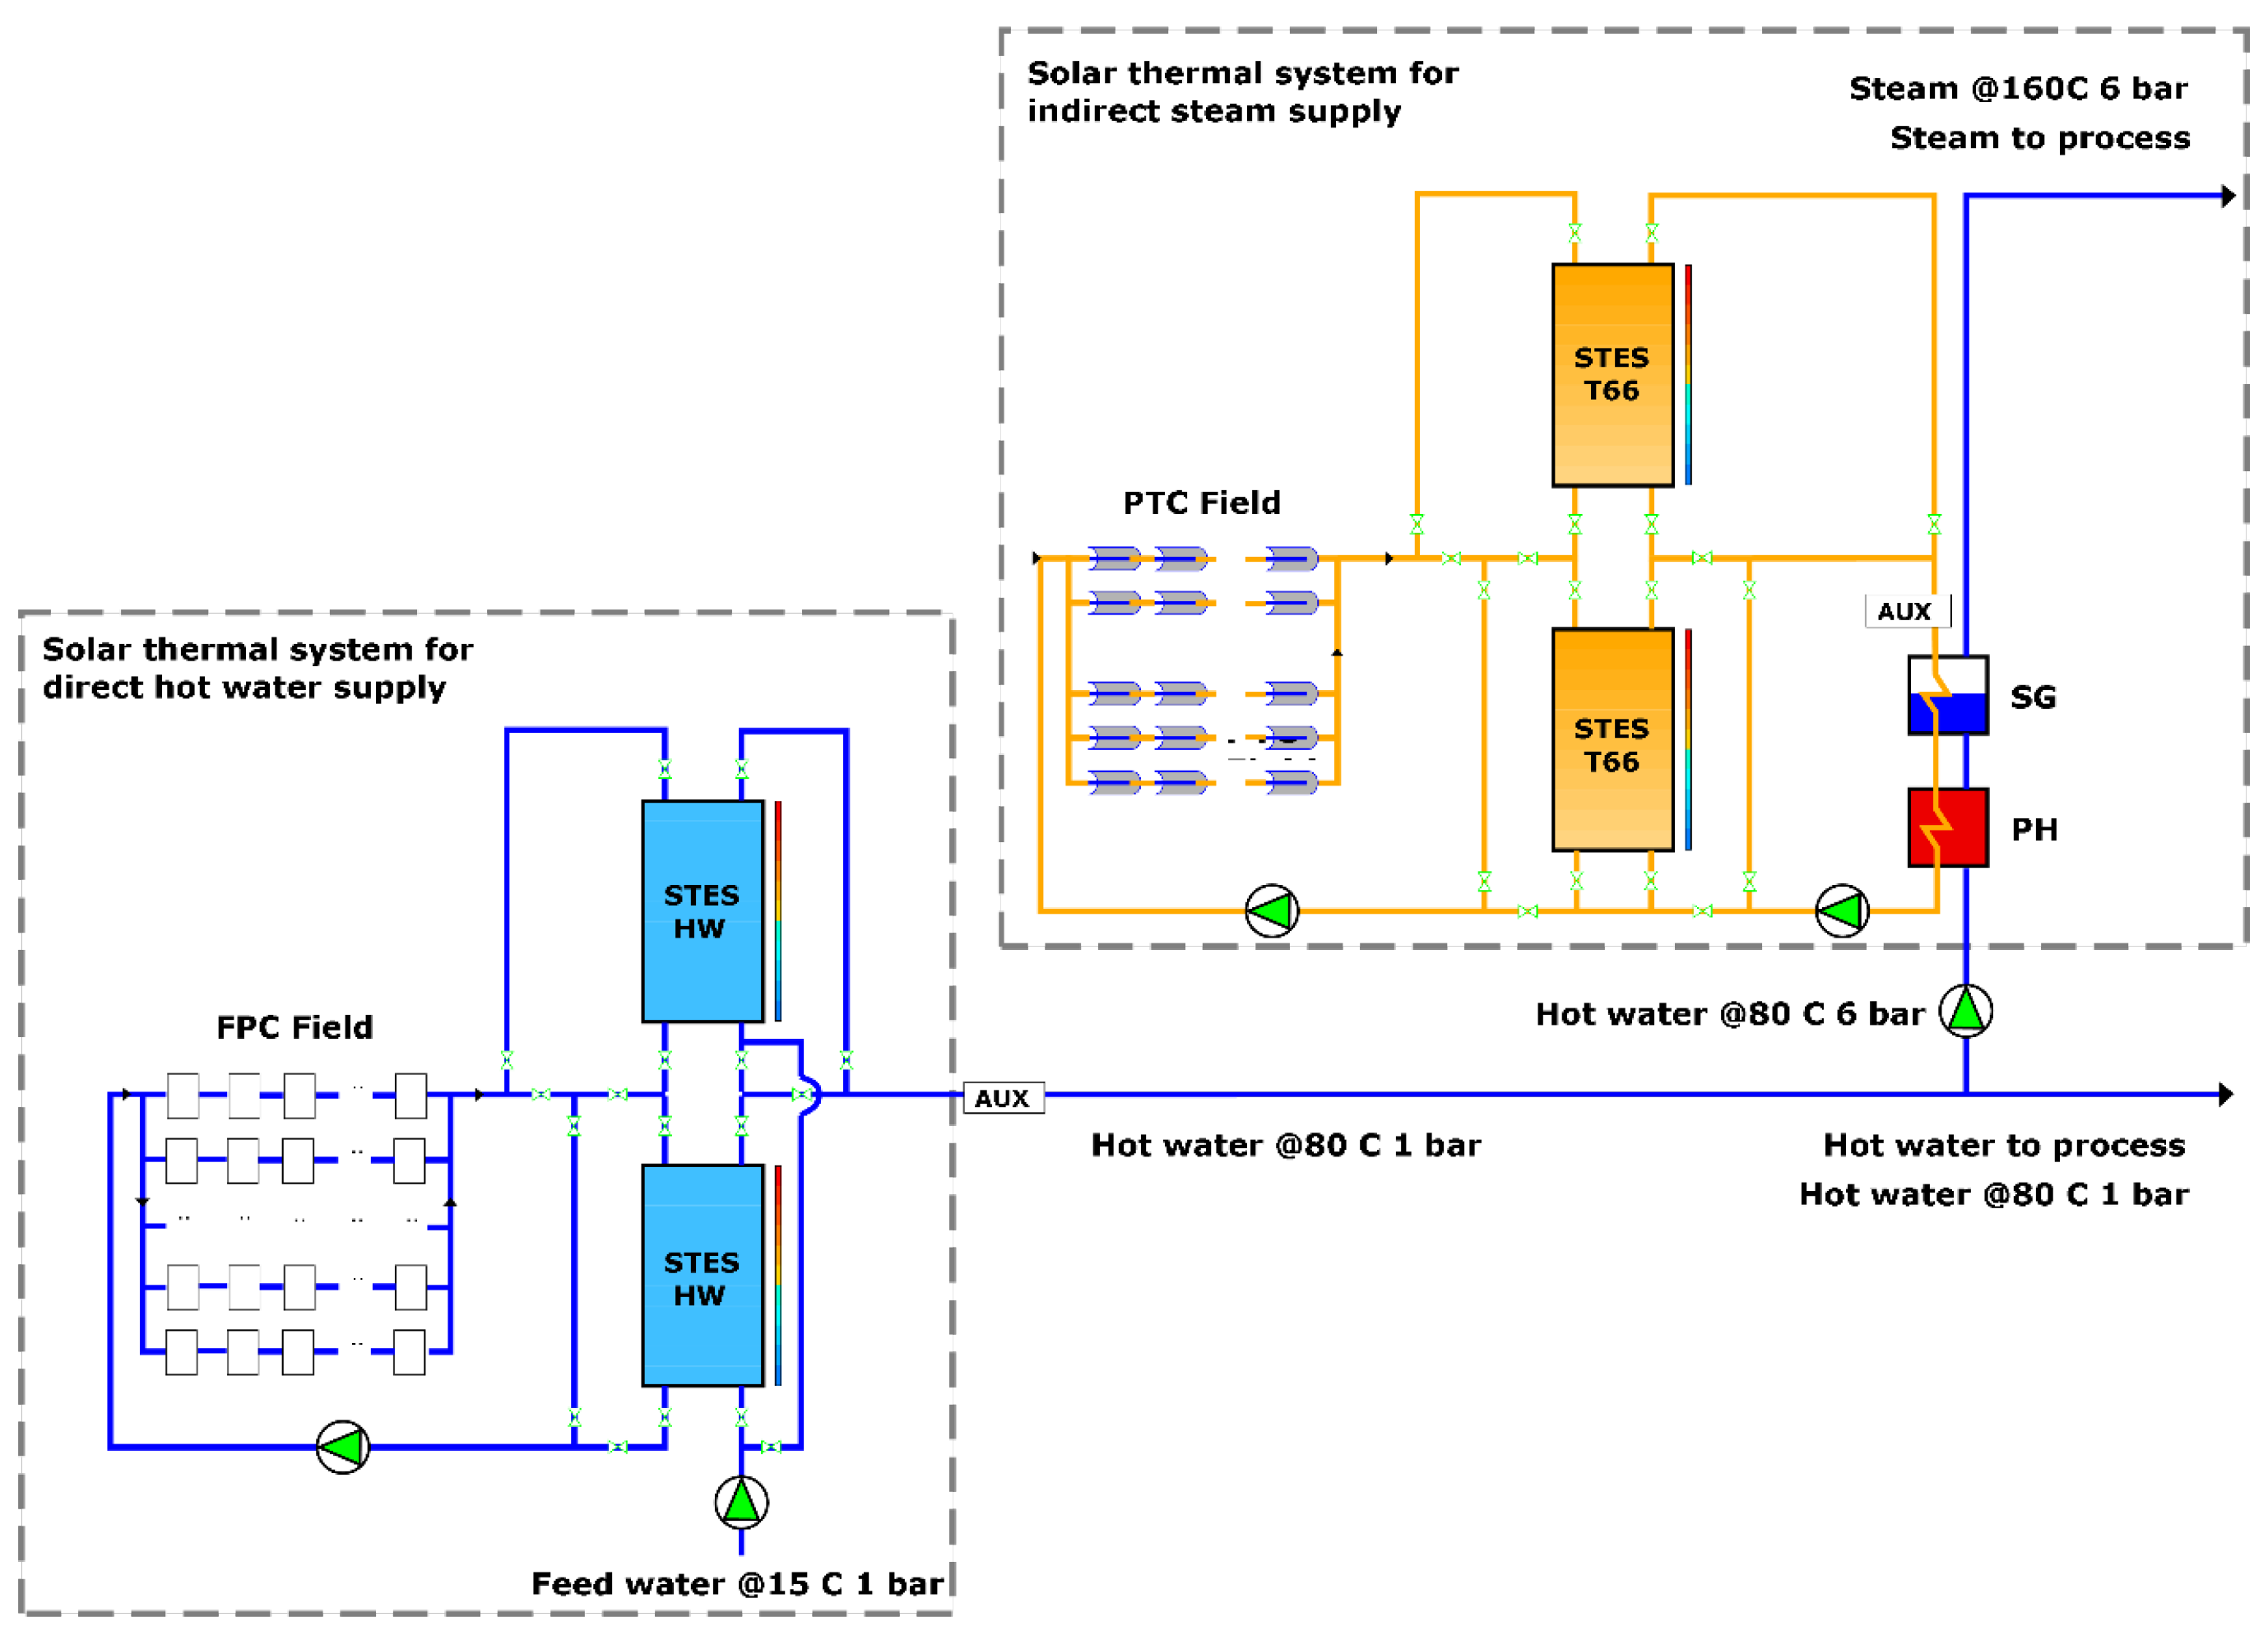
It can be observed in Figure 1 that the hot water demand presents significant variations over time, with the highest peaks during mashing. The other peaks correspond to simultaneous cleaning and keg washing. Throughout the whole time period, hot water is also needed for cleaning. The total heat requirement for hot water production Q h w for the two batches is 5837.5 kWh. Steam is also constantly demanded for keg washing. As in this work, the aim is to perform the operations of wort preheating and boiling with saturated steam instead of flue gas, the peaks shown in Figure 1 correspond to these two processes. The total amount of heat needed for steam production Q s for the two batches is 2817.9 kWh. The solar plant proposed to meet the total heat demand is schematized in Figure 2.
The plant is composed of two subsystems: one for hot water and one for saturated steam. The first subsystem also provides the water that is converted to steam. A total of 250 FPC collectors arranged in five parallel lines, each with ten sets of five collectors in series, two stratified STES tanks, two pumps, one auxiliary heating system, and a series of valves comprise the first subsystem. Water is employed as HTF and storage material. For the second subsystem, eight parallel lines of five PTC collectors in series, two stratified STES tanks, three pumps, one economizer (feedwater preheater, PH), one steam generator (SG), one auxiliary heating system, and a group of valves are used. Therminol 66® (T66) is the HTF and storage material in this case. The suggestion of Silva et al. [14] to use an economizer before the steam generator was implemented. The auxiliary heating systems help to reach the set temperatures when the solar plant cannot make it due to the inherent intermittency of solar radiation.
The FPC collector selected for this study is the SunEarth TR40 [18]. The chosen PTC collector is the NEP PolyTrough 1800 [19]. Their technical specifications are given in Table 2. A shell-and-tube heat exchanger (HX) with one shell pass and two tube passes was used as a steam generator. Hot T66 oil flows inside the tubes while liquid saturated water at 6 bar and 160 °C is on the shell side. A plate-type, liquid-to-liquid HX in counterflow was employed to increase the feedwater temperature to saturation conditions. The design of both HXs was completed with the ε-NTU (effectiveness–number of transfer units) method [20]. The analysis of the auxiliary heating systems, pumps, and piping systems was skipped for the moment.

3. Modeling

3.1. Solar Collectors

To investigate the performance of the solar plant, it is necessary to model the thermal performance of each collector. From the technical specifications and efficiency equations given by the manufacturer, it is possible to determine the useful heat gain Q u for each collector; thus, for the FPC collectors’ field
Q u F P C = A u F P C   I t [ K ( θ ) F P C   c 0 c 1 ( T i T a ) I t   ]
where A u F P C is the useful area of the FPC field, I t is the total solar irradiation at the collectors plane, K ( θ ) F P C is the incidence angle modifier, T i is the fluid inlet temperature, T a is the ambient temperature, c 0 = 0.709, and c 1 = 6.801 [18]. For the field of PTC collectors
Q u P T C = A u P T C   D N I [ K ( θ ) P T C   η 0 a 1 ( T i T a ) D N I a 2 ( T i T a ) 2 D N I   ]
where A u P T C is the useful area of the PTC field, D N I is the direct normal irradiation, K ( θ ) P T C is the incidence angle modifier, η 0 is the optical efficiency ( η 0 = 0.689), a 1 = 0.36, and a 2 = 0.0011 [19]. Since θ is the incidence angle, the equations to compute the incidence angle modifiers are [18,19]
K ( θ ) F P C = 1.00087 ( 0.00247 ) θ + ( 1.47654   × 10 4 ) θ 2 ( 3.69367 × 10 6 ) θ 3 + ( 1.09266 × 10 6 ) θ 4
K ( θ ) P T C = 0.99807 + ( 0.00043304 ) θ ( 0.00018659 ) θ 2 + ( 5.4105 × 10 6 ) θ 3 ( 6.5303 × 10 8 ) θ 4

3.2. Stratified STES Tanks

Different models to describe the time evolution of the fluid temperature within a STES tank can be found in the literature. The 0D model is the simplest, but it cannot reproduce the stratification process. 1D methods like the multinode model divide the tank into several disks or nodes assuming the thermophysical properties are constant, then apply mass and energy balance equations to each node and solve the set of equations numerically. The 2D and 3D methods are far more complex since they solve the energy, momentum, and mass balance equations in each of the control volumes in which the tank is divided. They can predict the flow and temperature dynamics of the charging and discharging processes and additional phenomena like natural convection.
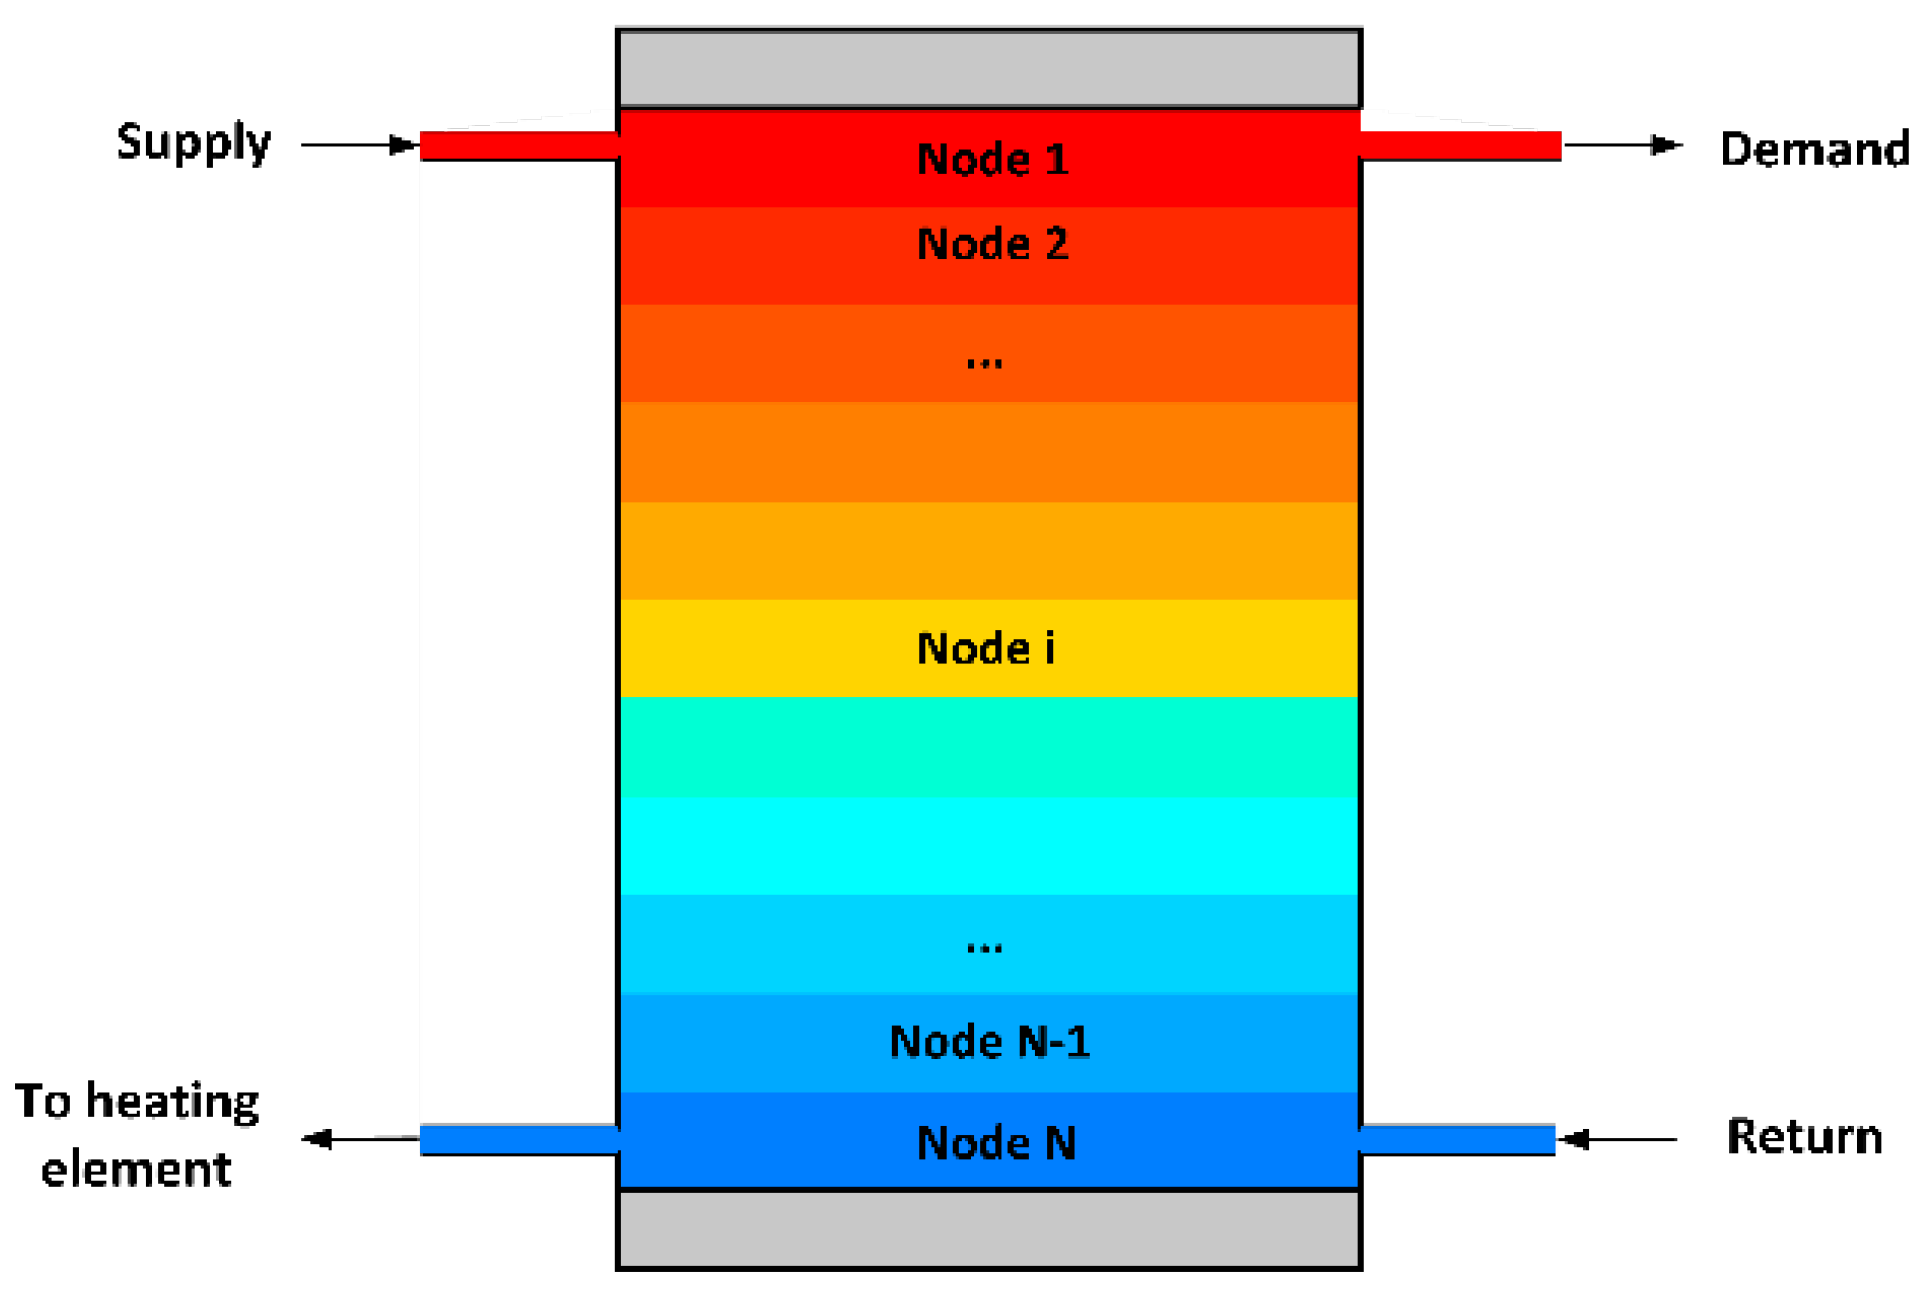
The 2D and 3D models can be very useful for tank design. However, comparative studies have shown that the 1D and 2D models predict similar temperature profiles along the tank height in time [21]; thus, for simplicity, the 1D multimode model developed by Cadau et al. [22] is used here. Considering the stratified STES tank shown in Figure 3, the application of the mass and energy conservation equations for node i gives
V ˙ v e r t o u t = m ˙ i n ρ ( T i n ) + V ˙ v e r t i n m ˙ o u t ρ ( T i )
M C p d T i d t = m ˙ i n C p T i n m ˙ o u t C p T i V ˙ v e r t o u t   ρ ( T v e r t o u t   ) C p T v e r t o u t + V ˙ v e r t i n   ρ ( T v e r t i n   ) C p T v e r t i n + k ( T i 1 T i ) k ( T i T i + 1 ) U A ( T i T a )
where V ˙ is the volume flow rate, ρ is the fluid density, T is the temperature, M is the mass of the fluid, C p is the fluid specific heat, k is the fluid thermal conductivity, t is time, and U A is the overall heat loss coefficient. Subindices i n and o u t denote entry or exit, and v e r t means vertical. V ˙ v e r t i n and V ˙ v e r t o u t are assumed positive when the flow is downwards. Accordingly, the nodes corresponding to T v e r t i n and T v e r t o u t are defined as
T v e r t i n = { T i 1                       i f   V ˙ v e r t i n > 0 T i                               i f   V ˙ v e r t i n < 0
T v e r t o u t = { T i                       i f   V ˙ v e r t o u t > 0 T i + 1             i f   V ˙ v e r t o u t < 0
The energy balance of Equation (4) considers the external energy flow coming in, internal energy flow going out, heat transfer by energy flow between adjacent nodes, thermal losses to adjacent nodes, and thermal losses to the surroundings. The resulting set of equations can be solved through Euler forward method, and the time evolution of every node’s temperature can be found.
The 1D model by Cadau et al. [22] is valid only when there is an external circulation (i.e., charging or discharging). When the tank is left still, the fluid experiences internal natural convection only, and Equation (4) can lead to physically inconsistent results in the temperature profiles along the tank height. However, this problem can be solved through computational artifices, such as temperature inversion [23], wherewith the argument that the largest temperature value must be at the top of the tank at any given time, a simple instruction can be made in the algorithm to correct the profile.

3.3. Heat Exchangers

The ε-NTU method employed here to determine the HXs heat transfer area is already well established, and an in-depth description of it can be found in any heat transfer textbook. For each HX, the method works through the calculations of the heat capacities of each stream (labeled as C m i n and C m a x depending on their value), the maximum possible heat transfer rate, the actual heat transfer rate, the overall heat transfer coefficient ( U ), and the heat transfer area (A), making use of already defined ε-NTU relations. For the steam generator (shell-and-tube HX)
ε = 1 exp ( N T U )
and for the economizer
ε = 1 exp [ N T U   ( 1 C * ) ] 1 C *   exp [ N T U   ( 1 C * ) ]
where C * = C m i n / C m a x and N T U = U A / C m i n [20]. According to Fernández-Torrijos et al. [24], the ε-NTU relations for a concentric-tube HX are valid for a plate HX as long as the number of plates is large enough (more than 40). The geometrical parameters and heat transfer coefficients of the HXs employed in this work are summarized in Table 3.

3.4. Solar Plant Dimensioning and Operation Modes

The size of the solar plant was based on the annual heat requirements and the annual average solar irradiation available in the proposed brewery location in the city of Ensenada, BC, Mexico (31.9° N, 116.7° W). To maximize the collection of energy throughout the year, the position assumed for each FPC collector was facing south and tilted 30°. Also, each PTC collector was positioned with its longitudinal axis north–south oriented. The volume of the stratified STES tanks for direct hot water supply was determined according to the mass flow rate requirements of one batch. It was done similarly for the stratified T66 oil STES tanks for indirect steam generation. In addition, each of the four STES tanks was of cylindrical shape, with an aspect ratio (height/diameter) of 3 in order to minimize the mixing coefficient and maximize stratification [25]. In Table 4, the size and operation parameters of the solar plant are summarized.
As an initial effort to meet the heat demand, characterized by important fluctuations throughout the batch time period, it was decided to implement only two operation modes of the solar plant: STES charging and STES discharging. In this way, the purpose of the solar field was to provide thermal energy only to charge the tanks. The mass flow rates and heat demand of the first batch brewing period (6 a.m.–12 p.m.) were supplied with the discharging of one hot water tank and one T66 oil tank (assuming that they were charged the day before). During this first time period, the other two tanks were charged in order to be used in the second batch brewing period (12–6 p.m.). Throughout this second period, the first two tanks were now charged for next-day operation. At night, the STES tanks were left in idle mode, with heat loss to the ambient only at a global loss coefficient of 1 W/m2∙K [26,27].
In Figure 4 and Figure 5, the diagrams of the two solar plant subsystems are presented again with all of the valves required for the two operation modes labeled. The valves that needed to be opened for each operation mode are indicated in Table 5. During the charging mode of each stratified water tank, hot water leaving the FPC collector field entered the tank at the top, increasing the node temperature. Water from the last node, located at the bottom, circulated back to the solar field to gain thermal energy and continue charging the tank. The ideal scenario was to reach the desired set temperature T s e t h w = 80 °C. During the discharging mode, hot water from the top node was sent directly to the process, while feedwater entered the tank at the bottom in an open loop scheme. The same charging approach was also applied to each T66 oil STES tank; however, for the discharge, a closed loop was followed; hot T66 oil at a set temperature T s e t T 66 = 252 °C was sent to the HXs, returning to the tank at a return temperature of T r e t T 66 = 155 °C. In parallel, hot water at 80 °C and 6 bar entered the preheater first to reach saturation conditions and then to the steam generator to change phase.
To quantify the viability of the solar plant, it is common practice to use the concept of solar fraction ( S f ), which can be understood as the relation between the solar heat delivered to the process Q u and the process heat demand Q p r o c e s s
S f = Q u Q p r o c e s s
Every time when the set temperatures could not be reached using solar heat only, the auxiliary heating systems were employed to provide additional heating and meet the requirement. Thus, Q p r o c e s s can also be seen as the sum of solar heat and auxiliary heat ( Q a u x ).

3.5. Solution Procedure and Validation

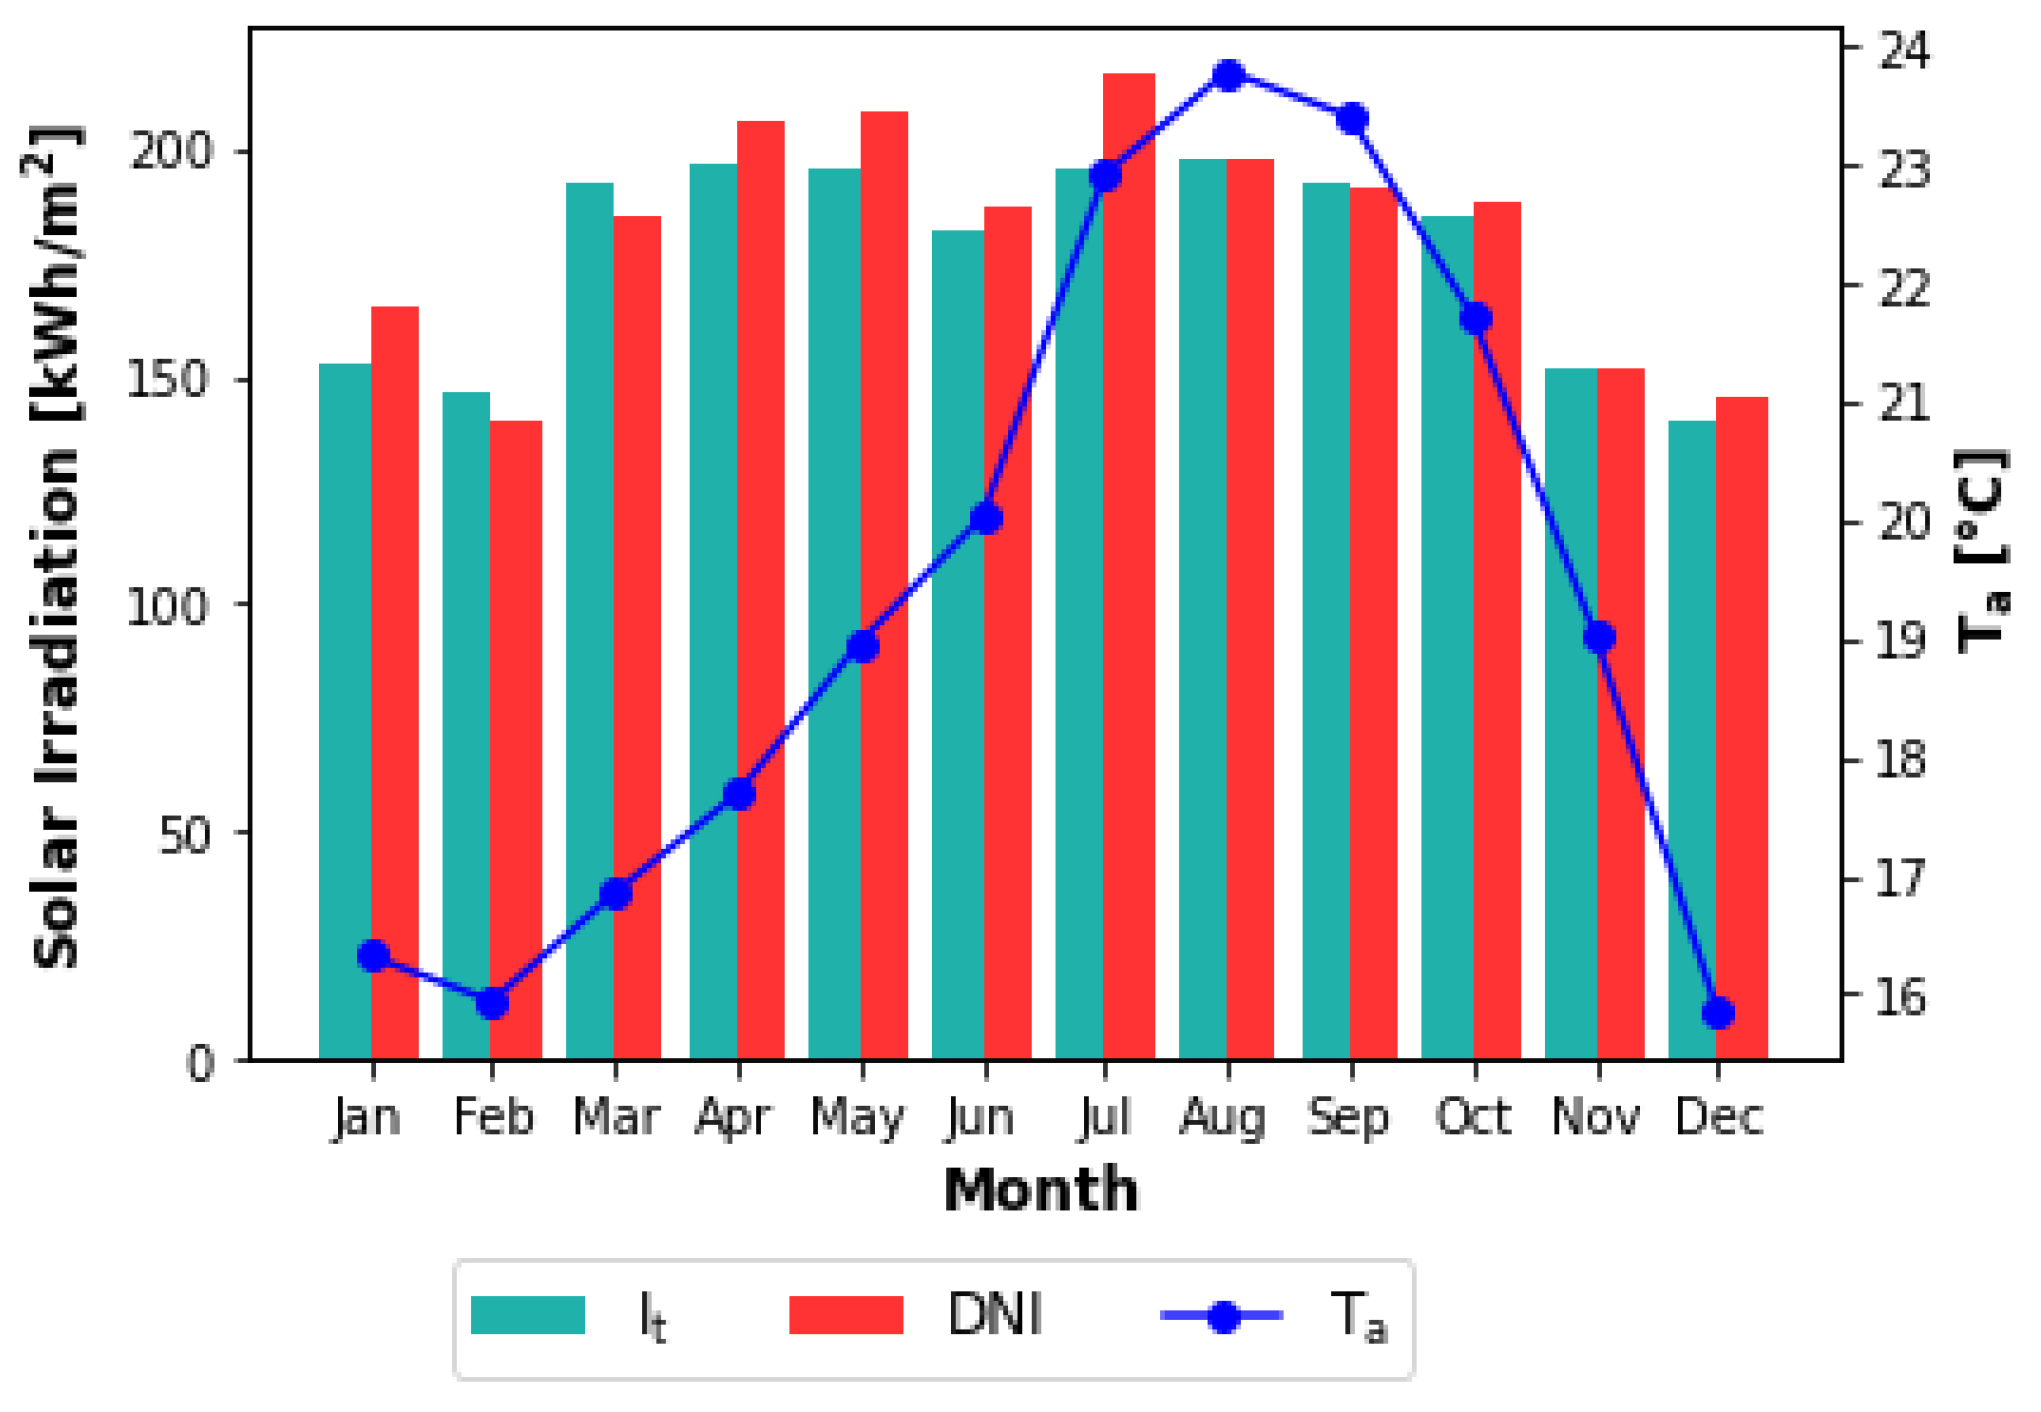
To model the thermal performance of the proposed solar plant, an in-house code was written in the open-source software Python. The thermophysical properties were obtained from the free library CoolProp [28]. The typical meteorological year (TMY) at the project location was also employed. The TMY can be generated using weather information of free access like that provided by the NASA Power Project [29]. The monthly average daily values of solar irradiation on the collector plane ( I t ) and direct normal irradiation ( D N I ) are given in Figure 6, together with the average ambient temperature ( T a ). Simulations were performed for the 365 days of the year. Flow diagrams of the solution procedure are provided in Figure 7a for the tanks charging and discharging during the first batch brewing period (6 a.m.–12 p.m.), and in Figure 7b, the second batch brewing period (12–6 p.m.). The time increment applied was 1 h, and steady-state conditions were assumed during each hour.
Equations (1) and (2), which describe the heat gain of both collector types, are based on experimental data made available by the manufacturer. Thus, they do not need to be validated. On the other hand, validation is required for the STES tanks model. The charging process was validated against the experimental work of González-Altozano et al. [26], who analyzed the charging process of a 0.9 m3 stratified hot water tank until 120% of the volume was replaced ( t = 4073 s). The tank dimensions were 1.8 m in height and 0.8 m in diameter. Initially, the tank was at 20 °C. A constant water flow rate of 16 dm3/min at 52 °C was delivered at the top. Twelve thermocouples uniformly distributed along the vertical axis measured the temperature every 5 s. The overall heat loss coefficient through the walls was 5.77 W/K. Figure 8 shows the comparison between the measured temperature distribution and the results obtained here employing 12 nodes. An additional verification was also conducted against the semi-analytic methodology developed by Unrau [30]. It is plotted in Figure 9a.
It can be seen in Figure 8 that by the end of the time period analyzed, nearly all of the experimental nodes reached the same temperature (~51 °C), while only eight of the simulated nodes approached that temperature. According to Cadau et al. [22], this deviation is due to the fact that 1D models, like the one used here, fail to reproduce the three-dimensional phenomena present in the tank when there is high incoming flow relative to the tank size. The nodes located far from the inlet section are those with the larger deviations from experimental measurements. Despite these differences, it is considered that 1D models can satisfactorily predict the storage tank temperatures without excessive computational effort, which can be seen sometimes as an advantage for industry simulation. Regarding the verification against the semi-analytic method of Unrau [30], plotted in Figure 9a, a close agreement between the results of both methods can be appreciated for all nodes. A summary of the validation and verification results of the charging process is given in Table 6 for 12 nodes, where a maximum difference of 14.5% with respect to the experimental measurements can be observed. As it can be observed, the model underestimates the real temperature in the lowest part of the tank. Thus, in real applications, the solar heat available would be higher than predicted, helping to achieve a slightly larger solar fraction.
The discharging process was verified, employing only the semi-analytical methodology developed by Unrau [30]. The same storage tank dimensions and flow rate conditions used for charging were considered. The results can be seen in Figure 9b, where a maximum difference of 2.7% was obtained. In addition, Cadau et al. [22] argued that it is not necessary to split the tank into many nodes to improve the accuracy of the temperature predictions, but rather, a small number of nodes is enough. To investigate this argument, the charging and discharging curves for six and twelve nodes are plotted in Figure 10a,b, respectively. A strong similarity in the final temperature values reached by the nodes can be perceived in the two cases, thus proving that six nodes are sufficient to appropriately model the charge and discharge of the STES tanks.

3.6. Economic Analysis

A first cost estimation of the proposed solar plant was calculated in terms of the levelized cost of heat (LCOH), which is a measure of the present value of the total cost of building and operating the solar plant over its assumed lifetime. It calculates the cost per unit of heat produced, allowing the comparison between the solar plant and other technologies. The simplest formula to compute the LCOH is the following [31]
L C O H = I o + t = 1 L T C O & M ( 1 + r ) t t = 1 L T Q u ( 1 + r ) t
where I o is the total installation cost after the deductible tax percentage, C O & M is the annual operation and maintenance cost, r is the annual discount rate (related to inflation), Q u is the useful thermal energy produced in one year, L T is the assumed lifetime of the solar plant (in years), and t is the year number. In Table 7, there is an estimation of the economic parameters needed to compute the LCOH based on the data given by Burkhardt et al. [32], Dieckmann et al. [33], Mohammadi et al. [34], and Zheng at al. [35]. In Mexico, renewable energy projects are 100% tax-deductible, implying that a reduction of up to 30% of the initial investment can be achieved.

4. Results

4.1. Hot Water Production

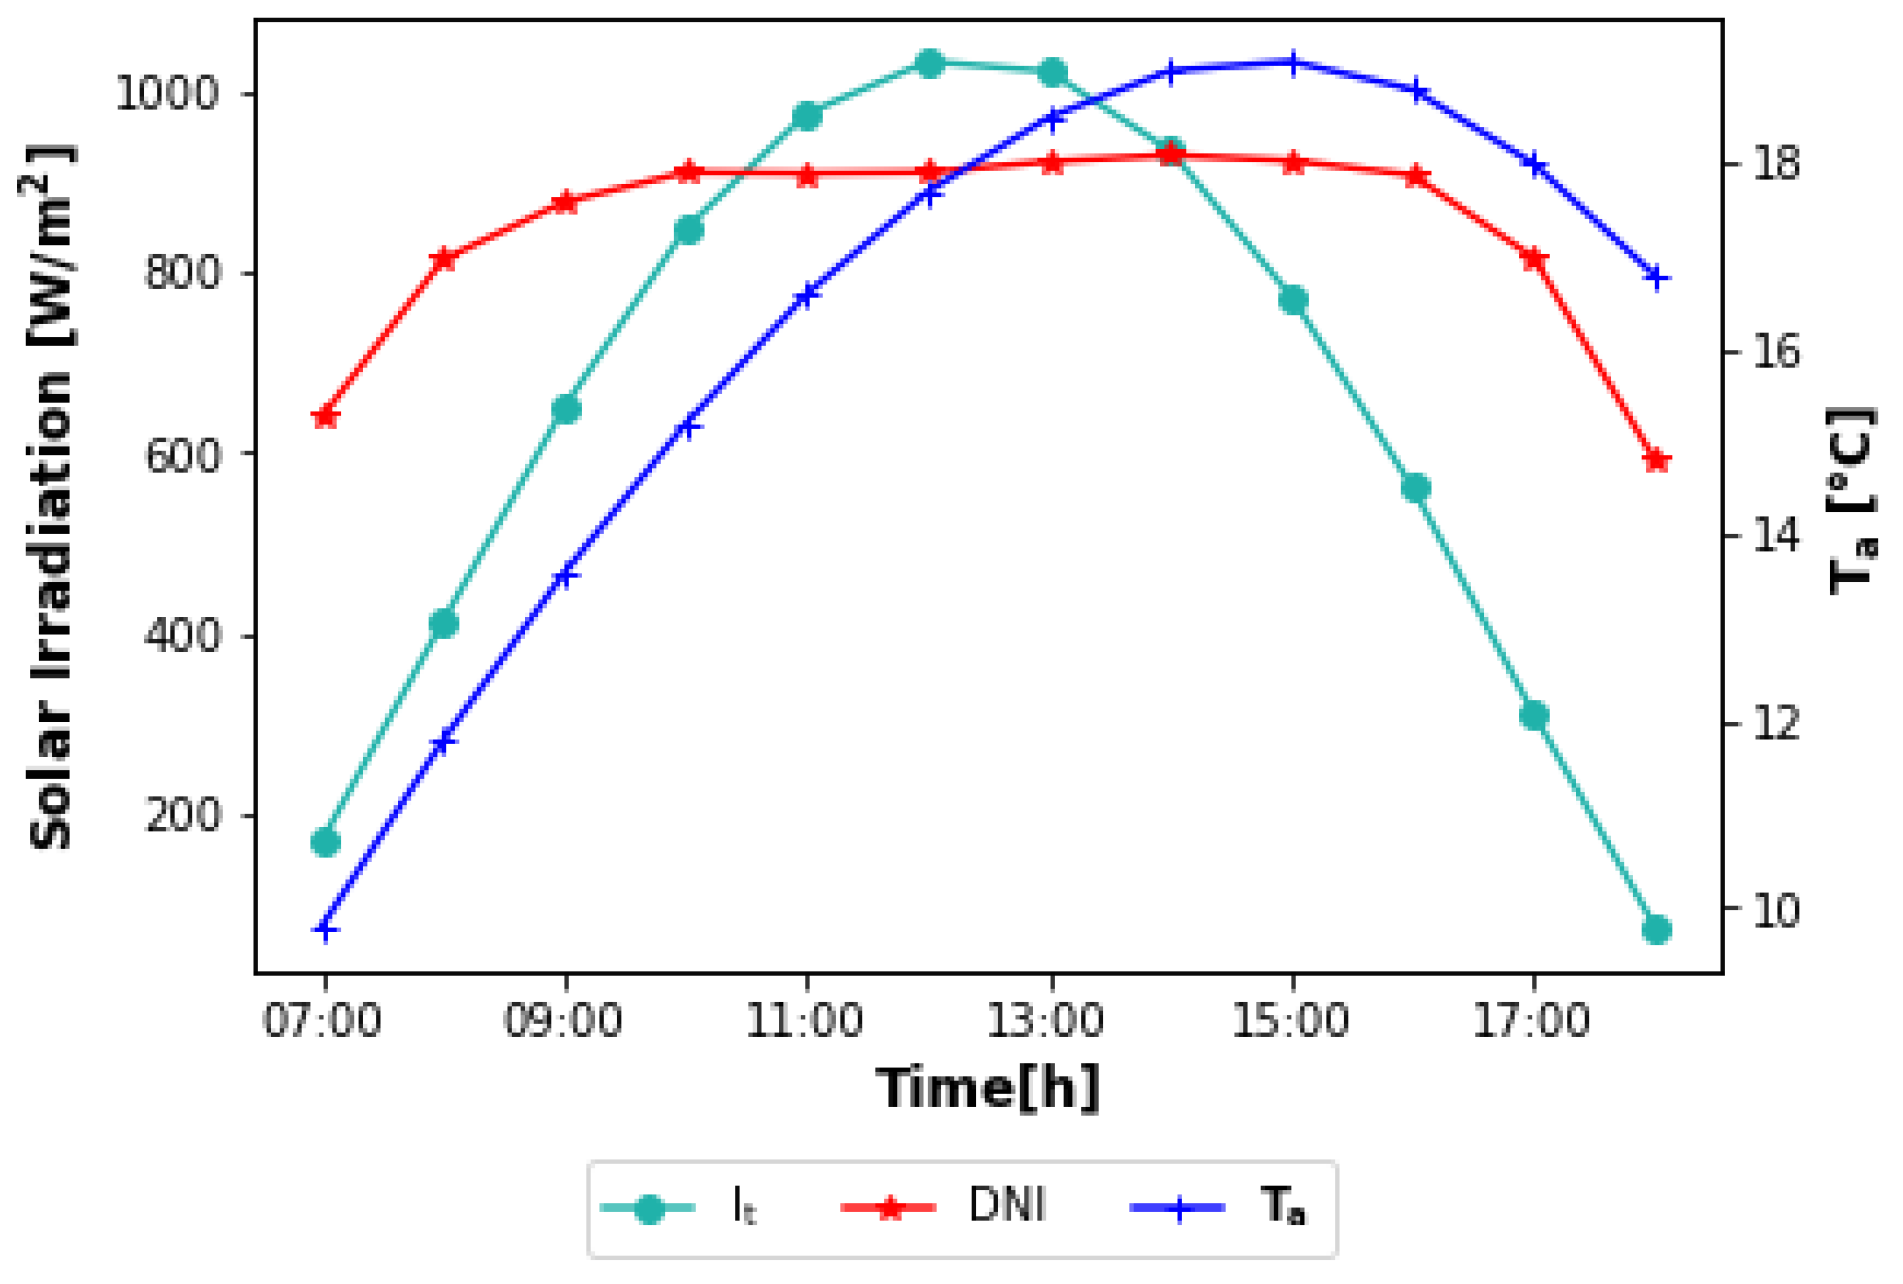
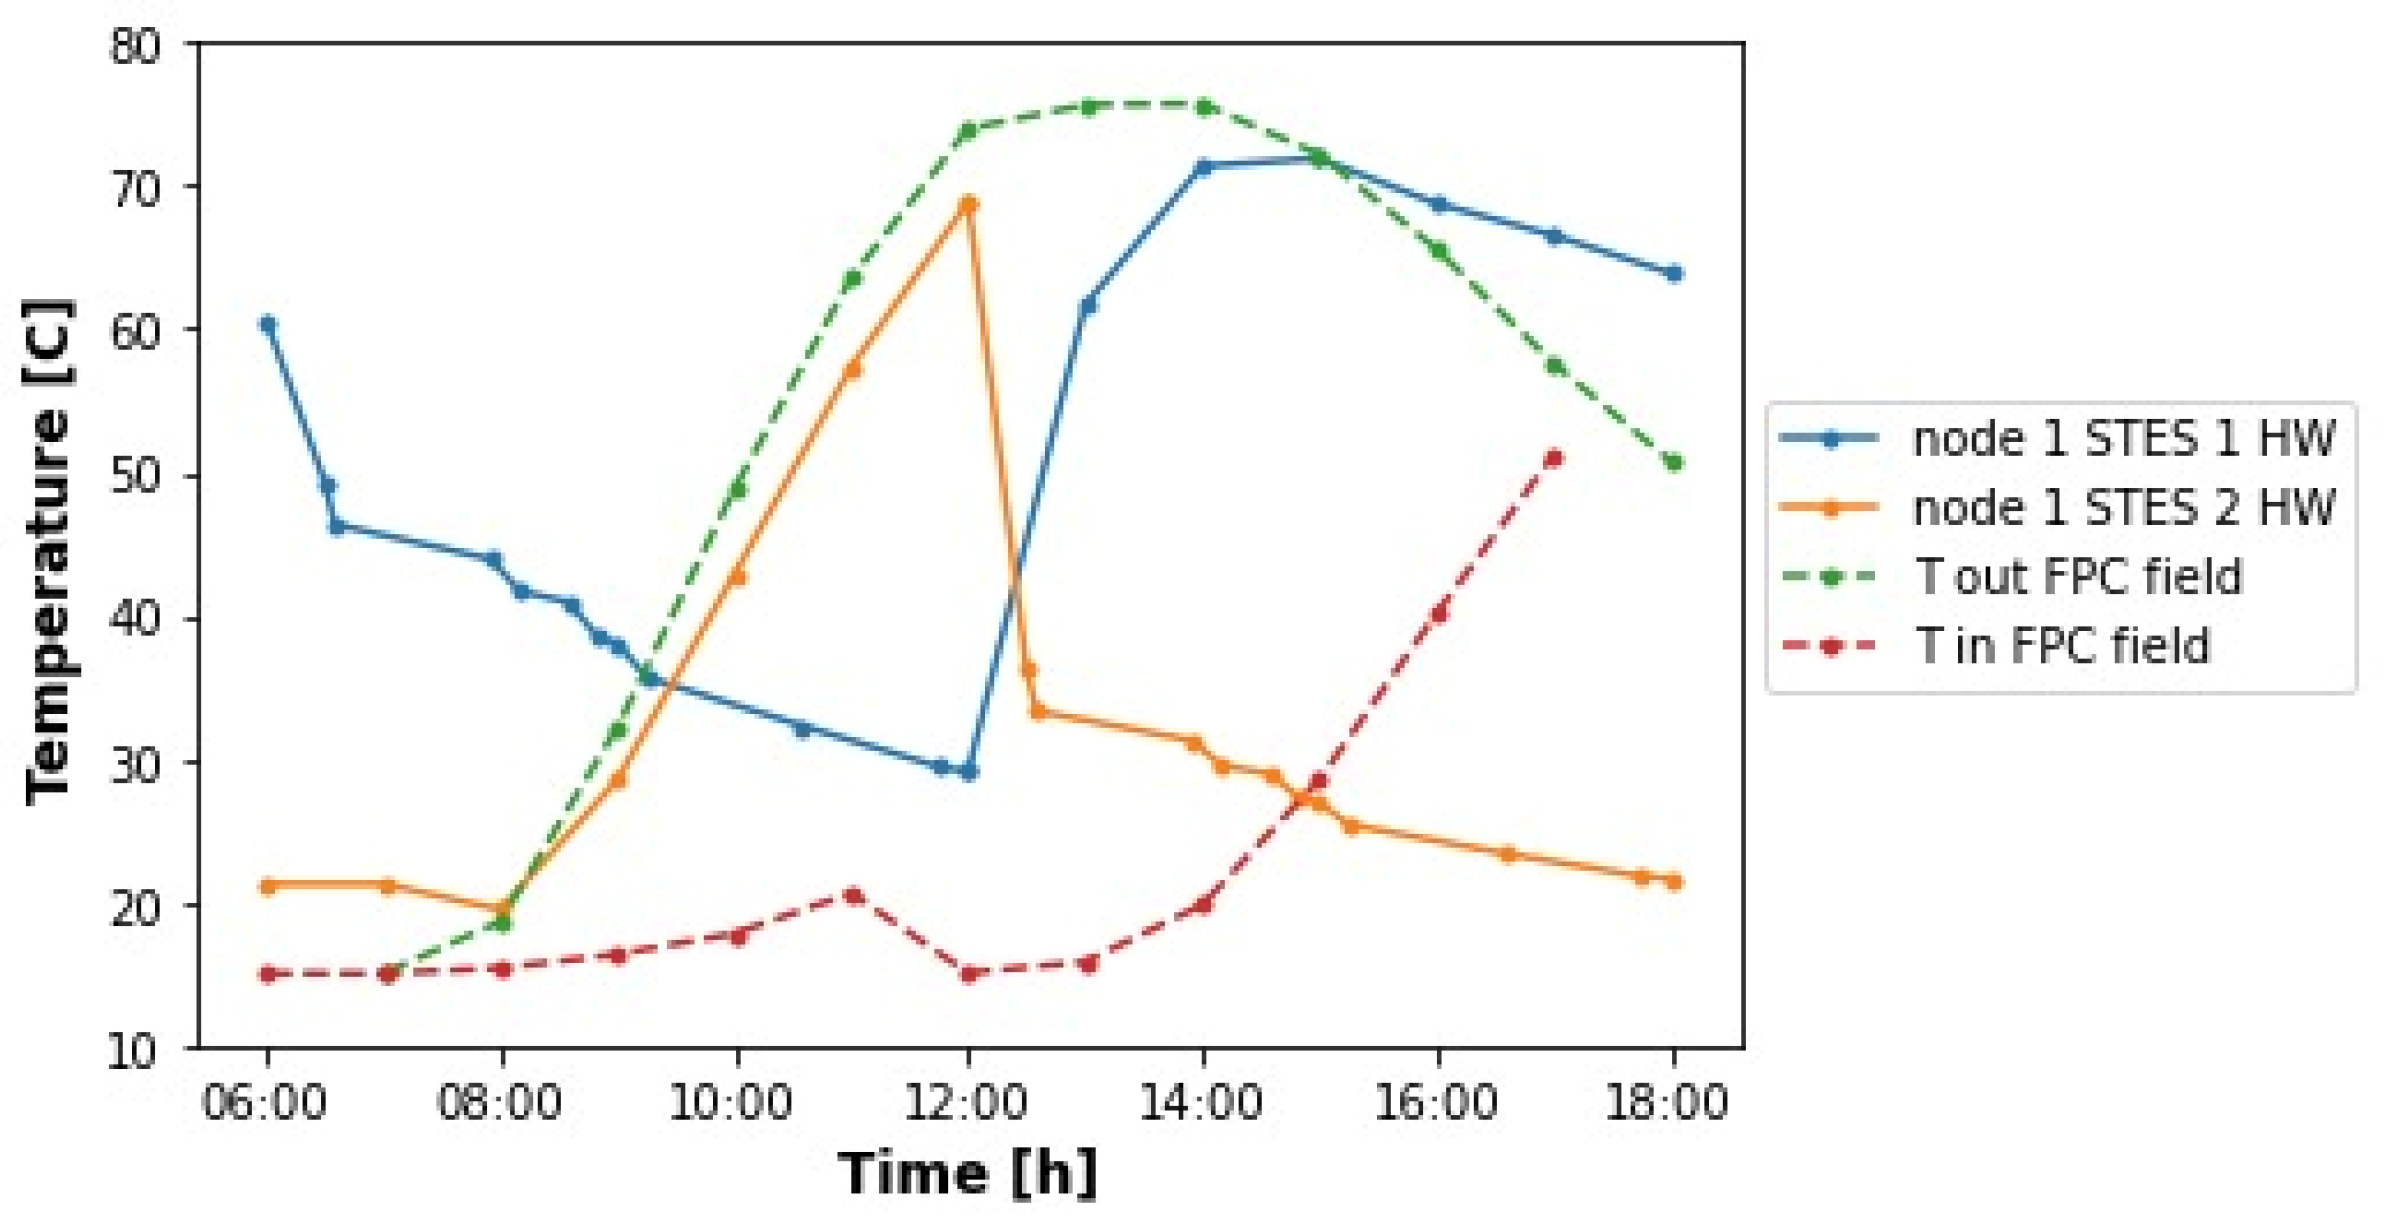
To observe the behavior of the solar subsystem to produce hot water during a whole day, a springtime sunny day was selected: 20 April. The solar irradiation and ambient temperature values measured on this day are presented in Figure 11. The maximum value of I t was 1035 kWh/m2 around noontime at a 30°-tilt-angle. On the other hand, the maximum values of D N I and T a were 931 kWh/m2 and 19.1 °C, respectively. The charging and discharging curves of the hot water STES tanks are illustrated in Figure 12 for the superior node only (node 1), along with the HTF temperatures at the inlet and outlet of the solar field. To agree with Figure 4, STES 1 HW was discharged from 6 a.m. to 12 p.m. to supply the heat demand while STES 2 HW was charged. From 12 to 6 p.m., the opposite occurred.
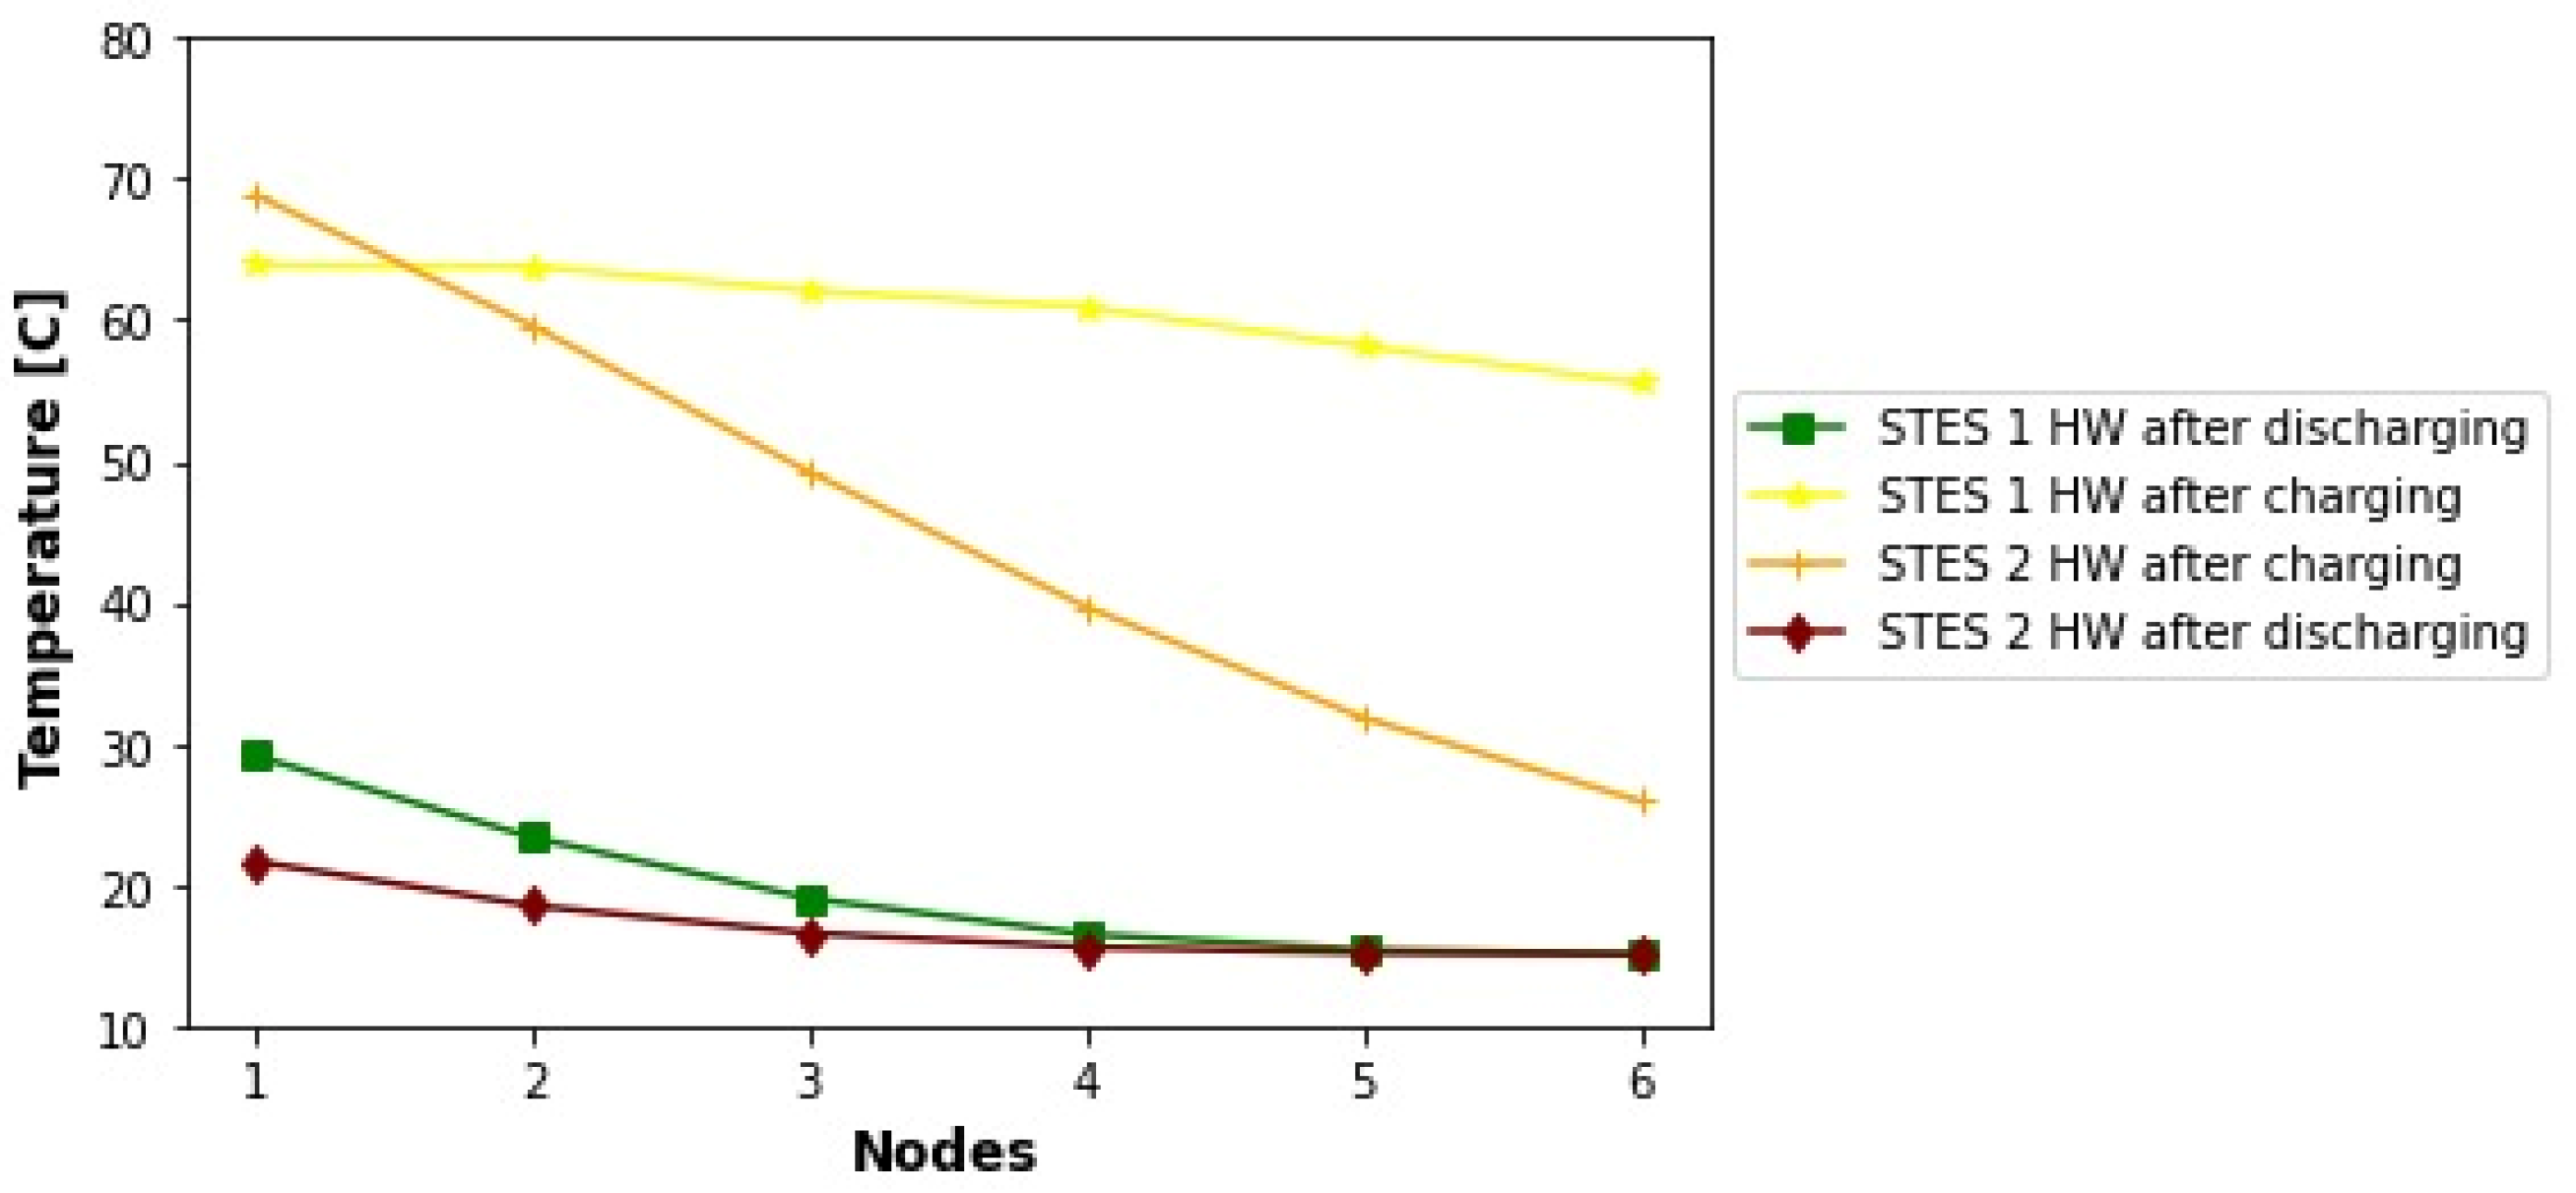
It can be observed in Figure 12 that on a typical sunny day, it was possible to begin at 6 a.m. the discharge of tank STES 1 HW at a temperature of the hottest node (node 1) equal to 60.6 °C at the required mass flow rate (10.59 kg/s according to Table 1). In order to reach the 80 °C required, Q a u x had to be employed. At the end of the discharging process (12 p.m.), the temperature of node 1 was 29.1 °C. Then, the charging started at this temperature from 12 to 6 p.m., achieving 63.9 °C at the end, although a peak temperature of 71.9 °C was registered at 3 p.m. The charging process was not stopped at this moment because more time had to be given to the interior nodes to increase their temperatures. Concerning tank STES 2 HW, the temperature behavior of node 1 was similar to that of tank STES 1 HW, showing temperatures at the end of the charging and discharging processes equal to 68.9 °C and 21.6 °C, respectively. Again, Q a u x had to be employed from 12 to 6 p.m. The temperature distributions of both STES tanks at the end of each charging and discharging process can be seen in Figure 13 for six nodes.
It can also be noticed in Figure 12 that the outlet temperature of the solar field was larger than the tank top node temperatures until nearly 3 p.m. Perhaps it might have been convenient to stop the HTF fluid recirculation through the solar field after this time, especially considering that the inlet temperature was increasing, reducing the efficiency of the collectors in consequence because the larger the inlet temperature, the lower the thermal performance of a solar collector for a given HTF. As the same water to be used for beer production was selected as HTF in this investigation, the enhancement of its thermal properties (density, viscosity, thermal conductivity, and specific heat) through some method (for instance, by adding nanoparticles) to improve the collector’s performance was not allowed. Therefore, it was decided not to implement any change in order to simulate a real scenario.
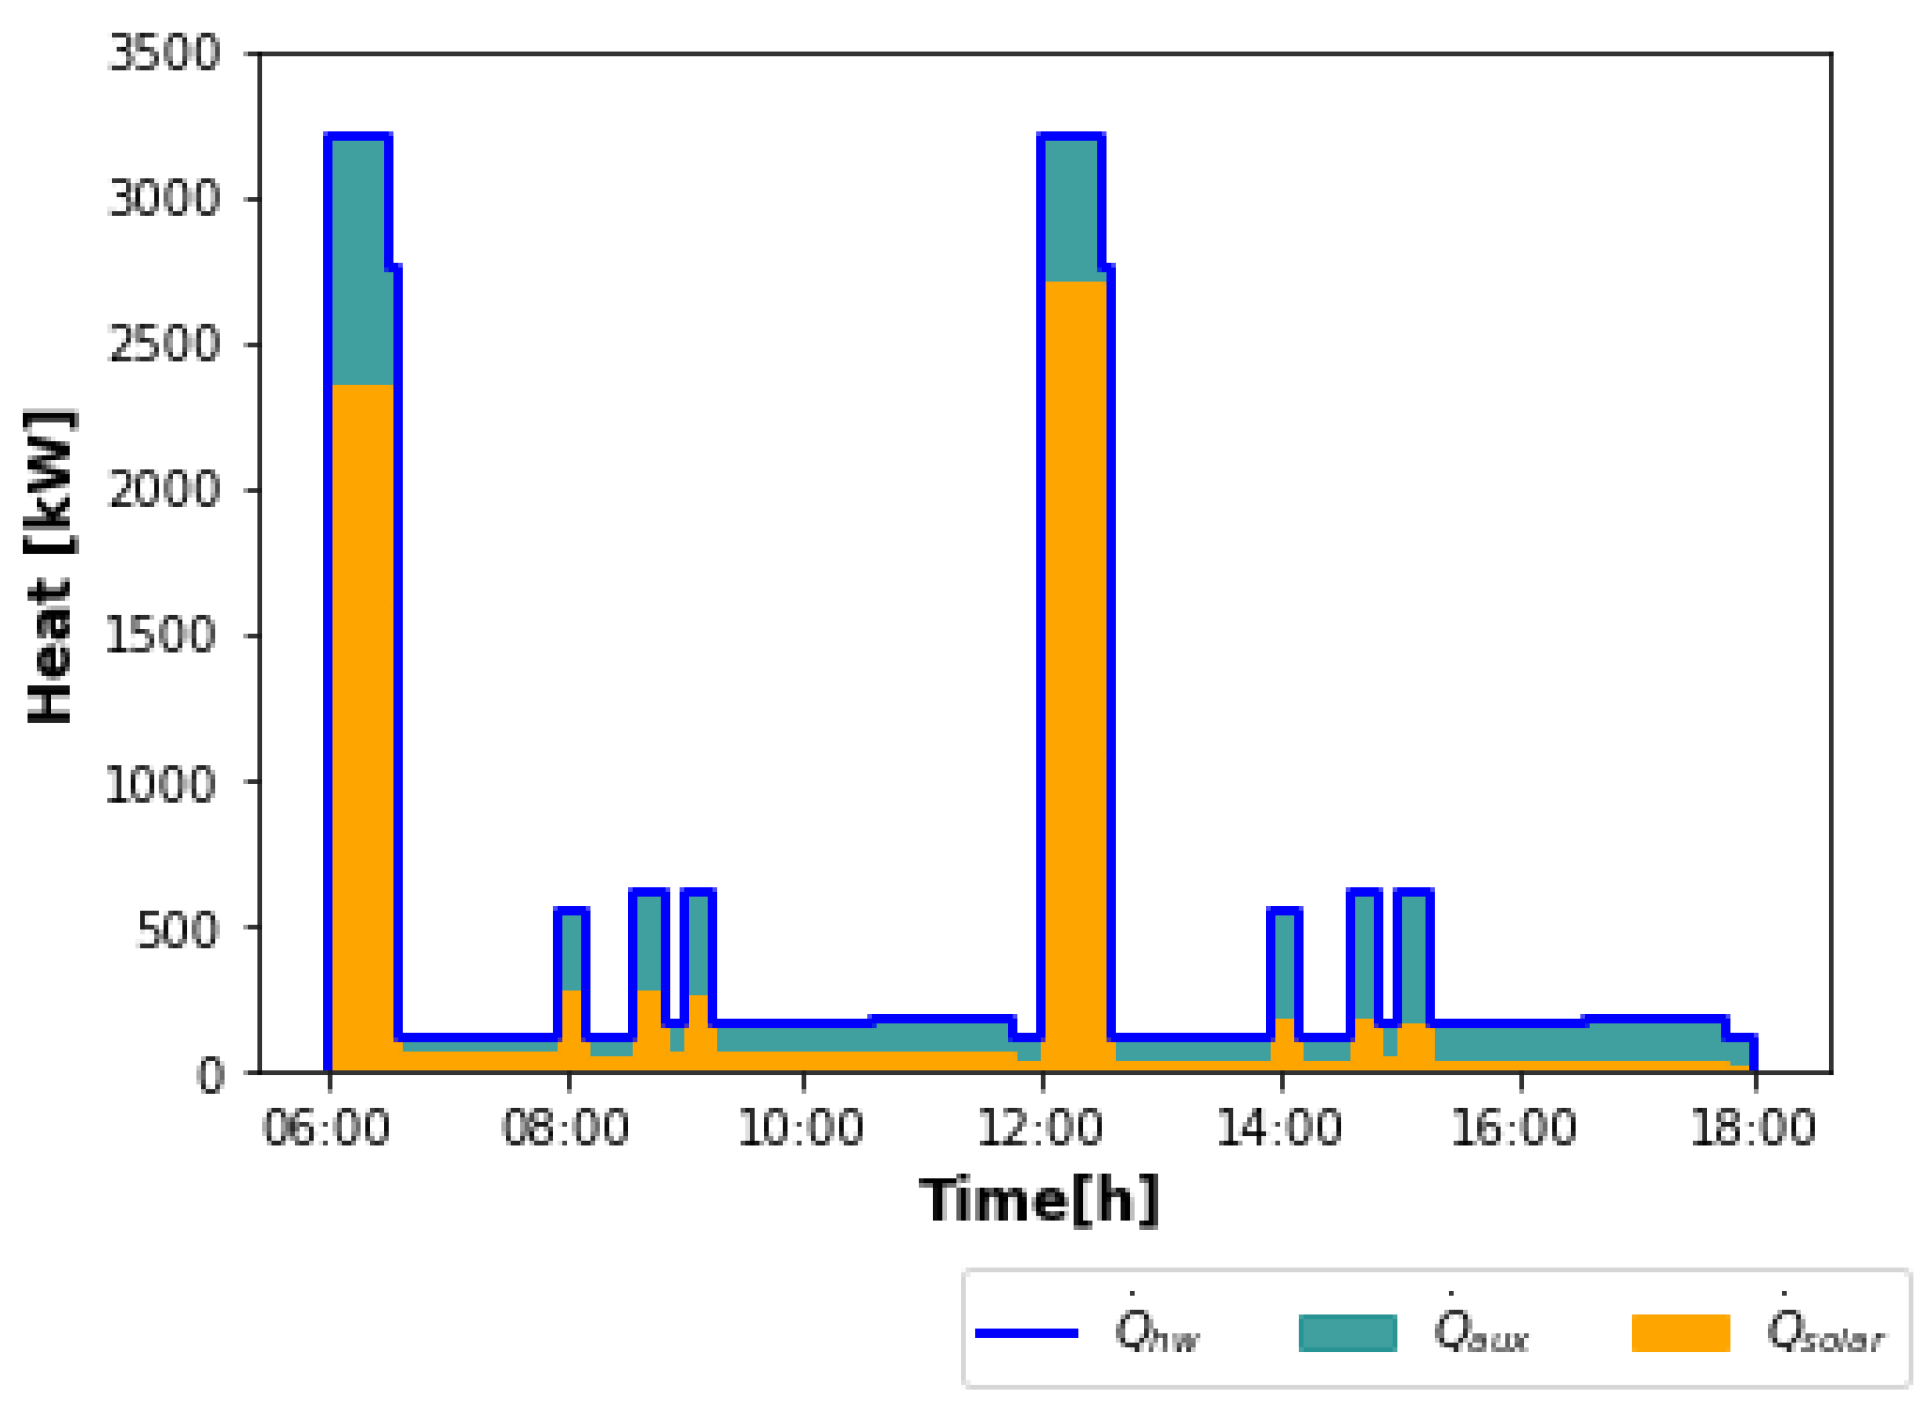
The increment of the solar field inlet temperature from 3 p.m. onwards in Figure 12 was due to the fact that a relatively uniform temperature distribution was accomplished during the charge of tank STES 1 HW (as depicted in Figure 13). In contrast, a uniform temperature distribution was not reached for tank STES 2 HW after the charge, explaining why the solar field inlet temperature did not increase considerably from 6 a.m. to 12 p.m. in this case. Despite these circumstances, a daily solar fraction of 60.6% was obtained for tank STES 1 HW and 59.8% for STES 2 HW, giving an average of 60.2%. The hourly distribution of the solar heat and auxiliary heat can be seen in Figure 14.
The solar fraction coverage of hot water production for each day of the year is plotted in Figure 15a for both STES tanks. In Figure 15b, the monthly averaged results are illustrated. As expected, large values of the solar fraction occurred in summer and low values in winter. For tank STES 1 HW, the mean annual coverage was 50.92%, while for tank STES 2 HW, it was 48.79%, giving an average of 49.9%. The small difference between both tanks was due to the fact that the established operation mode for hot water production allowed greater solar fractions for tank STES 1 HW in winter months, given the meteorological conditions of Ensenada.

4.2. Steam Production

Regarding the production of steam on the selected day (20 April), the temperatures of T66 oil entering and leaving the solar PTC field are plotted in Figure 16, along with the temperatures of the top node (node 1) of storage tanks STES 1 T66 and STES 2 T66. According to the chosen operation modes, STES 1 T66 was discharged from 6 a.m. to 12 p.m. to supply the heat demand, and from 7 a.m. to 12 p.m., STES 2 T66 was charged. From 12 to 6 p.m., the opposite occurred. In the interval 6–7 a.m., the amount of D N I available was negligible. It can be seen that throughout the day, the HTF temperature leaving the solar field was above the temperatures of node 1 for both tanks. In addition, an appreciable gap between the solar inlet and outlet HTF temperatures was observed from 7 a.m. onwards.
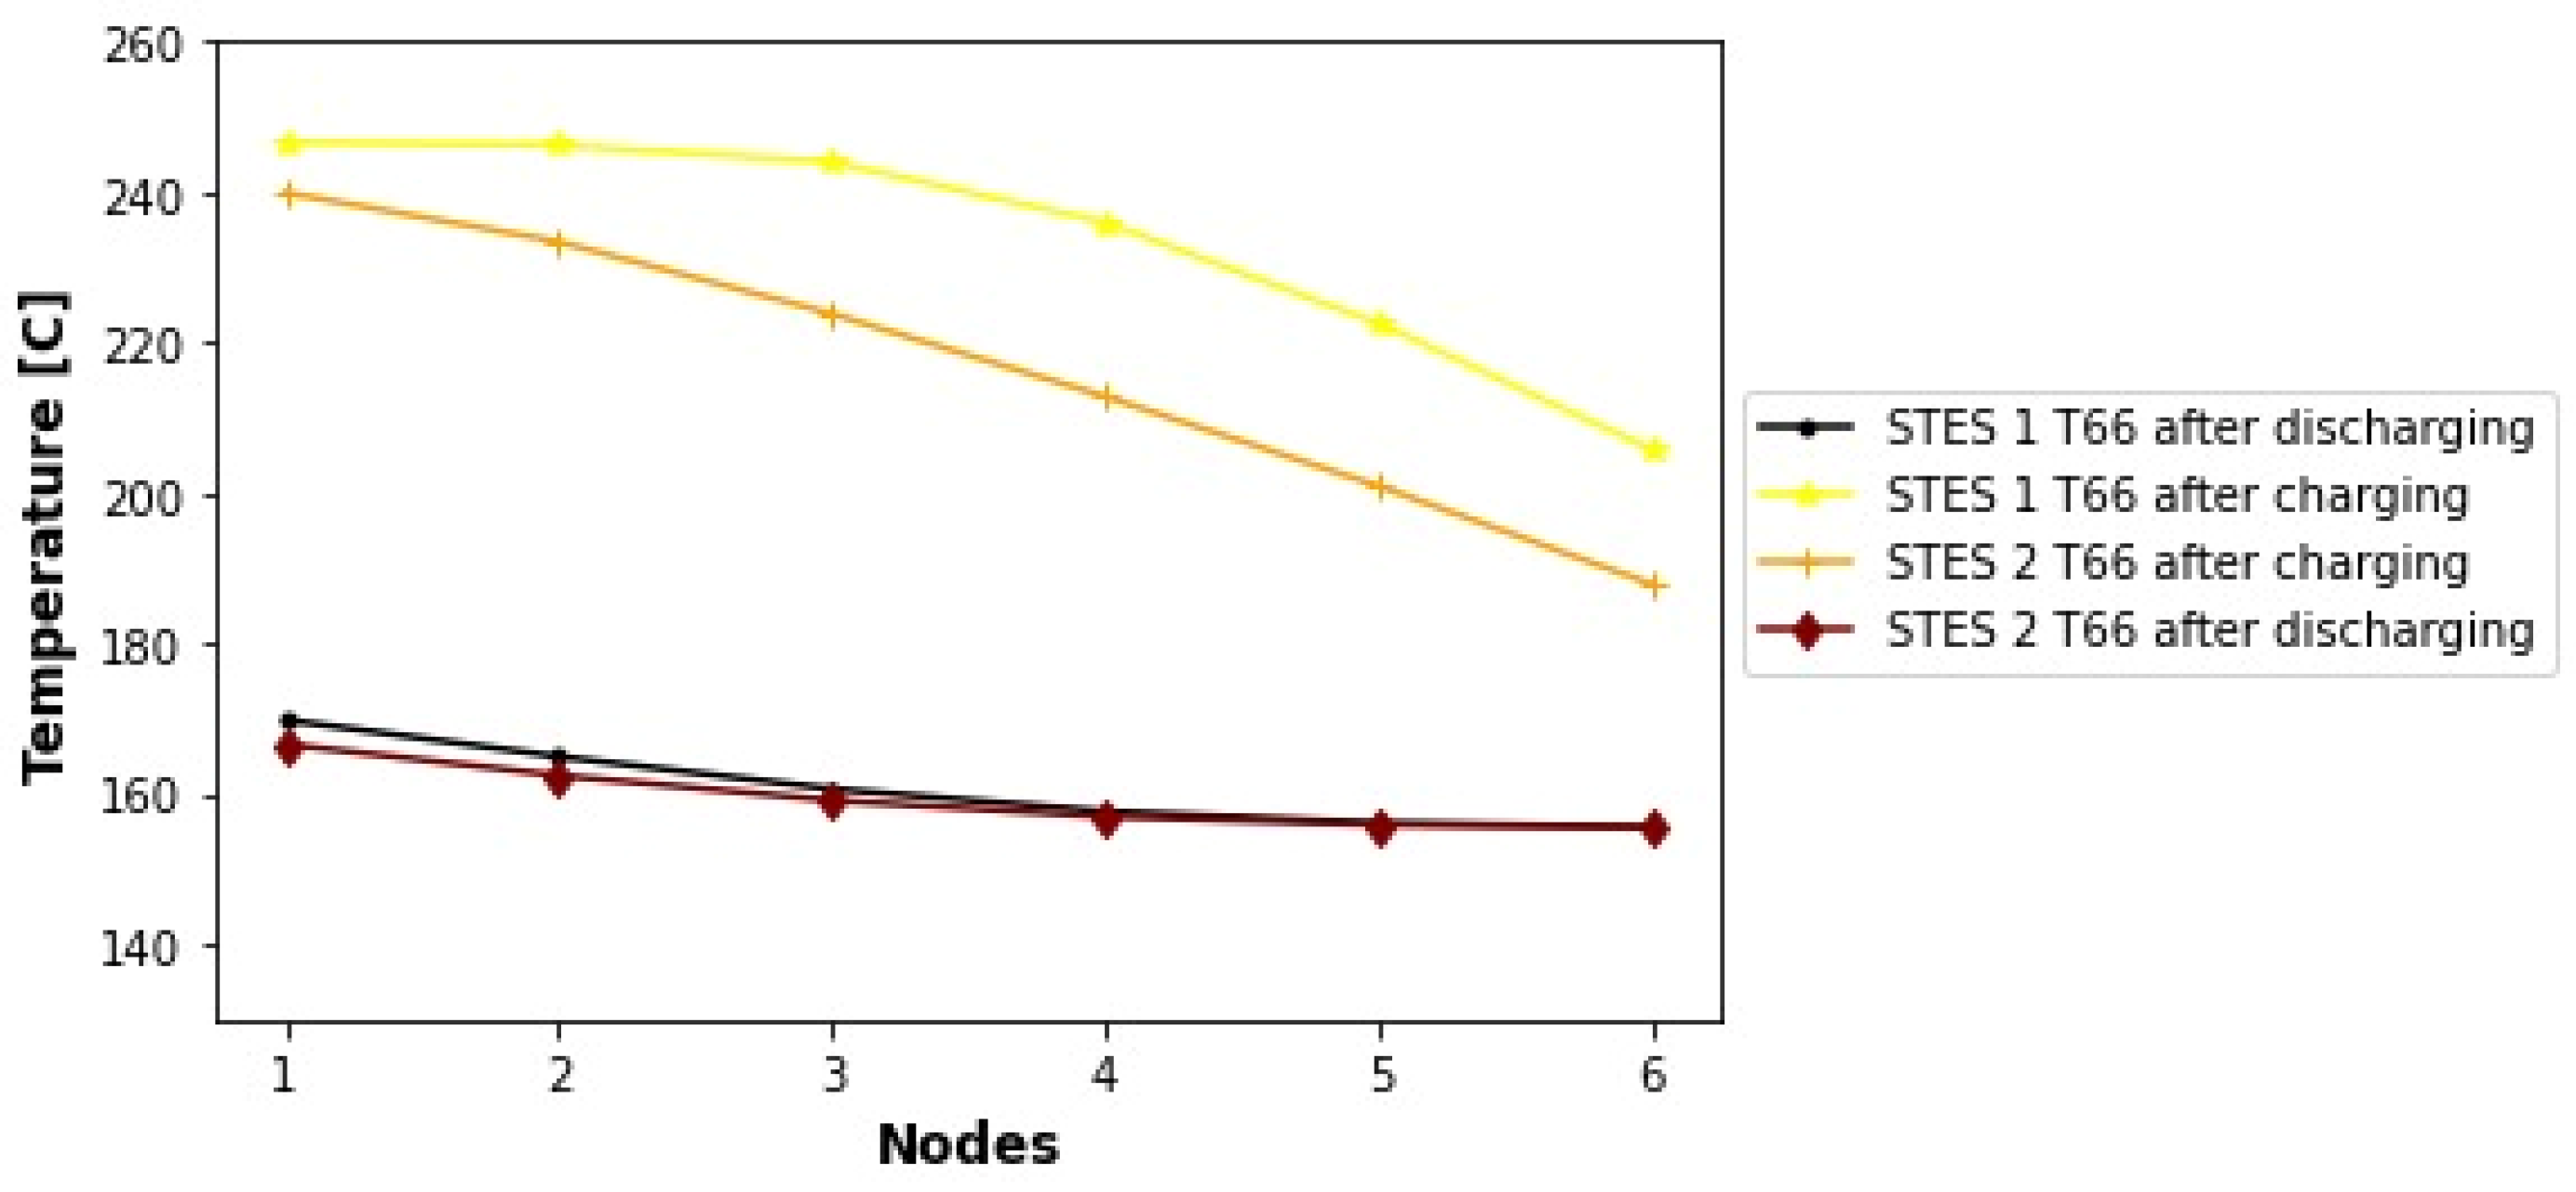
From the evolution of node 1 temperatures, it can be noticed in Figure 16 that in tank STES 1 T66, the discharge began at 235.3 °C. Thus, Q a u x had to be added to reach the set temperature of 252 °C at the steam generator inlet. A similar situation occurred in tank STES 2 T66, where the discharge started at 239.9 °C. The temperature distributions at the end of each charging and discharging phase of each tank are shown in Figure 17 for six nodes, revealing that uniform distributions after charging were not achieved. This partly contributed to the significant gap between the solar field inlet and outlet fluid temperatures. Moreover, it can be perceived too that in tank STES 1 T66, the top node temperature reached 246.6 °C, thus reducing the next day’s amount of Q a u x and improving the solar heat coverage. After the discharges, the temperature distributions of both tanks were quite uniform, with the lowest node (sixth node) temperature equal to the established return temperature of 155 °C at the economizer exit.
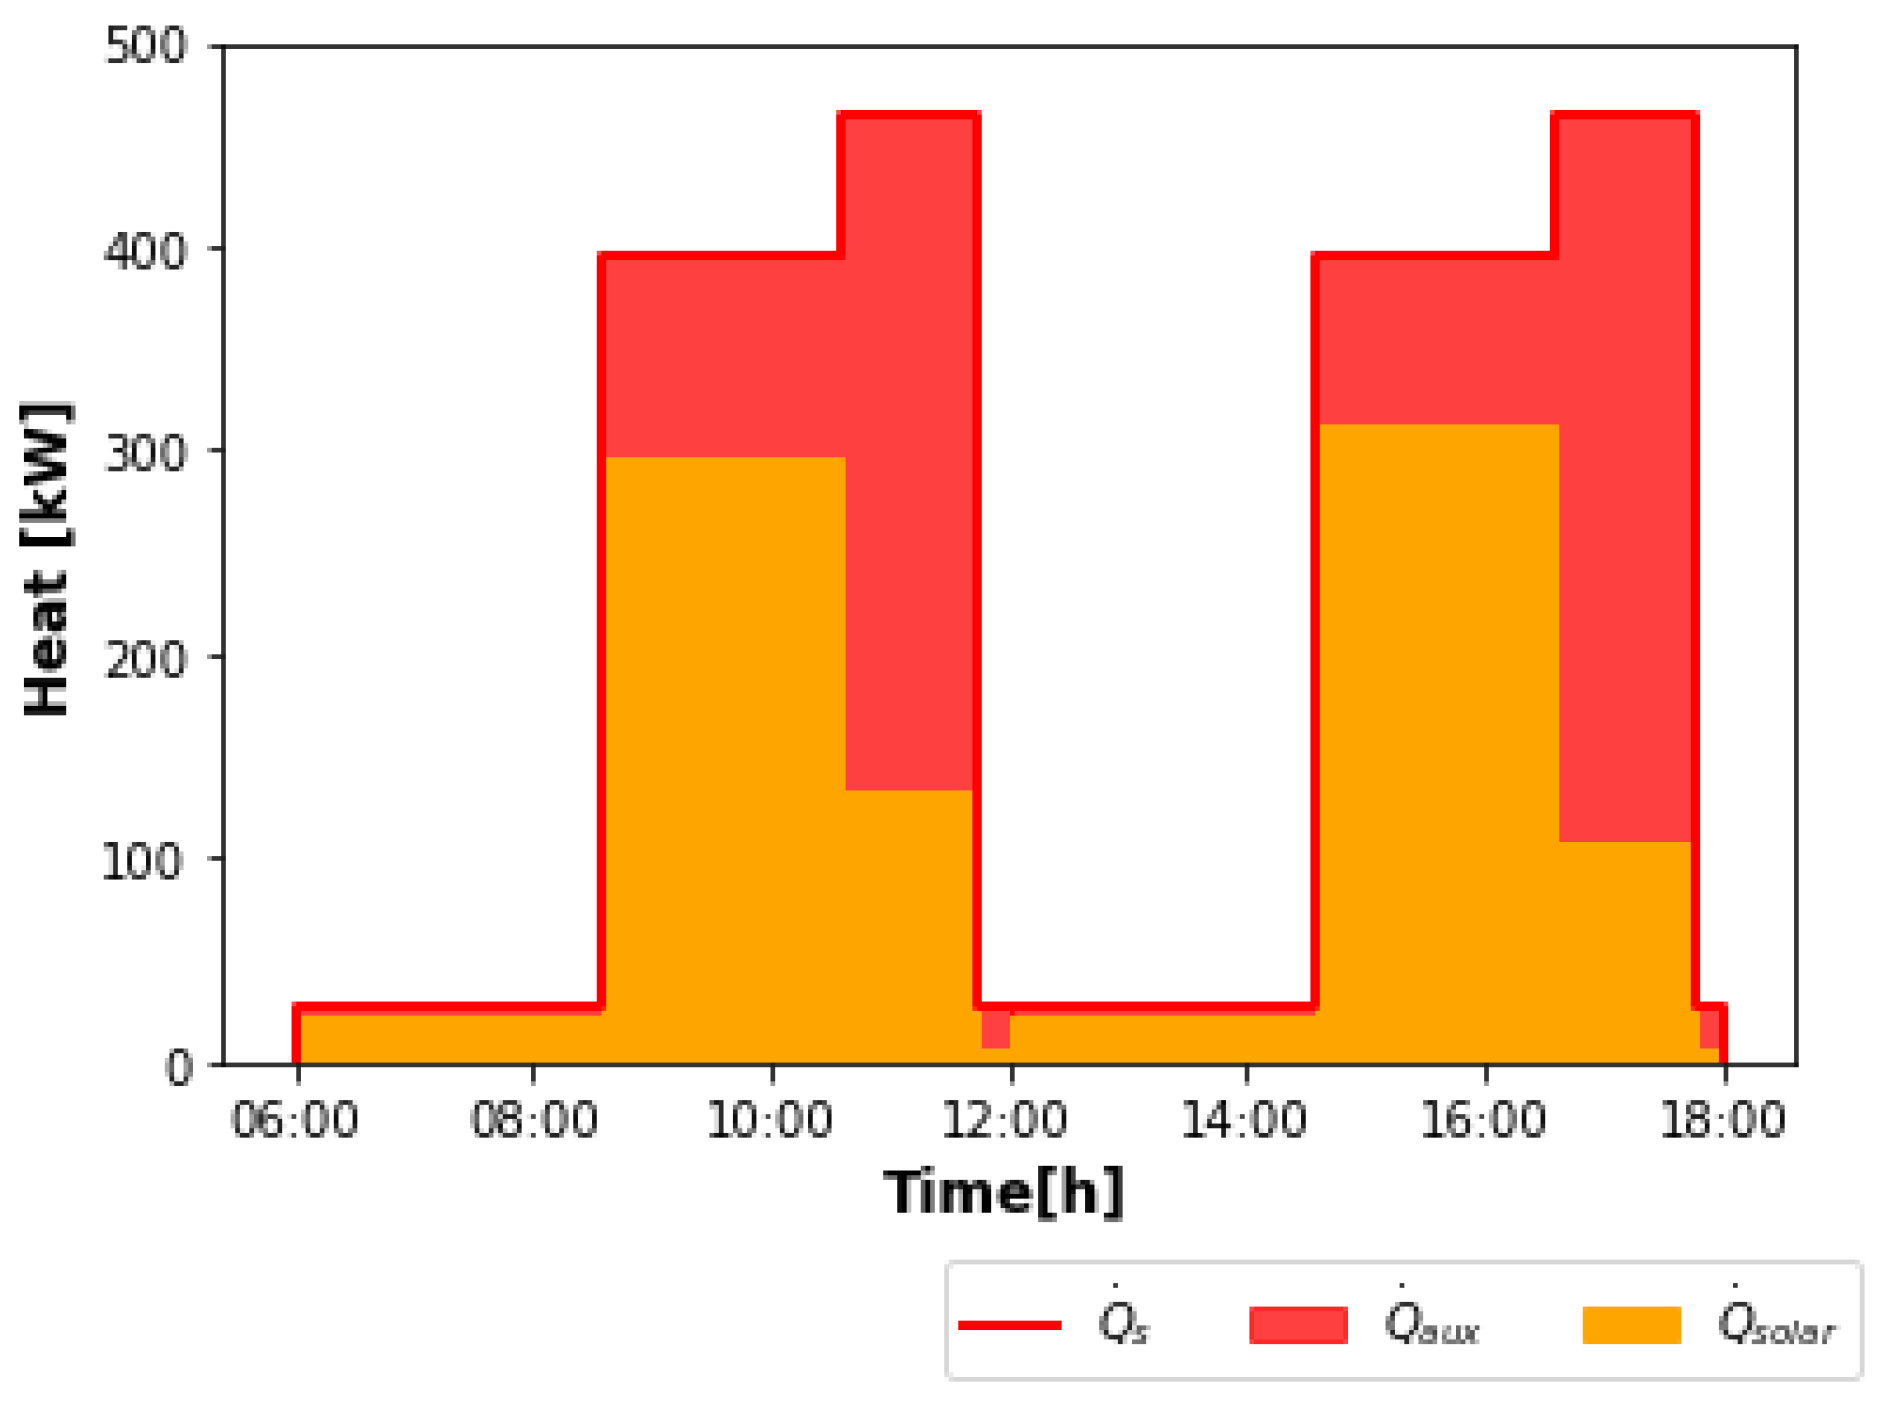
The hourly distributions of the gained solar heat and auxiliary heat on 20 April are plotted in Figure 18. The daily solar fraction achieved with the PTC field and tank STES 1 T66 was 57.83%, and with tank STES 2 T66, it was 57.42%, resulting in an average of 57.6%. In Figure 19a, the solar fraction coverage of steam production for each day of the year is illustrated, and the monthly averages are shown in Figure 19b. In all of the months, the coverage with the STES 1 T66 tank was higher because at the meteorological conditions of Ensenada, the D N I values from 12 p.m. to 6 p.m. (which is the interval where this tank was charged) are normally higher than during the first half of the day. The mean annual solar fraction obtained with tank STES 1 T66 was 40.36%, and with tank STES 2 T66, it was 34.29%, giving an average of 37.3%.

5. Discussion

The annual solar heat coverages obtained in this work lay within the interval of solar fractions reported in the literature for projects involving food processing and beverages industries. In Table 8, there is a comparison between the results attained here and those of the works mentioned in the literature review. In addition, since this work aimed to model the heat supply of the brewery analyzed by Eiholzer et al. [10] at conditions of higher solar insolation, a more complete comparison is described in Table 9. Provided that the size of the solar plant studied here is nearly three times larger, the simulation of meeting both heat demands (hot water and steam) produced nearly a fourfold improvement in fossil fuel savings and CO2 emissions reductions.
From an economic standpoint, the UK renewable heat incentive (RHI) program, which offers 0.108 USD per kWh saved, allowed a yearly return of nearly 33,274 USD for the project of Eiholzer et al. [10]. In addition, the fact that the natural gas price in the UK can be nearly twice that of Mexico [36] permitted them to reach a short payback period of 6.5 years. On the other hand, for the project proposed here, the application of the 30% tax-deduction benefit of Mexico (mentioned in Section 3.6) allowed a reduction in the installation cost to approximately 469,604 USD and a payback period of 15 years.
An additional comparison in terms of the LCOH between the results obtained here and other similar projects, including that of Eiholzer et al. [10], is provided in Table 10. Data from Table 7 were used for the calculations. The influence of factors such as process temperature levels, demand continuity, project scale, solar insolation levels, and geographical location can be straightforwardly appreciated. Among all, it seems that the levels of solar insolation determined by the geographical location played the most crucial role in determining the viability of the solar plant. The timing of the study also had an important effect since the prices of solar technologies have decreased by 35% over the last decade [33]. The competitive LCOH value of 0.032 USD/kWh achieved here demonstrates that the city of Ensenada, Mexico, can be seen as an ideal location to implement solar heat for industrial processes. Nonetheless, and despite the government incentives, the relatively low natural gas prices found in the region may pose an obstacle to a swift transition towards the use of renewable solar heat in industry.
6. Conclusions

A numerical simulation to evaluate the viability of a hybrid solar plant composed of FPC and PTC collectors, as well as sensible energy storage to generate both hot water and steam for the medium-sized brewery analyzed by Eiholzer et al. [10] at the meteorological conditions of Ensenada, Mexico, was conducted. From the results obtained for diurnal operation only (equivalent to two batches), the following main conclusions can be drawn:
  • For the production of hot water at 1 bar and 80 °C, an average annual solar fraction of 49.9% was achieved. For the production of saturated steam at 6 bar and 160 °C, the average annual solar fraction accomplished was 37.3%.
  • These solar fraction values permitted savings of 1398.2 MWh/year of fossil fuel and 252 tons of CO2 emissions.
  • A competitive value of the levelized cost of heat equal to 0.032 USD/kWh was obtained, demonstrating that in the city of Ensenada, the insolation conditions make viable the implementation of solar heat in industrial processes, such as those of the food processing and beverages industries.

Author Contributions

Conceptualization, K.G.T.-Z., I.Z.-G., A.A.-R., M.C.-A., D.S.-C. and F.J.C.-C.; methodology, K.G.T.-Z., I.Z.-G., A.A.-R., M.C.-A., D.S.-C. and F.J.C.-C.; software, K.G.T.-Z., I.Z.-G., A.A.-R., D.S.-C. and F.J.C.-C.; validation, K.G.T.-Z., I.Z.-G., A.A.-R., D.S.-C. and F.J.C.-C.; formal analysis, K.G.T.-Z., I.Z.-G., A.A.-R., M.C.-A., D.S.-C. and F.J.C.-C.; investigation, K.G.T.-Z., D.S.-C. and F.J.C.-C.; resources, I.Z.-G., A.A.-R., M.C.-A. and D.S.-C.; data curation, K.G.T.-Z., D.S.-C. and F.J.C.-C.; writing—original draft preparation, K.G.T.-Z.; writing—review and editing, I.Z.-G., A.A.-R., M.C.-A., D.S.-C. and F.J.C.-C.; visualization, K.G.T.-Z.; supervision, D.S.-C. and F.J.C.-C.; project administration, D.S.-C.; funding acquisition, I.Z.-G. All authors have read and agreed to the published version of the manuscript.

Funding

This research was funded by CICESE, grant number 631176.

Data Availability Statement

Data available upon request.

Acknowledgments

The authors would like to thank Anela Sánchez for their valuable technical assistance.

Conflicts of Interest

The authors declare no conflicts of interest. The funders had no role in the design of the study; in the collection, analysis, or interpretation of data; in the writing of the manuscript; or in the decision to publish the results.

References

  1. ExxonMobil. Outlook for Energy: A Perspective to 2040; ExxonMobil: Houston, TX, USA, 2019. [Google Scholar]
  2. Koçak, B.; Fernandez, A.I.; Paksoy, H. Review on sensible thermal energy storage for industrial solar applications and sustainability aspects. Sol. Energy 2020, 209, 135–169. [Google Scholar] [CrossRef]
  3. Kalogirou, S.A. Industrial process heat, chemical applications, and solar dryers. In Solar Energy Engineering: Processes and Systems; Academic Press: Cambridge, MA, USA, 2013; pp. 391–419. [Google Scholar]
  4. Kumar, K.R.; Chaitanya, N.K.; Kumar, N.S. Solar thermal energy technologies and its applications for process heating and power generation—A review. J. Clean. Prod. 2021, 282, 125296. [Google Scholar] [CrossRef]
  5. Philibert, C. Renewable Energy for Industry, Paris. 2017. Available online: www.iea.org/publications/insights (accessed on 8 April 2024).
  6. Epp, B.; Oropeza, M. Solar Payback: Solar Heat for Industry. 2017. Available online: https://www.solar-payback.com/ (accessed on 8 April 2024).
  7. Olajire, A.A. The brewing industry and environmental challenges. J. Clean. Prod. 2020, 256, 102817. [Google Scholar] [CrossRef]
  8. Kubule, A.; Zogla, L.; Ikaunieks, J.; Rosa, M. Highlights on energy efficiency improvements: A case of a small brewery. J. Clean. Prod. 2016, 138, 275–286. [Google Scholar] [CrossRef]
  9. Zogla, L.; Zogla, G.; Beloborodko, A.; Rosa, M. Process Benchmark for Evaluation Energy Performance in Breweries. Energy Procedia 2015, 72, 202–208. [Google Scholar] [CrossRef]
  10. Eiholzer, T.; Olsen, D.; Hoffmann, S.; Sturm, B.; Wellig, B. Integration of a solar thermal system in a medium-sized brewery using pinch analysis: Methodology and case study. Appl. Therm. Eng. 2017, 113, 1558–1568. [Google Scholar] [CrossRef]
  11. Tasmin, N.; Farjana, S.H.; Hossain, R.; Golder, S.; Mahmud, M.A.P. Integration of Solar Process Heat in Industries: A Review. Clean Technol. 2022, 4, 97–131. [Google Scholar] [CrossRef]
  12. Kumar, L.; Hasanuzzaman, M.; Rahim, N. Global advancement of solar thermal energy technologies for industrial process heat and its future prospects: A review. Energy Convers. Manag. 2019, 195, 885–908. [Google Scholar] [CrossRef]
  13. Mauthner, F.; Hubmann, M.; Brunner, C.; Fink, C. Manufacture of Malt and Beer with Low Temperature Solar Process Heat. Energy Procedia 2014, 48, 1188–1193. [Google Scholar] [CrossRef]
  14. Silva, R.; Cabrera, F.J.; Pérez-García, M. Process Heat Generation with Parabolic Trough Collectors for a Vegetables Preservation Industry in Southern Spain. Energy Procedia 2014, 48, 1210–1216. [Google Scholar] [CrossRef]
  15. Bolognese, M.; Viesi, D.; Bartali, R.; Crema, L. Modeling study for low-carbon industrial processes integrating solar thermal technologies. A case study in the Italian Alps: The Felicetti Pasta Factory. Sol. Energy 2020, 208, 548–558. [Google Scholar] [CrossRef]
  16. Biencinto, M.; Bayón, R.; González, L.; Christodoulaki, R.; Rojas, E. Integration of a parabolic-trough solar field with solid-solid latent storage in an industrial process with different temperature levels. Appl. Therm. Eng. 2021, 184, 116263. [Google Scholar] [CrossRef]
  17. Tian, Z.; Perers, B.; Furbo, S.; Fan, J. Thermo-economic optimization of a hybrid solar district heating plant with flat plate collectors and parabolic trough collectors in series. Energy Convers. Manag. 2018, 165, 92–101. [Google Scholar] [CrossRef]
  18. SunEarth. The Thermoray Series—Solar Collector Specification Sheet. 2024. Available online: https://sunearthinc.com (accessed on 8 April 2024).
  19. SPF Institute for Solar Technology. Solar Collector Factsheet NEP PolyTrough 1800. 2024. Available online: https://www.ost.ch/en/research-and-consulting-services/technology/renewable-energies-and-environmental-engineering/spf-institute-for-solar-technology (accessed on 8 April 2024).
  20. Incropera, F.P.; Dewitt, D.P.; Bergman, T.R.; Lavinne, A.S. Fundamentals of Heat and Mass Transfer, 6th ed.; John Wiley and Sons: Hoboken, NJ, USA, 2007. [Google Scholar]
  21. Oliveski, R.D.C.; Krenzinger, A.; Vielmo, H.A. Comparison between models for the simulation of hot water storage tanks. Sol. Energy 2003, 75, 121–134. [Google Scholar] [CrossRef]
  22. Cadau, N.; De Lorenzi, A.; Gambarotta, A.; Morini, M.; Rossi, M. Development and Analysis of a Multi-Node Dynamic Model for the Simulation of Stratified Thermal Energy Storage. Energies 2019, 12, 4275. [Google Scholar] [CrossRef]
  23. Franke, R. Object-oriented modeling of solar heating systems. Sol. Energy 1997, 60, 171–180. [Google Scholar] [CrossRef]
  24. Fernández-Torrijos, M.; Almendros-Ibáñez, J.; Sobrino, C.; Santana, D. ε–NTU relationships in parallel–series arrangements: Application to plate and tubular heat exchangers. Appl. Therm. Eng. 2016, 99, 1119–1132. [Google Scholar] [CrossRef]
  25. Karim, A.; Burnett, A.; Fawzia, S. Investigation of Stratified Thermal Storage Tank Performance for Heating and Cooling Applications. Energies 2018, 11, 1049. [Google Scholar] [CrossRef]
  26. González-Altozano, P.; Gasque, M.; Ibáñez, F.; Gutiérrez-Colomer, R.P. New methodology for the characterisation of thermal performance in a hot water storage tank during charging. Appl. Therm. Eng. 2015, 84, 196–205. [Google Scholar] [CrossRef]
  27. Cruickshank, C.A.; Harrison, S.J. Heat loss characteristics for a typical solar domestic hot water storage. Energy Build 2010, 42, 1703–1710. [Google Scholar] [CrossRef]
  28. Bell, I.H.; Wronski, J.; Quoilin, S.; Lemort, V. Pure and Pseudo-pure Fluid Thermophysical Property Evaluation and the Open-Source Thermophysical Property Library CoolProp. Ind. Eng. Chem. Res. 2014, 53, 2498–2508. [Google Scholar] [CrossRef] [PubMed]
  29. NASA. The Power Project. 2021. Available online: https://power.larc.nasa.gov (accessed on 8 April 2024).
  30. Unrau, C. Numerical Investigation of One-Dimensional Storage Tank Models and the Development of Analytical Modelling Techniques. Ph.D. Thesis, McMaster University, Hamilton, ON, Canada, 2017. [Google Scholar]
  31. Rosales-Pérez, J.F.; Villarruel-Jaramillo, A.; Pérez-García, M.; Cardemil, J.M.; Escobar, R. Techno-economic analysis of hybrid solar thermal systems with flat plate and parabolic trough collectors in industrial applications. Alex. Eng. J. 2024, 86, 98–119. [Google Scholar] [CrossRef]
  32. Burkhardt, J.J.; Heath, G.A.; Turchi, C.S. Life Cycle Assessment of a Parabolic Trough Concentrating Solar Power Plant and the Impacts of Key Design Alternatives. Environ. Sci. Technol. 2011, 45, 2457–2464. [Google Scholar] [CrossRef] [PubMed]
  33. Dieckmann, S.; Dersch, J.; Giuliano, S.; Puppe, M.; Lüpfert, E.; Hennecke, K.; Pitz-Paal, R.; Taylor, M.; Ralon, P. LCOE reduction potential of parabolic trough and solar tower CSP technology until 2025. In AIP Conference Proceedings; AIP Publishing: Long Island, NY, USA, 2017; p. 1850. [Google Scholar] [CrossRef]
  34. Mohammadi, K.; Khanmohammadi, S.; Immonen, J.; Powell, K. Techno-economic analysis and environmental benefits of solar industrial process heating based on parabolic trough collectors. Sustain. Energy Technol. Assess. 2021, 47, 101412. [Google Scholar] [CrossRef]
  35. Zheng, J.; Febrer, R.; Castro, J.; Kizildag, D.; Rigola, J. A new high-performance flat plate solar collector. Numerical modelling and experimental validation. Appl. Energy 2024, 355, 122221. [Google Scholar] [CrossRef]
  36. Global Petrol Prices. Natural Gas Prices. 2024. Available online: https://www.globalpetrolprices.com/natural_gas_prices/ (accessed on 8 April 2024).
Figure 1. Heat demand curves of hot water and saturated steam for two batches (12 h of plant operation).
Energies 17 02300 g001
Figure 2. Layout of the proposed solar plant.
Energies 17 02300 g002
Figure 3. Division of the stratified STES tank into N nodes. Red color at the top refers to the hottest node; blue color at the bottom refers to the coldest node.
Energies 17 02300 g003
Figure 4. Solar thermal subsystem for direct hot water supply with valves and tanks labeled.
Energies 17 02300 g004
Figure 5. Solar thermal subsystem for indirect steam supply with valves and tanks labeled.
Energies 17 02300 g005
Figure 6. Monthly averages of daily solar irradiation on the collector plane ( I t ), direct normal irradiation ( D N I ), and ambient temperature ( T a ).
Energies 17 02300 g006
Figure 7. Flow diagrams of the solution procedure showing the charging and discharging of the STES tanks during: (a) the first batch brewing period (6 a.m.–12 p.m.); (b) the second batch brewing period (12–6 p.m.).
Energies 17 02300 g007
Figure 8. Comparison of the STES charging results obtained here against the experimental results reported by González-Altozano et al. [26] using 12 nodes. N1 refers to the top node; N12 refers to the bottom node.
Energies 17 02300 g008
Figure 9. Verification of the STES tank charge and discharge results obtained here against the semi-analytical method of Unrau [30] using 12 nodes: (a) tank charge; (b) tank discharge. N1 refers to the top node; N12 refers to the bottom node.
Energies 17 02300 g009
Figure 10. Influence of the number of nodes in the (a) charging and (b) discharging processes of an STES tank.
Energies 17 02300 g010
Figure 11. Solar irradiation and ambient temperature between 7 a.m. and 6 p.m. of 20 April.
Energies 17 02300 g011
Figure 12. Daily evolution of the FPC solar field inlet and outlet temperatures and the charging and discharging temperatures of the top node (node 1) of the hot water STES tanks for 20 April. From 6 a.m. to 12 p.m., STES 1 HW was discharged and STES 2 HW charged. From 12 to 6 p.m., STES 1 HW was charged and STES 2 HW discharged.
Energies 17 02300 g012
Figure 13. Temperature distributions at the end of each charging and discharging process of both hot water STES tanks on 20 April.
Energies 17 02300 g013
Figure 14. Distribution of the solar heat and auxiliary heat needed to meet the hot water demand at 80 °C in two batches.
Energies 17 02300 g014
Figure 15. Solar fractions achieved by the hot water subsystem: (a) per day; (b) per month.
Energies 17 02300 g015
Figure 16. Daily evolution of the solar PTC field inlet and outlet temperatures and the charging and discharging temperatures of the top node (node 1) of T66 oil STES tanks for 20 April. From 6 a.m. to 12 p.m., STES 1 T66 was discharged, and STES 2 T66 was charged from 7 a.m. to 12 p.m. From 12 to 6 p.m., STES 1 T66 was charged and STES 2 T66 discharged.
Energies 17 02300 g016
Figure 17. Temperature distributions at the end of each charging and discharging process of both T66 oil STES tanks on 20 April.
Energies 17 02300 g017
Figure 18. Distribution of the solar heat and auxiliary heat needed to meet the steam demand at 160 °C in two batches.
Energies 17 02300 g018
Figure 19. Solar fractions achieved by the steam subsystem: (a) per day; (b) monthly averaged.
Energies 17 02300 g019
Table 1. Times, mass flow rates, and heat demands required by the processes that need heating during one batch of operation. Data were extracted from the work of Eiholzer et al. [10].
Time (h)Hot Water (1 bar, 80 °C)Steam (6 bar, 160 °C)
StartEnd m ˙ h w (kg/s) Q ˙ h w (kW) m ˙ s (kg/s) Q ˙ s (kW)
0.00.510.593202.420.0124.21
0.50.589.122757.890.0124.21
0.581.920.35105.840.0124.21
1.922.171.82550.370.0124.21
2.172.580.35105.840.0124.21
2.582.832.0603.820.19452.18
2.833.00.53159.290.19452.18
3.03.252.0603.820.19452.18
3.254.580.53159.290.19452.18
4.585.750.56169.460.22533.61
5.756.00.35105.840.0124.21
Total (kWh):2918.85Total (kWh):1595.52
Table 2. Technical specifications of the selected FPC and PTC collectors [18,19].
ParameterFPC SunEarth TR40PTC NEP PolyTrough 1800
Gross width1.22 m1.965 m
Gross length3.10 m11.085 m
Gross area3.78 m221.782 m2
Aperture area3.45 m218.45 m2
Nominal flowrate0.019 kg/(m2∙s)1800 L/h
Maximum flowrate12 gpm3600 L/h
Fluid capacity4.5 L9.8 L
Max operation pressure160 psi40 bar
Table 3. Geometrical parameters and overall heat transfer coefficients of the employed HXs.
Steam Generator (SG)Economizer (Preheater PH)
Number of tubes, N 23Number of plates, N 100
Length, L 12.45 mLength, L 0.66 m
Tubes inner diameter, D i 12.7 mmGap distance, a 6.61 mm
Tubes outer diameter, D o 20.7 mm U 23.4 W/m2∙K
U i 1084.9 W/m2∙K
Table 4. Size and parameters of operation of the proposed solar plant.
ParameterHot Water Subsystem
(1 Bar, 80 °C)
Saturated Steam Subsystem
(6 Bar, 160 °C)
Type of solar collectorFPCPTC
Total collecting area862.5 m2738 m2
Heat transfer fluidWaterTherminol 66®
Mass flow rate per collector0.072 kg/s0.441 kg/s
Field mass flow rate1.805 kg/s3.530 kg/s
STES tanks volume36 m333 m3
Heat exchanging area of SG-18.62 m2
Heat exchanging area of PH-43.22 m2
Table 5. Valves that need to be open at each operation mode of the solar plant.
Operation ModeHot Water SubsystemSteam SubsystemTime Period
STES 1 dischargev13, v15, v17v15′, v19′, v18′, v17′, v16′, v11′6 a.m.–12 p.m.
STES 2 chargev2, v4, v5, v9, v8v2′, v4′, v5′, v9′, v8′6 a.m.–12 p.m.
STES 2 dischargev14, v12, v16v12′, v16′, v13′, v14′12 p.m.–6 p.m.
STES 1 chargev1, v10, v3, v4, v6, v7v1′, v10′, v3′, v4′, v6′, v7′12 p.m.–6 p.m.
Table 6. Validation and verification results of the STES charging process.
STES Tank Charging Temperatures (°C)
NodeGonzález-Altozano et al. [26]Unrau [30]Present WorkDifference (%)
150.8652.052.02.20
350.8652.052.02.20
550.8651.5951.882.00.6
850.8650.6251.160.61.1
1050.5148.2748.523.90.5
1250.043.8242.7614.52.4
Table 7. Economic parameters required to assess the cost of the project [32,33,34,35].
Type of CostParameterValue
DirectSolar FPC field$172 USD/m2
Solar PTC field$177 USD/m2
Site improvements$15 USD/m2
HTF$3 USD/m2
Storage$26 USD/kWht
Contingency0.07 × (Solar field + site improvements + HTF system + storage)
IndirectEngineering, construction, and ownership cost0.1 × Direct cost
Total installation costDirect cost + indirect cost
Annual operation and maintenance cost1% of total installed cost
Expected lifetime of the solar plant25 years
Deductible tax percentage30%
Inflation rate5%
Table 8. Comparison of the solar fractions obtained in this work and those reported for food processing and beverages industries.
DemandSolar TechnologyLocationSolar FractionAuthor
Hot water at 80 °CETC collectors *Scotland, UK13.6%Eiholzer et al. [10]
Hot water in the interval 58–78 °CFPC collectorsGoess, Austria30.0%Mauthner et al. [13]
Hot water in the interval 63–65 °C Valencia, Spain45.0%
Hot water in the interval 35–55 °C Vialonga, Portugal20.0%
Steam at 120 °CPTC collectorsAndalucía, Spain34.9%Silva et al. [14]
Hot water at 135 °CPTC collectorsMolina, Italy23.0%Bolognese et al. [15]
Heat at 85 °CPTC collectorsGraz, Austria25.0%Biencinto et al. [16]
Almería, Spain52.0%
Hot water at 80 °CFPC collectorsEnsenada, BC, Mexico49.9%Present work
Steam at 160 °CPTC collectors 37.3%
* Optimized values without the limitation in capacity.
Table 9. Contrast between the results of Eiholzer et al. [10] and those obtained here for the same heat demand, taking advantage of the higher insolation levels of Ensenada, BC, Mexico.
ParameterEiholzer et al. [10]Present Work
Solar technologyETC collectors *FPC + PTC collectors
Area (m2)586950 + 871
STES volume (m3)3033 (×4)
Solar heat gain (MWh/year)308.11188.5
Investment cost (USD)282,895.2469,603.3
Payback period (years)6.515
Fossil fuel savings (MWh/year)362.51398.2
CO2 emissions (tons/year)66.7252
Renewable heat incentive (RHI) income (USD/year)33,273.7-
* Optimized values without the limitation in capacity.
Table 10. Comparison against other similar projects in terms of the LCOH using data from Table 7.
AuthorYearLocationSolar TechnologyArea (m2)LCOH (USD/kWh)
Mohammadi et al. [34] 2021Salt Lake City, USAPTC collectors20,9920.026
Tian et al. [17]2018Taars, DenmarkFPC + PTC collectors59600.058 *
Rosales-Pérez et al. [31]2024Calama, ChileFPC + PTC collectors6870.063, 0.081
Eiholzer et al. [10]2017Scotland, UKETC collectors5860.133 **
Present work2024Ensenada, MexicoFPC + PTC collectors18210.032
* 1 DKK = 0.14 USD; ** 1 EUR = 1.07 USD.
Disclaimer/Publisher’s Note: The statements, opinions and data contained in all publications are solely those of the individual author(s) and contributor(s) and not of MDPI and/or the editor(s). MDPI and/or the editor(s) disclaim responsibility for any injury to people or property resulting from any ideas, methods, instructions or products referred to in the content.