Article

Crystal Violet (CV) Biodegradation Study in a Dual-Chamber Fungal Microbial Fuel Cell with Trichoderma harzianum

1
Normandie Université, Université Rouen Normandie, CNRS UMR 6270, Polymères, Biopolymères, Surfaces, 76821 Mont Saint-Aignan, France
2
Group of Analysis and Processes (GA&P), Department of Chemistry, University of Angers, 2 Bd. A. de Lavoisier, 49045 Angers, France
3
Department of Biology, University of Angers, 2 Bd. A. de Lavoisier, 49045 Angers, France
*
Author to whom correspondence should be addressed.
Energies 2024, 17(1), 247; https://doi.org/10.3390/en17010247
Submission received: 11 November 2023 / Revised: 12 December 2023 / Accepted: 19 December 2023 / Published: 3 January 2024
(This article belongs to the Section A4: Bio-Energy)

Abstract

:
In the present study, CV dye, known as a recalcitrant dye, was tested for bioremediation via Trichoderma harzianum in a dual-chambered MFC for the first time. Two types of carbon clothes, KIP and CSV from the Dacarb company (France), were tested as electrodes and supported for fungi growth. We first observed that 52% and 55% of the CV were removed by the MFC using KIP and CSV anodes, respectively. The incomplete removal of VC was explained by the relative toxicity of VC to T. harzianum and correlated with IC50 determined as 0.97 ± 0.28 mg L−1 at 25 °C. Furthermore, the MFC working with the KIP electrode was more efficient with a higher maximum power density of 1096 mW m−3 and was only 14.1 mW m−3 for CSV. The MFC experiments conducted on KIP without the T. harzianum biofilm exhibited significantly lower potential and power density values, which proves the electrocatalytic effect of this fungus. These results provide new insight into the development of an effective MFC system capable of direct energy generation and, at the same time, promoting the bioremediation of the persistent CV pollutant.

Graphical Abstract

1. Introduction

Many classes of dyes are used in textile industries, and the triphenyl methane group is predominant in most dying applications [1]. Among this group, crystal violet (CV) has been used for a long time as a biological stain and textile dye [2], but it is now classified as a potent carcinogen [3]. CV is also reported to be a recalcitrant dye molecule because it persists in the environment for a long period. It is a mitotic poison with potent clastogen effects and promotes tumor growth in some fish species.
Several dye removal methods have been studied. Among them, photocatalytic degradation is an effective method to eliminate dyes from wastewater. Direct red 16 has been effectively removed with the mixed photocatalyst B-ZnO/TiO2 [4]. Among metal-organic frameworks, Fe-BTC and ZIF-8 have shown an interesting sorption potential for methyl orange removal [5]. Biomass can also be used for dye removal. Wheat straw has been used as a biosorbent for the removal of reactive black 5 from wastewater [6]. Indeed, biological methods are a growing interest for dye removal.
The use of fungi and their enzymes for dye degradation has been well-appreciated in the literature, especially for the detoxification of wastewater [7]. Studies have proved the ability of fungal biomasses or their purified enzymes to degrade different types of organic pollutants [8]. Among these enzymes, laccase, a copper-containing oxidase, showed an ability to oxidize a large range of chemical compounds, among them polyphenols, diphenols, diamines, aromatic amines, benzenethiol, substituted phenols [9,10,11], and colored pollutants [12]. The removal of CV from polluted soils by fungi has been tested by Moturi et al. using the white rot fungi Polyporus elegans, Trametes versicolor, and Lenzites betulina and the soil fungus Mucor mucedo [13]. The soils were sampled from textile dye industries’ wastes and used as substrates. After 15 days of incubation, between 63 and 78% of CV was decolorized without a toxic effect on the fungi. The degradation of dyes was explained by the production of a significant quantity of lignin peroxidase, manganese peroxidase, and laccase enzymes. The degradation of CV by Trichoderma asperellum laccase has also been reported [14].
The MFC came directly from the discovery of electricity production by Escherichia coli and Saccharomyces spp. in the early 20th century [15]. Microbial half-fuel cells were first connected in series and were able to produce over 35 volts and 2 milliamperes [16]. An MFC can produce electricity by degrading organic substrates from human activities, such as phenol from coconut husk retting effluents [17] and leachate substrates like fruit waste and landfill leachates [18,19]. MFCs also decrease nitrogen and phosphorus compounds and, therefore, the chemical demand for oxygen in wastewater from the agro-food industry [20], like breweries [21], paper industries [22], kitchens [23], swine breeding [24], and organic acid fermentations [25].
The employment of fungi, specifically filamentous species, as electrodes in MFCs is gaining increasing interest due to their ability to degrade an array of substrates, including persistent and complex pollutants [26,27]. Scedosporium dehoogii was used as the bioanode for acetaminophen degradation with a power production of 50 mW m−2 [28]. Fungi can also be used for dye degradation in MFCs. In particular, Pleurotus ostreatus was able to degrade brilliant blue remazol R during multiple functioning cycles with a removal between 80% and 90% in the three first cycles and 60% for the last due to the declining laccase activity [29]. Aspergillus nigger and T. harzianum have been experimented with as bioanodes within MFCs to evaluate their ability to degrade Acid Red 399, Acid Yellow 235, Acid Yellow 218, Acid Blue 296, and Acid Black 172 [30]. A. niger demonstrated the ability to remove between 70 and 90% of each dye, whereas T. harzianum eradicated 90% of Acid Black 172 and between 30 and 40% of the remaining dyes.
The use of T. harzianum in MFCs is poorly documented in the literature and has not been experimented with in conjunction wtih CV. However, the CV degradation ability of T. asperellum could be extended to T. harzianum. An MFC is different from other dye removal methods in such a way that an electric current can be produced from the dye degradation. Therefore, CV degradation by T. harzianum with electricity generation could be both experimented with and exploited.
In this work, MFCs were tuned up as electrodes for VC removal using T. harzianum cultivated biofilm in two types of carbon cloth materials. The experiments were conducted in the open circuit voltage mode (OCV) and then in closed circuit voltage (CCV). The obtained results were analyzed to optimize CV removal and power production in an MFC, considering the influence of the carbon cloth electrode, saturation step, and circuit mode.

2. Experimental

2.1. Micro-Organism and Culture Media

The T. harzianum strain 1573 used in this study was collected from tree bark near Angers, France, and was gracefully provided by the IRHS-INRAE (Angers, France). T. harzianum stock cultures were prepared on potato dextrose agar plates (PDA) (3.9 wt.%) (Sigma-Aldrich, Paris, France).

2.2. Chemicals

The following chemicals were used in this study: crystal violet (Aldrich Chemical Compagny, Milwaukee, WI, USA), anhydrous citric acid (Fisher bioreagents, Fair Lawn, NJ, USA), dihydrated trisodium citrate (Sigma-Aldrich Produktions GmbH, Steinheim, Germany), potassium ferricyanide (ACS reagent grade, MP Biomedicals, Solon, OH, USA), anhydrous D (+)-glucose (ACS reagent grade, Acros Organics, NJ, USA), and hydrochloric acid (Analytical reagent grade, Acros Organics, Geel, Belgium).

2.3. Electrodes

The KIP-1300 (KIP) and CSV-1100 (CSV) carbon clothes electrodes were gracefully given by Dacarb (Asnières-sur-Seine, France). The activated carbon cloth referenced KIP was prepared from a phenolic resin precursor and physically activated by a water steam [31]. Usually, activated carbon fibers are prepared this way, including those to manufacture CSV. Both carbon clothes electrodes also have microporous and mesoporous structure, with a specific surface of 1560 g m2 for KIP and 1230 g m2 for CSV [32].

2.4. Toxicity of VC

The toxicity of CV towards T. harzianum was investigated on plates containing 3.4 wt.% PDA and between 0 and 2.5 mg L−1 of VC, for 140 h. T. harzianum was inoculated onto the plates using a platinum inoculation loop, with a single spot placed in the center of each plate. The growth of T. harzianum was monitored by measuring the diameter of the growth on two orthogonal axes and maintaining a temperature constant at 25 °C in an oven. Each experiment was conducted in triplicate and the results were averaged.

2.5. MFC

The MFC was composed of two glass compartments (100 mL volume) separated by a 3 cm × 3 cm Nafion 117 cation exchange membrane (provided by Ion Power GmbH, Munich, Germany). Both compartments were sealed with Teflon gaskets and sterilized via autoclaving. The setup was assembled in a microbiological safety cabinet. Carbon clothes used as electrodes are connected to the electrical circuit via platinum rods (1.5 mm diameter, 99.95% purity, ThermoFisher, Kandel, Germany) and alligator clips. The circuit consisted of a multimeter and a resistance decade box (Elc, DR06, Angers, France) arranged in parallel. The carbon cloth anode (3 × 3 cm) was inoculated with T. harzianum spores (1 × 10⁶ spores mL−1) for 3 days at room temperature before being placed in the MFC. The anodic compartment was filled with a solution of VC (100 mg L−1) and D (+) glucose (10 mg L−1) as co-substrate, in citrate buffer (pH 5.0, 0.1 M ionic strength). The cathodic compartment contained potassium ferricyanide (PF, 31.9 g/L) in citrate buffer (0.1 M ionic strength) for dioxygen reduction and to improve the electrical performance of the MFC. The MFC was operated at room temperature (22 +/−2 °C) with magnetic stirring (130 rpm) for 7 days. As a control experiment, an MFC was run without T. harzianum. To eliminate the effect of dye sorption on the anode, an MFC was also tested with carbon cloth previously saturated with CV (300 mg L−1). For all experiments, samples of the anolyte (0.25 mL) were collected at regular intervals, diluted with 3.75 mL of deionized water, and stored in a freezer to prevent further T. harzianum growth. At the end of the experiment, the samples were thawed, homogenized, and analyzed with a UV–visible spectrophotometer (Agilent Technologies, Santa Clara, CA, USA, Cary 100) to measure the change in absorbance at 590 nm (the maximum absorption wavelength of CV). The CV concentrations (initial C0, and at t time Ct expressed in mg L−1) were determined using a previously established calibration curve. The CV removal ratio (f %) was calculated from the changes in VC concentrations over time as follows:
f = C 0 C t C 0 × 100
The mass of CV removed per gram of carbon cloth at equilibrium (qe) and at a given time (qt), expressed in mg g−1, were calculated using the following equations:
q e = C 0 C e q V m   q t = C 0 C t V m
with Ceq the CV concentrations in solution at equilibrium (mg L−1), C0 the CV concentration in solution at t = 0 (mg L−1), V’ the volume of solution (L) and m the mass of carbon cloth (g).
Pseudo-first order kinetics of removal were plotted using the following equation:
ln (qe − qt) = −kt
with k as rate constant (h−1) and t as time (h).
Half-reaction time (t1/2 as expressed in h) were calculated as follows:
t 1 / 2 = ln ( 2 ) k
with k as rate constant (h−1).
During the experiment, the external resistance of the MFC was fixed at 1 MOhm in open circuit conditions (OCV). The potential between the electrodes (E, in V) was measured twice daily at different values of external resistance (R, in Ω) set with an external resistance decade box. The current intensity (I, in A) was then calculated using Ohm’s law, as follows:
E = I R
I as current intensity (A) and R as external resistance (Ω).
The power output (P, in W) was determined at the optimal resistance, as follows:
P = E I
with E as electric potential (V) and I as current intensity (A).
The optimal resistance, maximum current density (J, in mA m−2), maximum power density (φs, in mW m−2 of electrode) and maximum volume power density (φv, in W m−3 of electrode volume and φv’ in mW m−3 of anolyte volume) of the MFC were deduced from these measurements (see Figure A1 in the Appendix A), as follows:
J S = I S φ S = P S φ v = P V   φ V = P V
with I as current intensity (A), P as power output (mW), S as anode surface (m2), V as anode volume (m3) and V’ as solution volume (m3).
In addition, the performance of the MFC was tested in the closed-circuit voltage mode (CCV) at the measured optimal external resistance R [33].

2.6. Carbon Cloth Characterization

Prior to initiating each microbial fuel cell (MFC) trial, a series of dimensional and physical property measurements were conducted on the utilized KIP and CSV carbon cloth anodes. These metrics included an evaluation of the cloth’s average thickness and volume, obtained using precision calipers, as well as determinations of the cloth’s weight and density.
The contact angle (θ) between the carbon cloth surface and the anolyte solution—comprising CV (100 mg L−1) and D (+) glucose (10 mg L−1) within a citrate buffer of pH 5.0 and 0.1 M ionic strength—was measured at a standard room temperature of 23 °C. This was accomplished by utilizing the sessile drop technique contact angle determination mode of the DSA 25 drop shape analyzer from Krüss (Hamburg, Germany). The droplet’s size was regulated to 3 µL and the exposure duration was kept at 500 ms. A minimum of five measurements were taken and averaged to attain each result.

3. Results and Discussion

3.1. Stability of VC

The stability of CV in light over time is a crucial consideration, as light sensitivity could make it difficult to differentiate degradation caused by fungi and degradation caused by light. To address this issue, UV–visible spectroscopy was used. The spectra of a VC solution (100 mg L−1) in citrate buffer (pH = 5.0) after 24 days of exposure to daylight were found to be similar to the spectra before exposure, with no significant decrease in absorbance at the maximum absorption wavelength (590 nm for CV). This suggests that light exposure will not significantly affect VC concentration in the upstream compartment during MFC experiments.
The stability of VC after autoclaving for sterilization (20 min, 120 °C, P = 1.4 bar) was also assessed using UV–visible spectroscopy. No effect of the treatment on CV concentration was observed).

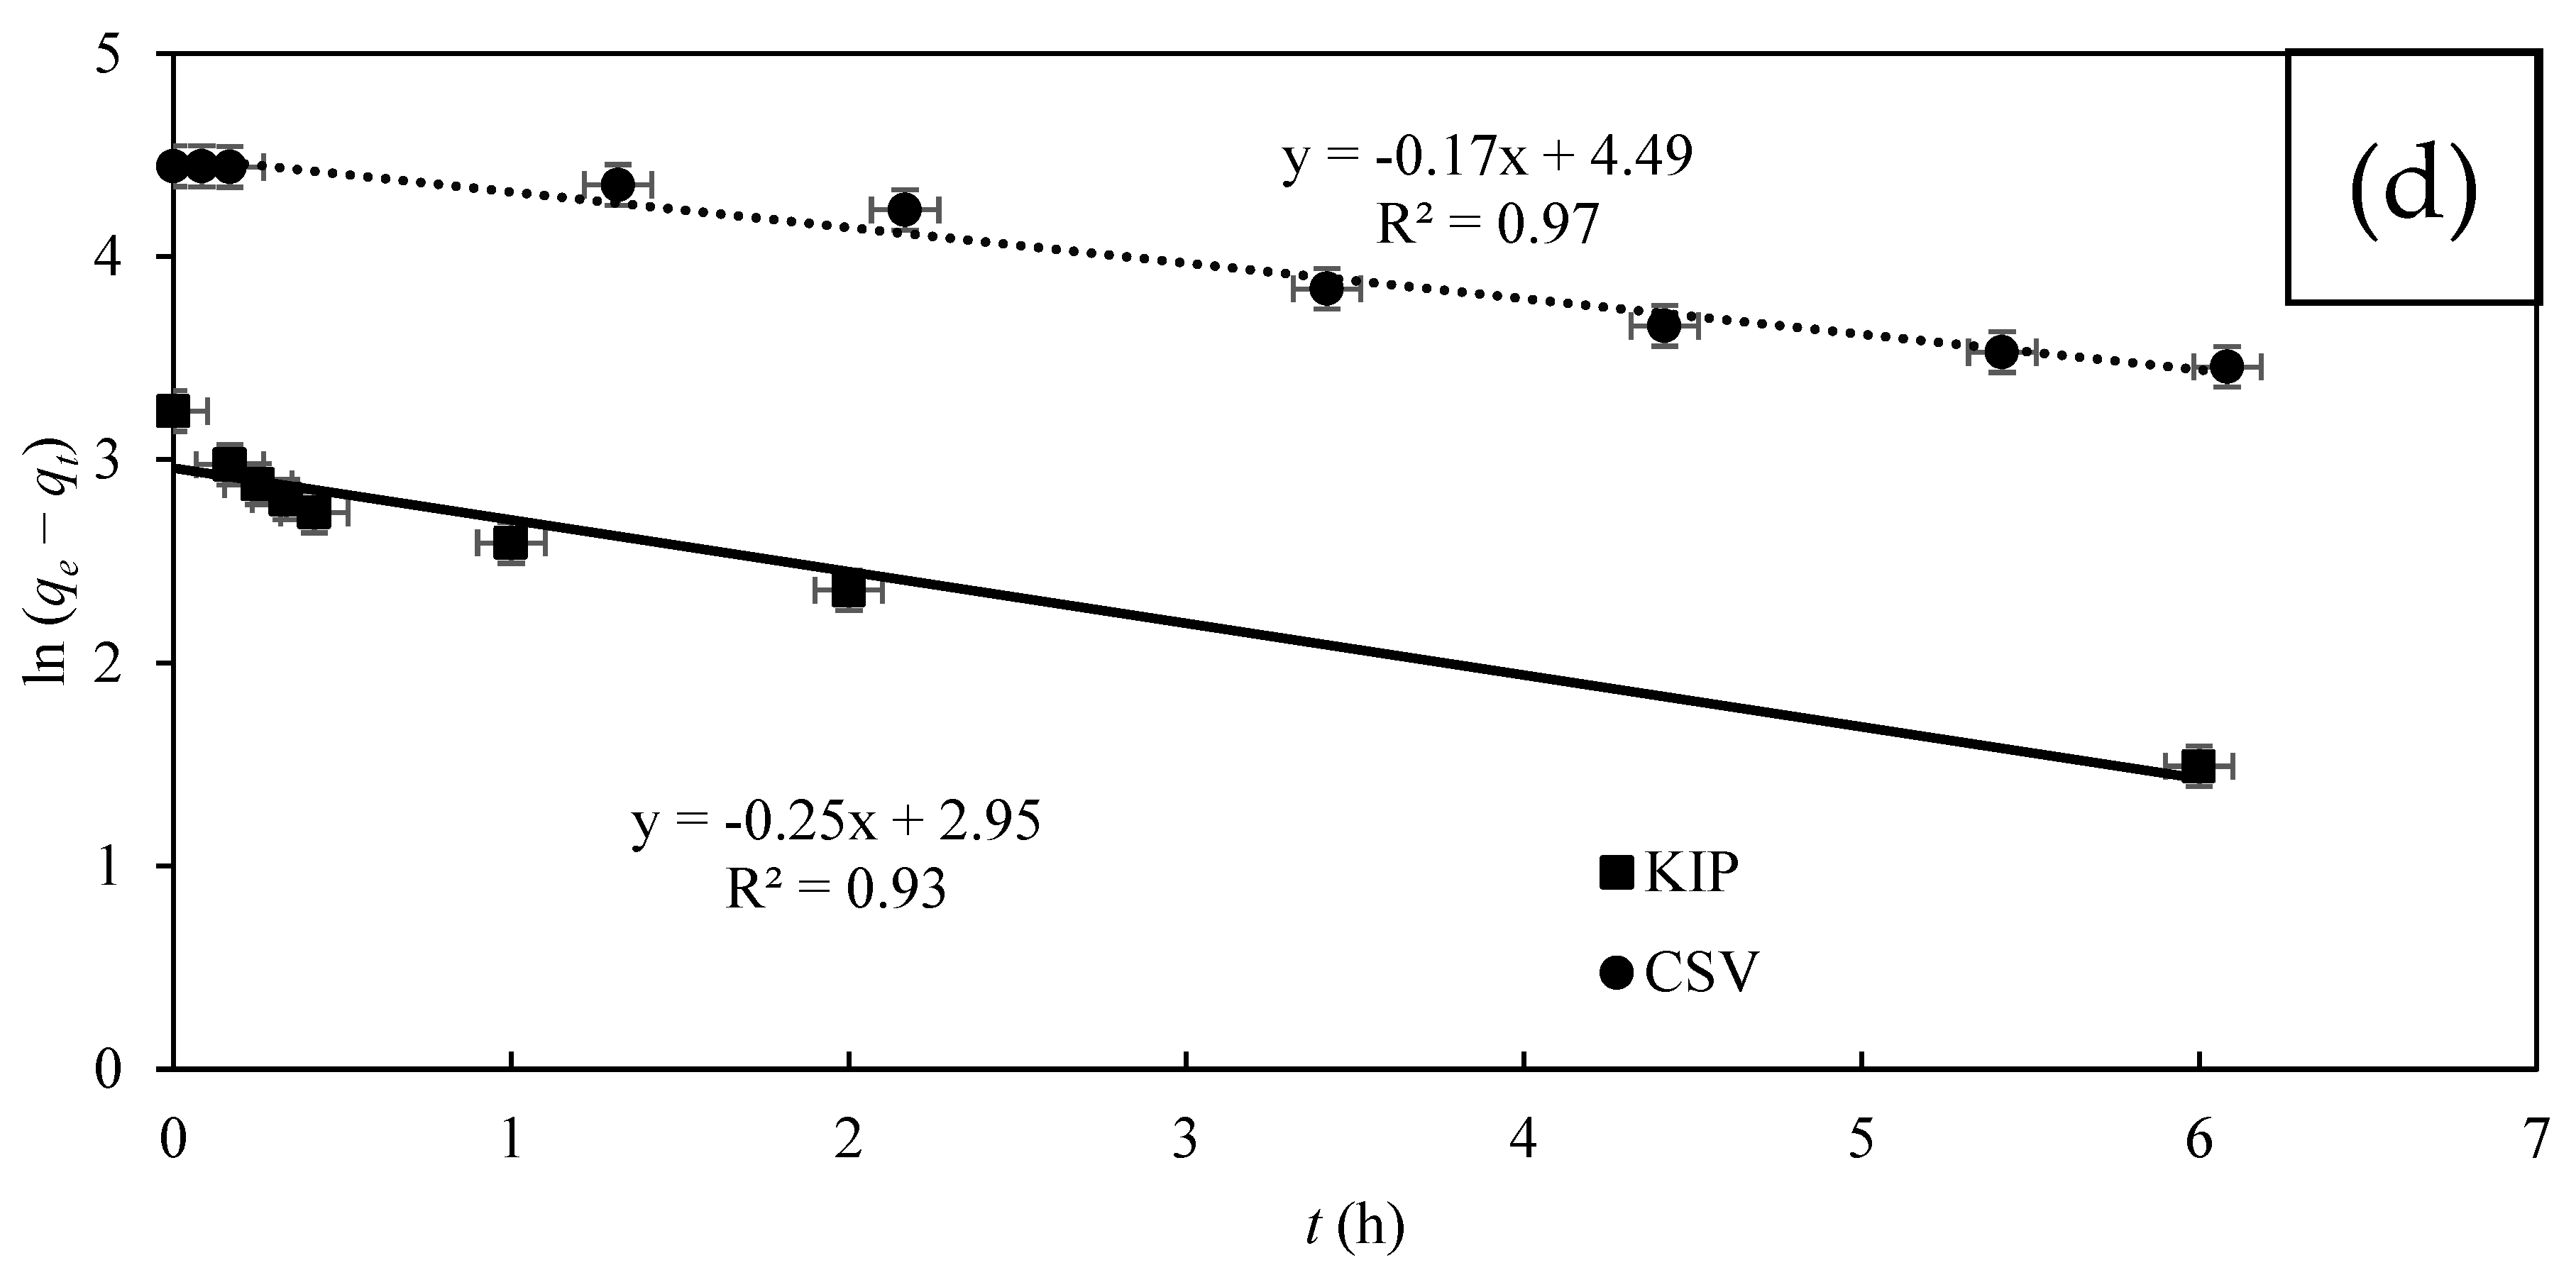
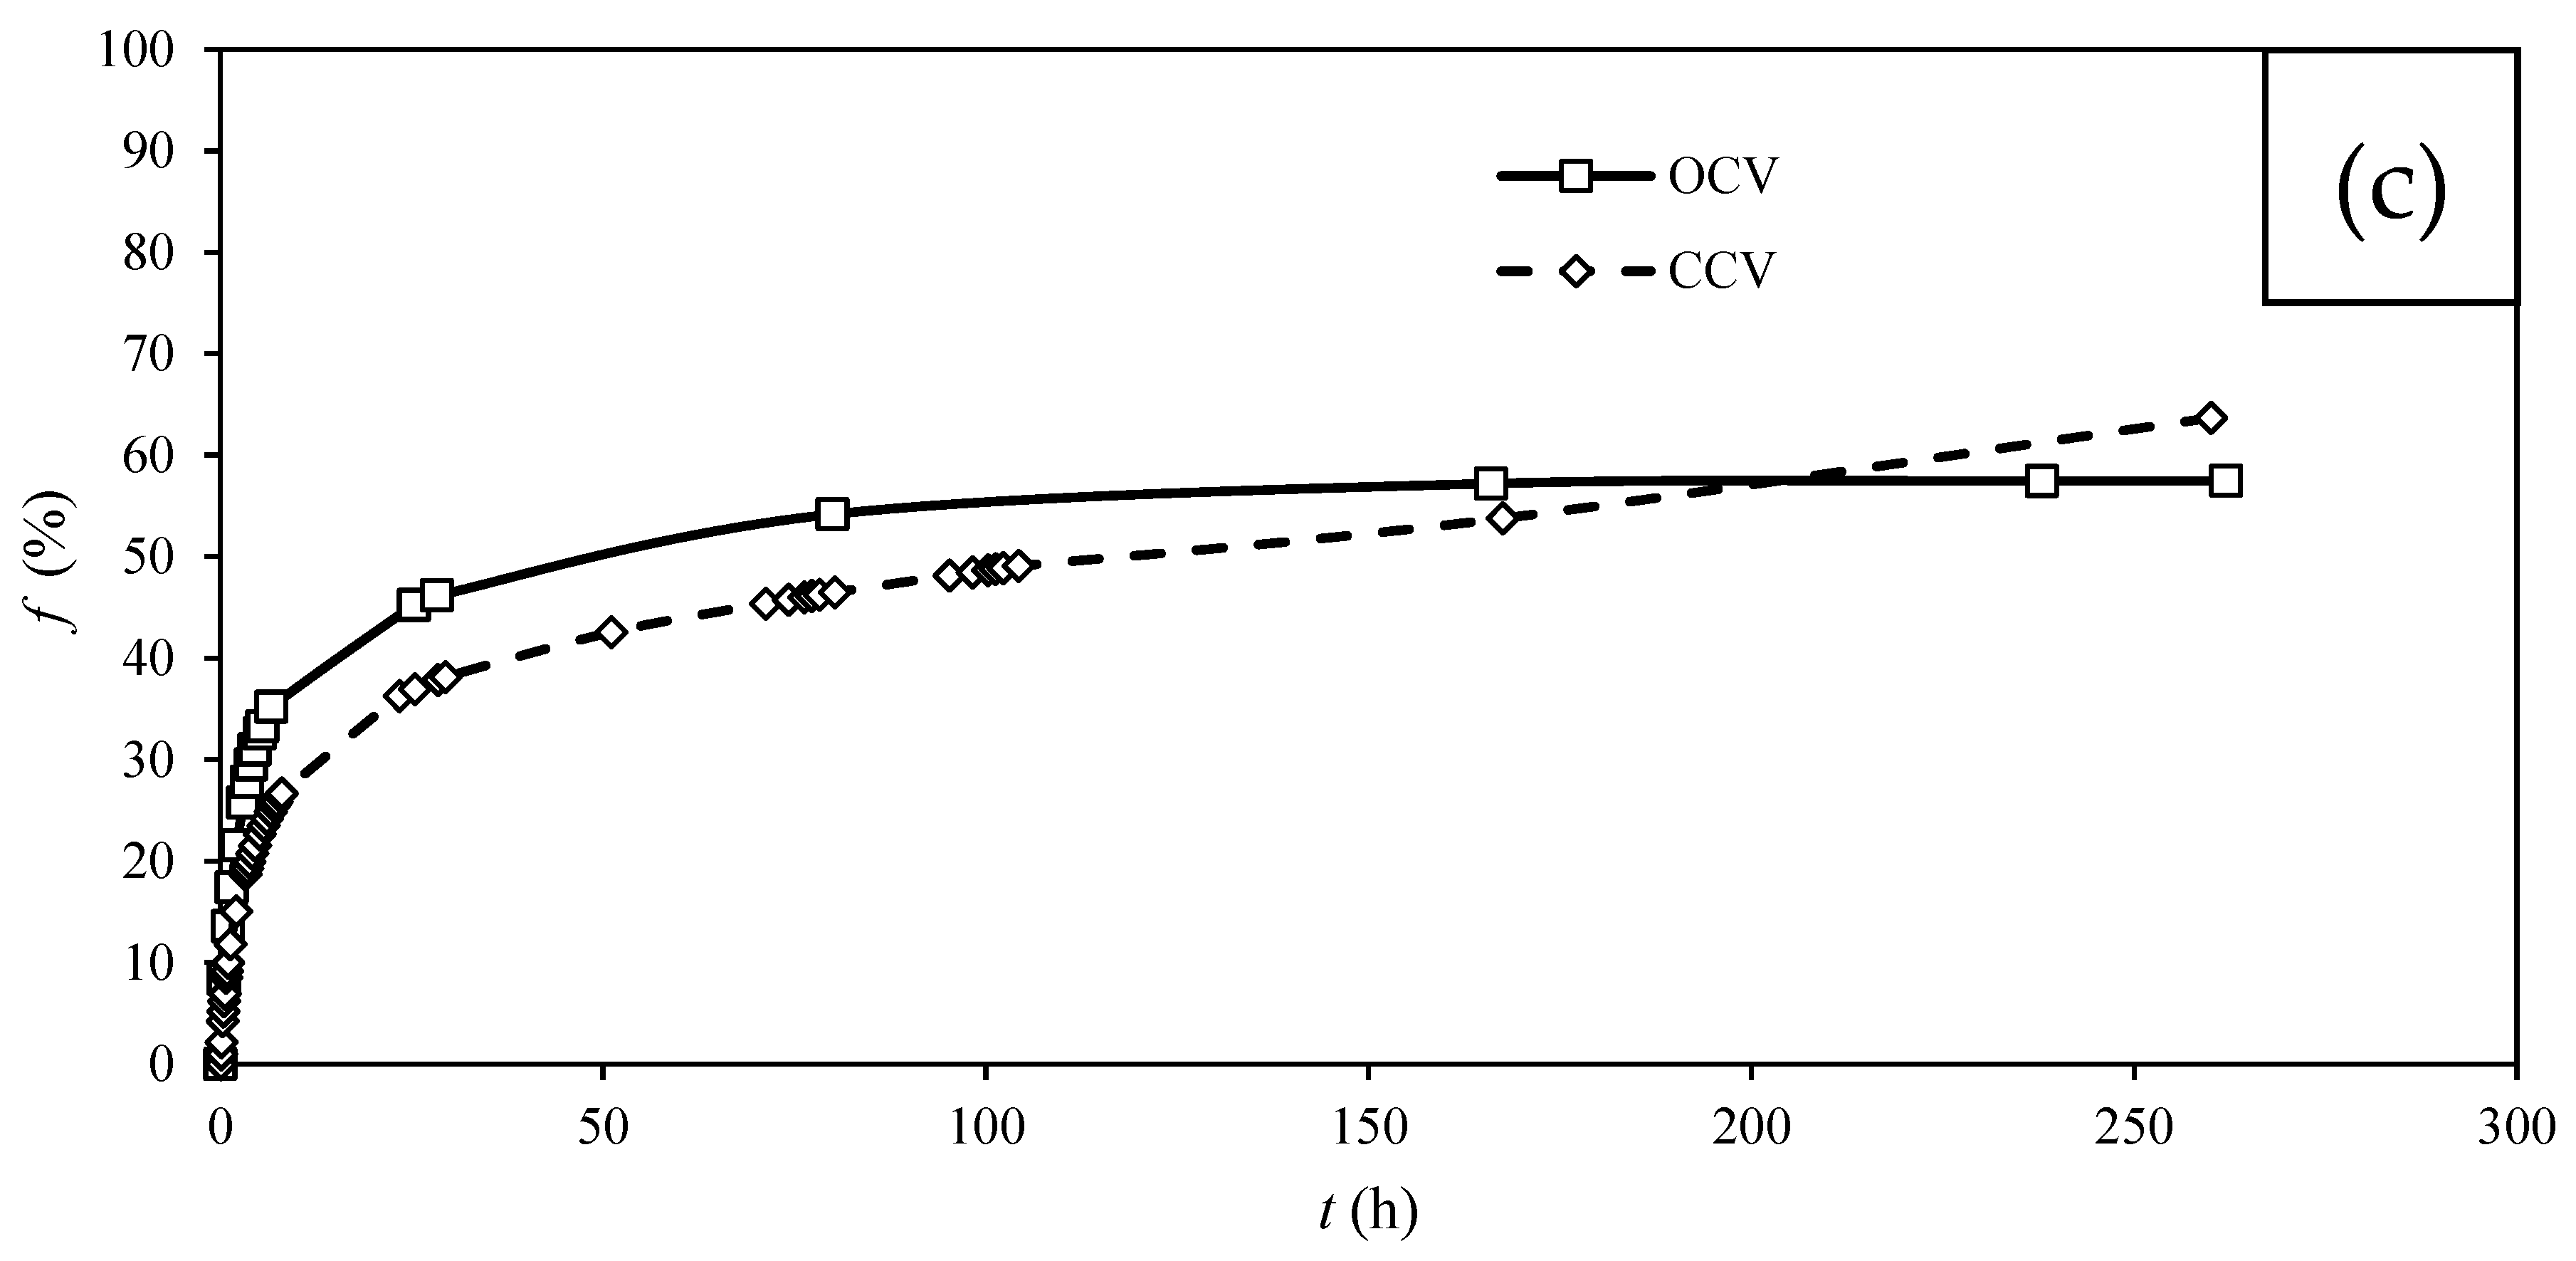
3.2. CV Removal by MFC

The performance of the MFC in terms of CV removal was evaluated using KIP and CSV carbon cloth anodes. The evolution of the UV–visible spectra of the CV anolyte solution over time is shown in Figure 1a. Initially, prior to the oxidation reaction, the absorption spectrum of VC in water exhibited a main peak at 584 nm in the visible region, and two peaks at 250 and 300 nm in the UV region. These peaks were attributed to aromatic structures in the molecule, with the peak at 590 nm arising from the chromophore [34]. The gradual decrease in the visible peaks with time was due to the cleavage of aromatic rings through oxidation. In addition to the rapid decolorization of the solution, the decrease in absorbance at 250 or 300 nm was taken as an indication of aromatic fragment degradation of the dye molecules and its by-products [35,36].
The MFC equipped with a KIP carbon cloth anode exhibited a faster rate of VC consumption compared to the MFC with a CSV anode (Figure 1b). For both systems, the disappearance of 100 mg L−1 CV was rapid, reaching a plateau within 25 h, but complete removal was not achieved whatever the anode. Additionally, Figure 1b shows that a slightly larger amount of VC was removed using the KIP anode. This higher CV removal with KIP may be due to its more hydrophobic properties, which enhanced contact with T. harzianum, which is also hydrophobic [37]. Measured contact angles with the anolyte indicated that the drop instantly penetrated the CSV carbon cloth, resulting in complete wetting. In contrast, the contact angle for the KIP anode was 102° ± 2° under the same conditions.
For a more comprehensive evaluation of the results, Figure 1c shows the CV removal ratio f vs. time. It indicates that 52% and 55% of the CV was removed at 40 h in the MFC using KIP and CSV anodes, respectively. This was attributed to the production of VC degradation by-products and the CV toxicity that could inhibit CV removal.
The degradation kinetics of CV in MFC was modelized. The first, second and pseudo-first order were evaluated and the pseudo-first order was found to best fit with respective R² of 0.93 and 0.98 for KIP and CSV carbon clothes as demonstrated by a linear plot of ln (qeqt) = f(t) (Figure 1d). The pseudo-first order is plotted with concentration of CV evolution through time, each concentration value being divided by the mass of carbon cloth, taking account of both sorption and degradation phenomenon occurring in VC removal.
A pseudo-first order kinetic is commonly observed for metal ion sorption, e.g., by complexing membranes [38]. It has also been reported in biorefractory organics molecules or azo-dye removal in MFC [39,40]. The corresponding k and t1/2 values indicated faster removal with KIP (k = 0.25 h−1 and t1/2 = 2.7 h) compared to CSV (k = 0.17 h−1 and t1/2 = 4 h). This is consistent with the idea that KIP has better compatibility with T. harzianum, allowing a higher amount of biomass compared to CSV and a faster rate of CV consumption.
As shown in Figure 1b, the initial concentration of CV differs from the expected concentration of 100 mg L−1 (80 mg L−1 for KIP and 93 mg L−1 for CSV). This is likely due to the fast sorption of CV by the carbon cloth, as carbon black and carbon fibers are known to facilitate the sorption of organic molecules. This raises the question of what proportion of CV is actually consumed by the fungus to produce current and what is absorbed by the carbon fiber. To quantify the sorbed fraction, sorption experiments were conducted on CSV and KIP carbon clothes in a CV solution (650 mg L−1). The results showed that the carbon clothes indeed sorbed CV, with 70 mg g−1 for CSV and 170 mg g−1 for KIP at saturation. CSV and KIP were saturated after 3 days and 10 days, respectively. The amount of sorbed VC was higher for KIP and the saturation took longer due to its larger thickness (950 µm for KIP and 450 µm for CSV). Moreover, KIP displayed a higher affinity for VC than CSV in time due to more favorable chemical interactions with CV. CV contains three aromatic cycles that create π-stacking bonds with the carbon fibers, which are thicker and denser in KIP. The saturation of the carbon cloth was not observed during MFC operation, as the CV concentration was not high enough to reach it, and the presence of T. harzianum within the carbon cloth anode likely prevent the VC sorption. However, these results demonstrated that a significant portion of CV was sorbed by the carbon cloth during MFC operation (7 days), and particularly for KIP.
It is difficult to quantify the extent to which the fungi obstruct the sorption sites of the carbon cloth, making it challenging to estimate the proportion of VC that is available during MFC operation. To mitigate this sorption phenomenon by the anode during the experiment, the carbon cloths were pre-saturated with CV (500 mg L−1) prior to their use in the MFC. Figure 2a,b compare the evolution of CV concentration in the MFC with KIP and CSV, with and without the CV saturation step.
Pre-saturation of the anode resulted in a slower decrease in CV concentration in solution over time due to the higher CV concentration available for T. harzianum and a possible desorption of CV from the carbon cloth. After curve modeling (the calculated rate constants were k = 0.13 h−1 and k = 0.04 h−1, and the half-reaction times t1/2 = 5.2 h and t1/2 = 16.7 h−1 for KIP and CSV, respectively (instead of k = 0.25 h−1 and t1/2 = 2.7 h−1 for KIP, and k = 0.17 h−1 and t1/2 = 4 h for CSV, without saturation step). These results highlight the influence of the carbon cloth during CV removal by the MFC through a sorption-desorption phenomenon. T. harzianum also uses CV for its growth and maintenance during MFC operation. In the absence of a fungi biofilm on the carbon cloth anode, the removal rate of CV was much lower (k = 0.16 h−1 and t1/2 = 4.4 h instead of k = 0.25 h−1 and t1/2 = 2.7 h) for KIP (Figure 3). This result demonstrates that T. harzianum plays a significant biocatalytic role in the MFC.
Indeed, literature displays a few reports on CV bioremoval from aqueous solutions by MFC using fungi to allow comparisons with our results. Bumpus et al. studied the biodegradation of CV in ligninolytic cultures of the white rot fungus Phanerochaete chrysosporium [1]. The disappearance of CV was demonstrated and three metabolites (N,N,N’,N’,N”-pentamethylpararosaniline, N,N,N’,N”-tetramethylpararosaniline, and N,N’,N”-trimethylpararosaniline) formed by sequential N-demethylation were identified as by-products of degradation of the original compound. Another work reports a maximum of 66.6% decolorization rate of CV at the concentration of 100–280 mg L−1 with Phanerochaete chrysosporium [41].
Some works also report the use of bacteria to degrade CV in MFC. Yatome et al. reported the degradation of CV at a low concentration (about 2 mg L−1) with bacterial cells of Nocardia coralline IAM 12121 [42]. Roy et al. used bacteria from Enterobacter family to perform CV degradation and complete removal was obtained in a mineral salt medium containing up to 150 mg L−1 of CV dye [43]. Cheng et al. 2014 investigated the feasibility of CV bioremoval from wastewater in a single-chamber MFC with Aeromonas hydrophila YC 57 [44]. This work resulted in removal rates of 82.5% at initial CV concentration of 100 mg L−1.

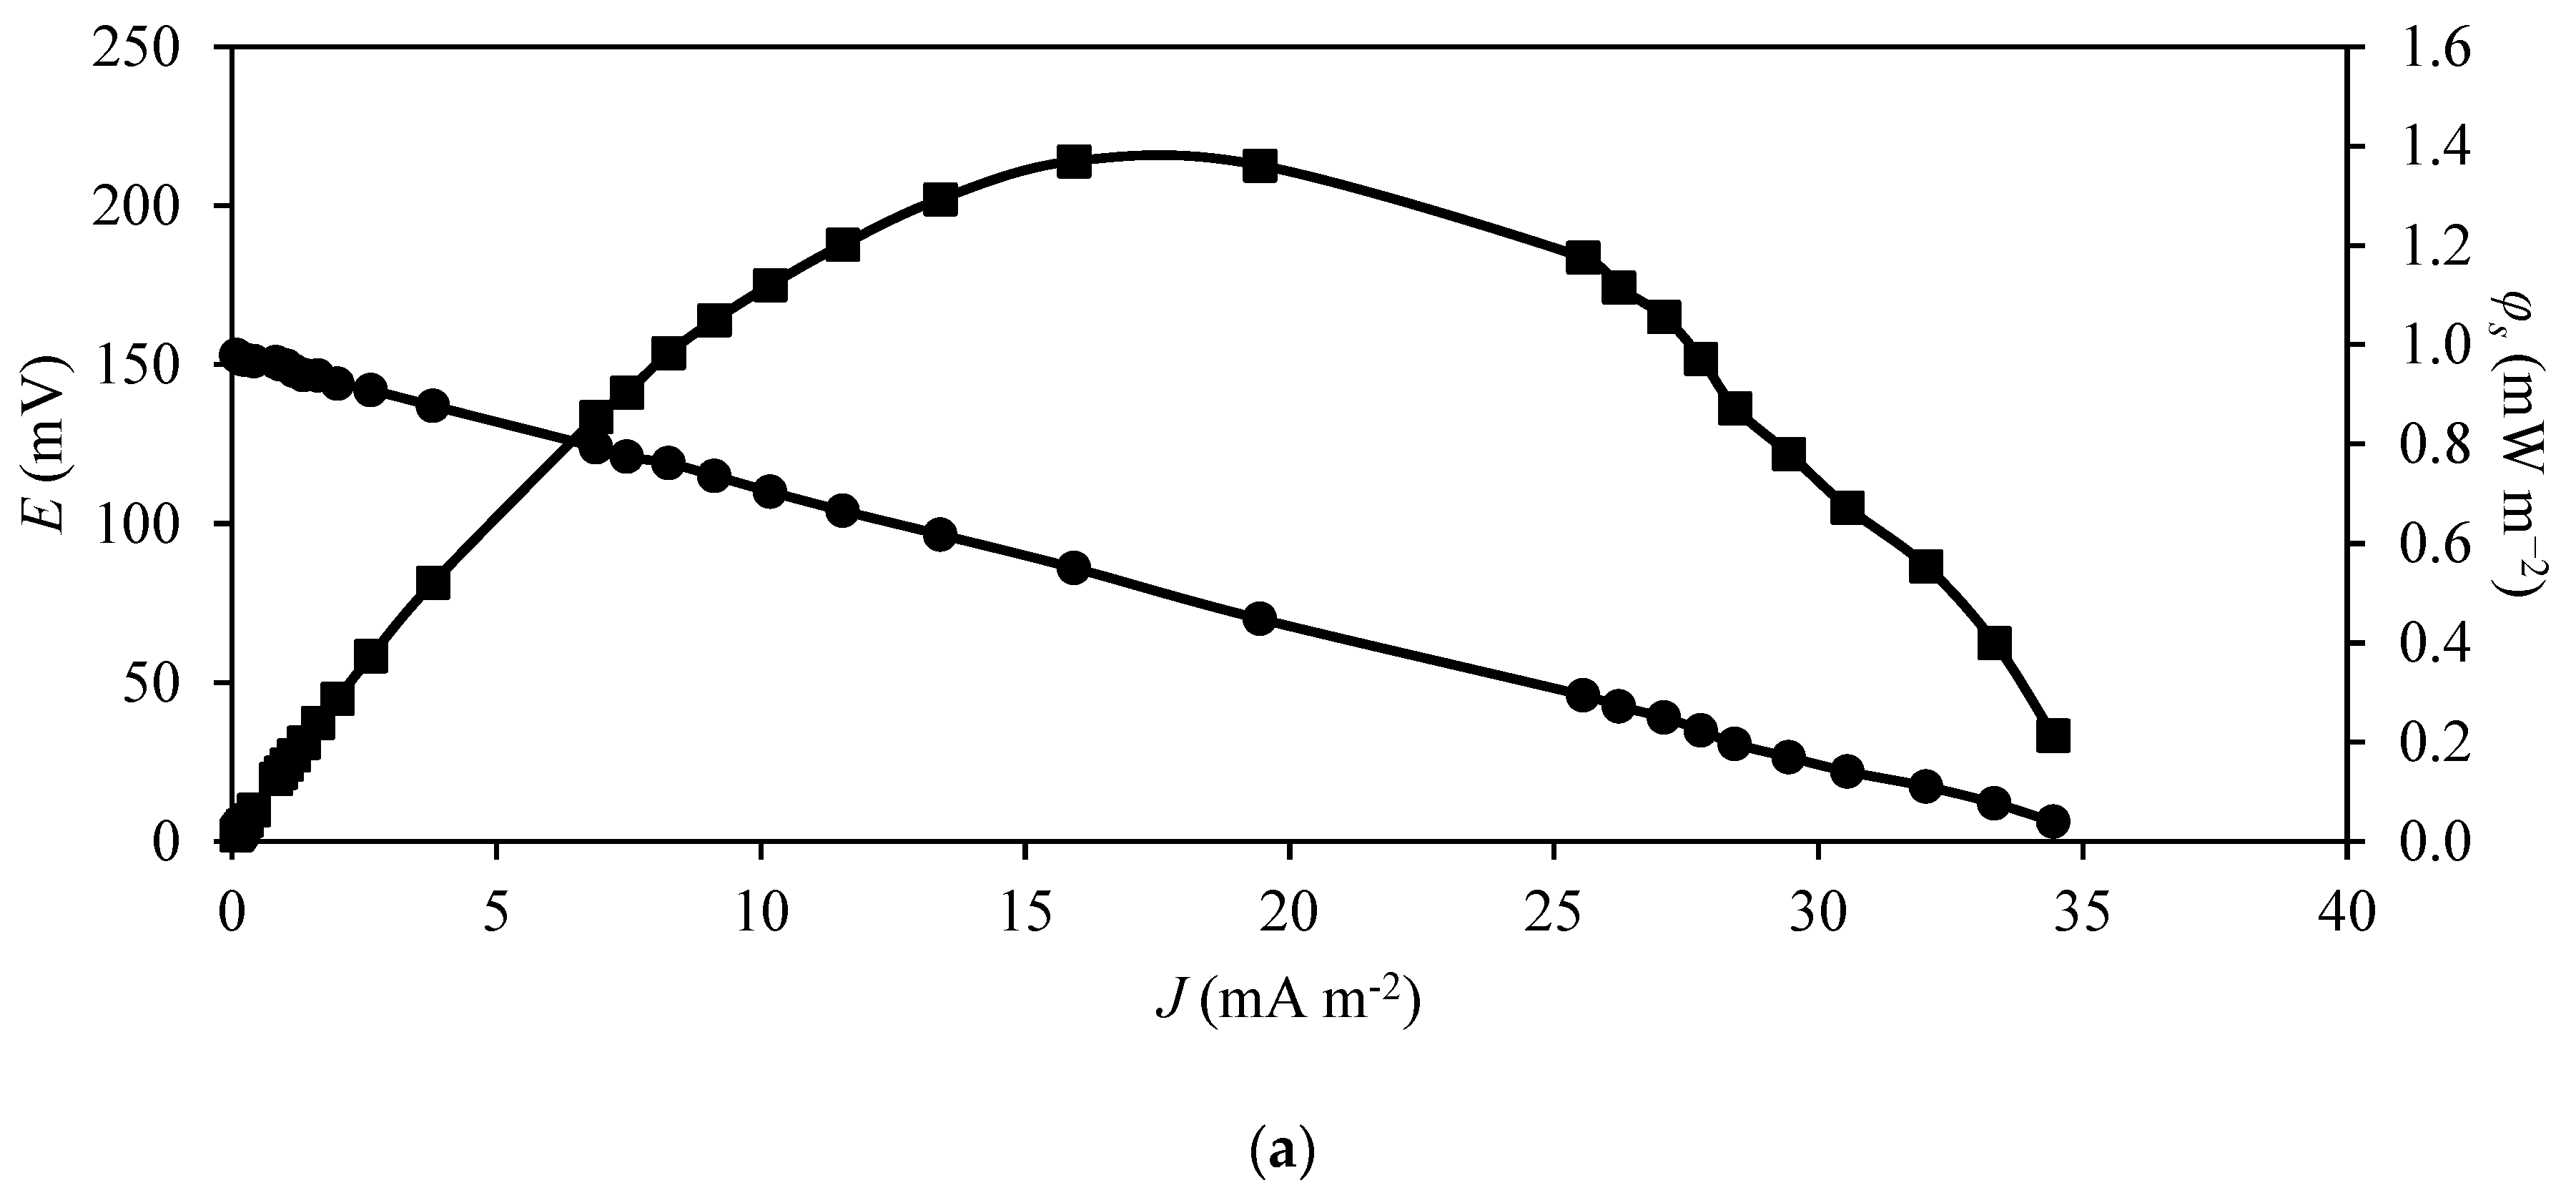
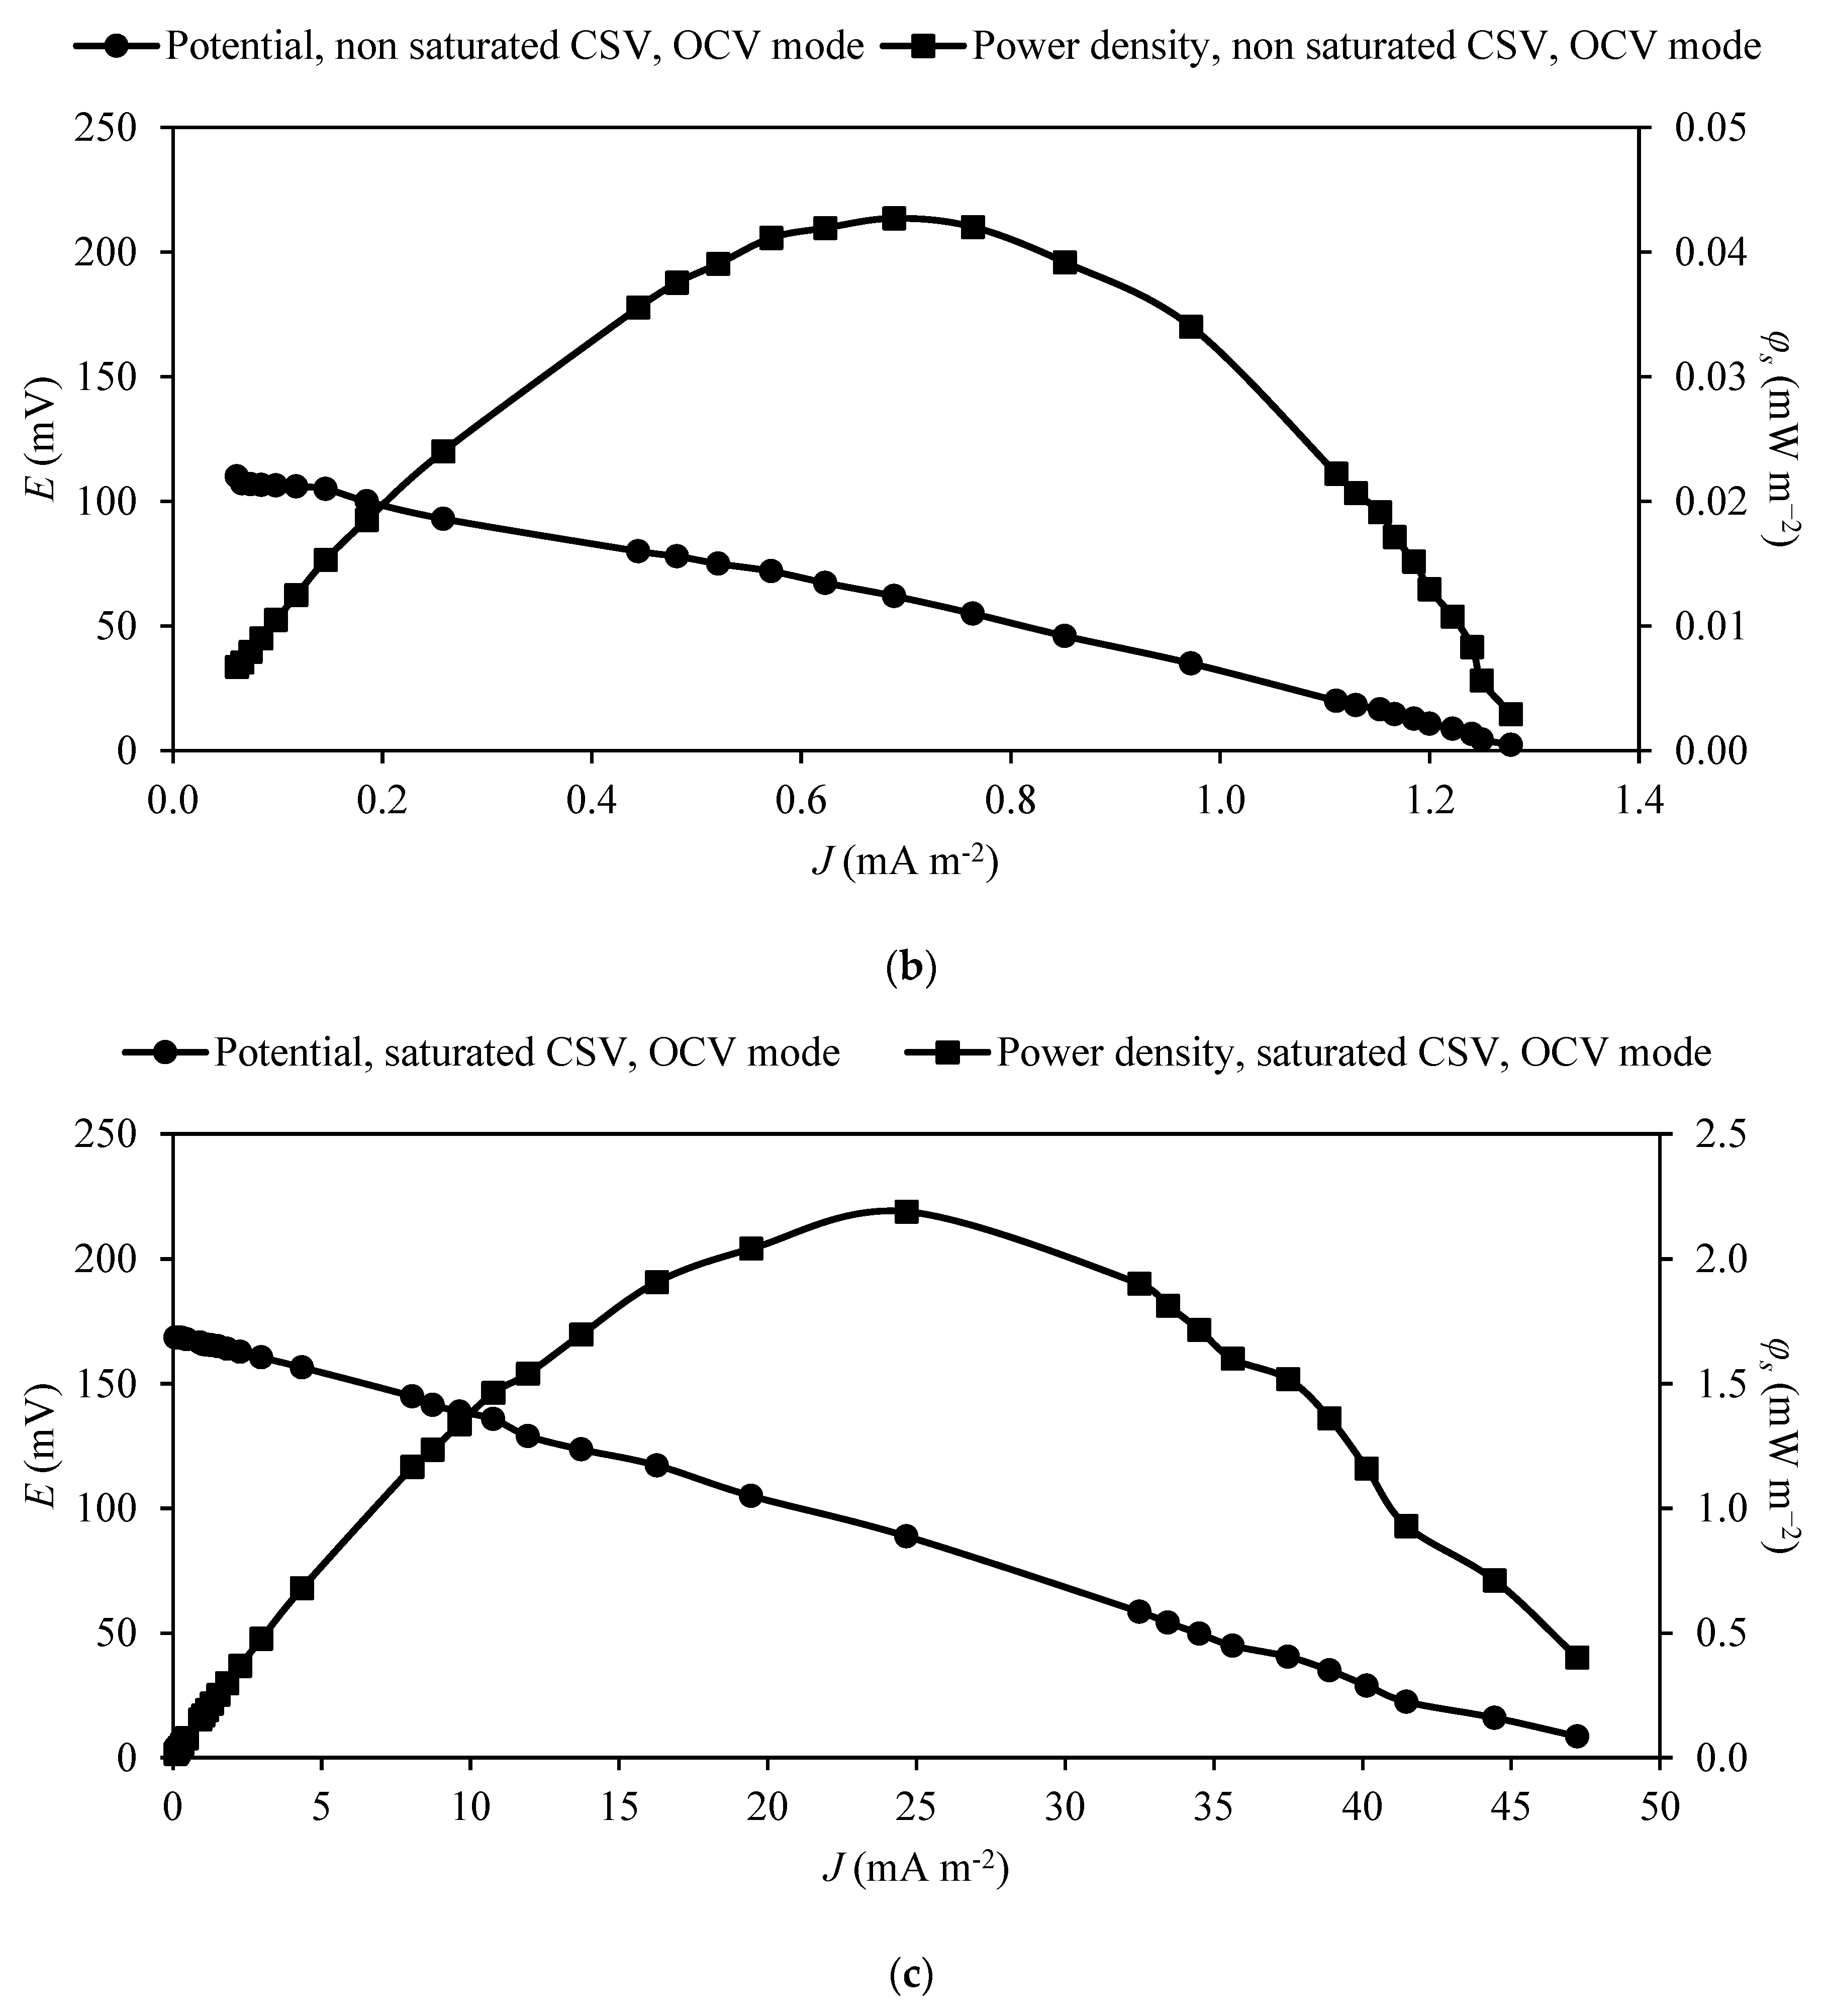
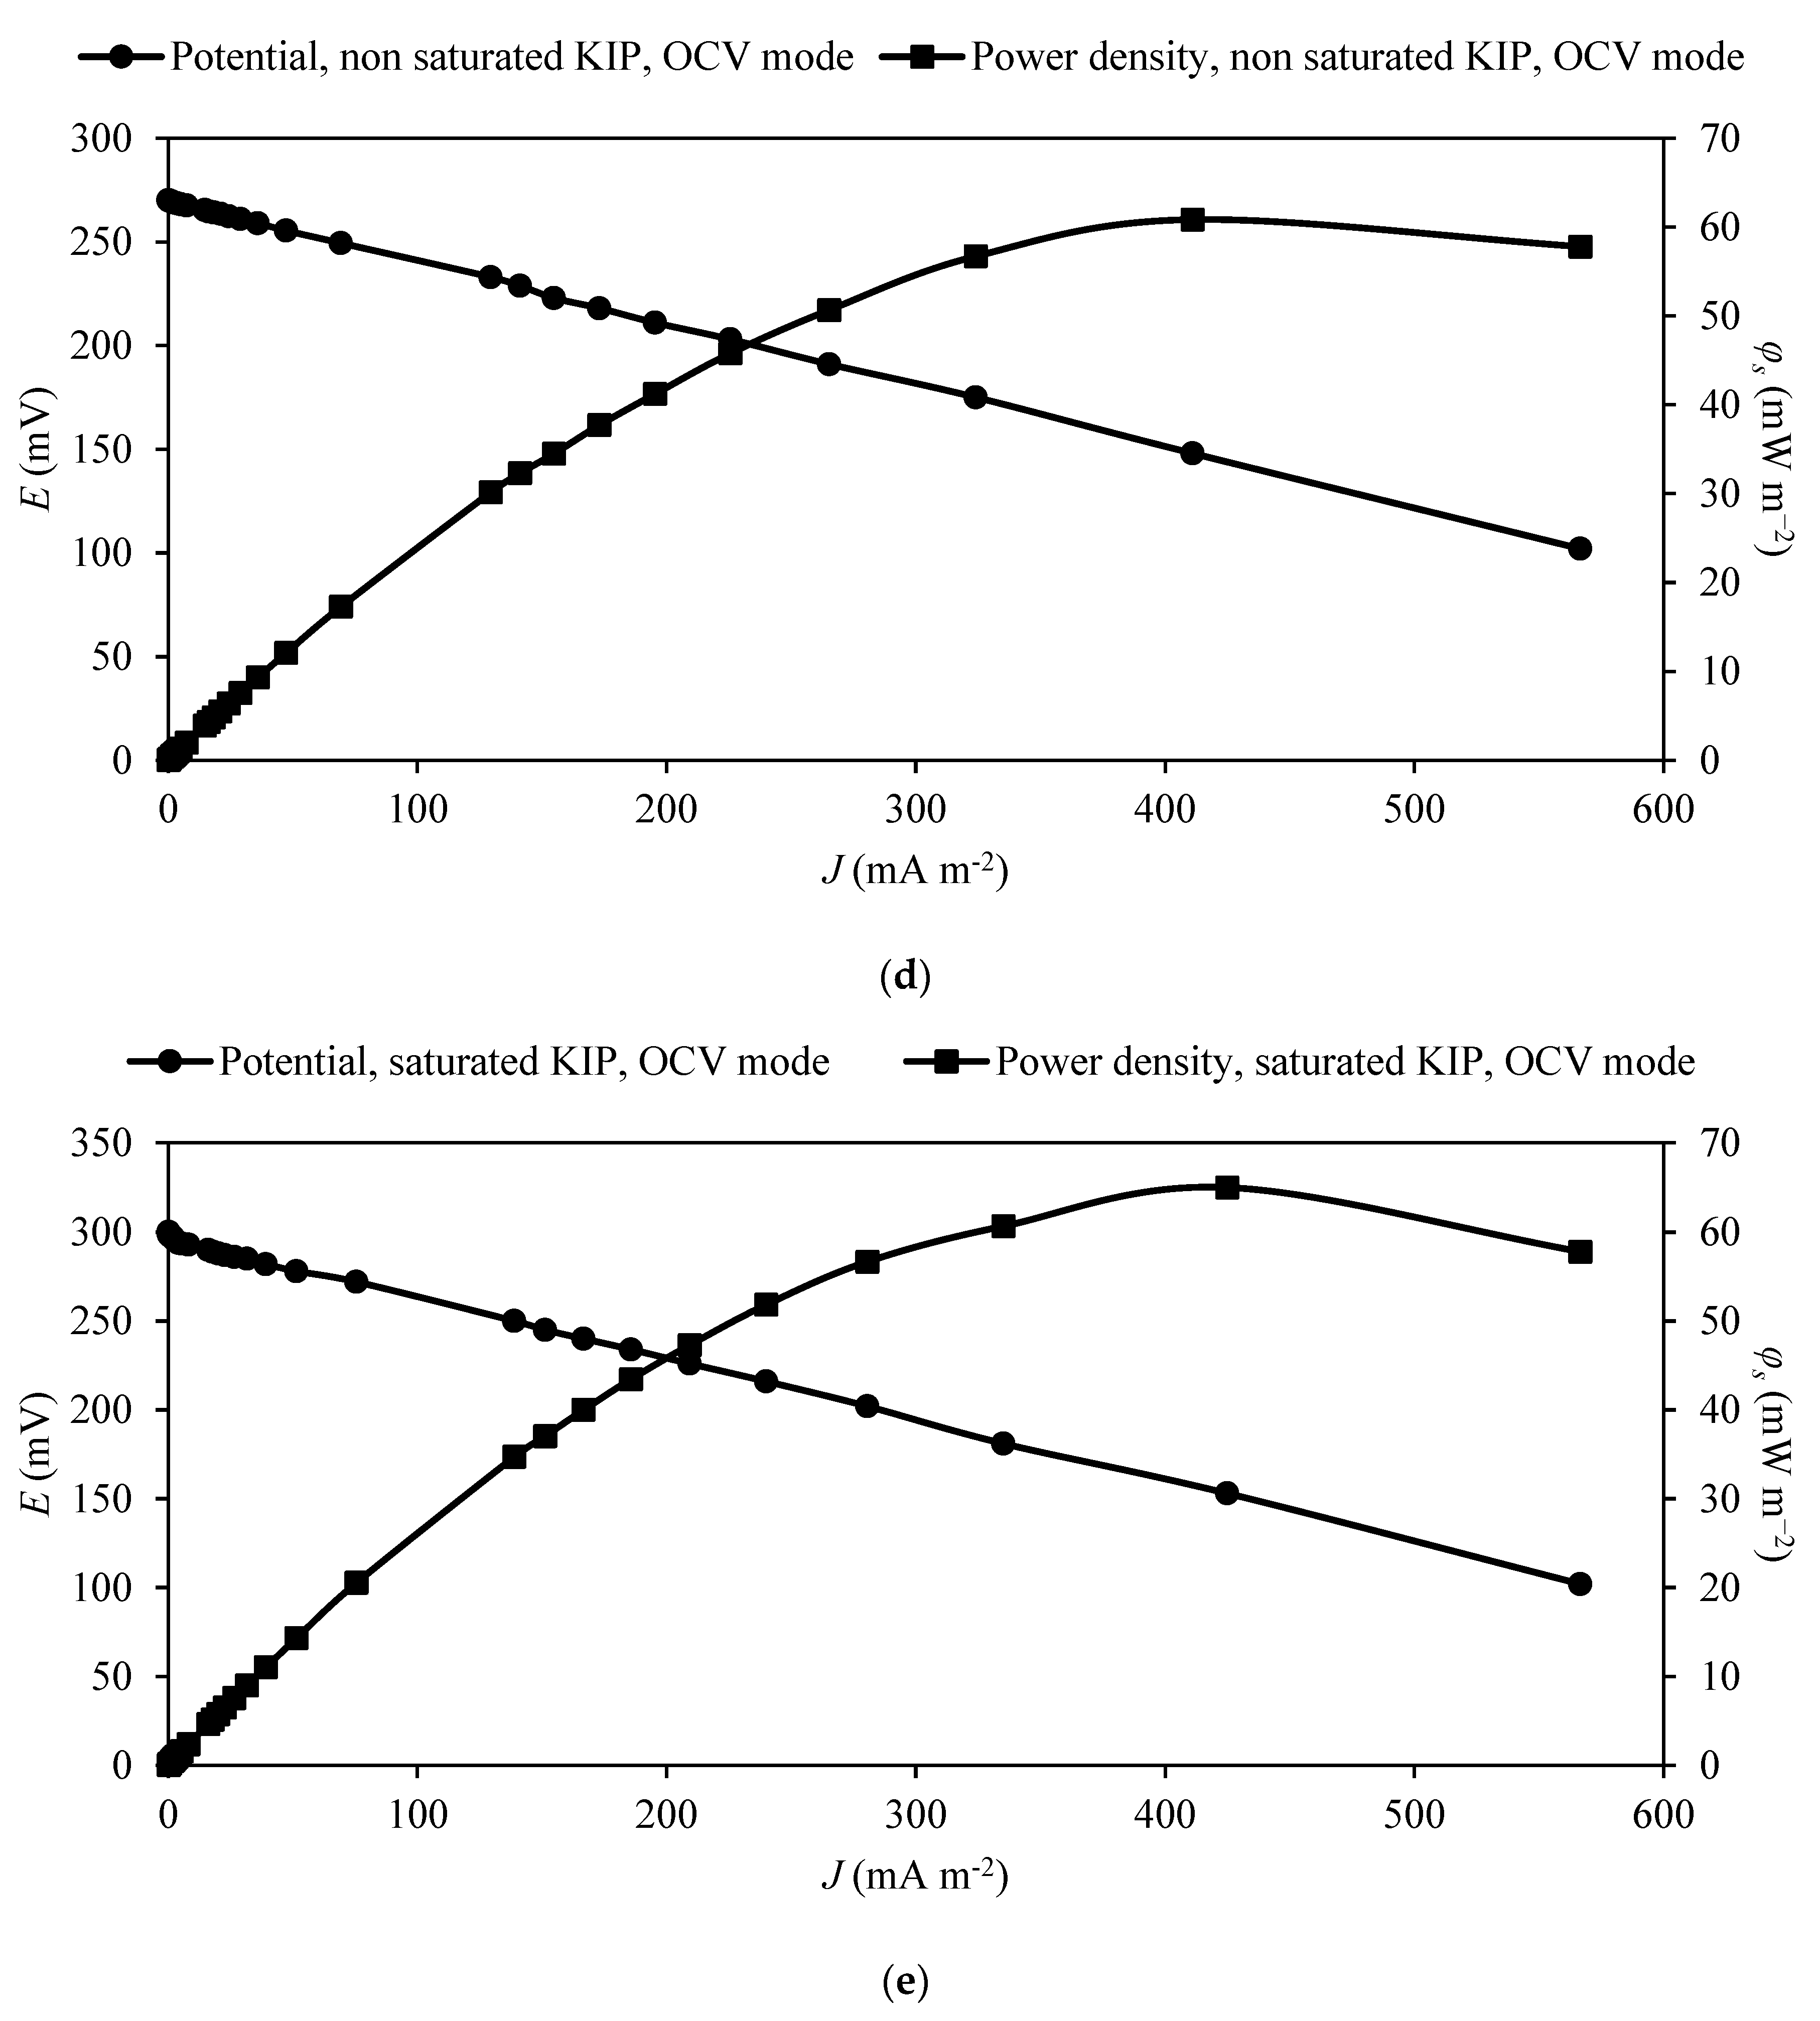
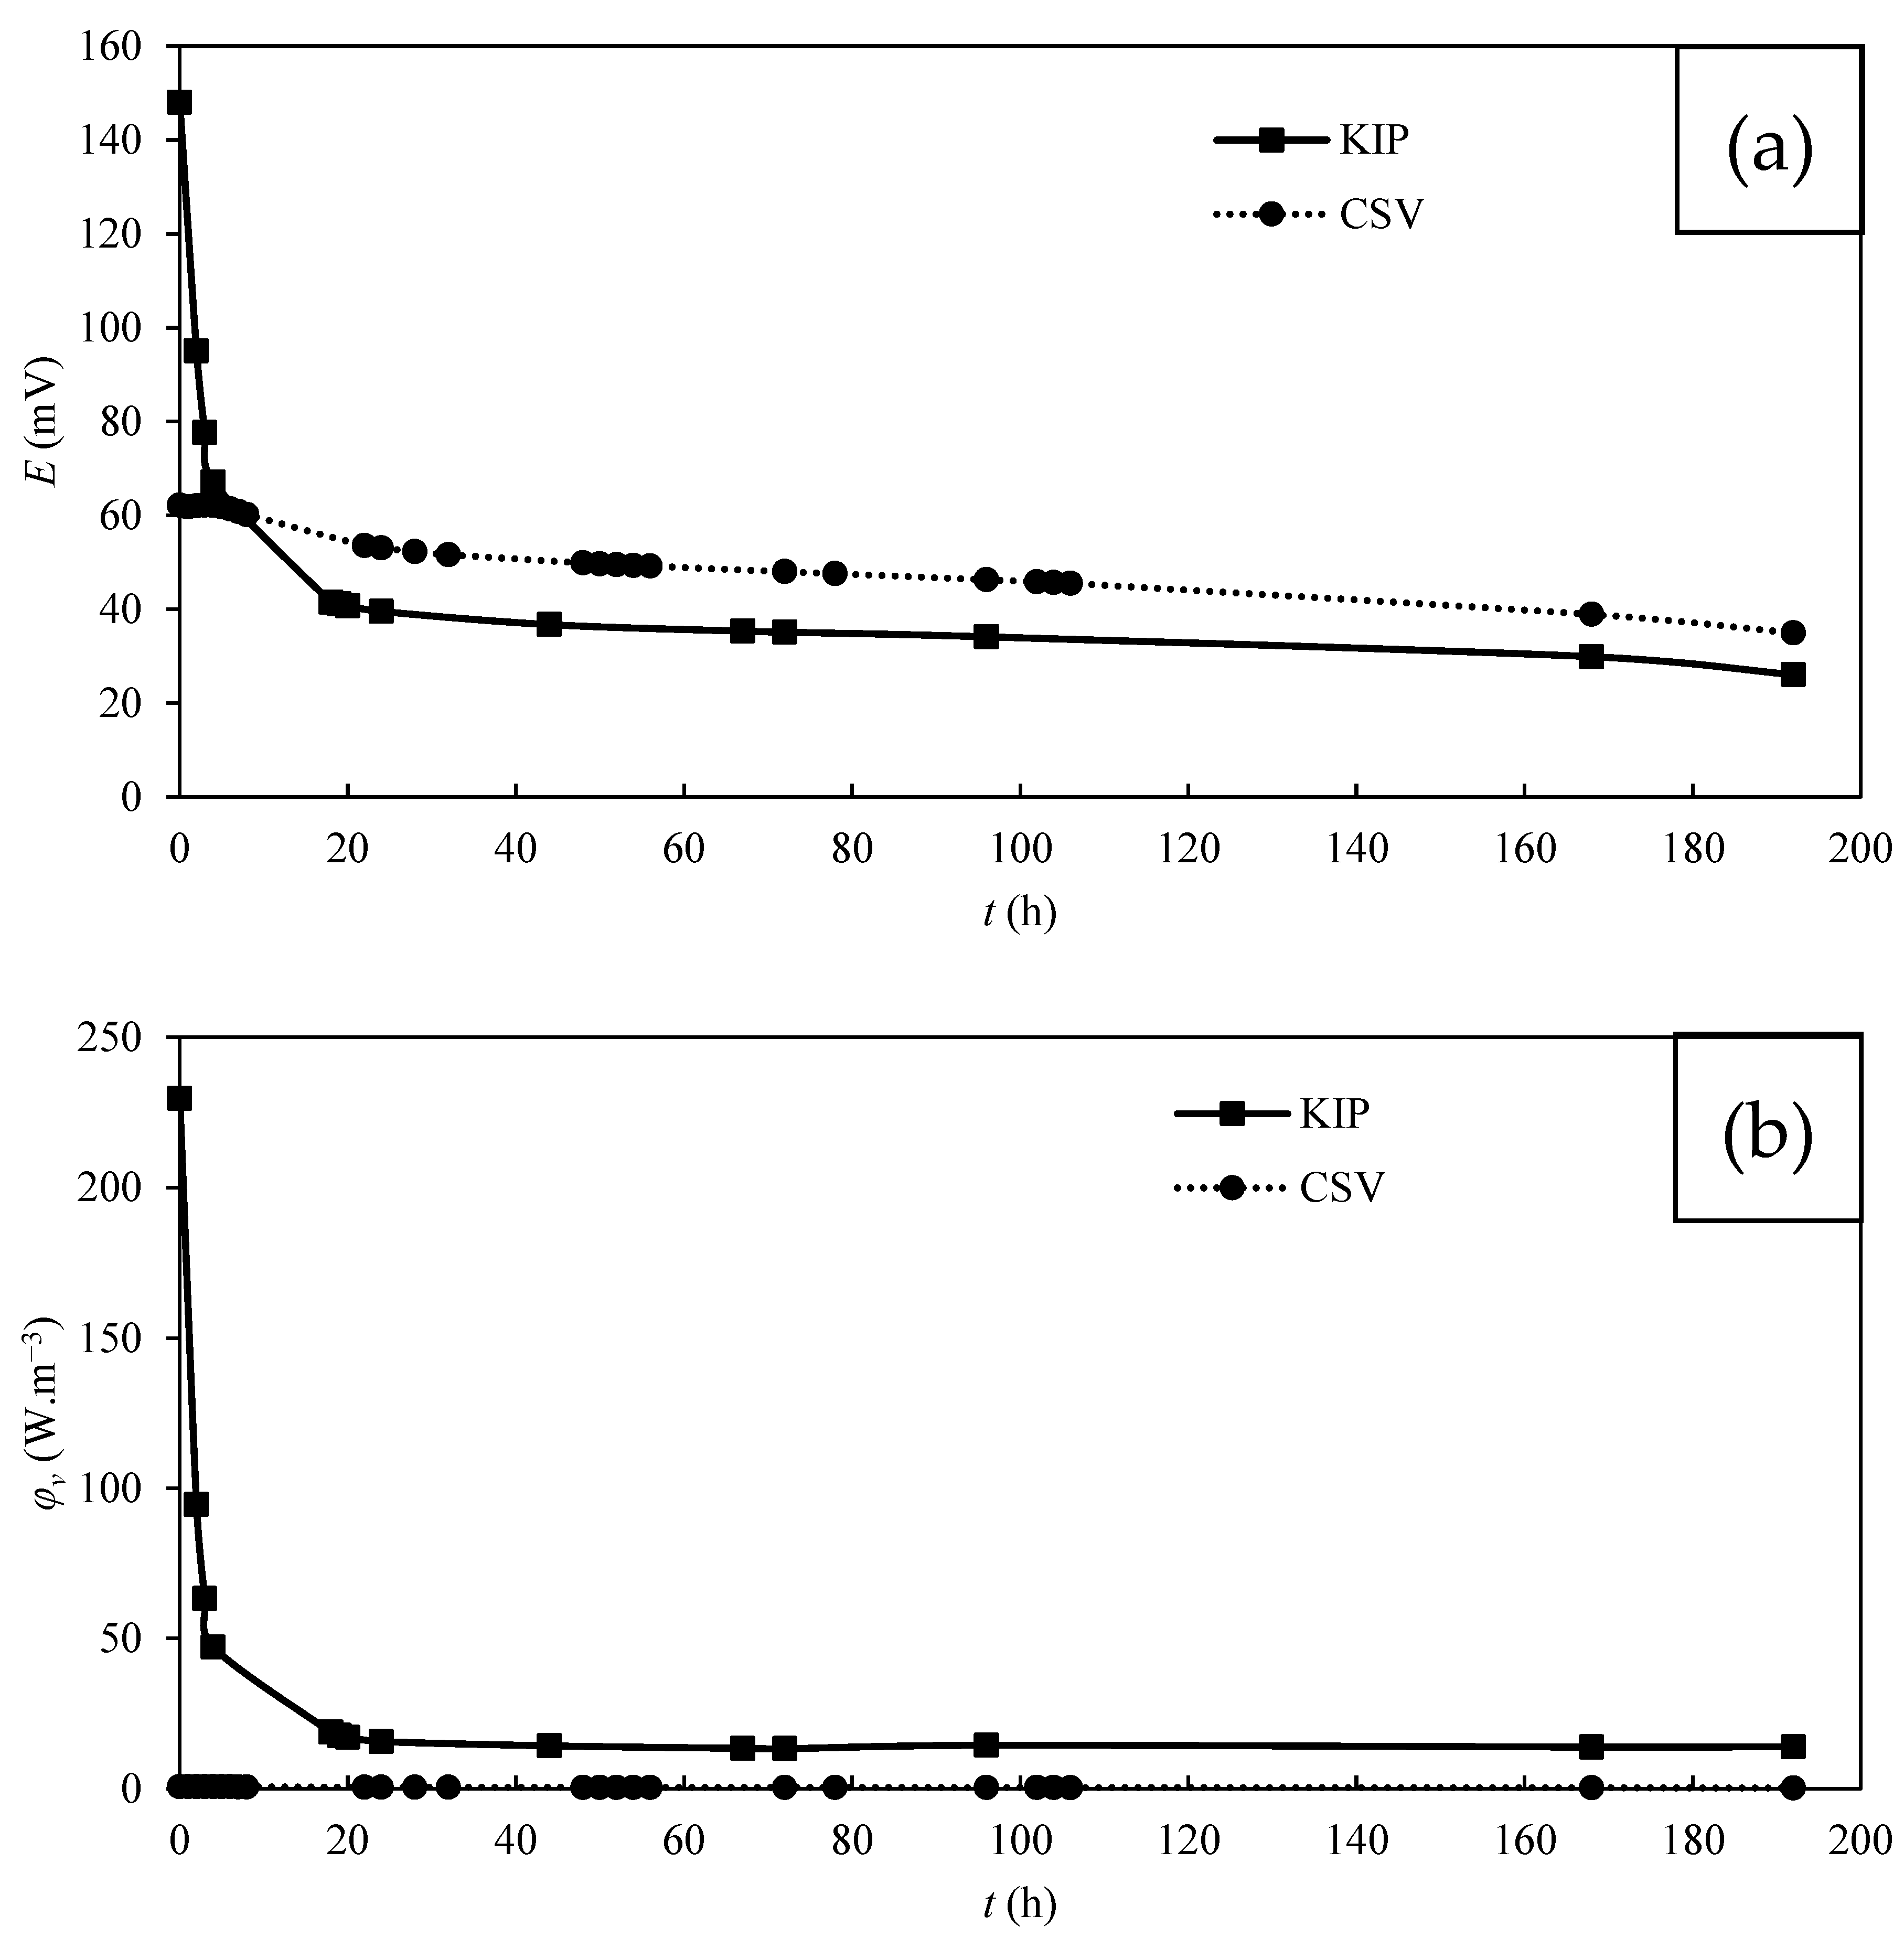
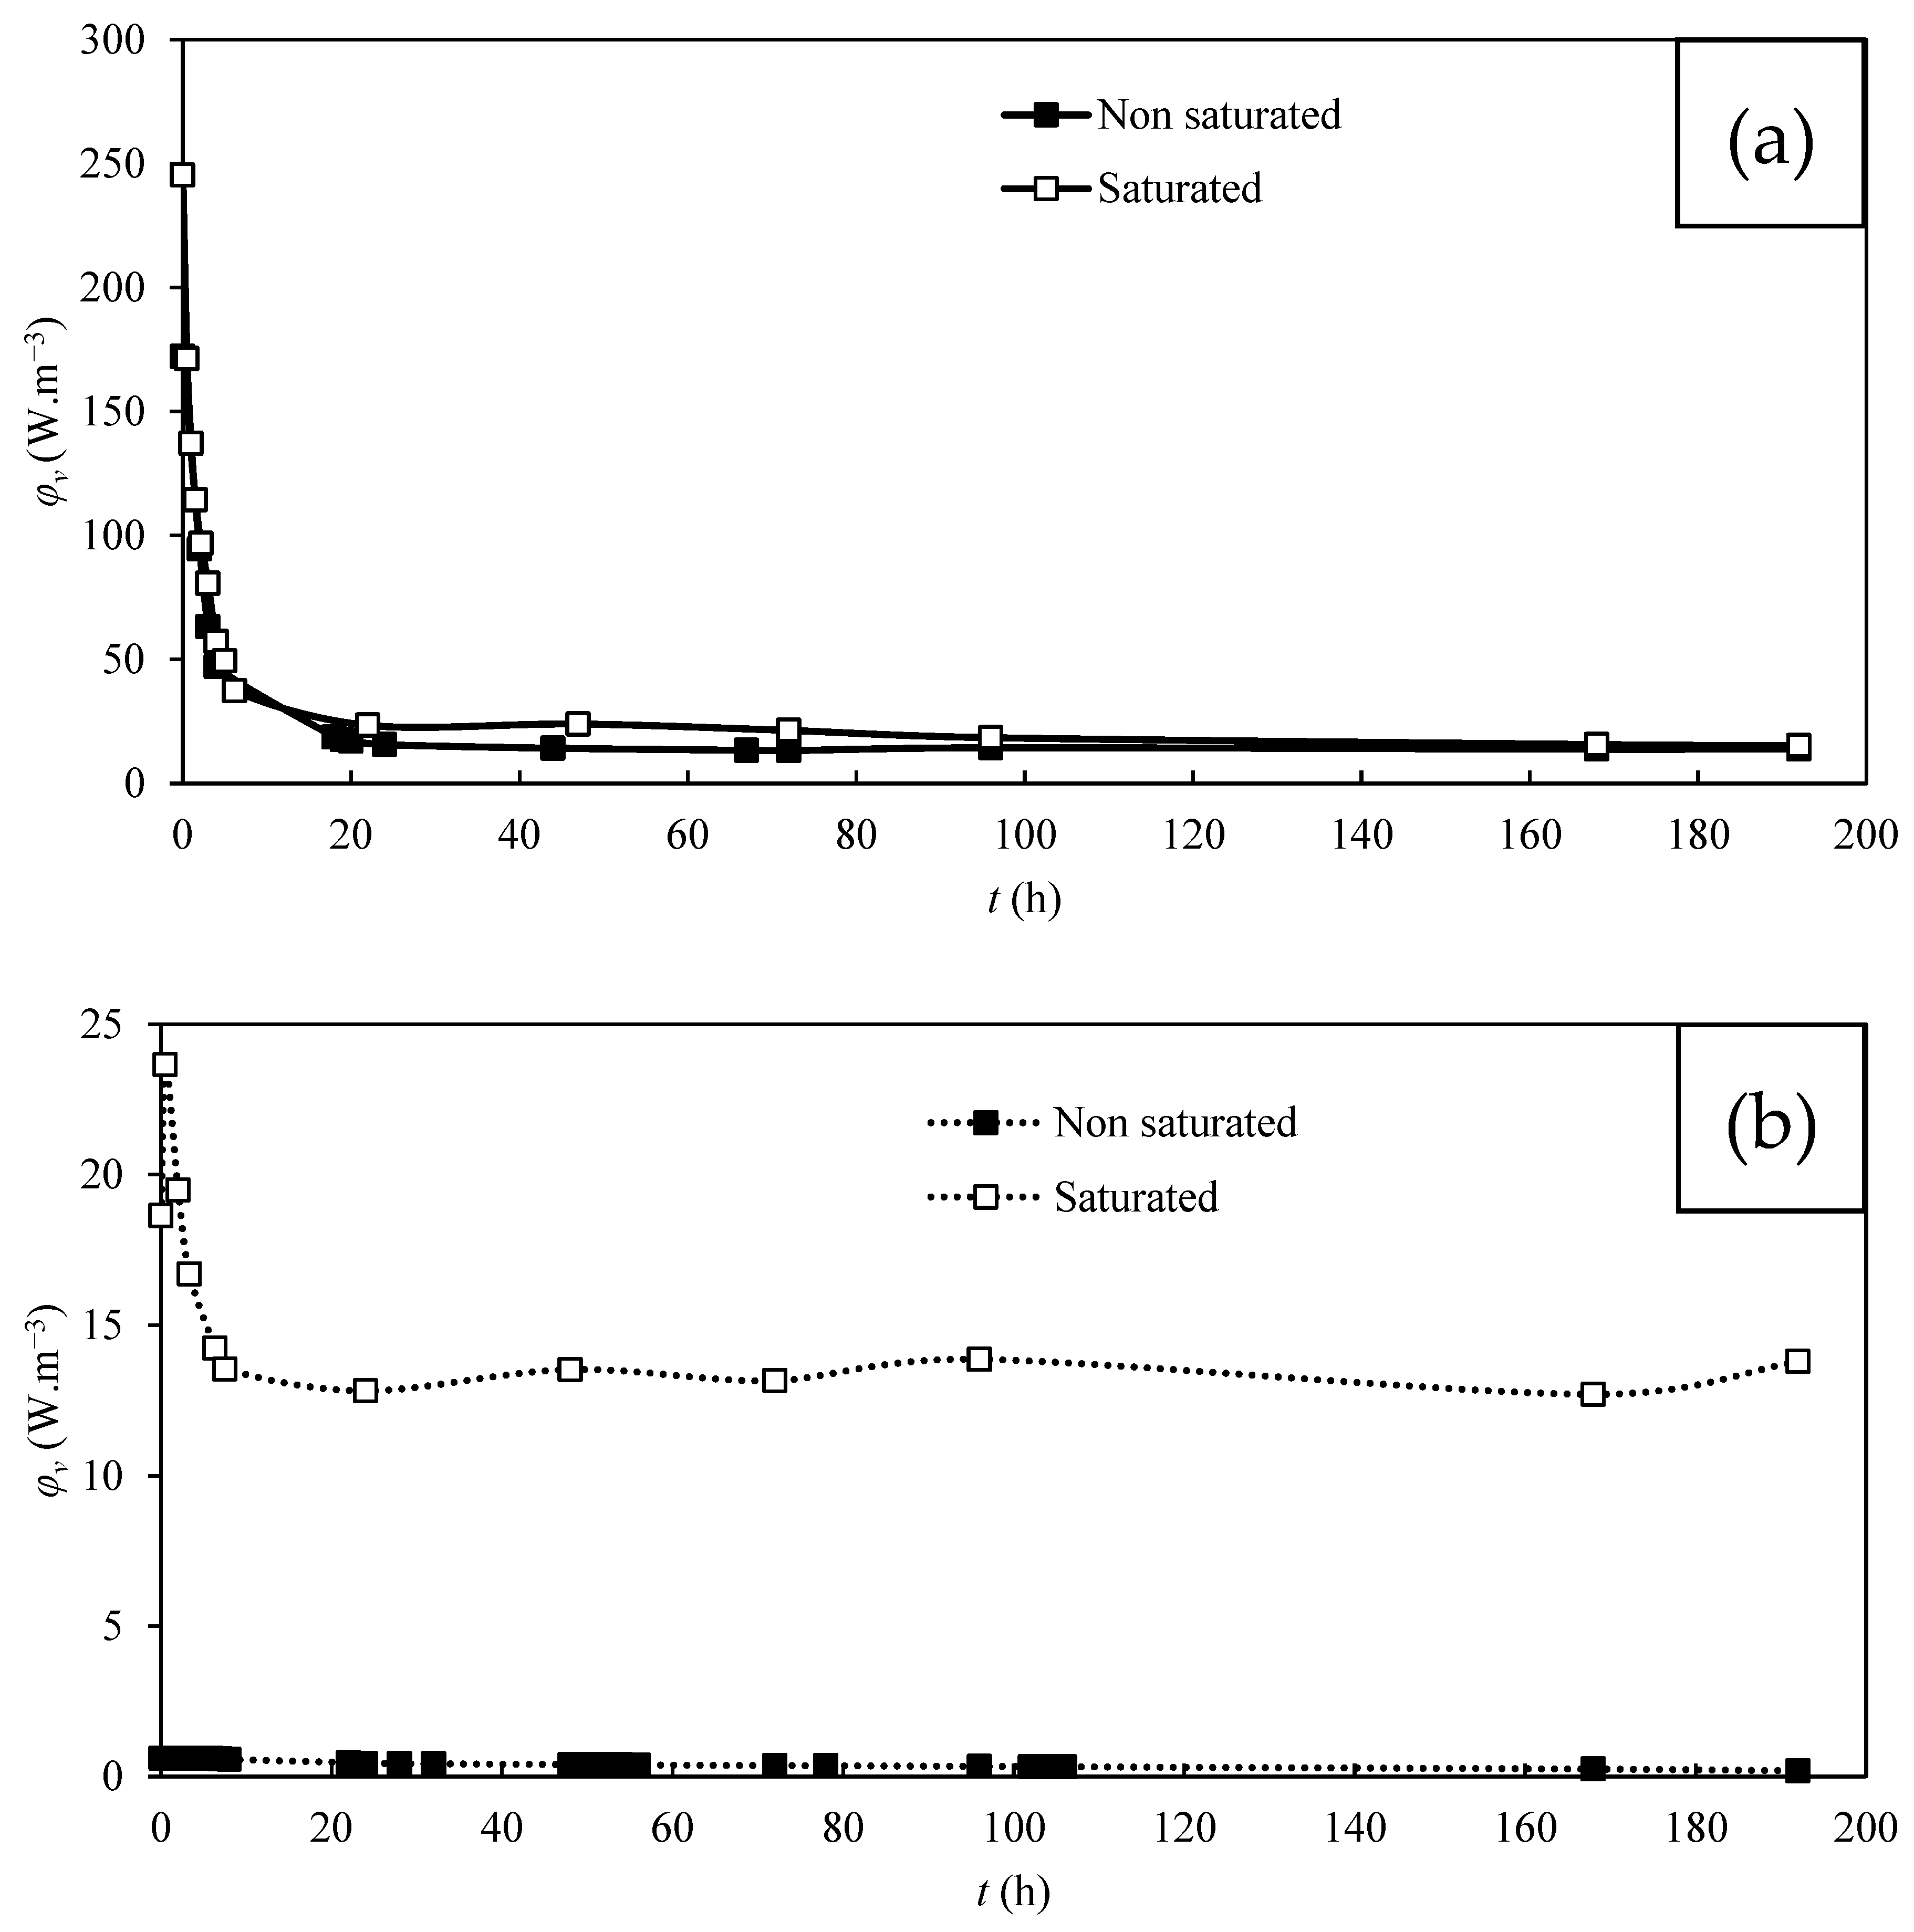
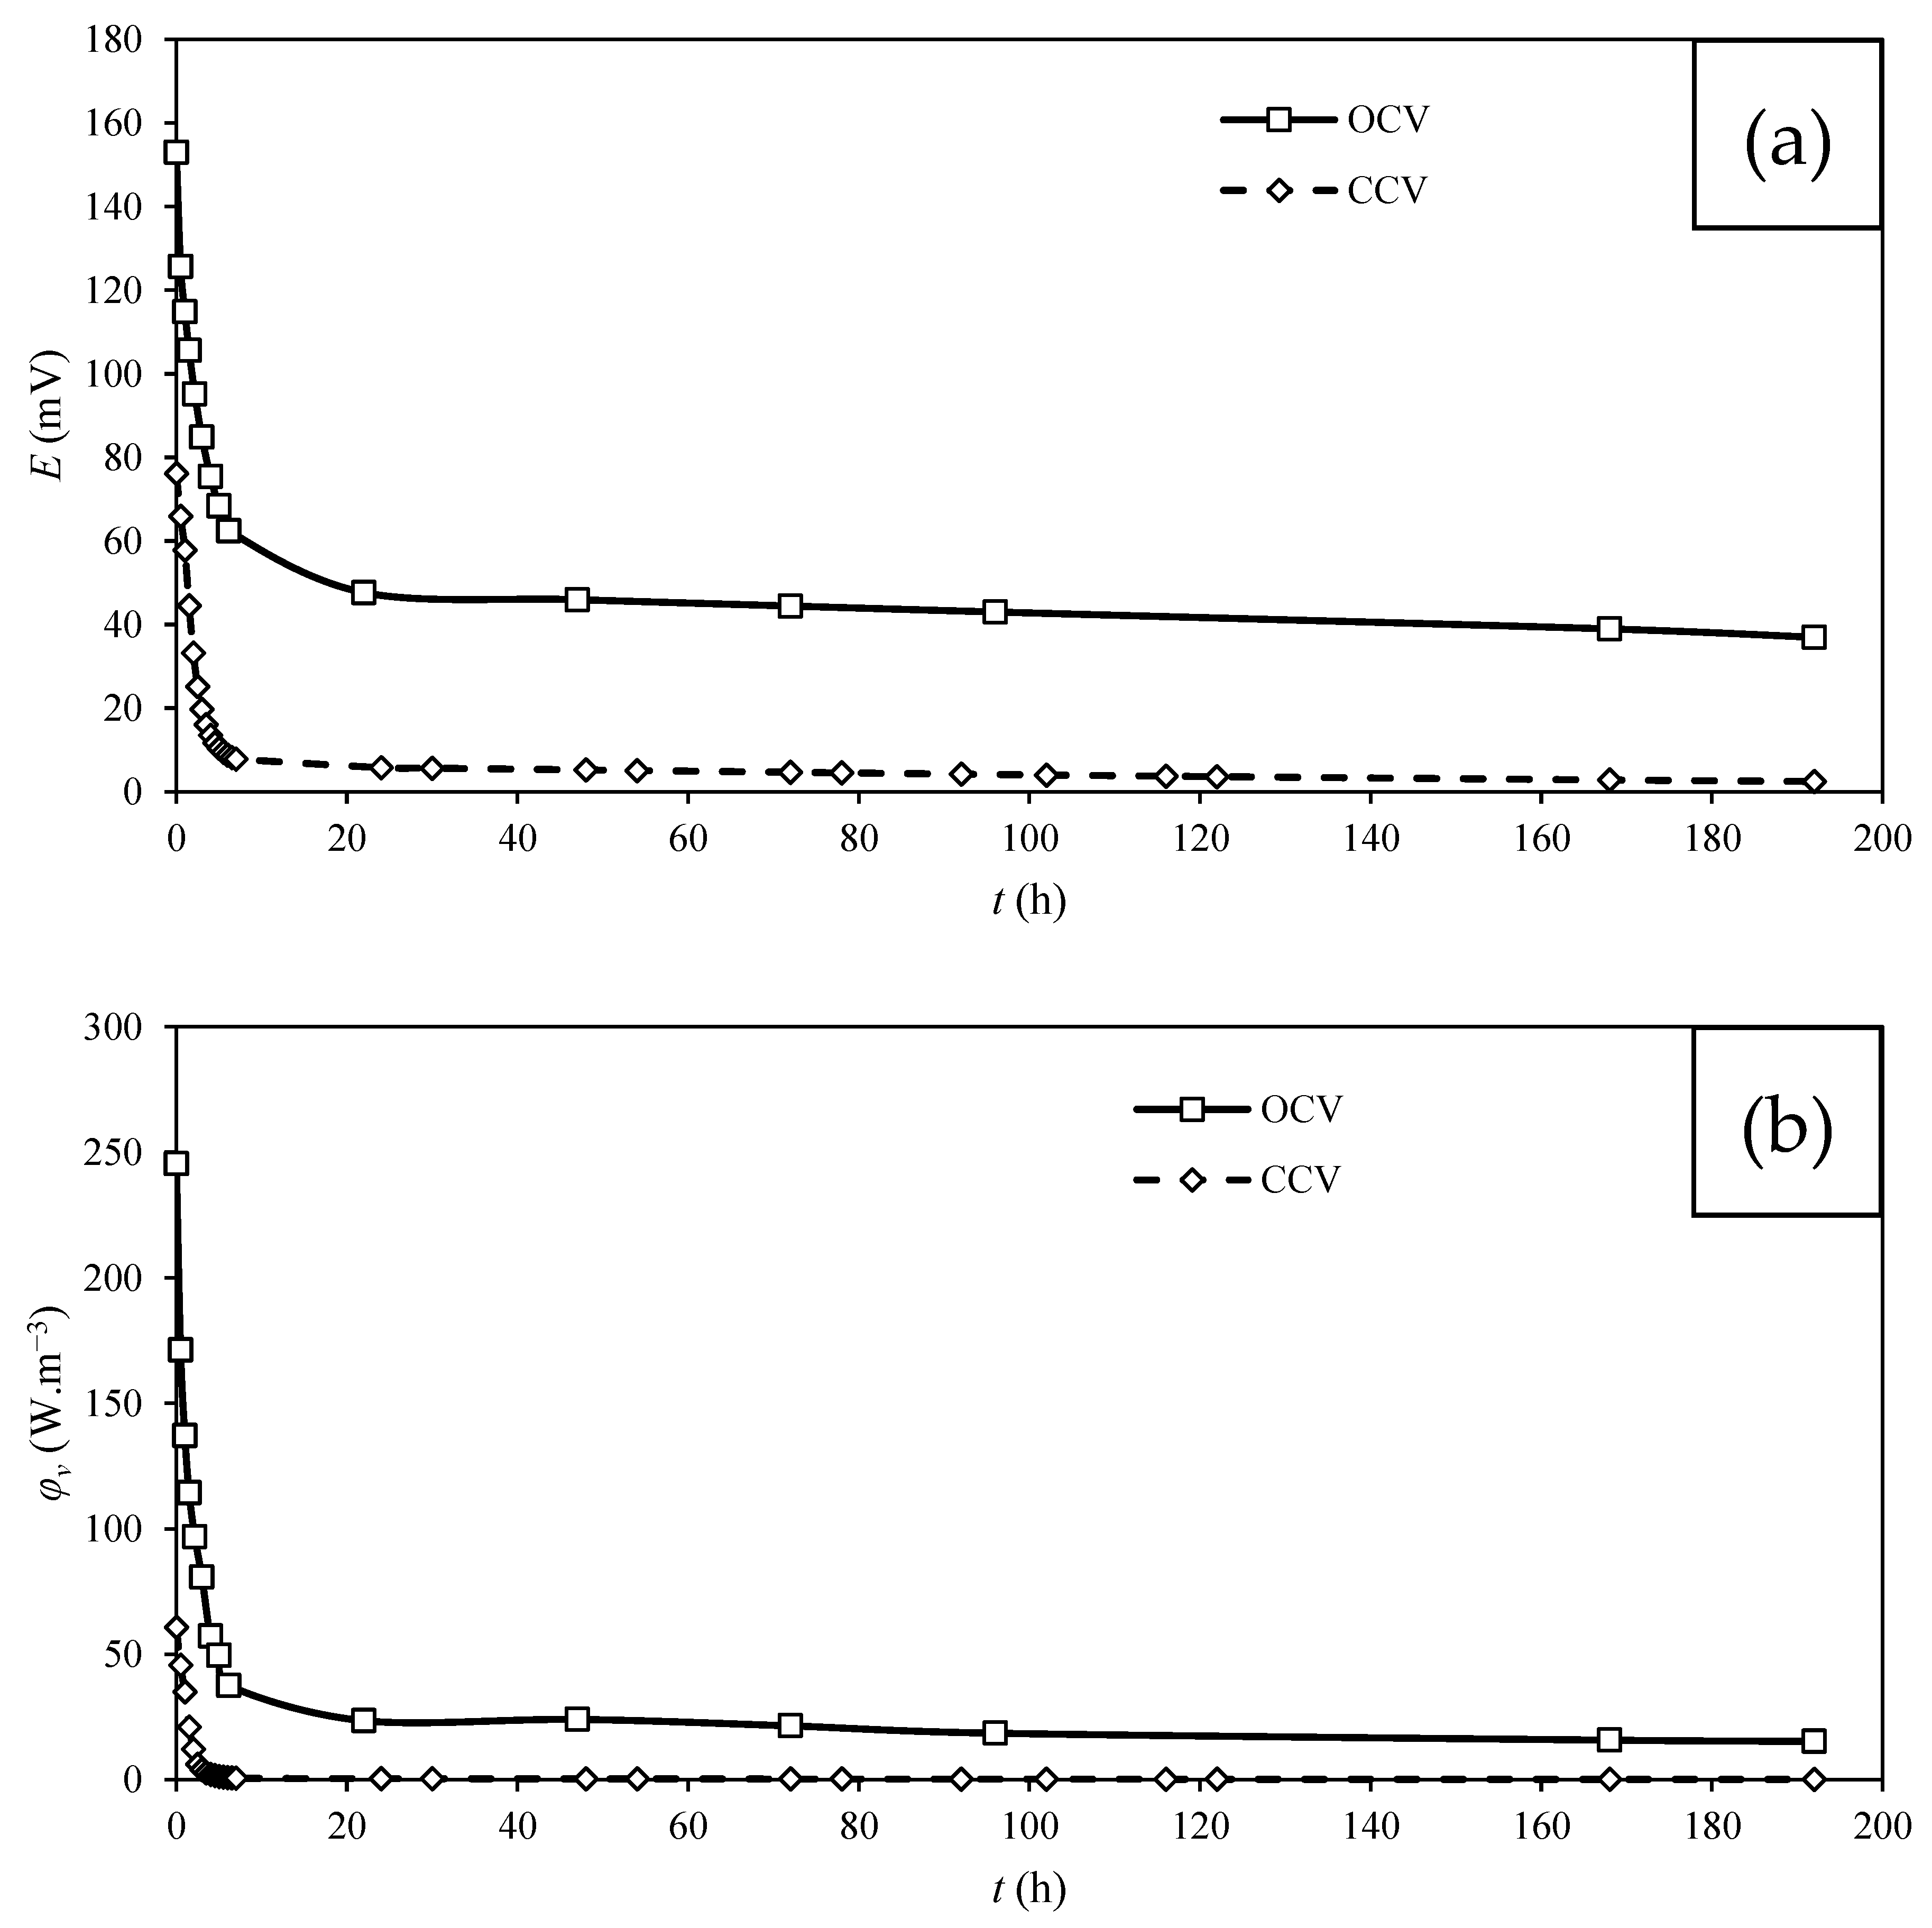
3.3. Power Production by MFC

The power production results in MFC are summarized in Table 1. The performance of the MFC was initially evaluated under open circuit voltage mode (OCV). The evolution of potential over time during MFC operation is shown for KIP and CSV bioanodes in Figure 4a.
The potential values were higher with KIP during the first hours of the experiment, but then were higher with CSV (Figure 4a). This result can be explained by the intrinsic properties of each carbon cloth, i.e., thickness 530 µm and 235 µm, volume 4.77 × 10⁻⁷ m−3 and 2.12 × 10⁻⁷ m−3, weight 162 mg and 62 mg, and volumetric mass density 0.34 g cm−3 and 0.29 g cm−3 for KIP and CSV, respectively. Therefore, the larger volume and density of KIP enhanced its ability to collect and concentrate CV, improving its oxidation with a higher concentration polarization effect than CSV. After 20 h of operation, potential decreased, due to the depletion of available substrate.
The power densities, presently expressed in W m−3 of carbon clothes volumes (φv), were measured at the optimal resistances (200 and 2000 ohms for KIP and CSV, respectively) vs. time. These resistance values highlight the different conductivity between KIP and CSV materials that will have consequences on the power production in the MFC (Table 1). Figure 4b shows the evolution of φv over time for the KIP and CSV anodes. The maximum φv values were 229.6 W m−3 for KIP and 0.6 W m−3 for CSV, as reported in Table 1. Both MFCs experienced a significant decrease in power density after 20 h of operation due to the consumption of VC by T. harzianum as illustrated in Figure 1a,b. The MFC with the KIP anode showed higher φv values than the CSV anode, which can be attributed to the difference in volumetric mass density between the KIP and CSV carbon cloths (0.34 g cm−3 and 0.29 g cm−3, respectively). The KIP optimal resistance was consistently lower than the CSV due to its higher density and more closely packed fibers, enabling more efficient electron flow and lower optimal resistance. As a result, for a given potential value, the power and power density values increased for the KIP anode. Another explanation comes from the hydrophobicity of KIP. As previously seen, T. harzianum is also hydrophobic [37], which enhanced interactions with KIP and the fungi biomass. Ultimately, CV is more quickly degraded and more power density is produced. Moreover, usual power densities parameters (φv’ and φs) highlight the electrical performances differences between KIP and CSV (φv’ = 1095.8 and 14.1 mW m−3; φs = 58.8 and 0.8 mW m−2 for KIP and CSV, respectively) (Table 1).
As previously explained, it is essential to saturate KIP and CSV carbon clothes before using it in the MFC in order to separate CV sorption and bioremoval phenomenons. As shown in Figure 5a,b and Table 1, the power density in MFC containing KIP or CSV with prior saturation with CV was 23.6 W m−3 (0.6 W m−3 without saturation) for CSV and 245.3 W m−3 (229.6 W m−3 without saturation) for KIP. The power densities for the saturated KIP and CSV anodes were higher than the values obtained without saturation. The initial saturation step significantly reduced VC sorption by the carbon cloth, making more available CV for the biodegradation by T. harzianum. This resulted in an increased overall yield of the MFC, regardless of the type of bioanode used.
Additionally, for saturated carbon clothes, the potential values and the power densities vs. time show the same behavior with significantly higher values for KIP (Table 1). As previously mentioned, this was attributed to the properties of KIP compared to CSV for power production.
The effect of T. harzianum on the anode as a biocatalyst on MFC performances was also investigated. The MFC with T. harzianum exhibited significantly higher potential values, reaching a maximum of 270.1 mV and an output power of 229.6 W m−3 (compared to a maximum potential output of 153 mV and an output power of 5.5 W m−3 without T. harzianum), as shown in Table 1.
Finally, the most effective MFC, equipped with a saturated KIP anode, was tested in the CCV vs. OCV mode. Figure 6a,b show the evolution of the potential E at optimum resistance and the power density φv, vs. t, respectively. The power density and emf values in the OCV mode at t = 0 are also reported in Table 1. The potential was higher in OCV than in the CCV mode. Similarly, φv was higher in OCV than in the CCV mode (245.5 W m−3 and 60.7 W m−3, respectively). Furthermore, the half-life time of degradation was longer in the CCV mode than in the OCV mode (14.7 h and 5 h, respectively, indicating that the degradation rate was lower in the CCV mode. In OCV, the removal rate reached 54% with a plateau in 80 h and 46% in the CCV mode for the same time (Figure 6c). However, after 260 h the removal of the CCV mode did not reach a plateau as observed for the OCV mode. This could be attributed to a stationary mass transfer regime in the CCV mode (electron production and protons migration through PEM), which could better manage the inhibition effect of VC by-products on T. harzianum than the transitory OCV mode. Moreover, in the CCV mode, the MFC stopped the power production after about 25 h due to the end of CV removal. In contrast, in the OCV mode, there was always some residual potential at the end of the experiment, even when the removal stopped (Figure 6a,b). In OCV, the high external resistance applied (1 MΩ) prevents the transfer of the electrons, causing a build-up of electrons at the anode and then in a larger potential difference and a small power density. In the CCV mode, a large part of the electrons generated by the oxidation reaction was transferred to the cathode and consumed with H+ for O2 reduction in water form.
To achieve the comments of Table 1, we observed emf values in the range of 101.6–300.1 mV, values usually reported in MFC as described in the following part. We must notice also that our carbon cloth cathode in a none-modified electrode.
Maximum E, φs and φv’ values were compared to those already obtained with cloth design MFC (batch) and published in the bibliography. Babanova et al. observed similar performance than with saturated KIP carbon cloth in debiting mode (φs = 15.5 mW m−2) using Candida melibiosica yeast on a carbon felt (φs = 20 mW m−2) [45]. Some authors reported higher performances. Gunawardena et al. performed an MFC with S. cerevisiae yeast with glucose as carbon source and MB, and obtained E = 383.6 mV for a maximum φv’ = 147 mW m−3 [46]. The very good performances obtained by this MFC were probably linked to a microporous vitreous carbon electrode employed. Using brewery waters as substrate, Çetinkaya et al. obtained φs = 80 mW m−2 in a continuous flow MFC with a tin coated copper mesh as anode [21].
Other results have been published, but it is not easy to compare the performances, because the functioning mode is not always reported. Kebaili et al. developed MFC for fruit waste leachate wastewater treatment consisting in graphite and felt carbon rods as leachate biofilm support. They obtained potentials of 140 mV and 260 mV and power densities of 24.2 mW m−2 and 19.1 mW m−2, respectively [18]. Mbokou et al. developed a MFC Scedosporium dehoogii filamentous ascomycota fungus as bioanode [47]. The performances were promising with a highly stable power density at 6.5 mW m−2 associated with a potential of 450 mV. Pontié et al. studied the bioremediation of acetaminophen by the same strain of T. harzianum as us in a similar dual-chamber MFC as us and obtained V = 550 mV and φs = 50 mW m−2 [28]. The use of the same MFC with S. dehoogii with lignin as substrate gave φs = 16 mW m−2.

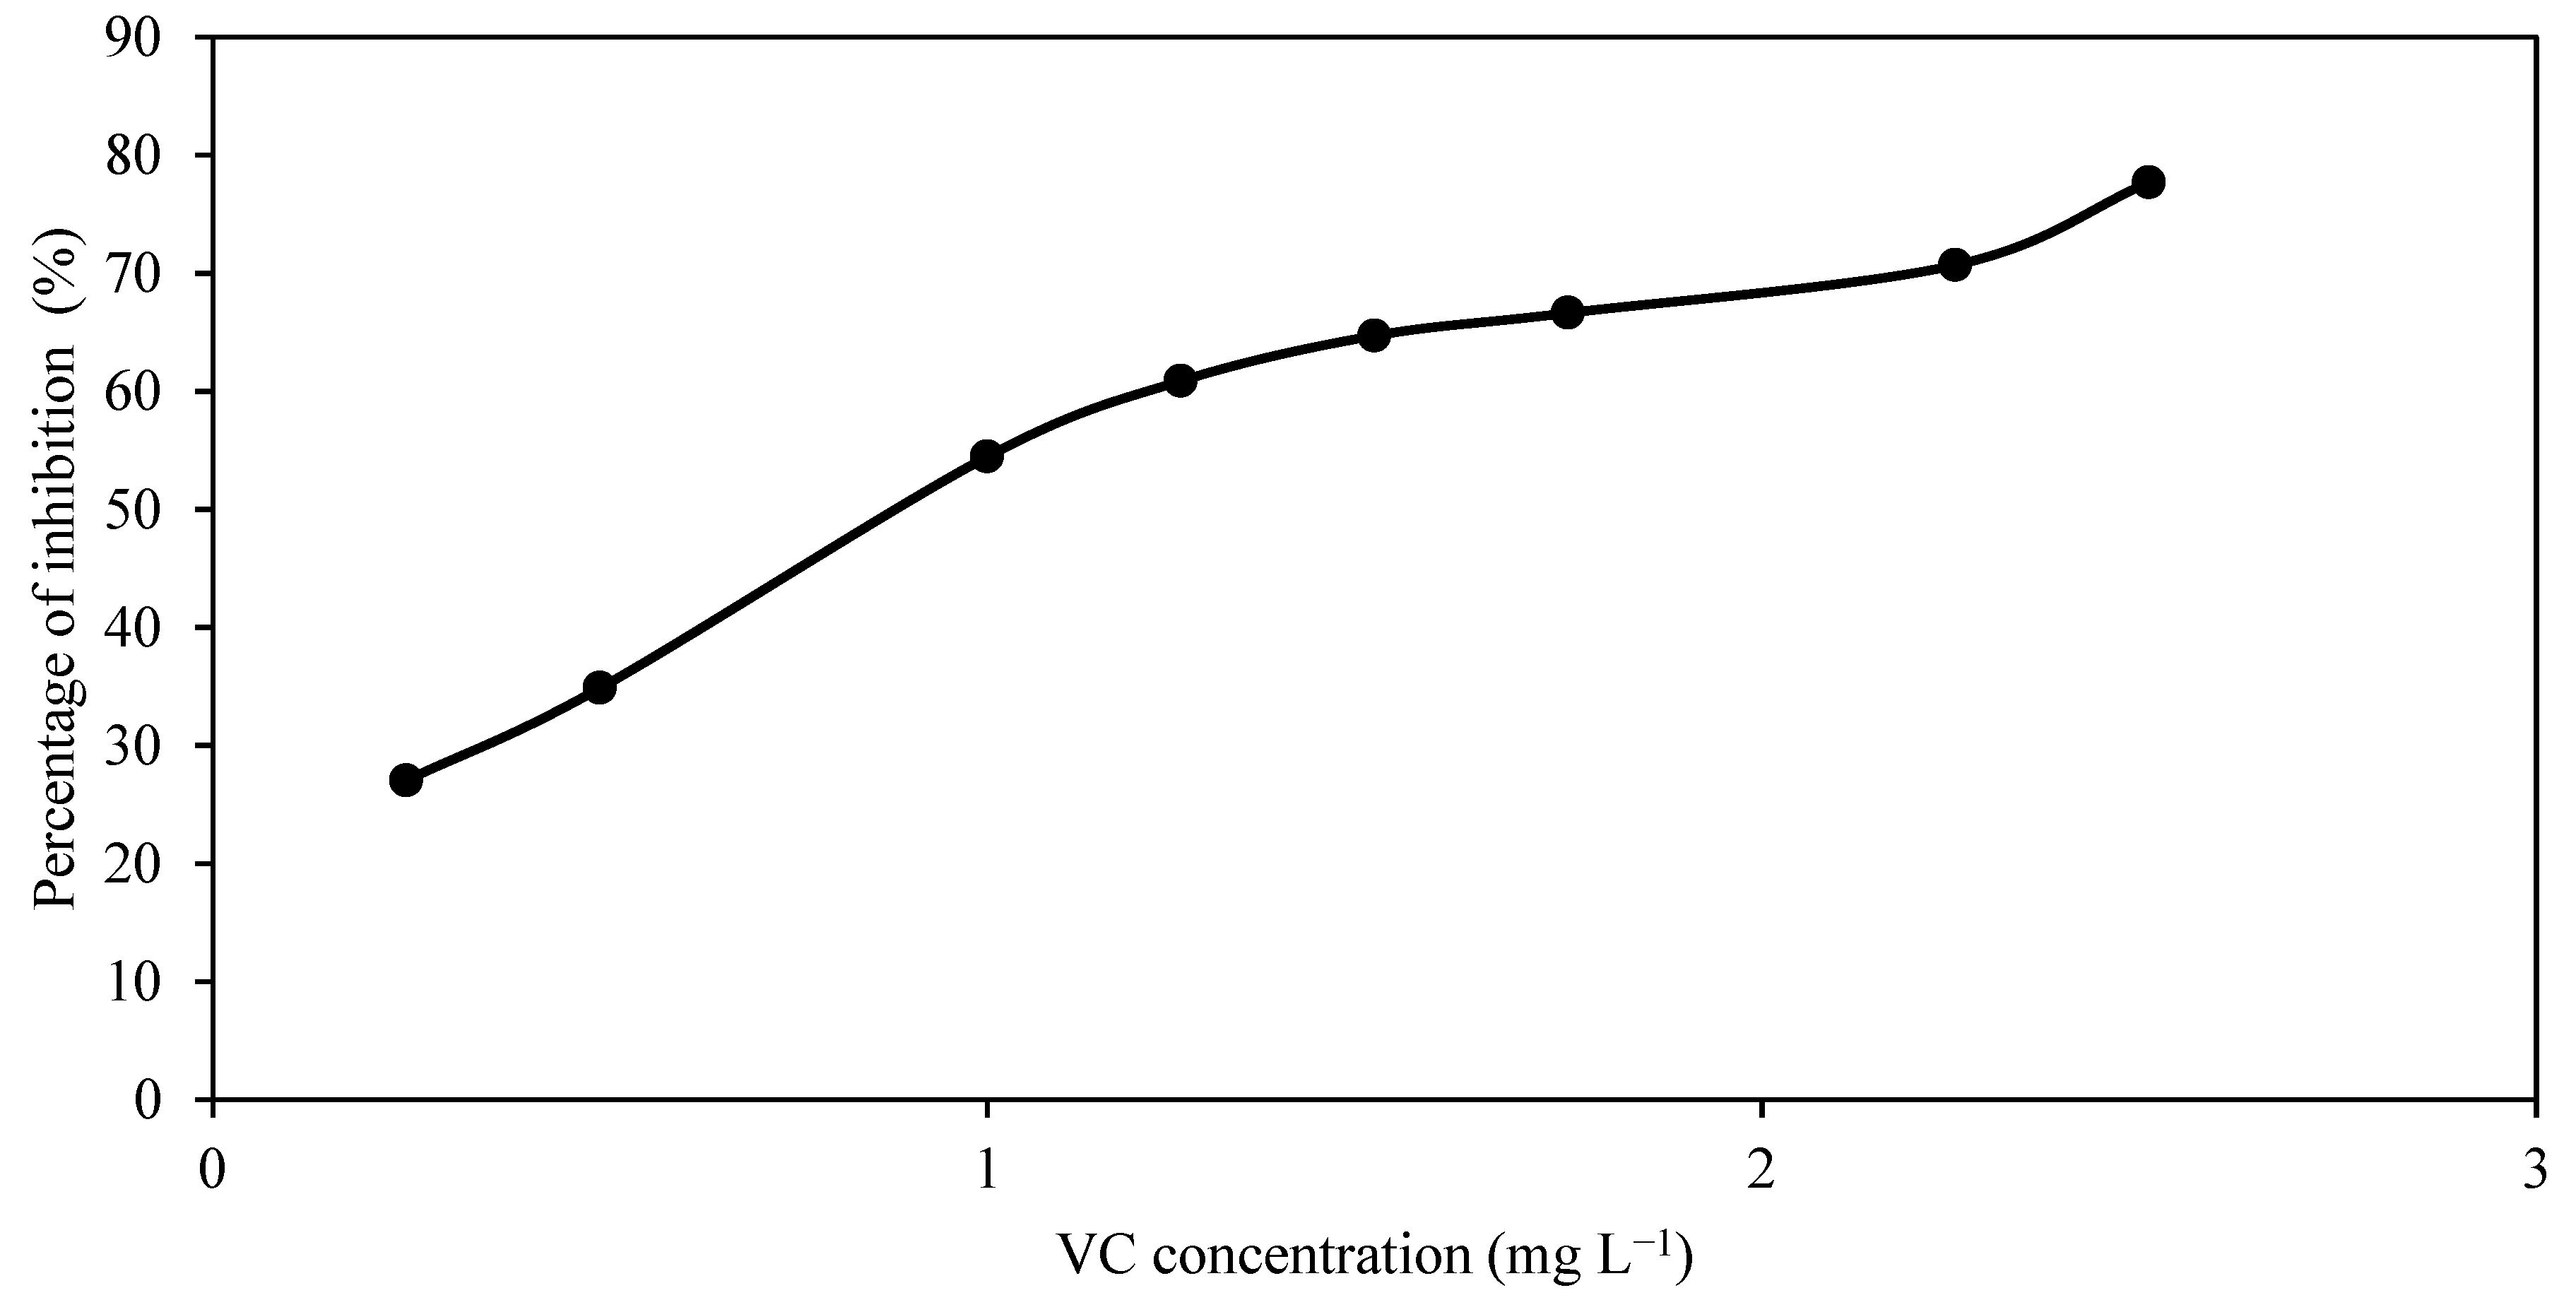
3.4. IC50 of CV for T. harzianum

In order to better understand the CV inhibition effect on T. harzianum, the inhibition on its growth was studied in PDA plates with CV concentrations (CVC) between 0 and 2.5 mg L−1 (Figure 7).
Slopes values were obtained from each growth curves determined during the exponential growth phase at different CCV, slopecontrol being the one measured in the absence of CV. The percentage of inhibition was then calculated using the following Equation (7):
I n h i b i t i o n % = s l o p e c o n t r o l s l o p e C C V s l o p e c o n t r o l × 100
The percentage of inhibition was plotted as a function of CV concentration (Figure 8).
From the curve percentage inhibition vs. CCV (Figure 8), IC50 for CV towards T. harzianum was determined using the following Equation (8) [48]:
I n h i b i t i o n   p e r c e n t a g e % = I m a x × 1 I m i n   x   C C V H i l l I C 50   + C C V H i l l
Imin and Imax are the extrema of the curve; CCV are the CV concentrations; IC50 is the inhibitor concentration corresponding to the I mean value between Imin and Imax; Hill is a constant reflecting the sigmoidicity of the curve (Hill constant = 1.8 ± 0.7).
From Equation (4), IC50 = 0.97 ± 0.28 mg L−1 or 2.34 ± 0.66 mmol L−1. There is little information about IC50 values for T. harzianum to make comparisons with other molecules, but it seems very resistant towards aromatic molecules. Furthermore, in our MFC experiments, T. harzianum was still able to degrade CV even at large concentration (100 mg L−1), because it is in a biofilm form.

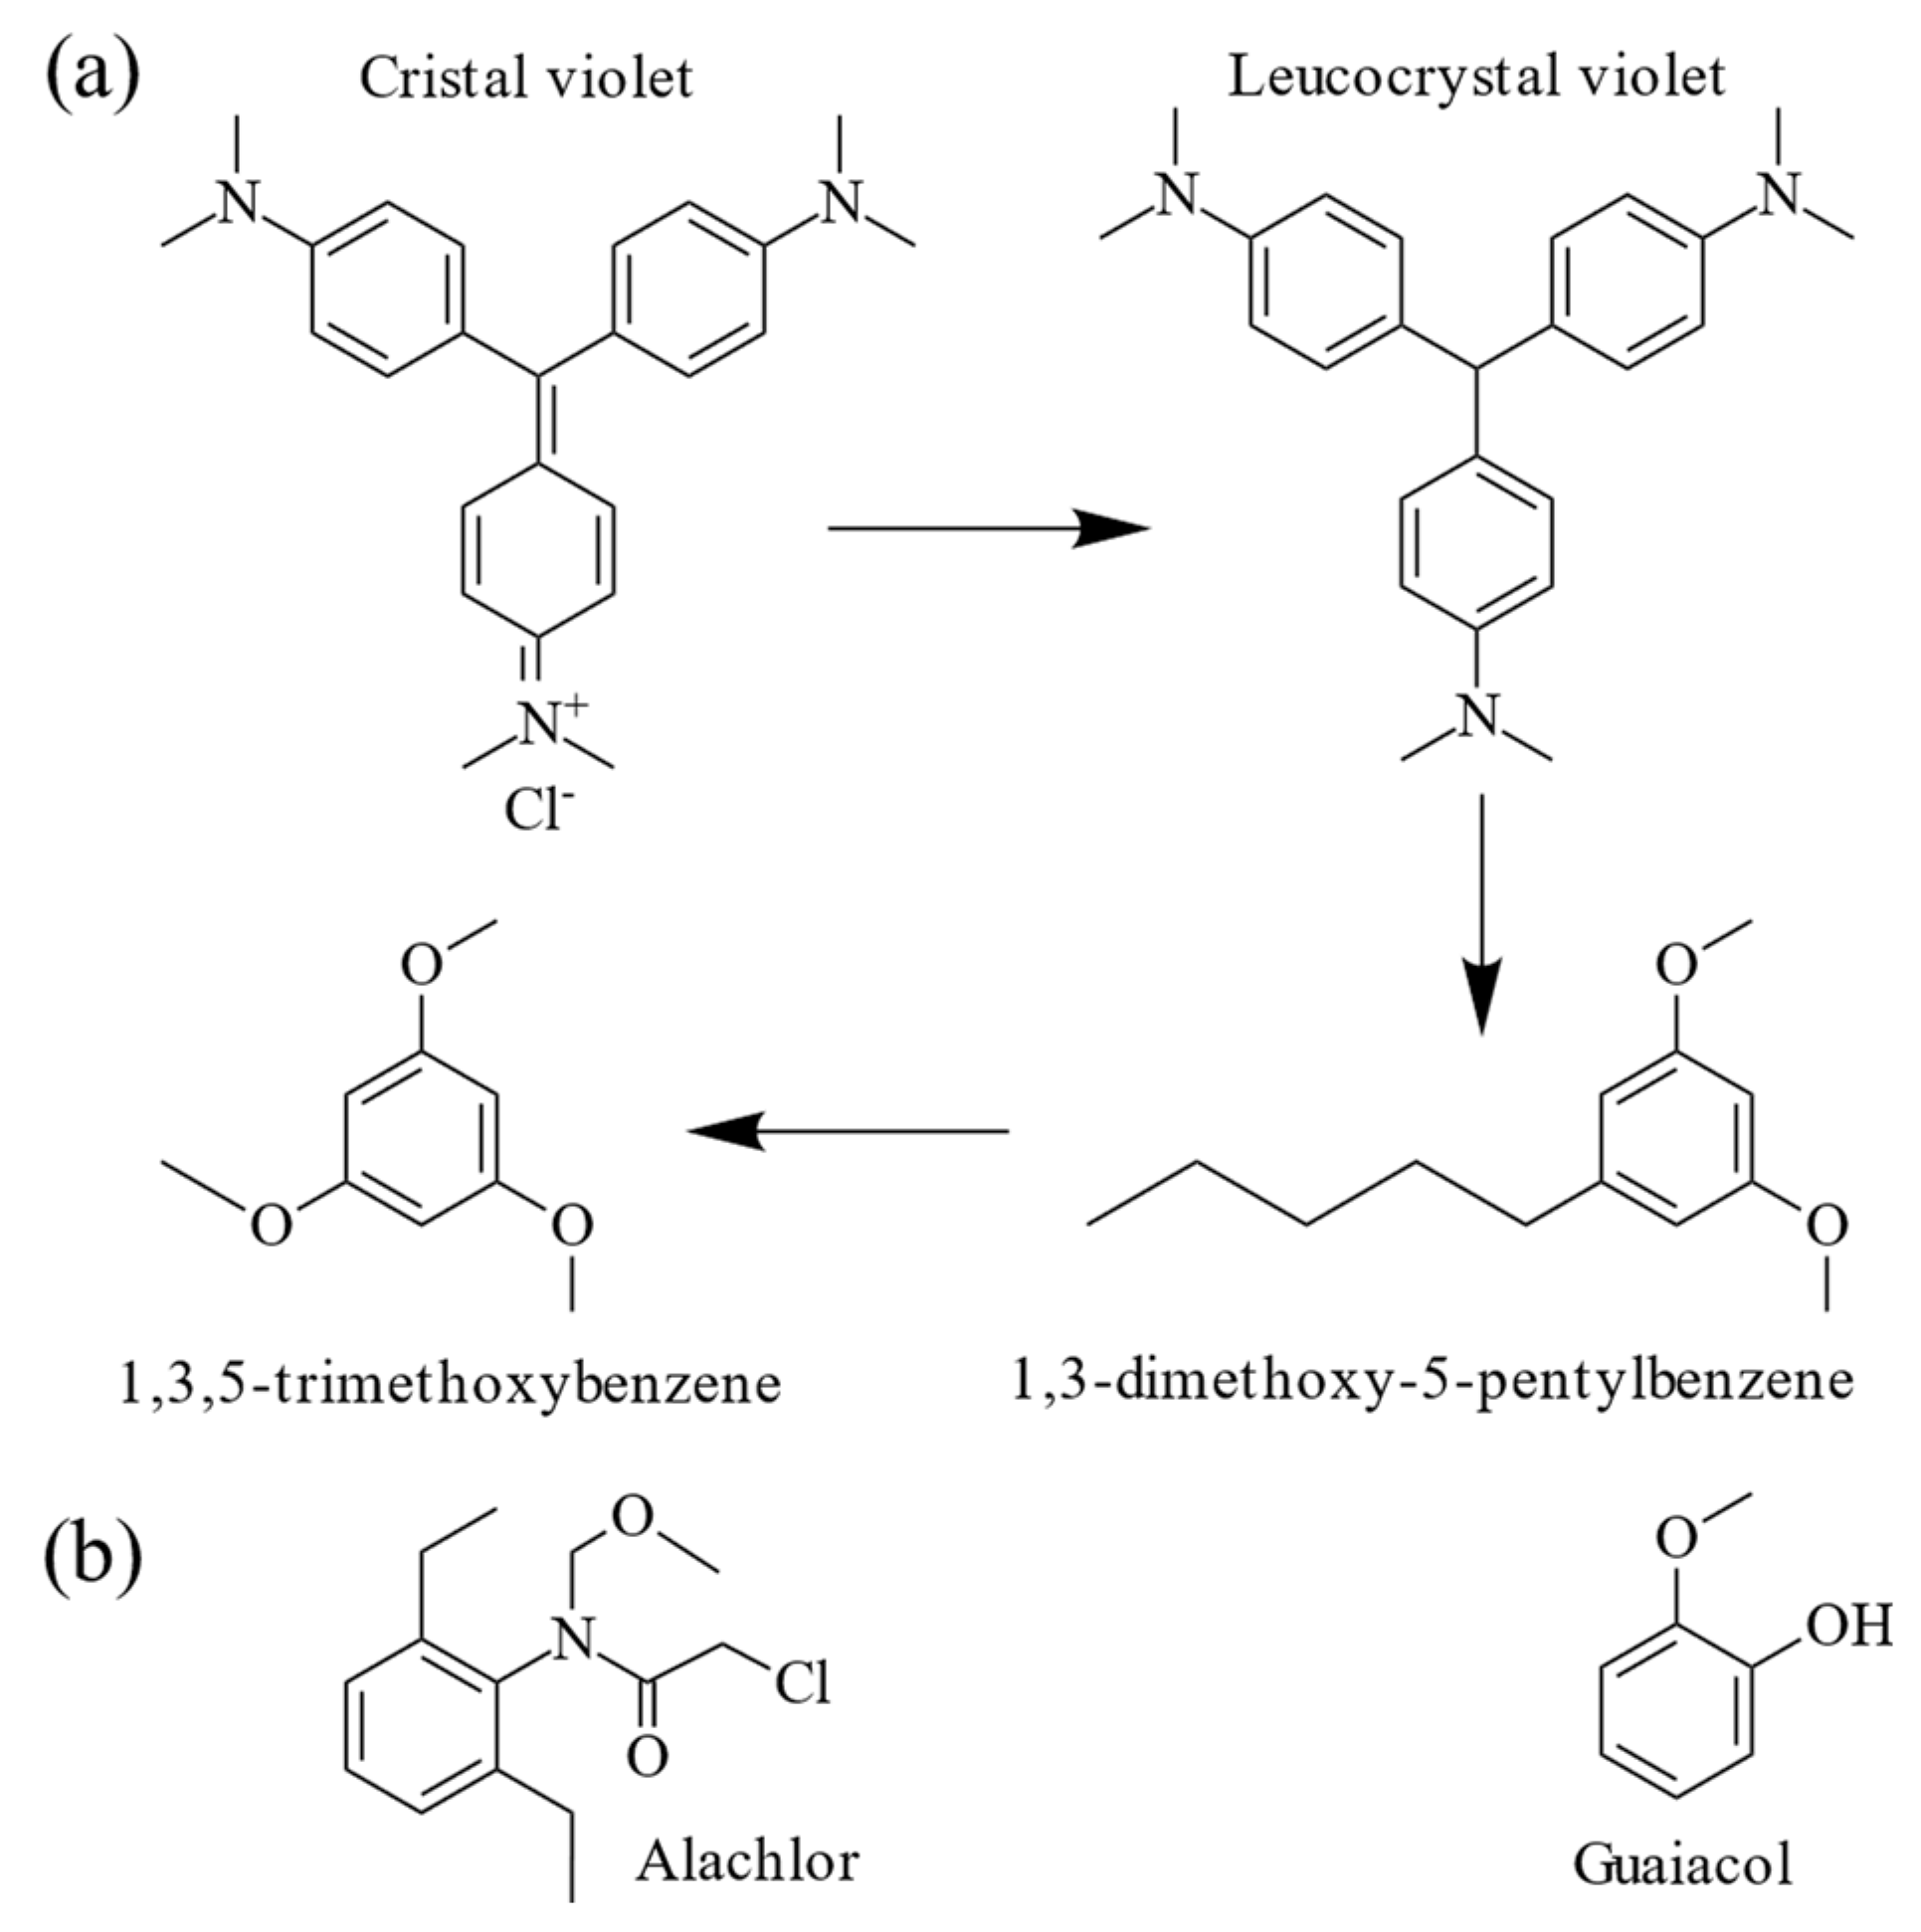
3.5. Hypothesis for the Mechanism of CV Degradation by T. harzianum

As few ascomycota fungi species, T. harzianum contains numerous genes encoding for various classes of enzymes from diverse families (Table 2). This panoply of specific catalytic activities allow fungi to survive in environments where they are confronted with biotic stress and abiotic agents.
Laccase from Trichoderma asperellum is known to catalyze oxidative degradation of CV [14]. Moreover, synthesis of laccase in Trichoderma is stimulated by alachlor (an aromatic compound from the chloroacetanilide family, a pesticide) or by guaiacol (a phenolic compound with a methoxy group) [50]. The structures of these two compounds exhibit some similarities with those of the degradation by-products of CV by T. asperellum (Figure 9).
One can make the following hypothesis. The inhibition of the growth of T. harzianum could be due to CV itself. In parallel, the transcription of the gene encoding laccase could be increased by CV degradation by-products. Therefore, the more by-products of CV degradation formed by laccase there would be, the more this enzyme would be synthesized, the more the CV would be degraded in the long term, since, at the same time, the concentration of the CV is decreasing, the inhibition would also decrease. However, this was not observed in our MFC experiments.
Indeed, little is known about the actual mechanisms of dyes biodegradation (in particular CV) by Trichoderma (T. harzianum) and there are probably several. For example, Trichoderma tomentosum degrades azo-dye Acid Red 3R mainly with manganese peroxidase and lignin peroxidase enzymes working: no aromatic amine products, neither laccase activity is detected suggesting a possible oxidative degradation pathway [51].

4. Conclusions

Microbial fuel cells (MFC) are a cost-effective and sustainable option of treating wastewaters. In addition, fungal MFC utilize biological techniques to effectively remove recalcitrant compounds that remain after traditional physico-chemical treatments. Dyes, particularly polyaromatic compounds, are commonly found in wastewaters and can be challenging to remove using conventional methods. In this study, we used the dye model VC, which contains three aromatic rings and dimethylamine/dimethylammonium groups.
Fungi possess a diverse range of enzymes giving them an ability to degrade aromatic compounds. Specifically, laccase has been shown to be capable of oxidizing a wide range of chemical compounds, including aromatic compounds. In this work, the fungus T. harzianum, which produces laccase, was used.
In this study, two different carbon cloths were used as electrodes in the MFC (KIP and CSV) with T. harzianum as biocatalyst on the anode. As results, the removal of CV ceased at 55% with CSV, and at 52% with KIP after 40 h run with respective power densities of 0.6 W m−3 and 229.6 W m−3. The KIP anode showed more effective power production compared to the CSV anode due to its thicker, denser structure and hydrophobicity. This structure allowed a higher concentration of charges leading to higher potential, lower resistance, and ultimately higher power density.
An experiment without T. harzianum highlighted a sorption phenomenon of VC occurred by the carbon cloth. Consequently, the anode was saturated with CV prior to MFC experiments to make degradation by T. harzianum, the only factor of VC removal. An increase in power density production was observed (23.6 W m−3 with CSV and 245.4 W m−3 with KIP) explained by the larger quantity of CV which was disposable for degradation by T. harzianum.
In OCV experiments, CV removal was faster and higher than in CCV. In the CCV mode, the degradation should be accelerated due to the lower resistance applied, which stimulate the degradation process. The contrary was observed attributed to the challenging nature of CV for biodegradation by T. harzianum. Power densities were also lower, with 60.7 W m−3 in the CCV mode and 245.4 W m−3 in the OCV mode.
CV inhibition effect on T. harzianum was quantified by IC50 measurement. The value of 0.97 ± 0.28 mg, highlighted the strong inhibition effect of CV on T. harzianum growth even at low concentration. Furthermore, in the biofilm environment of the anode in the MFC, we noticed that T. harzianum remained was able to produce a current under 100 mg L−1 of CV.
This study presents promising opportunities for the use of this MFC to treat various phenolic compounds as carbon source substrates. Further work will be conducted to optimize the electrodes, such as treating the cathode surface to improve the reduction reaction efficiency and attain higher power densities of our MFC.

Author Contributions

S.V. performed the experiments, wrote this article, and formatted this article; M.P. supervised the work and wrote this article; E.J. participated in the writing and helped with formatting the IC50 and biodegradation pathways data; L.L. supervised the work and wrote this article. All authors have read and agreed to the published version of the manuscript.

Funding

This work was supported by the University of Rouen Normandie: PhD Grant Sébastien Votat.

Data Availability Statement

Data are contained within the article.

Acknowledgments

The authors thank the University of Rouen Normandie, France, for the PhD Grant awarded to Sébastien Votat. The authors thank Christophe Innocent for the helpful discussions.

Conflicts of Interest

The authors have no conflicts of interest to declare that are relevant to the content of this article.

Appendix A

Figure A1. Influence of operative parameters on the MFC potential and power density at start of operation: potential E vs. current density J, and power density φs vs. current density J: (a) non-saturated KIP anode in the OCV mode, without biofilm; (b) non-saturated CSV anode in the OCV mode; (c) saturated CSV anode in the OCV mode; (d) non-saturated KIP anode in the OCV mode; (e) saturated KIP anode in the OCV mode; (f) saturated KIP anode in the CCV mode.
Energies 17 00247 g0a1aEnergies 17 00247 g0a1bEnergies 17 00247 g0a1cEnergies 17 00247 g0a1d

References

  1. Bumpus, J.A.; Brock, B.J. Biodegradation of Crystal Violet by the White Rot Fungus Phanerochaete chrysosporium. Appl. Environ. Microbiol. 1988, 54, 1143–1150. [Google Scholar] [CrossRef] [PubMed]
  2. Idaka, E.; Ogawa, T.; Yatome, C.; Horitsu, H. Behavior of activated sludge with dyes. Bull. Environ. Contam. Toxicol. 1985, 35, 729–734. [Google Scholar] [CrossRef] [PubMed]
  3. Au, W.; Pathak, S.; Collie, C.J.; Hsu, T.C. Cytogenetic Toxicity of Gentian Violet and Crystal Violet on Mammalian Cells in Vitro. Mutat. Res. Genet. Toxicol. 1978, 58, 269–276. [Google Scholar] [CrossRef] [PubMed]
  4. Habeeb, S.A.; Zinatizadeh, A.A.; Zangeneh, H. Photocatalytic Decolorization of Direct Red16 from an Aqueous Solution Using B-ZnO/TiO2 Nano Photocatalyst: Synthesis, Characterization, Process Modeling, and Optimization. Water 2023, 15, 1203. [Google Scholar] [CrossRef]
  5. Karami, A.; Shomal, R.; Sabouni, R.; Al-Sayah, M.H.; Aidan, A. Parametric Study of Methyl Orange Removal Using Metal–Organic Frameworks Based on Factorial Experimental Design Analysis. Energies 2022, 15, 4642. [Google Scholar] [CrossRef]
  6. Jóźwiak, T.; Filipkowska, U.; Walczak, P. The Use of Aminated Wheat Straw for Reactive Black 5 Dye Removal from Aqueous Solutions as a Potential Method of Biomass Valorization. Energies 2022, 15, 6257. [Google Scholar] [CrossRef]
  7. Claus, H.; Faber, G.; König, H. Redox-Mediated Decolorization of Synthetic Dyes by Fungal Laccases. Appl. Microbiol. Biotechnol. 2002, 59, 672–678. [Google Scholar] [CrossRef]
  8. Wesenberg, D.; Kyriakides, I.; Agathos, S.N. White-Rot Fungi and Their Enzymes for the Treatment of Industrial Dye Effluents. Biotechnol. Adv. 2003, 22, 161–187. [Google Scholar] [CrossRef]
  9. Forootanfar, H.; Moezzi, A.; Aghaie-Khozani, M.; Mahmoudjanlou, Y.; Ameri, A.; Niknejad, F.; Ali Faramarzi, M. Synthetic Dye Decolorization by Three Sources of Fungal Laccase. Iranian J. Environ. Health Sci. Eng. 2012, 9, 27. [Google Scholar] [CrossRef]
  10. Ostadhadi-Dehkordi, S.; Tabatabaei-Sameni, M.; Forootanfar, H.; Kolahdouz, S.; Ghazi-Khansari, M.; Faramarzi, M.A. Degradation of Some Benzodiazepines by a Laccase-Mediated System in Aqueous Solution. Bioresour. Technol. 2012, 125, 344–347. [Google Scholar] [CrossRef]
  11. Sadighi, A.; Faramarzi, M.A. Congo Red Decolorization by Immobilized Laccase through Chitosan Nanoparticles on the Glass Beads. J. Taiwan Inst. Chem. Eng. 2013, 44, 156–162. [Google Scholar] [CrossRef]
  12. D’Souza, D.T.; Tiwari, R.; Sah, A.K.; Raghukumar, C. Enhanced Production of Laccase by a Marine Fungus during Treatment of Colored Effluents and Synthetic Dyes. Enzyme Microb. Technol. 2006, 38, 504–511. [Google Scholar] [CrossRef]
  13. Moturi, B.; Charya Singara, M. Decolourisation of Crystal Violet and Malachite Green by Fungi. Sci. World J. 2009, 4. [Google Scholar] [CrossRef]
  14. Shanmugam, S.; Ulaganathan, P.; Sivasubramanian, S.; Esakkimuthu, S.; Krishnaswamy, S.; Subramaniam, S. Trichoderma Asperellum Laccase Mediated Crystal Violet Degradation-Optimization of Experimental Conditions and Characterization. J. Environ. Chem. Eng. 2017, 5, 222–231. [Google Scholar] [CrossRef]
  15. Potter, M.C. Electrical Effects Accompanying the Decomposition of Organic Compounds. R. Soc. Publ. 1911, 84, 260–276. [Google Scholar]
  16. Cohen, B. The Bacterial Culture as an Electrical Half-Cell. J. Bacteriol. 1931, 21, 18–19. [Google Scholar]
  17. Jayashree, C.; Sweta, S.; Arulazhagan, P.; Yeom, I.T.; Iqbal, M.I.I.; Rajesh Banu, J. Electricity Generation from Retting Wastewater Consisting of Recalcitrant Compounds Using Continuous Upflow Microbial Fuel Cell. Biotechnol. Bioprocess Eng. 2015, 20, 753–759. [Google Scholar] [CrossRef]
  18. Kebaili, H.; Kameche, M.; Innocent, C.; Ziane, F.Z.; Sabeur, S.A.; Sahraoui, T.; Ouis, M.; Zerrouki, A.; Charef, M.A. Treatment of Fruit Waste Leachate Using Microbial Fuel Cell: Preservation of Agricultural Environment. Acta Ecol. Sin. 2021, 41, 97–105. [Google Scholar] [CrossRef]
  19. Nguyen, H.T.H.; Kakarla, R.; Min, B. Algae Cathode Microbial Fuel Cells for Electricity Generation and Nutrient Removal from Landfill Leachate Wastewater. Int. J. Hydrogen Energy 2017, 42, 29433–29442. [Google Scholar] [CrossRef]
  20. Cecconet, D.; Molognoni, D.; Callegari, A.; Capodaglio, A.G. Agro-Food Industry Wastewater Treatment with Microbial Fuel Cells: Energetic Recovery Issues. Int. J. Hydrogen Energy 2018, 43, 500–511. [Google Scholar] [CrossRef]
  21. Çetinkaya, A.Y.; Köroğlu, E.O.; Demir, N.M.; Baysoy, D.Y.; Özkaya, B.; Çakmakçi, M. Electricity Production by a Microbial Fuel Cell Fueled by Brewery Wastewater and the Factors in Its Membrane Deterioration. Cuihua Xuebao/Chin. J. Catal. 2015, 36, 1068–1076. [Google Scholar] [CrossRef]
  22. Chen, F.; Zeng, S.; Luo, Z.; Ma, J.; Zhu, Q.; Zhang, S. A Novel MBBR–MFC Integrated System for High-Strength Pulp/Paper Wastewater Treatment and Bioelectricity Generation. Sep. Sci. Technol. 2020, 55, 2490–2499. [Google Scholar] [CrossRef]
  23. Naina Mohamed, S.; Ajit Hiraman, P.; Muthukumar, K.; Jayabalan, T. Bioelectricity Production from Kitchen Wastewater Using Microbial Fuel Cell with Photosynthetic Algal Cathode. Bioresour. Technol. 2020, 295, 122226. [Google Scholar] [CrossRef] [PubMed]
  24. Ma, D.; Jiang, Z.H.; Lay, C.H.; Zhou, D. Electricity Generation from Swine Wastewater in Microbial Fuel Cell: Hydraulic Reaction Time Effect. Int. J. Hydrogen Energy 2016, 41, 21820–21826. [Google Scholar] [CrossRef]
  25. Xia, T.; Zhang, X.; Wang, H.; Zhang, Y.; Gao, Y.; Bian, C.; Wang, X.; Xu, P. Power Generation and Microbial Community Analysis in Microbial Fuel Cells: A Promising System to Treat Organic Acid Fermentation Wastewater. Bioresour. Technol. 2019, 284, 72–79. [Google Scholar] [CrossRef]
  26. Deshmukh, R.; Khardenavis, A.A.; Purohit, H.J. Diverse Metabolic Capacities of Fungi for Bioremediation. Indian J. Microbiol. 2016, 56, 247–264. [Google Scholar] [CrossRef]
  27. Sayed, E.T.; Abdelkareem, M.A. Yeast as a Biocatalyst in Microbial Fuel Cell. In Old Yeasts—New Questions; InTech: Nappanee, IN, USA, 2017. [Google Scholar]
  28. Pontié, M.; Jaspard, E.; Friant, C.; Kilani, J.; Fix-Tailler, A.; Innocent, C.; Chery, D.; Mbokou, S.F.; Somrani, A.; Cagnon, B.; et al. A Sustainable Fungal Microbial Fuel Cell (FMFC) for the Bioremediation of Acetaminophen (APAP) and Its Main by-Product (PAP) and Energy Production from Biomass. Biocatal. Agric. Biotechnol. 2019, 22, 101376. [Google Scholar] [CrossRef]
  29. Simões, M.F.; Maiorano, A.E.; dos Santos, J.G.; Peixoto, L.; de Souza, R.F.B.; Neto, A.O.; Brito, A.G.; Ottoni, C.A. Microbial Fuel Cell-Induced Production of Fungal Laccase to Degrade the Anthraquinone Dye Remazol Brilliant Blue R. Environ. Chem. Lett. 2019, 17, 1413–1420. [Google Scholar] [CrossRef]
  30. Osman, M.E.; Khattab, O.-K.H.; Abo-Elnasr, A.A.; Abdel Basset, S. Acid Black 172 Dye Decolorization and Bioelectricity Generation by Microbial Fuel Cell with Filamentous Fungi on Anode. Biosci. Biotechnol. Res. Asia 2018, 15, 981–986. [Google Scholar] [CrossRef]
  31. Gineys, M.; Benoit, R.; Cohaut, N.; Béguin, F.; Delpeux-Ouldriane, S. Behavior of Activated Carbon Cloths Used as Electrode in Electrochemical Processes. Chem. Eng. J. 2017, 310, 1–12. [Google Scholar] [CrossRef]
  32. Masson, S. Étude de L’adsorption de Micropolluants Émergents Sur Des Tissus de Carbone Activé. Ph.D. Thesis, Université de Grenoble, Grenoble, France, 2017. [Google Scholar]
  33. Kosimaningrum, W. Modification of Carbon Felt for Construction of Air-Breathing Cathode and Its Application in Microbial Fuel Cell. Ph.D. Thesis, Université de Montpellier, Montpellier, France, 2018. [Google Scholar]
  34. Palma-Goyes, R.E.; Guzmán-Duque, F.L.; Peñuela, G.; González, I.; Nava, J.L.; Torres-Palma, R.A. Electrochemical Degradation of Crystal Violet with BDD Electrodes: Effect of Electrochemical Parameters and Identification of Organic by-Products. Chemosphere 2010, 81, 26–32. [Google Scholar] [CrossRef] [PubMed]
  35. Zhang, H.; Wu, J.; Wang, Z.; Zhang, D. Electrochemical Oxidation of Vrystal Ciolet in the Presence of Hydrogen Peroxide. J. Chem. Technol. Biotechnol. 2010, 85, 1436–1444. [Google Scholar] [CrossRef]
  36. He, H.; Yang, S.; Yu, K.; Ju, Y.; Sun, C.; Wang, L. Microwave Induced Catalytic Degradation of Crystal Violet in Nano-Nickel Dioxide Suspensions. J. Hazard Mater. 2010, 173, 393–400. [Google Scholar] [CrossRef] [PubMed]
  37. Ding, J.; Mei, J.; Huang, P.; Tian, Y.; Liang, Y.; Jiang, X.; Li, M. Gα3 Subunit Thga3 Positively Regulates Conidiation, Mycoparasitism, Chitinase Activity, and Hydrophobicity of Trichoderma Harzianum. AMB Express 2020, 10, 221. [Google Scholar] [CrossRef] [PubMed]
  38. Bessbousse, H.; Rhlalou, T.; Verchère, J.F.; Lebrun, L. Mercury Removal from Wastewater Using a Poly(Vinylalcohol)/Poly(Vinylimidazole) Complexing Membrane. Chem. Eng. J. 2010, 164, 37–48. [Google Scholar] [CrossRef]
  39. Fu, B.R.; Shen, C.; Ren, J.; Chen, J.Y.; Zhao, L. Advanced Oxidation of Biorefractory Organics in Aqueous Solution Together with Bioelectricity Generation by Microbial Fuel Cells with Composite FO/GPEs. In Proceedings of the IOP Conference Series: Earth and Environmental Science, Toronto, ON, Canada, 1–3 November 2017; Institute of Physics Publishing: Bristol, UK, 2018; Volume 127. [Google Scholar]
  40. Danish Khan, M.; Abdulateif, H.; Ismail, I.M.; Sabir, S.; Zain Khan, M. Bioelectricity Generation and Bioremediation of an Azo-Dye in a Microbial Fuel Cell Coupled Activated Sludge Process. PLoS ONE 2015, 10, e0138448. [Google Scholar] [CrossRef]
  41. Annadurai, G.; Rajesh Babu, S.; Nagarajan, G.; Ragu, K. Use of Box Behnken Design of Experiments in the Production of Manganese Peroxidase by Phanerochaete Chrysosporium (MTCC 767) and Decolorization of Crystal Violet. Bioprocess Eng. 2000, 23, 715–719. [Google Scholar] [CrossRef]
  42. Yatome, C.; Yamada, S.; Ogawa, T.; Matsui, M. Degradation of Crystal Violet by Nocardia Corallina. Appl. Microbiol. Biotechnol. 1993, 38, 565–569. [Google Scholar] [CrossRef]
  43. Roy, D.C.; Biswas, S.K.; Saha, A.K.; Sikdar, B.; Rahman, M.; Roy, A.K.; Prodhan, Z.H.; Tang, S.S. Biodegradation of Crystal Violet Dye by Bacteria Isolated from Textile Industry Effluents. PeerJ 2018, 2018, e5015. [Google Scholar] [CrossRef]
  44. Cheng, C.Y.; Liang, F.Y.; Chung, Y.C. Electricity Generation from Crystal Violet Using a Single-Chambered Microbial Fuel Cell Inoculated Aeromonas Hydrophila YC 57. Adv. Mater. Res. 2014, 860–863, 466–471. [Google Scholar] [CrossRef]
  45. Babanova, S.; Hubenova, Y.; Mitov, M. Influence of Artificial Mediators on Yeast-Based Fuel Cell Performance. J. Biosci. Bioeng. 2011, 112, 379–387. [Google Scholar] [CrossRef] [PubMed]
  46. Gunawardena, A.; Fernando, S.; To, F. Performance of a Yeast-Mediated Biological Fuel Cell. Int. J. Mol. Sci. 2008, 9, 1893–1907. [Google Scholar] [CrossRef] [PubMed]
  47. Mbokou, S.F.; Tonle, I.K.; Pontié, M. Development of a Novel Hybrid Biofuel Cell Type APAP/O2 Based on a Fungal Bioanode with a Scedosporium Dehoogii Biofilm. J. Appl. Electrochem. 2017, 47, 273–280. [Google Scholar] [CrossRef]
  48. Volpe, D.A.; Hamed, S.S.; Zhang, L.K. Use of Different Parameters and Equations for Calculation of IC 50 Values in Efflux Assays: Potential Sources of Variability in IC50 Determination. AAPS J. 2014, 16, 172–180. [Google Scholar] [CrossRef]
  49. JGI Database MycoCosm. Available online: https://mycocosm.jgi.doe.gov/mycocosm/home (accessed on 18 December 2023).
  50. Venice, F.; Davolos, D.; Spina, F.; Poli, A.; Prigione, V.P.; Varese, G.C.; Ghignone, S. Genome Sequence of Trichoderma Lixii Mut3171, a Promising Strain for Mycoremediation of Pah-Contaminated Sites. Microorganisms 2020, 8, 1258. [Google Scholar] [CrossRef]
  51. He, X.-L.; Song, C.; Li, Y.Y.; Wang, N.; Xu, L.; Han, X.; Wei, D. sheng Efficient Degradation of Azo Dyes by a Newly Isolated Fungus Trichoderma Tomentosum under Non-Sterile Conditions. Ecotoxicol. Environ. Saf. 2018, 150, 232–239. [Google Scholar] [CrossRef]
Figure 1. CV removal by MFC: (a) Absorbance spectra of anolyte samples vs. time t (with KIP carbon cloth anode); (b) kinetics of consumption of VC: concentration Ct vs. t; (c) removal of CV: f vs. t; (d) pseudo-first order model plot of CV removal.
Energies 17 00247 g001aEnergies 17 00247 g001b
Figure 2. CV removal by the MFC: influence of the CV saturation of carbon cloth. Kinetics of consumption of CV vs. t: (a) KIP anode; (b) CSV anode.
Energies 17 00247 g002
Figure 3. Influence of T. harzianum on CV removal (KIP carbon cloth as anode): pseudo-first order model plot of VC removal.
Energies 17 00247 g003
Figure 4. Performances of MFC with KIP or CSV anode: (a) potential E at optimum resistance R vs. t; (b) power density φv vs. t.
Energies 17 00247 g004
Figure 5. Influence of the carbon cloth MB saturation on the MFC performances: power density φv vs. t: (a) KIP anode; (b) CSV anode.
Energies 17 00247 g005
Figure 6. Performances of MFC with saturated KIP anode in open circuit potential (OCV) or closed-circuit mode (CCV): (a) potential E at optimum R vs. t; (b) power density φv vs. t; (c) CV removal: f vs. t.
Energies 17 00247 g006aEnergies 17 00247 g006b
Figure 7. T. harzianum growth curves in the presence of increasing Ccv (from top to bottom: 0 (i.e., control) (□), 0.25 (■), 0.5 (◊), 1 (♦), 1.25 (Δ), 1.5 (▲), 1.75 (○), 2.25 (●) and 2.5 mg L−1 (×), respectively).
Energies 17 00247 g007
Figure 8. T. harzianum inhibition rate at different CVC.
Energies 17 00247 g008
Figure 9. Hypothesis on CV biodegradation: (a) possible degradation by−products of CV by laccase from T. asperellum [11]; (b) structure of alachlor and guaiacol.
Energies 17 00247 g009
Table 1. Performances of MFC: carbon cloth used, presence of T. harzianum, saturation level, OCV and CCV operating mode, maximum electromotive force (emf) at t = 0, maximum electrode surface power density φs, and maximum anolyte volume power density φv’, maximum electrode volume power density φv.
Carbon ClothT. harzianumSaturationOperating Modeemf (mV)Maximum φs (mW.m−2)Maximum φv’
(mW.m−3)
Maximum φv (W.m−3)
CSVYesNon-saturatedOCV *111.60.814.10.6
CSVYesSaturatedOCV *178.52.749.923.6
KIPYesNon-saturatedOCV *270.158.81095.8229.6
KIPNoNon-saturatedOCV *153.01.4162.75.5
KIPYesSaturatedOCV *300.162.81170.3245.4
KIPYesSaturatedCCV **143.715.5288.860.7
* Entrance impedance = 10 MOhms; ** optimum resistance: R = 200 Ohms (KIP); 2000 Ohms (CSV).
Table 2. T. harzianum genes and depolluting enzymes [49].
T. harzianum’s StrainsNumber of Genes
T. harzianum T22 v1.012,762
T. harzianum M10 v1.012,842
T. harzianum TR274 v1.013,932
T. harzianum CBS 226.95 v1.014,095
Enzyme familiesEnzymes
Multicopper oxidases6 laccases, 2 tyrosinases
MonooxygenasesFrom 41 to 71 P450 mono-oxygenases, 1 benzoate-specific mono-oxygenase, 2 phenol 2-mono-oxygenases
Flavin-dependent monooxygenasesFrom 9 to 10 flavoprotein monooxygenases, from 0 to 2
meta-dichlorophenol 6-mono-oxygenases, from 17 to 26 flavin-binding monooxygenases-like, 2 nitroreductases
Disclaimer/Publisher’s Note: The statements, opinions and data contained in all publications are solely those of the individual author(s) and contributor(s) and not of MDPI and/or the editor(s). MDPI and/or the editor(s) disclaim responsibility for any injury to people or property resulting from any ideas, methods, instructions or products referred to in the content.

