Article

Hybrid (Gas and Geothermal) Greenhouse Simulations Aimed at Optimizing Investment and Operative Costs: A Case Study in NW Italy

1
Interuniversity Department of Regional, and Urban Studies, and Planning (DIST), University of Turin, 10124 Torino, Italy
2
Direzione Edilizia e Sostenibilità, University of Turin, 10124 Torino, Italy
*
Author to whom correspondence should be addressed.
Energies 2023, 16(9), 3931; https://doi.org/10.3390/en16093931
Submission received: 27 February 2023 / Revised: 5 April 2023 / Accepted: 3 May 2023 / Published: 6 May 2023
(This article belongs to the Special Issue Shallow Geothermal Energy 2023)

Abstract

:
Generally, greenhouses are high energy-consuming, sometimes accounting for 50% of the cost of greenhouse production. Geothermal energy plays a very important role in maintaining the desired temperature and reducing energy consumption. This work deals with a project of a hybrid heating plant (97% geothermal energy and 3% gas-condensing boiler) for the innovative Plant Phenotyping Greenhouse at the University Campus in Grugliasco (few km West of the city of Turin). The aim of the study is to testify to the energy efficiency of this kind of hybrid plant as well as its economic sustainability. Numerical simulations of a GRT were used to calibrate the system and verify that the software reasonably modeled the real case. They helped to correctly size the geothermal plant, also providing data about the thermal energy storage and production during on and off plant cycles. The results show a thermal power of 50.92 kW over 120 days of plant operation, in line with the expected energy needs to meet the base load demand. Long-term results further ensure a negligeable impact on the ground, with a thermal plume between 5 and 10 m from the plant, reducing substantially in a few months after switching off the plant.

1. Introduction

One of the most important challenges under the current geopolitical situation is reducing energy costs to produce both heat and power [1]. The effort to better manage energy consumption and, thus, lower high consumer bills ensuring reliable access to energy, is among the main objectives of European governments. The International Energy Alliance reports that efficient and low-carbon heating technologies are growing, even if fossil fuels still meet over 60% of the heating energy needs [2]. The recent United Nations Climate Change Conferences (COP26 and COP27) identified solutions to reduce carbon emissions through innovative technologies, as well as more economic investments and financial incentives [3,4,5]. Regardless, Europe showed a negative trend in 2021, both for energy consumption and CO2 emissions, which rebounded to above pre-pandemic levels in 2019, despite a great increase in investments in lowering the energy intensity of buildings [6,7].
In this framework, agricultural greenhouses represent an important source of the energy demand, resulting in their being one of the higher energy-consuming sectors in farming [8]. Heating accounts for 70/85% of the total energy consumption as one of the largest operating costs for the maintenance of a greenhouse, after labour and plant materials [9,10]. The amount of thermal energy needed for heating mainly depends on the climate of the specific area, as well as on the greenhouse design and on the cultivated crop [9]. As reported in [9], finding the right temperature to balance energy losses and gains allows the plants’ optimal range for their growth to be reached. Keeping temperatures constant inside greenhouses, at a right level for the plants’ growth, using conventional heating systems can meet considerable operating costs.
Geothermal energy can be an option for more economic and sustainable agricultural production [10,11,12]. This topic has been addressed by many studies, but most of them are focused on the energy efficiency of the whole structural design and the materials used for the realization of a greenhouse, as well as the improvement of the traditional heating and ventilation systems to keep constant indoor temperatures [10,11,12,13]. Other works deal with feasibility studies to assess the geothermal potential of an area, also evaluating how to mitigate climate impact on indoor temperatures when large temperature variations occur [14,15]. A comparison of integrated heating systems combining geothermal and solar energies with conventional technologies is presented in a few studies. Some authors [16,17] already testified that the integration of different renewable energy sources can lead to a considerable reduction in carbon emissions. They confirm this through a life cycle assessment comparing a conventional hot air generator with a pilot photovoltaic-geothermal heat pump integrated system.
In this paper, the design of a hybrid heating system for a greenhouse located NW Italy (in the surroundings of Turin), where two heat generators work together (fed, respectively, by geothermal energy and methane), is presented (Figure 1). This study focuses on field studies and numerical simulations aimed at evaluating the geological, hydrogeological, and thermo-physical characteristics of the ground, which are useful to correctly size the geothermal plant. These data help to better understand the thermal efficiency of the system in terms of productivity and thermal impact on the ground.
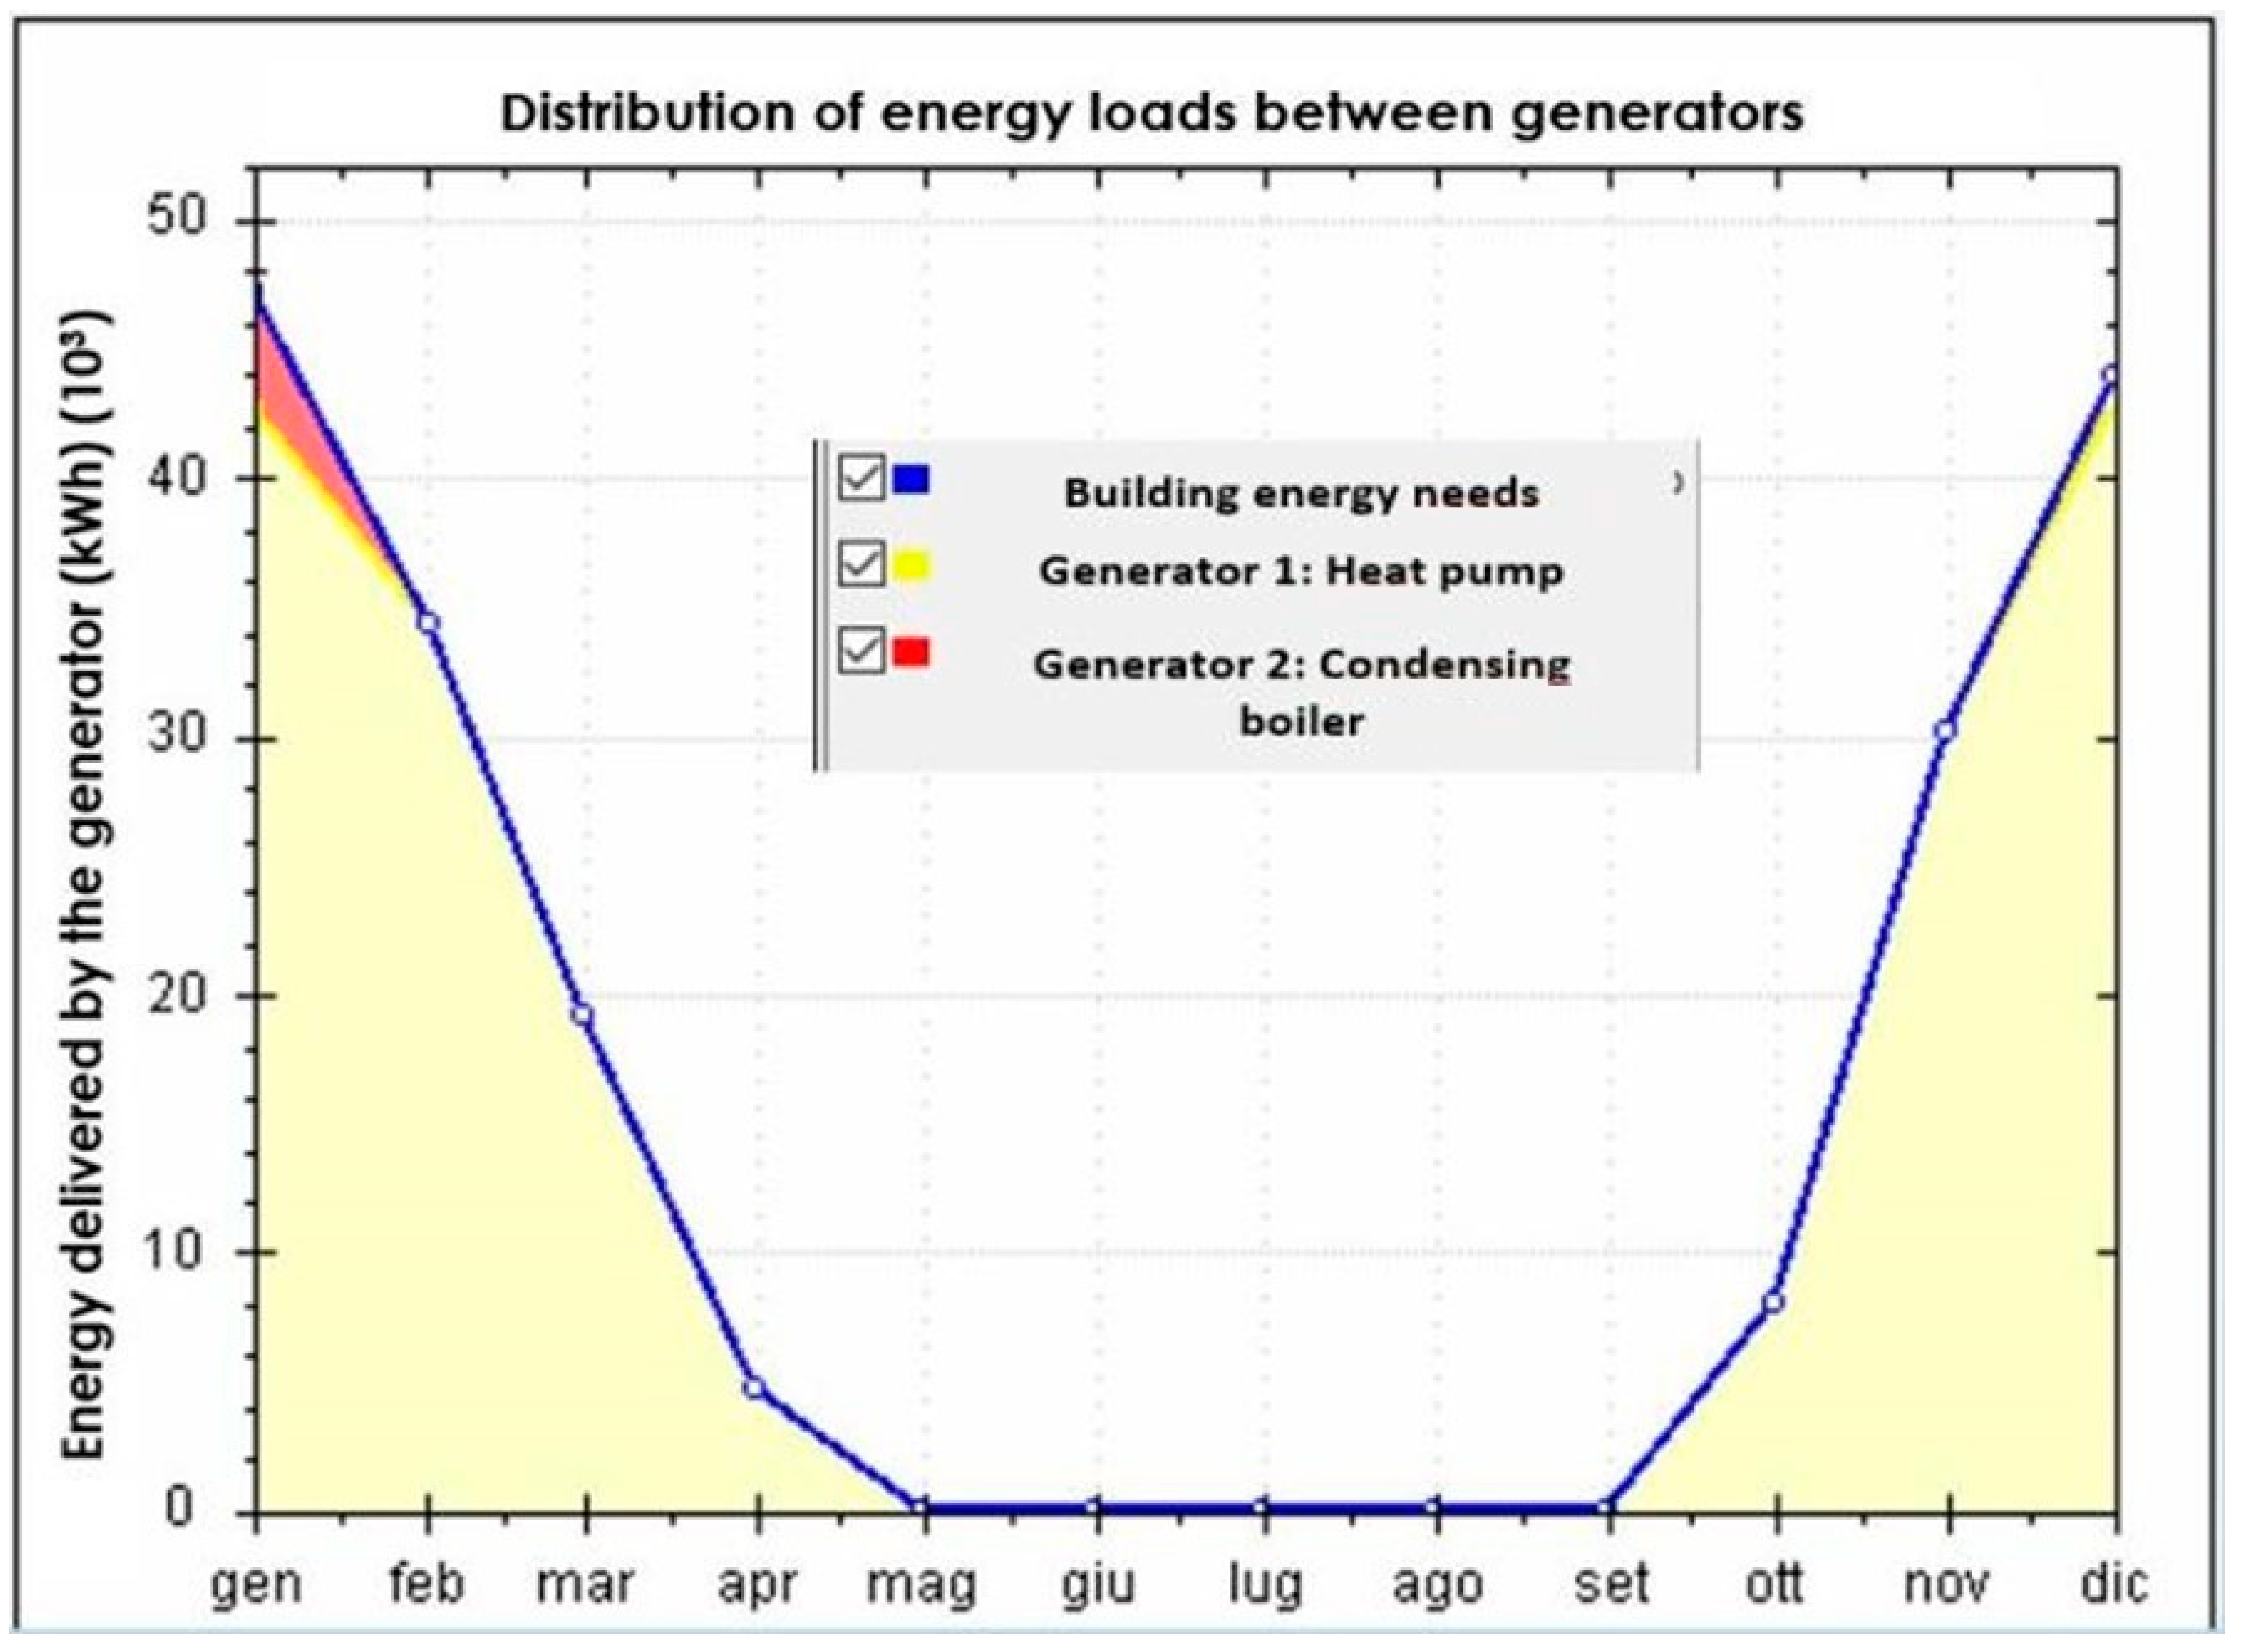
The aim of the study is to optimize both investments and operative costs, comparing with conventional heating systems. The plant is in a testing phase, and it will be operative from autumn 2023. In detail, a hybrid heating system, consisting of a condensing boiler to meet peak loads during colder days and of a shallow geothermal plant to meet the base load and the energy needs for most of the year, will be used. As represented in Figure 2, preliminary energy simulations of the greenhouse expect to almost meet the total energy need with only the geothermal heat pump, while using the condensing boiler only during some days in colder months to meet peak loads (about 3% of the total energy needs). This design was identified as a good solution to bear high costs for drilling and operative costs for gas, achieving high environmental and economic benefits.
This study allows an understanding of how the correct design of a shallow geothermal plant can ensure meeting base load demands and the near totality of the peak loads, also providing great thermal efficiency with a negligeable thermal impact on the ground after many years of plant operation.

2. Geological Setting

The study area is in NW Italy at the University Campus located in the Municipality of Grugliasco, a few kilometres from the Turin area (Figure 3) in the western sector of the Po Plain, here represented by a narrow sector between the Western Alps and the Turin Hill. The morphology of this area is flat with a gentle slope towards the east and corresponds to large alluvial fans coming from the Alps [18]. This portion is the Piedmont Plain, representing the westernmost part of the Po Plain, which consists of superimposed alluvial complexes. It is composed of an upper Pleistocene outwash and fluvial units consisting of mainly sands and gravels with subordinate silts and clays [19,20] and forming the alluvial fans of the Po River tributaries, such as the Dora Riparia River, the Stura di Lanzo, and the Sangone watercourses [18]. This sector of the Po Plain is located at the lowermost elevations, where the Po River represents the main regional discharge axis directed from the Alps towards the SE–NE direction, with the water table following the topographical surface [18,21,22]. This area represents the distal sector of the outwash plane of the Rivoli-Avigliana end-moraine system (RAES) [22], linked to the Pleistocene glacial expansions of the Dora Riparia Glacier at the outlet of the Susa Valley.
The bedrock is formed by the Turin Hill successions, consisting of sedimentary units of the synorogenic basins that were deformed and uplifted during the Cenozoic, and records the syn-collisional tectonic phases of the Alps-Apennine orogenic system [21,22]. These successions are covered by a Pliocene muddy-sandy succession, and they are composed of three main hydrogeological complexes (from the base to the top) [18,19,20,21,22]:
  • the Pliocene marine complex, consisting of two members: the “Argille Azzurre” Formation, with scarcely permeable silt and clays, and the “Asti Sand”; this complex hosts moderate productive aquifers;
  • the late Pliocene–early Pleistocene “Villafranchiano” transitional complex, composed of deltaic to continental deposits with alternating sandy gravels and silty clays and hosting a multilayered aquifer representing the most-exploited groundwater system of the Turin area because of its productivity and better groundwater quality than the shallow aquifer;
  • the lower Pleistocene–Holocene “Alluvial deposits” complex, which hosts a shallow, unconfined aquifer formed of highly permeable coarse gravels and sands of fluvioglacial origin, with silty-clayey intercalations.

3. Assessments Aimed at Sizing the Shallow Geothermal Plant

Previous studies in the investigated area allowed detailed geological and hydrogeological data to be obtained [19,20]; however, due to the high vertical and lateral variability of the geological units, the borehole field was not easy to design. Preliminary measures of the undisturbed ground temperature were carried out for two weeks, just after the drilling and the installation of the borehole heat exchangers (BHEs), also evaluating the effects the of the grout ageing.
Aimed at defining the ground thermal efficiency to efficiently design a shallow geothermal plant for thermal energy production, a ground thermal response test (GRT) was planned. As specified in [23], the GRT allows thermo-physical parameters of the whole investigated domain to be obtained without defining the specific properties of the underground soils at different depths. The GRT provide temperature data of the inlet and outlet fluids through geothermal pipes inside a BHE, thus, allowing an assessment of the heat transfer. This means that measures released by the GRT also include the contributions of the pipe and grout materials used to seal borehole walls, and that of the groundwater level, depending on its depth. According to [23], a back analysis of the field GRT reveals very helpful information for understanding the right amount of heat transfer though specific parameters of the ground, such as the undisturbed ground temperature and the thermal conductivity; in particular, it ensures that great efficiency of the whole plant is achieved, thanks to an accurate BHE configuration.

3.1. Monitoring of Ground Temperature and Grout Ageing

Knowing the right undisturbed ground temperature, as well as the depth at which it can be considered “undisturbed”, is of paramount importance when dealing with the design of a shallow geothermal plant. The temperature can indeed be affected by several factors in the first meters below the ground, but it can also change depending on the groundwater [24,25,26].
Three different temperature profiles, in different periods and modalities, were carried out. Precisely, measurements were performed during the ageing of the grout used to seal the space between the wall boreholes and the geothermal pipe inside the BHE. As widely proved in [27], grout is another important element involved in the heat transfer process; therefore, verifying the ground temperatures in a BHE also entails testing the grout stability during its ageing. For this purpose, a specific device was installed to measure the temperature continuously (1000 Series Squirrel, Eltek Ltd., Cambridge, UK) over a period of 16 days. A cable consisting of three thermocouples placed outside the geothermal pipe and inside the grout at three different depths (−30, −70, and −130 m) was connected to the device, recording temperature variations every hour. This further analysis allowed a more accurate and deeper temperature profile to be obtained, as well as to monitor when the temperature stabilized during the grout ageing. Two other temperature profiles were measured in the following weeks. In this case, specific sensors (Mini-Diver, Van Essen Instruments, Tucker, GA, USA), measuring the temperature with a time interval of 1 min, were inserted inside the geothermal pipe. They recorded temperature data at −30, −60, −70, −80, −90, and −100 m, with a measuring time of 10 min at each depth, as well as an interval time between measurements of 5 min.

3.2. Field GRT and Interpretation of the Obtained Parameters

The field Ground Response Test (GRT) was carried out at the end of 2021. The equipment used complies with the VDI4640 [28] for geothermal plants which require more than 30 kW to satisfy their energy needs. The GRT investigated a preliminary vertical borehole −100 m in depth, inside which a “double U” geothermal pipe had been installed. Thanks to the use of three electric resistances of about 2 kW each, the heat transfer fluid was conveyed with a flow rate of 0.41 l/s. A measuring system allowed the inlet and outlet temperature variations to be recorded in a short time interval of 1 min over a typical test duration of 72 h.
The test was based on the infinite linear source model (ILS), which provides a quick and appropriate estimation of subsurface thermal parameters such as thermal conductivity and thermal resistance, a value that defines the performance of the heat transfer between the geothermal pipe and the ground with greater accuracy. Two main approaches introduced by Equations (1) and (2), respectively, and developed by [29,30], were used to accurately interpret the field GRT [23]:
T f t = q 4 π λ * l n 4 α t r 2 γ + q * R b + T g
where:
  • Tf(t) is the average fluid temperature (Tin and Tout) depending on the test time, expressed in °C.
  • Q is the injected power per unit of length and time, expressed in W and derived from q = Q/H (H is the drilling depth).
  • π is equal to 3.14.
  • λ is the ground thermal conductivity, expressed in W*m−1K−1.
  • γ is the Eulero Constant, equal to 0.5772.
  • α is the thermal diffusivity, expressed in m2/s.
  • t is the test time, expressed in s.
  • r is the borehole radius, expressed in m.
  • Rb is the borehole thermal resistance, expressed in K/(W/m).
  • Tg is the undisturbed temperature, expressed in °C.
The value of the thermal resistance was evaluated using the approach developed by [31] and revised by [32], as well.
Differently from Equation (1), the thermal conductivity was also evaluated using Equation (2), which differs in that the function g represents the thermal response factor of the geothermal pipe:
T f = T g q R b q 2 π λ g t t s c , r H
where g is a function according to which the long-term response of a BHE field is defined. It depends on t/tsc, where t is the time expressed in s, and tsc = H2/9α.
Possible gaps in the use of these methods mainly relate to some assumptions of the model, such as considering heat transfer in a purely conductive regime through an isotropic and homogeneous medium rather than heterogeneous and anisotropic, like in natural conditions. Therefore, a good practice should be to integrate these results with further analyses, such as a GRT back analysis, to better detail the investigated medium and also evaluate the convective regime of the heat transfer.
Once the ground thermal conductivity (λ) and the borehole thermal resistance (Rb) are obtained, the thermal power which can be extracted from a borehole can be also calculated. By multiplying the flow rate of the heat transfer fluid by its specific heat capacity and then the temperature difference of the fluid when entering and leaving the geothermal pipes, the thermal power can be derived.
Among several equations, the simplified version of what was exposed by [33] and used after by [23] was applied to calculate the energy power production and then to assess the amount of thermal energy extracted from the plant during colder months:
P = Q T o u t T i n * C p
where P is the thermal power (W), Q is the heat flow rate (kg/s), Tout and Tin (°C) are the inlet and outlet temperatures, respectively, and Cp is the specific heat capacity (J/kg*°C).

3.3. Numerical Simulation of the Field GRT

A back analysis of the field GRT was performed, based on its interpretation as presented in Section 3.2, as well as on geological, hydrogeological, and thermo-physical data (Table 1) derived from the literature and preliminary field surveys.
Feflow software 7.0 (Wasy DHI Group, Berlin, Germany) was used; it is one of the most reliable finite element numerical codes and one of the most-used for these purposes. According to what was specified in [23,27], this software enables analyses of each part of the ground/aquifer/pipe system, as well as to obtain the amount of thermal power that can be extracted from the investigated medium using specific boundary conditions. These features allow a high level of numerical efficiency to be provided and, thus, an accurate sensitivity analysis. Furthermore, the software enables the use of several different calculation systems, each responding to specific model conditions. For this study, a calculation method suitable for symmetrical (flow) and asymmetric (transport) equations systems was used. Aimed at studying the heat exchange in the ground/aquifer/pipe systems, each simulation was characterized by a specific time step typical for transient conditions. The study area was then set, generating a finite-element mesh containing all the geometrical properties the mesh generation algorithm needs (a super-mesh). This 50 × 50 × 120 m mesh was characterized by an arbitrary number of polygons, lines, and points with a specified function [34]. The model was divided in five “slices” representing the top and the bottom of each considered layer. A punctual element, placed in the central portion of the mesh at −100 m in depth and equipped with a double U geothermal pipe, represented the pilot BHE.

4. Short- and Long-Term Numerical Simulations

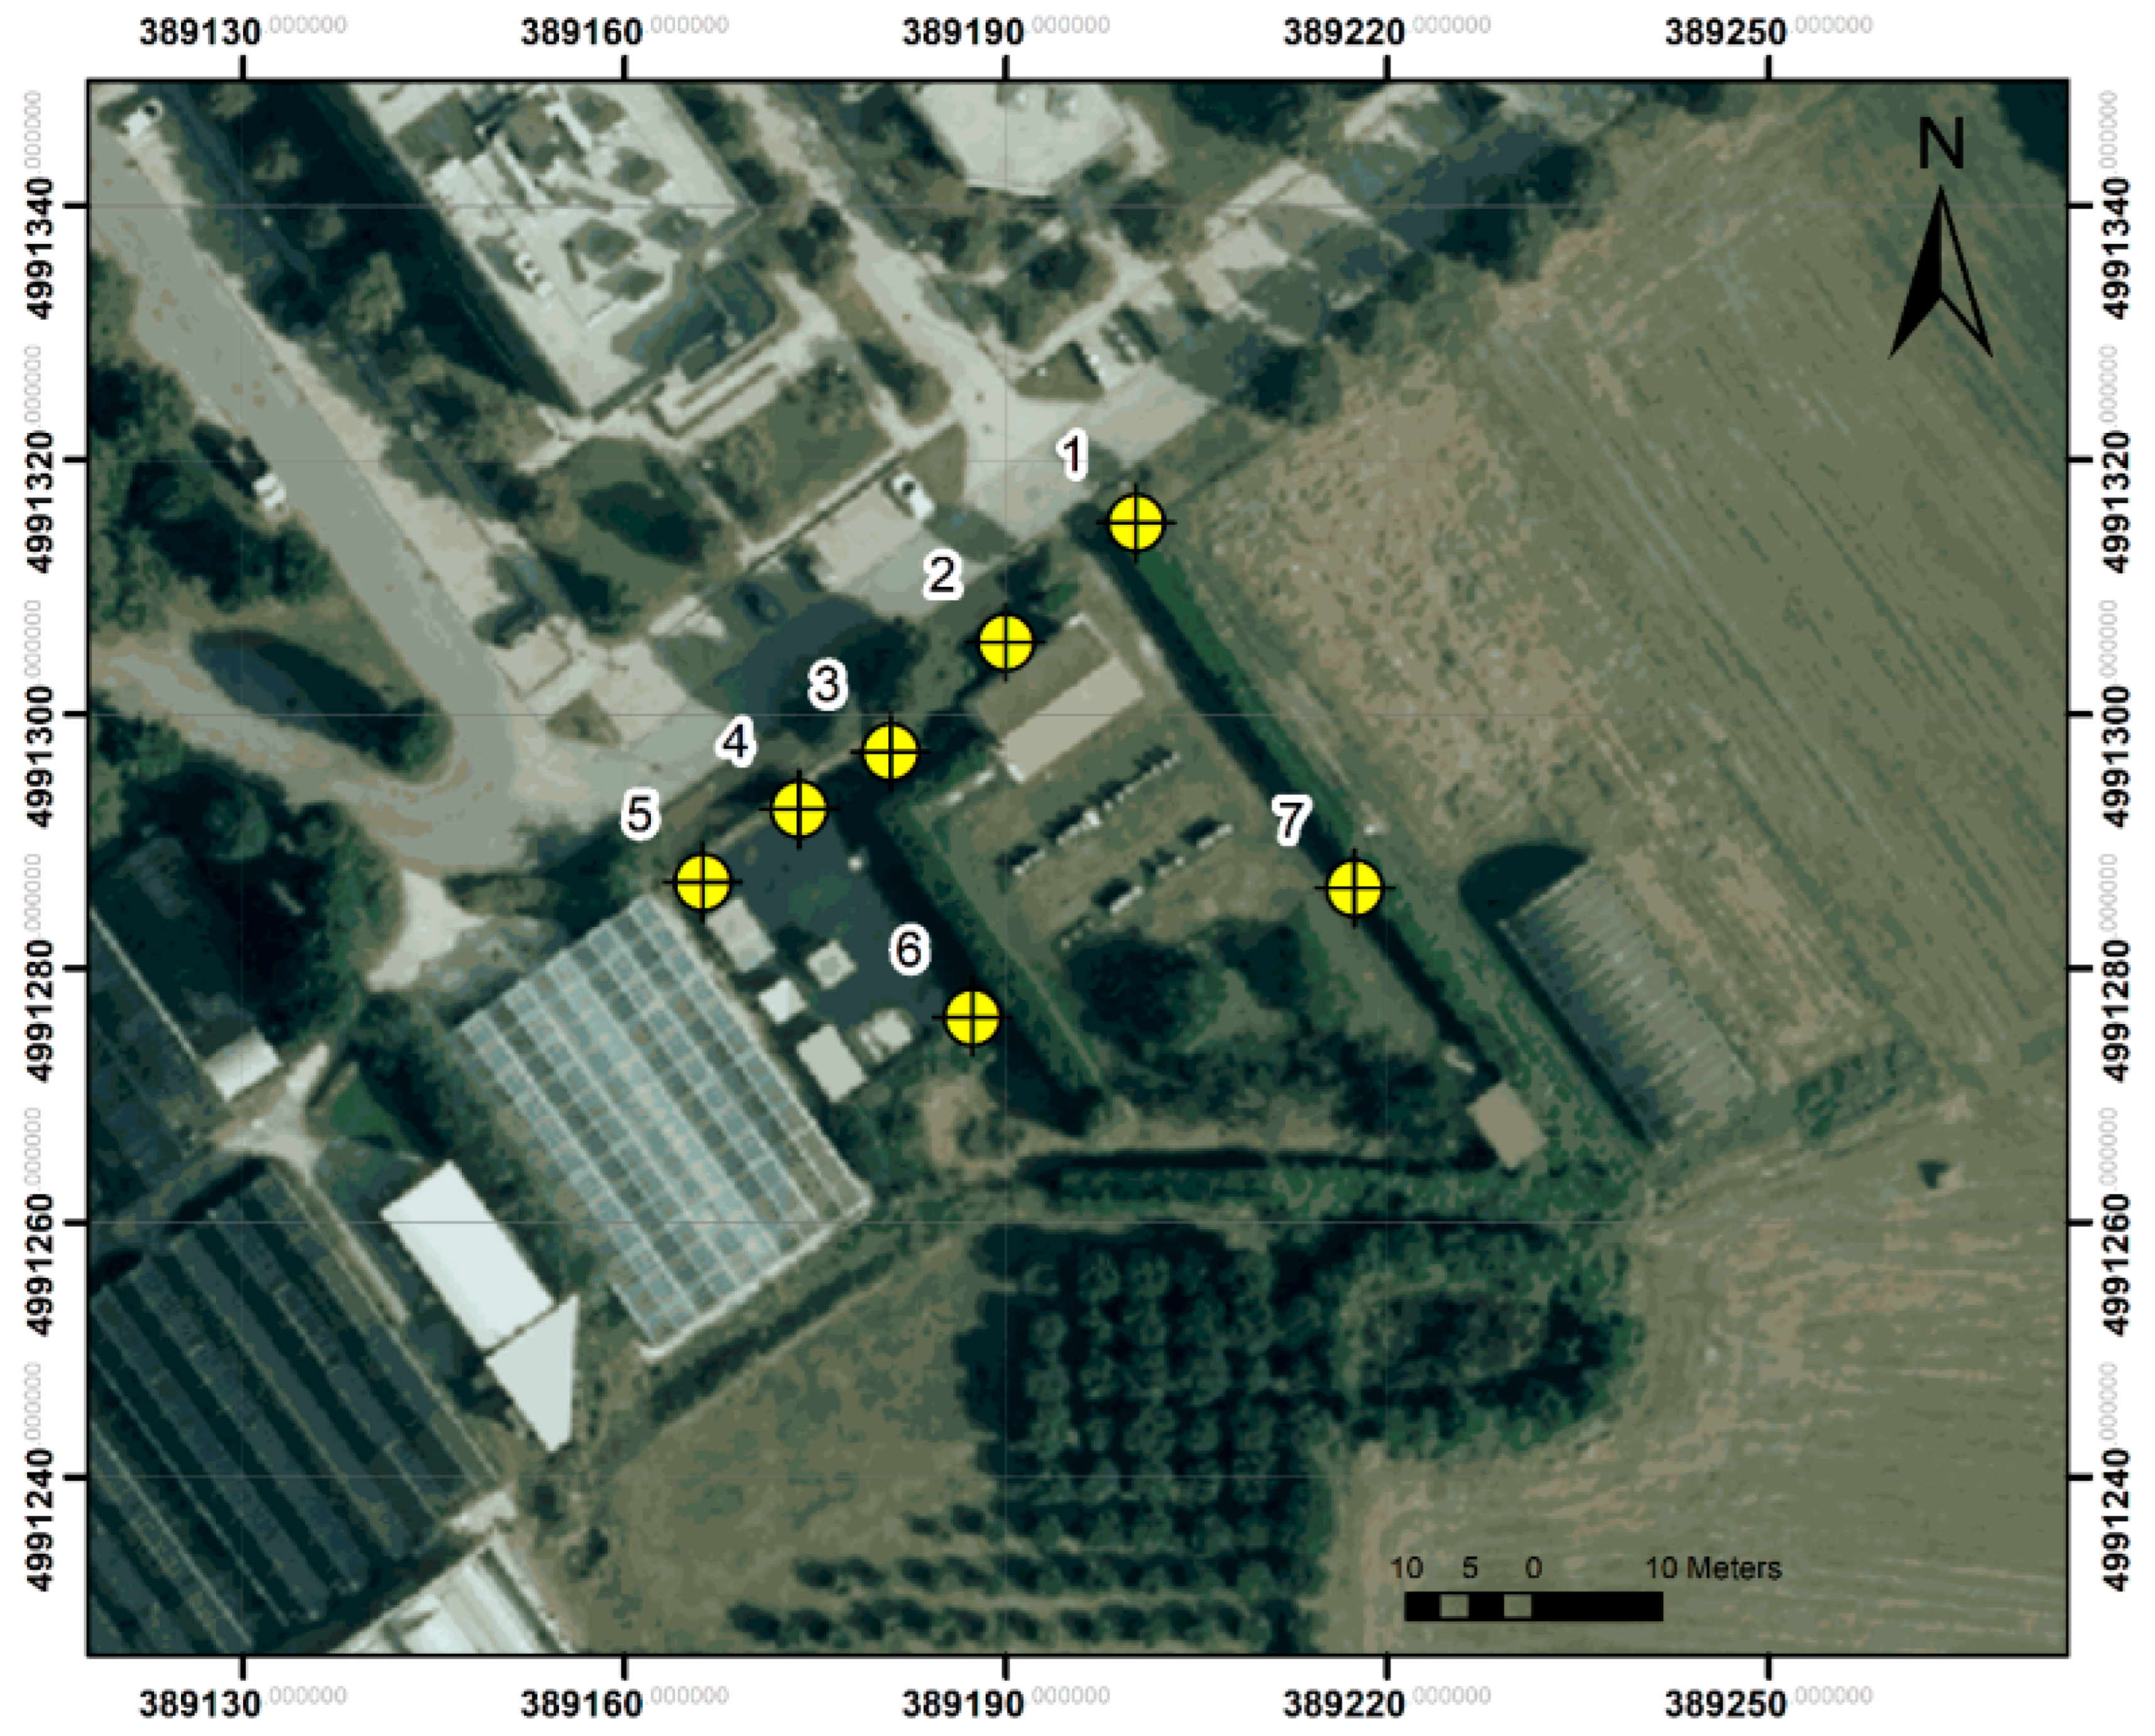
The literature review, field surveys, field GRT and its interpretation, allowed the geometrical, geological, thermo-physical and thermo-technical parameters of the test site to accurately be defined. A series of preliminary simulations, studying different geometrical and technical settings, was performed. Particular attention was paid to optimizing the position and the distance between boreholes, mainly depending on the results of the numerical simulations about the influence of the thermal plumes on the ground; this allowed the shallow geothermal part of the hybrid heating system to be definitively designed. The adopted solution consisted of seven boreholes of which six −150 m in depth and one (the pilot BHE used for the field GRT) −100 m deep, as shown in Figure 4.
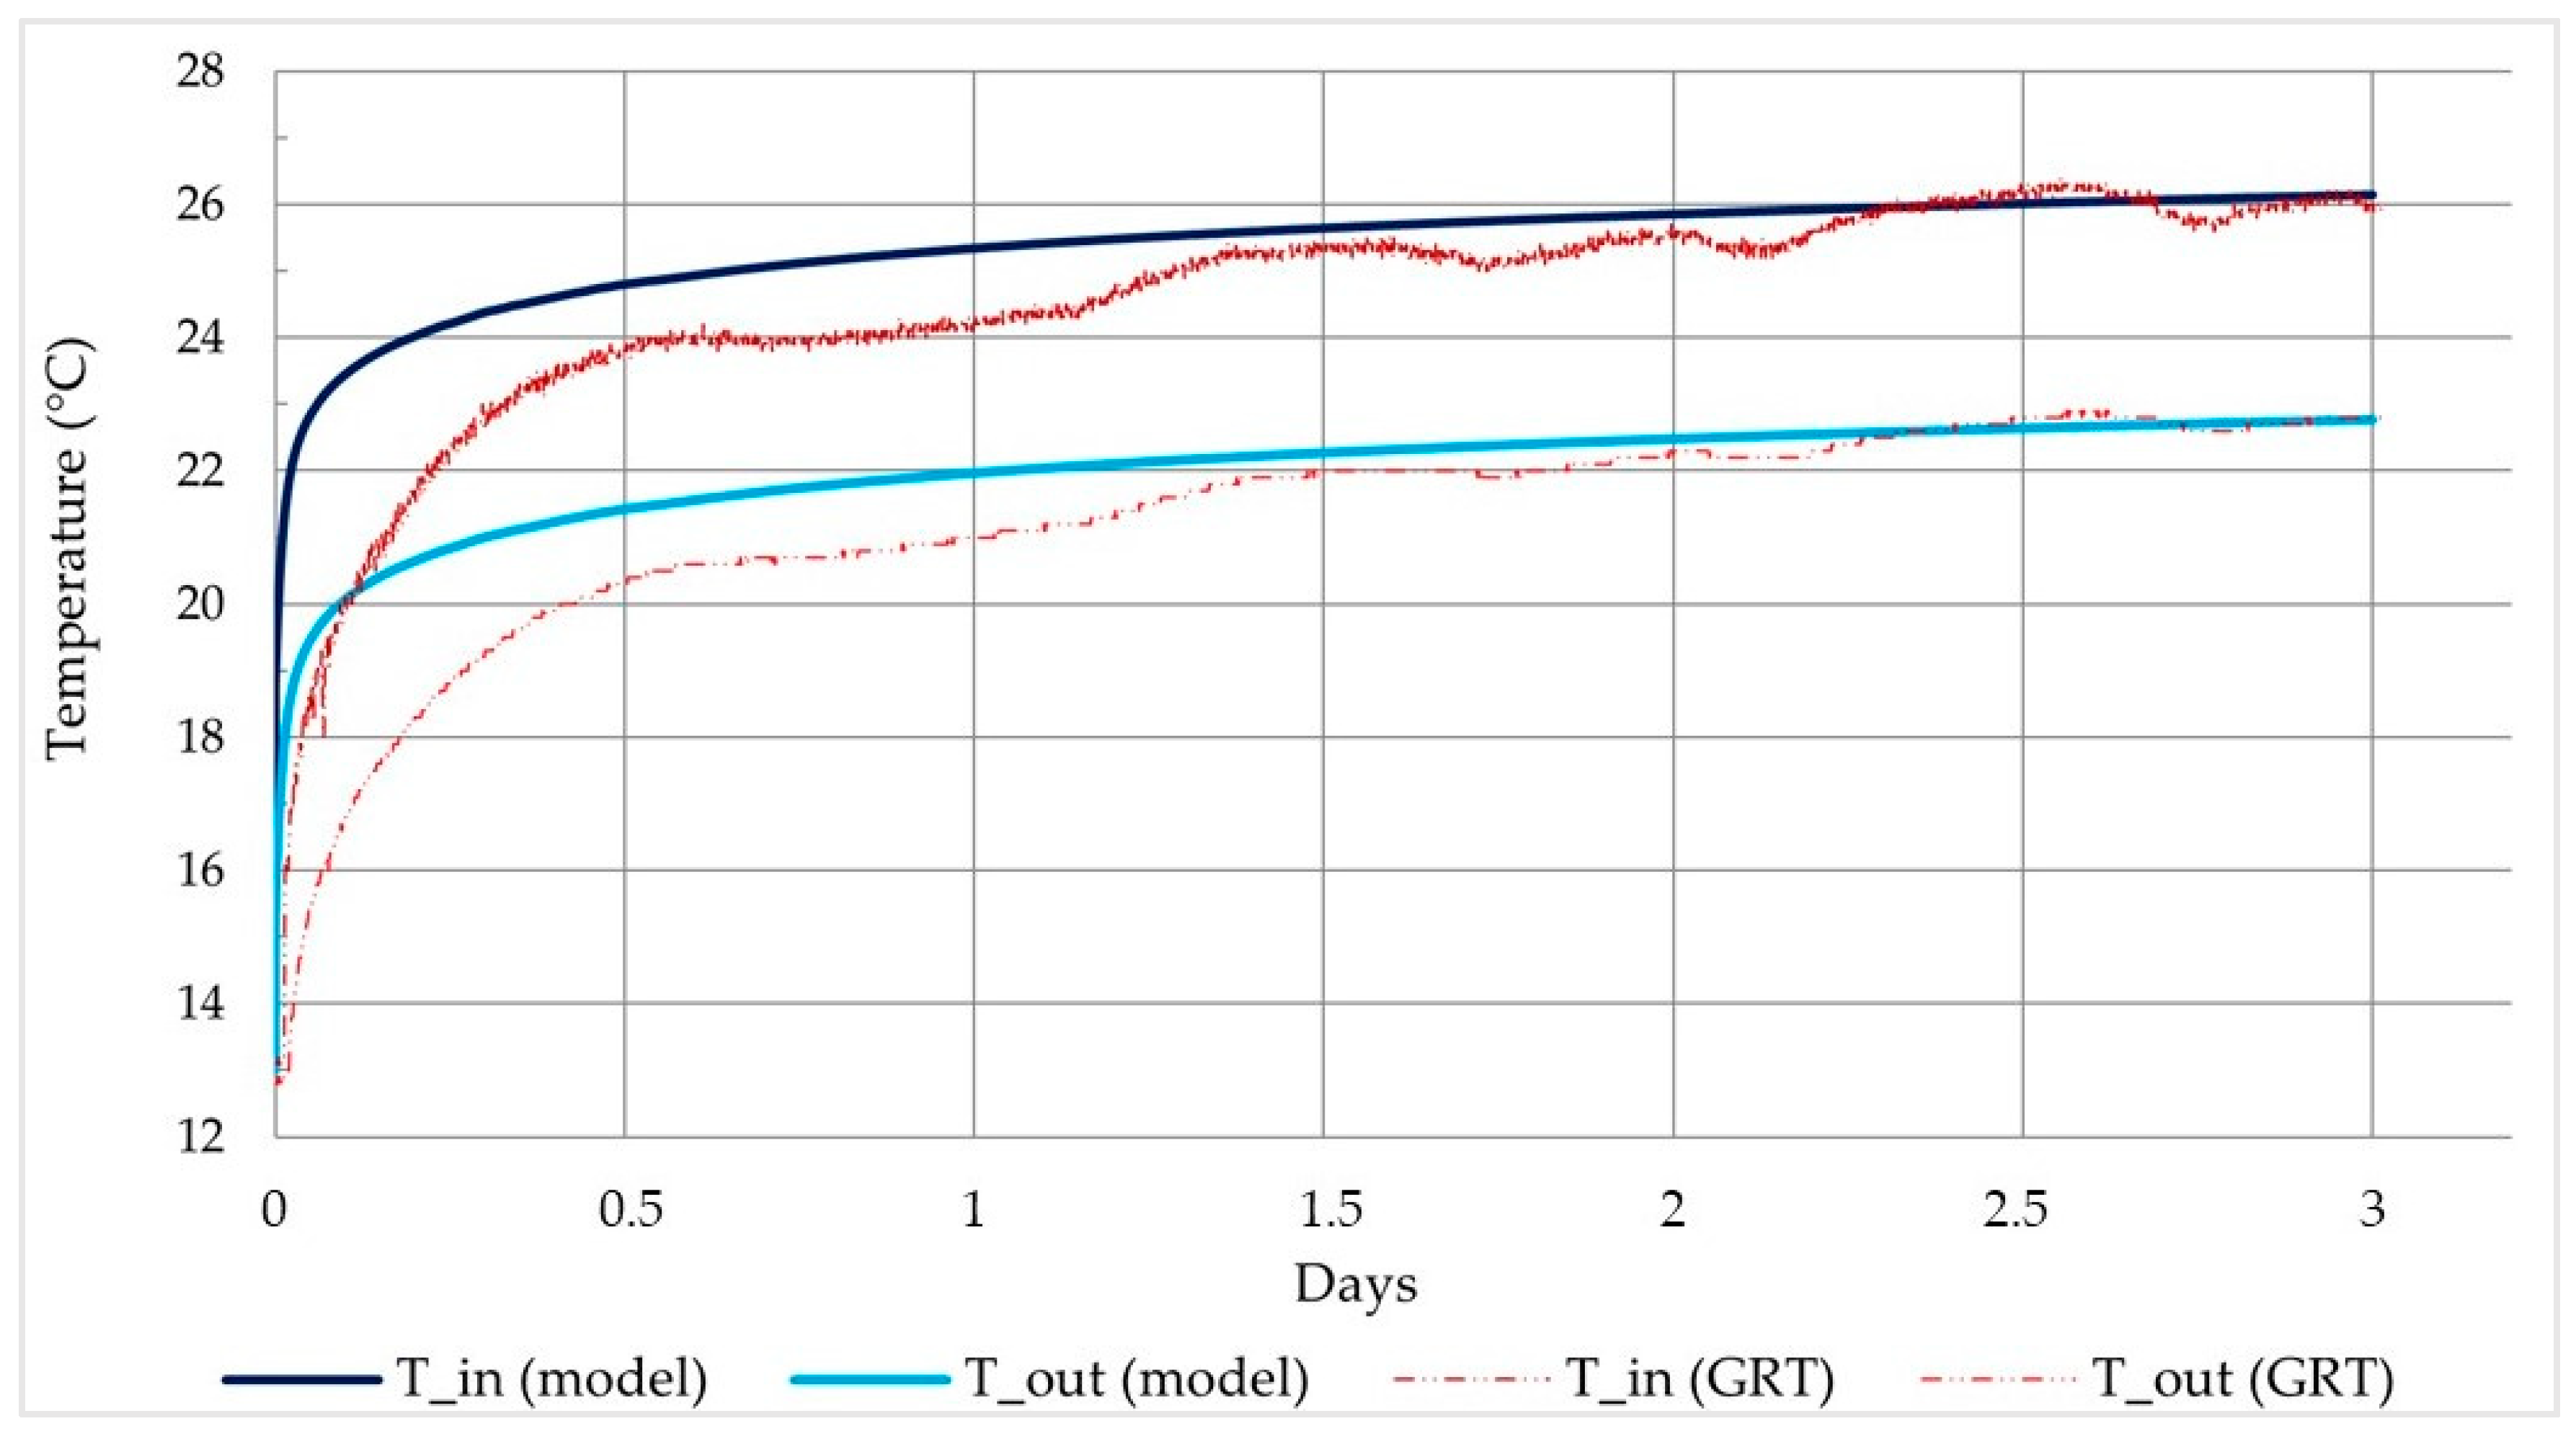
The borehole configuration, was also the result of the previous back analysis of the field GRT, as presented in Section 3.3. It allowed geological, hydrogeological, and thermo-physical parameters as close as possible to real conditions to be obtained; results from field and simulated GRTs fit perfectly, as demonstrated in Figure 5. A good agreement was then reached, especially after 1.5 days from the beginning of the test.

4.1. Geological, Hydrogeological, and Thermo-Physical Model

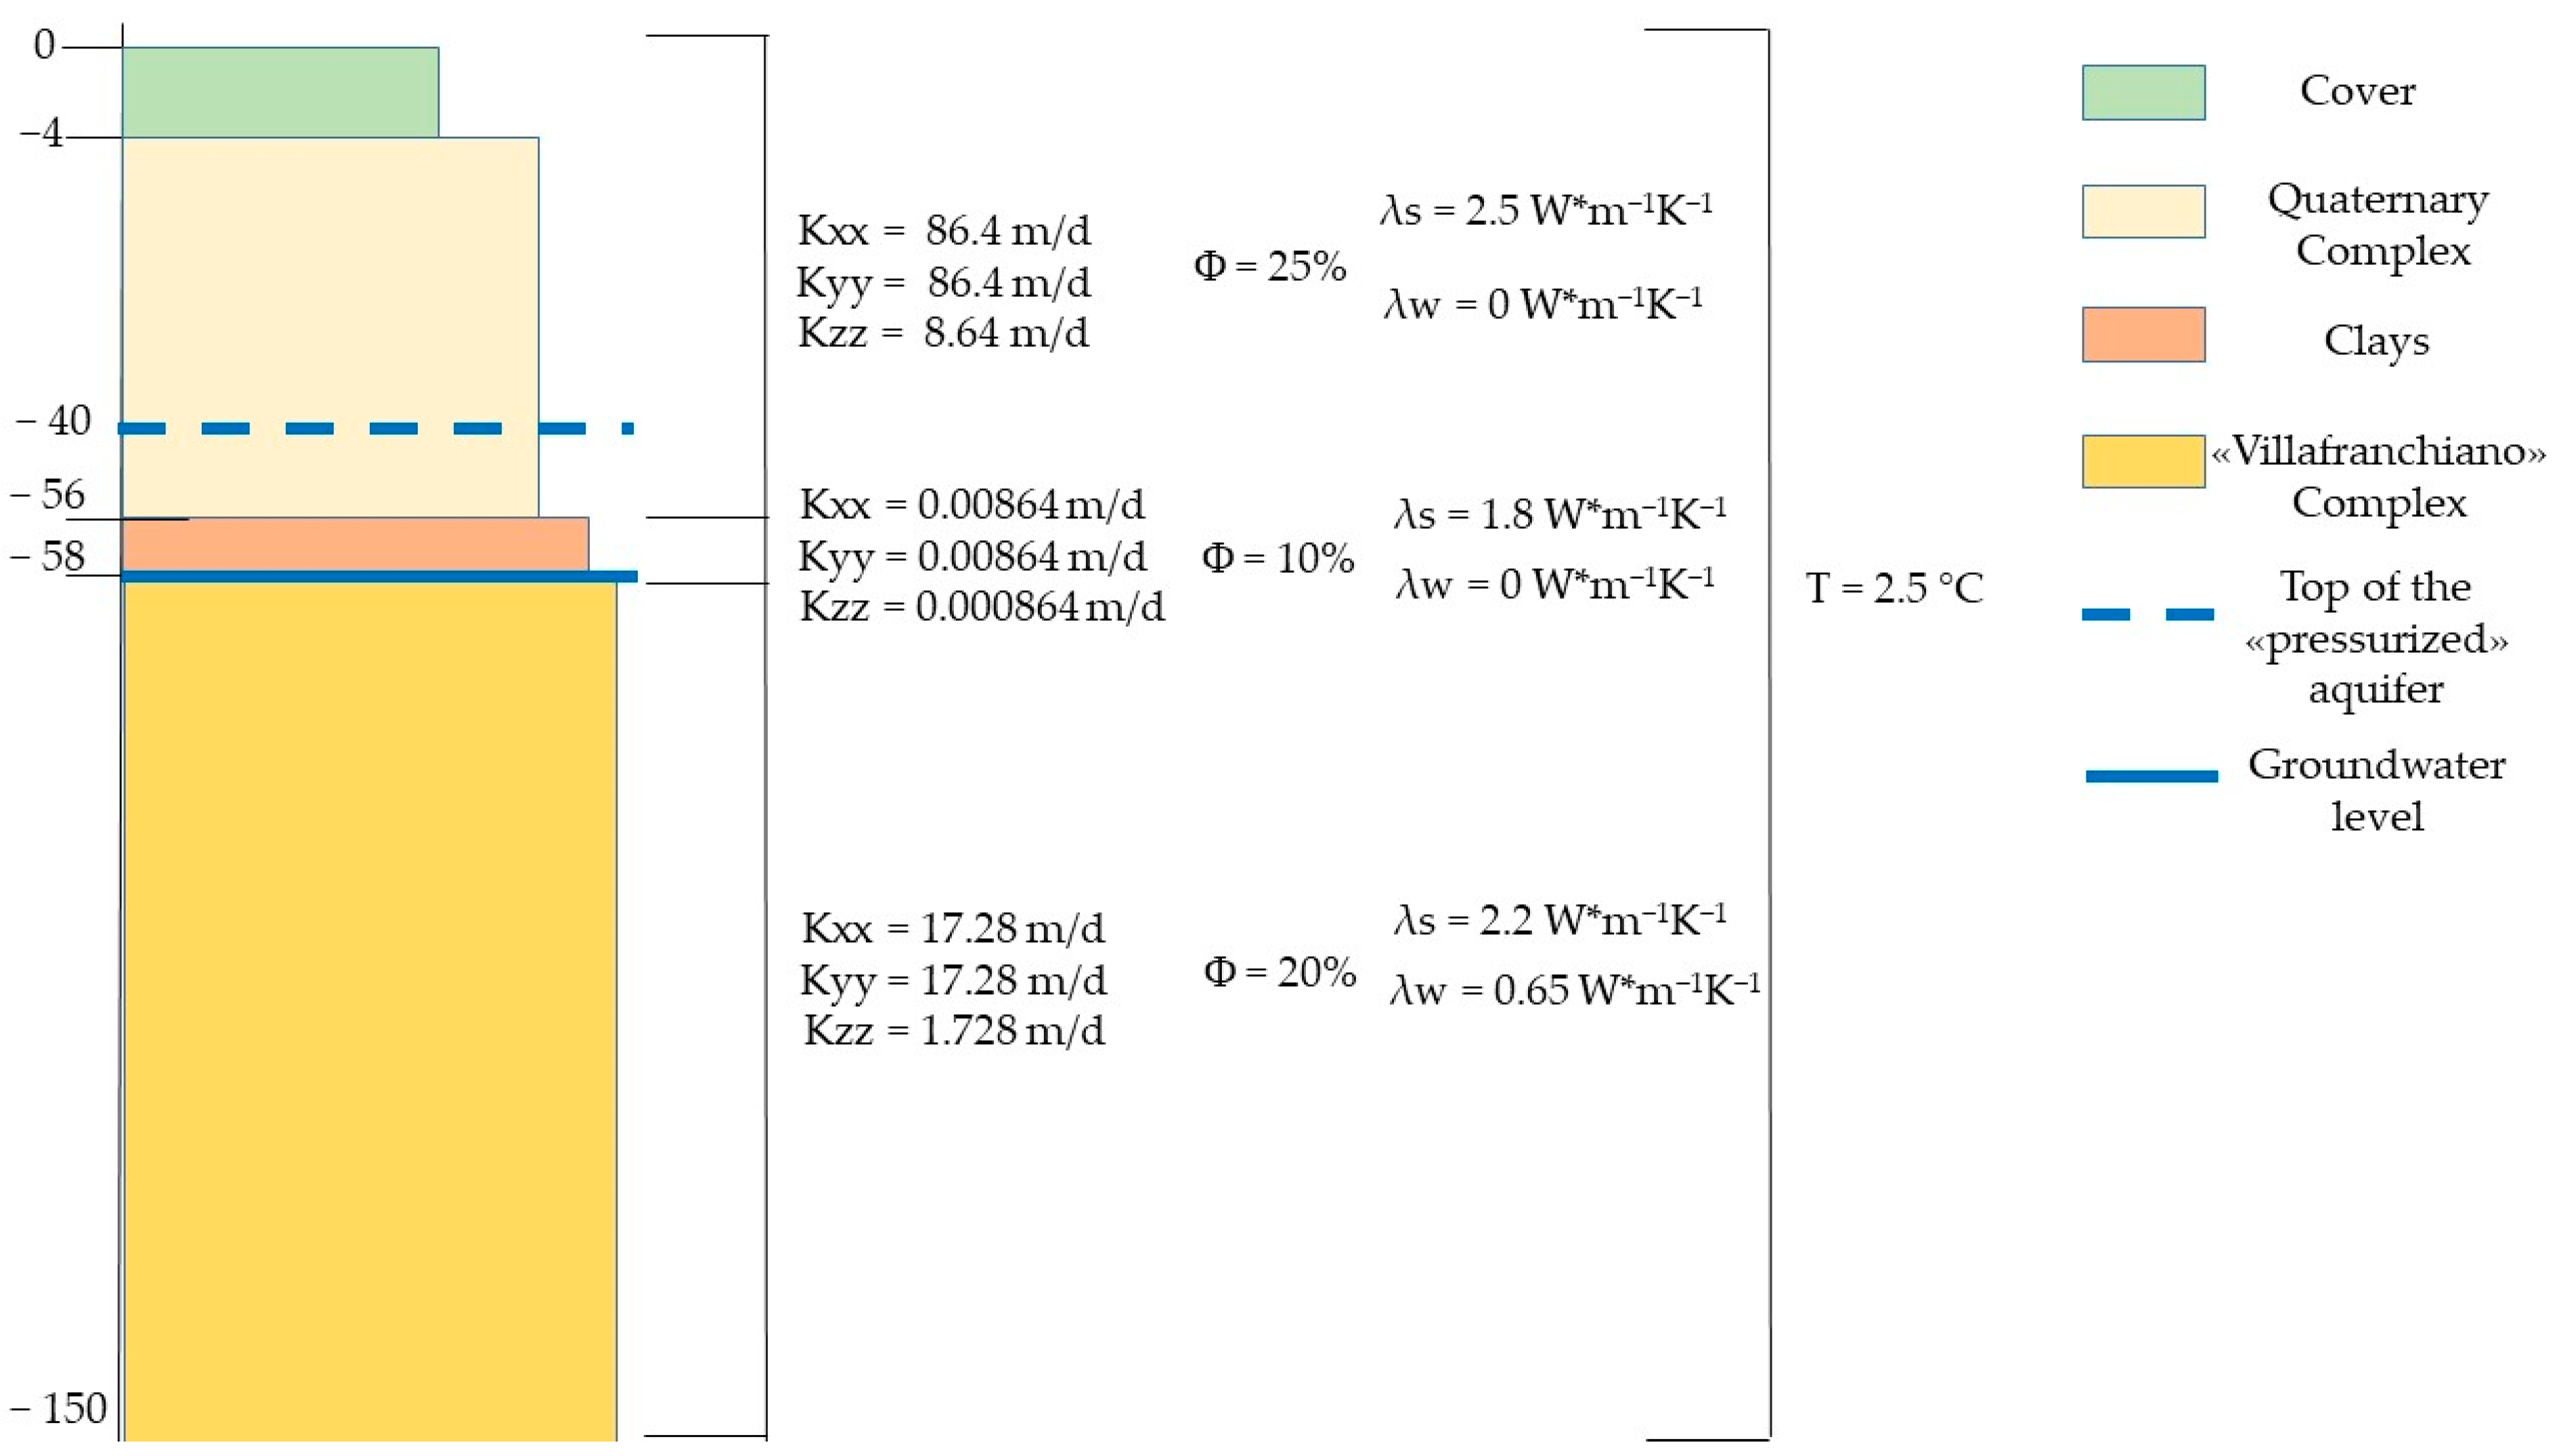
As described in the previous sections and represented in Table 1, the investigated site is characterized by two important geological units, including the “Quaternary” complex, consisting of conglomerates and gravels, and the “Villafranchiano” complex, representing a succession of clays and gravels with subordinate gravels and sands. These lithological characteristics have been differentiated in the numerical simulations through their different hydraulic heads in the X, Y, and Z directions, their different porosities and thermal conductivity values (Figure 6); all these data were achieved as close as possible to real parameters, thanks to an accurate calibration of the hydrogeological model.
Furthermore, hydraulic boundary conditions were then applied to the entire investigated domain, to correctly define the presence and the direction of the groundwater level, at −58 m below the ground.
Moreover, the geothermal gradient and the thermal flux were not evaluated because thermal anomalies were not detected in the investigated area.

4.2. Geometrical and Thermo-Technical Model

The geometrical model was defined by a triangular super-mesh, which is particularly suitable for a complex matrix (Figure 7). This kind of mesh also allows for a specific global refinement and a further mesh smoothing to avoid irregular-shaped elements or obtuse-angled triangles; for this geometrical model, a point gradation of 2 as well as 0.2 m for polygons and the point target size, together with a check for obtuse angles and triangles violating the Delaunay criterion, was conducted.
The calculations were computed on each active node of the finite element mesh using the Algebraic MultiGrid Solver (SAMG). The SAMG was used due to its ability in solving complex matrices because it is the fastest and most robust, and its usefulness and efficiency have been proved in several applications in the field of solid and fluid mechanics [35]. Furthermore, a local refinement was performed, aiming to better discretize the point at which to place each BHE; this allowed a greater mesh quality to be obtained because the denser the mesh, the better the numerical accuracy. Thanks to the 3D layer configuration tool, it was possible to extend the original 2D model with prismatic elements and divide it into a total of seven slices at different depths in a modelled area of 90 × 90 × 180 m. The slices represent the top and the bottom of each underground layer; they were set as highlighted in Figure 7. Precisely, the layer at −58 represents the groundwater level, while the layer at −150 m represents the BHEs’ bottom.
About the thermo-technical model, it was characterized by seven BHEs equipped with double U geothermal pipes, consisting of polyethylene material (PE100 RC) and with conventional characteristics as follow (Table 2).
These detailed features were put in the numerical model through the borehole heat exchanger BC tool; this function was also used to set the circulation of the heat transfer fluid through the geothermal pipes, consisting of water with a 5% of glycol and a flow rate of 35 m3/d corresponding to 0.41 l/s. This kind of temperature ensures a great heat transfer to the surface, depending on the undisturbed ground temperature, and complies with the Italian laws about the classification and use of geothermal resources.

5. Results

The results of the study refer to two different aspects:
  • specific ground temperature measures and monitoring of the grout ageing;
  • real geothermal plant simulations (short- and long-term)

5.1. Monitoring of the Grout Ageing and Ground Temperature

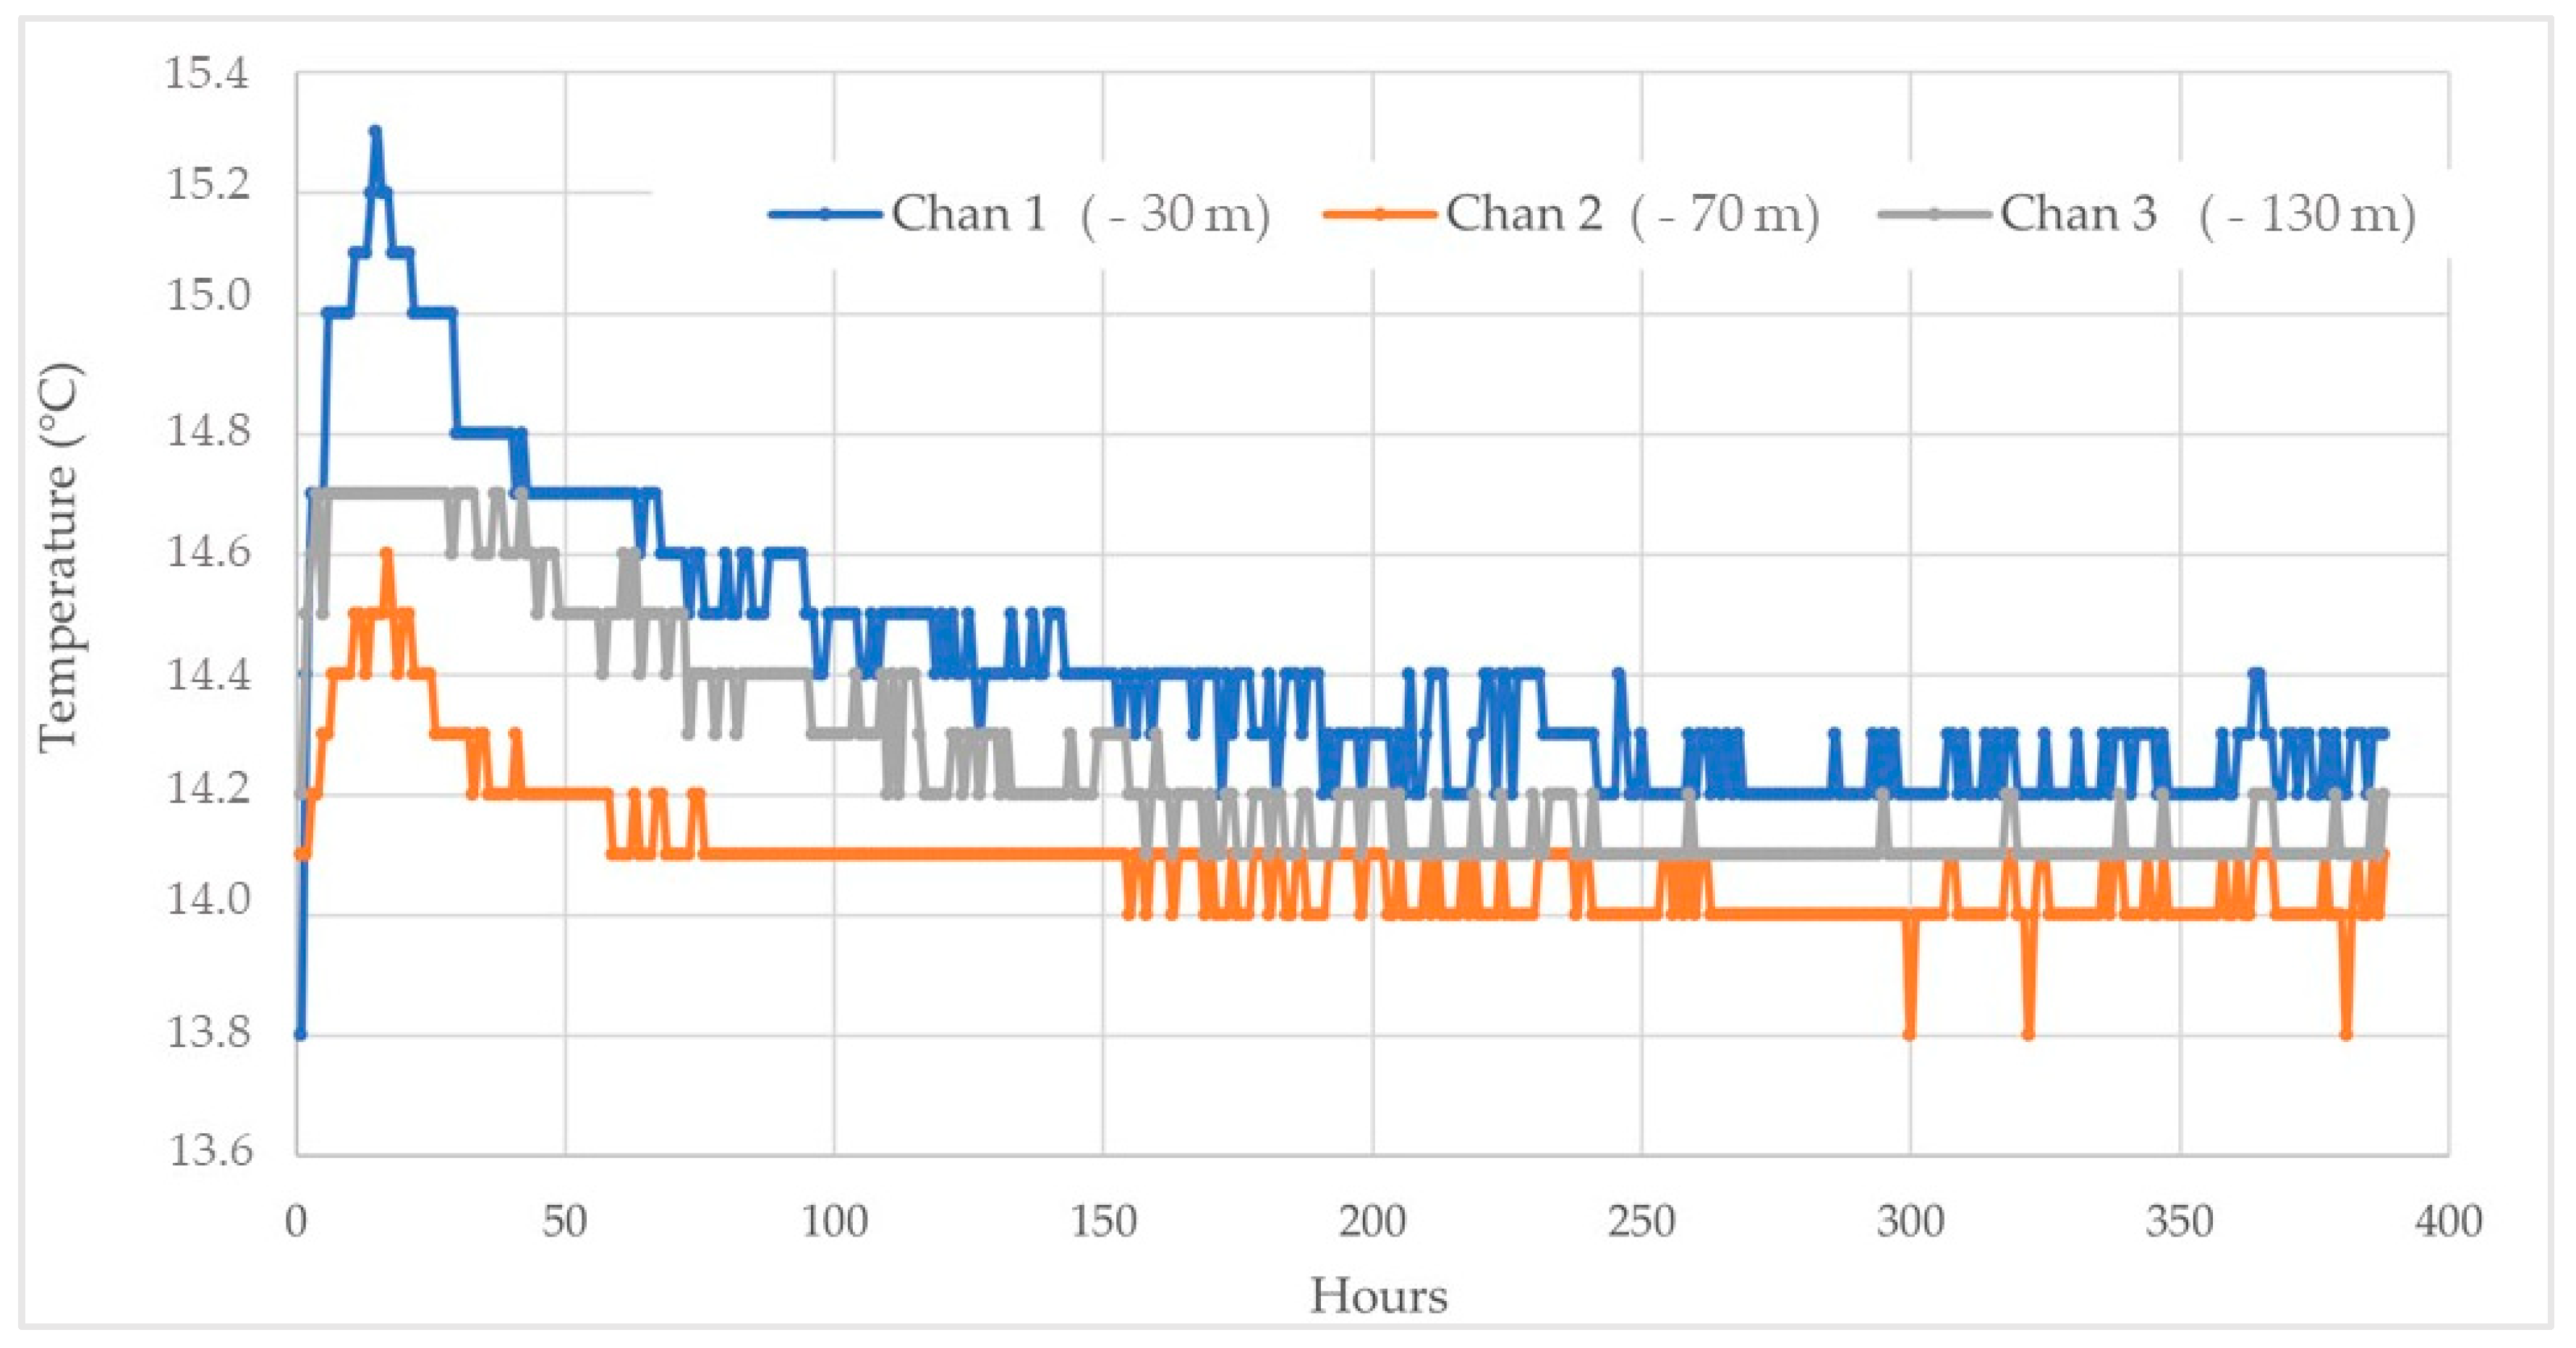
A first set of measurements was carried out, recording continuously at −30, −70, and −130 m through three PT100s (wire thermo-resistances, with a precision of 0.1 + 0.0017 * |t|) placed inside the geothermal grout, as described in Section 3.1 (Figure 8).
The results show that after just over 6 days of grout ageing (corresponding to about 150 h), the ground temperature stabilized both in dry conditions at −30 m (with negligeable variations between 14.3 and 14.2 °C) and in wet conditions at −70 m (between 14.2 and 14.1 °C) and at −130 m (between 14.1 and 14.0 °C).
From the sixth day to the end of the monitoring, each channel displayed almost the same values with negligeable variations (between 14.0 and 14.3 °C).
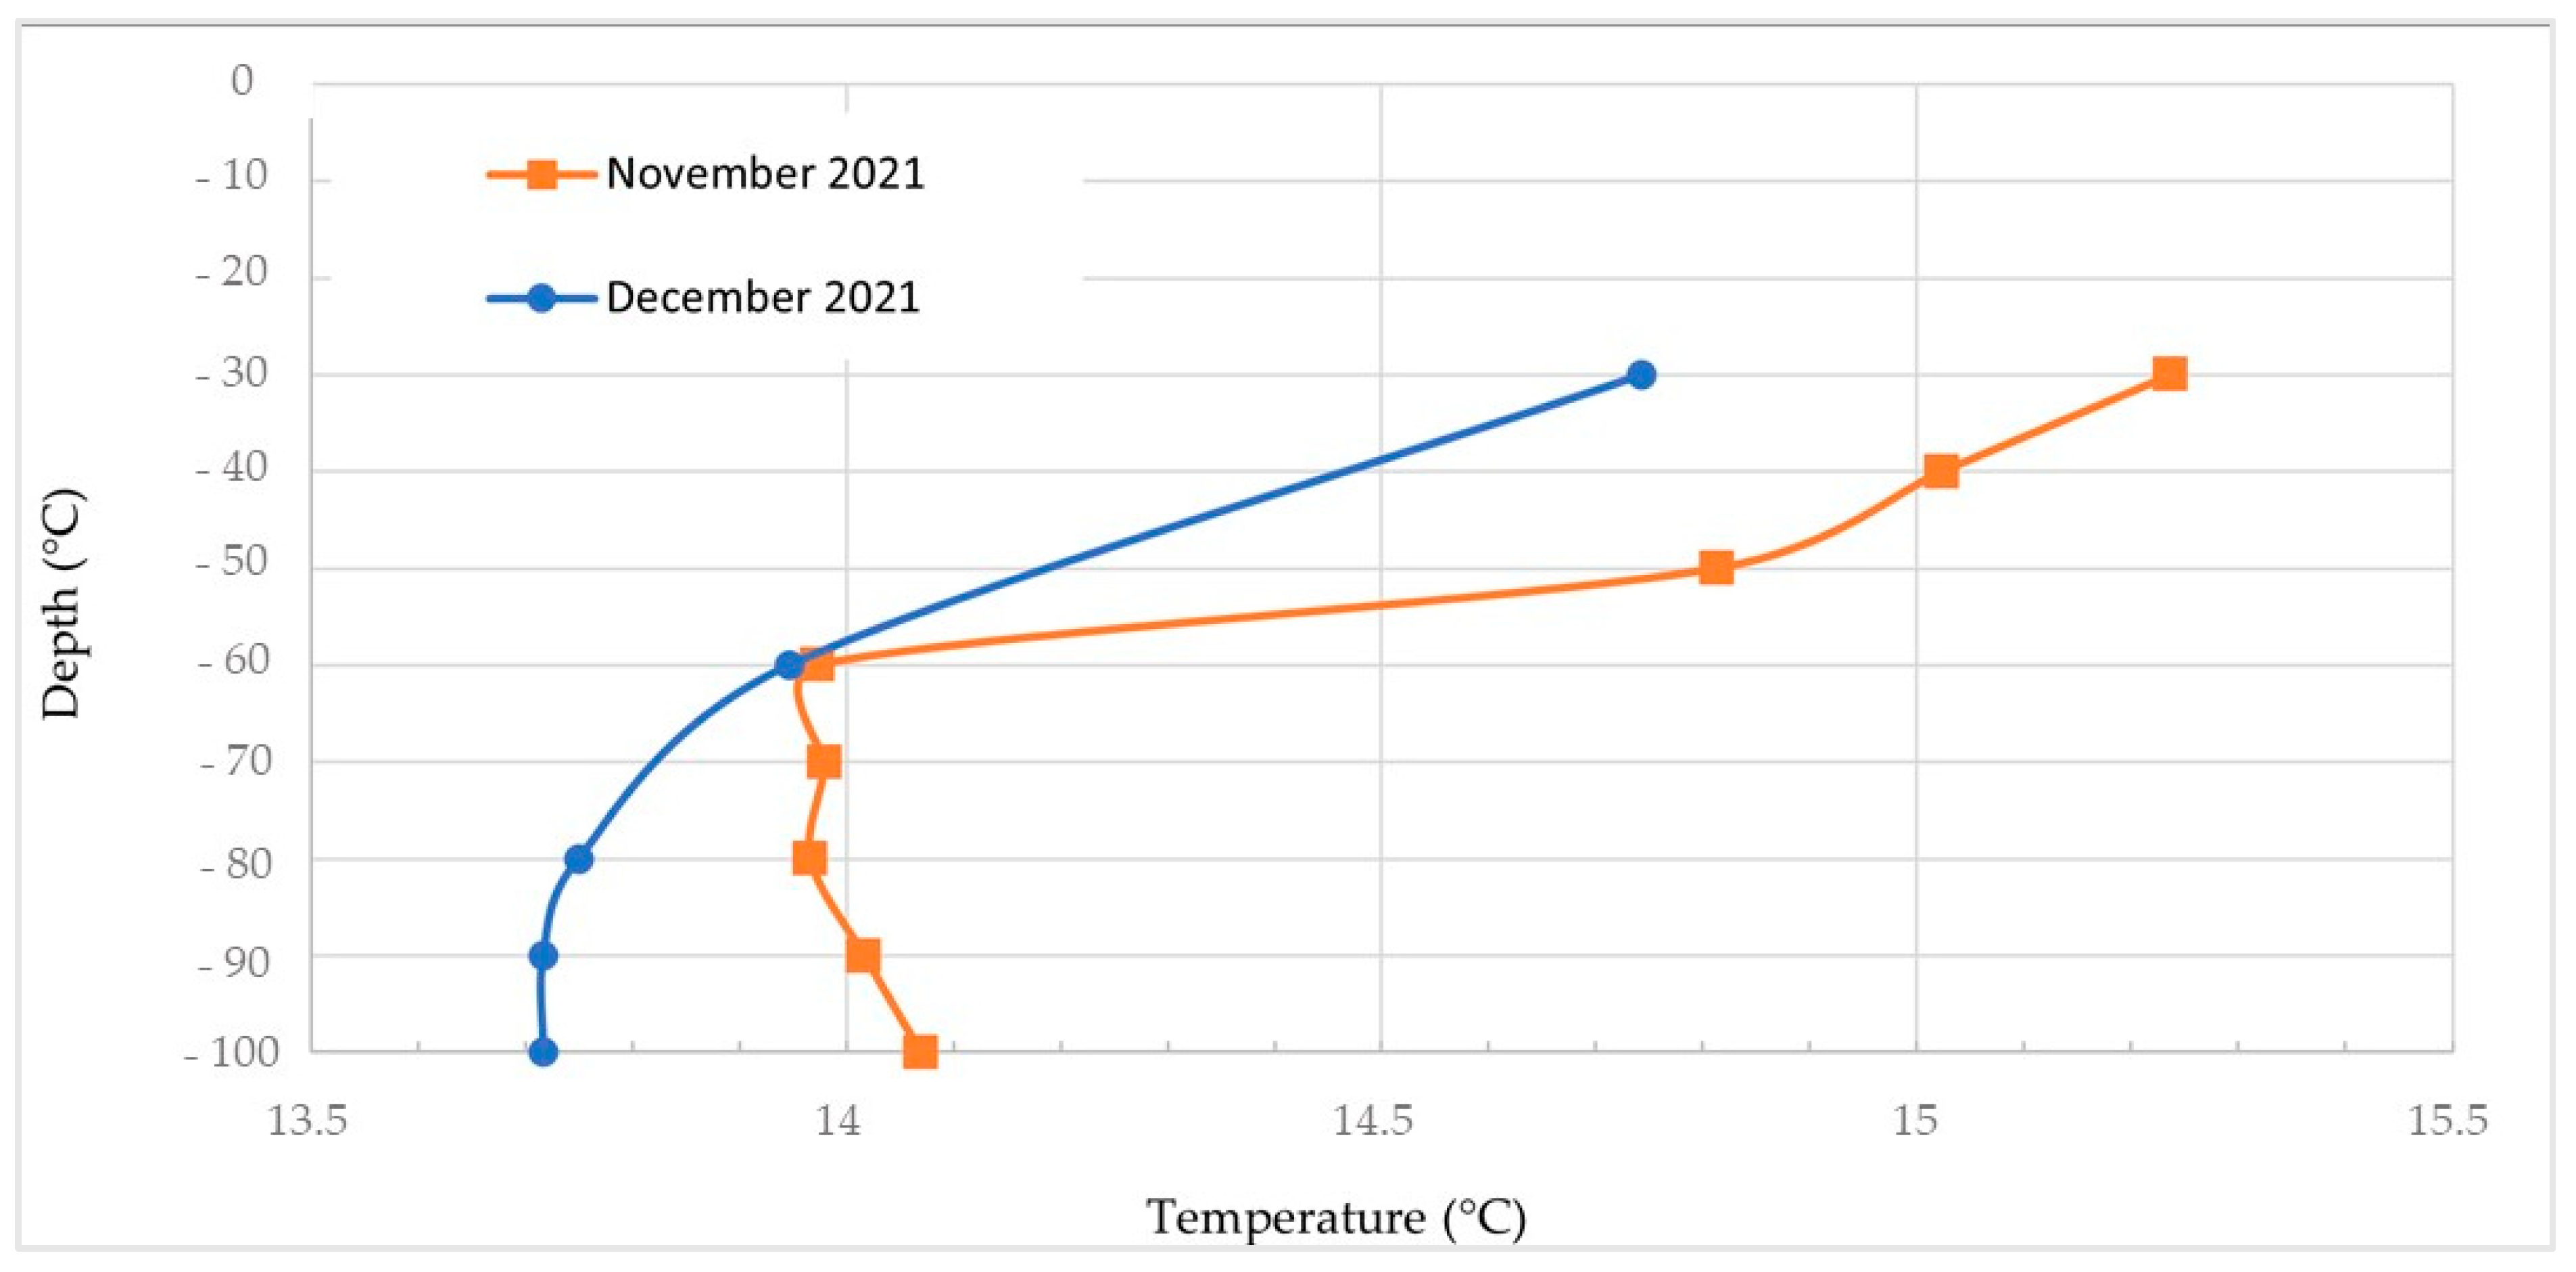
In addition, two different logs were accomplished in November (a few days after the drilling of the borehole) and December 2021, aimed at evaluating temperature of the water inside the geothermal pipe (Figure 9) using a Mini-Diver by Van Essen Instruments (range: −20 to 80 °C, accuracy: 0.1 °C, resolution: 0.01 °C). Both highlighted a change at about −60 m, representing the level at which the temperature values started to stabilize with the depth. This matches with the variations in the hydrogeological conditions due to the presence of the groundwater level at −58 m. The second log shows a temperature slightly lower than the previous one, according to the smoothing of the ageing effect of the grout that produced an increase in the ground temperature for some days.

5.2. Real Geothermal Plant Simulation

One of the main purposes of this study was to understand if the ground can satisfy the plant’s energy needs and if its performance would be stable over long periods. This was tested in two different conditions:
(a)
switching the plant on over 120 days without any interruption, representing the four months with the greatest thermal energy demands (colder months);
(b)
switching it on over 120 days followed by switching it off during the remaining months over a period of 5 years.

Continuous Plant Operation over Four Heating Months

Aimed at defining the thermal behavior of the ground during the plant operation and the plant’s efficiency during the colder months, when the greatest energy needs are required, a period of four months corresponding to 120 days of heating, was considered. This is the worst case to represent because it is very unlikely that a heating system works 24 h a day over four months.
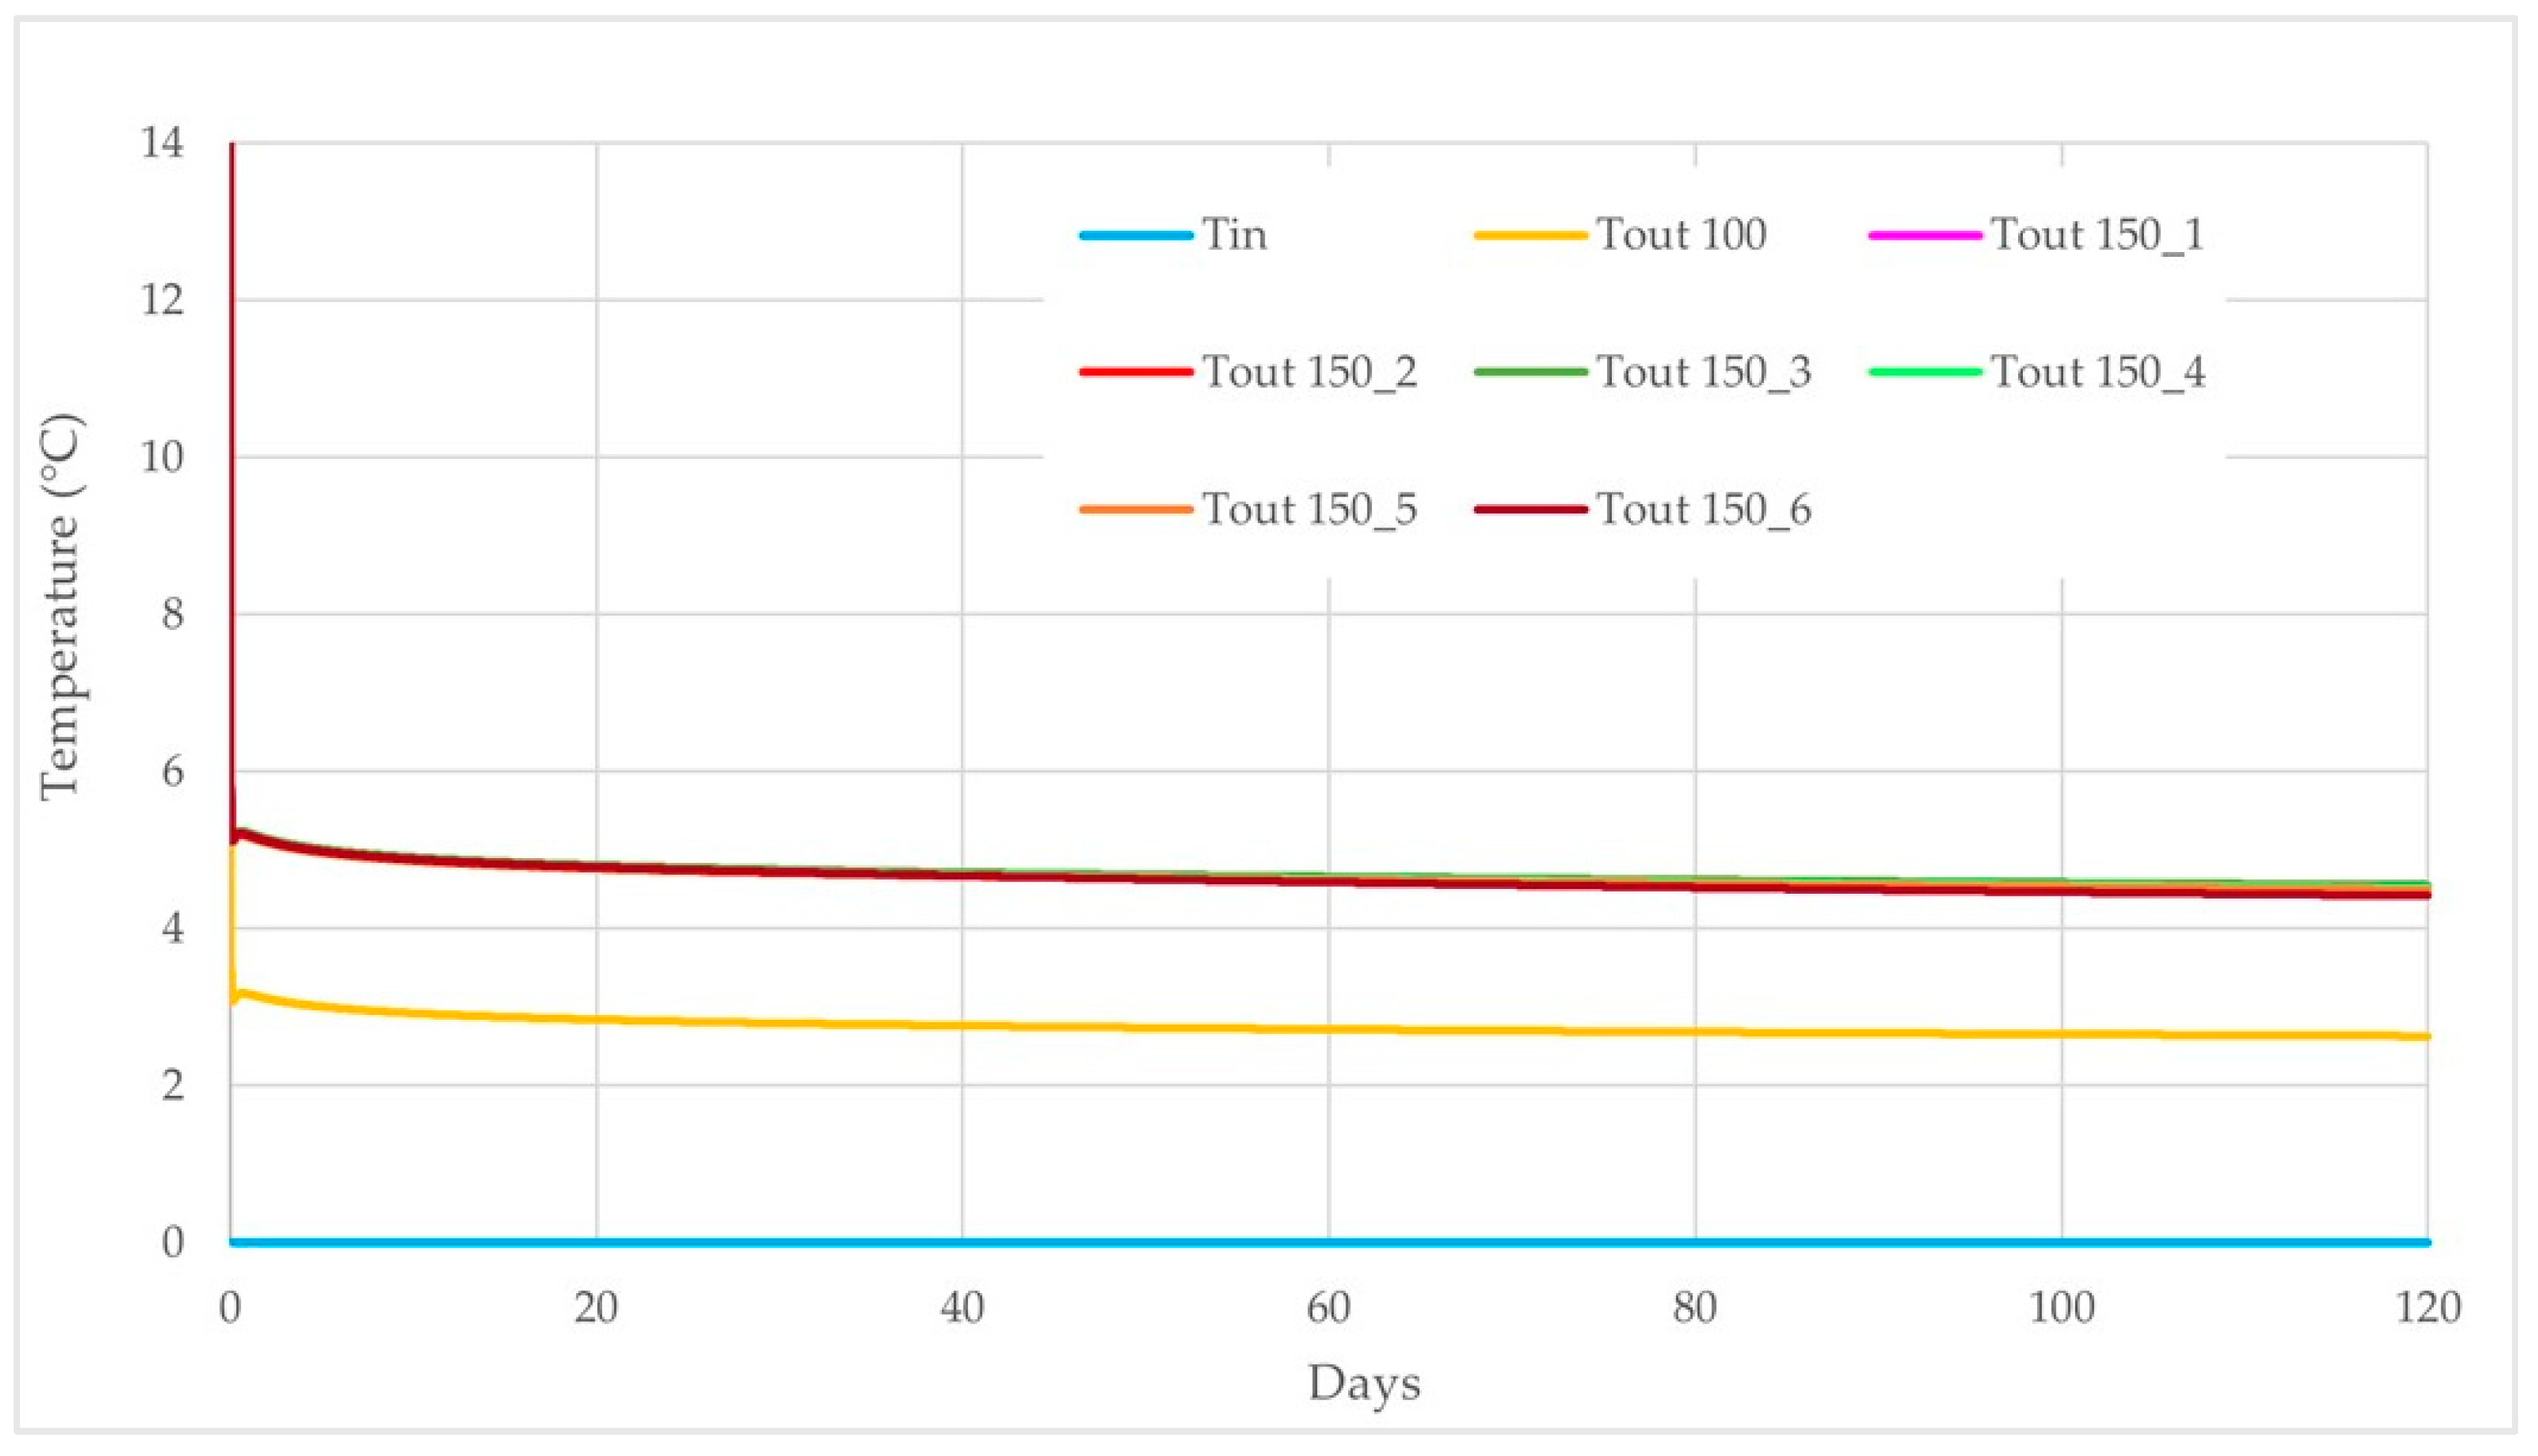
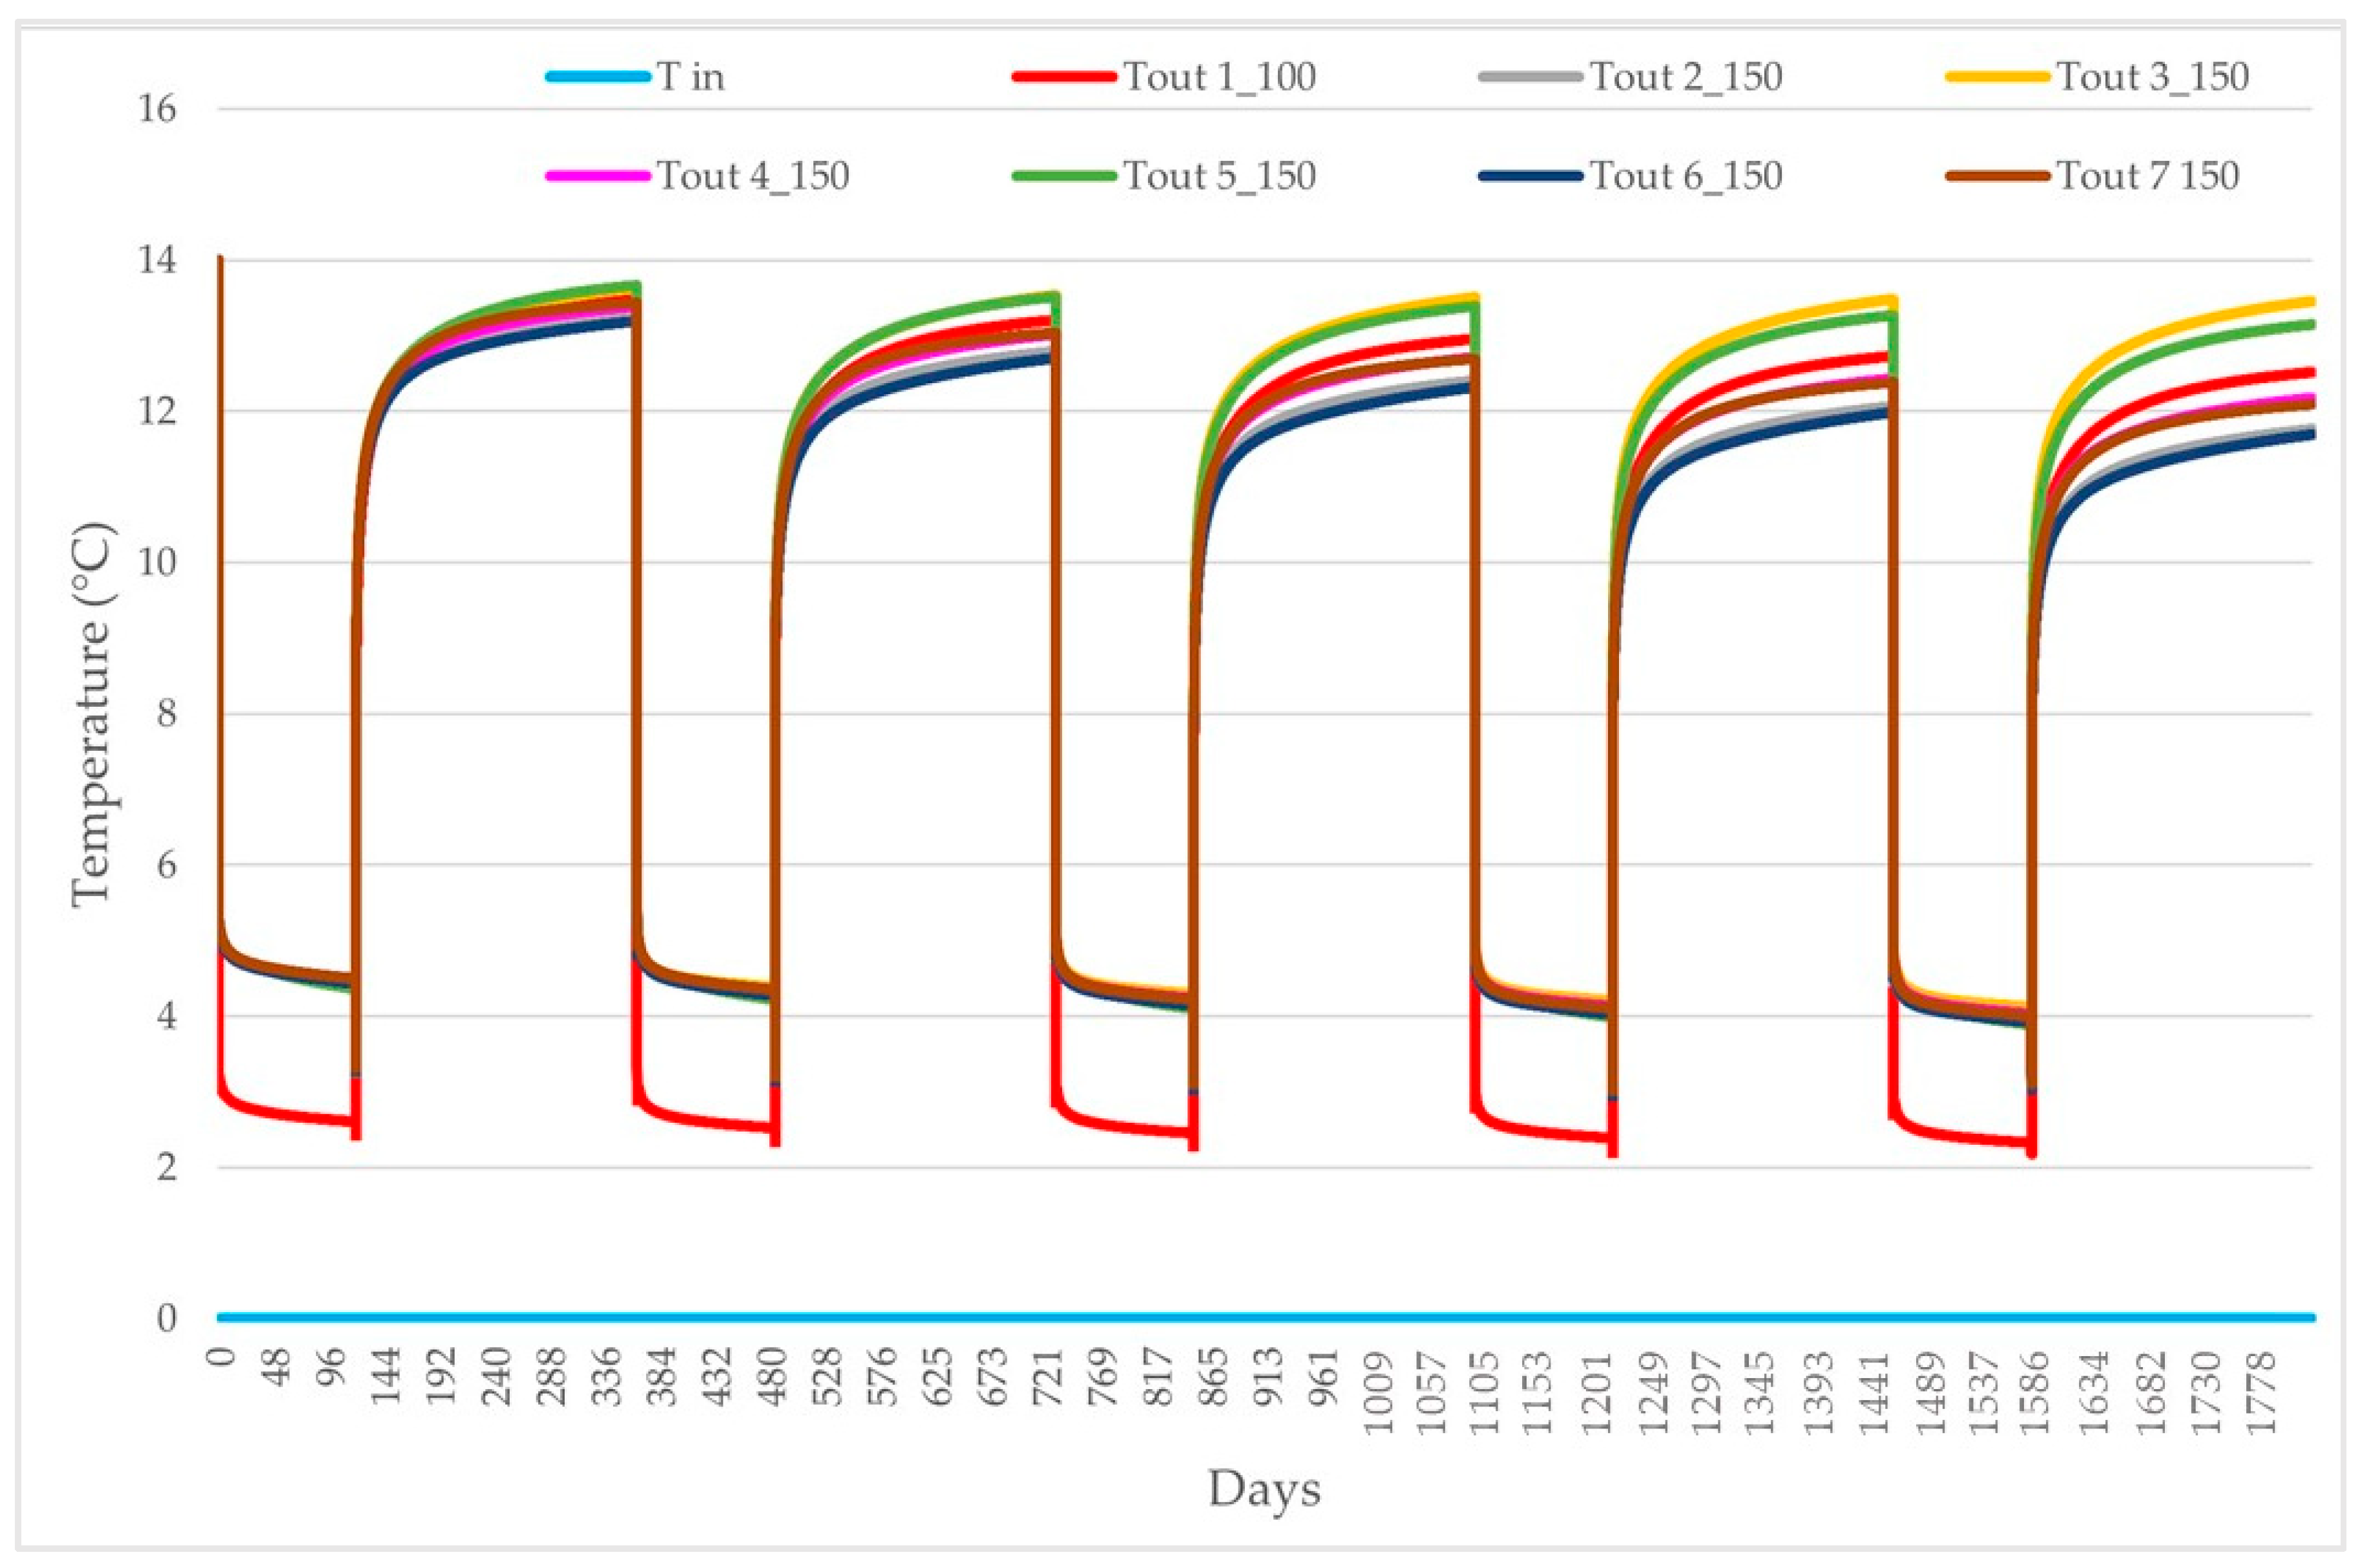
Refrigerant fluid at 0 °C was continuously injected into the inlet geothermal pipe while leaving the outlet pipes at the end of the simulated heating cycle at slightly different temperatures depending on the depth of the boreholes (Figure 10). Precisely, the pilot pipe used for the field GRT at −100 m deep recorded an outlet temperature of 2.63 °C, while the other geothermal pipes at −150 m deep displayed outlet temperatures ranging from 4.42 to 4.56 °C (Figure 10), with a greater temperature difference (TinTout) than the pilot one. Furthermore, curves representing the six outlet pipes at −150 m overlapped, showing the same linear trend during the entire simulation time. Generally, after the first hours of operation, all curves showed a steep decrease, reaching temperature values very close to those recorded at the end of the simulation and, thus, maintaining a linear trend.
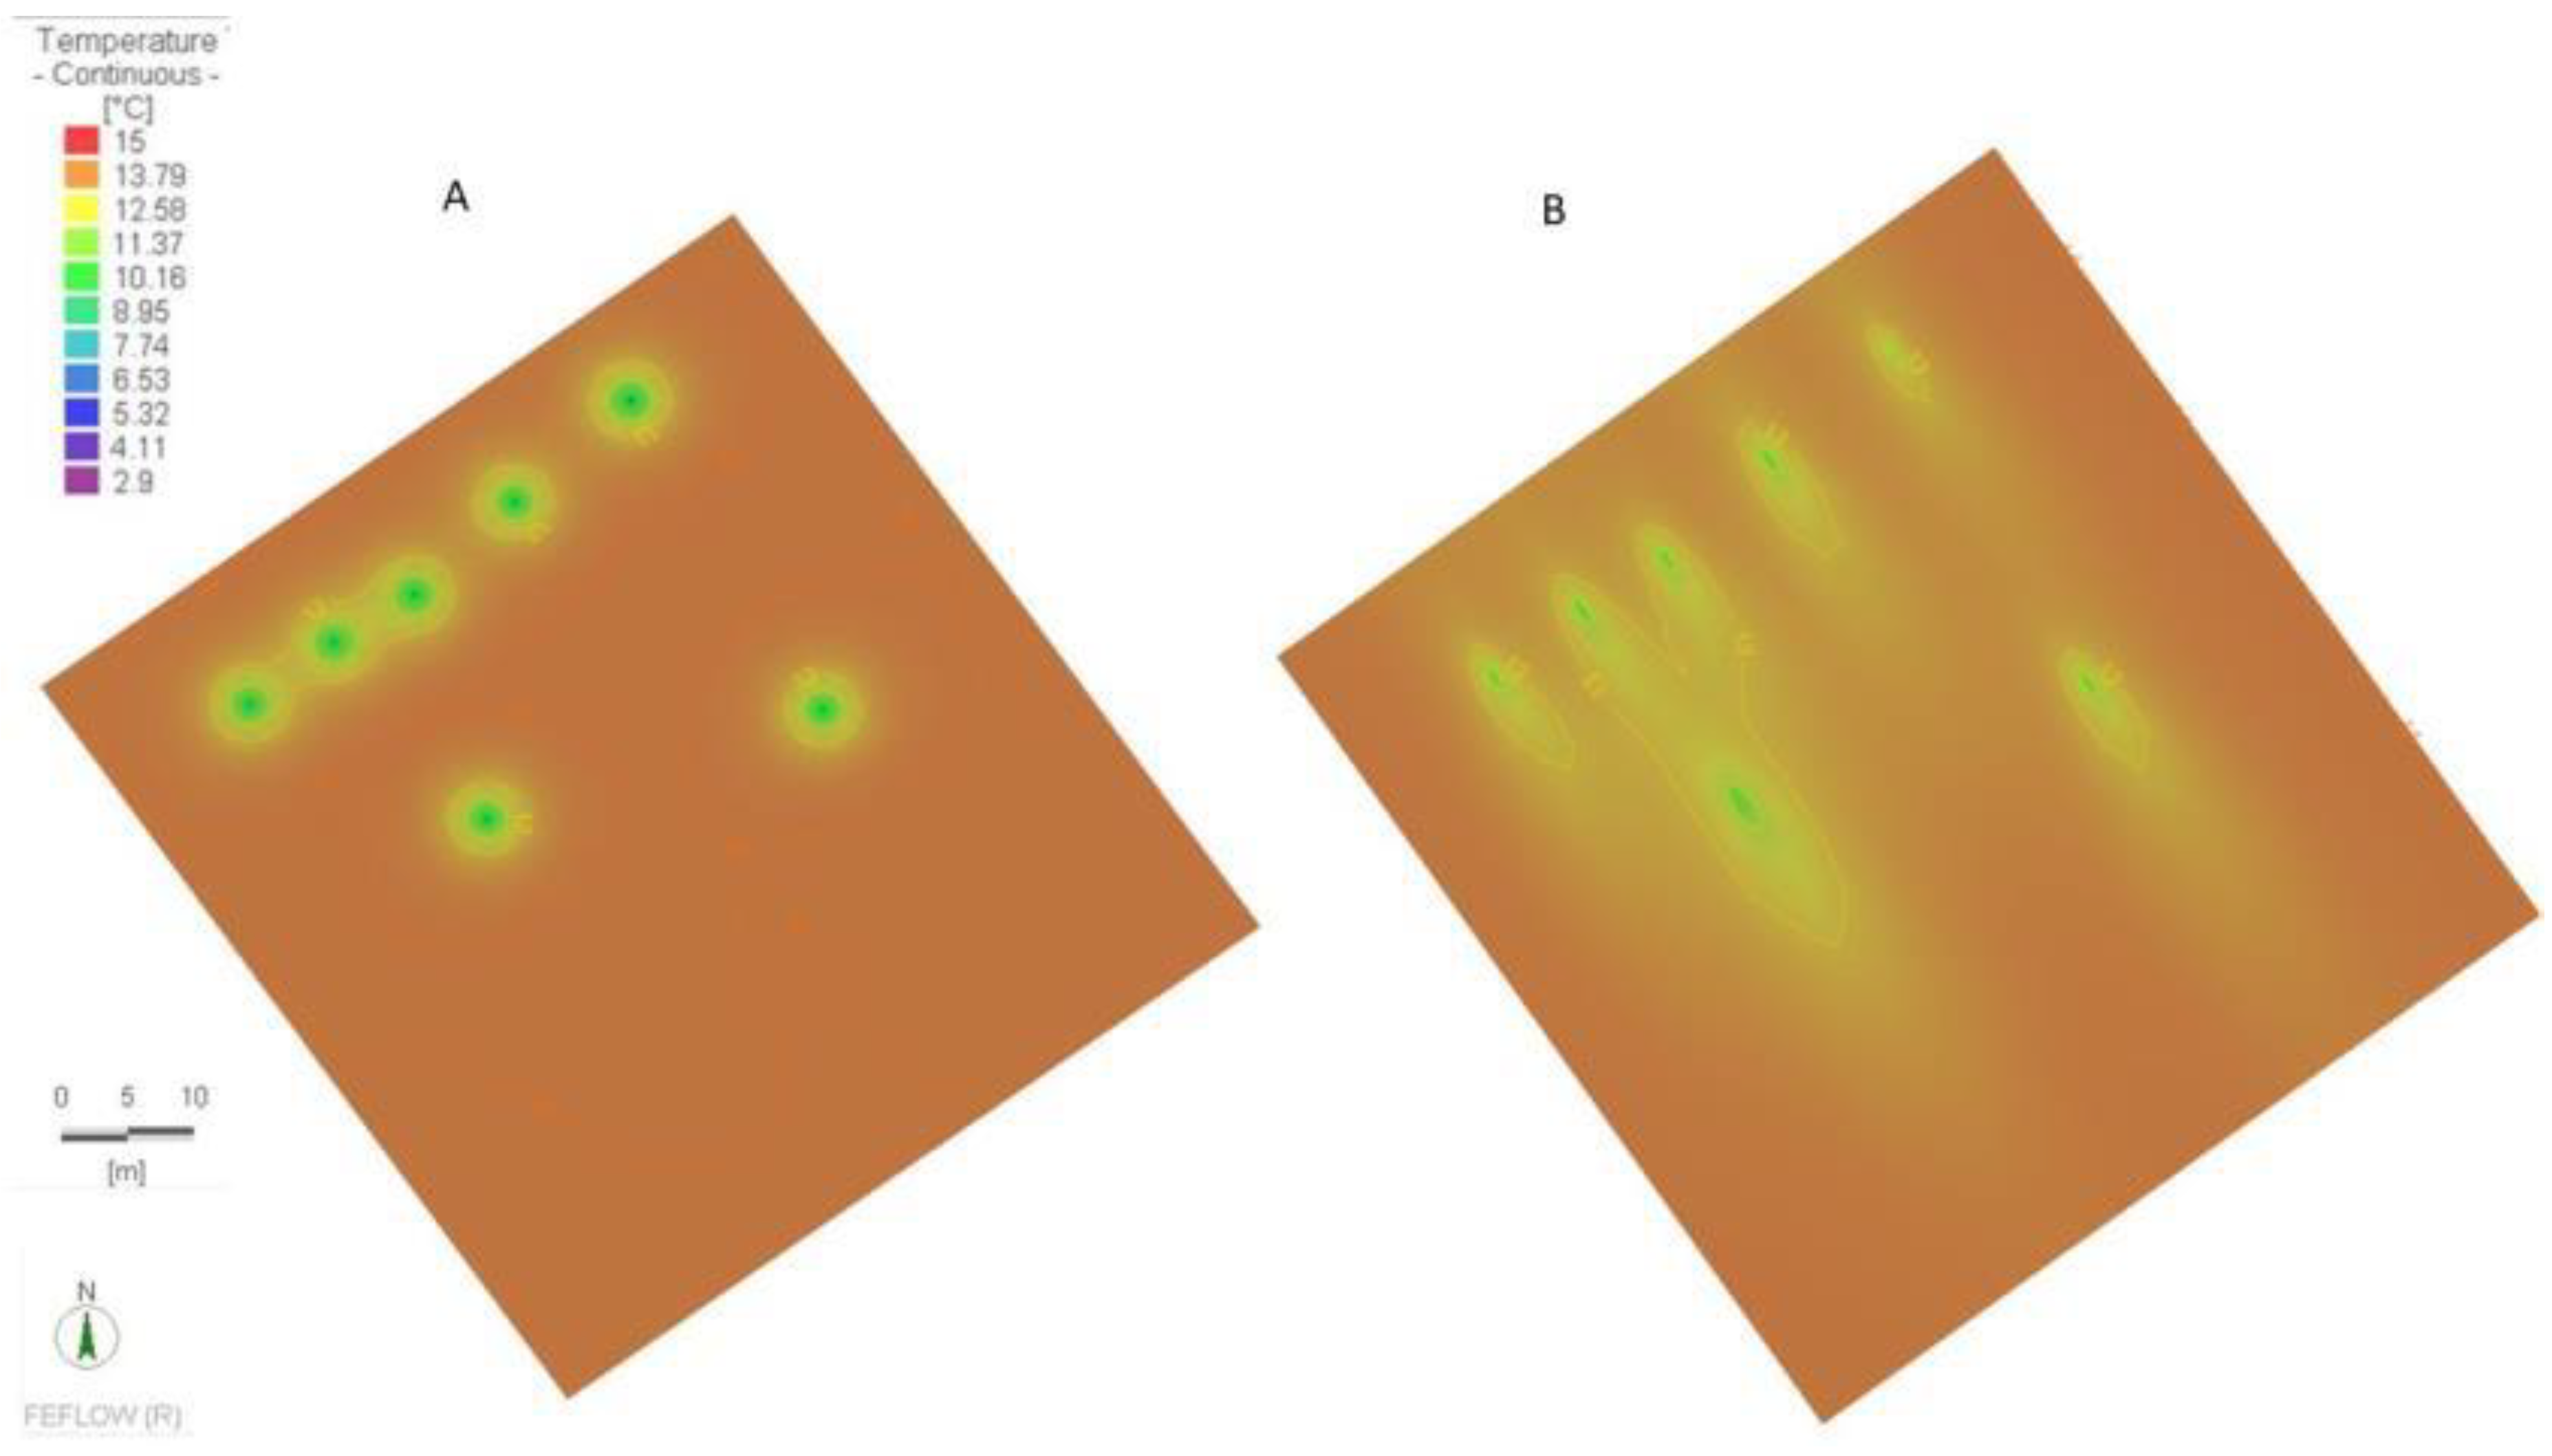
Figure 11 shows thermal plumes around and along the BHEs at the end of the simulation. It clearly defines how groundwater is important in increasing the heat transfer through its advective component and, thus, how the thermal plume can extend, following the groundwater flow direction only in wet conditions, while the thermal plumes are very limited and rounded in the first part of the boreholes with dry conditions. Moreover, these results show that switching on the plant continuously over four months does not produce any thermal interference between the BHEs.

5.3. On and Off Cycles over Five Years’ Operation

An on/off-cycle numerical simulation over a period of 5 years was also set. The plant was switched on for 120 days during the colder months, while it was switched off for the remaining 8 months (Figure 12). Of course, the time steps in this case were longer than in the previous numerical simulations (to save calculation times), and the main purpose was to check whether the performance evolved over long operation times.
Figure 12 shows well how the outlet temperatures maintained the same trend during the entire switched-on cycle over the five years, both for the pilot pipe at −100 m in depth (red line) and for the other pipes at −150 m deep. When the plant was switched on, the temperature values became more stable from the fourth year of operation, especially for the geothermal pipes at −150 m deep. Differently, at the end of the four months of the first year of operation, the temperature difference (ΔT, TinTout) from the geothermal pipes at −150 m in depth was 4.55 °C, decreasing to 2.62 °C in the pilot pipe at −100 m in depth. In the last year of simulation, ΔT stabilized at 4.14 °C for the deepest geothermal pipes, reaching 2.33 °C in the pilot pipe. Furthermore, when the plant was switched off, the thermal recovery of the ground around the boreholes was relevant and was maintained within 1 °C of the undisturbed ground temperature of 14 °C while progressively differentiating inside each pipe, especially from the third year of operation; however, it always maintained reasonable environmental values (i.e., between 11.7 and 13.45 °C).

6. Discussion and Conclusions

Modelling the energy production of a geothermal plant consisting of several borehole heat exchangers (BHEs) could be very complex, and many authors in recent years have dealt with this topic [23,36,37,38,39]. This is due to the numerous parameters which characterize the underground volume hosting the BHEs. Some hydrogeological parameters (i.e., groundwater flow direction, velocity, and hydraulic conductivity), as well as thermo-physical properties (i.e., thermal conductivity and undisturbed ground temperature) are often difficult to assess. However, these are key parameters in ruling outlet temperatures through pipes, as well as in creating thermal plumes around BHEs. Therefore, these variables are extremely important to understand the energy efficiency of a plant as well as to quantify its impact on the environment.
This study focused on the design of a shallow geothermal part of a hybrid heating system of a greenhouse. The first efforts allowed the undisturbed ground temperature to be defined and permitted an interesting evaluation about the ageing time of the grout used to seal boreholes and geothermal pipes. In this case, geothermal grout mostly thermally stabilized in the first six days. This is an important result because it allows a considerable reduction in times to wait from those recommended in the literature.
The numerical simulations provided data about the thermal energy production as well as the thermal behaviour of the ground during on and off plant cycles. Therefore, these sensitivity analyses allowed the number, size, and location of boreholes to be better-defined based on the calculated energy needs, ensuring a greater thermal efficiency of the plant.
Numerical simulations conducted over -short and -long periods of plant operation proved the geothermal plant to be able to meet the required energy demands. They allowed the temperature difference between the heat transfer fluid entering and leaving the geothermal pipes to be known, which is important for the calculation of the thermal power from each geothermal pipe (Equation (3)).
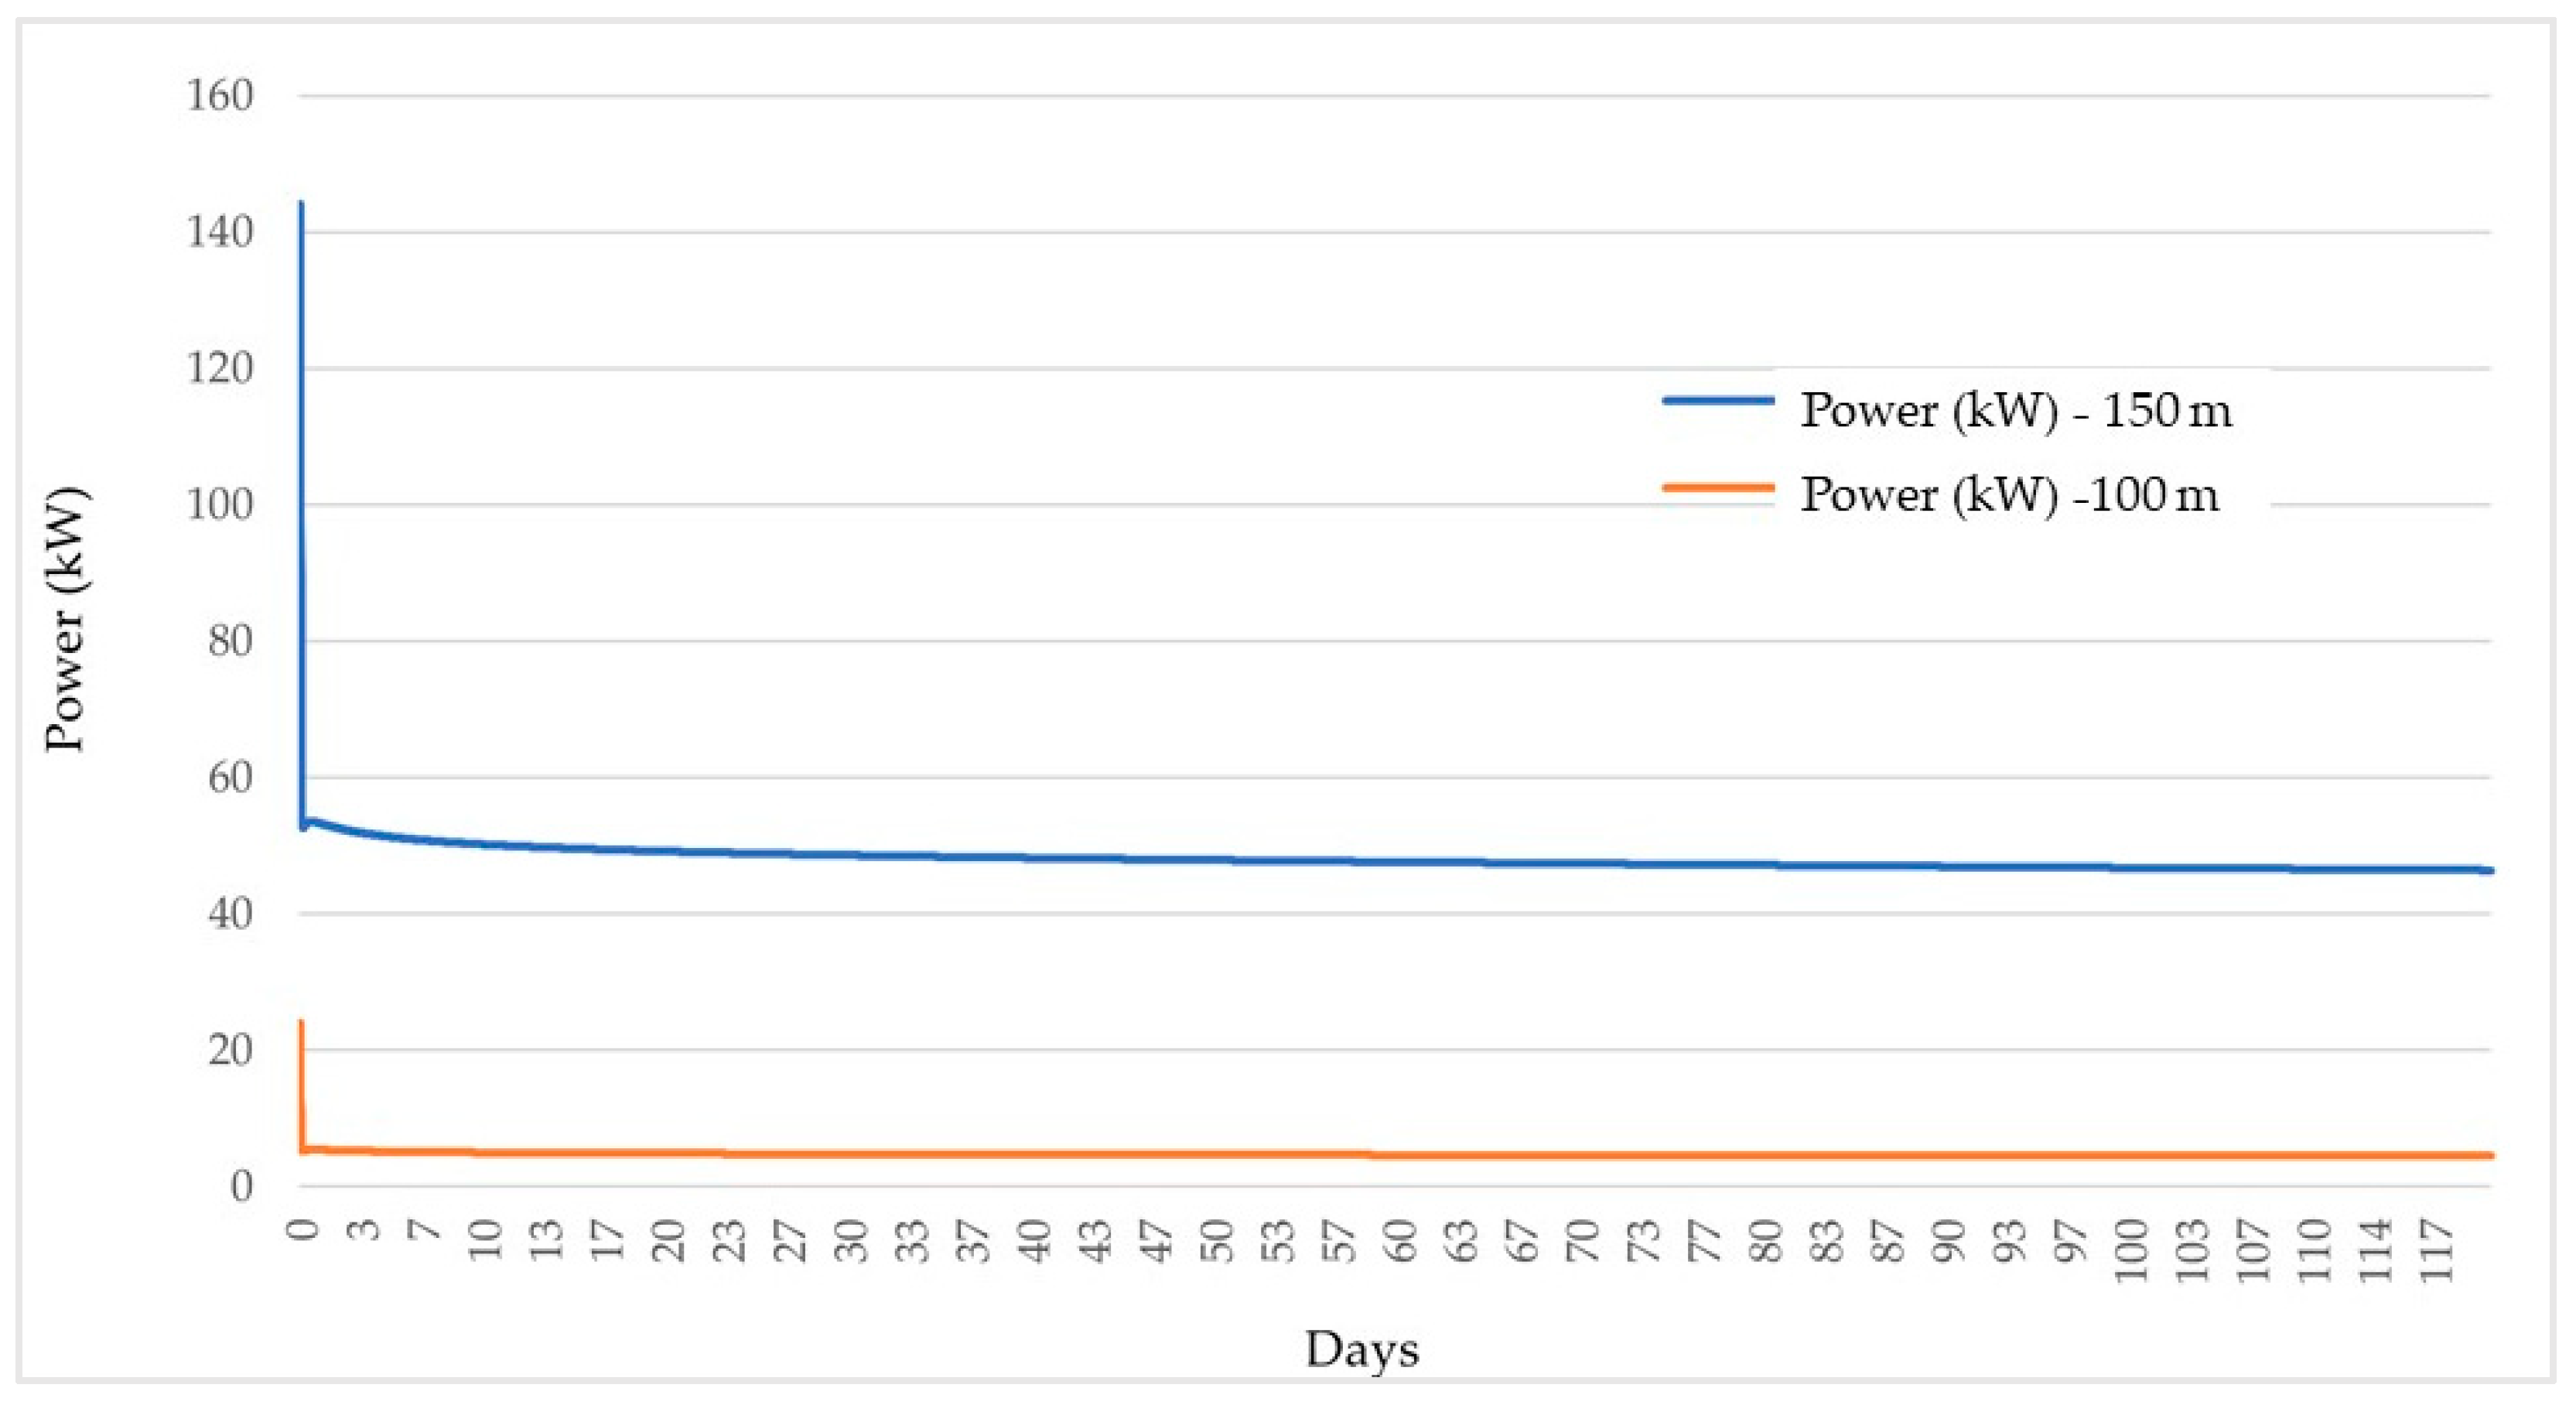
Figure 13 shows how the thermal power obtained from a geothermal pipe can be different, mainly depending on the temperature difference (TinTout) of the heat transfer fluid entering and leaving the geothermal pipes during plant operation, which is in turn linked to the depth of the pipes. In fact, from the geothermal pipe that −100 m deep, the thermal power at the end of the heating cycle was 4.51 kW, while it increased to 7.81 kW for a single pipe at −150 m.
The thermal power obtained from the numerical simulations at the end of 120 days of plant operation was calculated to be 50.92 kW. This is in line with the expected needs and confirms that the designed shallow geothermal system can certainly ensure meeting the base load demand, covering most of the energy needs. Furthermore, integrating the hybrid system with geothermal energy can meet investment and operative costs, optimizing payback times. Differently, the design of a shallow geothermal plant to meet all the required energy needs can be very costly; the number of boreholes should be almost the double, also doubling investments costs (geothermal and gas heat production in the designed plant were both about 70 kW).
A specific economic analysis (Figure 14) based on the costs before the year 2022 and, thus, before the current European geopolitical situation, was also conducted. The design of the shallow geothermal plant, as presented in the previous chapters, allowed the right number of the geothermal boreholes (BHEs) to be deduced, as well as their depth and their distance, while limiting the initial investment costs and meeting almost all the energy needs. The economic analysis has provided how much of the initial costs can be retrieved; the payback time for the realization of the entire hybrid system has been evaluated to be seven years. These data clearly vary because of the current instability of the energy market, for which it is very difficult to perform a correct economic evaluation in such a volatile situation. Furthermore, the designed hybrid system allows a strong reduction in CO2 emissions (about 50%), proving the great benefits of this heating system in terms of energy and cost savings.
Moreover, the long-term results confirm a negligible thermal impact on the ground; after five years of plant operation, the thermal plume ranged between 5 and 10 m from the plant, ensuring a limited impact of the system on the environment. These results also allow an assessment that the thermal effect is reduced substantially in less than one year, after switching off the plant. It is also highlighted that the temperature stabilizes easily over the first years of operation, also ensuring constant production after long periods.
Results that could confirm or modify the final remarks of this study, will be provided in the next few months when the plant will be operative.

Author Contributions

Conceptualization, J.M.C., G.M., A.T. and L.F.; methodology, J.M.C., D.V. and G.M.; software, J.M.C. and G.M.; validation, J.M.C. and G.M.; investigation, J.M.C., D.V. and G.M.; data curation, J.M.C., D.V. and G.M.; writing—original draft preparation, J.M.C. and G.M.; writing—review and editing, J.M.C. and G.M.; supervision J.M.C. and G.M. All authors have read and agreed to the published version of the manuscript.

Funding

This research received no external funding.

Data Availability Statement

Data available on request due to restrictions e.g., privacy or ethical. The data presented in this study are available on request from the corresponding author.

Conflicts of Interest

The authors declare no conflict of interest.

References

  1. IEA (International Energy Agency). Energy Efficiency 2022; IEA: Paris, France, 2022; Available online: https://www.iea.org/reports/energy-efficiency-2022 (accessed on 18 January 2023).
  2. IEA (International Energy Agency). Heating; IEA: Paris, France, 2022; Available online: https://www.iea.org/reports/energy-efficiency-2022 (accessed on 18 January 2023).
  3. UNFCCC. UN Climate Change Conference UK. 2021. Available online: https://ukcop26.org/it/iniziale/ (accessed on 31 October 2022).
  4. UNFCC. Sharm El-Sheikh Climate Change Conference-November 2022. 2022. Available online: https://unfccc.int/cop27 (accessed on 31 January 2023).
  5. European Commission. New Studies Look Closer at Decarbonising Heating and Cooling Sector. News Article, Directorate-General for Energy. 2022. Available online: https://commission.europa.eu/news/new-studies-look-closer-decarbonising-heating-and-cooling-sector-2022-06-13_en (accessed on 18 January 2023).
  6. IEA (International Energy Agency). Buildings; IEA: Paris, France, 2022; Available online: https://www.iea.org/reports/energy-efficiency-2022 (accessed on 18 January 2023).
  7. UN (United Nations) Environment programme. Global Status Report for Buildings and Constructions: Towards a Zero-Emissions, Efficient and Resilient Buildings and Construction Sector. Global Alliance for Buildings and Construction. 2022. Available online: https://www.unep.org/resources/publication/2022-global-status-report-buildings-and-construction (accessed on 18 January 2023).
  8. D’Arpa, S.; Colangelo, G.; Starace, G.; Petrosillo, I.; Bruno, D.E.; Uricchio, V.; Zurlini, G. Heating requirements in greenhouse farming in southern Italy: Evaluation of ground-source heat pump utilization compared to traditional heating systems. Energy Effic. 2016, 9, 1065–1085. [Google Scholar] [CrossRef]
  9. Sanford, S. Reducing Greenhouse Energy Consumption—An Overview; A3907-01; Cooperative Extension Publishing: Madison, WI, USA, 2011; pp. 1–15. [Google Scholar]
  10. Ahamed, M.S.; Guo, H.; Tanino, K. Energy saving technique for reducing the heating cost of conventional greenhouses. Biosyst. Eng. 2019, 178, 9–33. [Google Scholar] [CrossRef]
  11. Muñoz-Liesa, J.; Royapoor, M.; Cuerva, E.; Gassó-Domingo, S.; Gabarrell, X.; Josa, A. Building-integrated greenhouses raise energy co-benefits through active ventilation systems. Build. Environ. 2021, 208, 108585. [Google Scholar] [CrossRef]
  12. Benli, H.; Dormus, A. Performance analysis of a latent heat storage system with phse change material for new designed solar collectors in greenhouse heating. Sol. Energy 2019, 83, 2109–2119. [Google Scholar] [CrossRef]
  13. Sun, W.; Wei, X.; Zhou, B.; Lu, C.; Guo, W. Greenhouse heating by energy transfer between greenhouses: System design and implementation. Appl. Energy 2022, 325, 119815. [Google Scholar] [CrossRef]
  14. Le, A.T.; Wang, L.; Wang, Y.; Li, D. Measurement investigation on the feasibility of shallow geothermal energy for heating and cooling applied in agricultural greenhouses of Shouguang City: Ground temperature profiles and geothermal potential. Inf. Process. Agric. 2021, 8, 251–269. [Google Scholar] [CrossRef]
  15. Al-Helal, I.; Alsadon, A.; Marey, S.; Ibrahim, A.; Shady, M.; Abdel-Ghany, A. Geothermal Energy Potential for Cooling/Heating Greenhouses in Hot Arid Regions. Atmosphere 2022, 13, 105. [Google Scholar] [CrossRef]
  16. Russo, G.; Anifantis, A.S.; Verdiani, G.; Scarascia Mugnozza, G. Environmental analysis of geothermal heat pump and LPG greenhouse heating systems. Biosyst. Eng. 2014, 127, 11–23. [Google Scholar] [CrossRef]
  17. El Haj Assad, M.; Ahmadi, M.; Sadeghzadeh, M.; Yassin, A.; Issakhov, I. Renewable hybrid energy systems using geothermal energy: Hybrid solar thermal–geothermal power plant. Int. J. Low-Carbon Technol. 2021, 16, 518–530. [Google Scholar] [CrossRef]
  18. Forno, M.G.; De Luca, D.A.; Bonasera, M.; Bucci, A.; Gianotti, F.; Lasagna, M.; Lucchesi, S.; Pelizza, S.; Piana, F.; Taddia, G. Synthesis on the Turin subsoil stratigraphy and hydrogeology (NW Italy). Alp. Mediterr. Quat. 2018, 31, 147–170. [Google Scholar] [CrossRef]
  19. Giordano, N.; Comina, C.; Mandrone, G. Borehole thermal energy storage (BTES). First results from the injection phase of a living lab in Torino 8NW Italy). Renew. Energy 2016, 86, 993–1008. [Google Scholar] [CrossRef]
  20. Giordano, N.; Arato, A.; Comina, C.; Mandrone, G. Time-laps electrical resistivity imaging of the thermally affected zone of a Borehole Thermal Energy Storage system near Torino (Northern Italy). J. Appl. Geophys. 2017, 140, 123–134. [Google Scholar] [CrossRef]
  21. Piana, F.; Fioraso, G.; Irace, A.; Mosca, P.; d’Atri, A.; Barale, L.; Falletti, P.; Monegato, G.; Morelli, M.; Tallone, S.; et al. Geology of Piemonte region (NW Italy, Alps-Apennines interference zone). J. Maps 2017, 13, 395–405. [Google Scholar] [CrossRef]
  22. Forno, M.G.; Gianotti, F.; Storti, U. Geomorphology of the Po tluvial terraces in Turin deduced by new subsoil data (NW Italy). Water 2022, 14, 2872. [Google Scholar] [CrossRef]
  23. Chicco, J.M.; Mandrone, G. Modelling the energy production of a borehole thermal energy storage (BTES) system. Energies 2022, 15, 9587. [Google Scholar] [CrossRef]
  24. Saito, T.; Hamamoto, S.; Ueki, T.; Ohkubo, S.; Moldrup, P.; Kawamoto, K.; Komatsu, T. Temperature change affected groundwater quality in a confined marine aquifer during long-term heating and cooling. Water Res. 2016, 94, 120–127. [Google Scholar] [CrossRef]
  25. Riedel, T. Temperature-associated changes in groundwater quality. J. Hydrol. 2019, 572, 206–212. [Google Scholar] [CrossRef]
  26. Chicco, J.M.; Comeau, F.-A.; Casasso, A.; Comina, C.; Giordano, N.; Mandrone, G.; Raymond, J. Alternative Use of Artificial Quarry Lakes as a Source of Thermal Energy for Greenhouses. Water 2021, 13, 3560. [Google Scholar] [CrossRef]
  27. Chicco, J.M.; Mandrone, G. How a sensitive analysis on the coupling geology and borehole heat exchanger characteristics can improve the efficiency and production of shallow geothermal plants. Heliyon 2022, 8, e09545. [Google Scholar] [CrossRef]
  28. Thermal Use of the Underground-Fundamentals, Approvals, Enironmental Aspect; VDI 4640 Blatt 1; Engl. VDI-Gesellschaft Energie und Umwelt: Düsseldorf, Germany, 2010; pp. 1–33.
  29. Eklöf, C.; Gehlin, S. Ted-a Mobile Equipment for Thermal Response Test: Testing and Evaluation. Master’s Thesis, Luleå University of Technology, Norrbotten, Sweden, 1996; pp. 1–62. [Google Scholar]
  30. Raymond, J.; Mercier, S.; Nguyen, L. Designing coaxial ground heat exchangers with a thermally enhanced outer pipe. Geotherm. Energy 2015, 3, 7. [Google Scholar] [CrossRef]
  31. Claesson, J.; Dunand, A. Heat Extraction from the Ground by Horizontal Pipes: A Mathematical Analysis; Byggforskningsrådet: Stockholm, Sweden, 1983; Available online: https://lucris.lub.lu.se/ws/portalfiles/portal/4375488/8146470 (accessed on 4 February 2023).
  32. Javed, S.; Spitler, J. Calculation of Borehole Thermal Resistance. In Advances in Ground-Source Heat Pump Systems; Woodhead Publishing: Cambridge, UK, 2016; Volume 1, pp. 63–95. ISBN 9780081003114. [Google Scholar]
  33. Kuosa, M.; Rahiala, S.; Tallinen, K.; Mäkilä, T.; Lampinen, M.; Lahdelma, R.; Pulkkinen, L. Mass flow controlled district heating with an extract air heat pump in apartment buildings: A practical concept study. Appl. Therm. Eng. 2019, 157, 113745. [Google Scholar] [CrossRef]
  34. Diersch, H.-J.G. FEFLOW–Finite Element Modeling of Flow, Mass and Heat Transport in Porous and Fractured Media. In Earth and Environmental Science; Springer: Berlin/Heidelberg, Germany, 2014; Volume 1, p. 996. [Google Scholar] [CrossRef]
  35. Diersch, H.-J.G. Using and testing the algebraic multigrid equation solver SAMG in FEFLOW. FEFLOW White Pap. 2009, 3, 25–36. [Google Scholar]
  36. Lanahan, M.; Tabares-Velasco, P.C. Seasonal Thermal-Energy Storage: A Critical Review on BTES Systems, Modeling, and System Design for Higher System Efficiency. Energies 2017, 10, 743. [Google Scholar] [CrossRef]
  37. Catolico, N.; Ge, S.; McCartney, J.S. Numerical Modeling of a Soil-Borehole Thermal Energy Storage System. Vadose Zone J. 2016, 15, 1–17. [Google Scholar] [CrossRef]
  38. Blank, L.; Meneses Rioseco, E.; Caiazzo, A.; Wilbrandt, U. Modeling, simulation, and optimization of geothermal energy production from hot sedimentary aquifers. Comput. Geosci. 2021, 25, 67–104. [Google Scholar] [CrossRef]
  39. Gao, C.; Zhang, L.; Sun, C.; He, J. The numerical simulation of heat and mass transfer on geothermal system. A case study Laoling area, Shandong, China. Math. Probl. Eng. 2022, 2022, 1–11. [Google Scholar] [CrossRef]
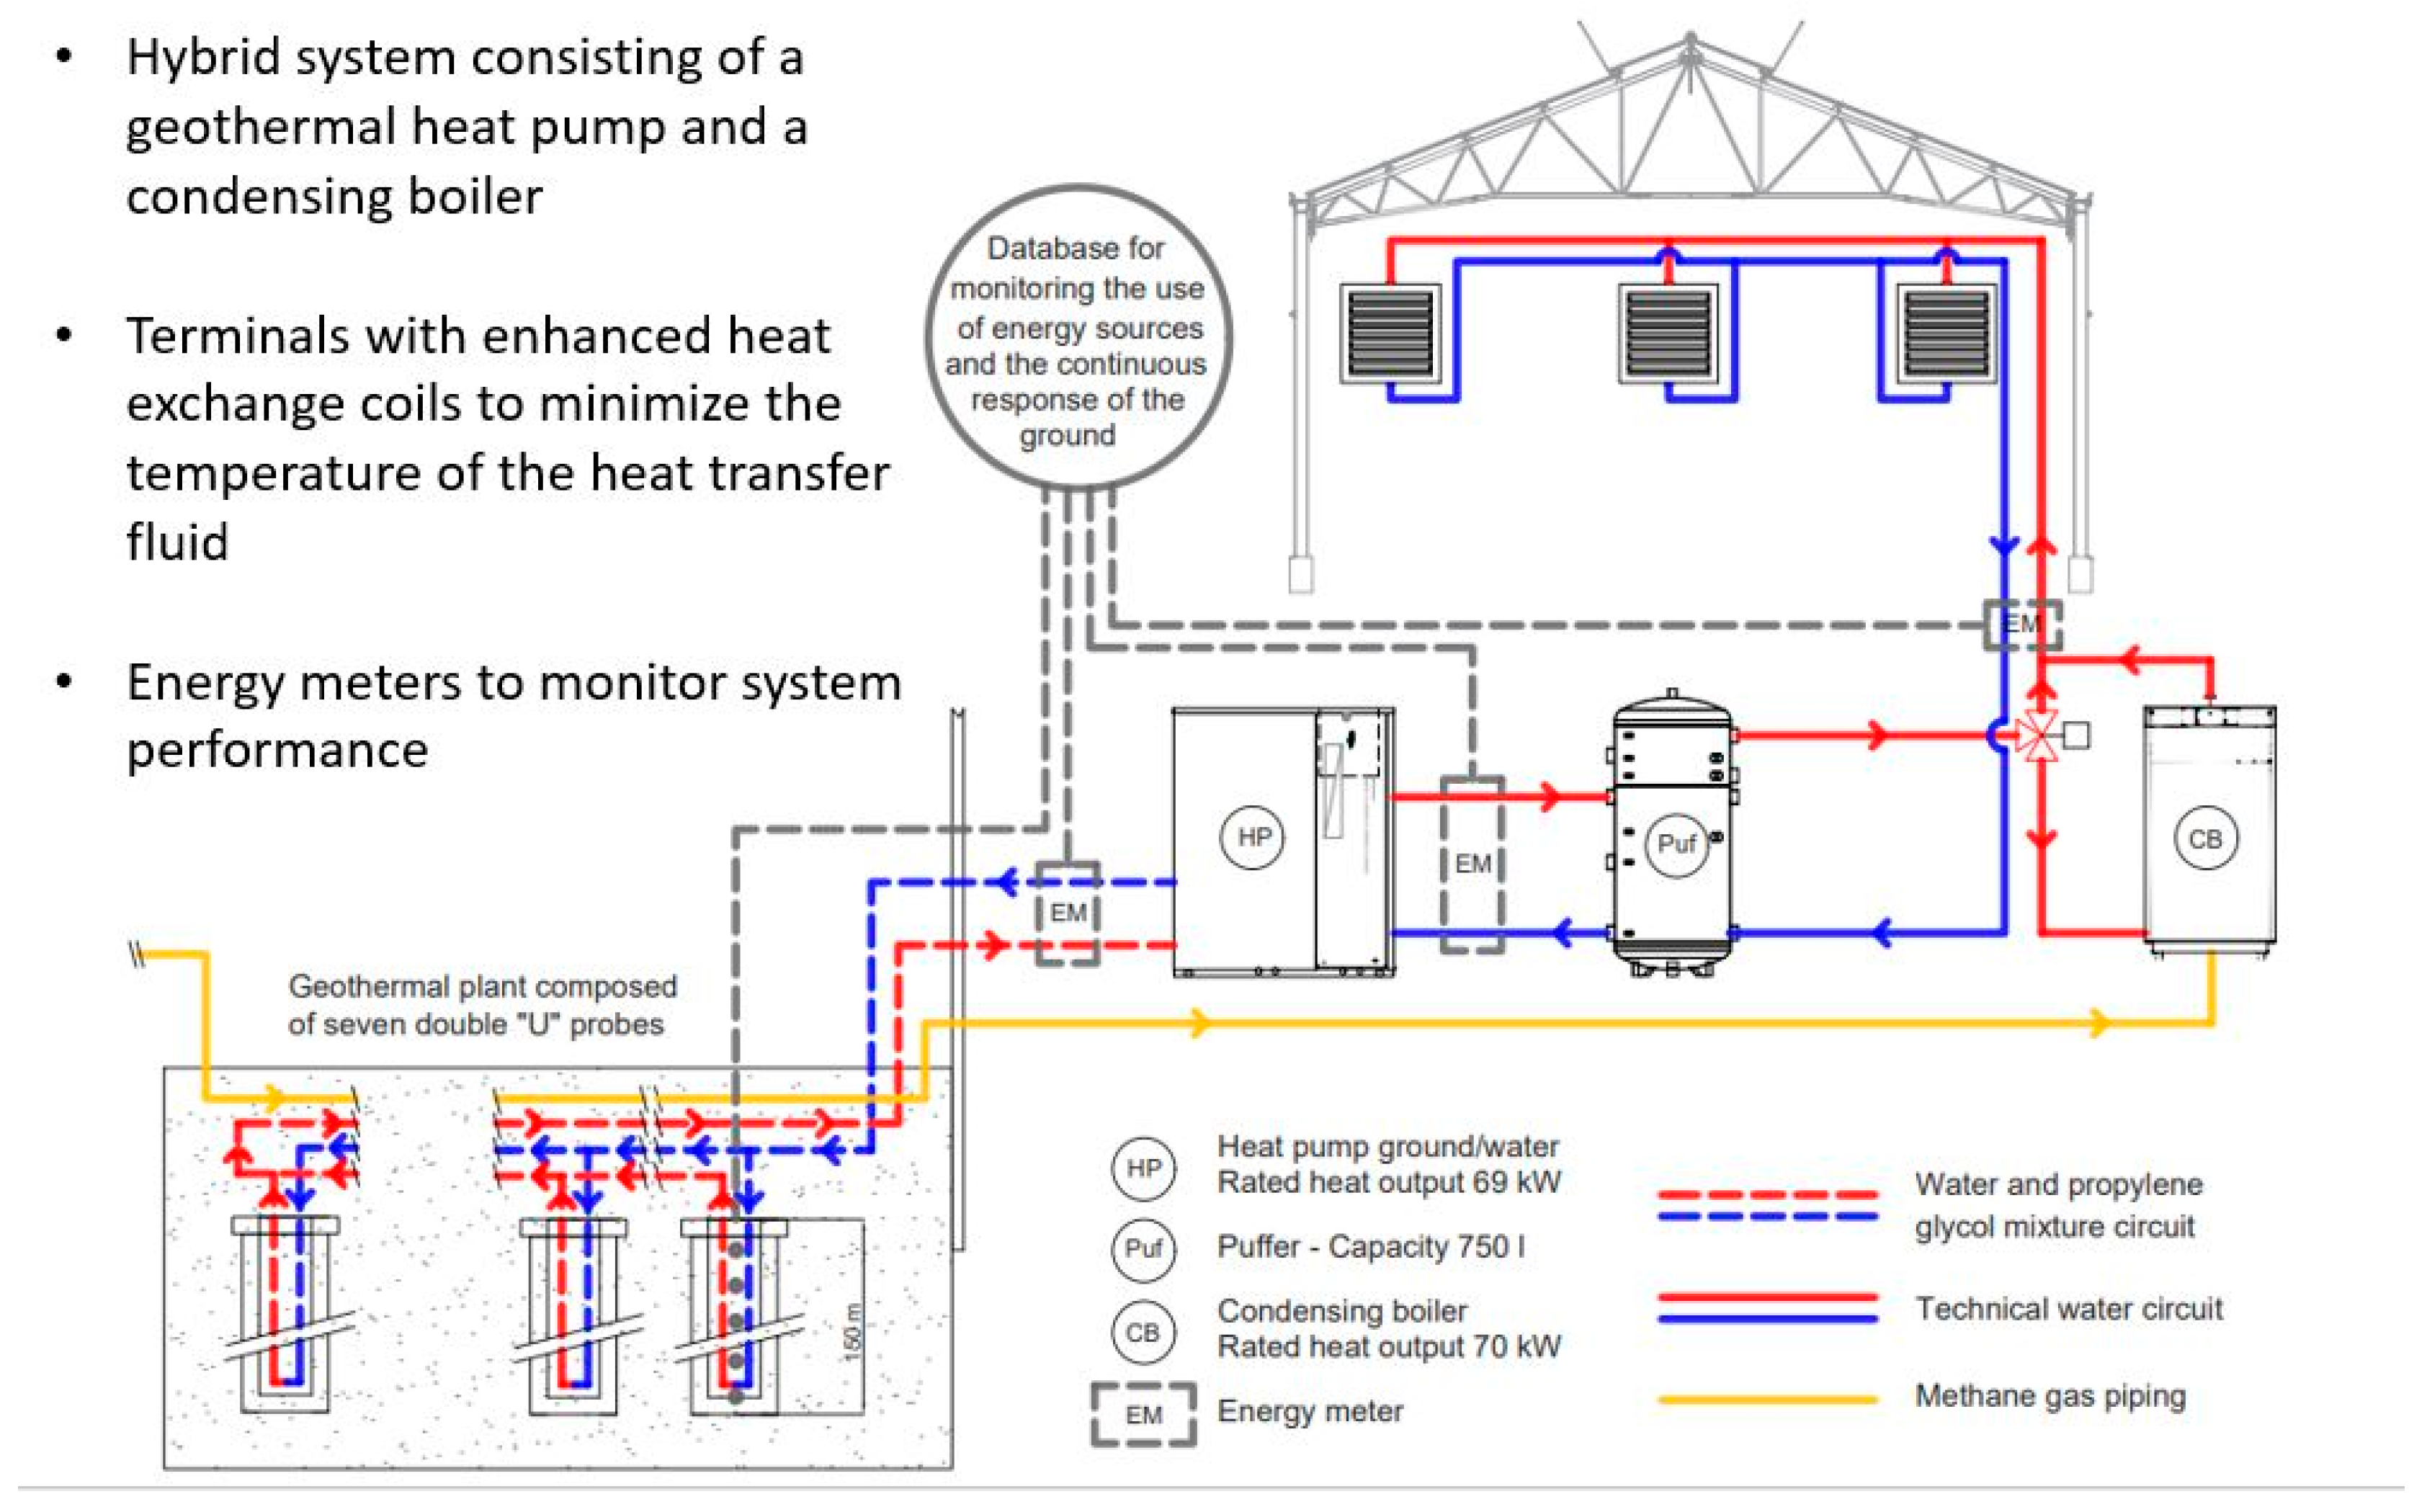
Figure 1. The hybrid heating system project for the plant phenotyping greenhouse at the University Campus in Grugliasco (a few km from Turin, Italy).
Energies 16 03931 g001
Figure 2. Distribution of the energy loads over 1 year of plant operation.
Energies 16 03931 g002
Figure 3. Geological sketch map modified after [22]. The red star indicates the University Campus of Grugliasco, where the study area is located.
Energies 16 03931 g003
Figure 4. Aerial view of the designed BHEs, based on the available data from the previous field studies and on the requested energy needs. The yellow circles represent the BHEs. Number 1 refers to the pilot BHE used for field GRT (−100 m in depth); numbers 2–7 refer to the other BHEs at 150 m in depth.
Energies 16 03931 g004
Figure 5. Inlet (Tin, °C) and outlet (Tout, °C) temperatures from the field GRT vs. simulated GRTs.
Energies 16 03931 g005
Figure 6. Hydrogeological and thermo-physical data used to integrate the numerical simulations. Key: Kxx, Kyy, and Kzz are the hydraulic conductivities along the X, Y, and Z directions, respectively; ф is the porosity; λs and λw are the thermal conductivities of the soils and of the water, respectively; T is the undisturbed ground temperature.
Energies 16 03931 g006
Figure 7. Geometrical model of the designed shallow geothermal plant. On the left is the 2D section representing boreholes (red points). On the right, the 3D section is divided into 6 slices placed at different depths, from the ground level to −180 m in depth. It is possible to see the pilot pipes used for the field GRT at −100 m deep, while the other six are at −150 m in depth; the space under the pipes (30 m more than the BHEs’ length) was planned to see the ground behaviour under BHEs during their operation.
Energies 16 03931 g007
Figure 8. Ground temperature monitoring over the first 16 days of grout ageing. The blue line refers to the temperature at −30 m, the orange line at −70 m, and the grey line at −130 m.
Energies 16 03931 g008
Figure 9. Ground temperature monitoring through point measures in different periods. The orange line refers to November 2021, while the blue line represents December 2021.
Energies 16 03931 g009
Figure 10. Inner (Tin, °C) and outlet (Tout, °C) temperatures over 120 days of operation, without switching off the plant, for the 7 boreholes.
Energies 16 03931 g010
Figure 11. Numerical simulations over 120 days, corresponding to 4 months of heating. (A): horizontal section at −30 m, above groundwater level; (B): horizontal section at −100 m, below groundwater level.
Energies 16 03931 g011
Figure 12. Numerical simulations over 5 years, representing on and off cycles every year. The red curve represents the pilot BHE at −100 in depth, used for the field GRT; the other curves refer to the BHEs at −150 m deep.
Energies 16 03931 g012
Figure 13. Thermal power extractions from the geothermal pipes (−100 and −150 m deep, respectively) during the 120 days of continuous operation.
Energies 16 03931 g013
Figure 14. Economic analysis before 2022, based on the average costs for the investigated site.
Energies 16 03931 g014
Table 1. Geological, hydro-geological, and thermo-physical characteristics, as revealed by preliminary field surveys and information from the literature.
LithologyDepth
(m)
Hydraulic Conductivity
(K, m/d)
Porosity (θ, %)Temp. (°C)Groundwater
Level (m)
“Quaternary” Complex From 0 to −5686.42514−58
ClaysFrom −56 to −580.008641014−58
“Villafranchiano” ComplexFrom −58 to −10017.282014−58
Table 2. BHE characteristics. Key: L is the BHE length; D is the BHE diameter; din and dout are the inner and outer pipe diameters; bin and bout represent the inner and outer pipe thicknesses; λin and λout are the inner and outer pipe thermal conductivities.
Pipe
Configuration
L
(m)
din
(m)
bin
(m)
dout
(m)
bout
(m)
D
(m)
λin
(W*m−1K−1)
λout
(W*m−1K−1)
Double U600.0260.00230.0320.00290.150.420.42
Disclaimer/Publisher’s Note: The statements, opinions and data contained in all publications are solely those of the individual author(s) and contributor(s) and not of MDPI and/or the editor(s). MDPI and/or the editor(s) disclaim responsibility for any injury to people or property resulting from any ideas, methods, instructions or products referred to in the content.