Article

Flow Characteristics of Electrochemical Catalytic Reduction of CO2 in Microchannel

1
School of Mechanical Engineering, Harbin Institute of Technology, Harbin 150001, China
2
Nanjing Chenguang Group Co., Ltd., Nanjing 210006, China
3
Beijing Spacecrafts, Beijing 100094, China
*
Author to whom correspondence should be addressed.
Energies 2023, 16(9), 3929; https://doi.org/10.3390/en16093929
Submission received: 1 April 2023 / Revised: 25 April 2023 / Accepted: 3 May 2023 / Published: 6 May 2023
(This article belongs to the Section J: Thermal Management)

Abstract

:
Human beings need abundant material support and energy supply in their exploration of the universe. The sustainable supply of materials is an important condition for long-term space exploration. In situ resource utilization technology (ISRU) is an important way to realize the sustainable development of space exploration, which uses the abundant raw materials in outer space to transform energy and materials. In this paper, a microfluidic reaction device based on in situ resource utilization is designed, which converts H2O and CO2 into O2 and organic matter through photoelectrocatalysis. The flow and mixing process of gas-liquid two-phase flow was studied, and both the characteristics of mass transfer and the chemical reaction of fluids in the microchannel were studied. The dynamic process of the fluid-in-microchannel chemical reaction was expounded, and a prediction model of the volumetric mass transfer coefficient was proposed. The results show that the mass transfer coefficient of the chemical reaction is affected by the gas-liquid flow characteristics, and the mass transfer affects the rate of the chemical reaction. The material conversion of in situ resources by using the microchannel device can improve efficiency and accurately control the reaction products.

1. Introduction

The sustainable development of space exploration requires sufficient energy and material. Due to the limitation of the weight that aircraft can carry, further development of deep space exploration is greatly restricted. In situ resource utilization technology (ISRU) proposed in recent years to use raw materials from outer space for material conversion and energy extraction, in order to achieve energy and material supply [1,2]. Taking Mars exploration as an example, there is abundant CO2 on Mars, and using CO2 as raw material for fuel and oxygen conversion can provide sufficient material for Mars development [3,4].
In the 1970s, the in situ production of propellants on Mars was put forward. Ash et al. proposed the use of raw materials on Mars for the production of vehicle ascent propellants, and conducted a study on in situ propellant production (ISPP) [2]. With the progress of research, the utilization of resources on Mars has been more widely used, and ISPP has been gradually replaced by ISRU. Since 1990s, ISRU has gained rapid development. The most commonly used ISRU technology for CO2 conversion and oxygen production is the Sabatier conversion method [5,6,7]. The reaction principle of the Sabatier reduction method is as follows:
CO 2 + 4 H 2 CH 4 + 2 H 2 O ,   Δ H 289 K = 252 . 9 kJ / mol
Many researchers have developed many transformation systems based on the Sabatier method [8,9]. In 2004, NASA proposed a manned Mars exploration system based on the Sabatier method to convert H2 and CO2 into CH4 and H2O [10]. The device includes two reaction modules of CO2 reduction and H2O electrolysis, and a series of experiments have been carried out on the space station [11,12]. In 2007, researchers designed a reactor based on the Sabatier principle, which can achieve 70% to 80% CO2 conversion at 400 °C and produce 0.0125 kg/h CH4 [13]. In 2013, Pioneer Astronautics in the United States developed the Integrated Mars In-situ Propellant Production System (IMISPPS) [7], which combines the Sabatier reaction and the RWGS reaction. The overall reaction is:
3CO2 + 6H2 → CH4 + 2CO + 4H2O(g), △H298K = −82 kJ/mol
The reactor simplifies the system, reduces the power consumption of the reaction, and improves the quality of the apparatus.
In the last ten years, Sabatier transformation has been developed rapidly, and some experiments have been carried out to verify it. Sabatier reaction technology is mature and has a high conversion rate, but the high temperature and pressure limit the efficiency of energy conversion; it is also not conducive to accurate control of the product.
In 2021, Nanjing University and the Chinese Academy of Space Technology proposed the use of artificial photosynthesis technology for ISRU [14], which can reduce CO2 and generate O2 at normal temperature and pressure. The characteristics of less energy consumption and easy control of reaction is very important for space technology. There are three main ways to reduce CO2 by artificial photosynthesis: photocatalysis, electrocatalysis, and photoelectrocatalysis [15,16,17]. Photocatalysis has the characteristic of high energy utilization, but the light source is unstable in an outer space environment and the reaction is not easy to continue. Electrocatalysis is the use of electrical energy generated by solar energy for reactions, which is stable and sustainable. Moreover, due to the simple and compact structure of the reaction device, the modular production can be realized. However, if we only rely on electricity to carry out chemical reactions, we will need to carry a large amount of energy, resulting in an increase in costs. Photoelectrocatalysis is a photoelectrochemical reaction carried out by a semiconductor photoelectrode material changing the surface state of an electrode [18]. In photoelectrocatalysis, electrical energy can be obtained by solar energy conversion. Photoelectrocatalysis has strong sustainability and a high energy utilization rate. Therefore, photoelectrocatalysis was chosen for the reduction of CO2.
The chemical reaction in the microreactor has the following advantages: the reaction is safe, easy to control, and has high mass transfer efficiency [19,20]. At the same time, due to the influence of surface tension in the channel being far greater than that of gravity, gravity can be ignored when chemical reactions are carried out in outer space [21]. Therefore, artificial photosynthesis in microchannels is an important way to reduce CO2 in situ.
Researchers have conducted numerous studies on the reduction of CO2 in microchannels. Rongwei Guo [22] studied CO2 absorption by AMP and EG; a mass transfer prediction model was proposed, and the results showed that the microchannel had obvious advantages in the mass transfer. Wen-Ling Li [23] used a numerical simulation method to study the absorption of CO2 by MEA, and analyzed the flow and mass transfer law. Yaran Yin [24] studied the CO2 absorbed by MEA/[Bmim] [BF4], the variation of bubbles was analyzed, and the prediction formula of mass transfer coefficient considering the Re number and Damköhler number was proposed. Daofan Ma [25] studied CO2 absorption by MEA and DEEA through visualization. It was found that the mass transfer coefficient of the microreactor was higher than that of the conventional reactor. Mengmeng Huang [26] studied the CO2 absorption by silica nanostream; the mass transfer coefficient, CO2 absorption, and pressure drop were analyzed. Physical mass transfer, chemical mass transfer, and CO2 absorption have been studied extensively by researchers [27,28,29]. However, there are few studies on the photoelectrocatalysis reduction of CO2 in microchannels.
In this study, the reduction of CO2 under electrocatalysis in microchannels was studied, including the bubble and liquid slug changes, pressure, porosity, and mass transfer coefficient. We also proposed a prediction model for mass transfer coefficient in electrochemical reactions.

2. Reaction Mechanism and Electrochemical Device

2.1. Reaction Principle

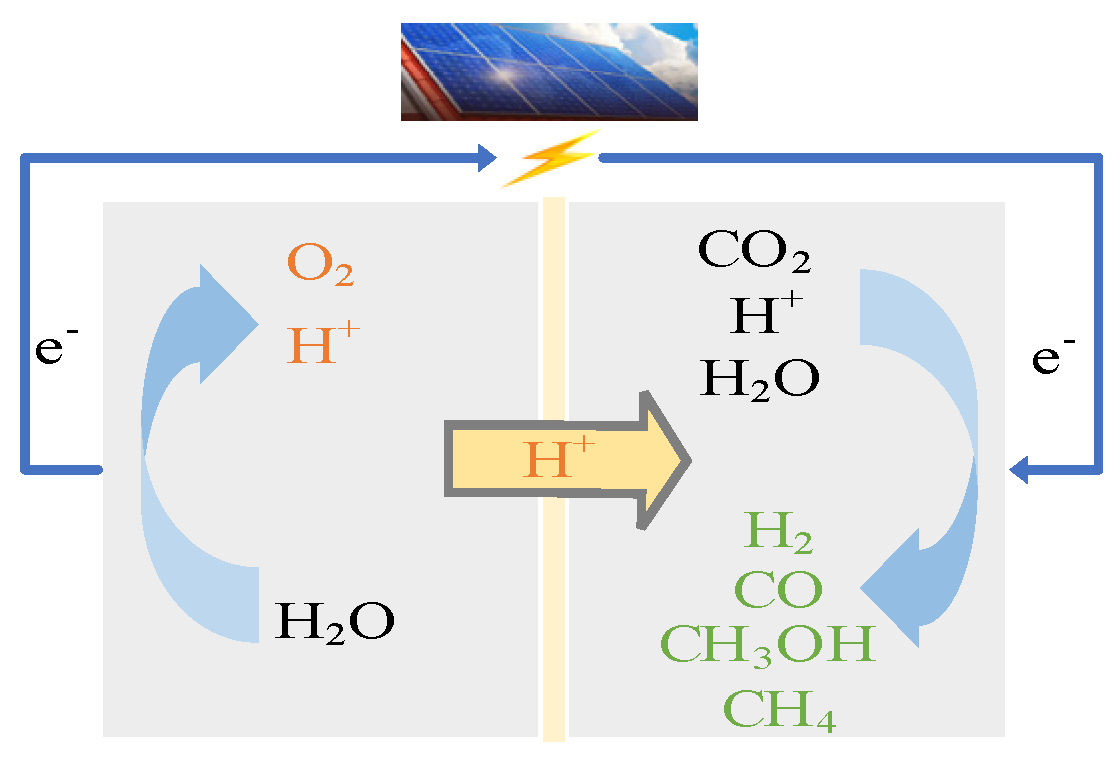
As shown in Figure 1, the device needs to connect photovoltaic cells to provide energy support for the reaction. The photovoltaic cell absorbs and stores solar energy, and the generated voltage is applied to the two ends of the electrode of the microfluidic chip to carry out a catalytic reaction.
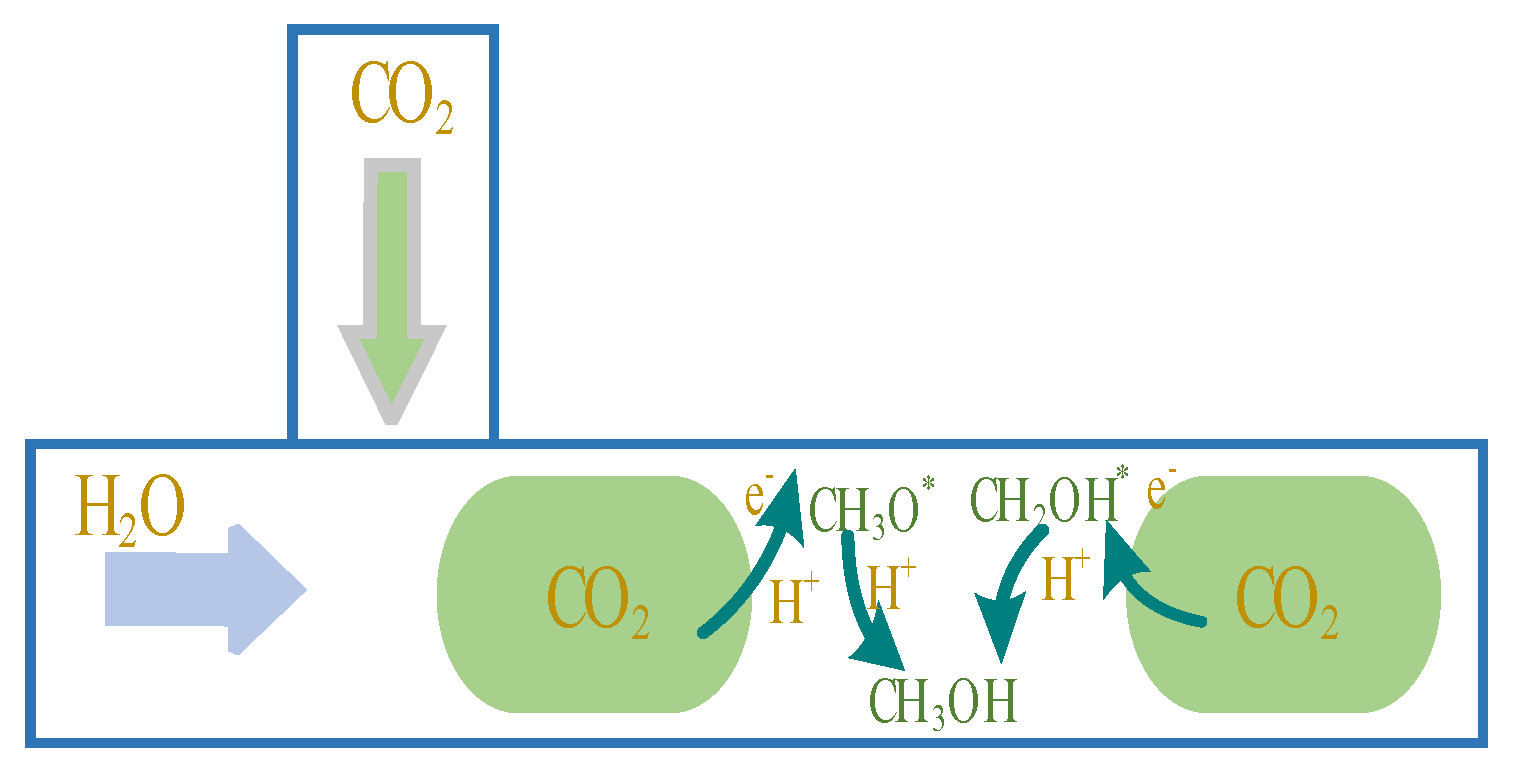
As shown in Figure 2, there are many kinds of products in the reduction of CO2, and the kinds of products change with the catalyst and applied voltage. The main products are CO, H2, hydrocarbons, etc. To improve the conversion efficiency of CO2, the hydrogen evolution reaction should be avoided as much as possible. The products of CO2 reduction are diverse and widely used. Compared with gaseous products, liquid products have higher energy densities, are easier to store and transport, and are suitable for energy consumption in extraterrestrial exploration. As a common organic material, CH3OH is an excellent chemical raw material, which has the characteristics of high energy utilization and low pollution. Therefore, the catalytic reduction of CO2 to CH3OH is an important research direction [30,31].
Due to the strong thermodynamic stability of CO2 molecules in an H2O solution, the reaction process is difficult to complete spontaneously. The application of a catalyst can effectively reduce the energy barrier in the reaction and make the reaction easier. Meanwhile, the catalyst can enhance the selectivity of reaction products and reduce the occurrence of hydrogen evolution reactions. Many researchers have studied catalysts in the reduction of CO2. At present, there are mainly three types of catalytic systems for the reduction of CO2 to CH3OH: the first type is Cu-based catalytic system, mainly including Cu, CuO, Cu2O, etc.; the second type is noble metal catalytic system, mainly including Ir, Au, Pd, Ru, etc.; the third type is a Ti-based catalytic system mainly including TiO2, etc.
The Cu-based catalyst [32,33] can reduce CO2 at a relatively low potential, and has good adsorbability and high reducibility, which is conducive to improving the production capacity of methanol. The noble metal catalyst system [34,35] also has a good selectivity for the reduction of CO2, but the noble metal catalyst has the characteristics of high cost and poor practicability, so its wide range of use is limited. Ti-based catalytic systems [36,37,38] are mainly composed of TiO2 and its derivatives, which have high Faradaic efficiency in CH3OH generation. TiO2 as a catalyst has a strong ability to absorb photons. The combination of Cu2O and TiO2 as the catalyst will have better reducibility and adsorbability.
The reaction occurs at the electrode-electrolyte interface, and the whole reaction process involves many processes, such as mass transfer, chemical reaction, and so on. The stability of the flow affects the mass transfer behavior in the reaction, and then affects the chemical reaction. According to the classical catalysis theory, the reaction process has the following steps [39]: (1) mixing of two-phase flow, (2) diffusion of CO2 molecules, (3) gas phase molecules combineing with catalysts, (4) the CO2 molecule gaining energy and then carrying out a reduction reaction, (5) generation of products. (6) the product leaving the catalyst and diffusing into the solution.
In order to realize the photoelectrocatalytic reduction of CO2, it is necessary to ensure the appropriate performance of catalytic materials, electrode potential, hydrodynamics, and other aspects, then testing and analyzing its comprehensive performance. The basis of the chemical reaction lies in the transfer and transformation of substances, and the mass transfer and reaction kinetics in microchannels are the focus of the research.

2.2. Reaction Device

The core area of the artificial photosynthetic reaction device is the microchip, where chemical reactions take place. The microchip includes an anode reaction region and a cathode reaction region. Artificial photosynthesis mimics the photosynthesis of green plants. As shown in Figure 3, the anode imitates the photoreaction stage of photosynthesis, and the electrolyte is introduced to carry out the electrolysis of H2O; the reaction produces O2, H+ and e. The H+ moves to the cathode through the proton exchange membrane, and the e reaches the cathode through an external circuit. The cathode imitates the dark reaction stage of photosynthesis, CO2 and electrolyte are introduced into the cathode, and the CO2 is subjected to a hydrogenation reaction to generate organic matter.
Anode:
2 H 2 O O 2 + 4 H + + 4 e
Cathode:
CO 2 + 6 H + + 6 e CH 3 OH + H 2 O
As shown in Figure 4, the microchip includes an anode reaction region and a cathode reaction region. The anode reaction area consists of an anode substrate, an anode microchannel, and an anode carbon film. The cathode reaction area consists of a cathode carbon film, a cathode microchannel, and a cathode substrate. The anode reaction region and the cathode reaction region are separated by a proton exchange membrane.
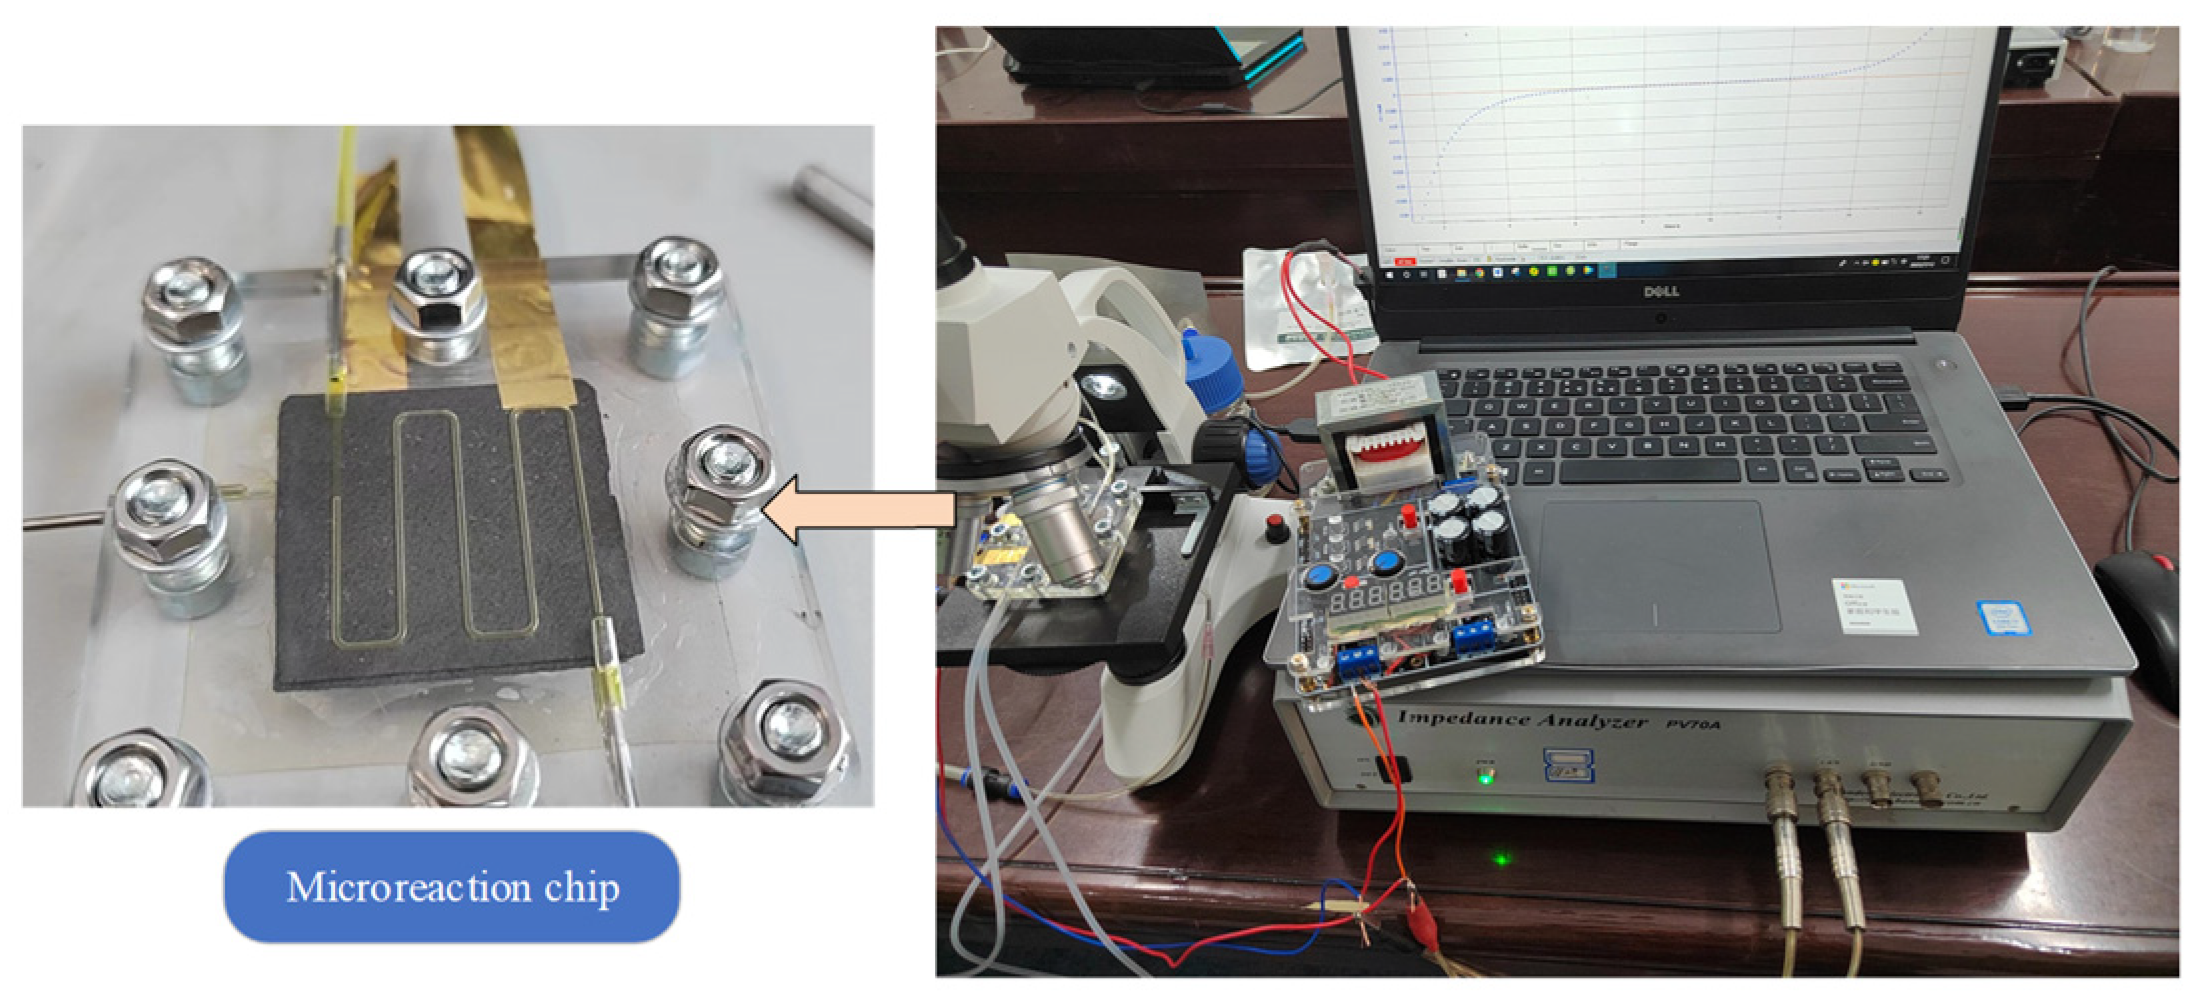
As shown in Figure 5, in order to observe the fluid in the microchannel, the anode channel and the cathode channel are made of PMMA transparent material, and the corners of the channel are rounded to ensure stability. The anode microchannel and the cathode microchannel are embedded on the anode substrate and the cathode substrate, respectively. The substrate is made of a metal material, the outer side of the substrate is sprayed with insulating spray paint, and the conductive surface on the inner side of the substrate is connected with an electrode material. A conductive hole is arranged on that substrate, and the electrode material is connected with an external circuit through the conductive hole. An anode carbon film and a cathode carbon film are arranged on two sides of the proton exchange membrane to serve as a carry of the catalyst. In order to increase the assembly accuracy and improve the sealing performance of the device, the anode carbon membrane, the proton exchange membrane, and the cathode carbon membrane are pressed into one with a hot pressing method. A sealing gasket is placed between the cathode reaction area and the anode reaction area. TiO2-Cu2O was used to catalyze the reaction.
The anode-electrode catalytic material was produced by a Sol-Gel method according to Reference [40]. The preparation of the catalytic material comprises two steps: the preparation of the TiO2 colloid material and the spraying of an electrode. Firstly, C₅H₈O₂ is added to deionized water and stirred with a magnetic stirrer. C5H8O2 can prevent the aggregation of TiO2 particles. Then, TiO2 nanoparticles are added, and the mixed solution is stirred. Then, a small amount of surfactant Triton X-100 is added into the solution to accelerate the diffusion of the catalyst. Polyethylene glycol is added into the solution to enable the catalyst to form a porous structure, and the preparation of the catalyst solution can be finished by continuously stirring. Finally, the solution is sprayed on the carbon film via a spraying method.
The anode-electrode catalytic material was produced according to Reference [41]. Firstly, 5 mg of Cu2O was added to a mixed liquid consisting of 0.5 mL of isopropanol, 0.5 mL of deionized water, and 0.05 mL of Nafion. Then, it was mixed using ultrasonic oscillation. Then, 0.1 mL of Cu2O suspension was added dropwise to the dried carbon film and then dried naturally.

2.3. Reaction Process

Chemical reactions need to detect the reaction products, study the mass transfer and fluid flow phenomena, and explain the reaction mechanism from a microscopic point of view, so as to optimize the reaction device, improve the material yield, and accurately control the reaction products.

2.3.1. Experimental Process

The experimental process includes the following steps:
(1)
All modules of the reaction device need to be connected, wherein a microchip is connected with a gas supply pressure regulating device, a product collecting device, and a power supply control device; a high-speed camera is arranged above the reaction chip to observe the fluid flow in the reaction in real time.
(2)
The microchannel is purged with air and then deionized water is introduced to check the tightness and smoothness of the device. Then the device is dried by inert gas.
(3)
The gas-liquid phase fluid is pumped into the micro-reaction chip. After the gas circuit and the liquid circuit are stable, the electrode is connected for power supply, the current change is detected in real time, and the reaction product is collected into the collection bag. Meanwhile, the fluid in the micro-flow channel needs to be monitored and photographed in real time during the reaction process.
(4)
After the reaction is finished, the reaction channel is closed, the collected reaction products are subjected to gas chromatography analysis, the types and yields of the products are detected, and the data generated by the experiment are analyzed. This paper mainly studies the reaction of CO2 reduction to CH3OH. The Agilent 7890B gas chromatograph is used to measure the yield of CH3OH.

2.3.2. Reaction Parameters

(1)
Pressure drop
For a micromixer, the pressure drop represents the pressure loss of the mixed fluid from one point to another in the microchannel. The greater the pressure loss is, the more obvious the decrease of flow velocity. The pressure drop affects the mixing efficiency of the two-phase fluid and the mixing performance of the micro-mixer, and then affects the reduction reaction of CO2. At the same time, higher pressure loss requires a larger driving force to promote the flow, and for the passive micromixer without an additional power source, a higher power injection pressure is required, which has a greater impact on the integration of the micromixer.
(1)
Porosity
Porosity is a parameter of the gas-liquid phase ratio of the reaction. The porosity in the microchannel is calculated by the ratio of the total volume of gas phase to the total volume.
α = i = 1 n V i V C
where Vc is the microchannel volume, and Vi is the volume of the bubble.
The volume can be calculated via the image method. The Taylor bubble consists of a bubble head, a bubble tail, and a bubble body, wherein the bubble head and the bubble tail can be regarded as hemispheres, and the bubble body is a cylinder. The volume is calculated as follows:
V i = 1 6 π d 3 + π 4 d 2 L g d
where Lg is the bubble length, and d is the diameter of the bubble body.
Porosity can reflect the content of gas and liquid in the microchannel, which has an important impact on the chemical reaction.
(3)
Mass Transfer Coefficient
The mass transfer coefficient is an important parameter of chemical reaction rate, which can reflect the mass transfer.
As shown in Figure 6, when the gas-liquid two-phase fluid makes contact, CO2 molecules move from the bubble to the gas film, diffuse into the phase interface, and then reach the electrode surface for catalytic reaction. The mass transfer coefficient consists of the gas film and the liquid film.
1 K L = 1 H k G + 1 k L
where H is Henry’s constant.
Due to the gas phase being pure CO2, the gas film mass transfer can be neglected. According to references [24,42], the average mass transfer coefficient of a single bubble is calculated as follows:
k L = P i n V i n P o u t V o u t H R T t A ¯ p ¯
where Pin and Pout are the pressures of the microchannel, Vin and Vout are the volumes of the bubbles of the microchannel, A ¯ is the average surface area during bubble movement, and p ¯ is the average pressure within time t. The pressure can be measured by a pressure gauge; the bubble volume can be obtained by a picture method.

3. Mass Transfer of Physical Absorption in Microreactor

3.1. Two-Phase Flow Mixing

CO2 and electrolytes are introduced into the cathode. The solubility of CO2 in the electrolyte is low, and CO2 exists in the micro-channel in the form of bubbles. Taylor flow formed by two-phase flow mixing is often studied as the main flow pattern because of its stable structure and obvious mass transfer. Parameters such as the frequency of bubble generation, the bubble velocity, and the relevant parameters of the Taylor cell are analyzed.
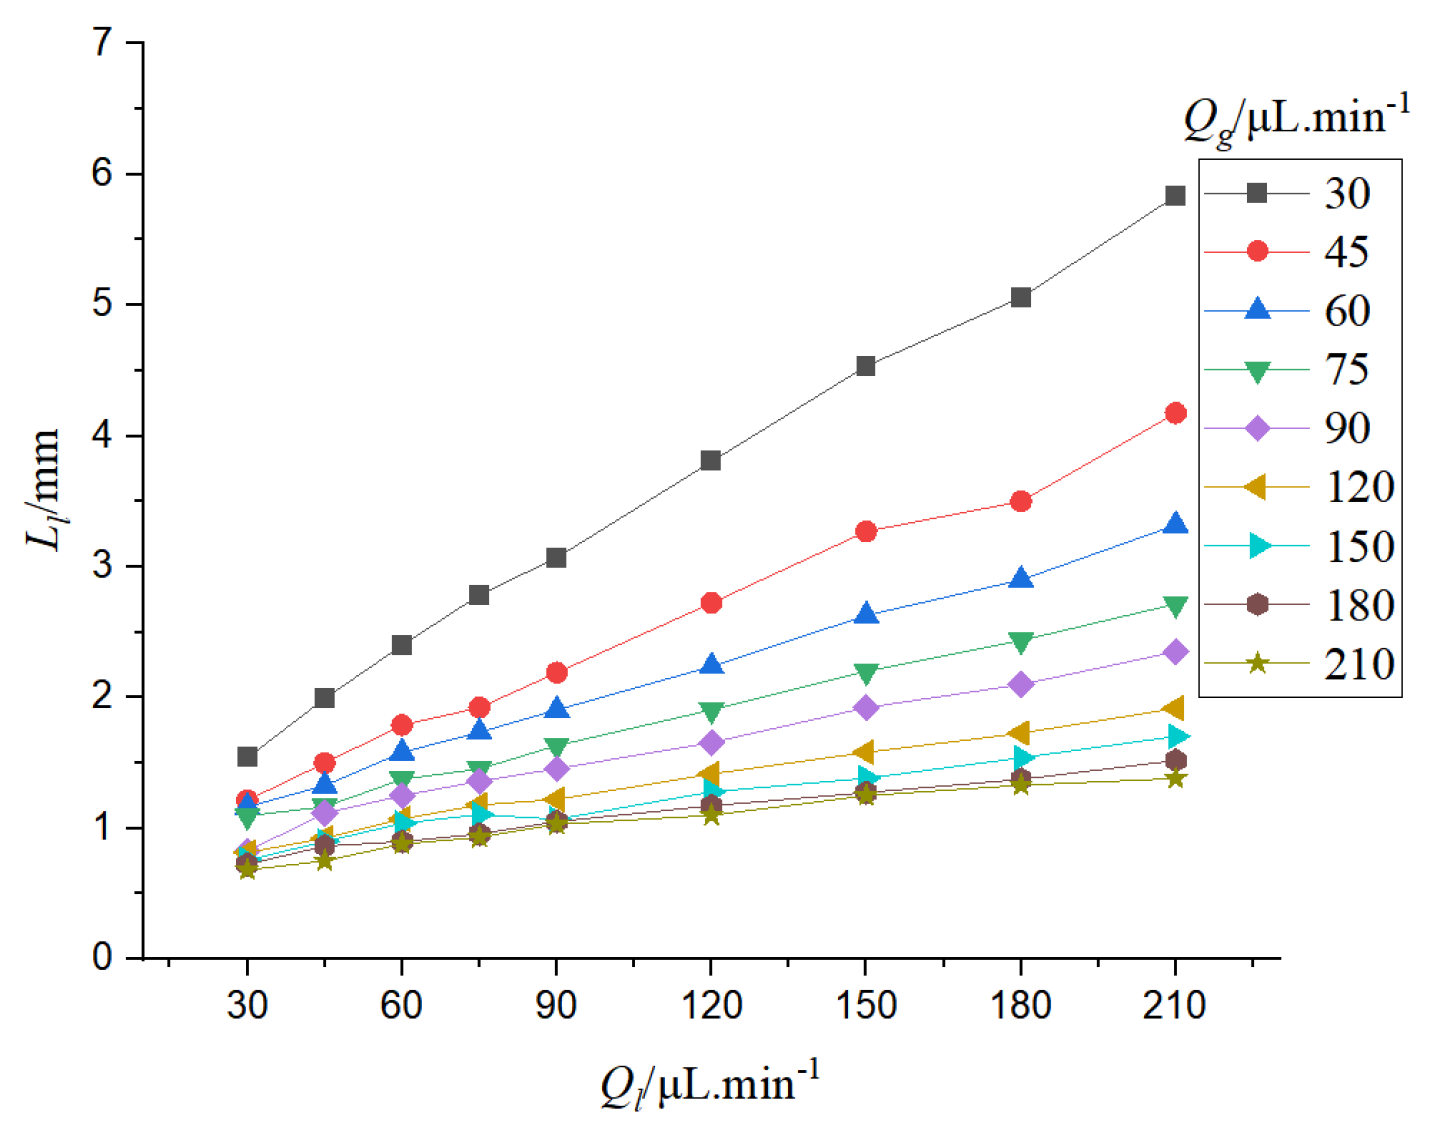
As shown in Figure 7, when the flow rate of CO2 increases, the concentration of the gas phase in the microchannel increases, thus increasing the proportion of the gas phase in the microchannel; therefore, the bubble volume becomes larger. When the liquid flow rate is low, the proportion of the gas phase in the two-phase flow increases rapidly with the increase of gas flow rate, increasing the bubble volume greatly. When the liquid phase flow rate is high, the proportion of the liquid phase in the microchannel is high, and when the gas phase flow rate is increased, the proportion of the gas phase in the microchannel increases slightly, increasing the bubble volume slightly. When the flow rate of the gas phase is constant, the proportion of the gas phase decreases with the increase of the flow rate of the liquid phase, decreasing the bubble volume. When the flow rate of the liquid phase is low, increasing the flow rate of the liquid phase can increase the squeezing effect of bubbles, and the increase of solvent can make more gas phase enter the liquid phase, so the length of bubbles decreases significantly. When the liquid flow rate is higher, the two-phase flow velocity is gradually accelerated, and the gas-liquid mass exchange reaches saturation in unit time. At the same time, the bubble pressure increases, and the bubble volume change caused by the pressure decreases, decreasing the bubble length slightly.
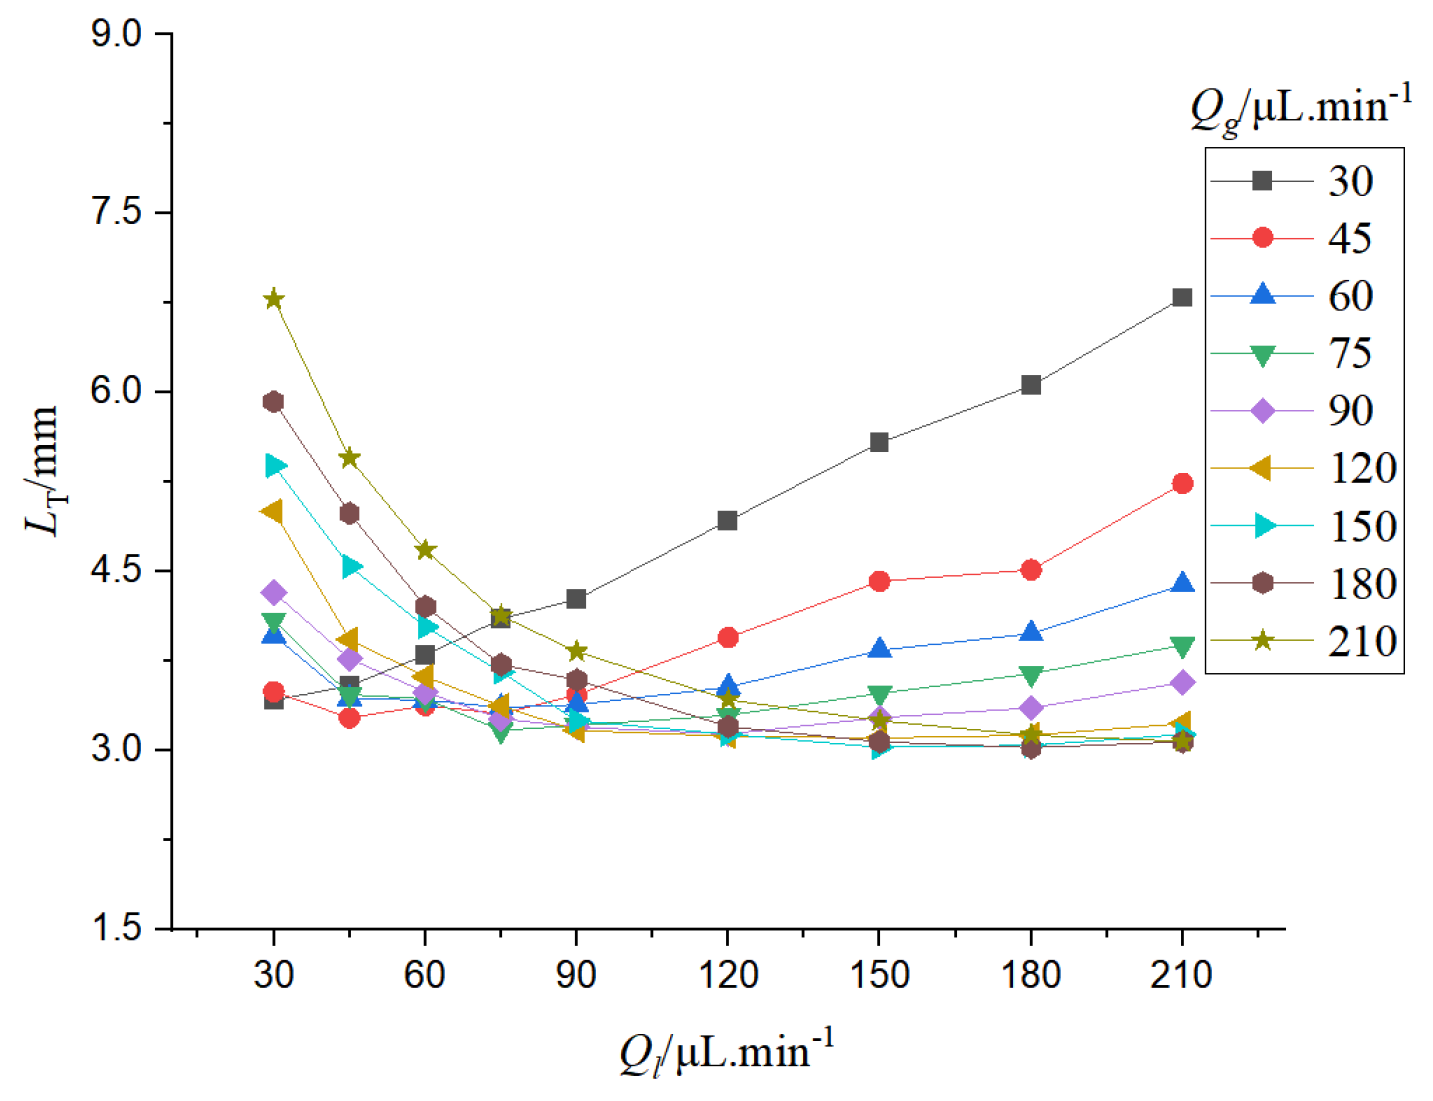
As shown in Figure 8, when the liquid flow rate is low, increasing the liquid flow rate can increase the liquid content in the microchannel, enhance the aggregation of the liquid, and lengthen the liquid slug. If the gas flow rate is low, the liquid phase is dominant in the microchannel, and the shear effect of the bubble on the liquid phase is weakened. With the increase of the liquid flow rate, the length of the liquid slug increases rapidly. When the gas flow rate is higher, the shear effect of the bubble is stronger, so the liquid slug length increases relatively slowly with the increase of the liquid flow rate.
As shown in Figure 9, the Taylor cell is composed of bubbles and liquid slug. When the difference between the liquid velocity and the gas velocity is too large, the length of liquid slug or bubbles increases sharply, which makes the length of the Taylor cell increase. When the gas velocity and the liquid velocity are close to each other, the lengths of bubbles and liquid slug are not too large, and the length of the Taylor cell is short. The shorter the length of the Taylor unit, the more Taylor units exist in the microchannel at the same time, which is beneficial to the chemical reaction.
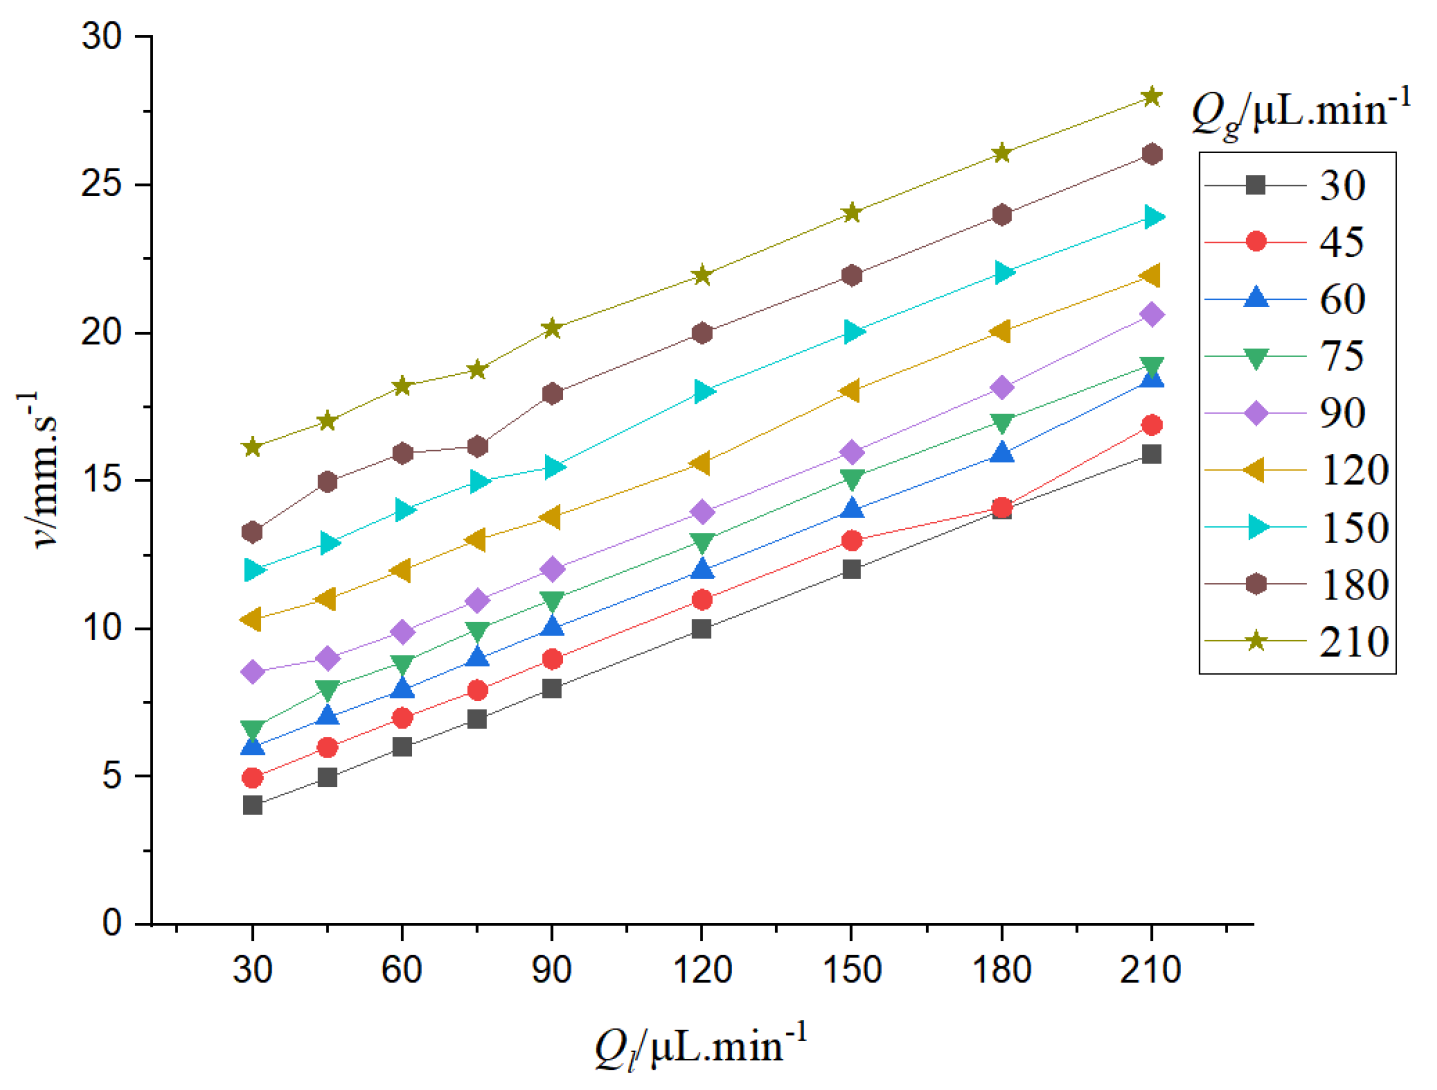
It can be seen from Figure 10 that the bubble velocity increases as the gas-liquid phase flow rate increases. When the gas-liquid flow rate increases, the bubble velocity is accelerated, and the gas-liquid flow rate varies linearly with the bubble velocity.
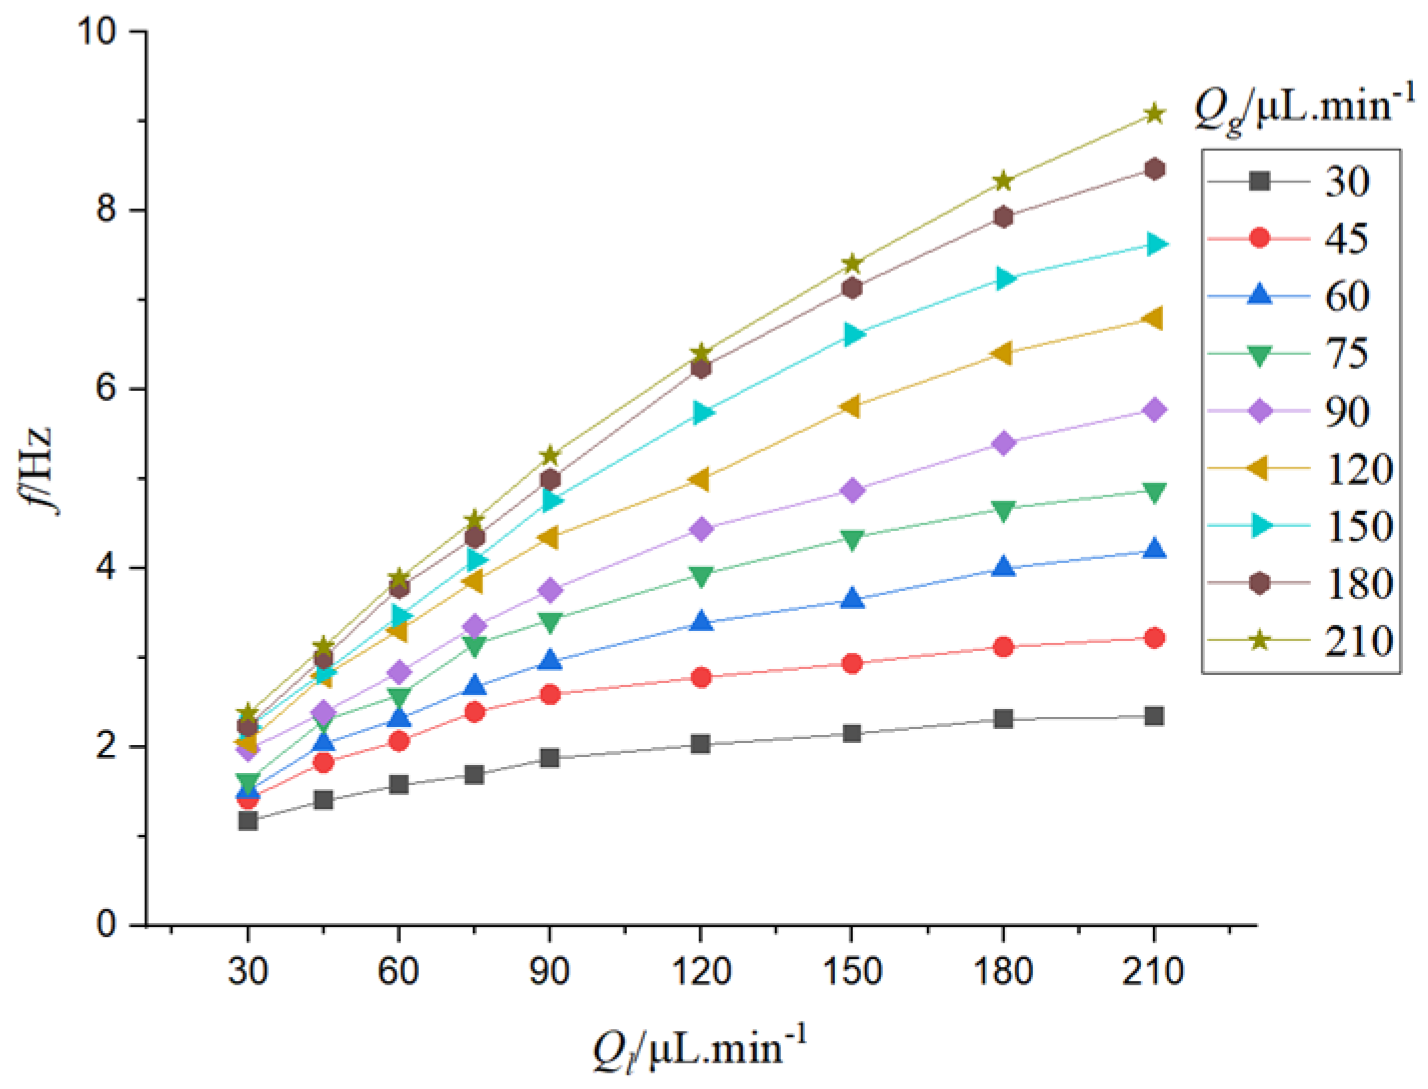
It can be seen from Figure 11, When the flow rate of the liquid phase is constant, the frequency of bubble formation increases as the flow rate of the gas phase increases. When the gas flow rate is low, the increase of the gas flow rate will lead to a larger increase in bubble frequency. When the gas flow rate is high, the bubble frequency increases slightly with the increase of gas flow rate. When the gas flow rate is constant, the bubble frequency increases with the increase of the liquid flow rate. When the liquid flow rate is low, the bubble frequency increases greatly with the increase of liquid flow rate. When the flow rate of the gas-liquid phase increases, the speed of bubbles is accelerated, and the shear force at the two-phase interface is strengthened, which makes the bubble fall off more easily at the two-phase mixing interface, and the frequency of bubble formation increases.
Due to the existence of dissolution and diffusion, the bubble length is continuously shortening. The evolution of bubble length in the process of CO2 absorption by electrolyte was studied.
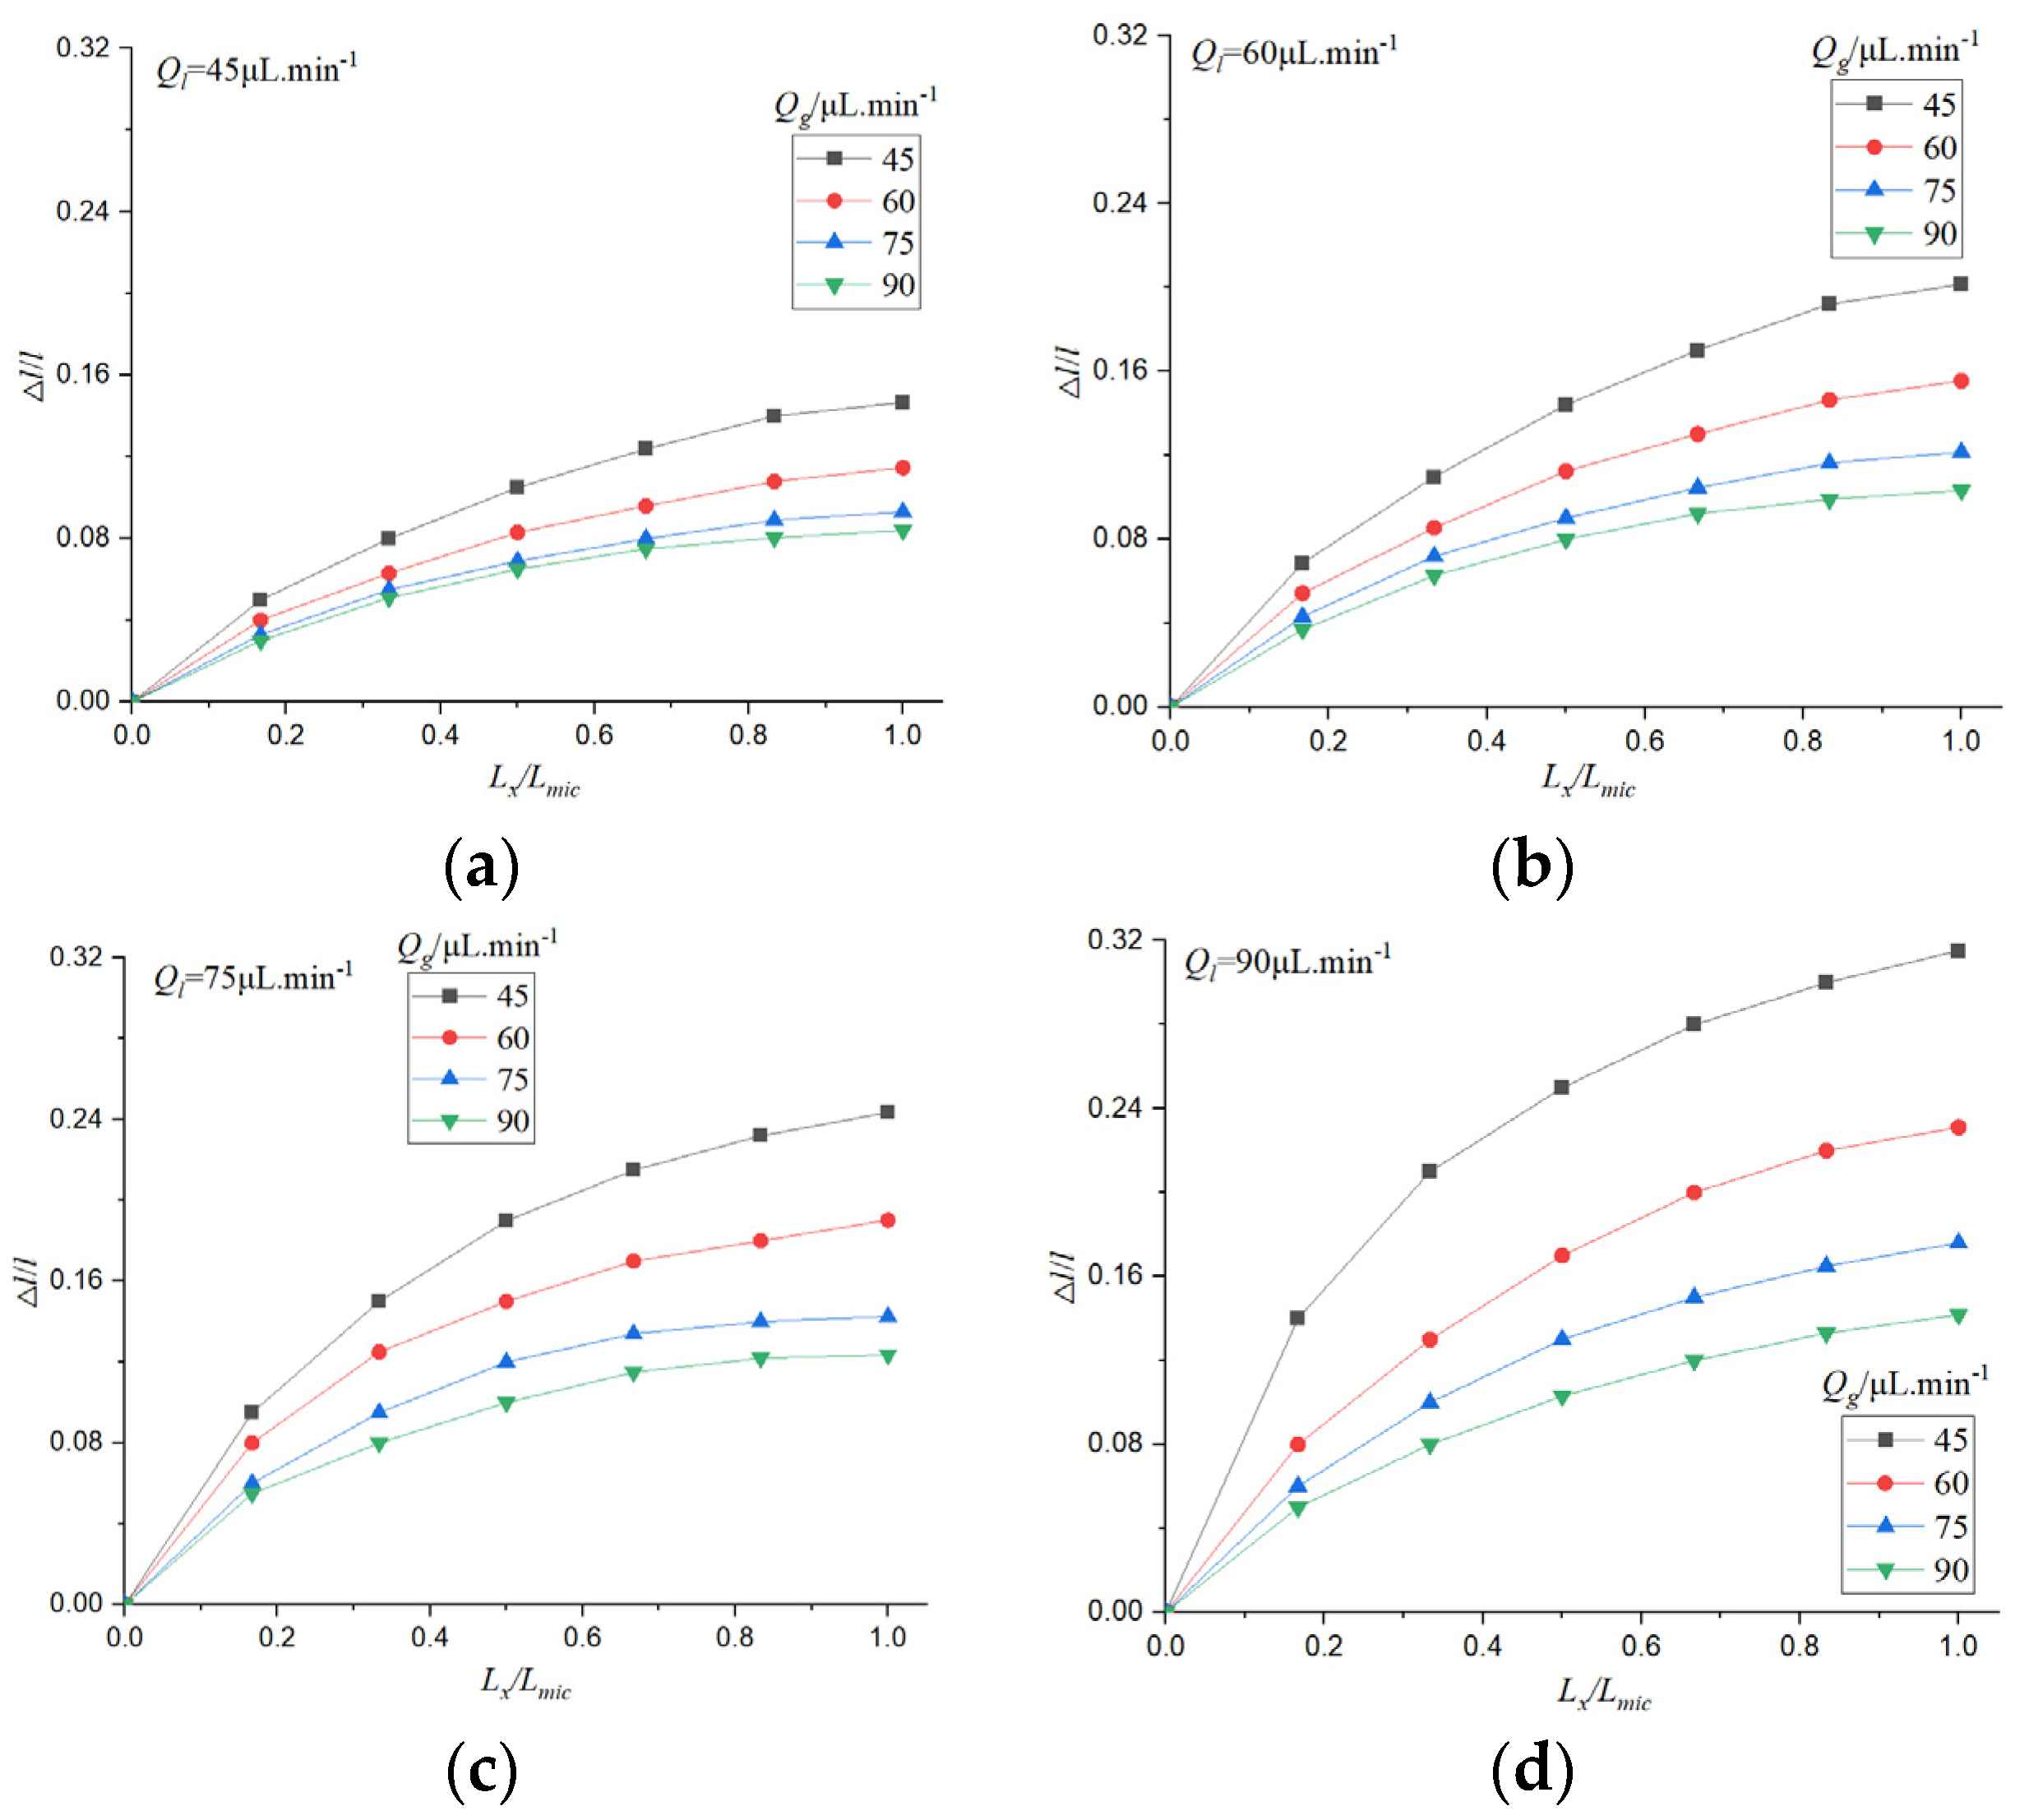
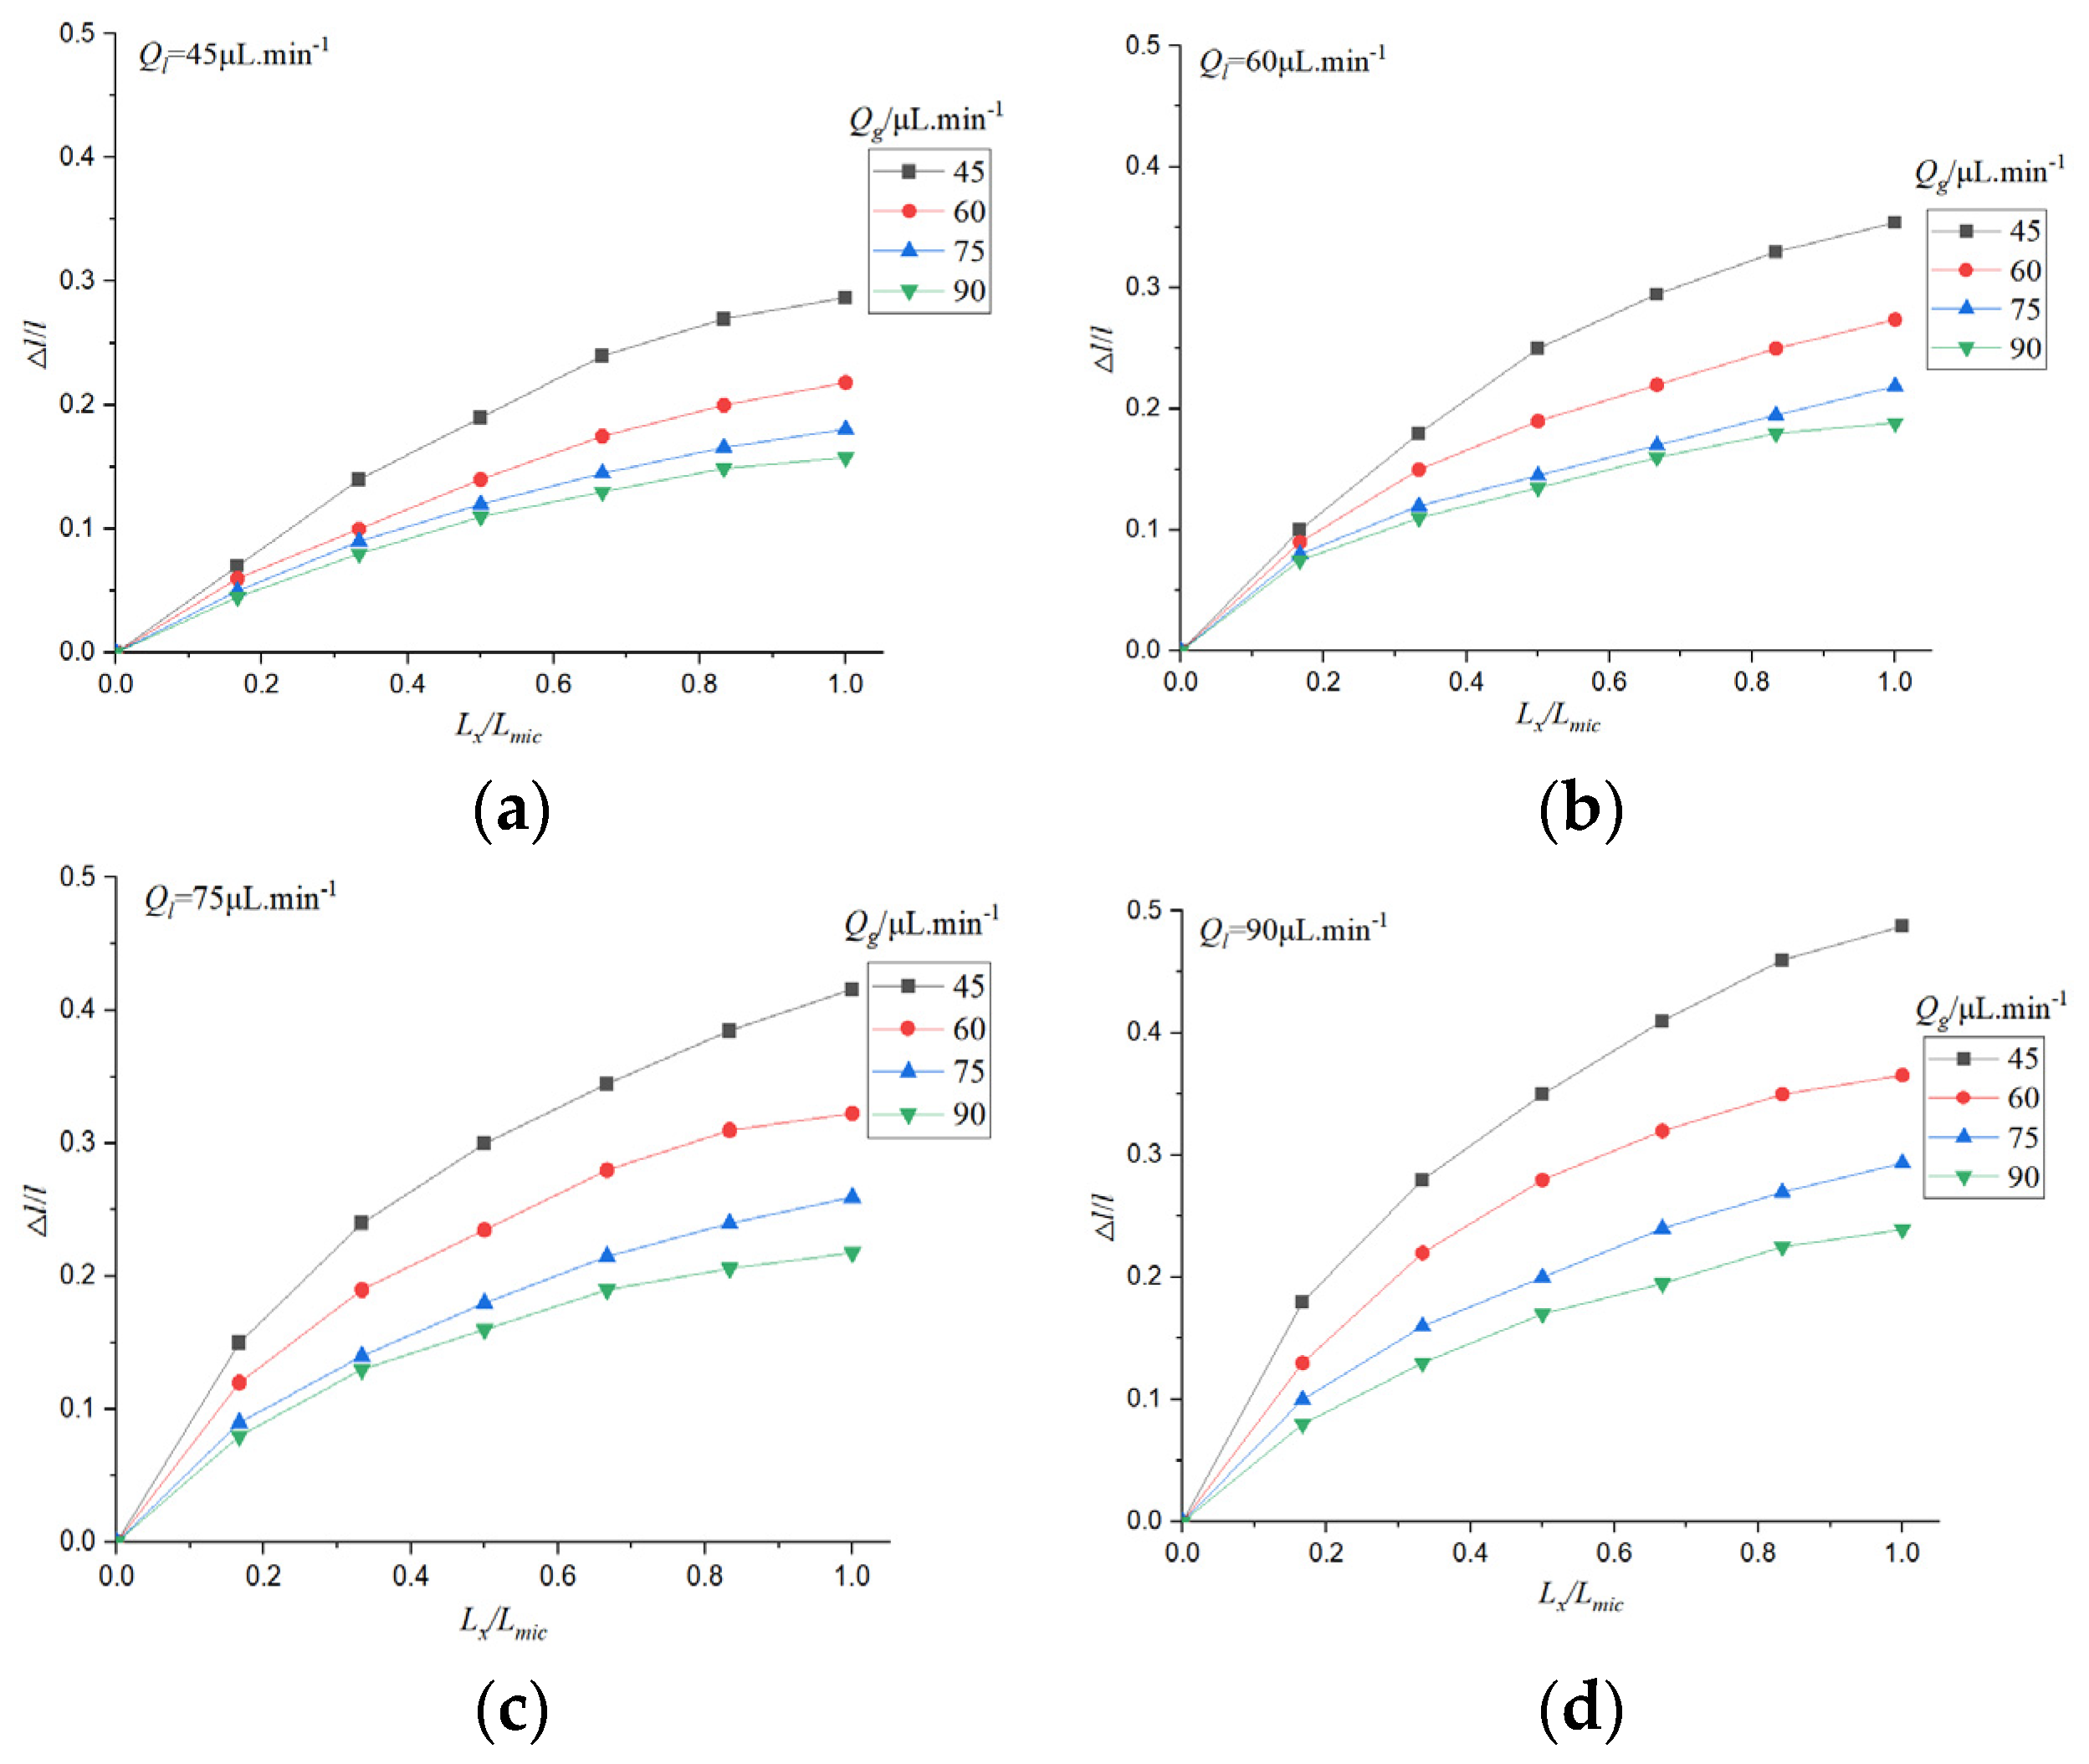
The initial length of the bubble is l0, and the difference between the instantaneous length and the initial length is △l. The relative loss length of the bubble △l/ l0 can reflect the rate of gas-liquid circulation and mass transfer, and it is affected by temperature, microchannel structure, electrolyte type, and concentration. The length of the microchannel is Lmic, the position of the bubble is Lx, and the influence curve of gas-liquid flow rate on the relative loss length of bubbles under physical absorption is drawn.
l/l0 can reflect the change of bubble position with time. It can be seen from Figure 12 that the relative loss length of bubbles increases with the increase of time, and the bubble length changes significantly when the gas flow rate is low. In the initial stage of bubble formation, the change of bubble is more obvious, the relative loss length decreases gradually with the increase of time, and the outlet of microchannel is basically unchanged.
This is due to the fact that the gas phase in the microchannel is continuously absorbed, and the concentration of CO2 in the liquid phase is low initially, so the absorption rate is fast. The concentration of CO2 in the liquid phase increased gradually, and the absorption rate decreased. When the gas velocity is small, the bubble size is small, and the change of relative absorption length is more obvious. When the gas flow rate is large, the effect of gas flow rate on the relative absorption length is not obvious. The increase of liquid phase flow rate can increase the absorption of gas phase and increase the relative loss length.

3.2. Mass Transfer of CO2 Absorption in Electrolyte

CO2 and electrolytes were introduced into the cathode of the microchip, and the two-phase flow was mixed. The mass transfer coefficient of CO2 under physical absorption was studied.
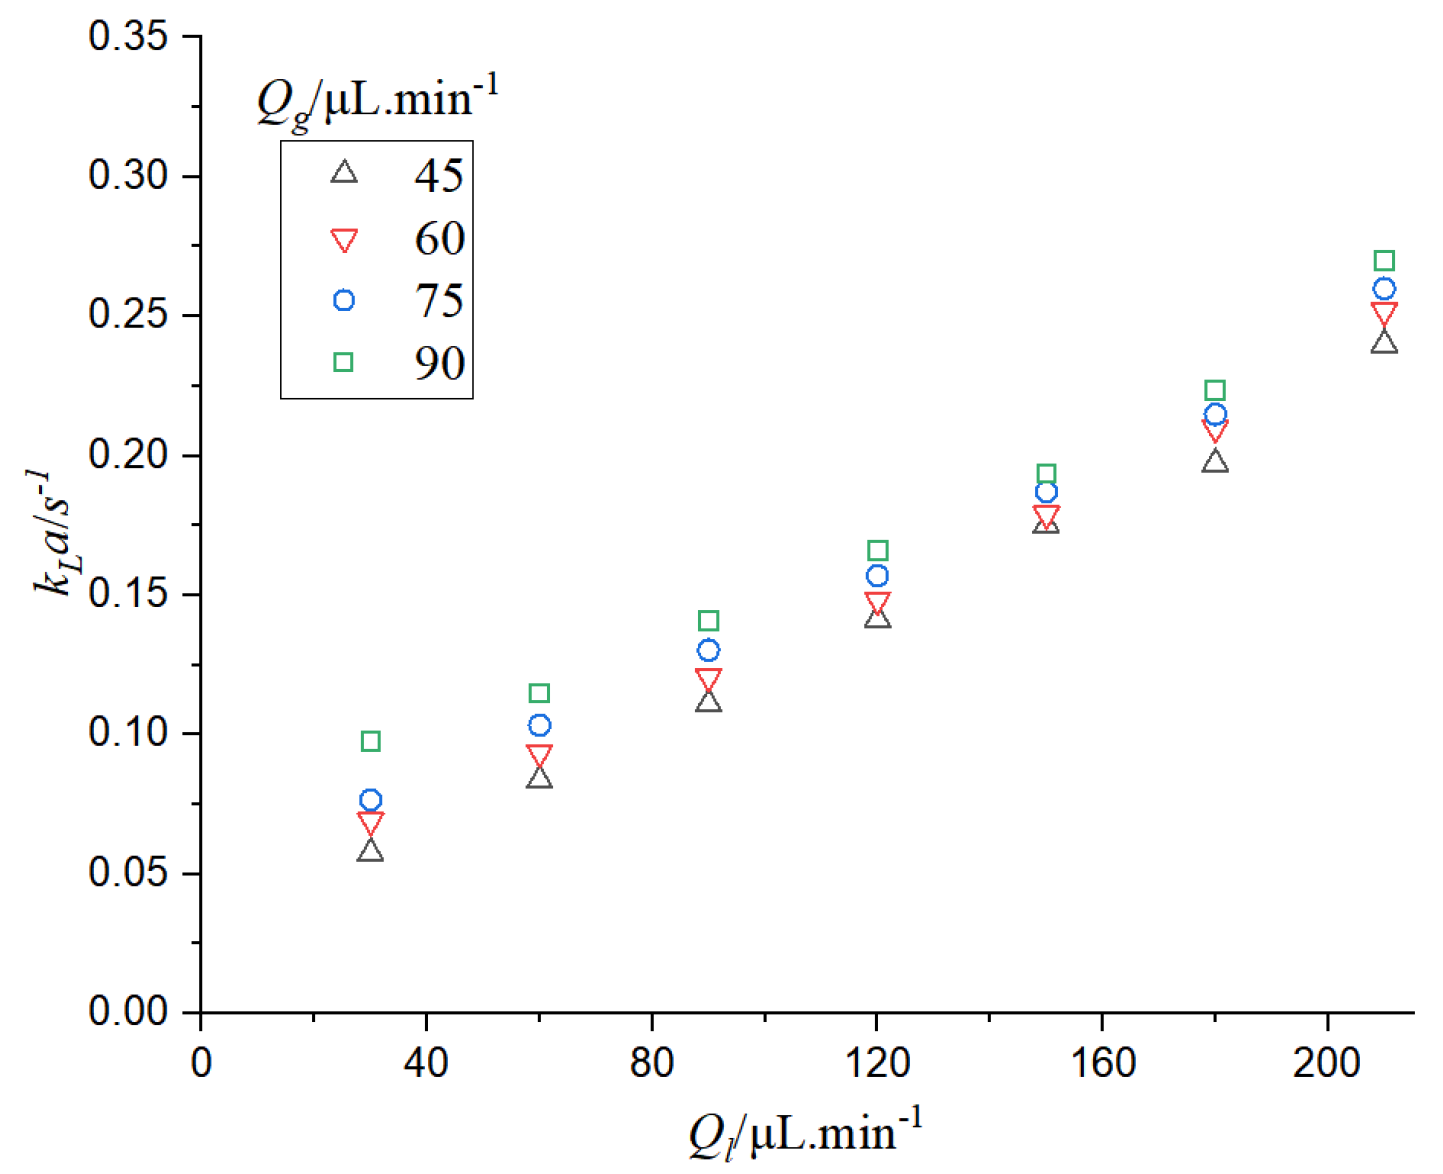
It can be seen from Figure 13 that when the gas phase flow rate is constant, the mass transfer coefficient increases with the increase of the gas-liquid phase flow rate. When the gas-liquid flow rate increases, the mass circulation intensifies and the mass transfer effect enhances. When the gas flow rate increases, the specific surface area of bubbles increases, while the specific surface area decreases with the increase of liquid flow rate. The residence time of bubbles in the microchannel also decreases with the increase of gas-liquid flow rate. According to the calculation formula of the mass transfer coefficient, the decrease of residence time can increase the mass transfer coefficient, so the increase of kLa is mainly caused by the increase of the specific surface area of bubbles and the decrease of the residence time of bubbles in the microchannel.
The change in gas-liquid flow rate will lead to the change of bubble and liquid slug length, thus affecting the absorption of CO2. The CO2 mass transfer coefficient under the influence of bubble and liquid slug was studied.
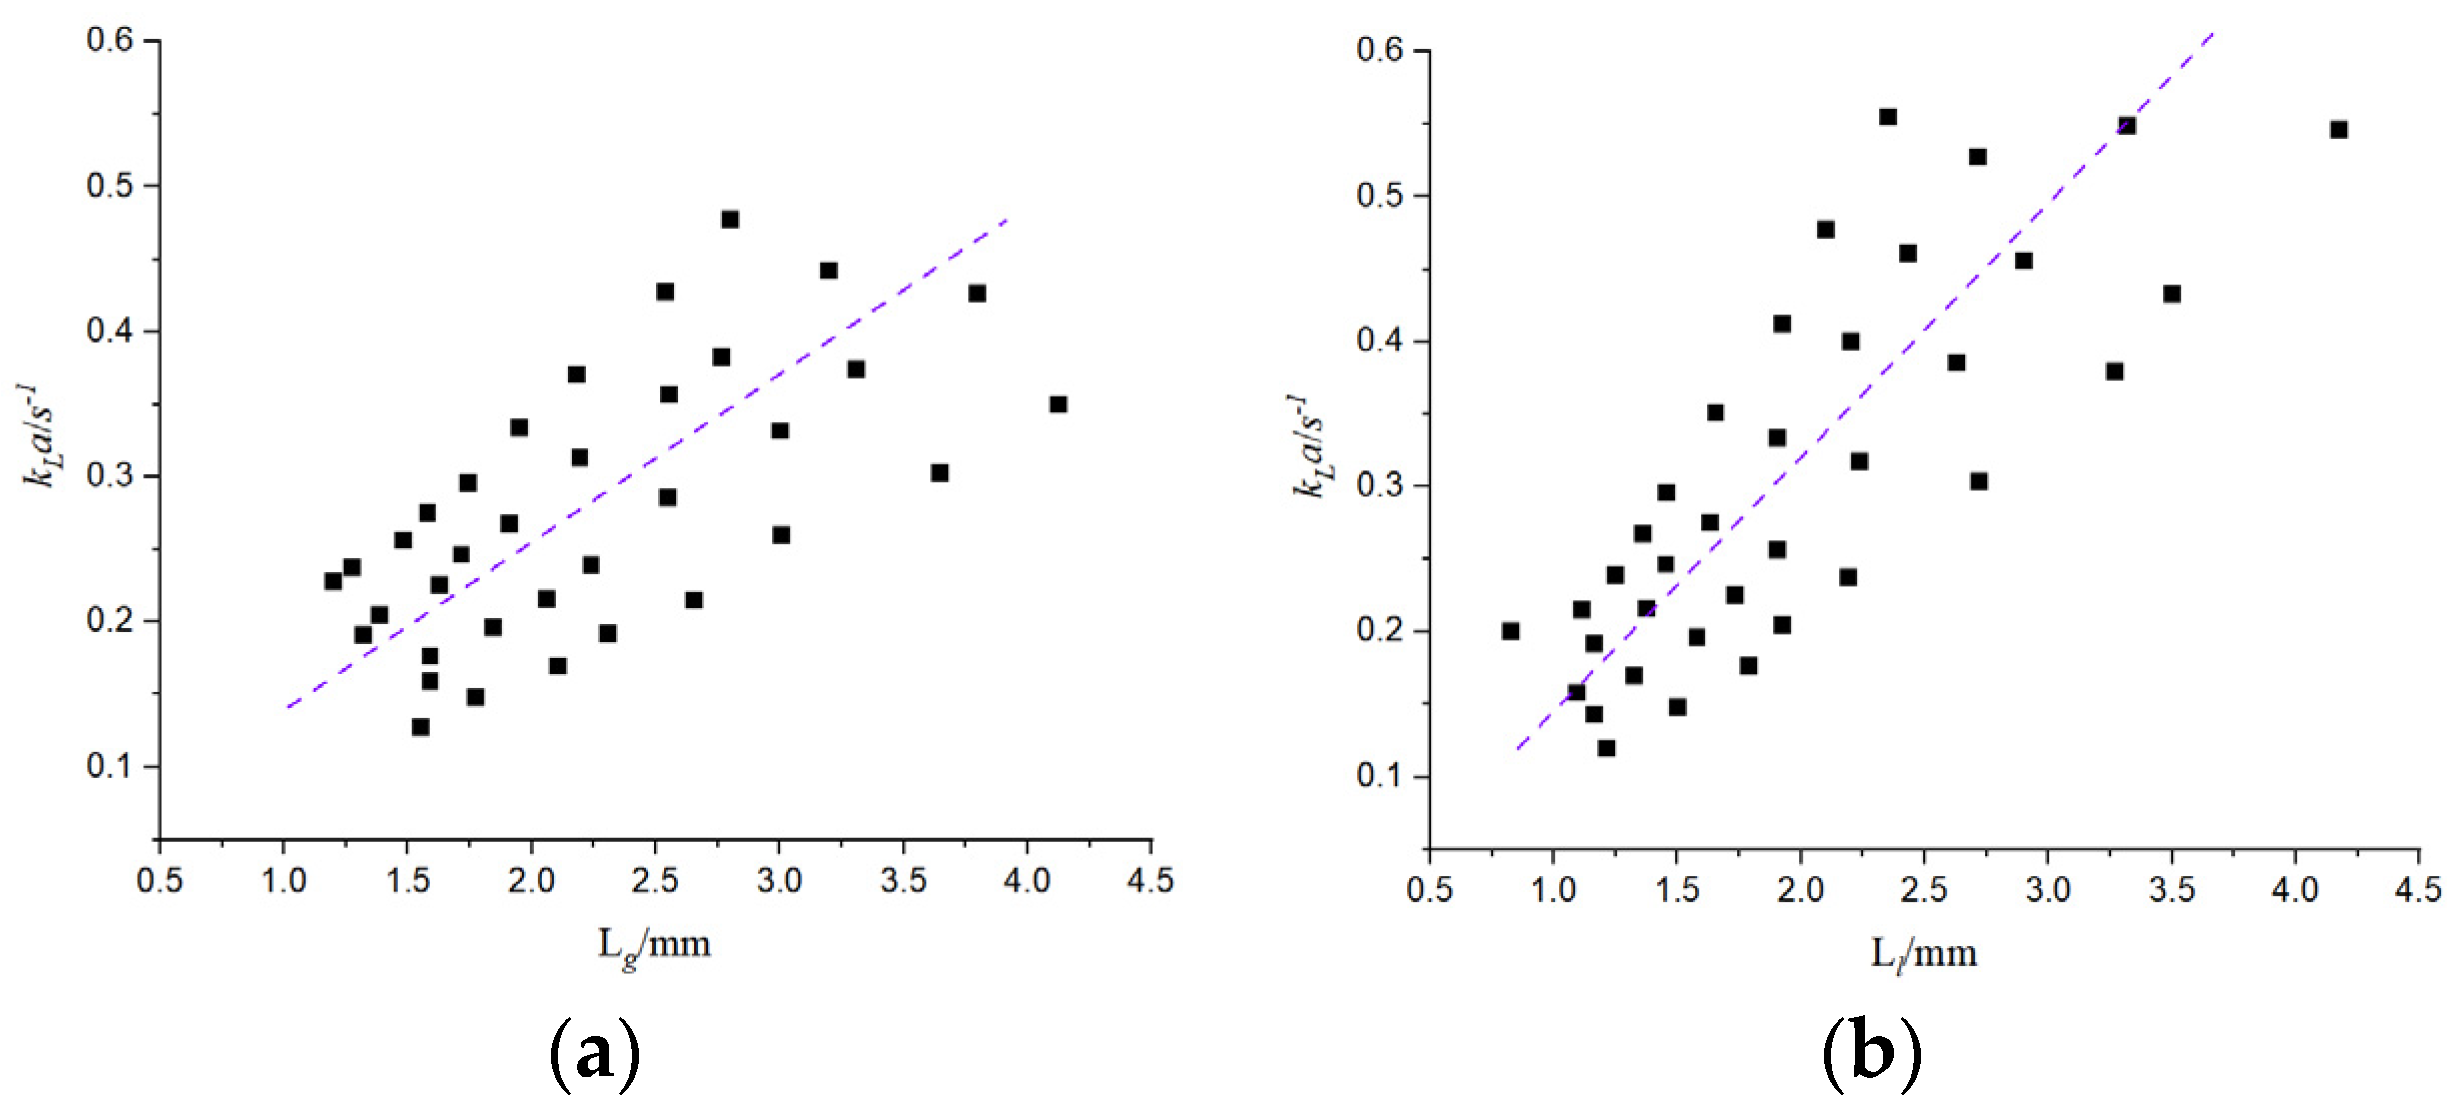
It can be seen from Figure 14 that when the bubble length is constant and the liquid slug length increases, or when the liquid slug length is constant and the bubble length increases, the mass transfer coefficient increases, which verifies that the increase of gas-liquid phase flow rate can lead to the intensification of mass transfer.
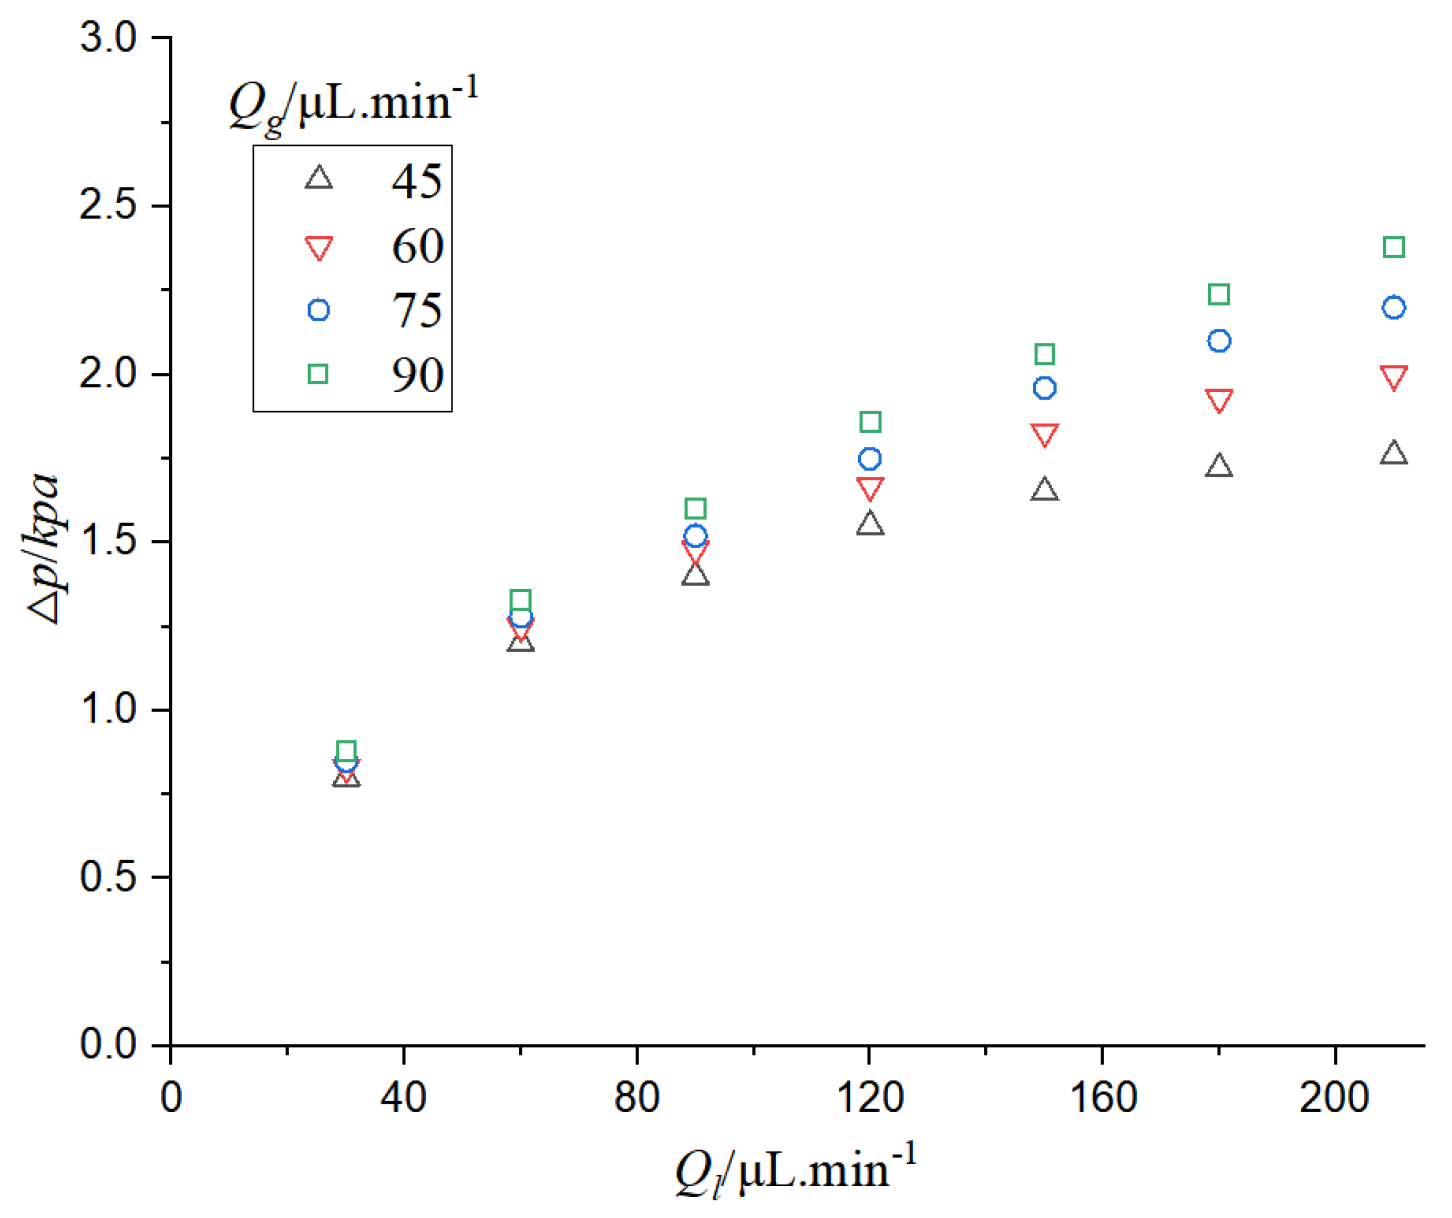
The gas-liquid two-phase flow is introduced into the microchannel to carry out the chemical reaction, and the gas is dissolved into the liquid phase at the initial stage. Taylor flow mass transfer studies on physical absorption have shown [43] that the pressure of the gas is the main factor in the initial stage of gas dissolution. Fluid transport in microchannels is affected by surface friction, resulting in a pressure drop. Pressure drop is an important parameter of gas-liquid two-phase flow, which affects the chemical reaction rate, gas-liquid flow rate, and the stability of the reaction.
It can be seen from Figure 15 that when the gas phase flow rate is constant, the pressure drop in the CO2-H2O system increases with the increase of the liquid phase flow rate. When the liquid velocity is constant, the pressure drop increases with the increase of gas velocity. When the flow velocity of the gas-liquid two-phase flow increases, the microfluidics need great pumping pressure, and thus its pressure drop increases. With the increase of gas-liquid flow rate, the growth trend of the pressure drop gradually slows down, especially when the gas-liquid flow rate difference is large; the velocity of the phase with larger flow rate continues to increase, and the increase of pressure drop is very small. This is because the increase of liquid phase flow and gas phase flow can lead to the increase of pressure drop, and the increase of pressure drop is also affected by the bubble absorption of the liquid phase. When the difference of gas-liquid flow is large, the change of bubble length is reduced, so the influence of gas phase absorption on pressure drop is reduced.
It can be seen from Figure 16 that when the pressure drop increases, the mass transfer coefficient increases. The pressure drop of two-phase flow can promote mass transfer. The increase of pressure drop is mainly affected by the increase of liquid flow rate, and the increase of gas-liquid flow rate can accelerate the mass transfer. The increase of pressure can increase the solubility of CO2 in the electrolyte, thus increasing the concentration of CO2 on the surface of the catalyst and thereby increasing the rate of chemical reaction.
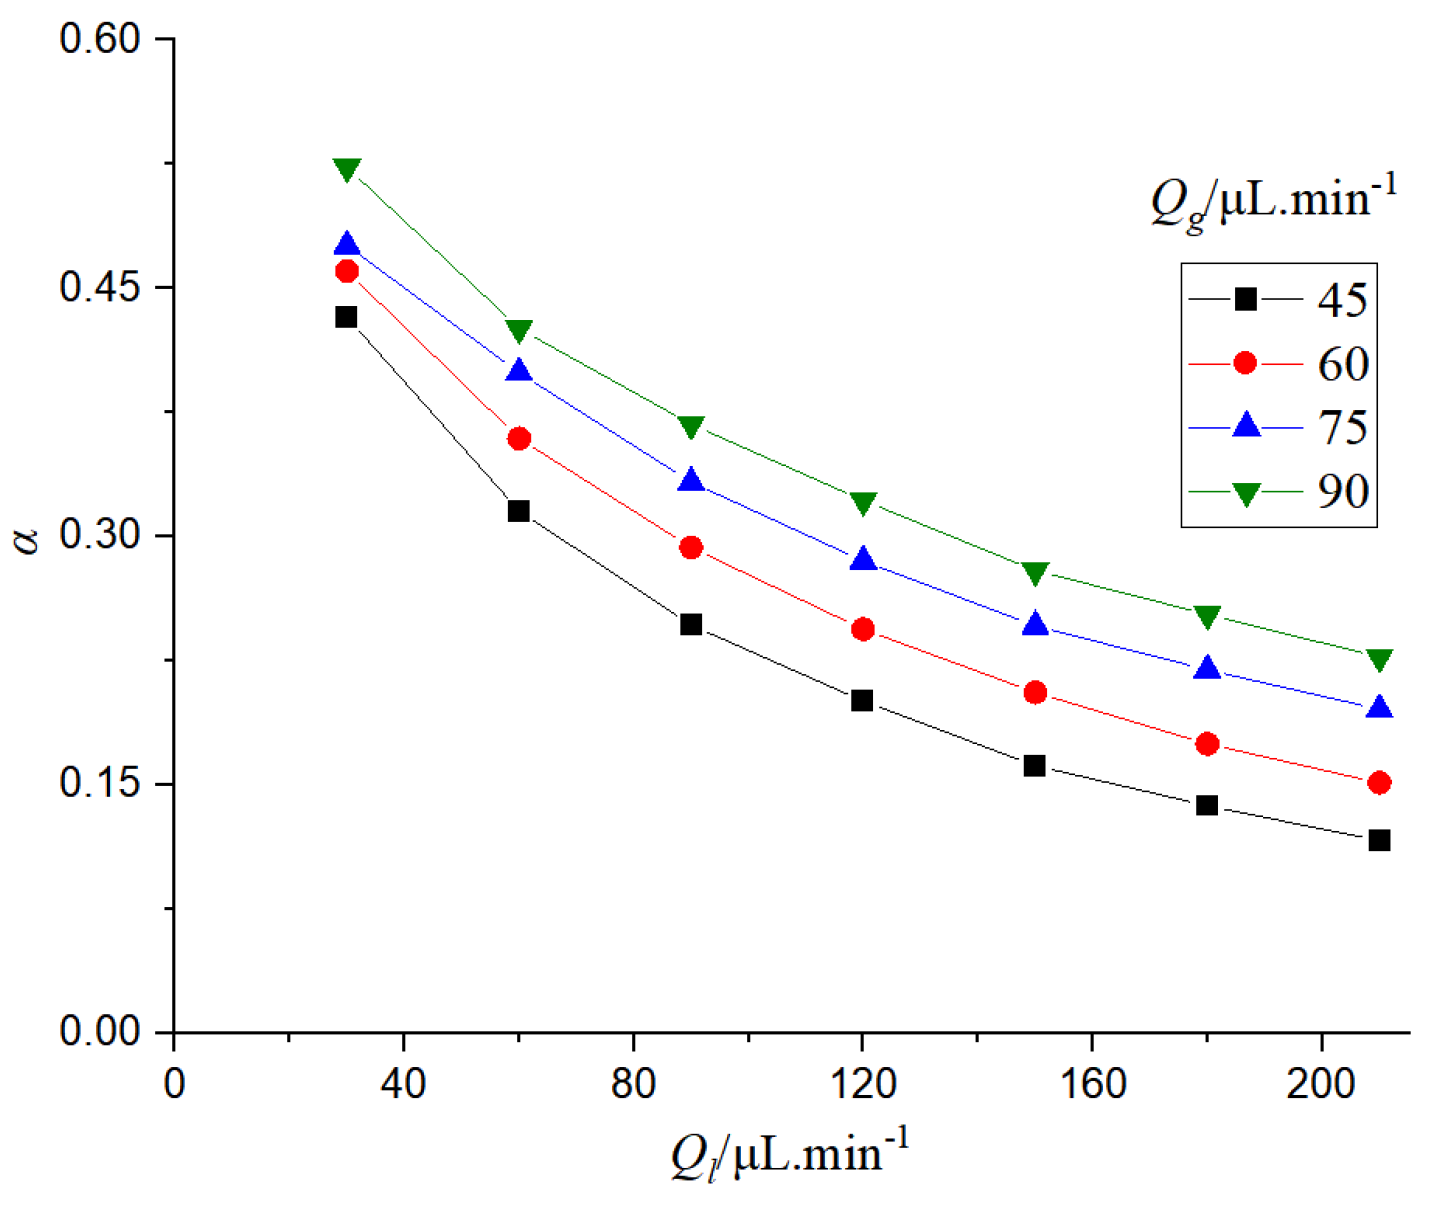
It can be seen from Figure 17 that the porosity in the microchannel is determined by the distribution of bubbles and liquid slugs. When the gas flow rate is constant, the bubble length becomes shorter and the porosity decreases with the increase of the liquid flow rate. When the liquid flow rate is fixed, the porosity increases with the increase of the gas flow rate.
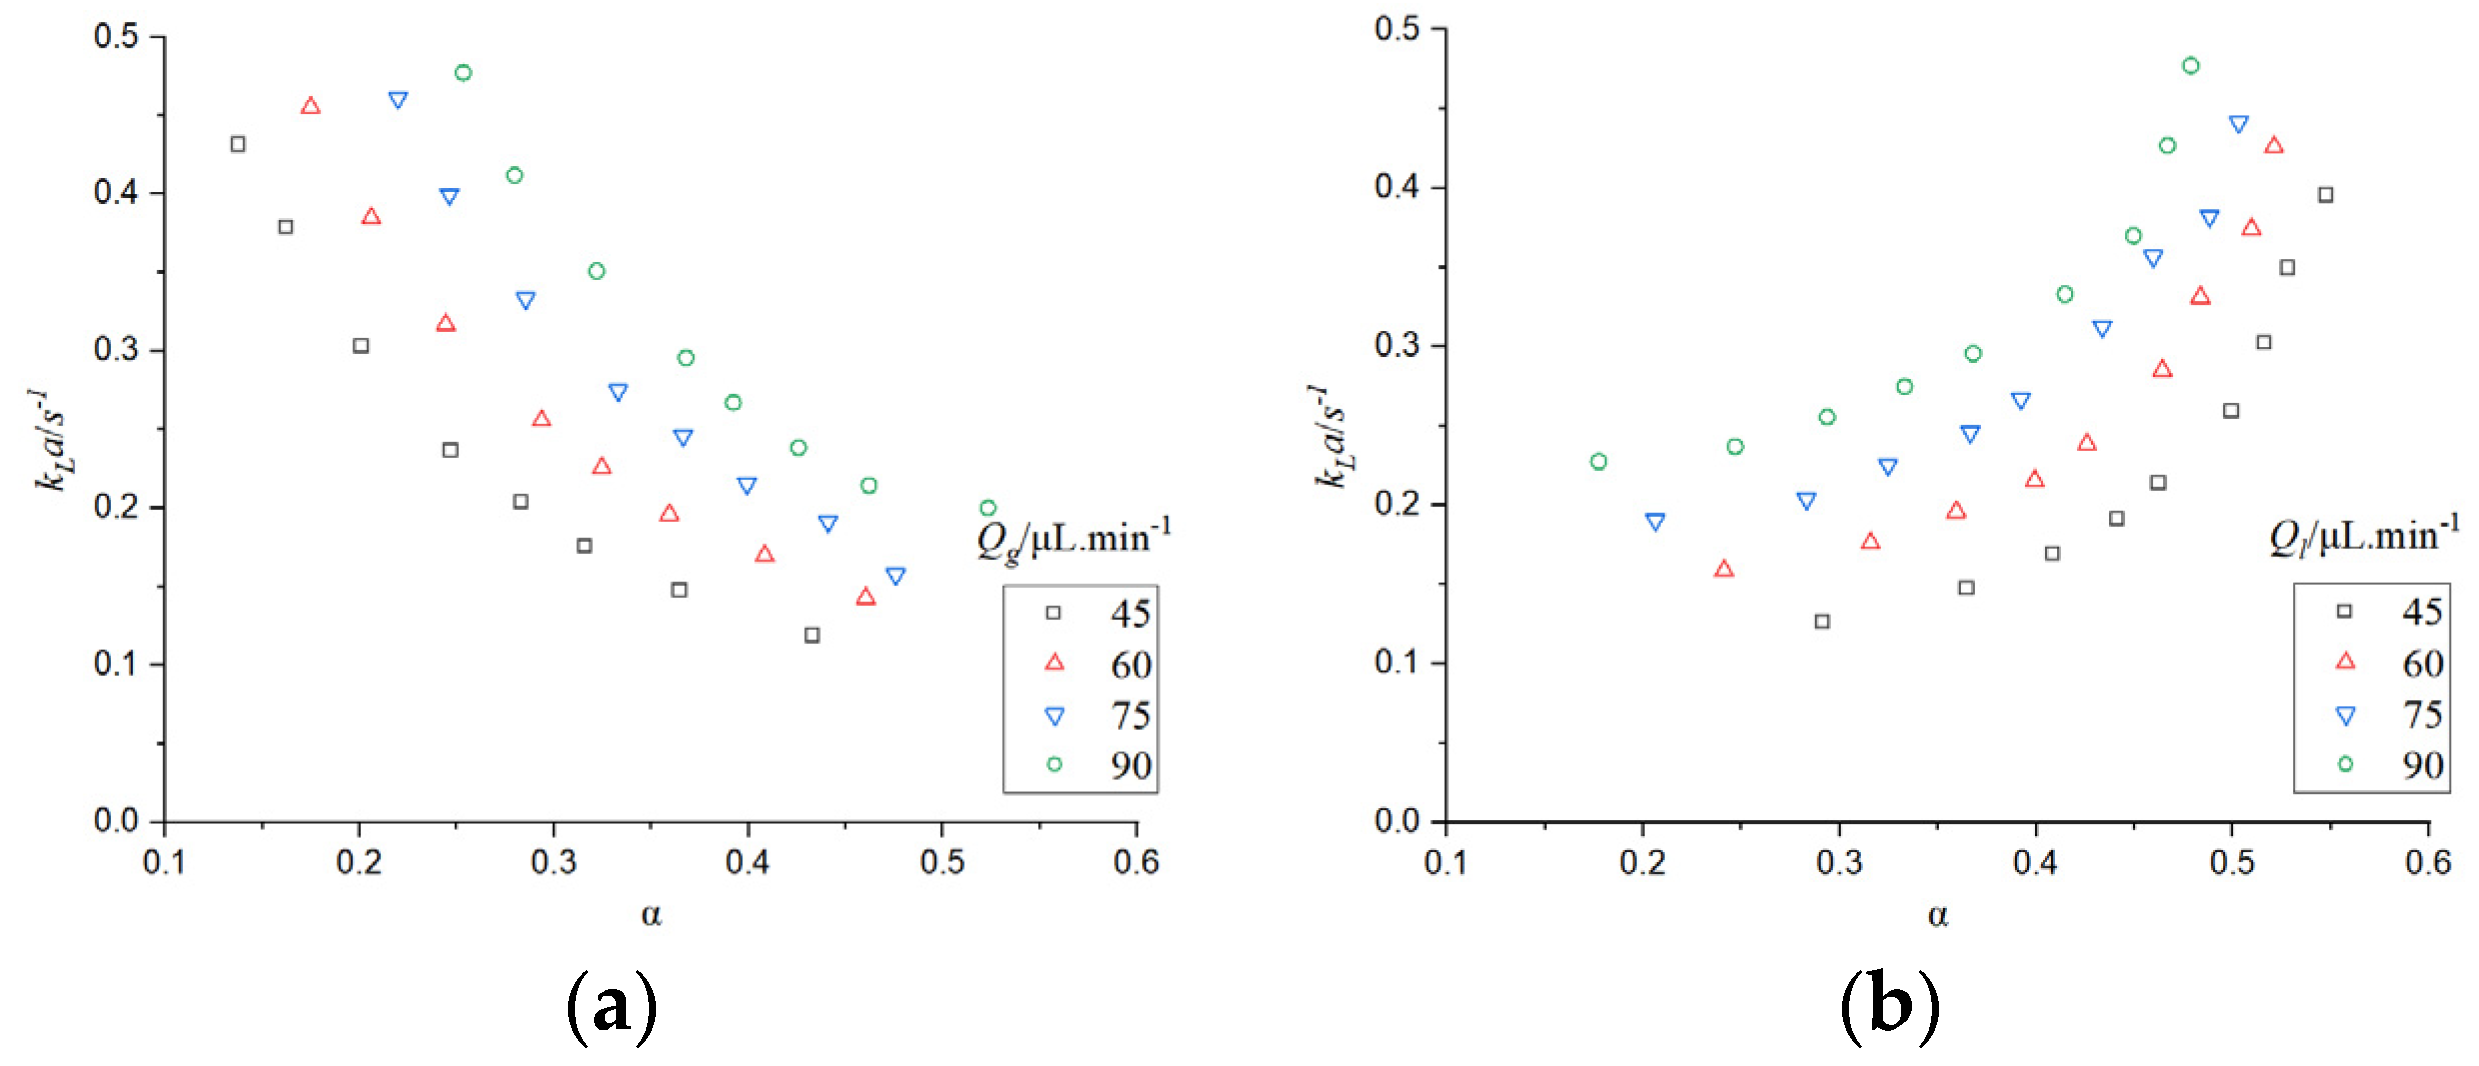
Porosity can reflect the flow relationship between gas and liquid, thus affecting the absorption and mass transfer performance of CO2. The effect of porosity on the mass transfer coefficient was studied.
It can be seen from Figure 18 that when the gas phase flow rate is constant, if the porosity increases, the mass transfer efficiency will decrease. This is because the porosity reflects the ratio of gas-liquid flow rate in the microchannel. When the gas flow rate is constant, the increase of porosity is due to the decrease of liquid flow rate, and the decrease of liquid flow rate will reduce the mass transfer efficiency. When the liquid flow rate is constant, the increase of porosity will lead to the increase of the mass transfer coefficient, which is mainly due to the increase of gas flow rate.

3.3. Prediction of Mass Transfer Coefficients for Physical Absorption of CO2

Many scholars have studied the mass transfer of gas-liquid two-phase flow, and proposed a relevant prediction formula of the mass transfer coefficient.
Yue et al. [44] predicted the mass transfer coefficient of CO2 absorption by deionized water in a microchannel, and proposed a prediction formula for the correlation between the mass transfer coefficient, Reynolds number, and Schmidt number, which is as follows:
S h L a d H = 0.084 Re G 0.213 Re L 0.937 S c L 0.5
where ShLadH is the Sherwood number, ShLadH = kLdH/D, and ScL is the liquid phase Schmidt number, ScL = μL/(ρLD).
Ji et al. [45] studied the mass transfer process of CO2 absorption by deionized water, ethanol, and n-propanol in the microchannel, and proposed the mass transfer prediction method. The prediction formula of mass transfer coefficient is as follows:
S h L a d H = 0.22 Re G 0.78 Re L 0.0535 S c L 0.5 C a L 0.7586
where CaL is the liquid phase Capillary number, and CaL = ULμL/σ.
Yin et al. [24,42] studied the mass transfer of CO2 absorbed by monoethanolamine and other solutions, and proposed a prediction method of mass transfer coefficient by using the Reynolds number and Damkohler number, and obtained the prediction formula of mass transfer coefficient as follows:
S h L a d H = 0.81 Re G 0.78 Re L 0.41 D a 0.35
where Da is the Damkohler number,
D a = k o v d H 2 / D
where kov is the overall reaction rate constant.
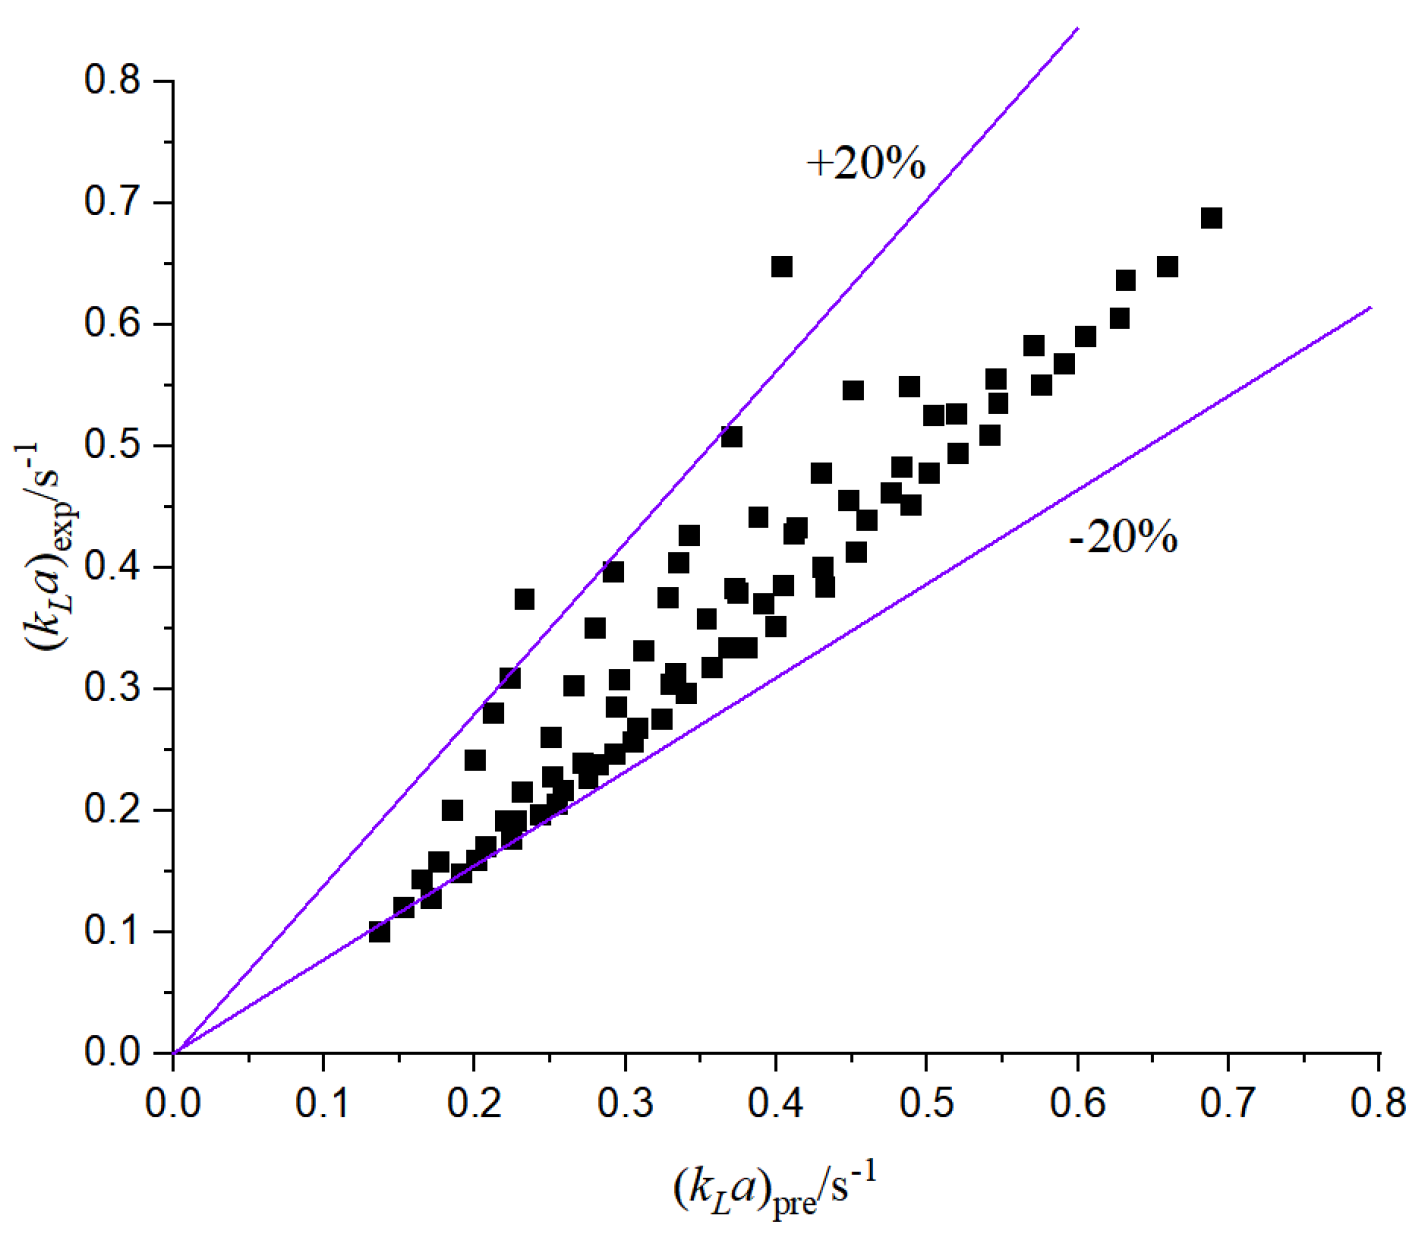
The above different prediction models are compared with this experiment, and there are some errors with the results of this paper. On the one hand, the reason lies in the influence of the size of the microchannel structure and the operating conditions. On the other hand, the micro-reaction channel has a cathode and an anode; the cathode and the anode are separated by a proton exchange membrane, and water molecules exchange substances between the cathode and the anode. Moreover, the gas-liquid two-phase flow rate in other literature is large, and the applicability is poor for the working conditions with a small flow rate. Therefore, based on the microchannel designed in this paper, the relevant mass transfer prediction formula is improved, as shown in Figure 19, the mass transfer coefficient is fitted, and the following correlation is obtained:
S h L a d H = 0.0039 Re G 0.2739 Re L 0.5566 S c L 0.5
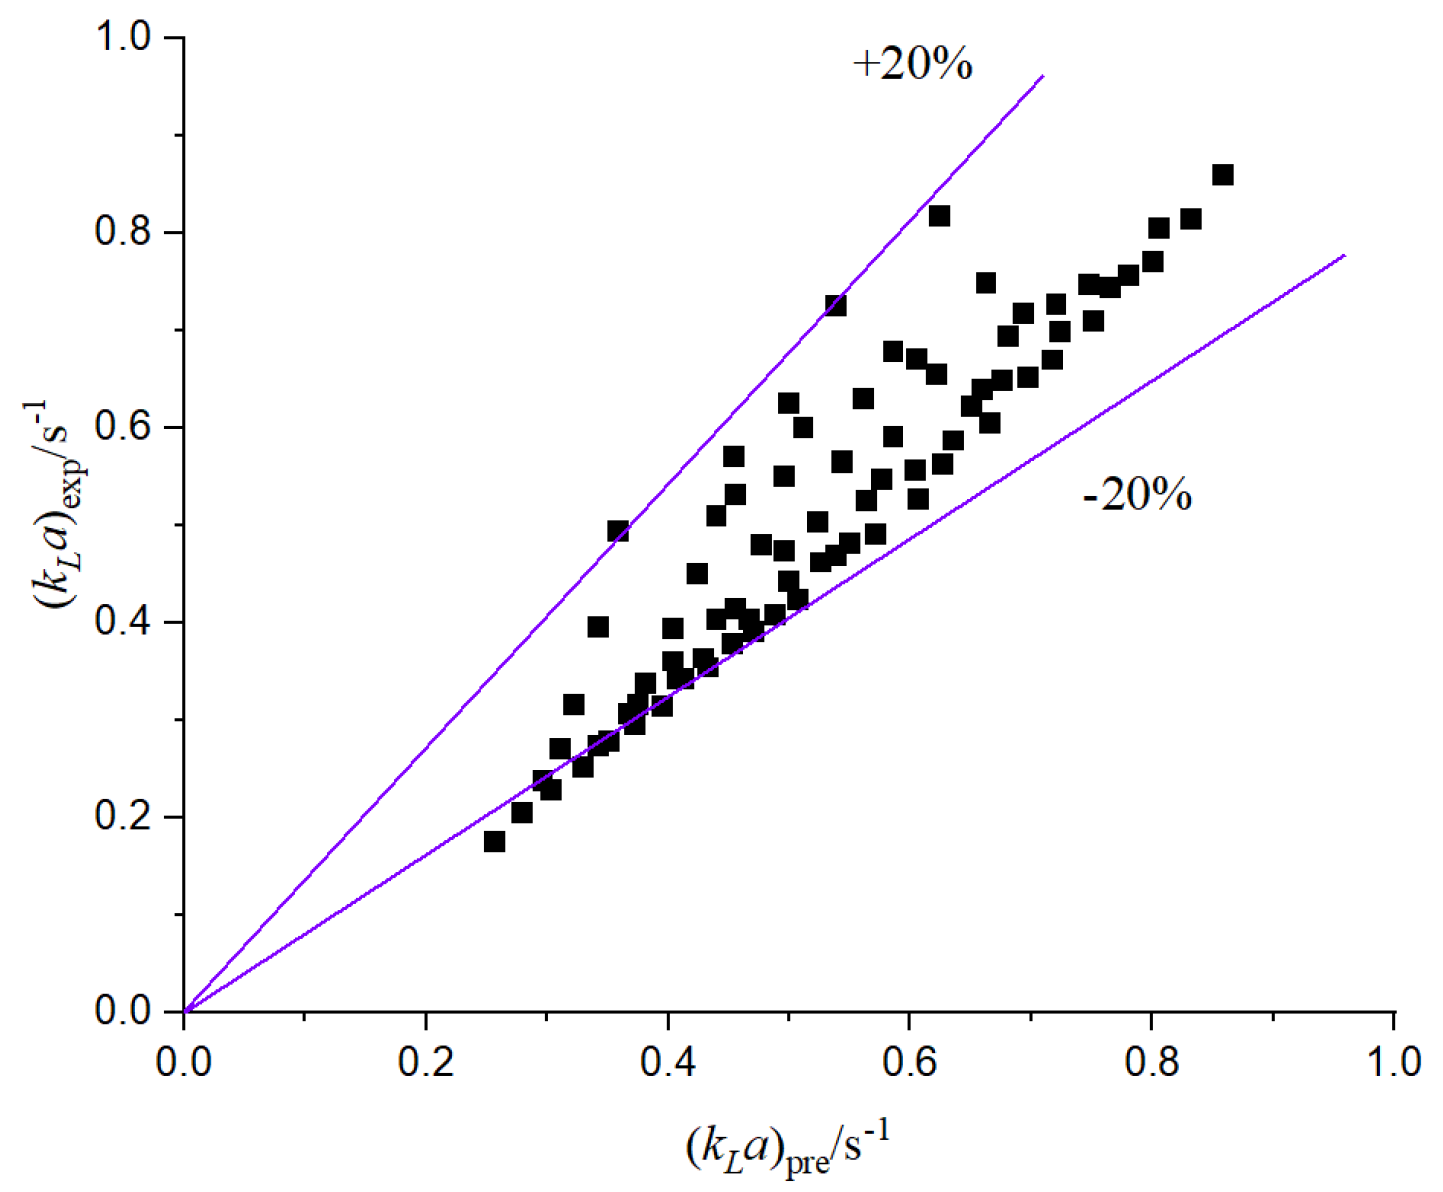
According to the comparison between the experimental mass transfer coefficient and the predicted value, the prediction of the two-phase flow mass transfer coefficient is accurate, the correlation is better, and the relative error is basically within 20%.

4. Mass Transfer of Chemical Absorption in Microreactor

4.1. Mass Transfer in Electrochemical Reaction

The reduction reaction of CO2 is carried out at the cathode in the microreactor, and the reduction reaction is affected by many factors. The analysis of physical absorption shows that the mass transfer in the micro-channel is affected by the hydrodynamic characteristics of Taylor flow. For the CO2 absorption process with the participation of chemical reaction, the chemical reaction and fluid flow interact with each other. On the one hand, Taylor flow affects the mass transfer and product yield of chemical reactions. On the other hand, the chemical reaction affects the characteristics of Taylor bubble change, porosity, and pressure drop.
A NaHCO3 solution with a volume fraction of 5% was introduced into the liquid phase inlet, CO2 was introduced into the gas phase inlet, and the experiment was carried out by changing the flow rate of gas and liquid phases. The flow rate of the liquid phase in the negative and positive stages remain the same. The TiO2-Cu2O electrode was used for catalysis, the catalyst loading was 0. 01 g/cm2, and the applied voltage was applied on the cathode and anode. The length of bubbles and liquid slugs were observed and recorded at intervals during the reaction, and the yield of products was measured after a period of catalytic reaction.
The formation process of Taylor bubbles and liquid slug under chemical reaction was studied, and the changes in bubble length, porosity, pressure drop, and mass transfer coefficient under the chemical reaction were analyzed.
It can be seen from Figure 20 that the bubble length gradually decreases with the chemical reaction and gas diffusion. At the initial moment, the length of the bubble decreases rapidly, and after a period of time, the change in length gradually decreases; that is, the slope of the curve in the figure decreases. Compared to the relative loss length of bubbles in the physical absorption process, it can be found that the relative loss length of bubbles in the chemical reaction is larger, and the change of bubbles is more obvious.
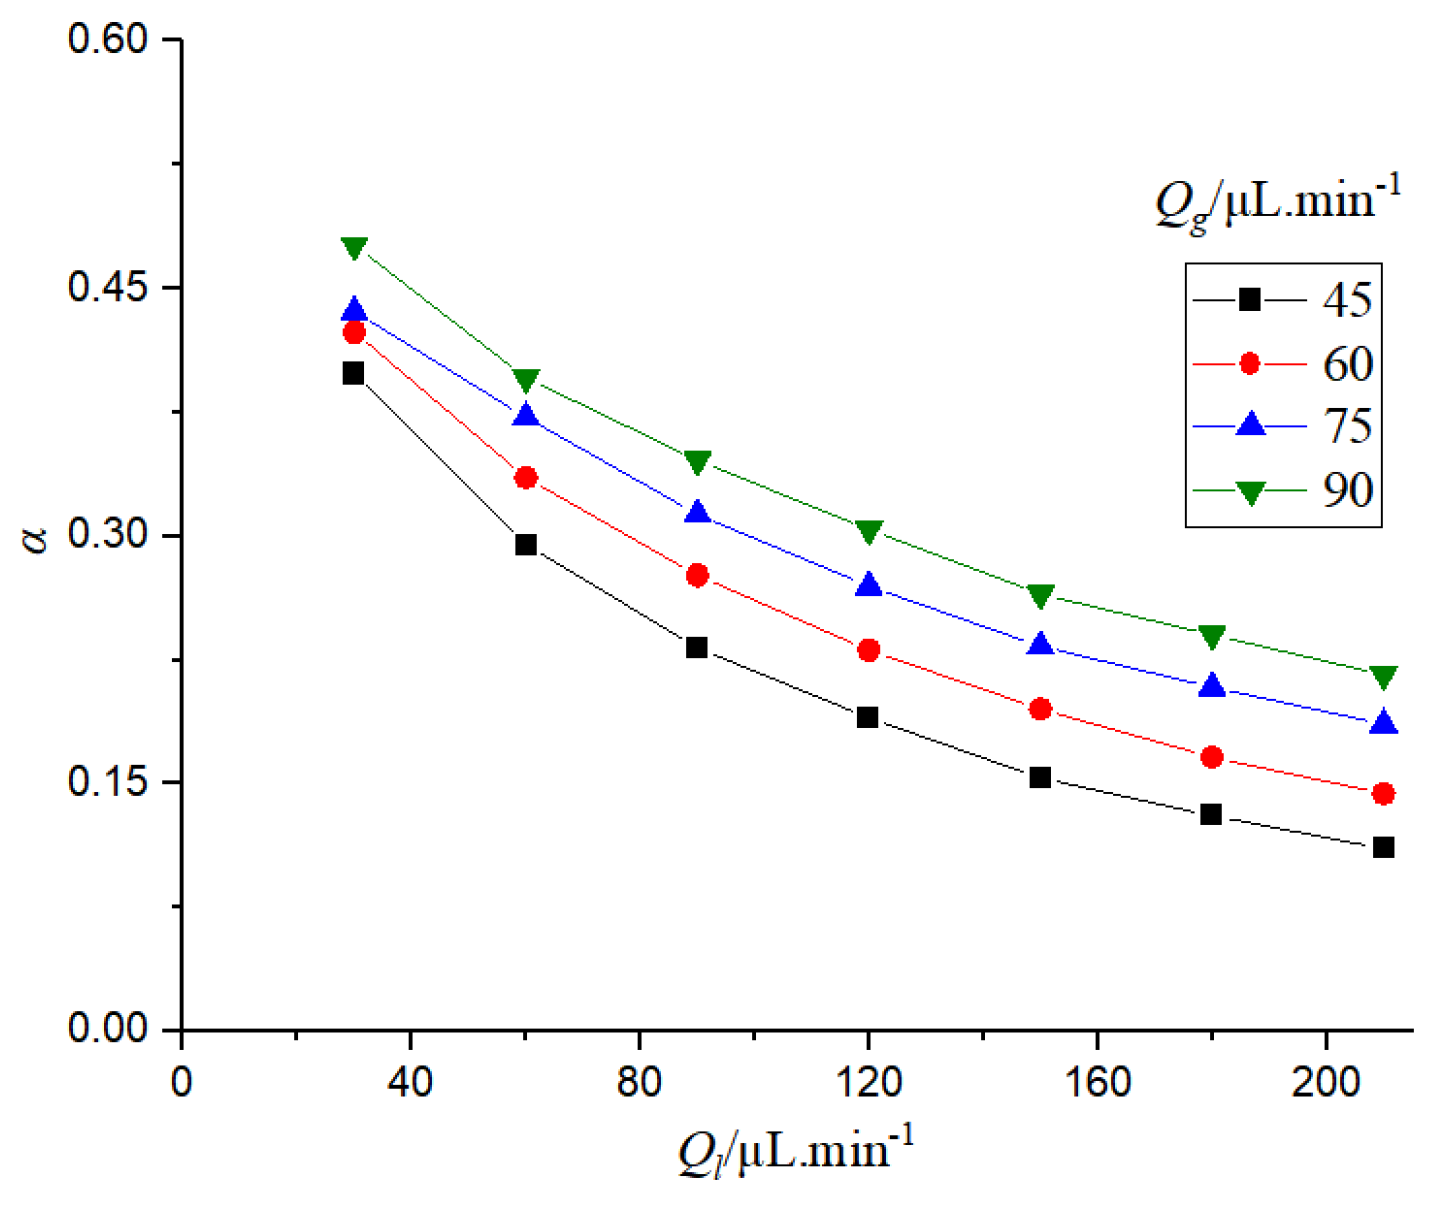
It can be seen from Figure 21 that the electrochemical absorption is similar to the physical absorption. In the electrochemical reaction, when the liquid phase flow rate increases, the porosity decreases; when the gas phase flow rate increases, the porosity of the microchannel increases. When the gas flow rate increases, the gas content in the microchannel increases, so the porosity increases. When the liquid flow rate increases, the liquid content in the microchannel increases and the porosity decreases. By comparing the changes of porosity in physical absorption and chemical absorption, it can be found that the porosity in electrochemical absorption is smaller. This is because the rate of chemical reaction increases and the consumption of CO2 increases, resulting in a decrease in porosity.
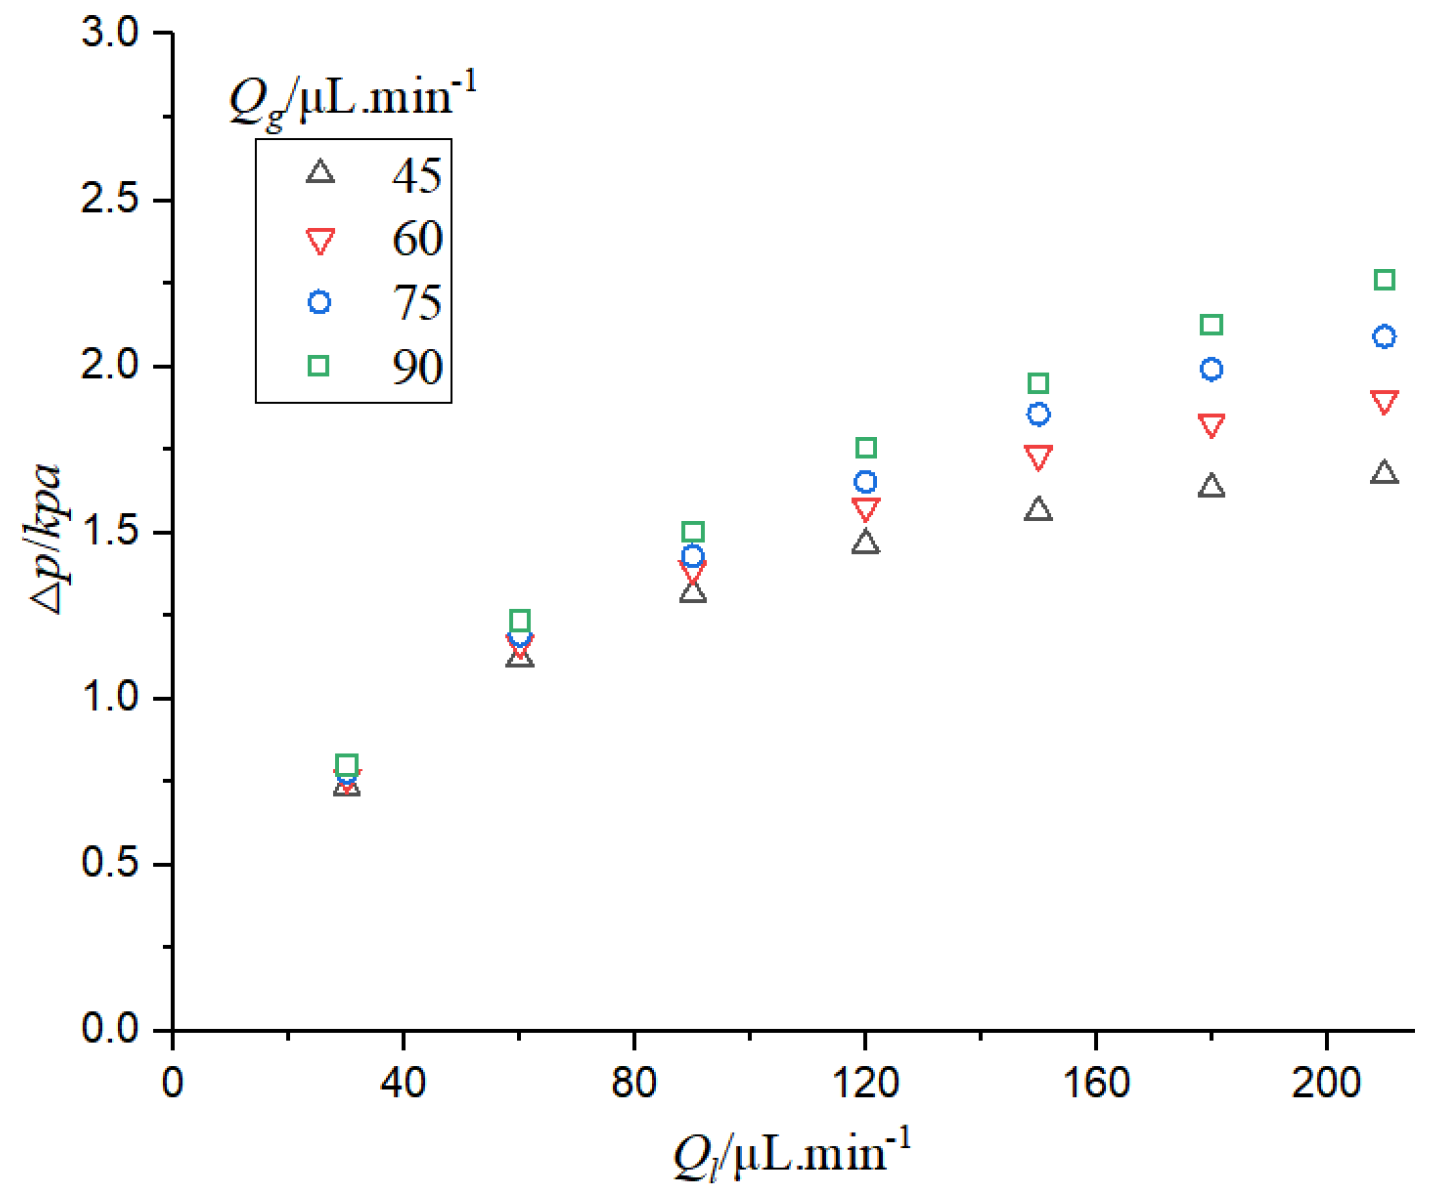
It can be seen from Figure 22 that when the liquid phase flow rate is constant, the pressure drop increases with the increase of the gas phase flow rate. By comparing the pressure drop in the electrochemical reaction with that of physical absorption, it can be found that the pressure drop in electrochemical reaction is low. This is because the porosity of the electrochemical reaction is increased, the length of the bubble is reduced, and the friction resistance to the fluid movement is reduced, so that the pressure drop in the channel is reduced.
Next, the mass transfer coefficient of the electrochemical reduction of CO2 in the microchannel was studied.
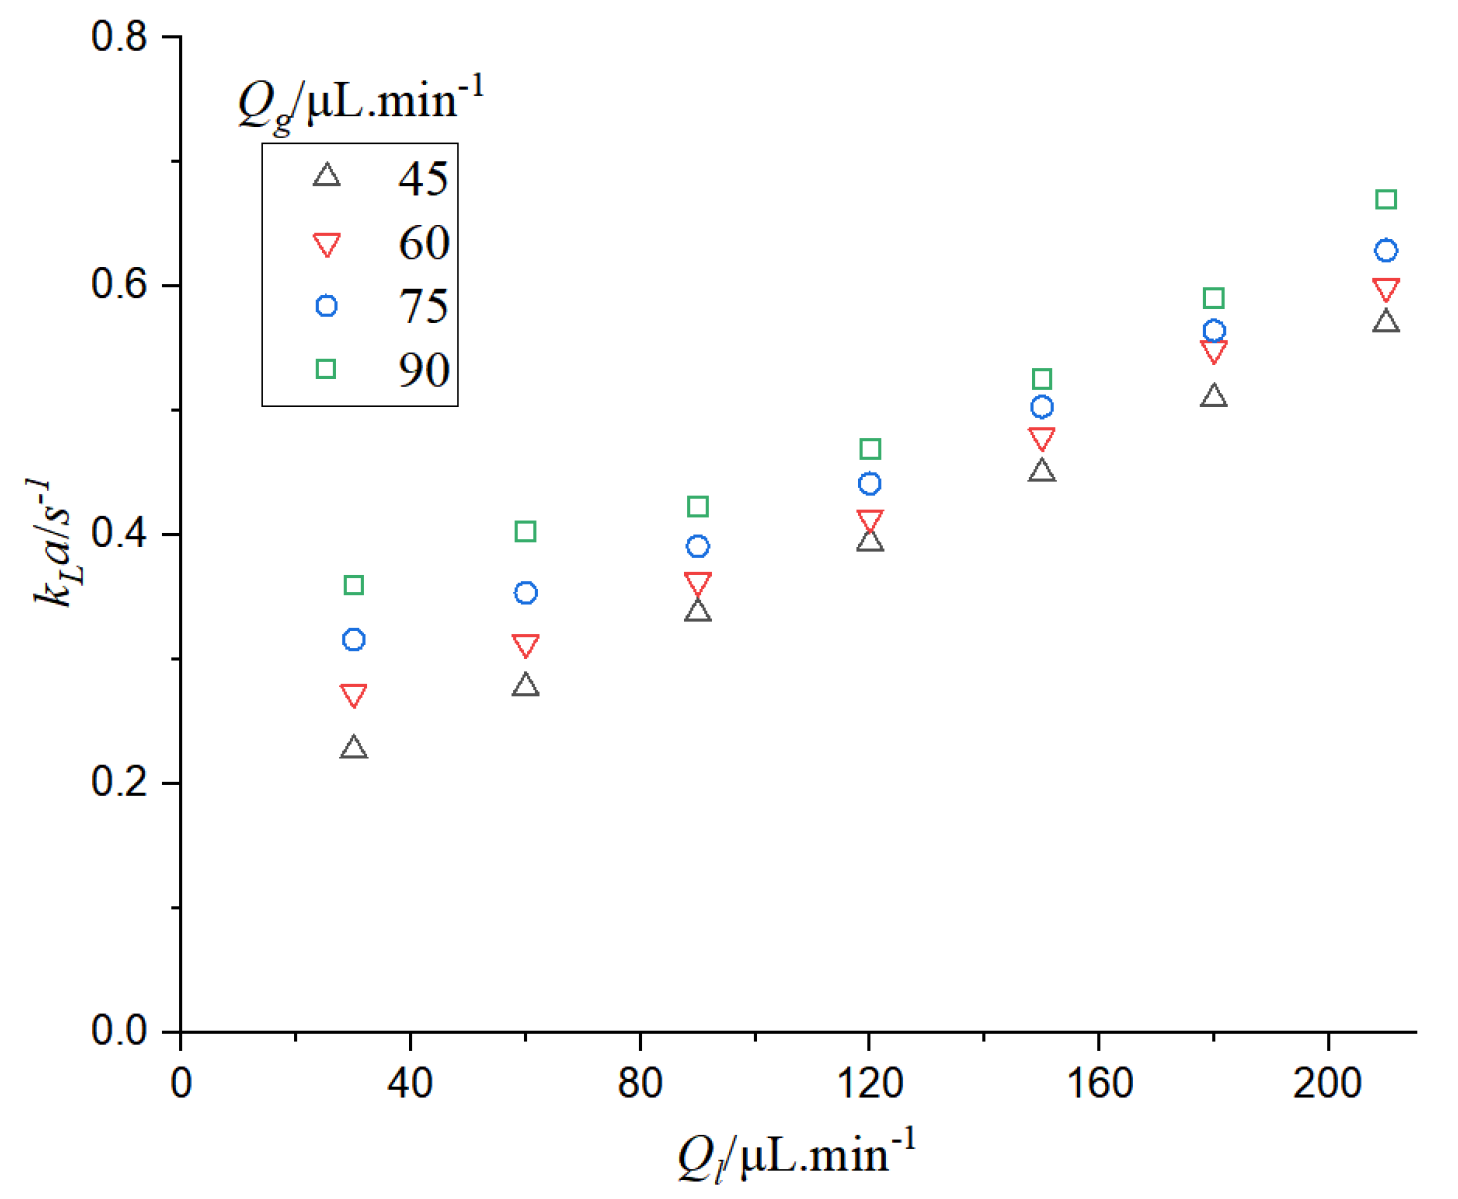
It can be seen from Figure 23 that the mass transfer coefficient increases when the gas-liquid phase flow rate increases. When the gas-liquid flow rate increases, the mass exchange of the two-phase flow in the microchannel is more sufficient, and the mass transfer coefficient increases. Moreover, the increase of gas-liquid phase flow rate also increases the flux of reaction substances, accelerates the rate of the chemical reaction, and is beneficial to mass transfer. By comparing the mass transfer coefficient in physical absorption, it can be found that the mass transfer coefficient in electrochemical absorption is larger than that in physical absorption. Chemical absorption includes the diffusion of substances and the absorption of chemical reactions.
Mass transfer in electrochemical reaction is affected by many factors, such as gas-liquid flow rate, applied voltage, catalyst type and loading, and micro-channel structure. It is difficult to predict the mass transfer coefficient in electrochemical reactions.
The mass transfer coefficient in the electrochemical reaction in this chapter is fitted and predicted. The applied voltage is 4 V, the catalyst is TiO2-Cu2O, the catalyst loading is 0.01 g/cm2, and the fitting formula of the mass transfer coefficient is as follows:
S h L a d H = 0.005 Re G 0.4134 Re L 0.2068 S c L 0.5
According to the comparison between the experimental mass transfer coefficient and the predicted value in the electrochemical reaction, as shown in Figure 24, the correlation between them is good, and the relative error is basically within 20%.

4.2. Enhancement Factor of CO2 Absorption

Chemical reactions are limited by mass transfer, but chemical reactions affect mass transfer. By comparing the mass transfer coefficients of the physical absorption of CO2 and electrochemical reduction of CO2, it can be found that the electrochemical reaction has a promoting effect on the absorption of CO2. The enhancement factor can be used to reflect the relationship between chemical absorption and physical absorption, and its calculation formula is as follows:
E = k L , c h e m i c a l k L , p h y s i c a l
Then, the effect of gas-liquid flow rate on enhancement factor was analyzed.
It can be seen from Figure 25 that when the liquid phase flow rate is the same, if the gas phase flow rate increases, the enhancement factor will increase. When the gas flow rate increases, the initial disturbance force of the two-phase flow increases, the CO2 reduction reaction accelerates, the gas consumption intensifies, and the mass transfer is intense. Moreover, the increase of gas phase flow rate also makes the bubble length larger, and the initial driving force of the gas phase operation is larger, so the mass transfer coefficient increases faster and the enhancement factor increases. When the gas flow rate is the same, the enhancement factor decreases with the increase of the liquid flow rate. This is contrary to the rule of CO2 absorption by alkanolamine solution in the literature [46]. On one hand, it is due to the different structural dimensions of the microchannel, but on the other hand, there is a water electrolysis reaction in this study, and the H+ generated will affect the absorption of CO2 by aqueous solution. When the liquid flow rate increases, on the one hand, the material circulation intensifies and the mass transfer coefficient increases. On the other hand, the increase of H + will hinder the absorption rate of CO2 in the liquid phase.

4.3. Effect of Mass Transfer on Chemical Reaction

Gas-liquid circulation affects the substance formation in chemical reactions. The catalytic reaction was carried out for 3 h, and the yield of the product was measured. In this study, the main target product of artificial photosynthesis is CH3OH, in addition to H2, CO, HCOOH, and other by-products, and the yield was analyzed by gas chromatography. At present, the product evaluation of catalytic reactions usually uses the yield of unit mass catalyst for a period of time as the evaluation standard; that is, μmol/g is the yield unit. In this study, the catalyst was in good contact with the substrate, and the generation of the product was affected by many factors, such as the structural parameters of the microchip and the size of the electrode membrane. In order to evaluate the device more intuitively and optimize the microchip, the yield per unit area in a period of time was used as the evaluation standard; that is, μmol/cm2 was used as the yield unit.
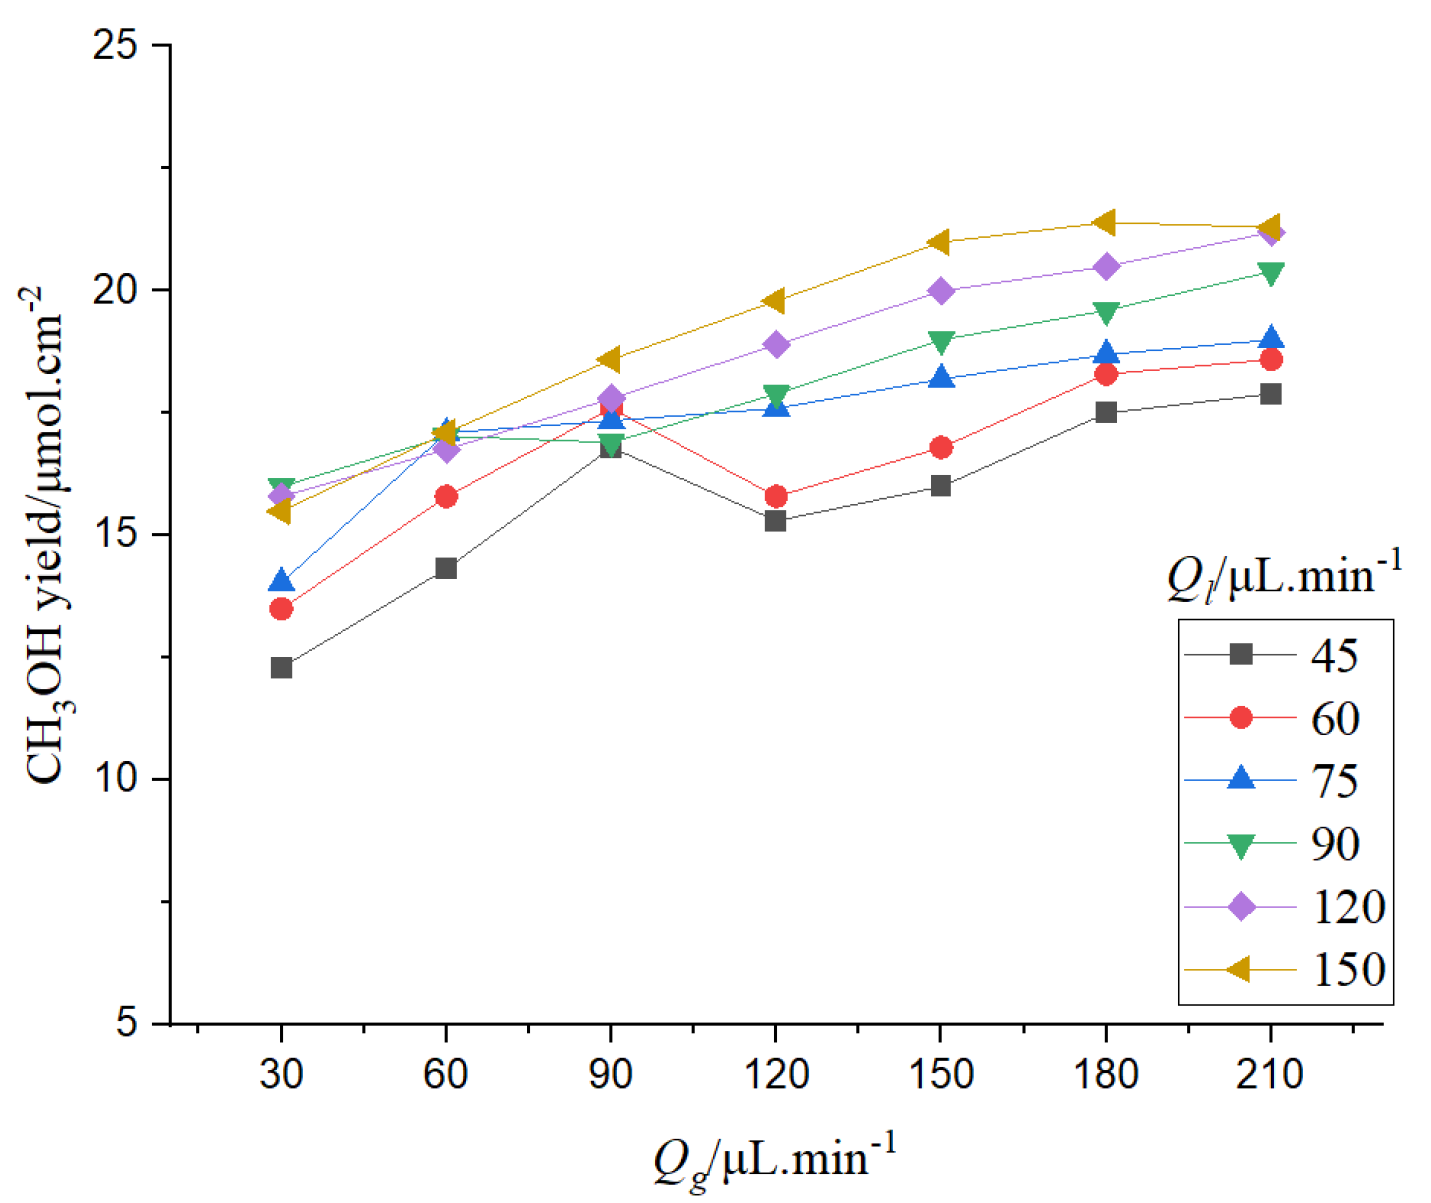
It can be seen from Figure 26 that when the gas phase flow rate is constant, the chemical reaction rate generally shows an increasing trend with the increase of the liquid phase flow rate. However, when the liquid flow rate is 60 μL/min–90 μL/min, the chemical reaction rate does not increase with the increase of the liquid flow rate, and even has a decreasing trend. The mass transfer of two-phase flow is affected by the velocity of the gas-liquid phase. When the velocity of the liquid phase is low, the pumping pressure of the liquid phase is low, and the bubbles exist in a stable form. Moreover, from the analysis above, it can be seen that the relative flow velocity of the gas-liquid interface is slow at low velocity, which is not conducive to the rapid occurrence of mass transfer. When the electrolyte flow rate increases, the mass transfer at the gas-liquid interface is enhanced and the reaction is sufficient, so the reaction rate increases. When the liquid flow rate increases, the mass transfer increases, and the side reactions of hydrogenation and CO generation are intensified. The generated gas is adsorbed on the surface of the catalyst layer, which limits the increase of the reaction rate. If the liquid flow rate continues to increase, the bubbles adsorbed on the surface of the catalyst layer can be brought out of the channel in time, so the chemical reaction rate can continue to increase.
When the liquid flow rate is fixed, with the increase of the gas flow rate, the production of CH3OH increases first, then decreases, and finally increases. When the gas flow rate increases, the concentration of CO2 in the microchannel increases, the mass transfer at the gas-liquid interface is enhanced due to the higher flow rate, and the reaction rate is accelerated. When the gas flow rate reaches a certain value, the generated bubbles will aggregate in the microchannel, which hinders the contact between the reactant and catalyst, and affects the continued increase of the reaction rate. When the gas flow rate continues to increase, part of the bubbles adsorbed in the microchannel will be taken out of the channel; the reaction rate shows an increasing trend, but the increasing rate slows down.
From the analysis of CH3OH production by gas-liquid flow rate, it can be found that when the gas-liquid flow rate is small, the chemical reaction increases faster with the increase of gas-liquid flow rate. When the gas-liquid flow rate is high, the chemical reaction rate will not increase or even decrease slightly with the increase of gas-liquid flow rate. This is because the excessive flow rate reduces the reaction time in the microchannel and reduces the yield of the reaction. Therefore, too large or too small gas-liquid flow rate is not conducive to the chemical reaction.
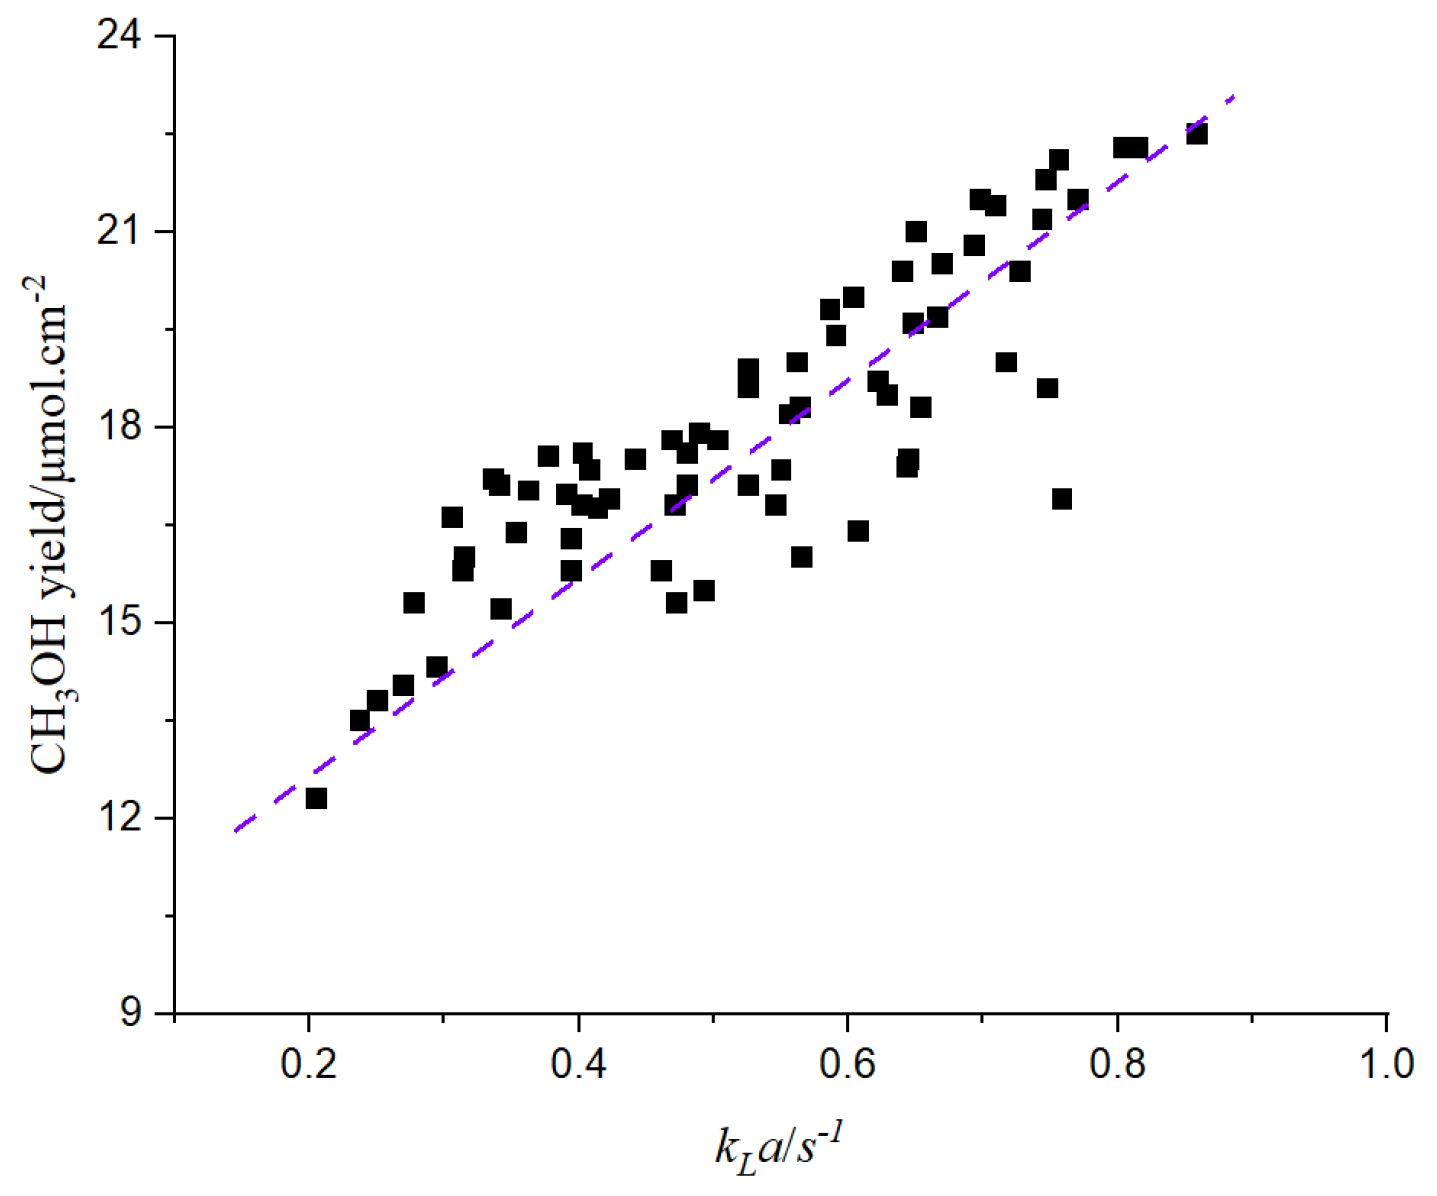
The chemical reaction is affected by the mass transfer rate. The following figure shows the relationship between the mass transfer coefficient and the yield of CH3OH.
It can be seen from Figure 27 that the yield of CH3OH increases with the increase of the mass transfer coefficient. The increase of the mass transfer coefficient leads to the intensification of material circulation, which accelerates the chemical reaction and increases the yield of products.
5. Conclusions

In this paper, the micro-scale effect in chemical reactions is introduced, and the effects of pressure drop, porosity, and the mass transfer coefficient on chemical reaction and product formation are analyzed. Then, mass transfer under physical absorption and chemical absorption is studied. Absorption of CO2 in an aqueous solution involves the mixing of two-phase flow and microfluidic diffusion. The formation of gas bubbles and liquid slug was studied. The effect of gas-liquid circulation in Taylor flow on mass transfer was analyzed. The mass transfer coefficient was also studied, and the prediction model of physical and electrochemical absorption of CO2 was proposed and verified by experiments. The study found that:
(1)
When the gas flow rate increases, the pressure drop, porosity, and mass transfer coefficient will all increase. When the liquid flow rate increases, the pressure drop and mass transfer coefficient will increase, and the porosity will decrease. The increase of the gas-liquid phase flow rate will lead to the intensification of material circulation, which is conducive to the chemical reaction.
(2)
By comparing electrochemical reactions with physical absorption, it was found that the pressure drop and porosity decreased while the mass transfer coefficient increased. Electrochemical absorption consumes more CO2, which makes the bubble size smaller, thus reducing the flow resistance. The electrochemical reaction promotes the consumption and absorption of reaction substances.
(3)
The increase of the mass transfer coefficient is beneficial to the chemical reaction, but the chemical reaction rate is affected by many factors. When the gas-liquid flow rate is small, the chemical reaction rate is slow due to insufficient reaction substances, and the chemical reaction rate gradually accelerates with the increase of the gas-liquid flow rate. However, the acceleration of the chemical reaction rate may lead to the accumulation of bubbles in the catalyst layer, thus affecting the chemical reaction, while a too-high gas-liquid flow rate may also lead to an inadequate reaction. Therefore, too-high or too-low gas-liquid flow rates are not conducive to the chemical reaction.
(4)
Based on the study of chemical reactions in the microchannel, the mixing of two-phase flow and the formation of chemical substances of CO2 reduction were explained from the microscopic point of view, thereby analyzing the mass transfer and flow characteristics of the chemical reaction so as to accurately regulate and control the reaction. This study can be applied to outer space exploration, carbon neutralization, and other fields.

Author Contributions

Idea—conception and framework of the paper, Q.Y.; Writing—original draft preparation, R.D.; writing—review and editing, R.Z., W.X. and S.Y. All authors have read and agreed to the published version of the manuscript.

Funding

This research received no external funding.

Data Availability Statement

Not applicable.

Conflicts of Interest

The authors declare no conflict of interest.

References

  1. Hoffman, J.A.; Hecht, M.H.; Rapp, D. Mars Oxygen ISRU Experiment (MOXIE)—Preparing for human Mars exploration. Sci. Adv. 2022, 8, 8636. [Google Scholar] [CrossRef] [PubMed]
  2. Hecht, M.; Hoffman, J.; Rapp, D. Mars oxygen ISRU experiment (MOXIE). Space Sci. Rev. 2021, 217, 9. [Google Scholar] [CrossRef]
  3. McClean, J.B.; Hoffman, J.A.; Hecht, M.H. Pre-landing plans for Mars Oxygen In-Situ Resource Utilization Experiment (MOXIE) science operations. Acta Astronaut. 2022, 192, 301–313. [Google Scholar] [CrossRef]
  4. Hinterman, E.; Hoffman, J.A. Simulating oxygen production on Mars for the Mars Oxygen In-Situ Resource Utilization Experiment. Acta Astronaut. 2020, 170, 678–685. [Google Scholar] [CrossRef]
  5. Yang, Q.; Dong, R.; Yang, S. Microfluidic system for extraterrestrial artificial photosynthetic device. Microsyst. Technol. 2022, 1, 49–61. [Google Scholar] [CrossRef]
  6. Zubrin, R.M.; Muscatello, A.C.; Berggren, M. Integrated Mars in situ propellant production system. J. Aerosp. Eng. 2013, 26, 43–56. [Google Scholar] [CrossRef]
  7. Lotto, M.A. Assessing the Feasibility of Using Room Temperature Co-Electrolysis to Concurrently Convert Carbon Dioxide and Water into Methane and Oxygen for Propellant and Life Support on Mars. Ph.D. Thesis, University of Colorado at Boulder, Boulder, CO, USA, 2020. [Google Scholar]
  8. Zlindra, A.; Schoen, D.; Mayer, F. Development and Testing of Prototype Sabatier Reactor for Martian In Situ Propellant Production. Earth Space 2021, 2021, 264–273. [Google Scholar]
  9. Interbartolo, M.A., III; Sanders, G.B.; Oryshchyn, L. Prototype development of an integrated mars atmosphere and soil-processing system. J. Aerosp. Eng. 2013, 26, 57–66. [Google Scholar] [CrossRef]
  10. Sridhar, K.; Iacomini, C.; Finn, J. Combined H2O/CO2 solid oxide electrolysis for mars insitu resource utilization. J. Propuls. Power 2004, 5, 892–901. [Google Scholar] [CrossRef]
  11. HMatsushima, H.; Kiuchi, D.; Fukunaka, Y.; Kuribayashi, K. Single bubble growth during water electrolysis under microgravity. Electrochem. Commun. 2009, 11, 1721–1723. [Google Scholar] [CrossRef]
  12. Sakurai, M.; Sone, Y.; Nishida, T.; Matsushima, H.; Fukunaka, Y. Fundamental study of water electrolysis for life support system in space. Electrochim. Acta 2013, 100, 350–357. [Google Scholar] [CrossRef]
  13. Holladay, J.D.; Brooks, K.P.; Wegeng, R. Microreactor development for Martian in situ propellant production. Catal. Today 2007, 120, 35–44. [Google Scholar] [CrossRef]
  14. Yang, L.; Zhang, C.; Yu, X. Extraterrestrial artificial photosynthetic materials for in-situ resource utilization. Natl. Sci. Rev. 2021, 8, 104. [Google Scholar] [CrossRef] [PubMed]
  15. Domínguez, R.B.; Arias, D.M.; Rodríguez, C. A critical review on advances in TiO2-based photocatalytic systems for CO2 reduction. Appl. Therm. Eng. 2022, 216, 119009. [Google Scholar] [CrossRef]
  16. Sharma, A.; Hosseini, A.; Kumar, N. Insight into ZnO/carbon hybrid materials for photocatalytic reduction of CO2: An in-depth review. J. CO2 Util. 2022, 65, 102205. [Google Scholar] [CrossRef]
  17. Wang, S.; Kou, T.; Baker, S.E. Recent progress in electrochemical reduction of CO2 by oxide-derived copper catalysts. Mater. Today Nano 2020, 12, 100096. [Google Scholar] [CrossRef]
  18. Alulema-Pullupaxi, P.; Espinoza-Montero, P.J.; Sigcha-Pallo, C.; Vargas, R.; Fernandez, L.; Peralta-Hernandez, J.M.; Paz, J.L. Fundamentals and applications of photoelectrocatalysis as an efficient process to remove pollutants from water: A review. Chemosphere 2021, 281, 130821. [Google Scholar] [CrossRef] [PubMed]
  19. Lachaux, J.; Hwang, G.; Arouche, N. A compact integrated microfluidic oxygenator with high gas exchange efficiency and compatibility for long-lasting endothelialization. Lab Chip 2021, 21, 4791–4804. [Google Scholar] [CrossRef]
  20. Kotb, Y.; Fateen, S.E.K.; Albo, J. Modeling of a Microfluidic Electrochemical Cell for the Electro-Reduction of CO2 to CH3OH. J. Electrochem. Soc. 2017, 164, 391–400. [Google Scholar] [CrossRef]
  21. Behdani, B.; Alhameedi, H.A. Computational Fluid Dynamics Study of Taylor Flow in Microreactors: Investigating the Effect of Surface Tension and Contact Angle on the Heatand Mass Transfer. arXiv 2021, arXiv:2102.04006. [Google Scholar]
  22. Guo, R.; Zhu, C.; Yin, Y. Mass transfer characteristics of CO2 absorption into 2-amino-2-methyl-1-propanol non-aqueous solution in a microchannel. J. Ind. Eng. Chem. 2019, 75, 194–201. [Google Scholar] [CrossRef]
  23. Li, W.L.; Liang, H.W.; Wang, J.H. CFD modeling on the chemical absorption of CO2 in a microporous tube-in-tube microchannel reactor. Fuel 2022, 327, 125064. [Google Scholar] [CrossRef]
  24. Yin, Y.; Fu, T.; Zhu, C. Dynamics and mass transfer characteristics of CO2 absorption into MEA/[Bmim][BF4] aqueous solutions in a microchannel. Sep. Purif. Technol. 2019, 210, 541–552. [Google Scholar] [CrossRef]
  25. Ma, D.; Zhu, C.; Fu, T. An effective hybrid solvent of MEA/DEEA for CO2 absorption and its mass transfer performance in microreactor. Sep. Purif. Technol. 2020, 242, 116795. [Google Scholar] [CrossRef]
  26. Huang, M.; Zhu, C.; Fu, T. Enhancement of gas-liquid mass transfer by nanofluids in a microchannel under Taylor flow regime. Int. J. Heat Mass Transf. 2021, 176, 121435. [Google Scholar] [CrossRef]
  27. Lim, C.F.C.; Harrington, D.A.; Marshall, A.T. Effects of mass transfer on the electrocatalytic CO2 reduction on Cu. Electrochim. Acta 2017, 238, 56–63. [Google Scholar] [CrossRef]
  28. Ješić, D.; Jurković, D.L.; Pohar, A. Engineering photocatalytic and photoelectrocatalytic CO2 reduction reactions: Mechanisms, intrinsic kinetics, mass transfer resistances, reactors and multi-scale modelling simulations. Chem. Eng. J. 2021, 407, 126799. [Google Scholar] [CrossRef]
  29. Shehzad, N.; Tahir, M.; Johari, K. A critical review on TiO2 based photocatalytic CO2 reduction system: Strategies to improve efficiency. J. CO2 Util. 2018, 26, 98–122. [Google Scholar] [CrossRef]
  30. Zeng, G.; Qiu, J.; Li, Z. CO2 reduction to methanol on TiO2-passivated GaP photocatalysts. ACS Catal. 2014, 4, 3512–3516. [Google Scholar] [CrossRef]
  31. Zhang, Y.; Han, B.; Xu, Y. Artificial Photosynthesis of Alcohols by Multi-Functionalized Semiconductor Photocathodes. ChemSusChem 2017, 10, 1742–1748. [Google Scholar] [CrossRef] [PubMed]
  32. Malik, M.I.; Malaibari, Z.O.; Atieh, M. Electrochemical reduction of CO2 to methanol over MWCNTs impregnated with Cu2O. Chem. Eng. Sci. 2016, 152, 468–477. [Google Scholar] [CrossRef]
  33. Yang, X.; Cheng, J.; Yang, X. MOF-derived Cu@ Cu2O heterogeneous electrocatalyst with moderate intermediates adsorption for highly selective reduction of CO2 to methanol. Chem. Eng. J. 2022, 431, 134171. [Google Scholar] [CrossRef]
  34. Bawab, B.; Thalluri, S.M.; Rodriguez, J. Anodic TiO2 nanotube layers decorated by Pd nanoparticles using ALD: An efficient electrocatalyst for methanol oxidation. Electrochim. Acta 2022, 429, 141044. [Google Scholar] [CrossRef]
  35. Wang, J.; Sun, K.; Jia, X. CO2 hydrogenation to methanol over Rh/In2O3 catalyst. Catal. Today 2021, 365, 341–347. [Google Scholar] [CrossRef]
  36. Mendieta, N.E.; Cheuquepán, W.; Rodes, A. Spectroelectrochemical study of CO2 reduction on TiO2 electrodes in acetonitrile. ACS Catal. 2019, 10, 103–113. [Google Scholar] [CrossRef]
  37. Zhang, L.; Cao, H.; Pen, Q. Embedded CuO nanoparticles@ TiO2-nanotube arrays for photoelectrocatalytic reduction of CO2 to methanol. Electrochim. Acta 2018, 283, 1507–1513. [Google Scholar] [CrossRef]
  38. Almeida, J.; Pacheco, M.S.; Brito, J.F. Contribution of CuxO distribution, shape and ratio on TiO2 nanotubes to improve methanol production from CO2 photoelectroreduction. J. Solid State Electrochem. 2020, 24, 3013–3028. [Google Scholar] [CrossRef]
  39. Zhong, Y.; Wang, S.; Li, M. Rational design of copper-based electrocatalysts and electrochemical systems for CO2 reduction: From active sites engineering to mass transfer dynamics. Mater. Today Phys. 2021, 18, 100354. [Google Scholar] [CrossRef]
  40. Lei, L.; Wang, N.; Zhang, X.M. Optofluidic planar reactors for photocatalytic water treatment using solar energy. Biomicrofluidics 2010, 4, 043004. [Google Scholar] [CrossRef]
  41. Cao, G.; Cao, X.; Shan, M.; Li, M.; Zhu, X.; Han, J.; Wang, H. Surface cavity effect on C2H4 formation from electrochemical reduction of CO2 as studied using Cu2O cubes. J. Solid State Electrochem. 2022, 26, 1527–1540. [Google Scholar] [CrossRef]
  42. Yin, Y.; Zhu, C.; Fu, T. Enhancement effect and mechanism of gas-liquid mass transfer by baffles embedded in the microchannel. Chem. Eng. Sci. 2019, 201, 264–273. [Google Scholar] [CrossRef]
  43. Tan, J.; Lu, Y.C.; Xu, J.H. Mass transfer performance of gas–liquid segmented flow in microchannels. Chem. Eng. J. 2012, 181, 229–235. [Google Scholar] [CrossRef]
  44. Yue, J.; Chen, G.; Yuan, Q. Hydrodynamics and mass transfer characteristics in gas–liquid flow through a rectangular microchannel. Chem. Eng. Sci. 2007, 62, 2096–2108. [Google Scholar] [CrossRef]
  45. Ji, X.Y.; Ma, Y.G.; Fu, T. T Experimental investigation of the liquid volumetric mass transfer coefficient for upward gas-liquid two-phase flow in rectangular microchannels. Braz. J. Chem. Eng. 2010, 27, 573–582. [Google Scholar] [CrossRef]
  46. Tan, J.; Lu, Y.C.; Xu, J.H. Mass transfer characteristic in the formation stage of gas–liquid segmented flow in microchannel. Chem. Eng. J. 2012, 185–186, 314–320. [Google Scholar] [CrossRef]
Figure 1. Schematic diagram of device.
Energies 16 03929 g001
Figure 2. Reaction mechanism of catalyst, CO2 and H2O. (where ‘*’ represents charged ions).
Energies 16 03929 g002
Figure 3. Schematic diagram of microreaction.
Energies 16 03929 g003
Figure 4. Microreaction chip (1—anode substrate; 2—anode microchannel; 3—sealing gasket; 4—anode carbon membrane; 5—proton exchange membrane; 6—cathode carbon membrane; 7—cathode microchannel; 8—cathode substrates).
Energies 16 03929 g004
Figure 5. Microreactor chip experimental device.
Energies 16 03929 g005
Figure 6. Schematic diagram of mass transfer.
Energies 16 03929 g006
Figure 7. Relationship between gas-liquid velocity and bubble length.
Energies 16 03929 g007
Figure 8. Relationship between gas-liquid velocity and liquid slug length.
Energies 16 03929 g008
Figure 9. Relationship between gas-liquid velocity and Taylor cell length.
Energies 16 03929 g009
Figure 10. Bubble velocity.
Energies 16 03929 g010
Figure 11. Relationship between gas-liquid velocity and bubble formation frequency.
Energies 16 03929 g011
Figure 12. Relative loss length of bubble under physical absorption: (a) Ql = 45 μL/min (b) Ql = 60 μL/min (c) Ql = 75 μL/min (d) Ql = 90 μL/min.
Energies 16 03929 g012
Figure 13. Effect of gas-liquid velocity on mass transfer coefficient.
Energies 16 03929 g013
Figure 14. Effect of bubble and liquid slug length on mass transfer coefficient: (a) KLa varies with Lg (b) KLa varies with Ll. (Where the square in the figure is the mass transfer coefficient, and the dotted line represents the fitting trend of the mass transfer coefficient).
Energies 16 03929 g014
Figure 15. Relationship between gas-liquid flow rate and pressure drop.
Energies 16 03929 g015
Figure 16. Effect of pressure drop on mass transfer coefficient. (Where the square in the figure is the mass transfer coefficient, and the dotted line represents the fitting trend of the mass transfer coefficient).
Energies 16 03929 g016
Figure 17. Effect of gas-liquid flow rate on porosity.
Energies 16 03929 g017
Figure 18. Effect of porosity on mass transfer coefficient (a) The gas phase flow is constant (b) The liquid phase flow is constant.
Energies 16 03929 g018
Figure 19. Comparison between the experimental mass transfer coefficient and the predicted value. (The solid line in the figure represents the fitting interval of the mass transfer coefficient).
Energies 16 03929 g019
Figure 20. Relative loss length of bubble in electrochemical reaction: (a) Ql = 45 μL/min (b) Ql = 60 μL/min (c) Ql = 75 μL/min (d) Ql = 90 μL/min.
Energies 16 03929 g020
Figure 21. Porosity in electrochemical reaction.
Energies 16 03929 g021
Figure 22. Pressure drop in electrochemical reaction.
Energies 16 03929 g022
Figure 23. Mass transfer coefficient in electrochemical reaction.
Energies 16 03929 g023
Figure 24. Experimental mass transfer coefficient and the predicted value in electrochemical reactions. (The solid line in the figure represents the fitting interval of the mass transfer coefficient).
Energies 16 03929 g024
Figure 25. Effect of Liquid Flow Rate on Enhancement Factor.
Energies 16 03929 g025
Figure 26. Effect of gas-liquid flow on electrochemical reaction.
Energies 16 03929 g026
Figure 27. Relationship between mass transfer coefficient and CH3OH production. (Where the square in the figure is the mass transfer coefficient, and the dotted line represents the fitting trend of the mass transfer coefficient.)
Energies 16 03929 g027
Disclaimer/Publisher’s Note: The statements, opinions and data contained in all publications are solely those of the individual author(s) and contributor(s) and not of MDPI and/or the editor(s). MDPI and/or the editor(s) disclaim responsibility for any injury to people or property resulting from any ideas, methods, instructions or products referred to in the content.