Abstract
Predicting energy demand in adverse scenarios, such as the COVID-19 pandemic, is critical to ensure the supply of electricity and the operation of essential services in metropolitan regions. In this paper, we propose a deep learning model to predict the demand for the next day using the “IEEE DataPort Competition Day-Ahead Electricity Demand Forecasting: Post-COVID Paradigm” database. The best model uses hybrid deep neural network architecture (convolutional network–recurrent network) to extract spatial-temporal features from the input data. A preliminary analysis of the input data was performed, excluding anomalous variables. A sliding window was applied for importing the data into the network input. The input data was normalized, using a higher weight for the demand variable. The proposed model’s performance was better than the models that stood out in the competition, with a mean absolute error of 2361.84 kW. The high similarity between the actual demand curve and the predicted demand curve evidences the efficiency of the application of deep networks compared with the classical methods applied by other authors. In the pandemic scenario, the applied technique proved to be the best strategy to predict demand for the next day.
1. Introduction
Applying machine learning techniques to energy systems is one of the tools for resource management and strategic planning in all its stages. Actions including tariff adjustment, contract evaluation, schedules, maintenance, and quality of service can be improved through load forecasting. In addition, adapting the energy system to a more reliable, economic, and environmentally friendly format has been the focus of current policies, given the concern of countries to reduce CO2 emissions caused by the use of fossil fuels in electricity generation [1,2,3,4].
Thus, several methods and scenarios have been explored to generalize predictive models. For example, electric power demand prediction methods have been developed to determine the value of electric power consumption in kW for the next hours, months, or years. Such periods are defined as short-term load forecasting (STLF), referring to predictions up to one day ahead; medium-term load forecasting (MTLF), referring to the period from one day to one year ahead; and long-term load forecasting (LTLF), referring to one to ten years ahead [5].
The literature shows that 90% of the proposed methods use artificial intelligence techniques for demand forecasting. In comparison, 10% use traditional statistical methods, requiring more studies that evaluate these two paradigms [1]. We also highlight that the sector’s decarbonization demands additional efforts to obtain an adequate solution to the demand prediction problem [3]. A key ingredient for the development of robust methods for energy demand forecasting is the availability of databases, which in most cases are not accessible to the community for new experiments. In addition to the availability of databases, to achieve an unbiased evaluation of the performance of different algorithms, load demand documents should use a standard benchmark [5].
Evaluating the performance of such models in adverse scenarios also requires further study. One recent case that requires further attention was the scenario caused by the COVID-19 pandemic [6,7,8,9]. Restrictive operating decisions in the industrial and commercial sectors directly impact daily demand profiles and the market price of electricity. For example, the New York Independent Power Operating System (NYISO) recorded a decrease in consumption from 2019 to 2020 during the lockdown period. [6]. In Poland, there was a more than 20% reduction in consumption during the first lockdown and a more than 10% reduction during the second. In Brazil, consumption fell by 10% in health centers, 40% in administrative buildings, and 50% in elementary school and daycare centers. [7]. Despite the variability of consumption, a reliable power supply was essential during these periods [10,11].
Due to the lockdown periods associated with the pandemic, the demand curves resulting from these periods were different from previous years, remaining below the historical average. The discontinuity in consumption patterns caused by the COVID-19 pandemic prompted studies on new methods of predicting energy demand, in addition to the traditional methods already developed [12,13,14]. In this context, the competition “IEEE DataPort Competition Day-Ahead Electricity Demand Forecasting: Post-COVID Paradigm” was created to promote a detailed analysis of the impacts caused by COVID-19-related actions on electricity demand. The competition sought to develop new strategies to mitigate the effects of the demand forecast for the following day in anomalous scenarios. For this purpose, a database was made available, containing energy demand information and climate variables from an energy utility [15].
Among the most successful papers in this competition, the authors in [16] first applied a statistical correction of the meteorological variables, followed by classical statistical and machine learning models to predict demand. In addition, they established state-space models to adapt the mentioned statistical and machine learning models. The authors in [17] developed a combination of forecasts through the smoothed Bernstein’s Online Aggregation (BOA) method. Employing holiday-fitting techniques, they trained four classical models, among them a high-dimensional linear regression model, with estimators obtained through the Lasso method.
Artificial intelligence techniques, which include feature extraction and time dependence, have shown promising results in demand prediction work using other databases [18,19]. It is important to emphasize that previous analysis for selecting the most appropriate characteristics for prediction and their adequate treatment is essential to obtain good predictive models. In this context, the main contributions of this work are:
- Proposal of predictive models based on deep learning, with spatial-temporal dependence, considering lockdown periods established during the COVID-19 pandemic for demand prediction, using the same database as the IEEE competition previously mentioned;
- To preliminarily investigate the input variables, proposing methods for selecting and rescaling such variables before the model training stage and applying the same testing and validation procedures previously determined by the IEEE competition;
- Comparing the proposed deep learning model with the best performance with the previously mentioned models developed in the IEEE competition, employing the same metrics for performance analysis.
This paper is organized as follows: Section 2 presents the techniques applied in demand prediction studies, both in the COVID-19 pandemic scenario and outside of this scenario; Section 3 presents the materials and methods used in the study; Section 4 shows the obtained results; Section 5 discusses the obtained results and compares them with the results obtained in the most successful studies in the IEEE competition previously mentioned. Finally, Section 6 presents the conclusions.
2. Literature Review
In [20], using long-short-term memory networks (LSTM) and clustering algorithms, the authors presented a method for daily demand forecasting for 10,000 households in the city of Shanghai. In the preprocessing step, missing values were filled in by linear interpolation and the average of adjacent values replaced discrepant values. The authors also presented a spatial-temporal potential flow method, indicating the displacement of electricity consumption for different regions and times of the day. To evaluate the network performance, the root means square error (RMSE), the mean absolute error (MAE), the log means square error (LMSE), and the R-squared (R2) were applied. The best results achieved for these metrics were 9446.15 kW, 6741.18 kW, 1.4%, and 0.83 kW, respectively. However, the database applied to train the recurrent network was only for one year with thirteen meteorological variables. These two aspects impact the low generalization power of the model and boast a high computational cost.
In [21], the authors developed a method for load prediction during holiday periods by applying the XGBoost algorithm on a real dataset from 2015 to 2018, obtained in a province of China. Data normalization, feature selection, and identification of holidays according to type (New Year’s Day, Qingming Festival, May First, Dragon Boat Festival, Mid-Autumn Festival, Spring Day, and National Day.) and duration time (3-day holiday and 7-day holiday) were employed. The network with the best performance obtained a value for the mean absolute percentage error (MAPE) of 2.98% in the provincial capital. However, the treatment of discrepant values was not mentioned and the database was not made available to reproduce new experiments.
In [22], the authors presented a hybrid model to predict monthly electric power demand in a US Smart Grid using a restricted Boltzmann machine. During preprocessing, the authors applied normalization, relevance filter, and redundancy filter to the input data, composed of four years of historical data of demand and climate variables (temperature, dew point, humidity, and wind speed). The model was evaluated using mean absolute percentage deviation (MAPD), variance, and correlation coefficient, reaching the results of 1.10%, 1.03%, and 0.79%, respectively. As an improvement, a graphical analysis of the variables could have been applied beforehand to assess the integrity of the database.
In [23], for electricity demand prediction of the regional events in Rongali Bihu, Durga Puja, and Diwali in India, the authors applied a hybrid support vector machine (SVM)-based method with parameter optimization using the grey wolf optimizer (GWO) algorithm. Demand and temperature variables were used over the period from 2012 to 2017. The metric used to analyze the model performance was MAPE, which obtained values of 1.79%, 1.72%, and 1.68%, respectively, for each of the holidays mentioned above. It is observed that the application of only two predictor variables and the absence of normalization in the input data prevented the model from obtaining better results.
In [24], the authors proposed a sparse code method for training a neural network to predict the energy demand of 5000 households in Chattanooga, using demand data, actual temperature, and weather-predicted temperature. Data from a previous week was used to predict the next day’s total demand. The model performance was evaluated using either the actual or predicted temperature in the training and test sets. The best model obtained used actual temperature values in the training and test data, achieving values for MAE, RMSE, and MAPE of 36.85 kWh, 46.76 kWh, and 19.79%, respectively. The availability of only one year of training data limited the model’s learning ability.
In [25], for demand prediction, using the database made available by the ISONE website, the authors proposed a framework composed of an SVM, a gated recurrent units (GRU) network, and a convolutional neural network (CNN). During preprocessing, the authors employed a hybrid of random forest (RF) and extreme gradient boosting (XGB) methods to calculate the importance of features. Fourteen features were used, among which we highlight real-time demand, dew point temperature, and real-time energy. The authors also applied the recursive feature elimination (RFE) method to remove variables that had little relevance to the model. They used eight years of information present in the database. With this approach, the authors obtained the following results: MAPE—6.00%, RMSE—7.00 kW, MAE—10.00 kW, and MSE—13.00 kW2. It is observed that the authors could have assigned a higher importance level to the demand variable, saving computational efforts through a multiplier factor.
In [26], the authors applied an empirical decomposition (EMD), followed by an LSTM network, to estimate the demand for the next day, using data from the city of Chandigarh. First, the input data was cleaned and transformed by averaging the neighboring values and subtracting the average by the current value of each time series, respectively. The demand, day of the week, and seasons variables available over five years were used. The obtained MAPE was 7.56%. It is observed that including climatic data, such as temperature or wind speed, could have improved model performance.
In [27], the authors proposed a shallow neural network architecture to predict the demand for the next hour. Data from four years of temperature and demand from a utility in Japan were used. To predict the demand for the next hour, data from 30 days prior was used. The best result achieved for the MAPE metric was 1.18%. It is observed that better results could have been obtained with the establishment of discrepant value analysis and application of deep learning techniques, besides employing other climatic variables. We also note the need for the inclusion of other performance evaluation metrics.
In [28], the authors used a stacked neural network and a similarity-of-days method for demand prediction. The model’s performance was evaluated using five databases from different regions of the United States. After normalizing the input data, a deep belief network (DBN) architecture was employed. The lowest RMSE and MAPE values achieved were for the spring season, 18.48 MW and 1.44%, respectively. It is noted that adding meteorological data would be essential to improve model performance.
Few works related to demand forecasting involving the COVID-19 scenario have been produced in the literature. In [29], the authors evaluated the lockdown case in China, predicting the monthly electricity demand through the Rolling IMSGM method, a grey model variation in which the Maclaurin series controls the model training coefficients. As input data, demand values from 2012 to 2018 were employed. The predicted variable was demand for the first three months of 2019. The MAPE and RMSE values obtained in this interval were 0.34% and 19.61 TWh, respectively. It is noted that the model could be improved with the inclusion of meteorological variables.
In [30], to predict the monthly, daily, and every thirty minutes demand during the COVID-19 period in Jordan, the authors applied the ARIMAX autoregressive model. Data corresponding with five years was used. Three regions were selected for prediction (city center, Ashrafiah, and Rashadieh). Demand and temperature variables were applied for model training. The best performance for the MAPE metric in daily prediction was 4.1%. It is observed that an improvement of the model could be through the application of data normalization.
In [31], for predicting daily electricity consumption in Turkey, the authors applied two predictive methods, an LSTM network and an exogenous nonlinear autoregressive network (NARX). Normalized data regarding the variables of demand and temperature were used. Both normal period data and pandemic period data were used for model training. The best results were obtained with the LSTM network. For the RMSE, MAE, and MAPE metrics, the values of 8717.878 kW, 8004.736 kW, and 1.1%, respectively, were obtained. It is noted that for the training and validation of the learning network, only data from January to April 2019 were applied, possibly limiting the model’s generalization ability.
In [32], the authors applied a multilayer perceptron neural network to predict the demand for the next day in Northern Italy. The database contains data for demand, temperature, precipitation, time, and seven other characteristics obtained from 2015 to 2020, with sample intervals of 15 min. Applying z-score normalization, the best result, MAE and MSE of 0.53% and 1.02%, respectively, was obtained through a network with four hidden layers. It is observed that a detailed analysis of the input variables was not presented, being an essential tool for removing discrepant values and filling in missing values.
To explore demand forecasting in the context of COVID-19, the “IEEE DataPort Competition Day-Ahead Electricity Demand Forecasting: Post-COVID Paradigm” competition was proposed. In this competition, participants used different data preprocessing techniques and methods for electric power demand prediction relative to the pandemic scenario. In [16], for demand forecasting and to correct residual values of weather forecasts made 48 h in advance, the authors applied an autoregressive statistical correction to weather forecast variables. In addition, they established independent models for different times of the day. The following models were used: autoregressive model, linear regression, additive Gaussian model, random forest, and multilayer perceptron network. Finally, linear Gaussian state-space models were developed to synchronize the predictive models in time, followed by applying the Kalman filter as a Bayesian estimator of the state-space model. As a result, the work obtained for the MAE metric, a value of 10.844 MW, reached first place in the competition.
In [17], also using the competition data for demand forecasting, the authors applied data cleaning by linear interpolation, followed by transformation of the wind direction data, in degrees, to north-south (NS) and east-west (EW) cardinal points, using trigonometric wind direction value analysis. Daily averages of the meteorological variables were calculated and added as new variables in the database. Additionally, during preprocessing, six processes were applied and defined, such as backward log loading, ReLU transform of the weather variables, second-order Taylor approximation of the 14 input variables, daily and weekly deterministic effects, annual deterministic effects, and holiday adjustment procedure. For the prediction of energy demand, several models were tested. The model with the best performance was based on high-dimensional linear regression, with parameters estimated using the Lasso method and Bernstein’s smoothed online aggregation (BOA) prediction algorithm. With a result of a MAE metric of 11.890 MW, the paper achieved third place in the competition.
Table 1, adapted by [15], summarizes the methods applied by the challenge teams that performed well. This table shows the preprocessing steps applied to the input data and the demand forecast prediction methods used. The mean absolute error (MAE) of each team is also presented [15].

Table 1.
Methods and Results from the Works Participating in the “IEEE Dataport Competition Day-Ahead Electricity Demand Forecasting: Post-COVID Paradigm”.
Concerning the studies presented in Table 1, we highlight the following aspects: the high complexity of the developed models; the absence of a previous detailed analysis of the variables; the high value obtained for the MAE metric; the lack of a preprocessing that characterizes the variables with greater importance and the scarce use of methods based on deep neural networks.
3. Methodology
3.1. Materials
The database used in this work was made available by the “IEEE DataPort Competition Day-Ahead Electricity Demand Forecasting: Post-COVID Paradigm”. This database contains hourly demand values and weather variables from 18 March 2017 to 16 February 2021. Next-day weather forecasts were also available from 16 h to 40 h in advance. Table 2 identifies the variables of the database.
Table 2.
Database Variables of the “IEEE Dataport Competition Day-Ahead Electricity Demand Forecasting: Post-COVID Paradigm”.
3.2. Preprocessing
The features were analyzed separately by observing their behavior over time. This procedure was performed to identify outlier’s values, missing values, or noise in the data. Figure 1 shows the electricity demand curve over the time. In it, is possible to identify that, in the section hatched in light red, there was a drop in energy consumption due to the lockdown period. This period is from approximately February to June 2020 with a more significant impact in the month of March 2020.
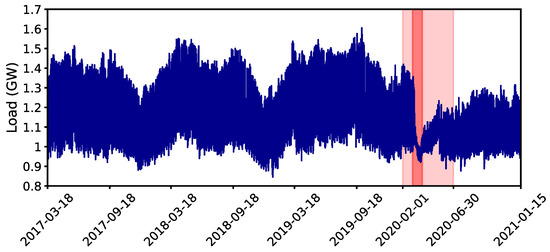
Figure 1.
Electricity demand curve of “IEEE DataPort Competition Day-Ahead Electricity Demand Forecasting: Post-COVID Paradigm”. The light red region corresponds to the lockdown period. The dark red area corresponds to the most significant impact on demand during this period.
Some weather forecast variables, such as air pressure, have atypical measured values, as shown by the hatched regions in light red in Figure 2a. The hatched area further to the left shows discrepant air pressure values while the hatched region further to the right shows that the measured pressure remained constant over three months.
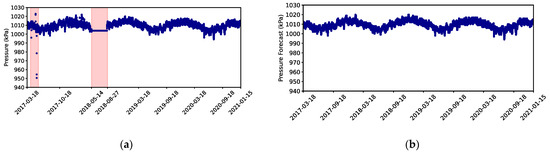
Figure 2.
Air pressure curves of “IEEE DataPort Competition Day-Ahead Electricity Demand Forecasting: Post-COVID Paradigm”. (a) measured air pressure values, highlighting the regions with discrepant values, shown by the hatched areas in light red; (b) air pressure values obtained from the weather forecast.
Thus, to eliminate outlier values and improve model learning, the weather forecast variables and the actual pressure variable were not used for training the proposed models in this study. Only the following variables were used: demand (kW), cloud cover (%), humidity (%), temperature (°C), wind direction (degrees), and wind speed (km/h) were used.
For training the deep network architectures proposed in this study, the need to identify the lockdown period was also observed. Thus, a variable was added to the database, called “lockdown”, which assumes the value 0 in normal periods and the value 1 in lockdown periods, considering the event’s date and time of occurrence.
By observing the values of the variables, the occurrence of different dynamic ranges was noted. For example, the demand varies between 845.47 MW and 1605.19 MW. The temperature varies between −6.42 °C and 39.07 °C. Faster convergence of deep grid optimization algorithms is achieved by normalizing the variables used in their inputs [33].
Thus, a normalization procedure was applied to all variables. The best results were obtained with the normalization process described in Equation (1). After the normalization procedure, the demand values were multiplied by 10. Therefore, the dynamic range of the demand was [0, 10], while the dynamic range of the other variables was [0, 1]. As a result, electricity demand was made the most significant feature of the network input.
A sliding window method was employed to establish the advance period in hours, used to predict the next hour’s demand. Thus, the window size Δt of 24 h was defined. Figure 3 illustrates the applied method, showing that between one window and the next window, an overlapping of the forecast data of h occurs. Considering the initial hour of a window as , the forecast for that window was made in the hour .
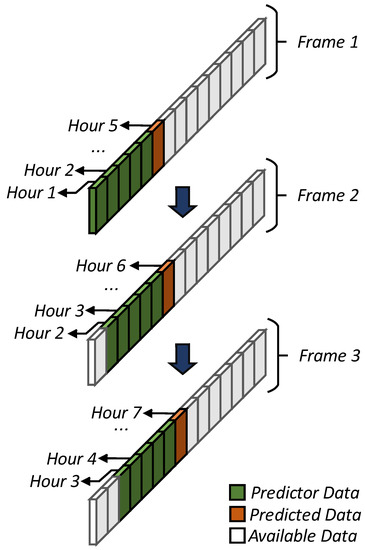
Figure 3.
Illustration of sliding window method applied to the input data. The green blocks correspond to the time window ( hours) containing the data for prediction. The orange block corresponds to the hour at which the energy demand is predicted, , where is the initial hour of the window.
3.3. Deep Neural Network Architectures
Three deep neural network architectures are proposed in this study for demand prediction in the pandemic context. These architectures combine convolutional neural networks and recurrent neural networks. Figure 4 shows these architectures. In their training, the stopping criterion was the number of training epochs, which was 300 epochs. The learning rate value was 10−3. The Adam optimizer was adopted by default. The size of the mini batch was made equal to 256.
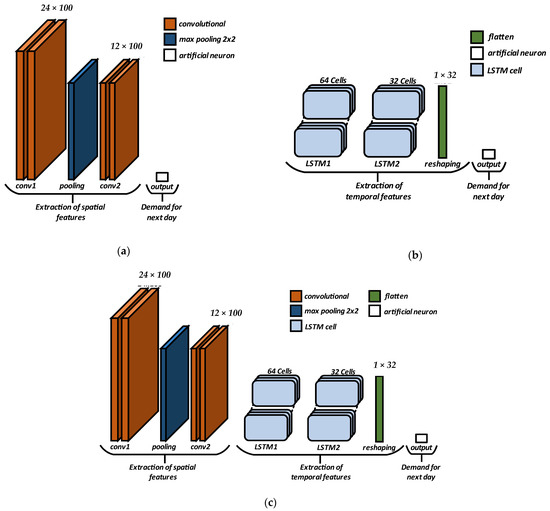
Figure 4.
Architectures of the deep neural networks proposed in this study for demand forecasting: (a) convolutional network with four convolutional layers using the ReLU activation function, interleaved by a pooling layer, followed by an output neuron with a linear activation function; (b) recurrent network with two LSTM layers for extracting temporal features, followed by a reshaping layer and an output neuron with a linear activation function; (c) mixed convolutional-recurrent network with four convolutional layers and two LSTM layers for extracting spatial-temporal features.
In the first architecture, a convolutional neural network and four convolutional layers were used for feature extraction, with ReLU activation function, interleaved by a max pooling layer. The max pooling layer has a kernel size of 2 × 2 and step size of two. The last layer consists of one neuron, as shown in Figure 4a.
The second architecture, a recurrent neural network, comprises two feature extraction LSTM layers with 64 and 32 cells, followed by a linearization (reshape) layer. The last layer also consists of one neuron, as shown in Figure 4b.
The third architecture is a hybrid convolutional-recurrent architecture, a combination of architectures 1 and 2, with the convolutional layers followed by the recurrent layers. A linearization (reshape) layer and an output layer with one neuron were also used. Since the output of the proposed networks predicts a demand value, which is a real number, a linear activation function was used in all output neurons.
3.4. Evaluation Metrics
To enable benchmarking with the competition models, the MAE metric was applied for the performance evaluation of the previously proposed architectures. This metric is defined using Equation (2), where is the expected value, is the predicted value, and is the amount of observed data.
3.5. Simulation Environment
The experiments were performed in the collaborative environment Google Colab™ in Python language with the packages Tensorflow v2.9.1, Keras v2.9.0, Pandas v1.3.5, Numpy v1.21.6, and Matplotlib v3.2.2. The computational resource used for the simulations was composed of an Intel Core i5 2.7 GHz processor, 16 GB RAM, 4 GB GPU, and 500 GB SSD.
4. Results
To train the deep net architectures, the input data was divided into two sets, a training set and a validation set, in a proportion of 70% and 30%, respectively. The test set was the same one made available by the competition, consisting of two months of data. Figure 5 represents the learning curve for architectures 1, 2, and 3, where the value of the MAE metric is plotted for each epoch for a total of 300 epochs.
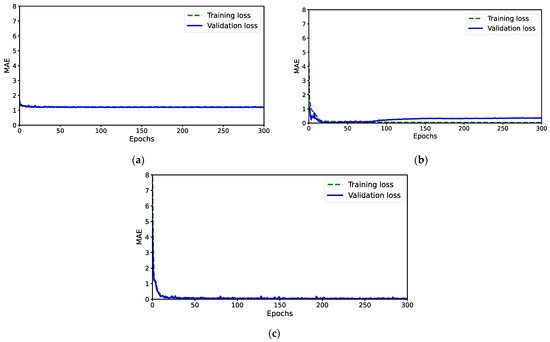
Figure 5.
Convergence curves obtained for training the three neural network architectures. The dashed green line indicates the MAE normalized values at training data and the blue line represents the MAE normalized at validation data. (a) Architecture #1; (b) Architecture #2; (c) Architecture #3.
It can be observed that architecture #1 presented a stable learning curve, with the MAE metric values being very close, in the validation and training sets. In this training, the final value of the MAE was still above one. Architecture #2 presented a slight instability in the first epochs, but the absolute value of the MAE was close to zero. However, a MAE increase was observed in the validation set after 75 epochs, characterizing an overfitting model. Architecture #3 presented stability throughout training, with the final value of the MAE close to zero and without overfitting.
Table 3 presents values for the MAE (not normalized values) obtained in the test set for the three proposed architectures after converting the values to kW units. We note the superiority of the result obtained in architecture #3, over the others, with an MAE of 2361.84 kW.
Table 3.
MAE obtained from the competition’s test (not normalized values).
Figure 6 presents the daily demand prediction curve of the third architecture and the actual demand from the database in the same period. We can notice the high similarity of the curves, indicating a load prediction close to the expected value. Thus, architecture #3 was the one that obtained the best performance.
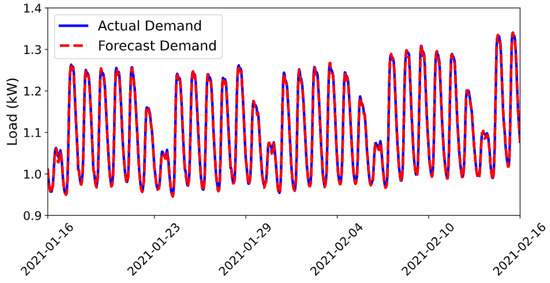
Figure 6.
Demand prediction curve for architecture #3. The blue line is the actual demand value and the dashed red line is the predicted demand value.
Concerning the time complexity, architecture #3 took about 14 min for training. Once trained, the time it takes to make a prediction is 1.3 min.
5. Discussion
The learning curve of architecture #3, shown in Figure 5c, presented a well-behaved training over the 300 epochs, with no overfitting error. The excellent performance of the MAE metric on the validation set during training was reflected in the values obtained for it on the testing set, as shown in Table 3 and in the graph shown in Figure 6. The results obtained in the validation and testing sets prove that the choice of a hybrid architecture of deep network (convolutional + recurrent network) and its hyperparameters, for the prediction of daily demand, was right.
The normalization of the input data, adding more significant weight to the demand data, was fundamental for the model’s performance. The preliminary analysis of the data, which resulted in the exclusion of characteristics that presented anomalies, also contributed to the excellent performance of the proposed architectures. These two strategies provided the highlighting, at the input of the networks, of the most important feature and the mitigation of problems arising from spurious data in the database. These strategies were not used in other works published in the literature that stood out in the competition.
We also highlight the beneficial result for demand prediction in the COVID-19 pandemic context by extracting spatial and temporal features from the input data.
Table 4 compares the values obtained for the MAE metric by the three first places in the competition, with those obtained by the architecture proposed in this work. Rank 1 in Table 4 refers to the study of the competition that obtained the smallest value of MAE The superiority of using deep networks compared with the classical methods applied by the other authors is evident.
Table 4.
Performance of the competition models and of the proposed method.
6. Conclusions
In this paper, a next-day demand prediction method applying convolutional networks and recurrent networks was proposed in the scenario of the COVID-19 pandemic. The efficiency of the spatio-temporal feature extraction method, associated with preliminary analysis and input data normalization, was shown. After normalization, assigning a higher weight to the demand variable highlighted its importance in the predictor input. In this paper, the performances of three deep architectures were evaluated. The best model obtained was compared with the models that stood out in “IEEE DataPort Competition Day-Ahead Electricity Demand Forecasting: Post-COVID Paradigm”, showing that the proposed hybrid model, convolutional + recurrent, is the best one to solve the prediction problem in this scenario.
Author Contributions
Conceptualization, N.L.V., C.F.F.C.F. and M.G.F.C.; methodology, N.L.V., C.F.F.C.F. and M.G.F.C.; software, N.L.V.; validation, N.L.V.; formal analysis, N.L.V., C.F.F.C.F. and M.G.F.C.; investigation, N.L.V.; resources, C.F.F.C.F. and M.G.F.C.; data curation, N.L.V.; writing—original draft preparation, N.L.V.; writing—review and editing, N.L.V., C.F.F.C.F. and M.G.F.C.; visualization, N.L.V.; supervision, C.F.F.C.F. and M.G.F.C.; project administration, C.F.F.C.F. and M.G.F.C.; funding acquisition, M.G.F.C. All authors have read and agreed to the published version of the manuscript.
Funding
This research received no external funding.
Data Availability Statement
The data used in this paper was made available in the “IEEE DataPort Competition Day-Ahead Electricity Demand Forecasting: Post-COVID Paradigm”.
Conflicts of Interest
The authors declare no conflict of interest.
References
- Nti, I.K.; Teimeh, M.; Nyarko-Boateng, O.; Adekoya, A.F. Electricity load forecasting: A systematic review. J. Electr. Syst. Inf. Technol. 2020, 7, 13. [Google Scholar] [CrossRef]
- Raza, M.Q.; Khosravi, A. A review on artificial intelligence based load demand forecasting techniques for smart grid and buildings. Renew. Sustain. Energy Rev. 2015, 50, 1352–1372. [Google Scholar] [CrossRef]
- Verwiebe, P.A.; Seim, S.; Burges, S.; Schulz, L.; Müller-Kirchenbauer, J. Modeling Energy Demand—A Systematic Literature Review. Energies 2021, 14, 7859. [Google Scholar] [CrossRef]
- Salleh, N.S.M.; Suliman, A.; Jorgensen, B.N. A Systematic Literature Review of Machine Learning Methods for Short-Term Electricity Forecasting. In Proceedings of the 2020 8th International Conference on Information Technology and Multimedia (ICIMU), Selangor, Malaysia, 24–26 August 2020; Institute of Electrical and Electronics Engineers, Inc.: New York, NY, USA, 2020; pp. 409–414. [Google Scholar] [CrossRef]
- Román-Portabales, A.; López-Nores, M.; Pazos-Arias, J.J. Systematic Review of Electricity Demand Forecast Using ANN-Based Machine Learning Algorithms. Sensors 2021, 21, 4544. [Google Scholar] [CrossRef]
- Agdas, D.; Barooah, P. Impact of the COVID-19 Pandemic on the U.S. Electricity Demand and Supply: An Early View from Data. IEEE Access 2020, 8, 151523–151534. [Google Scholar] [CrossRef]
- Siksnelyte-Butkiene, I. Impact of the COVID-19 Pandemic to the Sustainability of the Energy Sector. Sustainability 2021, 13, 12973. [Google Scholar] [CrossRef]
- Alhajeri, H.M.; Almutairi, A.; Alenezi, A.; Alshammari, F. Energy Demand in the State of Kuwait During the Covid-19 Pandemic: Technical, Economic, and Environmental Perspectives. Energies 2020, 13, 4370. [Google Scholar] [CrossRef]
- Zhang, L.; Li, H.; Lee, W.-J.; Liao, H. COVID-19 and energy: Influence mechanisms and research methodologies. Sustain. Prod. Consum. 2021, 27, 2134–2152. [Google Scholar] [CrossRef] [PubMed]
- Ghiani, E.; Galici, M.; Mureddu, M.; Pilo, F. Impact on Electricity Consumption and Market Pricing of Energy and Ancillary Services during Pandemic of COVID-19 in Italy. Energies 2020, 13, 3357. [Google Scholar] [CrossRef]
- Navon, A.; Machlev, R.; Carmon, D.; Onile, A.E.; Belikov, J.; Levron, Y. Effects of the COVID-19 Pandemic on Energy Systems and Electric Power Grids—A Review of the Challenges Ahead. Energies 2021, 14, 1056. [Google Scholar] [CrossRef]
- Obst, D.; de Vilmarest, J.; Goude, Y. Adaptive Methods for Short-Term Electricity Load Forecasting During COVID-19 Lockdown in France. IEEE Trans. Power Syst. 2021, 36, 4754–4763. [Google Scholar] [CrossRef] [PubMed]
- Tudose, A.M.; Picioroaga, I.I.; Sidea, D.O.; Bulac, C.; Boicea, V.A. Short-Term Load Forecasting Using Convolutional Neural Networks in COVID-19 Context: The Romanian Case Study. Energies 2021, 14, 4046. [Google Scholar] [CrossRef]
- Lu, H.; Ma, X.; Ma, M. A hybrid multi-objective optimizer-based model for daily electricity demand prediction considering COVID-19. Energy 2020, 219, 119568. [Google Scholar] [CrossRef] [PubMed]
- Farrokhabadi, M.; Browell, J.; Wang, Y.; Makonin, S.; Su, W.; Zareipour, H. Day-Ahead Electricity Demand Forecasting Competition: Post-COVID Paradigm. IEEE Open Access J. Power Energy 2022, 9, 185–191. [Google Scholar] [CrossRef]
- De Vilmarest, J.; Goude, Y. State-Space Models for Online Post-Covid Electricity Load Forecasting Competition. IEEE Open Access J. Power Energy 2022, 9, 192–201. [Google Scholar] [CrossRef]
- Ziel, F. Smoothed Bernstein Online Aggregation for Short-Term Load Forecasting in IEEE DataPort Competition on Day-Ahead Electricity Demand Forecasting: Post-COVID Paradigm. IEEE Open Access J. Power Energy 2022, 9, 202–212. [Google Scholar] [CrossRef]
- Al-Saudi, K.; Degeler, V.; Medema, M. Energy Consumption Patterns and Load Forecasting with Profiled CNN-LSTM Networks. Processes 2021, 9, 1870. [Google Scholar] [CrossRef]
- Le, T.; Vo, M.T.; Vo, B.; Hwang, E.; Rho, S.; Baik, S.W. Improving Electric Energy Consumption Prediction Using CNN and Bi-LSTM. Appl. Sci. 2019, 9, 4237. [Google Scholar] [CrossRef]
- Peng, J.; Kimmig, A.; Niu, Z.; Wang, J.; Liu, X.; Ovtcharova, J. A flexible potential-flow model based high resolution spatiotemporal energy demand forecasting framework. Appl. Energy 2021, 299, 117321. [Google Scholar] [CrossRef]
- Zhu, K.; Geng, J.; Wang, K. A hybrid prediction model based on pattern sequence-based matching method and extreme gradient boosting for holiday load forecasting. Electr. Power Syst. Res. 2021, 190, 106841. [Google Scholar] [CrossRef]
- Hafeez, G.; Alimgeer, K.S.; Wadud, Z.; Shafiq, Z.; Khan, M.U.A.; Khan, I.; Khan, F.A.; Derhab, A. A Novel Accurate and Fast Converging Deep Learning-Based Model for Electrical Energy Consumption Forecasting in a Smart Grid. Energies 2020, 13, 2244. [Google Scholar] [CrossRef]
- Barman, M.; Choudhury, N.B.D. A similarity based hybrid GWO-SVM method of power system load forecasting for regional special event days in anomalous load situations in Assam, India. Sustain. Cities Soc. 2020, 61, 102311. [Google Scholar] [CrossRef]
- Yu, C.-N.; Mirowski, P.; Ho, T.K. A Sparse Coding Approach to Household Electricity Demand Forecasting in Smart Grids. IEEE Trans. Smart Grid 2017, 8, 738–748. [Google Scholar] [CrossRef]
- Ayub, N.; Irfan, M.; Awais, M.; Ali, U.; Ali, T.; Hamdi, M.; Alghamdi, A.; Muhammad, F. Big Data Analytics for Short and Medium-Term Electricity Load Forecasting Using an AI Techniques Ensembler. Energies 2020, 13, 5193. [Google Scholar] [CrossRef]
- Bedi, J.; Toshniwal, D. Empirical Mode Decomposition Based Deep Learning for Electricity Demand Forecasting. IEEE Access 2018, 6, 49144–49156. [Google Scholar] [CrossRef]
- Senjyu, T.; Takara, H.; Uezato, K.; Funabashi, T. One-hour-ahead load forecasting using neural network. IEEE Trans. Power Syst. 2002, 17, 113–118. [Google Scholar] [CrossRef]
- Jiang, Q.; Cheng, Y.; Le, H.; Li, C.; Liu, P.X. A Stacking Learning Model Based on Multiple Similar Days for Short-Term Load Forecasting. Mathematics 2022, 10, 2446. [Google Scholar] [CrossRef]
- Huang, L.; Liao, Q.; Qiu, R.; Liang, Y.; Long, Y. Prediction-based analysis on power consumption gap under long-term emergency: A case in China under COVID-19. Appl. Energy 2021, 283, 116339. [Google Scholar] [CrossRef] [PubMed]
- Alasali, F.; Nusair, K.; Alhmoud, L.; Zarour, E. Impact of the COVID-19 Pandemic on Electricity Demand and Load Forecasting. Sustainability 2021, 13, 1435. [Google Scholar] [CrossRef]
- Özbay, H.; Dalcali, A. Effects of COVID-19 on electric energy consumption in Turkey and ANN-based short-term forecasting. Turk. J. Electr. Eng. Comput. Sci. 2021, 29, 78–97. [Google Scholar] [CrossRef]
- Scarabaggio, P.; La Scala, M.; Carli, R.; Dotoli, M. Analyzing the Effects of COVID-19 Pandemic on the Energy Demand: The Case of Northern Italy. In Proceedings of the 12th AEIT International Annual Conference (AEIT), Catania, Italy, 23–25 September 2020; Institute of Electrical and Electronics Engineers, Inc.: New York, NY, USA, 2020. [Google Scholar] [CrossRef]
- Mohammad, F.; Ahmed, M.A.; Kim, Y.-C. Efficient Energy Management Based on Convolutional Long Short-Term Memory Network for Smart Power Distribution System. Energies 2021, 14, 6161. [Google Scholar] [CrossRef]
Disclaimer/Publisher’s Note: The statements, opinions and data contained in all publications are solely those of the individual author(s) and contributor(s) and not of MDPI and/or the editor(s). MDPI and/or the editor(s) disclaim responsibility for any injury to people or property resulting from any ideas, methods, instructions or products referred to in the content. |
© 2023 by the authors. Licensee MDPI, Basel, Switzerland. This article is an open access article distributed under the terms and conditions of the Creative Commons Attribution (CC BY) license (https://creativecommons.org/licenses/by/4.0/).