Abstract
Due to uncertain photovoltaic (PV) power generation, analyzing the voltage stability of transmission networks with a large PV plant is challenging. The stability of PV output power is a critical factor in establishing PV penetration levels in active transmission networks when assessing loading capabilities. Therefore, this article contributes to enhancing the understanding of how a static synchronous compensator (STATCOM) could be used as part of the power system network. STATCOMs are often used to improve the static and transient voltage, maintain transmission limits, and reduce low-frequency disturbances. With the help of a STATCOM unit, a proper investigation and analysis of dynamic voltage stability in a transmission system are presented. The validity of the study is evaluated by the Saudi Arabia grid code (SAGC). The system being tested is comprised of a 300 MW PV plant in Sakaka, Saudi Arabia, integrated into a 17-bus transmission power network and a STATCOM, which is employed at one of the buses. PSAT software is used to evaluate a number of case studies to determine the transient voltage stability with and without the STATCOM and the PV plant. The simulation findings demonstrate how STATCOM functions to improve the quality of the power system in accordance with the SAGC. In addition, the analysis of voltage stability demonstrates that the power network’s resilience to short circuits at the PV system’s grid connection point significantly impacts the voltage’s dynamic behavior.
1. Introduction
1.1. Renewable Energy State of Art in Saudi Arabia
With the increased interest in renewable energy sources (RESs) to enhance their contribution and participation in the utility grid, the renewable energy industry has made rapid changes and technological progression to tackle the different challenges that face the deployment of such an industry. The recent trend in energy consumption indicates the need for alternative energy sources to balance the energy generated and load demand. Thus, solar photovoltaic generation plants (SPVGPs) have experienced a phenomenal increase over the past few decades. In addition, more interest has been oriented toward photovoltaic (PV) technology as a promising and encouraging solution to overcome fossil fuel emissions, produce green energy, and mitigate fast climate changes [1,2].
Saudi Arabia is one of the most fortunate countries with plenty of solar energy. The amount of solar energy in kilowatt-hour/kilowatt peak (kWh/kWp) that Saudi Arabia receives as solar irradiation in various parts of the country is indicated in the map published by the World Bank group. The potential of solar PV in Saudi Arabia is depicted in Figure 1 [3]. As per the details posted in the Saudi Arabia national renewable energy program (NREP), the government has identified more than 35 locations to deploy renewable energy projects. Renewable energy generation primarily includes solar photovoltaic, wind, and concentrated solar power (CSP) [4,5,6,7]. The program was planned considering the long-term targets to be met by 2030. Figure 2 shows the location of renewable energy projects that shall be completed by 2030 as per the NREP report. Moreover, the government decided to tender 12 pre-developed projects with a total capacity of approximately 3.1 GW. Around 2.2 GW would be generated using solar PV. The locations selected for solar plants are Qurrayat, Madinah, Rafha, Al Faisalia, Rabigh, Jeddah, Mahad Dahab, Saad, Alras, and Wadi Adwawser. The remaining 0.9 GW will be generated using wind in Yanbu [7,8]. One of the essential strategies of the government of Saudi Arabia is to include private-sector investment and public-private partnerships. The inclusion of the private and public-private sectors will help the government manage the nation’s power needs more effectively. The 300 MW Sakaka Solar PV project, tendered by Saudi Arabia’s renewable energy development office (REPDO), is one of the most significant projects in Saudi Arabia. The completion of the Sakaka Solar PV project has made a substantial contribution to the energy diversification and development plans of Saudi Arabia. With the opening of the Sakaka plant, Saudi Arabia has announced that agreements have been signed for seven new solar power projects. The seven new solar projects will be in Madinah, Sudayr, Qurayyat, Shuaiba, Jeddah, Rabigh, and Rafha. The total capacity of these projects, including the Sakaka solar project and the Domat Al jandal wind project, is expected to be 3670 MW as per the details available from the Saudi Ministry of Energy [9,10]. In tandem with the opening of Sakaka, the Public Investment Fund of Saudi Arabia unveiled its plans for Sudair Solar PV, a distinct renewable energy project that would eventually grow to be the largest solar plant in Saudi Arabia. The Sudair Solar PV project, with an estimated investment value of SAR 3.4 billion and a capacity of 1500 MW, will be able to power 185,000 houses and offset over 2.9 million tons of emissions annually.
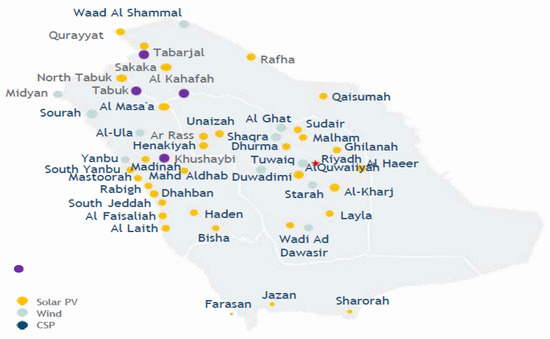
Figure 1.
Location of renewable energy projects to be deployed across Saudi Arabia.
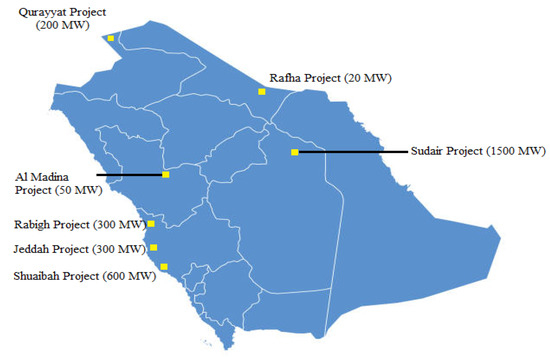
Figure 2.
Location of seven new solar PV projects [7].
1.2. Impact of PV Integration on Power System Stability
The effect of a large PV integration with the Saudi electricity grid needs to be analyzed in detail. The intermittent nature of PV plant power generation increases the concerns about providing the national grids with secure and reliable power operation [11,12]. With more PV deployment worldwide, the effect of PV technology on grid frequency stability, oscillations, transient angle stability, and voltage stability have become popular research topics.
High PV penetration causes relatively low system inertia, adversely affecting the steady-state and transient stability of the power system. The grid’s ability to synchronize power will be hampered by the PV plants’ massive power injection because of the increased angular disparity in AC bus voltages. In addition, the dynamic system behavior of the system with high PV penetration depends on the type and location of the disturbance. The literature shows that the stability of power systems with high PV penetration levels has been studied frequently [13,14,15,16,17,18,19]. In [13,14], the authors explored the impact of integrating large PV generation on the Tunisian power grid. Their results show that the grid performance highly depends on the LVRT capability, which can be improved using reactive power compensators. In [15], the authors explored the impact of the high penetration of PV systems on the Egyptian national grid. The simulation results showed that the power grid can accept a PV penetration of up to 10% of the grid capacity. Moreover, the authors in [16] explored the influence of connecting wind and PV power plants on the Jordan national grid. It was suggested that the penetration capacity of renewable power sources should not be increased to more than 10% to avoid transmission line overloading. Furthermore, the authors in [17] examined the influence of adding 1 MW PV generation to the utility grid in Bahrain. This study attempted to use the exceptional weather conditions of Bahrain to balance the increased load demand. In [18], the authors studied the incorporation of large-scale hybrid PV and wind energy systems on the Nigerian power grid. The simulation results show the optimal PV and wind power penetration levels, satisfying the bus voltage criteria (1.0 ± 0.05 p.u.), based on the ratio of the maximum value of the active power margin and critical voltage-reactive value; this suggested power ratio is 35%. Further, a comprehensive study of the Ontario national grid investigating PV penetration levels is provided in [19].
Furthermore, a high PV penetration level can significantly affect voltage stability, making it an important reliability factor. Voltage stability refers to the ability of the power system to keep the bus voltages within permissible limits in post-disturbance clearance conditions. It was discovered that when PV penetration reached 50%, there was a more significant voltage dip following a disturbance in the system [20]. Furthermore, as the level of PV penetration rose, more voltage oscillations were observed. In addition, a significant disturbance with high PV penetration in the power system could cause voltage instability [21]. A voltage stability analysis was conducted using the grid simulation model of Ontario and system Eigenvalues. It was seen that the short-term voltage stability was highly affected by the disconnection of the PV power generation and voltage sag.
On the other hand, static voltage stability was presented [22,23,24,25,26,27,28,29]. The main factors affecting static voltage stability are the PV generation size, location, and control method. The effect of integrating PV generation on Bangladesh’s power grid was presented in [29]. The results showed improved voltage stability near the load buses by integrating PV generation in a centralized style near the load buses or distributed near the load buses. Additionally, the authors of [30,31] studied the impact of the environmental conditions on the grid voltage and frequency stability by considering the irradiance and temperature profiles over the entire year. Reactive power control is crucial to enhance the voltage stability of highly penetrated PV power systems. Since significant power oscillations can be produced due to the intermittent and low inertial nature of PV systems, such fluctuations abruptly affect the power system stability and limit the penetration level of the PV generation.
Flexible alternating current transmission systems (FACTs) are often employed to overcome low-frequency oscillations and improve power transfer capability. Several methods for reactive power compensation were developed in [32,33,34,35,36]. By using the appropriate FACT devices, such as thyristor controller switched capacitors (TCSCs), static var compensators (SVCs), static synchronous series capacitors (SSSCs), and static synchronous compensators (STATCOMs), the reliability of grids could be increased with a reduction in the cost of power transfer. STATCOM and SVC are the standard modules commonly used for reactive power compensation. Both are useful for voltage stabilization, improving transient stability, maintaining transmission limits, and damping low-frequency oscillations. However, compared to SVC, STATCOM is much better at improving the transient stability and transmission limit [37]. When the damping of low-frequency oscillations is taken into account, STATCOM outperforms SVC because STATCOM represents an adjustable voltage or current source whose amplitude and phase can be controlled to change the reactive power delivered to the grid. Moreover, STATCOM indicates a better performance than SSSC [37]. In order to mitigate these problems, installing reactive power supply components is encouraged. Such mitigation is addressed by imposing VOLT/VAR control equipment as per the IEEE 1547 interconnection code for PV smart inverters connected to the grid [38]. PV intelligent inverters can provide reactive power support at all output levels of the solar PV plant. However, that comes with the cost of curtailing the real power output by the PV smart inverter unless the inverter is operating at 100% of the real power level and the voltage is outside of the dead band. On the other hand, PV smart inverters provide little reactive power support during abnormal voltage conditions. Thus, the dynamic voltage support (DVS) of PV smart inverters during abnormal conditions has not yet been introduced in the most recent IEEE 1547.1-2020 due to a lack of standard test procedures for such a function [38].
From the above discussion, the main aim of this paper is to investigate the impact of grid-tied photovoltaic systems in the Aljouf Region, Saudi Arabia, using dynamic reactive power control. The general contributions of this paper can be summarized as follows:
- Detailed system modeling is developed and the impact of the penetration levels of solar PV power plants in the north network region in Saudi Arabia are studied using computer simulation software (PSAT) during normal and transient conditions. The voltage and frequency stability are also evaluated.
- The system components for power system stability and reliability are modeled, which is a complex task due to the dependency of the output power on the intermittent source (solar radiation and other weather parameters), and the availability of a large number of system components such as synchronous generators, regulators, transformers, transmission lines and loads, is developed.
- The compliance of the developed model according to the Saudi Arabia grid code is investigated; the two major compliances checked are the HVRT/LVRT and active and frequency regulation.
- Grid integration studies (load flow, short circuit, and transient stability) are performed for verifying the validity of the provided model.
The paper is organized in the following sequence: System modeling of the power system components including SPVG is provided in Section 2, Section 3 introduces the Saudi Arabia grid code (SAGC) for the interconnection requirements for the power quality of the transmission system, Section 4 examines the effects of weather conditions, Section 5 shows the power system description and investigation methodology, Section 6 presents the simulation results of the studied system, and Section 7 summarizes the paper’s contributions and conclusion.
2. Power System Modeling for Stability Analysis
Modeling of various power system components has been developed to examine the power system stability of this case. In this section, the required models of the SPVGPs and STATCOM are presented in detail as follows:
2.1. SPVGP Dynamic Model
A proper model for solar photovoltaic generation plants is required for the stability analysis of power systems responding to disturbances in tens of milliseconds to several hours [39]. A typical structure for grid-connected SPVGPs is used in Figure 3, consisting of a PV array, DC/DC and DC/AC converters, and a system control unit. Utility-scale SPVGPs are distinguished by their control capability limited voltage, which is based on their reactive power control capabilities [39,40]. Dynamic modeling accurately represents inverter-based resources such as SPVGPs [41]. Since utility-scale SPVGPs are connected on the transmission level, for stability studies, the functional model shown in Figure 4 is considered, and for general studies of the SPVGPs, an active power injection with reactive power regulation is used [40].
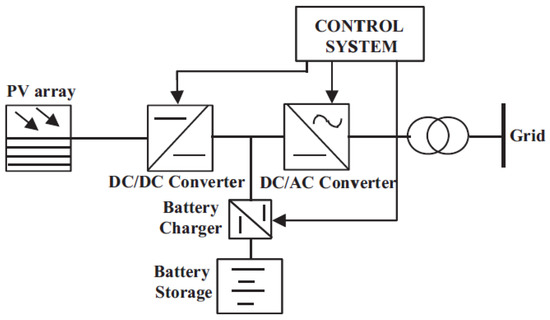
Figure 3.
Grid-connected SPVGP structure.
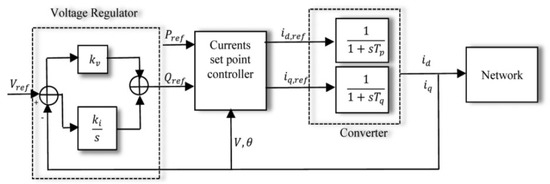
Figure 4.
Dynamic SPVGP model with inverter.
Figure 4 illustrates the SPVGP grid-connected inverter modeling using a first-order transfer function with unity steady-state gain. In the detailed block diagram of the SPVGP model, the measurement of the terminal voltage in the synchronous reference (DQ) frame with the desired active and reactive power parameters will assist in achieving the desired current set points as follows:
2.2. STATCOM Modeling
One of the components of a flexible alternating current transmission system (FACTS), which is used to increase the quality and stability of power systems, is a static synchronous compensator (STATCOM). A shunt-connected device that can inject or consume reactive power is a STATCOM. Employing pulse width modulation (PWM) converters with the proper control strategy allows the much faster operation of a STATCOM compared to the fundamental power system cycle. The enhanced technologies of the solid-state switches include insulated gated bipolar transistors (IGBTs) and gate turn-off thyristors (GTOs). The STATCOM has received significant interest with regard to being employed in medium and high-power applications of PWM-based FACTS [42]. Figure 5 shows the schematic diagram of a STATCOM. It consists of a storage element (Cdc), a voltage source converter (VSC), and a coupling transformer. The role of the VSC is to convert the (Vdc) across the storage element into AC voltages in phase to the AC bus voltages through the coupling transformer. The injected current from the STATCOM (Ic) is aligned in quadrature in reference to the bus voltage to ensure the reactive power is handled between the AC system and the STATCOM bus. The injected current by the STATCOM is dependent not only on the used PWM but also on the characteristics and the capability of the IGBTs.
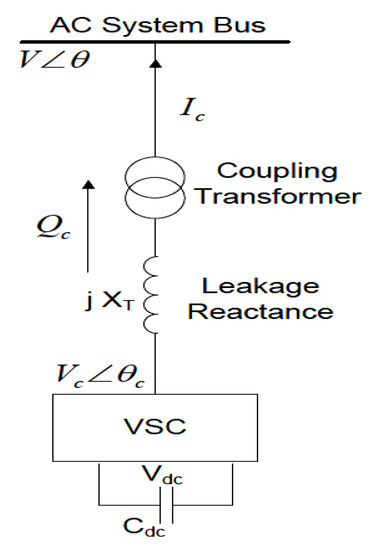
Figure 5.
Schematic diagram of a STATCOM.
The basic structure of the STATCOM equivalent circuit and control block is shown in Figure 6.

Figure 6.
STATCOM dynamic model.
The injected current and reactive power from the STATCOM shown in Figure 6 can be expressed with Equations (2) and (3).
3. Saudi Arabia Grid Code (SAGC) Requirements
For the proper connection of SPVGPs, the Saudi Arabia grid code SAGC requirements have to be considered. SAGC is a technical guideline and description which defines the range of technical parameters for a facility connected to the electric grid. SAGC has considerable consistency with IEEE 1547 about transmission system performance [43,44,45]. The electrical grid system’s stability, security, and economic functioning are achieved by following and implementing the grid code. The grid code manages and modulates the general conditions related to equipment installations and integration of power devices to high and extra-high voltage grids. The code also guides the utilization of grid services, the grid’s expansion, and the grid’s operation. According to the SAGC guidelines for better transmission system efficiency, several electrical parameters should be maintained within acceptable limits, as presented below.
3.1. Frequency Variations
The transmission system’s nominal frequency is 60 Hz and should be maintained between 59.9 and 60.1 Hz during regular service. The defined limits in Table 1 should design the generating system and auxiliary control apparatus.

Table 1.
Frequency requirements as per the SAGC [45].
3.2. Voltage Variations
The nominal range values of transmission voltage should be maintained as presented in Table 2. The maximum overvoltage limits should not be exceeded for more than 30 min under unusual circumstances:

Table 2.
Voltage requirements as per the SAGC [45].
3.3. Harmonic Distortion
The transmission system equipment must be able to withstand voltage and current harmonics. The connected equipment should not inject voltage harmonics into the transmission system above the value agreed in the connection agreement. However, if no such agreement is made, the total harmonic distortion (THD) must not exceed 1.5%, with no individual harmonic exceeding 1%.
3.4. Voltage Unbalance
The end-user should not trigger unbalanced voltages in the network compared to no-load and balanced three-phase loading. The maximum number of unbalanced conditions allowed at the connection point should not exceed 1%.
3.5. Protection Equipment/Schemes
All users are responsible for ensuring the safety and security of the apparatus and equipment used to interface with the transmission system at their locations. Users must adhere to the primary security’s fault clearance timing specifications, not surpassing the time limits stated in Table 3.

Table 3.
Fault clearance time [45].
3.6. Requirements for Generators
At the generating terminals, synchronous generating units (SGU) should supply rated active power at any stage between 85% for a lagging power factor and 95% for a leading power factor, as shown in Figure 7. A power park module (PPM), or PV plant, generating active power exceeding 20% of the rated power, should be able to absorb or deliver reactive power in the range of −0.33 to 0.33. The reactive power for a PV plant should be between −0.05 and 0.05 for a system with an active power output of less than 20% of the rated capacity [45].
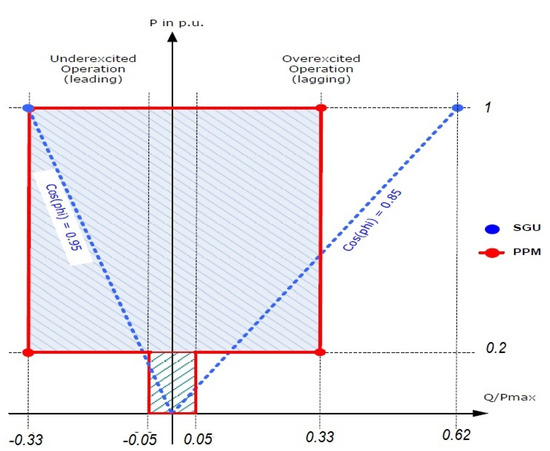
Figure 7.
P-Q Diagram (SGU: Synchronous generation unit; PPM: Power Park Module).
In addition, for frequencies between 59.5 and 60.5 Hz, the generating units must be efficient enough to continuously produce their rated active power at the connection point. The output active power reduction should not be more than 4%/Hz in the 57 to 59.5 Hz frequency range. The synchronous generators should not disconnect from the network, even if the frequency changes at a rate of up to 1 Hz/s, unless there is a problem with the mains protection. Figure 8 illustrates how a PV plant should be able to resist frequency shifts of up to 2.5 Hz/s without disconnecting from the network unless the shift is caused by the absence of the primary protection mechanism. The PV plant should be able to modulate its active power in response to frequency deviations over 60.2 Hz to control its active power from 60.2 Hz to 62.5 Hz. An average drop in active power should be 4%; however, it should be changeable between 2% and 8%. Moreover, the PV plant should control its active power in the frequency range of 57 Hz to 59.8 Hz by modulating its active power to a frequency deviation below 59.8 Hz. Where the usual droop is at 4%, the active power drop should be adaptable between 2% and 8%. All generation units, including renewable generators, should be closely monitored to sustain a steady-state voltage of ±0.5 of the usual voltage rating during steady-state service. To further minimize power oscillations at a low-frequency band of 0.15 to 2 Hz, a PV plant with more than 25 MW capacity should be equipped with a power oscillation damper to adjust the plant’s output power up or down as needed.
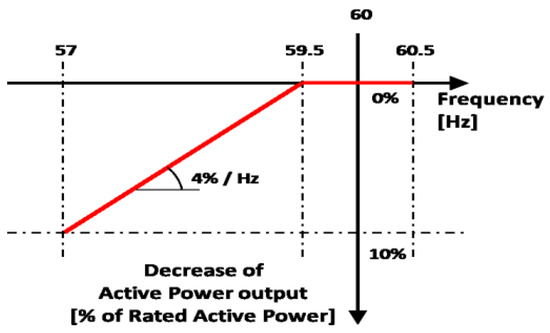
Figure 8.
Maximum active power output reduction diagram.
3.7. Fault Ride-Through Capability
Figure 9 shows the specifications for the lowest voltage that solar photovoltaic generators must sustain. A PV plant with good transient stability remains connected to the power grid for an overall fault clearance time of 300 ms. The grid should remain stable and isolated during fault conditions and the PV plant’s operating range. If the voltage drops to zero over 300 ms, the PV plant should still be able to function. After the first voltage drop, the voltage must be linearly recovered from the lower value up to 80% of the nominal voltage in one second. At the point of common coupling, the voltage should be kept at 80% of the nominal grid voltage for a recovery time of 30 min. For the grid to remain stable, solar inverters must be able to execute low voltage ride-through (LVRT).
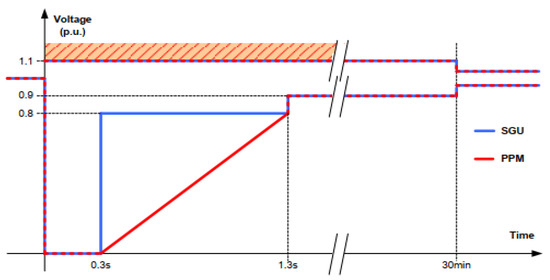
Figure 9.
Typical limit curve of LVRT/HVRT requirements.
Figure 9 also depicts the high voltage ride-through (HVRT) requirements based on the SAGC. When the grid voltage at the PV system connection point climbs to 110%, the PV plant must tolerate failures and stay connected for 300 ms. After a 30-min voltage recovery period, the voltage is restored to 105% of the rated voltage at PCC. The restore time of the PV plant during fault operation is displayed in Table 3 [38]. The network voltage range is represented in per-unit values.
Under a voltage dip at the point of common coupling, the PV plant effectively raises its reactive current production to add more reactive power to the grid, enabling the grid voltage to recover more quickly. It is performed to inject a dynamic reactive current for voltage correction. The SAGC mandates that the PV plant must be able to drain the grid of reactive power and reactive current in the event of an overvoltage. When the voltage drops below 1.0 p.u., it is expected that the PV plant will inject a reactive current into the grid that is proportionate to the voltage variation. The relationship between the reactive current and voltage deviation is expressed as follows:
ΔIq is the change in the reactive current during pre- and post-disturbance conditions, with a requirement of 0 ≤ k ≤ 10 p.u., where k is the slope, also known as droop. The considered reactive current tolerance ΔIq is ±20% where In is the rated current. On the other hand, the PV plant must be effective in supplying reactive current by fulfilling the droop k condition when the voltage exceeds the dead band field [44]. If the voltage drop exceeds 50%, then 100% of the rated current must be supplied by the reactive current.
3.8. Reactive Power Behavior at Sakaka Power Plant
In this section, the reactive power generation in the power plant was analyzed. The grid code compliance at the SAKAKA PV Power Plant is also verified in this section. The reactive power analysis is critical for ensuring the smooth functioning of the power plant. Proper planning, monitoring, and instantaneous decision-making based on these data are required. Unlike a synchronous generator, solar PV generation units are classified into different categories. PV-generating units have limited but quick responses. According to the grid code compliance, photovoltaic systems are categorized as Power Park Modules (PPM), which must be able to supply or absorb reactive power at the point of interconnection within the range Q = {−0.33, 0.33} of the rated active power output over 20% of the rated capacity. A further requirement for compliance with the grid code is that the PPM be able to restrict the reactive power output of Q within the range of {−0.05, 0.05} of the rated power with the active power output under 20% of the rated power. The two conditions mentioned were evaluated using the simulation, performed at 100% generation, considering that the impact would be much higher compared to only 20% generation, to check for grid code compliance. Various load flow analysis is carried out to confirm the requirements for grid code compliance. The load flow analysis conducted in the Sakaka Power Plant was satisfactory, indicating that the grid code compliance is adequately met in the Sakaka PV plant.
The plant’s latest FACT devices control the reactive power injected and absorbed. To analyze the performance of FACT devices and to study the power flow in the Sakaka PV power plant, the reactive power was monitored by considering two different cases. In the first case, it was assumed that the FACT devices were not connected to the system. In the second case, the FACT devices were included in the system to study, record the reactive power, and analyze the system’s performance. In this case, the effect of adding FACT devices, Static Var Generators, on the reactive power profile in Sakaka PV Power Plant was used to analyze the plant’s performance. SVGs are active power filters (APFs) that offer immediate and efficient solutions to power quality issues. They are compact, versatile, modular, high performing, and cost-effective. By adhering to the most stringent power quality standards and grid rules, SVGs can extend the useful life of equipment, increase dependability with greater power system capacity, have good stability, and reduce energy losses.
Various cases have been studied to understand how FACT devices such as SVGs can help improve system performance. Without SVGs, the reactive power produced by the SVG is taken as zero MVAR. The reactive power at the PCC without SVGs is on the low side. The increase in the MVAR value can be gradually seen in the case where an SVG has been included in the system for reactive power compensation. The inclusion of an SVG in the system provides the system with proper stability by injecting or absorbing reactive power whenever required.
3.9. Reactive Power Supply by Inverter at Night
The system voltage stability depends on reactive power, as the reactive power is directly proportional to the voltage. Any PV plant installed on the grid must comply with the grid code requirements to ensure stable and reliable system operation. With the increased penetration of PV plants, challenges related to reactive power control and voltage support may also arise. Considering the amount of power produced in the Sakaka PV Power Plant, it is evident that the reactive power requirement will also be very high. It is well-known that PV plants are capable and efficient at producing output based on the irradiance level available to the modules. Hence, the production during low irradiance levels or at night needs to be compensated by some other means, as the PV modules would not be able to produce an output at night. During the daytime, the reactive power requirement can be easily met but during the night, this is not the case. The reverse voltage to the PV module increases when the inverter is switched on at night. It is important to predetermine the value of the reactive power inverter at night. The inverters must be switched based on the requirement to minimize power loss. The inverter will absorb reactive power from the grid once it is switched to “reactive power output at night” mode.
The inverter P-Q curve (see Figure 10) describes the operating region and variation of the inverter output concerning the voltage and temperature. When the inverter operates at a grid voltage of 1.0/1.05/1.1 and an ambient temperature of 50 degrees Celsius, the output power can reach 90 KW or 90 kVA. However, with a reduction in the terminal voltage at the same ambient temperature, the output of the inverter reduces proportionally, i.e., a 5 % reduction in voltage shall cause a 5% reduction in the overall output of the inverter.
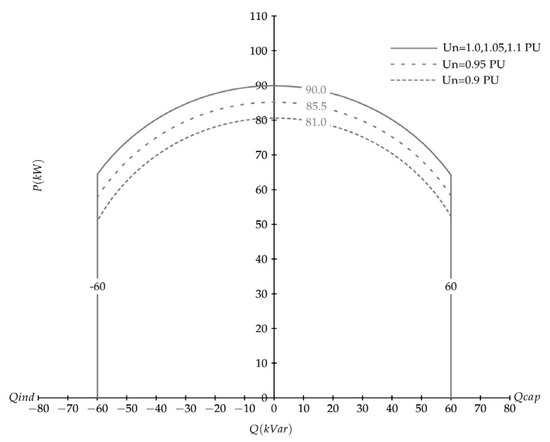
Figure 10.
P-Q diagram of the inverter.
The reactive power injection supports the voltage levels at nearby buses. Such behavior would benefit the grid and PV, with voltage levels converging throughout the base.
4. Effect of Weather Conditions
Generally, the performance of a PV module is specified under standard test conditions (STC); for example, the rating of a PV module may be specified for a particular irradiance and temperature level. Although the PV module manufacturers may limit the rating of the module case conditions for STC, the PV module will operate practically under continuously varying climatic conditions. For accurate results, the performance of PV modules in any power plant needs to be monitored throughout the year. Various factors must be considered before selecting a specific type and rating of PV modules for designing a PV power plant. These factors include weather data such as total solar irradiation, temperature, and humidity. In addition, PV module specifications such as the efficiency of PV modules, cell temperature coefficient, and power degradation rate of PV modules over time are considered.
Figure 11 illustrates the effect of irradiance and temperature on the performance of PV modules. Observations suggest that a rise in temperature results in a small increase in the current while decreasing the PV module’s voltage.
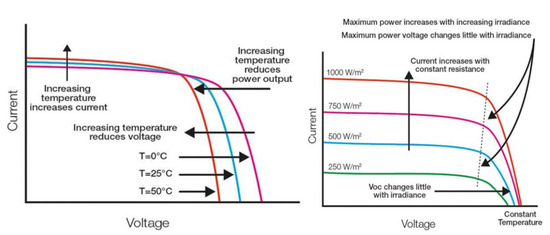
Figure 11.
Typical VI characteristics of PV panel.
Consequently, the PV module’s maximum output power will drop. In addition, the maximum PV power is proportional to solar irradiation. The following equations illustrate the relation between the PV module’s current, voltage, power, irradiance, and temperature.
where ,, , and are the PV module efficiency at STC, the effective area of the PV module, solar irradiance, PV module cell efficiency, power converter efficiency, efficiency temperature coefficient, cell temperature, ambient temperature, and normal operating cell temperature of the PV module, respectively.
The parameters, such as irradiance, temperature, humidity, power generation, etc., which indicates the performance of PV modules used in the Sakaka Plant, were collected from January 2020 to December 2020 on a real-time basis. Various graphs were plotted to illustrate the effect of environmental factors such as irradiance, temperature, and humidity on the total power generated in the Sakaka PV Power Plant. In addition, the data was collected considering the climatic changes in three different categories: sunny, moderately cloudy, and very cloudy, to achieve better and more accurate results.
4.1. Effect of Solar Irradiance
The power output and the efficiency of the PV panel primarily depend upon the irradiance or insolation level that the panel receives from the sun. Environmental factors such as cloudiness, dust, and pollution severely affect the module’s performance. Additionally, the geographical location of the power plant, the angle at which the panel is inclined, and the cleaning and maintenance of the panel affect the module’s performance considerably. The real-time data of the power output generated by the Sakaka plant concerning the amount of irradiance received by the modules during sunny, moderately cloudy, and very cloudy days were plotted and are shown in Figure 12, Figure 13 and Figure 14, respectively.
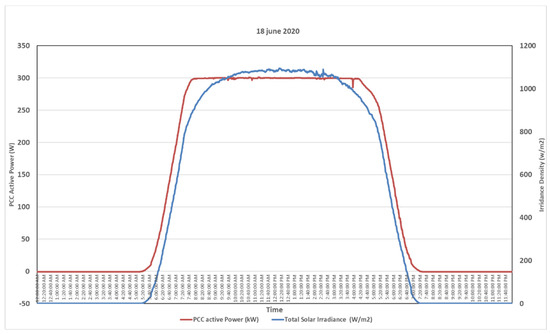
Figure 12.
Power vs. irradiance on a sunny day.
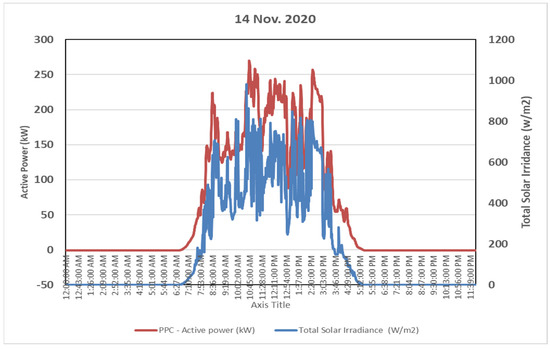
Figure 13.
Power vs. irradiance on a moderately cloudy day.
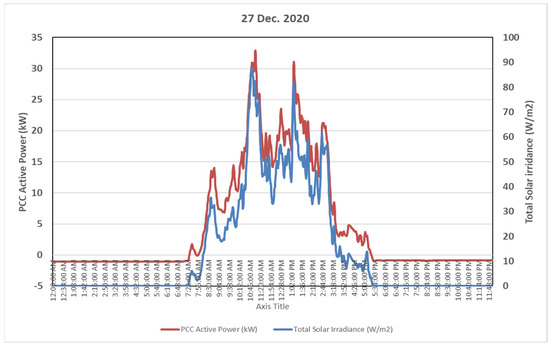
Figure 14.
Power vs. irradiance on a very cloudy day.
Figure 12 shows the power generated in kW and irradiance level on a sunny day with a very clear sky on 18 June 2020. The irradiance level was very high, approximately 1000 W/m2, and consistent. As a result, the plant produced a steady output of 300 kW without difficulty.
A moderately cloudy day, 14 November 2020, was selected for data collection. Figure 13 shows the output from the plant was reduced compared to the earlier case. The fluctuation of radiation and hence the output is clearly visible; a steady output was not available due to the cloudy weather.
The PV plant in December 2020 experienced a very cloudy day. The irradiance level received by the module was very low, resulting in reduced power generation from the PV plant to a very low level (maximum generated power—33.5 kW) with the interference of clouds between the sun and panel, as shown in Figure 14.
4.2. Effect of Module Surface Temperature
This section discusses the real-time data collected for the variation of power generated concerning changes in temperature variation. The performance ratio was also considered to better understand the effect of the module surface temperature on power output.
In all three cases discussed earlier, we can see that the power increases with the increase in irradiance up to a certain level and then decreases. The panel can only produce an output proportional to the irradiance level to a particular level. After this level, though the value of irradiance received increases, the module temperature increases, which results in a decrease in the output power.
Similar to the previous section, three days have been selected for data collection: meager, normal, and very high-temperature days. Although the highest module surface temperature of approximately 700 °C was recorded on a partially cloudy day on 28 July 2020, the power generated on the same day by the plant was around 300 kW, as shown in Figure 15. The performance ratio on this date was 75.88%.
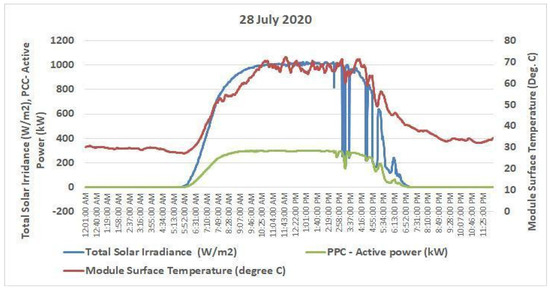
Figure 15.
Variation of active power with temperature and irradiance on a partially cloudy day with a very high temperature.
Figure 16 shows a day with moderate temperature. The maximum temperature recorded on this day was around 500 °C. Although the temperature is lower when compared to the previous case, here we can see the amount of power the plant is generating is still 300 kW. The irradiance level is on the higher side, and the temperature is low, which results in a performance ratio of 80.24%, 4.36% more than the previous case.
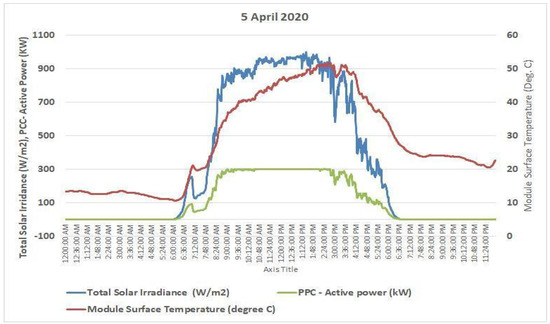
Figure 16.
Variation of active power with temperature and irradiance on a day with moderate temperature.
Finally, a day with the lowest module surface temperature was compared to the previous two cases. The maximum module surface temperature recorded on 25 January was around 230 °C. The module surface temperature was reduced, and the effect can be seen in power generation in Figure 17. A fluctuation in power generation due to changing temperature is visible here. The performance ratio (see Table 4) increases with high irradiance, and low temperatures are proven to be productive again, as the performance ratio calculated on this day is 88.3%. To validate the results, module surface temperatures were re-recorded on the same dates in 2021, i.e., 25 January, 5 April, and 28 July 2021.
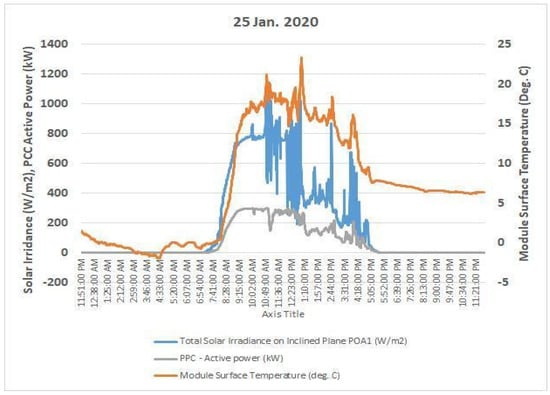
Figure 17.
Variation of active power with temperature and irradiance on the day with the lowest module temperature.

Table 4.
Comparison of the performance ratio corresponding to different module surface temperatures over two years.
4.3. Effect of Humidity
The electrical productivity of PV modules may be affected when exposed to moisture in the atmosphere. Even excessive exposure to moisture may result in the corrosion of the metallic parts of the modules. At a given temperature, relative humidity is the ratio between the actual water vapor pressure in the air and the saturated water vapor pressure. The atmospheric relative humidity (RH) depends on the water vapor saturation pressure and is affected by temperature. In hot and humid locations, moisture can penetrate PV cells through cracks, resulting in a considerable drop in cell efficiency.
This section discusses the variation of the plant’s power outputs concerning changes in humidity conditions. Three days with very high, moderate, and very low humidity conditions (Figure 18, Figure 19 and Figure 20) were selected to monitor the Sakaka plant’s output based on the air’s varying humidity.
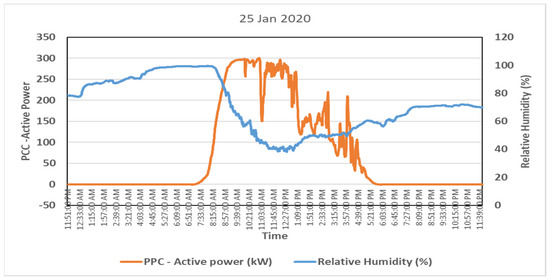
Figure 18.
Active power vs. relative humidity on a very humid day.
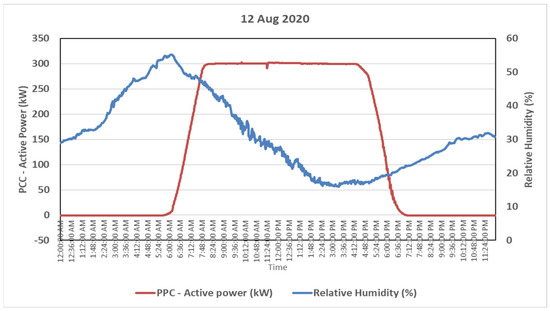
Figure 19.
Active power vs. relative humidity on a moderately humid day.
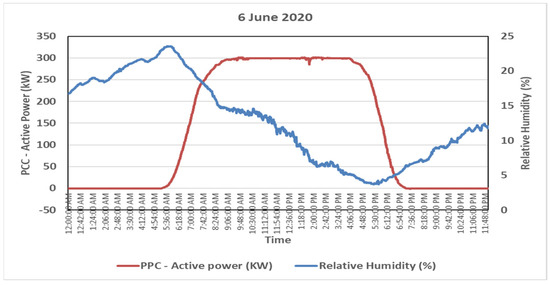
Figure 20.
Active power vs. relative humidity on a least humid day.
The output variation on a very humid day (25 January 2020) is represented using a graph in Figure 18. The percentage humidity from evening till early morning was at a high value, but as the day progressed, the humidity decreased. From Figure 18, we can infer that the power output is greater when the atmospheric humidity is low. In Figure 19, during a moderately humid day (12 August 2020) with a clear sky, the power output was close to almost 300 kW, and the humidity did not seem to affect the plant’s output. This is also similar to when the humidity level was at its lowest on a very sunny day, as seen in Figure 20, on 6 June 2020. We can infer from these results that a high level of humidity does have a marginal effect on the output of PV modules during cloudy days. On a sunny day, however, low amounts of humidity under a clear sky do not affect the production of PV modules.
5. Power System Description and Investigation Methodology
Figure 21 shows the structure of the 17-bus test system which represents the Aljouf region grid. The system consists of two synchronous generators: Hail and Arar at buses 1 and 3, with one standby generator at bus 7. There are 8 constant PQ loads, 4 transformers, and 22 branches, with nominal base values for an apparent power and voltage of 100 MVA and 132 kV, respectively. The total load in the base case is 571.2 MW and 149.34 MVAR.
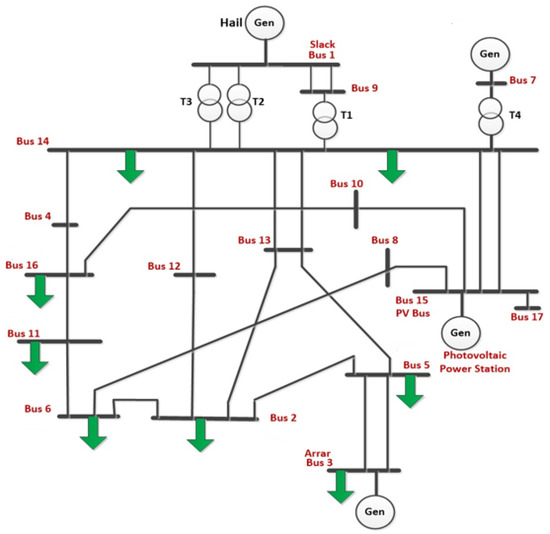
Figure 21.
Single line diagram of the Aljouf transmission grid with SPVG connected.
This study employed an exponential load recovery model with a recovery time constant of 60 s for active and reactive power, which is appropriate for voltage stability studies [46,47]. The central power plant, linked to bus 1, was chosen as the swing bus and was equipped with a turbine governor and an automatic voltage regulator. The solar photovoltaic generation plant was connected to bus 15 and had a maximum installed capacity of 300 MW, with a power factor ranging from 0.95 lagging to 0.95 leading. The transmission line parameters, load distribution at each bus, synchronous power station, model parameters used for the turbine governor and exciter model, and the parameters evaluated for the SPVGP were taken from [11].
In the first step, we tested the network voltage profile based on the load flow and Eigenvalues analysis in the base case under peak load demand conditions with and without SPVGP and STATCOM. The study of the network stability was accomplished with a transient stability analysis. In accordance with SAGC requirements, the stability of the grid-connected PV generators and synchronous generators in the considered power system network during faults was examined and analyzed.
Worst-case scenarios in this regard were taken into account. Initially, the system’s transient response was examined for an abrupt loss of photovoltaic power. Following that, a three-phase short circuit fault was applied to the SPVGP bus with and without SPVGP and STATCOM. Finally, with the SPVGP and the STATCOM present, a three-phase short circuit fault was employed at the largest load bus, i.e., Arar ‘bus 3’.
6. Simulation Results
A MATLAB-based toolbox popular for power system studies PSAT [48], was used for numerical analysis. It includes tools for load flow studies, dynamic stability studies, optimal power flow studies, and transient stability analysis. This software provides a Simulink-based one-line network and a full graphical interface. Steady-state and dynamic voltage stability analyses were performed as follows:
6.1. Steady-State Voltage Stability Analysis
In the static power flow studies, SPVGP’s voltage control capacity and active power generation were usually adapted to PV generator buses; they are referred to as load buses when they reach their reactive generation limits. To test this hypothesis [39,40,41], we analyzed the voltage profile of the network in peak-load conditions with and without SPVGP.
The characteristic of the voltage profile at all 16 buses with and without STATCOM is plotted in Figure 22. In the case of zero photovoltaic power, the connection bus voltage ranged from 0.98 to 1.045 p.u. With the integration of STATCOM to busbar 17 and SPVGP injecting the maximum solar power, the voltage magnitude profile was improved. It was observed that the voltage magnitude was reduced for all busbars after integration, and no over-voltages can be seen. The grid voltage profile, specifically the photovoltaic bus, increased to 1.045 p.u. The voltages in the network’s multiple buses were within the 5% tolerances.
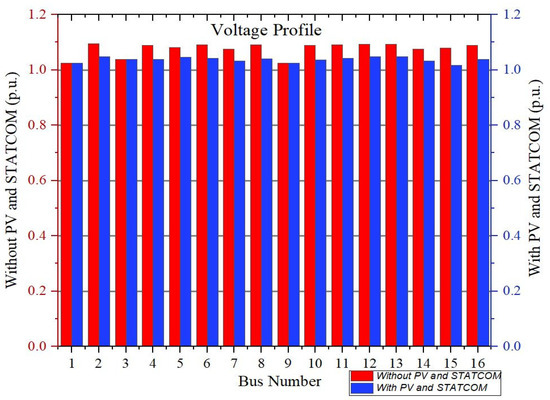
Figure 22.
Voltage profile at all buses without and with SPVGP and STATCOM.
Figure 23 shows the Eigenvalue locus of the static load flow Jacobian matrix for models without and with PV and STATCOM. The remaining Eigenvalue locus was ignored for the figure’s clarity, and only a loose value was considered. It was observed that the minimum Eigenvalue of the system’s static load flow Jacobian matrix increased from 2.33 to 2.647, resulting in a more stable system.
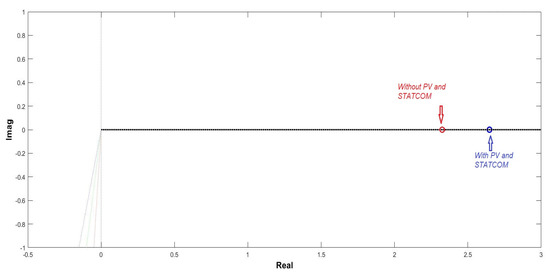
Figure 23.
Eigenvalue locus of the static load flow Jacobian matrix with and without PV and STATCOM.
The measured terminal voltage phase angle at each connection bus in radians for the system without and with PV and STATCOM is presented in Figure 24. It can be observed that the difference between the voltage phase angles of two neighboring buses was close to zero, as demonstrated by numerous references [49,50,51].
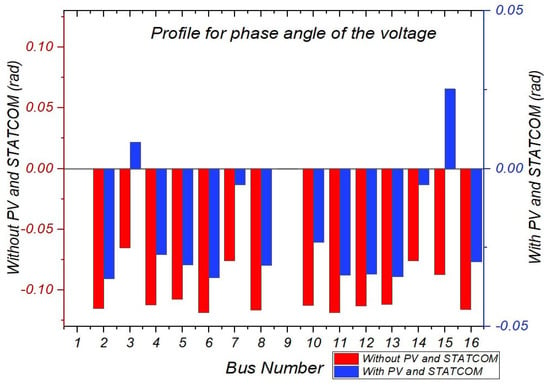
Figure 24.
Phase angle profile in radians without and with SPVGP and STATCOM.
It is evident that the reactive power generated is nearly zero with a value of unity resulting in to be zero. As a result, the angle difference influenced the increase in reactive power production. The reactive power generation increased as the angle difference increased. Therefore, the reactive power generated by the SPVGP on bus 15 and the synchronous generators on bus 3 were significantly increased, supplying the total reactive power consumption as shown in Figure 25.
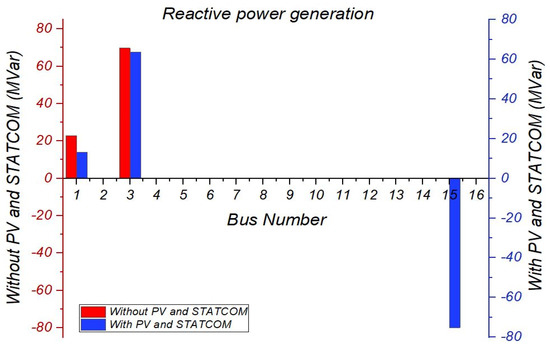
Figure 25.
Reactive power generation without and with SPVGP and STATCOM.
It can be observed in Figure 26 that after the SPVGP and STATCOM are connected online to the network, the active and reactive power were no longer provided by the swing bus and PV bus only but with contribution from the SPVGP and STATCOM, as shown in Figure 25 and Figure 26. It can be observed that the SPVGP and STATCOM supply the most active and reactive power demand.
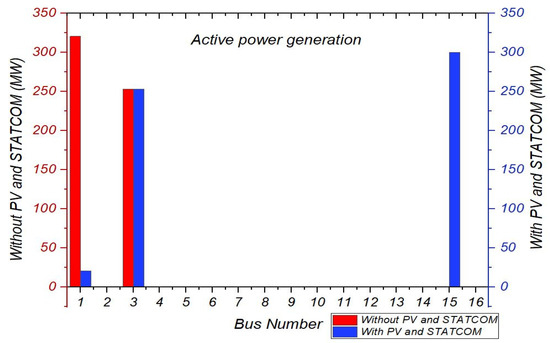
Figure 26.
Active power generation without and with SPVGP and STATCOM.
6.2. Dynamic Performance Analysis
This section presents and analyzes the transient responses of PV plants integrated into the grid and the synchronous generators of the considered power system network under faults. The system’s performance was assessed using the SAGC mandate. Worst-case scenarios were considered in this regard. Initially, a base case in time domain simulation was executed with the maximum solar PV power penetration. Laterally, the system’s transient response was tested for a sudden loss of photovoltaic power, i.e., disconnection of the SAKAKA photovoltaic farm. Following that, a three-phase short circuit fault was applied at the bus ‘3’ without the PV farm. Voltage profiles of fault conditions were applied at the photovoltaic farm’s connection bus, i.e., SAKAKA ‘bus 3’. A simulation of STATCOM during a short circuit at the PV farm was performed. Finally, at the largest load bus, i.e., at the Arrar generator, a three-phase short circuit fault was introduced for the stability studies of the transmission network.
6.2.1. Interconnection Requirements for Power Quality
Figure 27 depicts the minimum voltage values that the photovoltaic plants must withstand, according to IEEE 1547 [38]. It illustrates that a photovoltaic plant with good transient stability stays integrated into the grid without failing, with an average fault clearance period of 250 ms. Such faults should not result in instability or isolation from the transmission network when the solar photovoltaic power plant operates within its operating range. Furthermore, Figure 27 shows that a solar photovoltaic power plant should be capable of 250 ms of uninterrupted operation and a voltage drop of up to zero. The duration of a voltage recovery at the point of common coupling was 30 min, and it tracked up to 85% of the nominal power system voltage.
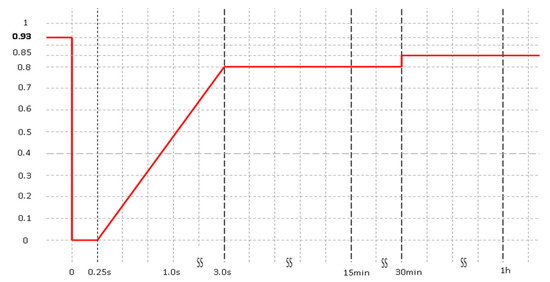
Figure 27.
The typical limit curve for IEEE 1547 LVRT requirements.
The LVRT capability of solar inverters is critical for system stability. Table 5 shows the recovery time of the solar power plant during abnormal operation. The network voltage range values are presented per unit.

Table 5.
IEEE 1547 Voltage ride-through requirement.
6.2.2. Base Case Analysis
During the base case scenario, the synchronous rotor speed of the Hail and Arrar generators, respectively, at buses 1 and 3, as shown in Figure 28, converge to 1.0 p.u. corresponding to a frequency of 60 Hz. Figure 29 shows the voltage response at all buses, indicating that the grid voltages converge to the equilibrium characterized by their nominal per-unit values in the base case. Figure 30 shows the active and reactive power generation at the synchronous generator Hail and Arrar buses and the solar PV generator bus ‘15’ equals 900 MW, 253 MW, and 300 MW, respectively. Therefore, the system is considered in a state of stability and all system variables did not exceed the permissible limits.
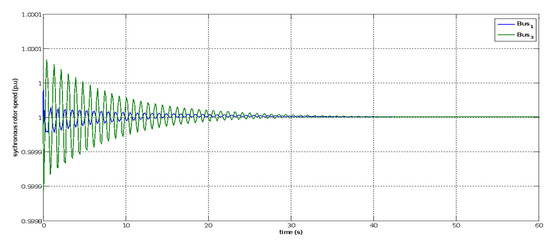
Figure 28.
Response of the rotor angle at synchronous generators power plant at bus 1 and bus 3 during the base case.
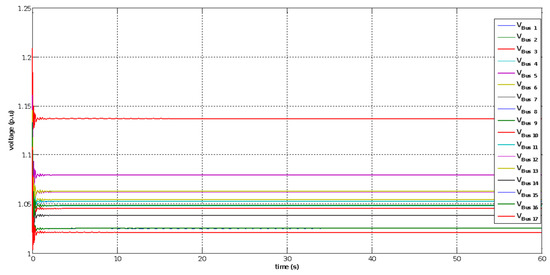
Figure 29.
Voltage variation at all buses during the base case.
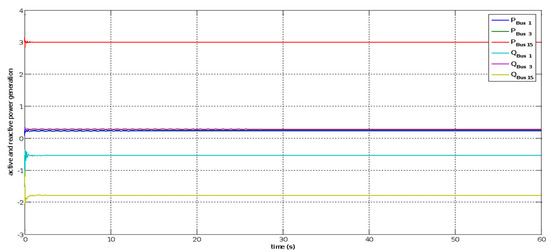
Figure 30.
Generated active and reactive power at buses 1, 3, and 15 during the base case.
6.2.3. Photovoltaic Farms Disconnection
In this scenario, all circuit breakers were opened concurrently at t = 5 s to abruptly disconnect the SPVGP from the network. As demonstrated in Figure 31, the synchronous rotor speed of Hail swing bus 1 and synchronous generator bus 3 Arar rapidly decreased after the disconnection because of PV power loss. Figure 32 shows the active and reactive power generation before and after the photovoltaic farm was disconnected at swing bus 1, generator bus 3, and SPVGP bus 15. Just after the photovoltaic farm was disconnected, an active power generation transient peak of 3.75 p.u. was detected at the swing bus. Later, the transitory was wiped off in a short period. Reactive power at the swing bus was recorded to have a brief transient peak of 3.0 p.u. To withstand the disconnection of the PV plant, the synchronous generator’s turbine governor action was maintained for 10 s. After the power oscillations were dampened, the system was brought back to normal operation. The abrupt and simultaneous disconnections of the SPVGP from the network are shown in Figure 33. Large drops were observed in the overall network voltage profile. Around 25% of the nominal voltage was dropped in the voltage recorded. Regarding the transient stability study under this scenario, the voltage decreased almost to zero near the fault location, which is at the bus with the highest load. Without the connection of the PV power plant, there was a mismatch between generators and loads since the system could not work in regular operation.
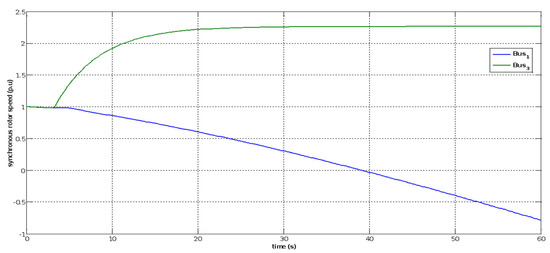
Figure 31.
Rotor speed response of swing bus 1 and at PV bus 3 after disconnection of SPVGP.
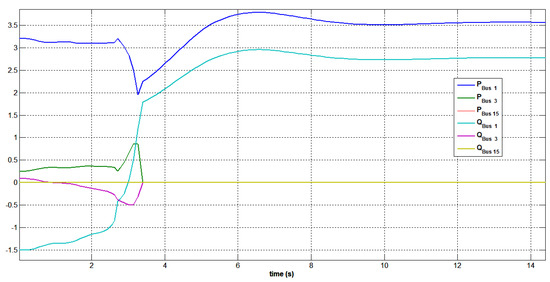
Figure 32.
Active and reactive power at swing generator bus 1, PV bus 3, and the photovoltaic bus 15 after disconnection of SPVGP.
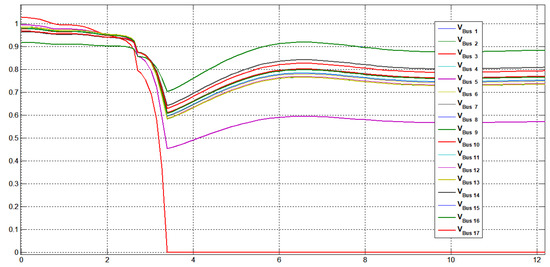
Figure 33.
Variation of voltage at all buses after SPVGP disconnection.
6.2.4. Voltage Dip Fault at Bus 15 without the Connection of SPVGP
The grid without SPVGPs farms was considered for the second test. On the SPVGP bus, a symmetrical three-phase fault was injected to test the network system performance when subjected to faults and transients. The fault was initiated at 10 s, as shown in Figure 34. It created a severe drop in the synchronous speed of the generating system at the swing bus 1 and bus 3 generation stations from 10 s. The voltage profile at the different buses of the system is presented in Figure 35. The obtained voltage variations at the SPVGP bus 15, generator bus 3, and swing bus 1 is shown in Figure 36. A significant voltage drop was observed at the solar bus connection 15, where the fault was injected. A dramatic voltage value of 0 p.u. was recorded at the most loaded bus 3. These variations caused an overall voltage drop in the grid, dropping down to 0.60 p.u., as shown in Figure 35. Figure 37 illustrates the variation in active and reactive power values at the swing bus 1 and generator power plant bus 3. It was observed that both the active and reactive power generation increased, with the active power generation reaching a transitory peak of 4.12 p.u. and reactive power to 2.65 p.u. The changes in the real and reactive power values of SPVGP bus 15 were recorded and shown in Figure 38, where the real power can be seen to have significantly dropped to −1.8 p.u.
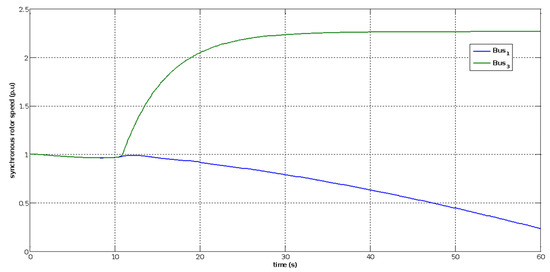
Figure 34.
Synchronous rotor speed response of the swing bus 1 and bus 3 under three-phase short circuit bus 15.
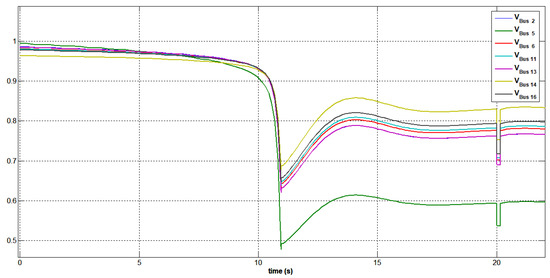
Figure 35.
Voltage variation at buses 2, 5, 6, 11, 13, 14, and 16 under three-phase short circuit bus 15.
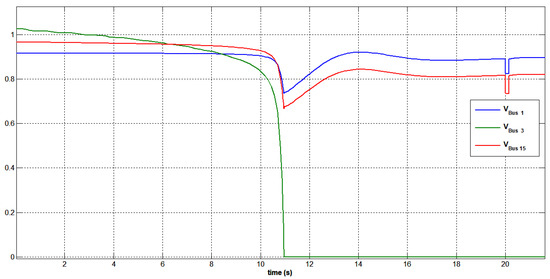
Figure 36.
Voltage variation at buses 1, 3, and 15 under three-phase short circuit bus 15.
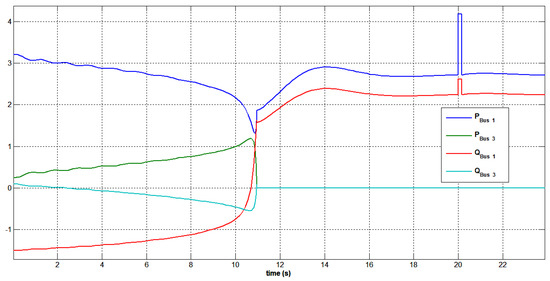
Figure 37.
Generated active and reactive power at buses 1 and 3 under three-phase short circuit bus 15.
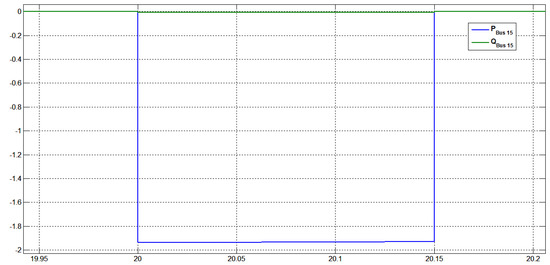
Figure 38.
Generated active and reactive power at bus 15 under a three-phase short circuit bus 15.
6.2.5. Short-Circuit of Network with PV Power Plant
The considered transmission network was simulated for the third test using the SPVGP. In this case, at t = the 20 s, the fault was applied at solar connection bus number 15, and it was observed that the fault was cleared in 150 ms. The behavior of the synchronous generator bus 3 and the swing bus 1 during the fault-ride-through is displayed in Figure 39. A decrease in the generating system’s synchronous speed at swing bus 1 was observed, and the synchronous generator’s synchronous speed at bus 3 dropped to 0.991 p.u.
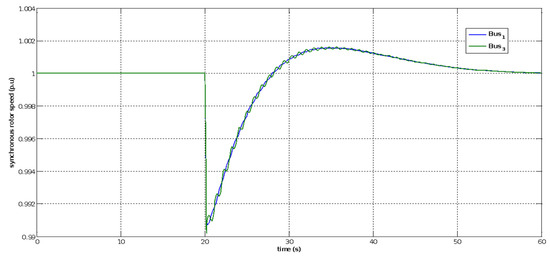
Figure 39.
Rotor speed response of generator at swing bus 1 and bus 3 under a three-phase short circuit at bus 15 without STATCOM.
The voltage at the SPVGP bus lowered to 0.885 p.u. immediately after the problem occurred as shown in Figure 40. These voltages rose throughout the fault ride and overshot to 1.27 p.u. before reaching their rated values. These overshoots occur due to the insufficient capacity of the SPVGP.
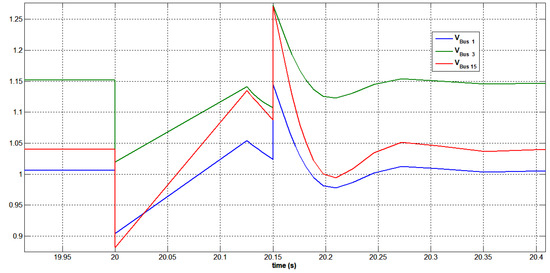
Figure 40.
Voltage variation at buses 1, 3, and 15 under a three-phase short circuit at bus 15 without STATCOM.
The voltage at the terminals of PV and all buses started to achieve their rated levels right away after the problem was fixed at 20.150 s and the SPVGP started to operate in voltage regulation mode. The voltage variations at buses 2, 5, 6, 11, 13, 14, and 16 during and after the three-phase short circuit at the terminal of bus 15 can be observed in Figure 41.
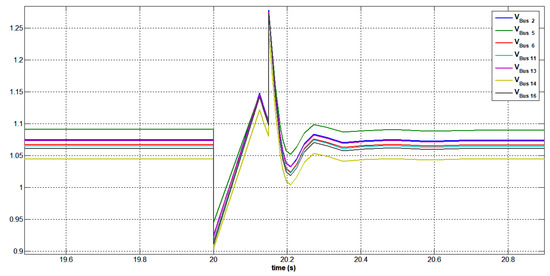
Figure 41.
Voltage variation at buses 2, 5, 6, 11, 13, 14, and 16 after a three-phase short circuit at bus 15 without STATCOM.
For voltage support in the fault duration, active and reactive power compensation was provided by the SPVGP at bus 15. The pattern of active and reactive power production is shown in Figure 42. It was noticed that the SPVGP contributed to achieving a better regulation of network voltage on all buses. According to [19,39,40], voltage regulation at this photovoltaic generator is assured since a simple and continuous controller is equipped. The short circuit depicted in Figure 42 caused a drop in the solar generator’s active power supply during the transient. The findings also demonstrate that the considered power system network is stable.
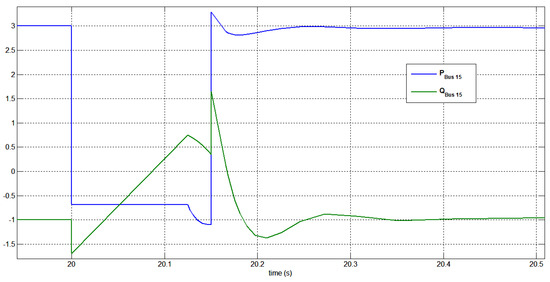
Figure 42.
Generated active and reactive power at bus 15 under a three-phase short circuit at bus 15 without STATCOM.
Figure 43 illustrates the excellent transient stability performance, including instantaneous terminal voltage recovery and reactive and active power compensation, during and post-fault clearance. Simulation results showed that the photovoltaic controllers can restore the PV plant voltage at the terminal after clearing the short-circuit problem.
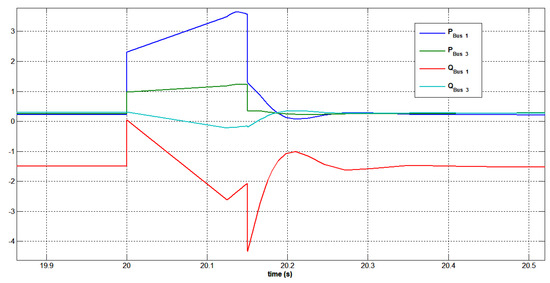
Figure 43.
Generated active and reactive power at buses 1 and 3 under a three-phase short circuit at bus 15 without STATCOM.
6.2.6. STATCOM Simulation with the Transmission Network during Short-Circuit
Figure 44 and Figure 45, respectively, illustrate the voltages at the SPVGP faulty bus 15 using the STATCOM during the short-circuit study. The most heavily loaded bus 3, as well as the SPVGP faulty bus 15, both had their voltage sags managed by the static var compensator. Since this is the STATCOM connection point, the voltage was also raised throughout the entire grid. Immediately after the clearance of faults, due to the STATCOM’s characteristics of dynamic response, STATCOM helped in changing grid voltages without negative consequences.
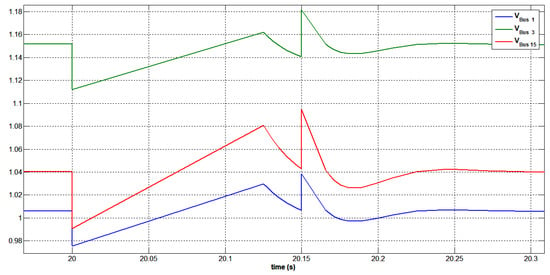
Figure 44.
Voltage variation at buses 1, 3, and 15 under a three-phase short circuit at bus 15 with STATCOM.
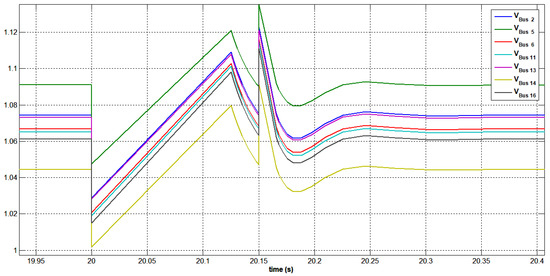
Figure 45.
Voltage variation at buses 2, 5, 6, 11, 13, 14, and 16 under a three-phase short circuit at bus 15 with STATCOM.
The reactive power profile of the swing bus, generator bus 3, SPVPP bus 15, and STATCOM are shown in Figure 46 and Figure 47 for reducing the voltage drop. After the fault was cleared, the supply of reactive power was reduced. The STATCOM consumes active power to maintain a DC stable bus voltage and indicated that the active power decreased as the supply of reactive power increased. It was noticed that the voltage level dropped as approached its nominal value when STATCOM is active.
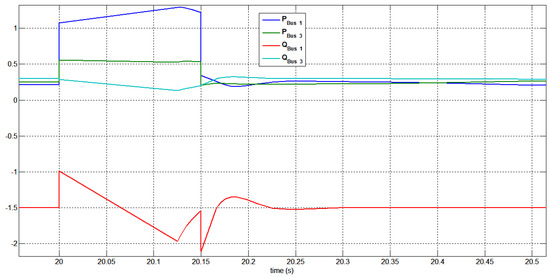
Figure 46.
Generated active and reactive power at buses 1 and 3 under a three-phase short circuit at bus 15 with STATCOM.
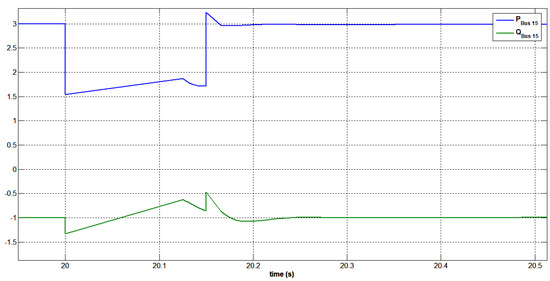
Figure 47.
Generated active and reactive power at bus 15 under a three-phase short circuit at bus 15 with STATCOM.
Figure 48 shows the behavior of the swing bus 1 and synchronous generator bus 3 during the fault-ride through. We observed a drop in the synchronous speed of the generating system at swing bus 1 and the synchronous generator of bus 3 dropped to 0.9965 p.u.
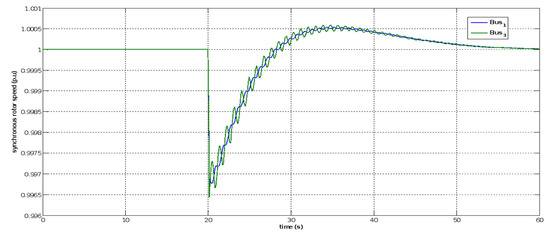
Figure 48.
Rotor speed response of generators at swing bus 1 and bus 3 under a three-phase short circuit at bus 15 with STATCOM.
6.2.7. Network Short Circuit at the Most-Loaded Bus 3
According to a load flow analysis, the power network’s bus 3 “Arar” was selected as the three-phase fault occurrence bus since it displayed a weak static voltage. At time t = 20 s, a three-phase short circuit was applied, and it was cleared in 150 ms. A three-phase fault that occurred at bus 3 resulted in a drop in bus voltage for all the network’s buses, as can be seen in Figure 49. A 15% voltage reduction was noticed at bus 3 ‘Arar’ as a result of the three-phase short circuit. In terms of distance from the faulty load bus 3 “Arar”, the photovoltaic bus 15 was the closest.
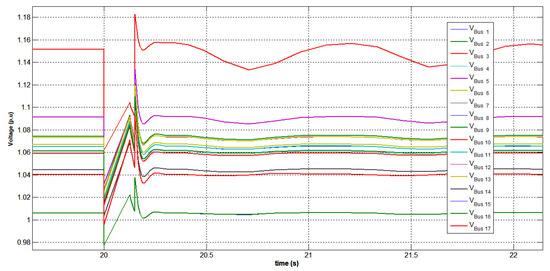
Figure 49.
Voltage variation at all buses under a three-phase short circuit at bus 3 with STATCOM.
It is observed from Figure 50 that a three-phase fault at bus 3 caused the photovoltaic bus to achieve a peak bus voltage of 1.09 p.u. The voltage regulation at the photovoltaic bus was guaranteed as the PV bus was equipped with a swift, continuously functioning controller in accordance with the regulation scheme presented in Figure 51. Figure 51 and Figure 52 show the active and reactive power generation patterns of the photovoltaic bus, swing bus, and Arar bus to deliver voltage compensation during the fault period. Since the photovoltaic bus was physically closest to the faulty bus 3, it is shown that the photovoltaic bus contributed more than the swing bus to maintain the network voltage level in control. During the transient condition of the short circuit, it was observed that there was a decrease in the active power supply of the photovoltaic generator. The network was found to be stable with the compensation provided by the photovoltaic generator. The obtained results also demonstrated complete system stability as seen in Figure 52. Additionally, the power system network performed well during and after fault conditions, with a quick recovery of terminal voltage and active and reactive power. The behavior of the synchronous generator bus 3 and the swing bus 1 during the fault-ride-through is represented in Figure 53.
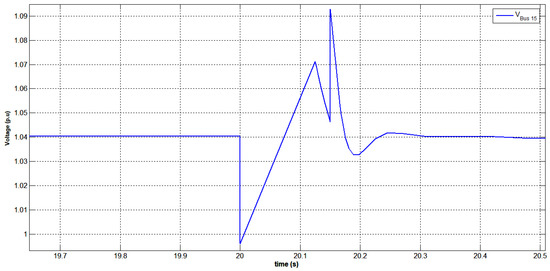
Figure 50.
Voltage variation at bus 15 under a three-phase short circuit at bus 3 with STATCOM.
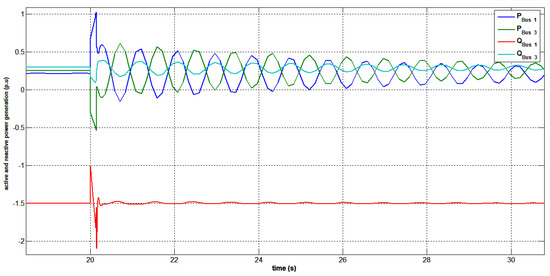
Figure 51.
Generated active and reactive power at buses 1 and 3 under a three-phase short circuit at bus 3 with STATCOM.
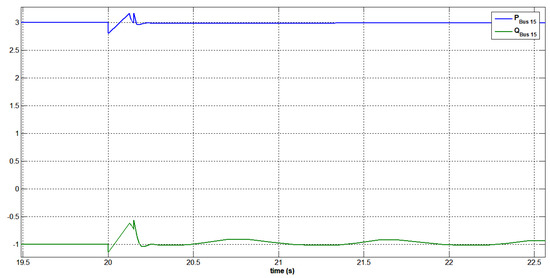
Figure 52.
Generated active and reactive power at bus 15 after a three-phase short circuit at bus 3 with STATCOM.
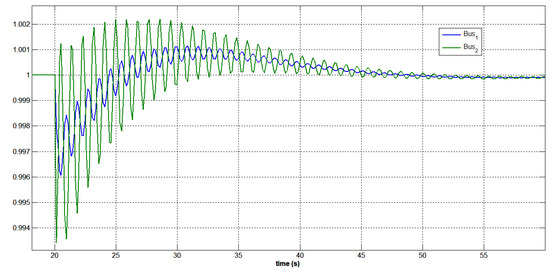
Figure 53.
Rotor speed response of generators at the swing bus 1 and bus 3 under a three-phase short circuit at bus 3 with STATCOM.
All of the system’s variables exhibited changes throughout the disturbance period, which began at 20 s and lasted for 0.150 s. This can be observed in Figure 49, Figure 50, Figure 51, Figure 52 and Figure 53, where it is evident that the voltage fluctuated significantly during the disturbance period (from 20 s to 20.150 s), but that the system quickly returned to a stable state. The stabilized voltage can be observed in Figure 38 and Figure 39 from the time of 20.200 s.
7. Conclusions
This paper presents a comprehensive dynamic voltage stability analysis of the Sakaka PV power plant connected to the Saudi transmission network. The analysis aimed to study the impacts on the grid with and without the PV plant and with and without the STATCOM functionality. The performance evaluation of this analytical study is based on SAGC, which provides the acceptable limit of the system voltage and frequency under different conditions. The observed voltage at different buses is almost in the range of 1.01 to 1.05 p.u. The Eigenvalue locus of the static load flow Jacobian matrix for without and with PV and STATCOM increased from 2.33 to 2.647, resulting in a more stable system. Moreover, the optimal parameters of the PV plant, which were based on real-time measurements of the weather, were selected to be employed in the simulation model. A considerable number of cases were performed with/without the SPVGP plant and with/without the STATCOM. According to SAGC, the results showed that the dynamic voltage stability of the system with the PV plant when the STATCOM was not considered yielded a better performance than that without the SPVGP. When considering the STATCOM, the system voltage dynamic stability had the best performance compared to the other cases. Therefore, the use of STATCOM is highly recommended for boosting the voltage dynamic stability and improving the power quality of the network.
Author Contributions
Methodology, A.S.S., F.A., E.M.A., S.F.A.-G. and S.A.; Software, A.S.S.; Validation, A.S.S. and S.M.I.; Formal analysis, E.M.A.; Investigation, A.S.S.; Resources, A.S.S. and F.A.; Data curation, A.S.S., F.A. and S.M.I.; Writing—original draft, A.S.S. and F.A.; Writing—review & editing, E.M.A., S.F.A.-G., S.M.I. and S.A.; Funding acquisition, S.F.A.-G. All authors have read and agreed to the published version of the manuscript.
Funding
This work was supported by the Deanship of Scientific Research through King Khalid University under Grant RGP.1/223/43.
Data Availability Statement
Data is not available due to privacy and ethical restrictions.
Acknowledgments
The authors would like to acknowledge all the help in providing the data and the contributions of the Saudi Electricity Company.
Conflicts of Interest
The authors declared no potential conflict of interest with respect to the research, authorship, and/or publication of this article.
References
- International Renewable Energy Agency, IRENA. 2022. Available online: https://www.irena.org/ (accessed on 1 July 2022).
- Middle East Economic Survey. Saudi Arabia’s Gas Consumption Flatlines As Oil Burn Rises. Middle East Economic Survey, 9 October 2020. [Google Scholar]
- Solar Resource Maps of Saudi Arabia. Available online: https://solargis.com/maps-and-gis-data/download/saudi-arabia (accessed on 1 July 2022).
- “Renewables 2022: Global Status Report,” Renewable Energy Policy Network for the 21st Century. 2017. Available online: http://www.ren21.net (accessed on 1 July 2022).
- US Energy Information Administration. Country Analysis Executive Summary: Saudi Arabia. Available online: https://www.eia.gov/international/analysis/country/SAU (accessed on 2 December 2021).
- Al Harbi, F.; Csala, D. Saudi Arabia’s Electricity: Energy Supply and Demand Future Challenges. In Proceedings of the 2019 1st Global Power, Energy and Communication Conference (GPECOM), Nevsehir, Turkey, 12–15 June 2019; pp. 467–472. [Google Scholar] [CrossRef]
- Al Ghamdi, A. “Saudi Arabia Energy Report”, 15 December 2020. Available online: https://www.kapsarc.org/file-download.php?i=72975 (accessed on 15 December 2020).
- Saudi Press Agency; Al-Sultan, K.B.S. “Chairman of KACARE: Saudi Arabia Aims to Adopt Electricity Production Using Renewable Energy by 50% in 2030,” 19 January 2021. Available online: https://www.spa.gov.sa/2181891 (accessed on 19 January 2021).
- Gulf Research Center. Saudi Arabia Renewable Energy Industry Outlook. Gulf Research Center Report 2022. Available online: https://www.casci.ch/wp-content/uploads/Saudi-Arabia-Renewable-Energy-Industry-Outlook.pdf (accessed on 19 January 2021).
- Saudi Aramco, Bond Prospectus, 16 November 2020, p. 45. Available online: https://www.aramco.com/en/Investors/Investor-tools/Bond-information (accessed on 19 January 2021).
- Saidi, A.S. Impact of grid-tied photovoltaic systems on voltage stability of Tunisian distribution networks using dynamic reactive power control. Ain Shams Eng. J. 2022, 13, 101537. [Google Scholar] [CrossRef]
- Saidi, A.S. Impact of large photovoltaic power penetration on the voltage regulation and dynamic performance of the Tunisian power system. Energy Explor. Exploit. 2020, 38, 1774–1809. [Google Scholar] [CrossRef]
- Saidi, A.S. Investigation of Structural Voltage Stability in Tunisian Distribution Networks Integrating Large-Scale Solar Photovoltaic Power Plant. Int. J. Bifurc. Chaos 2020, 30, 2050259. [Google Scholar] [CrossRef]
- Saidi, A.S.; Ben Kilani, K.; Elleuch, M. Impact of Large Scale Photovoltaic Generation on Voltage Stability in Distribution Networks. Eur. J. Electr. Eng. 2016, 18, 117–138. [Google Scholar] [CrossRef]
- Sultan, H.M.; Diab, A.A.Z.; Kuznetsov, O.N.; Ali, Z.M.; Abdalla, O. Evaluation of the Impact of High Penetration Levels of PV Power Plants on the Capacity, Frequency and Voltage Stability of Egypt’s Unified Grid. Energies 2019, 12, 552. [Google Scholar] [CrossRef]
- Feilat, E.; Azzam, S.; Al-Salaymeh, A. Impact of large PV and wind power plants on voltage and frequency stability of Jordan’s national grid. Sustain. Cities Soc. 2018, 36, 257–271. [Google Scholar] [CrossRef]
- Pillai, G.; Naser, H.Y. Assessing the technical impact of integrating large scale photovoltaics to the electrical power network of Bahrain. Sustain. Energy Technol. Assess. 2017, 20, 78–87. [Google Scholar]
- Adetokun, B.B.; Muriithi, C.M. Impact of integrating large-scaled fig-based wind energy conversion system on the voltage stability of weak national grids: A case study of the Nigerian power grid. Energy Rep. 2021, 7, 654–666. [Google Scholar] [CrossRef]
- Tamimi, B.; Cañizares, C.; Bhattacharya, K. System stability impact of large-scale and distributed solar photovoltaic generation: The case of Ontario, Canada. IEEE Trans. Sustain. Energy 2013, 4, 680–688. [Google Scholar] [CrossRef]
- Eftekharnejad, S.; Vittal, V.; Heydt, G.T.; Keel, B.; Loehr, J. “Impact of increased penetration of photovoltaic generation on power systems. IEEE Trans. Power Syst. 2013, 28, 893–901. [Google Scholar] [CrossRef]
- Shah, R.; Mithulananthan, N.; Sode-Yome, A.; Lee, K.Y. Impact of large-scale PV penetration on power system oscillatory stability. In Proceedings of the IEEE PES General Meeting 2010, New Orleans, LA, USA, 20–22 April 2010; pp. 1–7. [Google Scholar] [CrossRef]
- Till, J.; You, S.; Liu, Y.; Du, P. Impact of High PV Penetration on Voltage Stability. In Proceedings of the 2020 IEEE/PES Transmission and Distribution Conference and Exposition (T&D), Chicago, IL, USA, 12–15 October 2020; pp. 1–5. [Google Scholar] [CrossRef]
- You, S.; Kou, G.; Liu, Y.; Zhang, X.; Cui, Y.; Till, M.J.; Yao, W.; Liu, Y. Impact of High PV Penetration on the Inter-Area Oscillations in the U.S. Eastern Interconnection. IEEE Access 2017, 5, 4361–4369. [Google Scholar] [CrossRef]
- Tan, J.; Zhang, Y.; You, S.; Liu, Y.; Liu, Y. Frequency Response Study of U.S. Western Interconnection under Extra-High Photovoltaic Generation Penetrations. In Proceedings of the 2018 IEEE Power & Energy Society General Meeting (PESGM), Portland, OR, USA, 5–10 August 2018; pp. 1–5. [Google Scholar] [CrossRef]
- Kawabe, K.; Tanaka, K. Impact of Dynamic Behavior of Photovoltaic Power Generation Systems on Short-Term Voltage Stability. IEEE Trans. Power Syst. 2015, 30, 3416–3424. [Google Scholar] [CrossRef]
- Refaat, S.S.; Abu-Rub, H.; Sanfilippo, A.P.; Mohamed, A. Impact of grid-tied large-scale photovoltaic system on dynamic voltage stability of electric power grids. IET Renew. Power Gener. 2018, 12, 157–164. [Google Scholar] [CrossRef]
- Adetokun, B.B.; Muriithi, C.M.; Ojo, J.O. Voltage stability assessment and enhancement of power grid with increasing wind energy penetration. Int. J. Electr. Power Energy Syst. 2020, 20, 105988. [Google Scholar] [CrossRef]
- Ratra, S.; Tiwari, R.; Niazi, K. Voltage stability assessment in power systems using line voltage stability index. Comput. Electr. Eng. 2018, 70, 199–211. [Google Scholar] [CrossRef]
- Khan, M.M.S.; Arifin, M.S.; Haque, A.; Al-Masood, N. Stability analysis of power system with the penetration of photovoltaic based generation. Int. J. Energy Power Eng. 2013, 2, 84. [Google Scholar] [CrossRef]
- Olowu, T.O.; Sundararajan, A.; Moghaddami, M.; Sarwat, A.I. Future challenges and mitigation methods for high photovoltaic penetration: A survey. Energies 2018, 11, 1782. [Google Scholar] [CrossRef]
- Aleem, S.A.; Hussain, S.M.S.; Ustun, T.S. A review of strategies to increase PV penetration level in smart grids. Energies 2020, 13, 636. [Google Scholar] [CrossRef]
- Rathbun, M.; Xu, Y.; Nejad, R.R.; Qu, Z.; Sun, W. Impact studies and cooperative voltage control for high PV penetration. IFAC-Pap. -Line 2018, 51, 684–689. [Google Scholar] [CrossRef]
- Chaudhary, P.; Rizwan, M. Voltage regulation mitigation techniques in distribution system with high PV penetration: A review. Renew. Sustain. Energy Rev. 2018, 82, 3279–3287. [Google Scholar] [CrossRef]
- Srivastava, A.; Meena, R.; Parida, S.K. Effect of PV and FACTs on small-signal stability. In Proceedings of the 2018 20th National Power Systems Conference (NPSC), Tiruchirappalli, India, 14–16 December 2018; pp. 1–5. [Google Scholar]
- Gandoman, F.H.; Ahmadi, A.; Sharaf, A.M.; Siano, P.; Pou, J.; Hredzak, B.; Agelidis, V.G. Review of facts technologies and applications for power quality in smart grids with renewable energy systems. Renew. Sustain. Energy Rev. 2018, 82, 502–514. [Google Scholar] [CrossRef]
- Hu, J.; Li, Z.; Zhu, J.; Guerrero, J.M. Voltage stabilization: A critical step toward high photovoltaic penetration. IEEE Ind. Electron. Mag. 2019, 13, 17–30. [Google Scholar] [CrossRef]
- Hridya, K.R.; Mini, V.; Visakhan, R.; Kurian, A.A. Comparative study of voltage stability enhancement of a grid and loss reduction using STATCOM and SSSC. In Proceedings of the 2015 International Conference on Power, Instrumentation, Control and Computing (PICC), Thrissur, India, 9–11 December 2015; pp. 1–42. [Google Scholar]
- IEEE PES Industry Technical Support Leadership Committee. Impact of IEEE 1547 Standard on Smart Inverters and the Applications in Power Systems. In Proceedings of the IEEE Power and Energy Society, Washington, DC, USA, 17–20 February 2020. [Google Scholar]
- NERC. Standard Models for Variable Generation. NERC Special Report. Draft. 2010. Available online: http://www.nerc.com (accessed on 18 May 2010).
- Hatziargyriou, N.; Donnelly, M.; Papathanassiou, S.; Lopes, J.A.P.; Takasaki, M.; Chao, H.; Usaola, J.; Lasseter, R.; Efthymiadis, A. CIGRE Technical Brochure on Modeling New Forms of Generation and Storage. CIGRE, TF 38.01.10. 2000. Available online: https://citeseerx.ist.psu.edu/document?repid=rep1&type=pdf&doi=5b817daa0425ad80e91b5d0f17f3988abc62faf7 (accessed on 18 May 2010).
- GE Energy. 2010: Western Wind and Solar Integration Study. NREL/SR-550-47434, 317 pp. 3TIER, 2010: Development of Regional Wind Resource and Wind Plant Output Datasets. NREL/SR-550-47676, 23p. Available online: https://www.nrel.gov/grid/wwsis.html (accessed on 1 July 2022).
- Taylor, C.W.; Balu, N.J.; Maratukulam, D. Power System Voltage Stability; McGraw Hill: New York, NY, USA, 1994. [Google Scholar]
- Ahmed, E.M.; Mohamed, E.A.; Elmelegi, A.; Aly, M.; Elbaksawi, O. Optimum modified fractional order controller for future electric vehicles and renewable energy-based interconnected power systems. IEEE Access 2021, 9, 29993–30010. [Google Scholar] [CrossRef]
- Gandhi, O.; Kumar, D.S.; Rodríguez-Gallegos, C.D.; Srinivasan, D. Review of power system impacts at high PV penetration part I: Factors limiting PV penetration. Sol. Energy 2020, 210, 181–201. [Google Scholar] [CrossRef]
- National Grid SA-Saudi Arabian Grid Code, July 2022. Available online: https://www.se.com.sa/en-us/Pages/SaudiArabianGridCodeGuide.aspx (accessed on 1 July 2022).
- Saidi, A.S.; Ben Slimene, M.; Khlifi, M.A.; Fazle Azeem, M.; Al Ahmadi, S.; Draou, A. Analysis and study of two-dimensional parameter bifurcation of wind power farms and composite loads. Wind Energy 2019, 22, 1243–1259. [Google Scholar] [CrossRef]
- IEEE Task Force. Load representation for dynamic performance analysis. IEEE Trans. Power Syst. 1993, 8, 472–482. [Google Scholar] [CrossRef]
- Milano, F. Power System Analysis Toolbox. Documentation for PSAT Version 2.1.2. 2008. Available online: www.power.unwaterloo.ca (accessed on 26 June 2008).
- Maknouninejad, A.; Qu, Z. Realizing unified microgrid voltage profile and loss minimization: A cooperative distributed optimization and control approach. IEEE Trans. Smart Grid 2014, 5, 1621–1630. [Google Scholar] [CrossRef]
- Dvijotham, K.; Molzahn, D.K. Error bounds on the DC power flow approximation: A convex relaxation approach. In Proceedings of the 55th IEEE Conference on Decision and Control (CDC), Las Vegas, NV, USA, 12–14 December 2016; pp. 2411–2418. [Google Scholar]
- Khan, I.; Bhattacharjee, V.; Nasir, M. Effect of the approximation of voltage angle difference on the OPF algorithms in the power network. Energy Syst. 2020, 11, 471–490. [Google Scholar] [CrossRef]
Disclaimer/Publisher’s Note: The statements, opinions and data contained in all publications are solely those of the individual author(s) and contributor(s) and not of MDPI and/or the editor(s). MDPI and/or the editor(s) disclaim responsibility for any injury to people or property resulting from any ideas, methods, instructions or products referred to in the content. |
© 2023 by the authors. Licensee MDPI, Basel, Switzerland. This article is an open access article distributed under the terms and conditions of the Creative Commons Attribution (CC BY) license (https://creativecommons.org/licenses/by/4.0/).