Abstract
This article presents the influence of the evolution of the oil price on the international markets on the strategies of companies whose main activity is the manufacture of oil equipment for the Romanian oil industry. As a tool for economists and specialists in the oil industry, such a study helps to develop economic strategies and management decisions based on forecasts of oil price developments. Based on statistical data for the annual oil price on international markets and the turnover of the oil companies, an analysis was proposed which showed that the trends in the mathematical models are similar, which highlights that economic activities in the oil sector are sensitive to the evolution of oil price. Management strategies are based on anticipating changes in the corporate environment, assessing the company’s internal potential and making the necessary changes to bring it in line with the economy, its mission, and the objectives set to ensure its survival and continuity. These views make it possible to analyse and forecast oil prices; upward trends will encourage companies to design and develop strategies that include investments to expand production capacity, and downward trends will synergistically lead to downsizing strategies. Variations in company production will generate an economic, social, and environmental impact in the countries where they operate.
1. Introduction
Despite the extended use of renewable energy, oil still plays an essential role in national and international economies, and oil price is an economic indicator with major influences at micro and macroeconomic levels. Oil has dominated the energy market for several centuries, after coal ceased to be a strategic commodity on this market and an essential production factor. The need to use renewable energy, as a result of oil reserve depletion and of the negative effects oil processing has on the environment [1,2,3,4,5], has reduced the importance of this merchandise, but international statistics prove that oil still dominates the energy market and beyond. The importance of oil was well emphasized by Henry Kissinger, the former national security advisor of the USA, “Control oil and you control nations; control food and you control the people”. Considering the concentrated structure of the supply, oil price fluctuations are not only determined by economic factors, with geopolitical conditions being essential [6].
Countries with large reserves of oil and natural gas, such as those in the Persian Gulf or the Caspian Sea, are important players on the international energy market as exporters, with positive effects on the balance of payments and on economic growth. Certain European countries’ lack of oil or natural gas generates their energy dependence on other states such as Russia, which can have political and military effects. Other countries, such as Turkey, have become important players worldwide as a result of their strategic geographical position allowing oil or gas pipelines to pass through. Countries such as China, India, or Pakistan have become important players in the energy market as a result of demand, and any moderation of the economic growth process in these countries affects oil prices internationally. For example, at the international level, China has become the largest oil importer and consumer [7] and many studies have focused on the impact of oil price on the Chinese economy. In fact, most studies targeting the impact of oil prices on national economies or on certain economic indicators have been conducted for developed countries or for countries that have a special status on the international oil market as producers or consumers.
Starting from these considerations, this study focuses on the Romanian economy. The originality and novelty of our study consists in analysing the relationship between oil price evolution and the economic indicators of oil manufacturing companies operating in Romania.
Specialized literature analysis revealed that few studies have been conducted to capture the impact of oil prices on the Romanian economy. In the international scientific literature, the authors identified the study conducted by several Romanian researchers [8] that targeted the impact of oil Brent price changes on industrial production in Romania for the period of January 2008–July 2016. Results show that fluctuations in oil price (increase and decrease) affect industrial production in a different way, meaning that a price increase is felt faster. In addition, Romanian researchers observed a modest impact of the oil price change on fluctuations in the industrial production (less than 30%). Lower oil prices can fuel economic growth, improve the standing of external investments, and ease the burden of foreign public debt.
In other studies, such as the one conducted by Cheng et al., 2018 [9], Romania is part of the group of countries under analysis, namely EU countries, from 1990 to 2015. This study focuses on a complex problem targeting the determinants of carbon intensity for 28 EU countries. This group of countries was chosen because it includes developed countries, as the study focuses on determining carbon intensity; therefore, decisive factors such as economic growth, energy consumption, non-fossil energy use, and crude oil price were considered. The study results suggest an inverted U-shaped curve between crude oil price and carbon intensity. The impact of an increase in crude oil price is different depending on a country’s carbon intensity (low, medium, and high). Drachal’s study (2018) focuses on several countries in Central and Eastern Europe: the Czech Republic, Hungary, Romania, and Serbia [10]. Statistical data are analysed for the period between 2000 and 2015, tracking the relationship between crude spot oil price, exchange rates, and stock prices, using the Granger causality test and the non-linear Diks–Panchenko test. The strongest link between the analysed variables was recorded for the Czech Republic, Hungary, and Romania.
This article aims to materialize into an updated study on the influence of oil prices on emerging industries in general and on companies whose object of activity is the production of oil, petrochemical, and refinery equipment. Both the technical–economic implications and the influence on specific trends in these types of businesses are underlined. In order to better understand what this study intends, Figure 1 presents a graphical summary of the paper with the most important steps in the article.
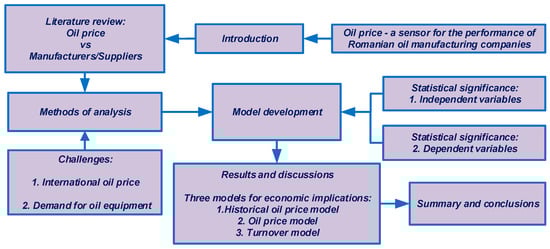
Figure 1.
Graphic abstract of the article (source: authors based on article content).
2. Motivation of the Study
It is critical to assess the influence of oil pricing on the main producers of oil machinery. Doing so helps reveal important developments and gain precious insights into how the industry reacts to changes in oil cost.
Business Planning: Companies in the oil machinery industry can benefit significantly by gaining an insight into the relationship between oil prices and the performance of producers. This knowledge can help them make better, more informed business decisions. For instance, if a company is aware that their revenue is closely connected to oil prices, they can adjust their strategies accordingly, such as modifying the production output or investing more capital depending on the projected price of oil.
Investment Decisions: Investors in companies that manufacture oil equipment should invest time into researching the relation between the cost of oil and the performance of these organisations. Becoming familiar with how changes in oil prices affect a company’s profits and income will help them make wiser investment choices.
Industry Analysis: Investigating the correlation between oil rates and manufacturers of oil machinery can provide beneficial knowledge into the overall state of the petroleum and gas sector. For instance, when prices of oil are low and its related machinery businesses are facing decreased profits, it may be an indication that the industry is in a downturn.
Government Policy: Governments may also be interested in understanding the link between oil prices and oil machinery producers, as this relationship can have an impact on the economy, employment, and the environment. As an example, when the industry is experiencing instability or a downturn, the government may resort to implementing policies to aid its revival. Conversely, when the industry is thriving, it would be wise for the government to make adjustments accordingly.
Environmental Impact: As oil and gas exploration and production activity is a significant contributor to greenhouse gas emissions, understanding the relationship between oil prices and oil machinery producers can also be important for evaluating the environmental impact of the industry and developing policies to mitigate this impact.
As a result, examining the link between oil prices and companies that manufacture oil equipment can provide a range of benefits, such as help with making prudent business choices, assessing the status of the industry, and setting up legal parameters to address both monetary and environmental issues.
3. Literature Review
Oil prices are an important driver of an economy. Oil price and its core drivers have been studied by many researchers [11,12,13,14,15]. Modelling oil price movements is important for policymakers and companies.
Actual fluctuations in oil prices affect households, more precisely the population’s standard of living, but also the activity of companies, which is why the subject is being closely followed by public authorities, considering the consequences of this phenomenon on the inflationary process and economic growth. Analysing the articles published in mainstream media in the last years, there are a variety of studies that focus on the impact of oil price on certain economic aspects such as economic growth, the activity of companies from certain sectors, costs in agriculture, and renewable energy.
The study conducted by Jahangir and Dural (2018) [16] is based on data for the period 1997 to 2015 and follows the relationship between crude oil, natural gas, and GDP for the Caspian countries (Azerbaijan, Iran, Kazakhstan, Russia, and Turkmenistan). The results of the econometric analysis show the robust impact of crude oil and natural gas on economic growth in the case of these countries. Other studies such as Aigheyisi (2018) analysed the impact of oil price fluctuations on the Nigerian economy for the period 1970 to 2015, and the author draws attention to this country’s economic dependence on the exploitation and export of a single product—oil—to the detriment of a harmonious and balanced development of an oil national economy [17]. The result of the research, namely the positive and significant relationship between oil price volatility and real GDP volatility in the short run, should be an alarm signal for authorities in this country, in order to intensify the diversification of economic activities and exports.
The activity of oil refineries is affected by oil price volatility due to cost uncertainty and implicitly of profit as a result of reducing the spread between the price of raw materials and that of the finished products. The article published by Łamasz et al. (2018) offers hedging solutions for these companies, namely short butterfly spread, long strip, and long strap based on European call and put options [18]. The authors, however, draw attention to a very important aspect, namely the existence of oil reserves in conflict areas, correlated with the increase in demand, which will generate fluctuations in oil price. Moreover, this price will be modelled by geopolitical factors and the decisions of the OPEC cartel and Russia.
The impact of oil price movement on the profitability of oil and gas companies in the United Kingdom (UK) was the object of a study by Romanian researchers for the period 2006 to 2014. Vătavu et al., 2018, conducted the study, taking into account the volatility specific to the oil and gas industry and the succession of boom-and-boost cycles for companies in this field, with major effects on the investment process and specialized personnel [19]. The authors of this study chose the UK as it is the most important producer of crude oil in the EU (followed by Denmark, Italy, and Romania). Oil price variations have also made their mark on the financial results of these companies, but their return on investment is a big reason why the oil and gas sector is an essential pillar of the UK economy, which ensures considerable revenue to the public budget.
The study conducted by Abdel-Latif et al., 2018, targets the impact of oil price shocks on government expenditures for Saudi Arabia [6]. The statistical data used in the study targeted the period 1990 to 2017 for the health and education sectors, and the authors based the research on a non-linear autoregressive distributed lag (NARDL) model. The problem is particularly important especially for the oil-exporting countries which have to implement various measures to reduce the dependence on oil export revenues, considering the transition to the bioeconomy.
The activity of logistics service providers (LSP companies) is affected by oil volatility. Hofmann et al. (2018) [20] focus on the relationship between oil price and the financial performance of different types of LSP, performing a cluster analysis for the period 2004 to 2014. The study is based on vector autoregressive models (VAR) and structure vector autoregressive models (SVAR); the results show a difference in the response of air, maritime, road, or rail transport companies towards petrol price fluctuations. The increased costs of transport companies have chain effects, not only on industrial companies but also on domestic and international tourism.
The price of agricultural products is influenced by the price of oil as a result of changes in production and transport costs. Given the importance of oil and agricultural products in the economy, some researchers have focused their activity on this subject [21,22,23], considering the expansion of the use of biofuels as alternatives to the classic fuels, which generates a pressure on the agricultural products market with implications even on food safety [24,25,26,27,28]. Shrestha et al. (2019) conducted a study using a global regression analysis based on Global Food Price Index (FPI) variables, world population, per capita production of cereal and oil crops, ethanol and biodiesel production, inflation rate, and Brent crude oil price for the period 1973 to 2016 [29]. The results of the study demonstrated the overwhelming impact that oil price has on the volatility of food price. Other studies have analysed the relationship between the two price categories in the context of biofuel use and demonstrated the importance of a direct biofuel transmission mechanism [30].
Many researchers have examined the impact of oil prices on renewable energy, with conclusive results implying that renewable energy is considered to be a replacement for fossil-fuel-based energy [31,32,33,34]. As the price of oil rises, so will the incentives to switch to renewable energy.
A more advanced analysis on the influence of oil price is performed using the copula methodology. An extensive review of this method and its applications was conducted by Bhatti and Do (2019) with an emphasis towards energy, forestry, and environmental sciences. Copulas can be applied to examine co-movement between two or more inter-connected variables of interest in a range of research areas from business, economics, and finance to energy, environment, and forestry [35] In a variety of studies, copulas are used to investigate the dependence structures of oil price and other economic factors [36,37,38,39].
Taking into consideration the stock market’s role as a barometer of economic activity, many studies have focused on the link between oil price and stock markets. For example, there have been several studies that focused on the Chinese stock market because of the importance of these countries as importers and consumers at the international level, and because of the size of the Chinese stock market (the second market in terms of capitalization and trading volume). In research conducted for the period 2001 to 2015, certain Chinese specialists prove that the relation between oil price shocks and Chinese stock market returns is complex and depends on the oil status and the stock market state (bust or boom), as well as on the cause of the shock (supply or demand) [40].
Based on the data from the Web of Science source, the most relevant scientific publications were analysed whose object of study was close to the one of this paper.
Therefore, the content of 131 highly cited articles on the Web of Science platform related to this topic was analysed to highlight the structure of the scientific field, using content analysis that inspects the most common keywords and the relationship between these keywords. The empirical analysis showed that the most frequently used words in the full content of the selected articles are those shown in Figure 2 and Figure 3 and include “crude oil price”, “oil industry”, “international market”, “energy”, and “transition”.

Figure 2.
Common words in scientific publications (Source: authors based on WoS’s articles analysed).

Figure 3.
International network scientific publications’ content with references to the subject of this paper (Source: authors based on WoS´s articles analysed).
4. Materials and Methods
The main aim of this study is to search for a connection between oil price internationally and the demand for oil equipment in the case of the Romanian economy. For the purpose of this endeavour, the usual methods of trying to see how independent variables influence the dependent variable and if they have statistical significance have not been used. Instead, using the historical price of oil, a model has been developed that best fits the trend, and based on that model, a subsequent one has been developed for the turnover of the sampled Romanian companies. An analysis of the oil price has been conducted to see both the historical and most recent issues regarding its evolution and prediction models. The problems of futures price have been underlined along with the influence of the wrong estimates of oil price.
After analysing the oil price, a model has been developed based on the annual data of the Europe Brent Spot Price FOB (USD per Barrel) extracted from US Energy Information Association between 1987 and April 2022. Brent oil price has been used because it is the most relevant internationally, as a large share of international types of oil are evaluated via the pricing system that uses the Brent oil price.
The focus of the study is to provide a forecast tool meant to estimate the turnover of companies that provide equipment for the oil industry. As the oil price has an important influence on the production volume of oil industry actors, their investment decisions subsequently affect the turnover of equipment producers. Therefore, by using a model such as the one used in forecasting oil prices, those companies could obtain a better forecast of their own turnover.
The data have been gathered from companies’ balance sheets for the period between 2008 and 2018. A sample of companies has been selected based on the following criteria:
- NACE Rev 2Code:2892—Manufacture of machinery for mining, quarrying, and construction
- Turnover for 2018: 5 million EUR or more
- Country: Romania
The sample resulted from applying these criteria consisted of 9 companies out of 69 that use this NACE code in 2018. The turnover of these companies in 2018 accounted for 376.3 million EUR out of 410.5 million EUR, the total turnover for this NACE code, representing 92% of the total. Additionally, the authors took a sample from the oil price for the same period as that used to analyse the companies, in order to make relevant discussions on the subject of oil price influence on the turnover of oil equipment providers.
5. Results and Discussions
The importance of oil price for many categories of economic agents is also demonstrated by tracking the price of this commodity on the futures market. The futures price of oil is not only important for speculators and hedges that operate on the derivatives market in order to obtain profit or reduce risks, but also for companies in different fields that see oil as a reference commodity whose futures price is a fundamental variable, and its evolution influences their long-term financial situation.
An increase in the appetite for risk and the intensification of financial innovation on the commodity derivatives market through financialization has also generated, in the case of oil, a decoupling between the real economy and the symbolic economy, in that the market transactions do not only reflect the intentions of the petroleum products’ producers and consumers, but also those of speculators; oil is no longer seen as a real commodity but as an asset for speculation [41,42]. Moreover, there are specialists, such as Luo et al. (2019) [43], who consider oil a financial asset and an additional investment instrument used to diversify the portfolio and reduce the risk.
The evolution of futures prices for crude oil on international markets, shown in Figure 1, suggests that participants in the oil and gas industry can expect a gradual fall in prices over time. Figure 4 shows the crude oil (Brent and WTI) prices at which buyers and sellers on international markets have agreed to buy/sell oil at some point in the near future. These are the so-called futures contracts; they reflect the expectations of market participants. From the supply and demand game, buyers and sellers have now agreed on the trading price of oil in the coming period. Therefore, with some clarifications presented in the graph, one can assume that futures prices largely reflect the expectations of the oil industry entrepreneurs as compared to future oil prices. These expectations may not materialize, but they are probably the best forecasts available immediately. They outline the knowledge of buyers and sellers who are trying very hard to stay up to date with oil prices. The problem of estimating oil price becomes very important in the case of national economies that are dependent on imported oil, such as China’s. For such countries, the correct estimation of the oil price generates market opportunities and reduces the risk [44].

Figure 4.
Brent spot price average quarterly (source: https://www.worldoil.com/news/2018/9/13/eia-tighter-crude-oil-markets-contribute-to-higher-forecast-prices accessed on 12 November 2022).
Futures prices cover, in addition to the expected price of oil, the risk premium and the so-called convenience yield (performance) [45,46]:
where: FPO—Future price of oil;
FPO = EPO + PR + CP
EPO—Expected price of oil;
RP—Risk premium;
CP—Convenience yield (performance).
The risk premium value represents buyers’ and sellers’ desire to avoid any uncertainties about the price at which they can buy or sell oil in the immediate period ahead. To reduce uncertainty, buyers may be willing to pay more than what they estimate would actually be the future price of oil. Similarly, in order to secure a market for their oil, sellers may be willing to accept a value lower than the estimated oil price for the coming period. Depending on which part of the market is feeling a greater need for insurance, the risk premium could be positive or negative. Additionally, this risk premium may vary over time as market conditions change.
The value of the convenience yield reflects the desire of oil refineries to have sufficient stocks of oil so that they rely on a constant production process that responds to the requirements of their beneficiaries. Maintaining an optimal stock of crude oil requires managerial decisions regarding the purchase of crude oil at the current time and a careful planning for future purchases. The current demand and supply for oil, as well as the forecast of future supply and demand, are slightly affected. Convenience yields will change as market conditions change.
One can neither directly observe the values of the risk premium or the convenience yield nor the probability of changes over time. Therefore, the future price of oil will not have the same value as the expected price of oil. However, despite these risky assumptions, the futures oil price seems to be as good (or as bad) as that of a predictor of oil prices (for example, surveys by forecasting experts and fundamental models based on the macroeconomic data). Data on futures prices have the advantage that these are transparent and can be updated in real time as the market incorporates new information about the oil market and the global economy. However, the best solution would be to analyse and forecast the data processing, resulting in an estimate, based on information on future situations, in parallel with a real-time update of the fundamentals influencing supply and demand on the oil market. To do this, one can consult all sources of information and news for oil and fuel prices.
Longer term, there is no estimate of high growth possibilities for oil price. Due to the demographic growth and implicitly to the diversification of the use range, there is an increasing demand for petroleum products in emerging markets. The demand for petroleum products in developed countries is constantly decreasing, due to the increasingly harsh environmental standards and the extensive use of electric vehicles. Additionally, it can be estimated that demand in emerging markets would rather decrease, due to the fact that cleaner technologies are becoming cheaper and more accessible. Therefore, the World Energy Council forecasts a medium-term increase in world oil consumption. Moreover, it is estimated that the current proven oil reserves worldwide will last until 2050, with new deposits continuously identified. In other words, there seems to be a large amount of crude oil available for many years after the consumption of this resource begins to decline. Of course, it does matter if the low-cost reserves run out first, but in general, these dynamics do not suggest a sharp increase in prices.
These assumptions may not be sufficient to influence the drop in oil prices relative to their current levels, as revenues are rising globally and, to date, this generates additional oil demand. However, specialists in the field have set an upward threshold on crude oil prices. There may yet be occasional peaks due to supply interruptions, but these will be temporary. As economic growth around the world is rising, oil prices may rise on a more sustained basis, but probably no more than USD 60–80 per barrel over the next few years.
Taking into account the global context and the assumptions presented above, a similar analysis of the evolution of oil price on the European continent can be made. The following shows a graph (see Figure 5) for the oil price variation with the data registered annually as the European average.
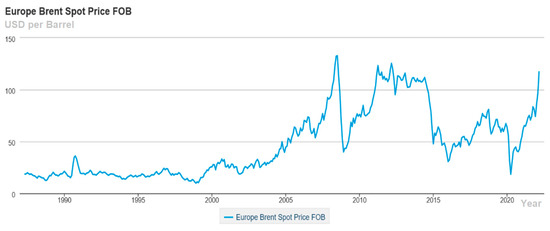
Figure 5.
Europe Brent Spot Price—Freight On Board—FOB (USD per Barrel/Year) (source: https://www.eia.gov/dnav/pet/hist/LeafHandler.ashx?n=PET&s=RBRTE&f=M (accessed on 12 November 2022).
Starting from the variation of oil price globally, and at European level, respectively, we propose a forecast variant based on statistical calculations, calculation that allows to identify a function that will model this variation with an as small as possible margin of error.
The mathematical model uses an econometric analysis of data from stock market price changes of oil over time.
In terms of data structuring, we can have:
- Cross-sectional (distribution) series in which each of the observations corresponds to a unit.
- Time series in which each of the observations corresponds to a specific point in time. Usually, the time points are taken at equal intervals (in this case annual values).
- Two-dimensional panel structure comprising data sets that vary one-dimensionally in time and have an individual dimension. Each observation (Yit) corresponds to a given unit i, i = 1, …, N, at a given time t, t = 1, …, Ti, where N is the number of units recorded and Ti is the number of records over time made for unit i.
If T = 1, the panel is reduced to a cross-sectional series {Yi} with N records, and if N = 1, we obtain a time series {Yt} with T records.
Time-series analysis allows the study of the evolution of the relationships between variables over time, without taking into account the individual characteristics of the elements that determine these evolutions (example: the annual USD prices for a barrel of oil—Table 1). Cross-sectional data analysis studies the effect of individual diversity, but does not take into account the dynamic behaviour of entities. The advantages of using panel-structured data are:

Table 1.
Statistical data used for this model.
- The possibility to analyse individual dynamics and effects generated by the order of events over time (separate and/or time-dependent individual specific effects).
- The control of the heterogeneity induced by time-invariant variables, or in cross-sectional structures, regardless of whether those variables are observable or not (latent).
- Examining the dynamics of adjustments and conducting more complex studies of some behaviours.
- The number of observations, hence the increase in the degrees of freedom, leading to increased test power, consistency, and efficiency of estimators and reduced collinearity between variables. Additionally, the distortion induced by the aggregation of activities, companies, or individuals is reduced or eliminated.
The justification for the choice of this regression model for the next two case studies is based on the nature of the two data series and the link between them (year vs oil price and oil price vs profit/loss) which also gave the meaning of the research. Some common considerations include:
- Type of the dependent variable: The type of the dependent variable (e.g., continuous, binary, ordinal) will influence the choice of the regression model.
- Linearity of the relationship: The linearity of the relationship between the independent and dependent variables should be assessed. If the relationship is linear, a linear regression model can be used; otherwise, a non-linear regression model may be more appropriate.
- Number of independent variables: If there are multiple independent variables, the choice of the regression model may depend on the presence of interaction terms, multicollinearity, and the need to control for confounding.
- Distribution of the error terms: The distribution of the error terms should be assessed to ensure that it is approximately normal and homoscedastic.
- Model fit: The fit of the regression model should be evaluated using statistical tests (e.g., R-squared, adjusted R-squared, AIC, BIC, etc.) and/or residual plots to ensure that the model is a good fit for the data.
- Predictive ability: The ability of the model to make accurate predictions should be evaluated using cross-validation and/or hold-out sample tests.
Taking into account these factors, an informed and correct choice could be made regarding the two regression models as the closest for the data and the proposed analyses.
In addition, other factors such as sample size, presence of outliers, and computational considerations may also influence the choice of regression model. From the statistical calculations using least squares regression and Table curves V.0.1 (free software) resulted the mathematical model in relation 1 with the values specified below (Table 2, Table 3 and Table 4).
Table 2.
Values of the coefficients of the mathematical model as a result of the regression for the considered data set.
Table 3.
Mathematical model coefficients values for a 99% confidence interval of the function.
Table 4.
The variance analysis.
Model definition:
where: Y—the endogenous (explained) variable,
Y = 1/(a + b·x + c·x2).
a, b, c—model coefficients,
x—explanatory variables,
Table 2 features the values of mathematical model coefficients, standard error, the t-ratio of the departure of the estimated value of a parameter from its hypothesized value to its standard error, and t-ratio distribution probabilities.
Table 3 shows the values of the coefficients of the mathematical model for a 99% confidence interval of the function and also the range of variation.
There are many different ways of estimating econometric models, which take different approaches to assessing the evidence that the observed differences between group means are “real”. In the case of the resulting mathematical model, analysis of variance was performed using the ANOVA F-test statistic, which provides a method of aggregating differences between the means of two or more groups and testing our null hypothesis of no differences between means versus alternative.
Taking into account the above, Table 4 shows the results of the analysis of variance using the ANOVA F-test. The number of degrees of freedom, the sum of squares, the mean of the sum of squares, the value of the F-statistic, and the likelihood of the estimation function are summarized for the model coefficients.
Additionally, as can be seen in Figure 6, there is the oil price variation on the European market and the function that models this variation, superimposed over these real values [45,46].

Figure 6.
Model definition graph: Y = 1/(a + b·x + c·x2).
As can be seen, the identified model has a 99% confidence; this shows that it can be used for a short- or medium-term forecast regarding the oil price evolution on the European market.
Regression results provide insight into the relationships with variation of the oil price, such as the strength, direction, and shape of the relationship, as well as the contribution of each predictor to the outcome. Regression can also help make predictions based on the relationships identified in the model.
In what follows, we propose to conduct some studies on oil price’s impact on the manufacturing and services industry in the field of oil exploitation, extraction, and transport.
During the analysed period, the cumulative turnover of the companies showed an ascending trend with a growth of 71% from 1.2 million RON in 2019 to 2 million RON in 2020 (Figure 7) [47,48,49]. Before further discussions regarding this evolution, a comment must be acknowledged, that the main part of the turnover presented in the sample is attributed to Cameron Romania, which holds 53% of the sample.

Figure 7.
Profit/loss vs turnover (Source: authors based on historical data).
Using the same reasoning and methodology presented in the previous sub-chapter, mathematical models and regression function results similar to those already presented are obtained for the turnover and profit rates of companies doing business in oil-related areas.
Starting from the same type of model and using the companies’ turnover, a similar model with different parameters has been developed.
As can be seen, for the same model, we can register the following results for the turnover of the Romanian petroleum companies (see Table 5).
Table 5.
Statistical data used for this model.
On the basis of the mathematical model presented in the previous chapter, an analysis is made based on available data, for a period of 13 years, regarding the application of the function identified for the turnover and the annual change in the price of a barrel of oil.
The results obtained by applying the model to annual turnover figures are summarized in Table 6, Table 7 and Table 8 and Figure 8.
Table 6.
Values of the coefficients of the mathematical model as a result of the regression for the considered data set.
Table 7.
Values of the coefficients of the mathematical model for a 99% confidence interval of the function.
Table 8.
The variance analysis.

Figure 8.
Model definition graph: Y = 1/(a + b·x + c·x2).
Additionally, as can be seen in Figure 8, there is the oil price variation on the European market and the function that models this variation superimposed over these real values (Neacsa et al., 2008).
The results obtained by applying the same model to the annual values of the annual price per barrel of oil for the same 13-year period are summarized in Table 9, Table 10 and Table 11 and Figure 9.
Table 9.
Values of the coefficients of the mathematical model as a result of the regression for the considered data set.
Table 10.
Values of the coefficients of the mathematical model for a 99% confidence interval of the function.
Table 11.
The variance analysis.

Figure 9.
Model Definition graph: Y = 1/(a + b·x + c·x2).
Additionally, as can be seen in Figure 9, there is the oil price variation on the European market over the last 11 years and the function that models this variation superimposed over these real values.
Applying regressions using the same mathematical model to the two sets of statistical data shows that the trends in the two graphical representations are similar, which underlines the fact that the change in the price of a barrel of oil influences the activity of oil companies. As the analysis of the two graphs shows, if the price of a barrel of oil is increasing on the international markets, oil companies increase their production activities, increasing their turnover and profits; otherwise, they record a decrease in turnover and financial losses.
Regression results provide insight into the relationships between variables, year, oil price, profit/loss, and turnover, such as the strength, direction, and shape of the relationship, as well as the contribution of each predictor to the outcome. Regression can also help make predictions based on the relationships identified in the model.
The oil equipment providers sector has always been indirectly influenced by the oil price, as oil producers upstream and downstream accelerate and reduce the production of oil and oil products in correlation with the oil price. Even though there is a lag between the moment the oil price shifts, the producer’s decisions, and the influence on equipment providers, which we intend to explore in future research, the quicker the information reaches the management, the more suitable its decisions are.
Since there are so many variables that can influence this relationship, including changes in oil production technology, governmental policies and regulations, and global economic conditions, it is extremely hard to create a single equation that fully captures the relationship between oil prices and oil machinery producers.
As a future direction of research, the team intends to continue the study by expanding the study globally and exploring new methods and adding new variables that may prove significant in order to produce and refine new equations for a deeper understanding of the relation between oil price and oil machinery production companies.
6. Conclusions
Oil prices can have a significant effect on the financial performance of oil machinery manufacturers. When the value of crude oil is high, exploration and production activities increase, which leads to a higher need for drilling and production equipment. High oil prices correlate to an increase in exploration and production activity, thus increasing the demand for oil drilling and production equipment. This consequently boosts sales revenue of machinery producers. On the other hand, when oil prices are low, exploration and production activity declines alongside a reduction in demand for drilling production equipment, leading to decreased sales and earnings for machinery producers. Besides that, oil equipment manufacturers may also experience the effect of changes in oil extraction technologies, which could potentially shift the demand for their machinery.
Despite the increase in the share of renewable energy in population and industrial consumption, oil still plays an important role on the energy market and in the international economy, and the price of oil affects the activity of the people, public institutions, and companies. Moreover, its trading on the stock market has generated a financial metamorphosis, meaning that oil is considered a financial asset in the sense that portfolio investors acquire different positions on the derivatives market in order to diversify portfolios and reduce risks.
Most of the studies link the performance of oil and gas producers to oil price [50,51,52]. The novelty of this research resides in analysing the connection between the oil equipment providers’ sector and the price of oil for the Romanian economy. This model aims to be a tool used in combination with other analyses to determine a possible evolution of a company’s turnover. Other aspects also need to be addressed when analysing the relation between oil machinery producers and oil price. Price volatility makes it difficult for producers to plan effectively. Government policies and regulations may influence the demand for oil machinery. Renewable energy sources may decrease the demand for oil machinery. Geopolitical tensions and conflicts may/are impacting the oil price. The shift in consumer preferences towards sustainable products may impact the oil machinery producers. The oil machinery producers may benefit from the adoption of fracking and horizontal drilling that increases the demand for oil machinery.
As can be seen, the trends in the two regressions are similar, which highlights that the general pattern of change or relationship between the independent and dependent variables is comparable. This helps us to conclude that the underlying relationships between the variables considered and analysed may be similar or related in some way. However, it is important to note that the mere similarity of trends does not mean that the two regressions are identical or that their coefficients or specific predictions are identical. Further analysis and interpretation may be needed to draw more concrete conclusions.
From the analysis of the two graphs of the regression models, it can be stated that there is a correlation between oil price and profit/loss of oil companies from Romania. In general, when oil prices are high, oil companies tend to make higher profits, while low oil prices lead to lower profits or even losses. This is highlighted by the fact that the costs of extracting, refining, and selling oil are largely constant, so a fall in oil prices directly affects the profit margins of oil companies and, therefore, their oil investments. However, it is important to note that there are other factors, such as operational efficiency and geopolitical events, which can also have a major impact on the profitability of oil companies.
From what has been presented in this article, it can be concluded that the oil equipment manufacturing industry in Romania is influenced by oil price variation in several ways. As previously stated, when oil prices are high, it can be seen on the graphs that there is an increase in demand for oil exploration and production equipment. This leads to an increase in demand for equipment manufactured by the oil equipment industry in Romania. Conversely, when oil prices are low, there is usually a decrease in demand for oil exploration and production equipment, which leads to a decrease in demand for equipment manufactured by this industry. Fluctuations in oil prices can also affect the profitability of companies within the industry, which can in turn affect their ability to invest in research and development and their ability to create new jobs.
Author Contributions
Conceptualization, A.N., O.M., J.D.M., M.C.V. and M.V.I.; methodology, A.N. and O.M.; software, A.N.; validation, A.N., O.M., J.D.M. and M.C.V.; formal analysis, J.D.M. and M.C.V.; investigation, A.N., O.M., J.D.M. and M.C.V.; resources, A.N., O.M., J.D.M., M.V.I. and M.C.V.; data curation, A.N., O.M., J.D.M., M.C.V. and M.V.I.; writing—original draft preparation, A.N.; writing—review and editing, A.N., J.D.M., M.C.V., O.M. and M.V.I.; visualization, J.D.M. and M.C.V.; supervision, J.D.M. and A.N.; project administration, A.N.; funding acquisition, O.M. All authors have read and agreed to the published version of the manuscript.
Funding
This research received no external funding.
Data Availability Statement
Not applicable.
Conflicts of Interest
The authors declare no conflict of interest.
References
- Dusmanescu, D.; Andrei, J.; Subic, J. Scenario for implementation of renewable energy sources in Romania. Procedia Econ. Financ. 2014, 8, 300–305. [Google Scholar] [CrossRef]
- Nica, E.; Manole, C.; Potcovaru, A.M. Environmentally sustainable economic growth, energy use, and CO2 emissions in China. Econ. Manag. Financ. Mark. 2016, 11, 101. [Google Scholar]
- Andrei, J.V.; Mieila, M.; Panait, M. The impact and determinants of the energy paradigm on economic growth in European Union. PLoS ONE 2017, 12, e0173282. [Google Scholar] [CrossRef]
- Armeanu, D.; Vintilă, G.; Andrei, J.V.; Gherghina, Ş.C.; Drăgoi, M.C.; Teodor, C. Exploring the link between environmental pollution and economic growth in EU-28 countries: Is there an environmental Kuznets curve? PLoS ONE 2018, 13, e0195708. [Google Scholar] [CrossRef] [PubMed]
- Popescu, G.H.; Mieila, M.; Nica, E.; Andrei, J.V. The emergence of the effects and determinants of the energy paradigm changes on European Union economy. Renew. Sustain. Energy Rev. 2018, 81, 768–774. [Google Scholar] [CrossRef]
- Abdel-Latif, H.; Osman, R.A.; Ahmed, H. Asymmetric impacts of oil price shocks on government expenditures: Evidence from Saudi Arabia. Cogent Econ. Financ. 2018, 6, 1512835. [Google Scholar] [CrossRef]
- Zhu, H.; Su, X.; Guo, Y.; Ren, Y. The Asymmetric Effects of Oil Price Shocks on the Chinese stock market: Evidence from a quantile impulse response perspective. Sustainability 2016, 8, 766. [Google Scholar] [CrossRef]
- Dudian, M.; Mosora, M.; Mosora, C.; Birova, S. Oil Price and Economic Resilience. Romania’s Case. Sustainability 2017, 9, 273. [Google Scholar] [CrossRef]
- Cheng, C.; Ren, X.; Wang, Z.; Shi, Y. The impacts of non-fossil energy, economic growth, energy consumption, and oil price on carbon intensity: Evidence from a panel quantile regression analysis of EU 28. Sustainability 2018, 10, 4067. [Google Scholar] [CrossRef]
- Drachal, K. Exchange rate and oil price interactions in selected CEE countries. Economies 2018, 6, 31. [Google Scholar] [CrossRef]
- Sadorsky, P. The oil price exposure of global oil companies. Appl. Financ. Econ. Lett. 2008, 4, 93–96. [Google Scholar] [CrossRef]
- Stevens, P. International Oil Companies. The Death of the Old Business Model; Chatam House: London, UK, 2016. [Google Scholar]
- Byrne, J.P.; Lorusso, M.; Xu, B. Oil prices, fundamentals and expectations. Energy Econ. 2019, 79, 59–75. [Google Scholar] [CrossRef]
- Niyazbekova, S.U.; Ivanova, O.S.; Suleimenova, B.; Yerzhanova, S.K.; Berstembayeva, R.K. Oil and Gas Investment Opportunities for Companies in Modern Conditions. In Socio-Economic Systems: Paradigms for the Future; Springer: Cham, Switzerland, 2021; pp. 669–676. [Google Scholar]
- Sanchez-Robles, B.; Herrador-Alcaide, T.C.; Hernández-Solís, M. Efficiency of European oil companies: An empirical analysis. Energy Effic. 2022, 15, 63. [Google Scholar] [CrossRef]
- Jahangir, S.R.; Dural, B.Y. Crude oil, natural gas, and economic growth: Impact and causality analysis in Caspian Sea region. Int. J. Manag. Econ. 2018, 54, 169–184. [Google Scholar] [CrossRef]
- Aigheyisi, O.S. Oil Price Volatility and Business Cycles in Nigeria. Stud. Bus. Econ. 2018, 13, 31–40. [Google Scholar] [CrossRef]
- Łamasz, B.; Iwaszczuk, N.; Ivashchuk, O. Selected methods of securing the refining sector against crude oil price fluctuations. Int. J. Manag. Econ. 2018, 54, 197–209. [Google Scholar] [CrossRef]
- Vătavu, S.; Lobonț, O.R.; Para, I.; Pelin, A. Addressing oil price changes through business profitability in oil and gas industry in the United Kingdom. PLoS ONE 2018, 13, e0199100. [Google Scholar] [CrossRef] [PubMed]
- Hofmann, E.; Solakivi, T.; Töyli, J.; Zinn, M. Oil price shocks and the financial performance patterns of logistics service providers. Energy Econ. 2018, 72, 290–306. [Google Scholar] [CrossRef]
- Vasile, A.J.; Andreea, I.R.; Popescu, G.H.; Elvira, N.; Marian, Z. Implications of agricultural bioenergy crop production and prices in changing the land use paradigm-the case of Romania. Land Use Policy 2016, 50, 399–407. [Google Scholar] [CrossRef]
- Andrei, J.V.; Andreea, I.R. A trade-off between economics and environment requirements on energy crops vs. food crops in Romanian agriculture. Custos E Agronegocio Line 2018, 14, 61–82. [Google Scholar]
- Dusmanescu, D.; Andrei, J.V.; Popescu, G.H.; Nica, E.; Panait, M. Heuristic methodology for estimating the liquid biofuel potential of a region. Energies 2016, 9, 703. [Google Scholar] [CrossRef]
- Ene, C. Securitatea Alimentară–Coordonate şi Implicaţii; Editura Universităţii Petrol-Gaze din Ploieşti: Ploiești, România, 2009. [Google Scholar]
- Istudor, N.; Ion, R.A.; Sponte, M.; Petrescu, I.E. Food Security in Romania-A Modern Approach for Developing Sustainable Agriculture. Sustainability 2014, 6, 8796–8807. [Google Scholar] [CrossRef]
- Ion, R.A.; Dusmanescu, D. Influences of international trade on food security. In Thematic Proceedings Sustainable Agriculture and Rural Development in Terms of the Republic of Serbia Strategic Goals Realization with the Danube Region-Development and Application of Clean Technologies in Agriculture-Thematic Proceedings; Institute of Agricultural Economics: Belgrade, Serbia, 2017; pp. 73–88. Available online: https://d1wqtxts1xzle7.cloudfront.net/51963342/1-s2.0-S0305750X15002946-main-libre.pdf?1488270272=&response-content-disposition=inline%3B+filename%3D1_s2_0_S0305750X15002946_main_pdf.pdf&Expires=1677482483&Signature=eT7ZuVhwn1w04MdW3GEPqqu1LIPxV-k9cnbLWdC3Y9crUJFeGJa6DTBkr5iVD0Hd8McI-vrJg0mDzTrsb8skd3HF56PoCrKz8yiJGj8YeQWQep4FlWx8Ije7rJJebeYc4jO2dVi9eKOhX8RxxXZvOL3ld3IvHkLK~1oYoo5Ce-k1lJhOdYwHJxXx2P9TJVfxzqtKvwRBAfK47fIFKeLYvjwlTDaO35CzQCE0AiOqEupB6p415Uh6pRXVVeRlcgrqBQK0wmIrD8tDVo84fV9F2Z3X9IhxCg4SNc12-ngho6qF8pEa~C2mvl2jq-XwlYGmC5X5IZTI1p4BPCeDfjg3hg__&Key-Pair-Id=APKAJLOHF5GGSLRBV4ZA#page=85 (accessed on 27 November 2022).
- Voica, C.M.; Ene, C.; Panait, M. The use of biofuels and bioliquids in the European Union in the context of sustainable development and food security’s constraints. In Agrarian Economy and Rural Development—Realities and Perspectives for Romania; ICEADR: Bucharest, Romania, 2016; pp. 241–248. Available online: https://www.econstor.eu/bitstream/10419/163381/1/ICEADR-2016_p241.pdf (accessed on 27 November 2022).
- Ene, C.; Voica, M.C.; Panait, M. Green Investments and Food Security: Opportunities and Future Directions in the Context of Sustainable Development. In Measuring Sustainable Development and Green Investments in Contemporary Economies; IGI Global: Hershey, PA, USA, 2017; pp. 163–200. [Google Scholar]
- Shrestha, D.S.; Staab, B.D.; Duffield, J.A. Biofuel impact on food prices index and land use change. Biomass Bioenergy 2019, 124, 43–53. [Google Scholar] [CrossRef]
- Su, X.; Zhu, H.; Yang, X. Heterogeneous Causal Relationships between Spot and Futures Oil Prices: Evidence from Quantile Causality Analysis. Sustainability 2019, 11, 1359. [Google Scholar] [CrossRef]
- Hsiao, C.Y.L.; Lin, W.; Wei, X.; Yan, G.; Li, S.; Sheng, N. The impact of international oil prices on the stock price fluctuations of China’s renewable energy enterprises. Energies 2019, 12, 4630. [Google Scholar] [CrossRef]
- Sun, C.; Ding, D.; Fang, X.; Zhang, H.; Li, J. How do fossil energy prices affect the stock prices of new energy companies? Evidence from Divisia energy price index in China’s market. Energy 2019, 169, 637–645. [Google Scholar] [CrossRef]
- Mukhtarov, S.; Mikayilov, J.I.; Humbatova, S.; Muradov, V. Do high oil prices obstruct the transition to renewable energy consumption? Sustainability 2020, 12, 4689. [Google Scholar] [CrossRef]
- Kyritsis, E.; Serletis, A. Oil prices and the renewable energy sector. Energy J. 2019, 40, 337–364. [Google Scholar] [CrossRef]
- Bhatti, M.I.; Do, H.Q. Recent development in copula and its applications to the energy, forestry and environmental sciences. Int. J. Hydrogen Energy 2019, 44, 19453–19473. [Google Scholar] [CrossRef]
- Elie, B.; Naji, J.; Dutta, A.; Uddin, G.S. Gold and crude oil as safe-haven assets for clean energy stock indices: Blended copulas approach. Energy 2019, 178, 544–553. [Google Scholar] [CrossRef]
- Jiang, Y.; Lao, J.; Mo, B.; Nie, H. Dynamic linkages among global oil market, agricultural raw material markets and metal markets: An application of wavelet and copula approaches. Phys. A Stat. Mech. Appl. 2018, 508, 265–279. [Google Scholar] [CrossRef]
- Ji, Q.; Liu, B.Y.; Fan, Y. Risk dependence of CoVaR and structural change between oil prices and exchange rates: A time-varying copula model. Energy Econ. 2019, 77, 80–92. [Google Scholar] [CrossRef]
- Li, J.; Li, P. Empirical analysis of the dynamic dependence between WTI oil and Chinese energy stocks. Energy Econ. 2021, 93, 104299. [Google Scholar] [CrossRef]
- Zhu, H.; Guo, Y.; You, W.; Xu, Y. The heterogeneity dependence between crude oil price changes and industry stock market returns in China: Evidence from a quantile regression approach. Energy Econ. 2016, 55, 30–41. [Google Scholar] [CrossRef]
- Matei, M.; Popescu, C. The innovation and integration-Dimensions of the activity of exchanges. In Proceedings of the 2010 2nd IEEE International Conference on Information Management and Engineering, Chengdu, China, 16–18 April 2010; pp. 299–303. [Google Scholar]
- Humbatova, S.I.; Hajiyev, N.Q. Oil factor in economic development. Energies 2019, 12, 1573. [Google Scholar] [CrossRef]
- Luo, Z.; Cai, X.; Tanaka, K.; Takiguchi, T.; Kinkyo, T.; Hamori, S. Can we forecast daily oil futures prices? Experimental evidence from convolutional neural networks. J. Risk Financ. Manag. 2019, 12, 9. [Google Scholar] [CrossRef]
- Zhao, L.T.; Zeng, G.R. Analysis of Timeliness of Oil Price News Information Based on SVM. Energy Procedi. 2019, 158, 4123–4128. [Google Scholar] [CrossRef]
- Neacsa, A.; Stoica, D.B. Aspects concerning the software applications in order to determine the technological systems reliability. Model. Optim. Mach. Build. Field 2007, 13, 153–160. [Google Scholar]
- Neacsa, A.; Stoica, D.B.; Antonescu, N.N.; Petrescu, M.G. Evaluation of technological systems reliability using software applications. In Proceedings of the 3rd International Conference on Manufacturing Engineering (ICMEN), Chalkidiki, Greece, 1–3 October 2008; pp. 757–762. [Google Scholar]
- Neacsa, A.; Rehman Khan, S.A.; Panait, M.; Apostu, S.A. The Transition to Renewable Energy—A Sustainability Issue? In Energy Transition—Economic, Social and Environmental Dimensions; Industrial Ecology Book Series (IE); Springer: Berlin/Heidelberg, Germany, 2022; Chapter 2. [Google Scholar]
- Neacsa, A.; Panait, M.; Muresan, J.D.; Voica, M.C. Energy Poverty in European Union: Assessment Difficulties, Effects on the Quality of Life, Mitigation Measures. Some Evidences from Romania. Sustainability 2020, 12, 4036. [Google Scholar] [CrossRef]
- Neacșa, A.; Panait, M.; Mureșan, J.D.; Voica, M.C.; Manta, O. The Energy Transition between Desideratum and Challenge: Are Cogeneration and Trigeneration the Best Solution? Int. J. Environ. Res. Public Health 2022, 19, 3039. [Google Scholar] [CrossRef] [PubMed]
- Stoica, D.B.; Eparu, C.N.; Neacsa, A.; Prundurel, A.P.; Simescu, N.B. Investigation of the gas losses in transmission net-works. J. Petrol. Explor. Prod. Technol. 2021, 12, 1665–1676. [Google Scholar] [CrossRef]
- Neacsa, A.; Eparu, C.N.; Stoica, D.B. Hydrogen—Natural Gas Blending in Distribution Systems-An Energy, Economic, and Environmental Assessment. Energies 2022, 15, 6143. [Google Scholar] [CrossRef]
- Eparu, C.N.; Neacsa, A.; Stoica, D.B. Gas Losses in the Distribution Networks: An Interdisciplinary Analysis. Energies 2023, 16, 196. [Google Scholar] [CrossRef]
Disclaimer/Publisher’s Note: The statements, opinions and data contained in all publications are solely those of the individual author(s) and contributor(s) and not of MDPI and/or the editor(s). MDPI and/or the editor(s) disclaim responsibility for any injury to people or property resulting from any ideas, methods, instructions or products referred to in the content. |
© 2023 by the authors. Licensee MDPI, Basel, Switzerland. This article is an open access article distributed under the terms and conditions of the Creative Commons Attribution (CC BY) license (https://creativecommons.org/licenses/by/4.0/).