Article

Green Deal and Carbon Neutrality Assessment of Czechia

Environment Centre, Charles University, 162 00 Prague, Czech Republic
*
Author to whom correspondence should be addressed.
Energies 2023, 16(5), 2152; https://doi.org/10.3390/en16052152
Submission received: 26 January 2023 / Revised: 13 February 2023 / Accepted: 20 February 2023 / Published: 23 February 2023
(This article belongs to the Topic Modeling, Optimization, and Control of Energy Systems)

Abstract

:
The European Green Deal declares climate neutrality as a goal for the year 2050. It establishes an EU binding target to reduce greenhouse gas emissions by 55 percent by 2030 compared to 1990. The market, through the EU Emissions Trading Scheme, will determine how EU member states contribute to this target. The Effort Sharing Regulation defines binding national targets to reduce the remaining GHG emissions not covered by the EU ETS. In this paper, an energy optimization model is applied to analyze the capability of Czechia to meet the climate change targets by 2030 and 2050. We define a baseline scenario derived from the National Energy and Climate Plan and three policy scenarios to assess impacts of the extension of the EU ETS to buildings and transport (EU ETS 2) and the coal phase-out on the Czech energy system. One of the policy scenarios aims at approaching climate neutrality in 2050. In addition, another scenario does not assess the impacts of the EU ETS 2 and coal phase-out but searches for the optimal path to achieve climate neutrality in 2050. Given the high level of GHG emissions in 1990 and the significant reduction in GHG emissions in the 1990s, Czechia could achieve a 55% reduction by 2030. However, further decarbonization will be quite challenging.

1. Introduction

The European Green Deal aims to achieve climate neutrality by 2050 and sets a binding EU target of a 55% reduction in greenhouse gas (GHG) emissions by 2030 compared to 1990 levels. The Fit for 55 package, which includes a series of legislative initiatives across a range of sectors to put the EU on track to meet its 2030 climate target of 55%, got close to its final approval during 2022. The EU-wide impact assessment of the Climate Target Plan [1] preceding Fit for 55 package and the subsequent ‘core policy scenarios’ with Member State-level details [2] have been followed by other studies. While Pietzcker et al. [3] focus only on the on EU Emissions Trading System (EU ETS) sectors, Kattelmann et al. [4] analyze the optimal share of GHG emission reductions between EU ETS and Effort Sharing Regulation (ESR) sectors and the optimal GHG emission reductions in ESR sectors for each EU Member State. Other studies assess the impacts of the Fit for 55 package on a specific sector (e.g., metallurgical silicon industry [5], households [6], transport [7], airports [8], shipping [9]) or on one sector or more sectors in a single country, e.g., [10,11].
This paper aims to enrich the literature with a case study of Czechia. Czechia significantly reduced its greenhouse gas emissions during the 1990s [12] but remains one of the two most industrialized EU member states [13] with the third highest GHG emissions per capita [14], a high energy intensity of industry and a relatively lukewarm attitude towards climate change mitigation measures [15,16,17]. So far, there is one study that evaluates the possibility of reaching a 55% reduction in GHG emissions by 2030 and climate neutrality by 2050 in Czechia [18], which does not evaluate any policy but searches for a suitable path towards Czech decarbonization. Other studies focus only on the Czech electricity sector [19,20,21], renewable energy sources [22,23] or industry [24], all with a 2030 horizon. Older Czech studies [25,26] model the whole energy system but evaluate mainly a lifting of the brown coal mining limits in Czechia. Therefore, we analyze Czechia’s ability to meet its climate targets not only in 2030, but also in 2050.
We apply the energy optimization model TIMES-CZ to analyze the impacts of the extension of the EU ETS to buildings and road transport (EU ETS 2) and of a coal phase-out on the Czech energy system. We also assess the capability of Czechia to achieve climate neutrality by 2050 without biomass or hydrogen imports. We evaluate a baseline scenario derived from the National Energy and Climate Plan [27] and four policy scenarios. We find that Czechia should be able to achieve a 55% reduction in total GHG emissions in 2030, mainly due to GHG emission reductions in the EU ETS sectors. The effort required to reach this target is reduced by the high level of GHG emissions in the base year 1990. The energy efficiency and renewable energy targets for 2030 are more difficult to achieve. Further decarbonization is quite challenging and climate neutrality in 2050 cannot be achieved without additional measures or higher imports of renewable energy. We evaluate the GHG emission savings and relate them to the EC REF2020 scenario [28] to assess several alternative policy scenarios and to show how ambitious the EC REF2020 scenario is for Czechia.
The rest of this paper is structured as follows. In Section 2, we describe the model and data used in the analysis. The modeled scenarios and their assumptions are described in Section 3. We then present our scenario analyses in Section 4. Finally, we provide a discussion of our results in Section 5, and Section 6 concludes the paper.

2. Model and Data

TIMES-CZ is a technology-rich, bottom-up, cost-optimizing integrated assessment model built within the generic and flexible TIMES (The Integrated MARKAL-EFOM System) model generator’s General Algebraic Modeling System (GAMS) code. TIMES has been developed and maintained within the Energy Technology System Analyses Program (ETSAP) by the International Energy Agency (IEA) [29]. TIMES searches for an optimal solution for an overall energy mix that will satisfy exogenously given energy service demand with the least total discounted costs in a given timeframe with a perfect foresight principle [30].
TIMES-CZ is based on the Czech region of the Pan-European TIMES PanEu model developed by the Institute of Energy Economics and Rational Energy Use at the University of Stuttgart [31], but its base year is updated to 2015 and its structure is modified. The modeling horizon spans from 2015 to 2050, split into 5 year-time steps. A year is divided into 12 time slices, 4 seasons and 3 time periods in a day (day, peak and night). GHG emissions (CO2, CH4, N2O) and other pollutants (SO2, NOx, NMVOC, PM) are included in the model.
The TIMES-CZ model covers the entire energy balance of Czechia from the supply of resources to the energy service demand. The structure of the TIMES-CZ model is significantly extended in four ways. First, all EU ETS sectors are disaggregated into individual units. The non-ETS parts correspond to the structure of the TIMES-PanEu model. Based on data from EU ETS emission reports, unique multi-fuel mixes are created for each ETS source according to their actual consumption. Other input data for the individual EU ETS sources are obtained from the Register of Emission and Air Pollution Sources [32] (REZZO database), which is compiled by the Czech Hydrometeorological Institute, and from the Energy Regulatory Office. Second, the emissions trading mechanism takes into account the transition to auctioning and the derogation (free allowances for existing power plants for a transitional period until 2019 according to Article 10c of the EU ETS Directive [33]). Third, both district heating demand and supply are regionalized into 36 regions based on zip codes. Fourth, a detailed transport module is developed. In the base year, the transport module contains 135 technologies for road vehicles by COPERT categories [34] (i.e., distinguishing vehicle category and type, fuel and EURO norm). Transport technologies for future years include both new and second-hand vehicles. The module includes biofuel production.
The technical and economic characteristics of new technologies are taken from TIMES-PanEu [31] and JRC-EU-TIMES [35] models and [36], with a few exceptions. The investment costs of solar photovoltaic (PV) and wind power plants are adjusted according to Czech conditions; see Table 1. The investment cost of new nuclear power sources is forecasted at EUR2015 6317 per kW; these investment costs are derived from those of the Hinkley Point C nuclear power plant. The assumed discount rates, taken from the JRC-EU-TIMES model [35], vary by sector and technology type, ranging from 7% for energy carrier distribution up to 12% for most heat and power generation technologies.
The GHG emissions from the land use, land use change and forestry (LULUCF), agriculture, waste and F-gas sectors are not modeled by TIMES-CZ, but are included in the overall GHG balance, following [4,28,38,39,40,41]; see Table 2.

3. Scenarios

We define a baseline scenario, called NECP, derived from the National Energy and Climate Plan [27] (hereafter referred to as the National Plan) and three policy scenarios to assess impacts of the extension of the EU ETS to buildings and transport (EU ETS 2) and of coal phase-out on the Czech energy system. One of the policy scenarios (REG) also aims to approach climate neutrality in 2050. On top of that, another scenario (NECP_zero) does not assess the impacts of the EU ETS 2 and of coal phase-out but searches for the optimal path to reaching climate neutrality by 2050.
In all scenarios, demands for energy services and energy-intensive products are derived from the National Plan [27]. We assume an increase in iron and steel recycling by 10% by 2050; thereby, the availability of steel scrap as an input for steel production is up to 2 Mt in 2050 (this is a conservative assumption that limits the decarbonization of iron and steel production through direct reduction by hydrogen). We conservatively assume Czechia is self-sufficient in all renewables and hydrogen production for the following reasons. (1) The main Czech renewable energy source is biomass, which is not suitable for long-range transportation for energy purposes for cost and biodiversity protection reasons. (2) The existing State Energy Policy [42] aims to maintain the Czech Republic’s import dependence in the area of gaseous and liquid fuels at no more than the current level. (3) Czechia’s Hydrogen Strategy [43] assumes imports of hydrogen but is very general about the cost and source of the imported hydrogen. The adoption of proposed amendments, which are likely meant as set targets for the deployment of hydrogen in industry and transport, in the EU Renewable Energy Directive has been stuck for a long time due to a disagreement over the definition of renewable (and low-carbon) hydrogen [44]. Additionally, according to the IEA, northwest Europe will face a shortage of hydrogen by 2030 even in a conservative scenario [45]. The hydrogen supply from North Africa is limited by existing pipelines to 9.5–23.2 TWh/a [46]. At the same time, it is estimated that excess electricity will be not sufficient to provide substantial amounts of hydrogen in Europe by 2050 [47].
A description of individual scenarios follows.
The NECP scenario, derived from the National Plan [27], assumes the decommissioning of the Dukovany nuclear power plant between 2036 and 2037 and its simple replacement with a new nuclear power source. GHG emissions are capped in 2030 at 98.5 Mt CO2ek in total and 52.3 Mt CO2ek under Effort Sharing Regulation (ESR, i.e., outside the EU ETS and LULUCF sectors), representing a 50% reduction in GHG emissions compared to 1990 and a 14% reduction compared to 2005 under ESR. After 2030, the evolution of GHG emissions is the result of cost optimization by the TIMES-CZ model. The electricity export balance (net imports) is fixed according to the National Plan, as seen in Table 3.
The NECP_zero scenario has the same assumptions as the NECP scenario, but it aims to approach climate neutrality in 2050.
The REF scenario is derived from the European Commission’s REF2020 scenario (EC REF2020) [28], including nuclear power generation and net electricity imports. The share of RESs in gross final consumption is at least 22.6% from 2030. The electricity export balance (net imports) is fixed according to the EC REF2020 scenario, as seen in Table 3.
The CPRICE scenario is derived from the CTP2030 CPRICE scenario (EC CPRICE). From 2026 onwards, the CPRICE scenario foresees the extension of the EU ETS to buildings and transport (EU ETS 2), and the EUA price is the same in both parts of the EU ETS. The decommissioning of the Dukovany nuclear power plant is assumed in 2036 and the installation of new nuclear sources is the result of cost optimization in the TIMES-CZ model. The assumption about the electricity export balance is relaxed and net electricity imports of up to 20 TWh/year are allowed from 2030. Within this range, the resulting electricity export balance is the result of the cost optimization of the model (assuming 70–80 EUR/MWh for the import and export of electricity).
The REG scenario is derived from the CTP2030 REG scenario (EC REG). The REG scenario assumes a shift away from coal after 2030: the end of brown coal mining and consumption and the end of domestic and energy coal consumption. The scenario assumes the decommissioning of the Dukovany nuclear power plant by 2036/2037 and its simple replacement with a new nuclear power source. The electricity export balance (net imports) is fixed at the same levels as in scenarios NECP and NECP_zero. The REG scenario aims to approach climate neutrality in 2050.
In the NECP and NECP_zero scenarios, the assumptions about fossil fuel prices and EUA prices are identical. The other scenarios differ mainly in the assumptions about EUA prices (Table 4) and fossil fuel prices (Table 5), which are important factors influencing the consumption of each primary resource and production of GHG emissions.
For the NECP, CPRICE and REG scenarios, sensitivity analyses of the impact of the price of EUAs and nuclear power development options (a pair of new reactors, different times of closure and development according to cost optimization) on the Czech power system are performed.

4. Results

4.1. Primary Energy Sources

The evaluation of all modeled scenarios shows a general trend of a 24–30% decrease in the consumption of primary energy sources (PESs) by 2050 compared to 2015 (Figure 1). The most rapid decline occurs in the CPRICE scenario, due to a rapid shift away from brown coal. The CPRICE scenario also has the highest net import of electricity; it is the only scenario that allows a net import of electricity of up to 20 TWh. In contrast, the slowest decline in PES consumption (and specifically in brown coal) occurs in the NECP and NECP_zero scenarios. After 2045, PES consumption is the highest in the REF scenario. In the REF, REG and partly also CPRICE scenarios, brown coal is mainly replaced by natural gas. In 2050, the total consumption of primary energy sources ranges from 1166 (CPRICE) to 1273 PJ (REF).
The consumption of black coal and coke falls in all scenarios to between 65 and 70 PJ in 2050, when it is almost exclusively used for iron and steel production. Consumption of fossil liquid fuels falls in all scenarios to between 194 (NECP_zero) and 235 PJ (REF) in 2050. In the REG scenario, brown coal consumption ceases from 2030 due to the cessation of domestic mining (exogenous assumption). In the other scenarios, brown coal consumption decreases to between 4.5 and 32 PJ (NECP). The NECP scenario is the only one wherein brown coal is consumed to a greater extent elsewhere than in households, specifically in electricity and heat generation.
Natural gas consumption is mainly influenced by assumptions about the future price of natural gas. In the NECP and NECP_zero scenarios, natural gas consumption in 2050 is the lowest, at 255 and 279 PJ, respectively. In the CPRICE, REF and REG scenarios, a significantly lower natural gas price is assumed (Table 5) and its consumption increases significantly compared to the base year, peaking here between 2030 and 2040, from 339 (CPRICE) to 418 PJ (REG), and then natural gas consumption decreases to 303 (REF) to 327 PJ (REG).
In all scenarios, there is a significant increase in the consumption of flow RES, in the case of hydro, solar and wind, to the level of their projected potentials in 2050. Geothermal energy use ranges from 49 (REF) to 67 PJ (REG) in 2050.

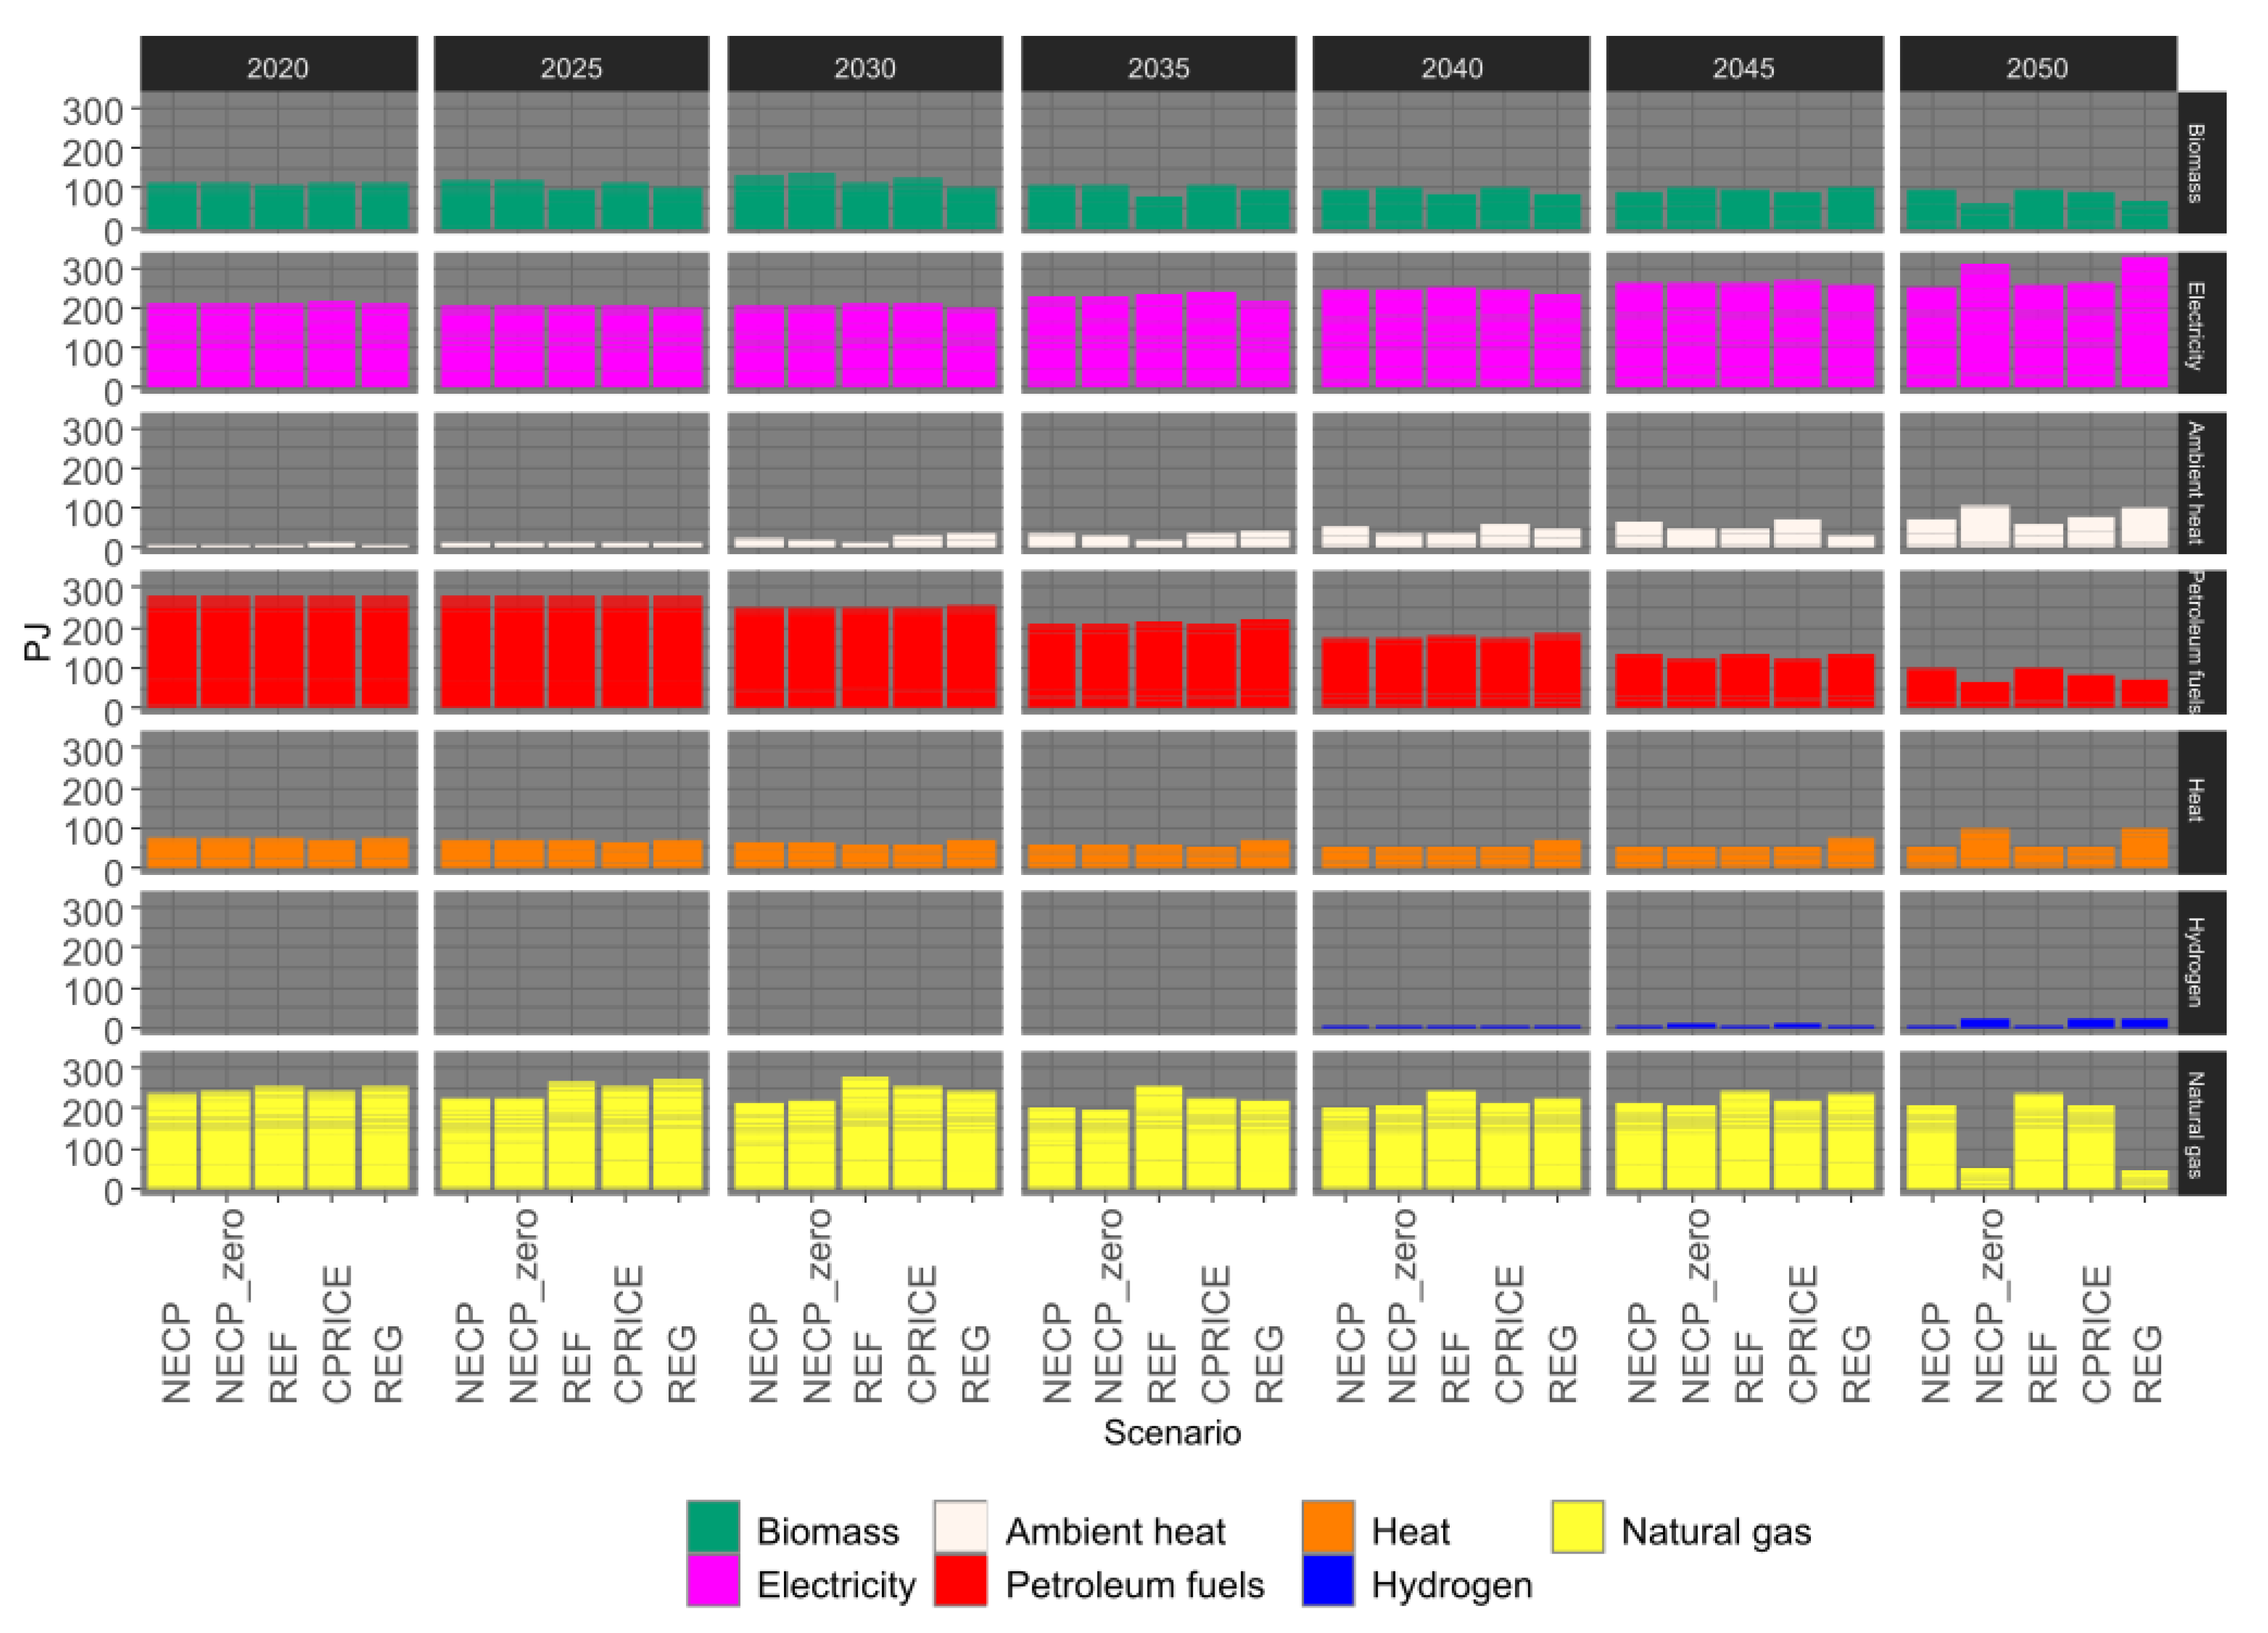
4.2. Energy Transformation—Electricity and Heat

In the energy consumption for electricity and heat production, the different rates of shifting away from coal are again evident in the scenarios (Figure 2). In the CPRICE scenario, which assumes the highest allowance price while allowing for net imports of electricity from 2025 onwards, there is already a significant decline in brown coal consumption in electricity and heat generation (to 36 PJ) in 2025. In the REG scenario, brown coal is mostly replaced by natural gas as soon as in 2030, while in the NECP scenario, it is still marginally present (21 PJ) in 2050. In all scenarios, the representation of RESs develops gradually, mainly in the form of solar, geothermal and wind energy; biomass use grows more slowly, except for a significant increase in the REG (87 PJ) and NECP_zero (97 PJ) scenarios in 2050, which is related to the need for carbon capture and storage (CCS) from biomass and a negative emission balance due to the scenario target of near to climate neutrality.
In all scenarios, there is a significant increase in flow RESs (i.e., geothermal, solar, wind and hydropower) and hydropower, solar and wind reach their projected potentials in 2050.
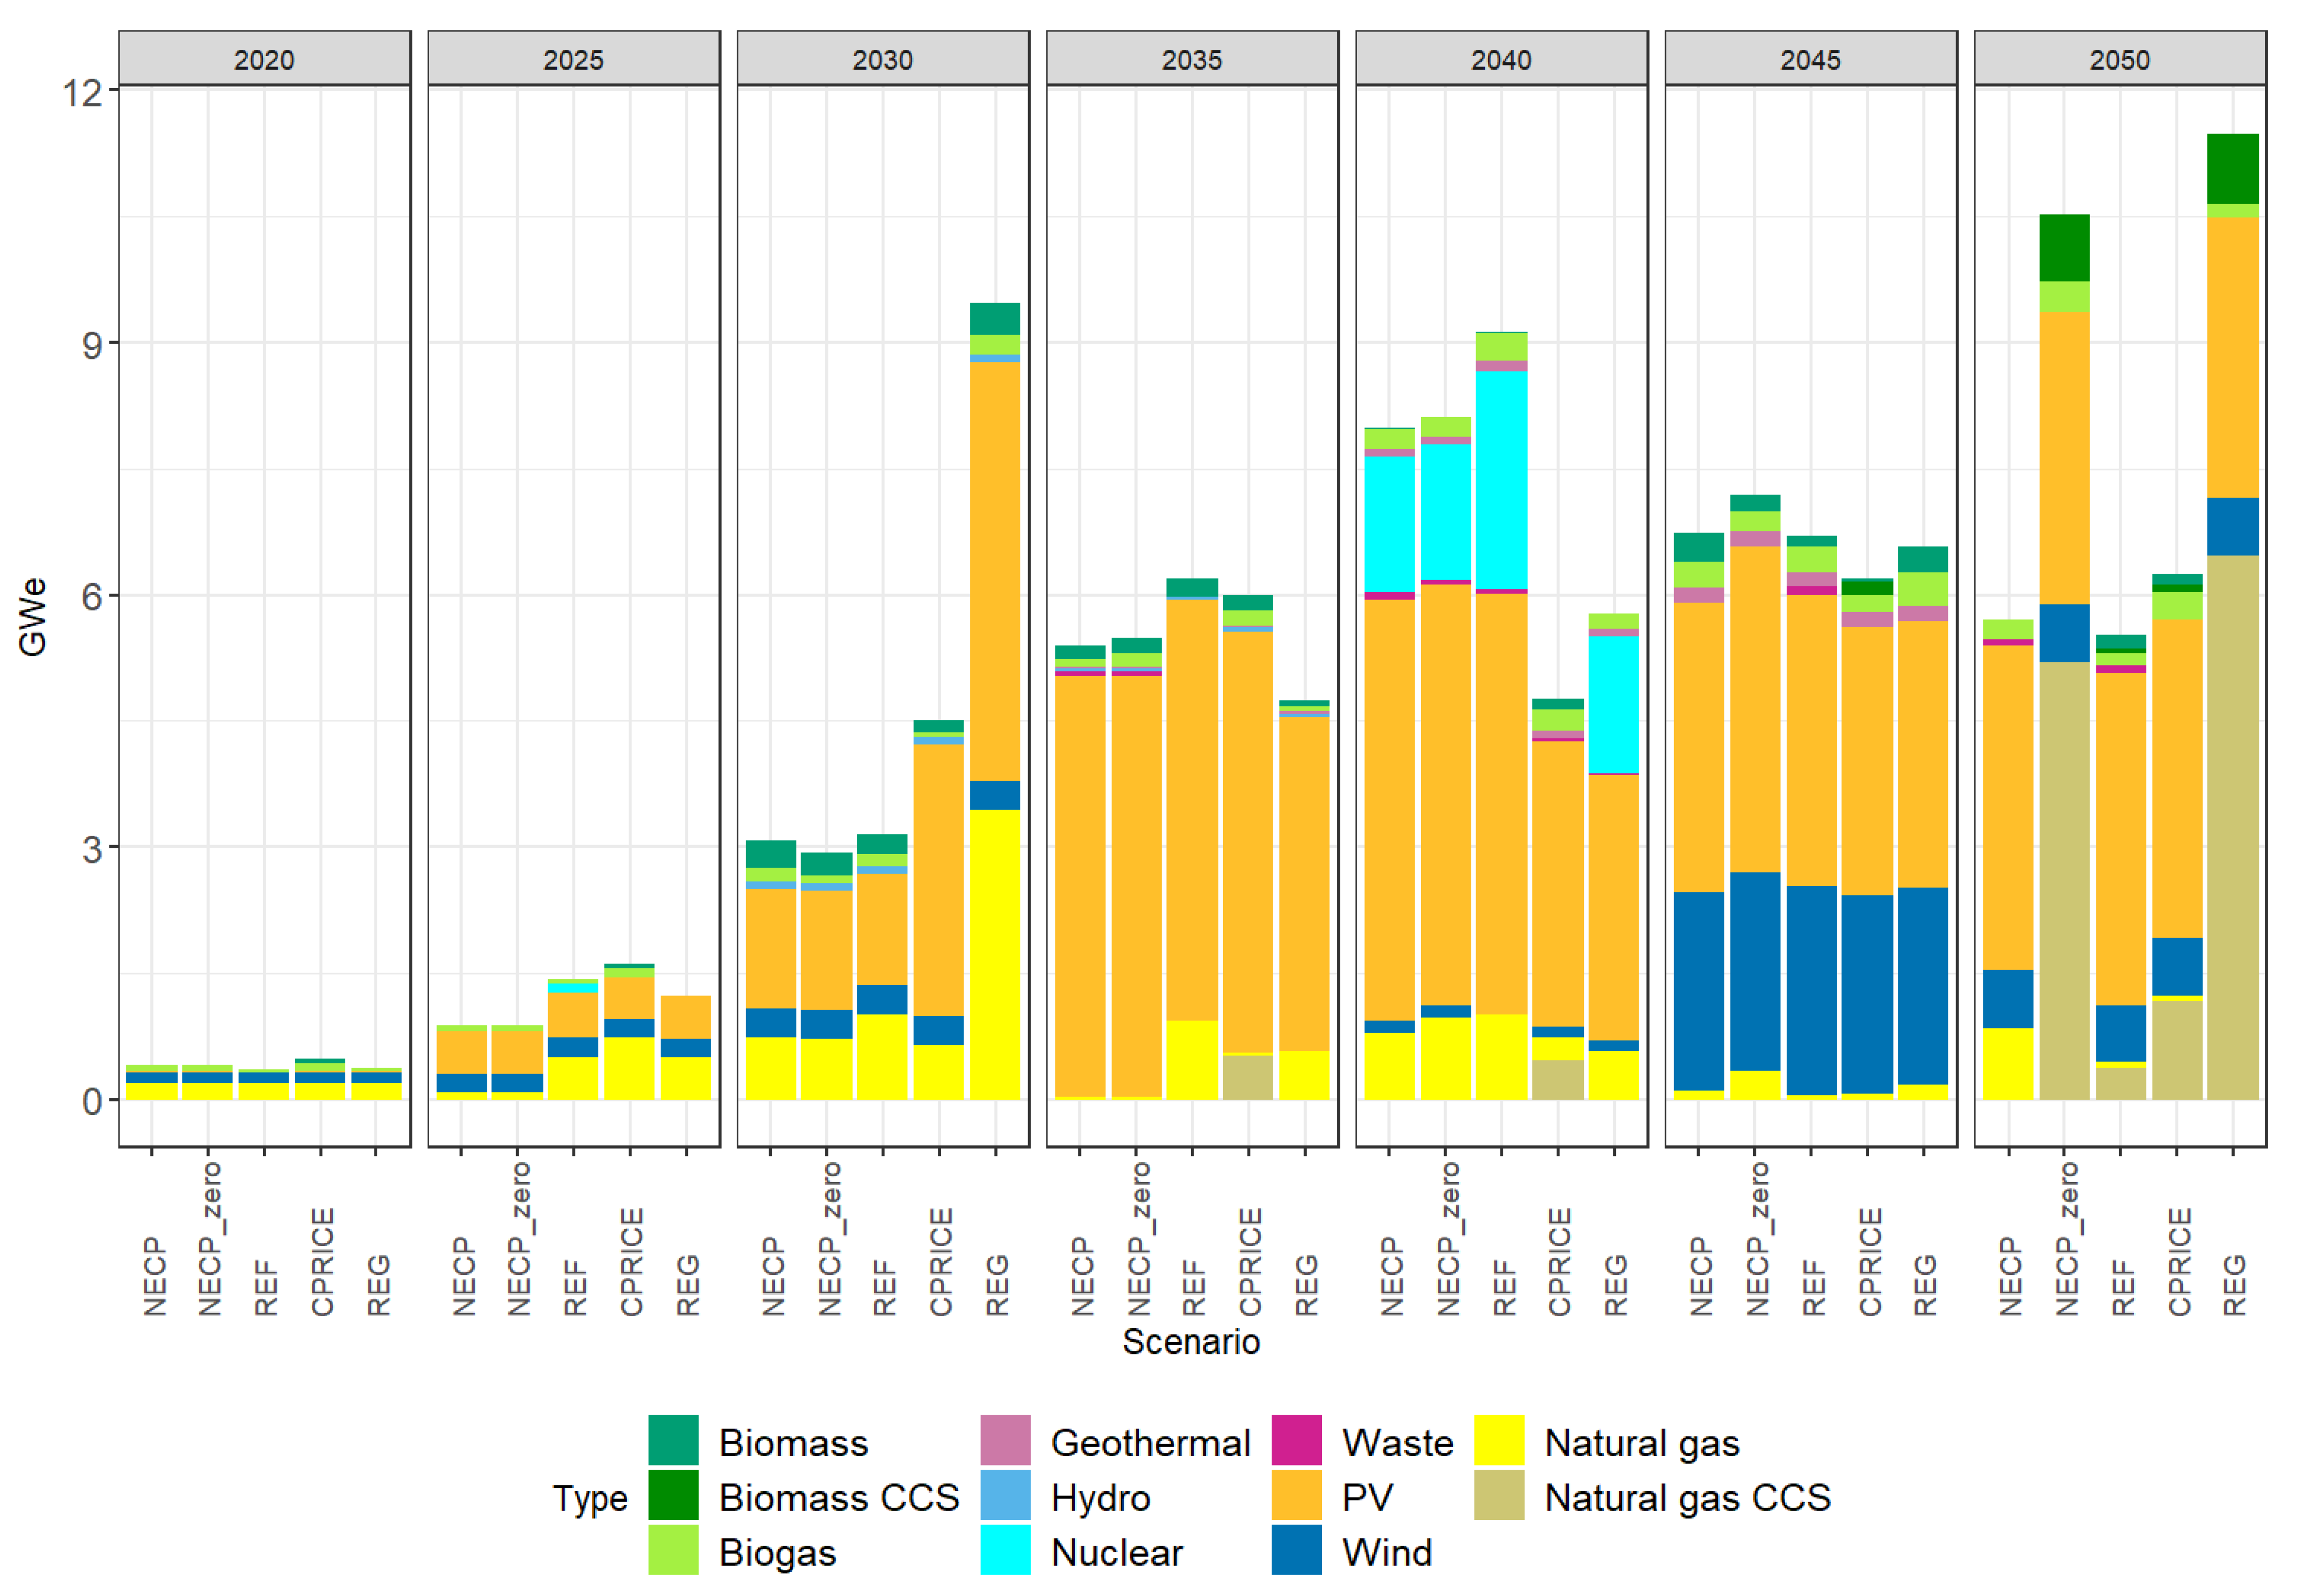
New electricity capacity installations correspond to the energy consumption for electricity and heat production. Cumulative new installations of electricity generation through 2050 differ across the scenarios mainly in terms of natural gas (Table 6). The most gas-consuming scenario—the REG scenario—installs cumulatively 5.4 GW of natural gas sources and another 6.4 GW with CCS technology. On the other hand, the NECP scenario, which relies most on brown coal for electricity, installs cumulatively 2.8 GW of natural gas sources—none with CCS technology. CCS technology is also applied to biomass sources in all scenarios except NECP. Cumulative new installations of wind turbines are the same in all scenarios (3.8 GW) because the model fully uses the assumed potential of wind energy. While the cumulative solar PV installations are very similar across the scenarios—ranging from 19.1 to 19.3 GW—the pace of the installations differs (Figure 3), including re-installations of solar PV sources installed in 2009 at the end of their lifetime. The growth of solar PV is limited to 1 GW per year to ensure grid stability. This is a limiting assumption in all scenarios in at least one 5-year period. No new nuclear units are built based on the cost optimization in the CPRICE scenario, but this is compensated for by increased electricity imports. In all other scenarios, new nuclear units are built around 2040, according to the scenario assumptions.

4.3. Final Energy Consumption

The total final energy consumption in all scenarios peaks around 2025 at approximately 1170 PJ. After 2025, total final energy consumption is on a declining trend, being 12.5 (REF) to 20% (NECP_zero) lower in 2050 than in 2015. In all scenarios, the share of renewable energy increases, especially ambient energy used by heat pumps. After 2045, the final consumption of natural gas decreases to less than 30 PJ in the NECP_zero and REG scenarios. The share of electricity in final energy consumption increases from 20% in 2015 to between 28% (NECP and REF) and 38% (NECP_zero and REG) in 2050 (Figure 4).
The electricity consumption increases from 206 PJ in 2015 to 254 (NECP)—324 (REG) PJ in 2050 (Figure 5). Electricity is mainly used to substitute natural gas and biomass in the final consumption. The increase in electricity consumption is rather conservative because the conservative assumptions preclude deeper industry decarbonization, which would imply a further increase in electricity consumption.

4.4. Greenhouse Gas Emissions

Without the GHG emissions from LULUCF, all scenarios meet the target of a 55% reduction in GHG emissions by 2030 compared to the 1990 levels. The NECP_zero scenario has the slowest decline in GHG emissions up to 2040 and reaches an exact 55% GHG emission reduction in 2030. Other scenarios reduce the GHG emissions even more than the required 55% compared to 1990 levels. However, the GHG emissions from LULUCF are projected to be positive at 2.3 Mt CO2ek due to forests’ recovery from the bark beetle calamity [41]. As a result, the NECP and NECP_zero scenarios fail to meet the 2030 target including the LULUCF, reducing the GHG emissions by only 53%.
The distribution of GHG emissions between ETS and non-ETS sectors is summarized in Figure 6. In the ETS sectors, emissions decline fastest in the CPRICE scenario, while the decline is slowest in the NECP and NECP_zero scenarios. The REF scenario assumes an EUA price in 2050 that is more than double that of the NECP scenario, and also almost half the price of natural gas. At the same time, due to decentralization and a deliberate reduction in the rated thermal input of fossil fuel heat plants and CHPs below 20 MW, individual installations are partially shifted from ETS to non-ETS. This shift of installations between ETS and non-ETS sectors is one of the factors of the significantly faster decline in GHG emissions in the ETS sector compared to the non-ETS sector.
Outside the ETS sectors, the decline is also initially largest in the CPRICE scenario, but after 2045, the largest reductions occur in the REG and NECP_zero scenarios, which aim to achieve climate neutrality in 2050. However, carbon neutrality in 2050 is not achievable under the given assumptions (no imports of biofuels, hydrogen or electricity, and increasing emissions from agriculture). In the REG and NECP_zero scenarios, GHG emissions (not including LULUCF) are reduced to 20 Mt CO2ek, and taking into account the 4.5 Mt CO2ek captured from biomass sources, to less than 16 Mt CO2ek. Including the assumed LULUCF sinks, the REG and NECP_zero scenarios reduce the GHG emissions to less than 10 Mt CO2ek in 2050.
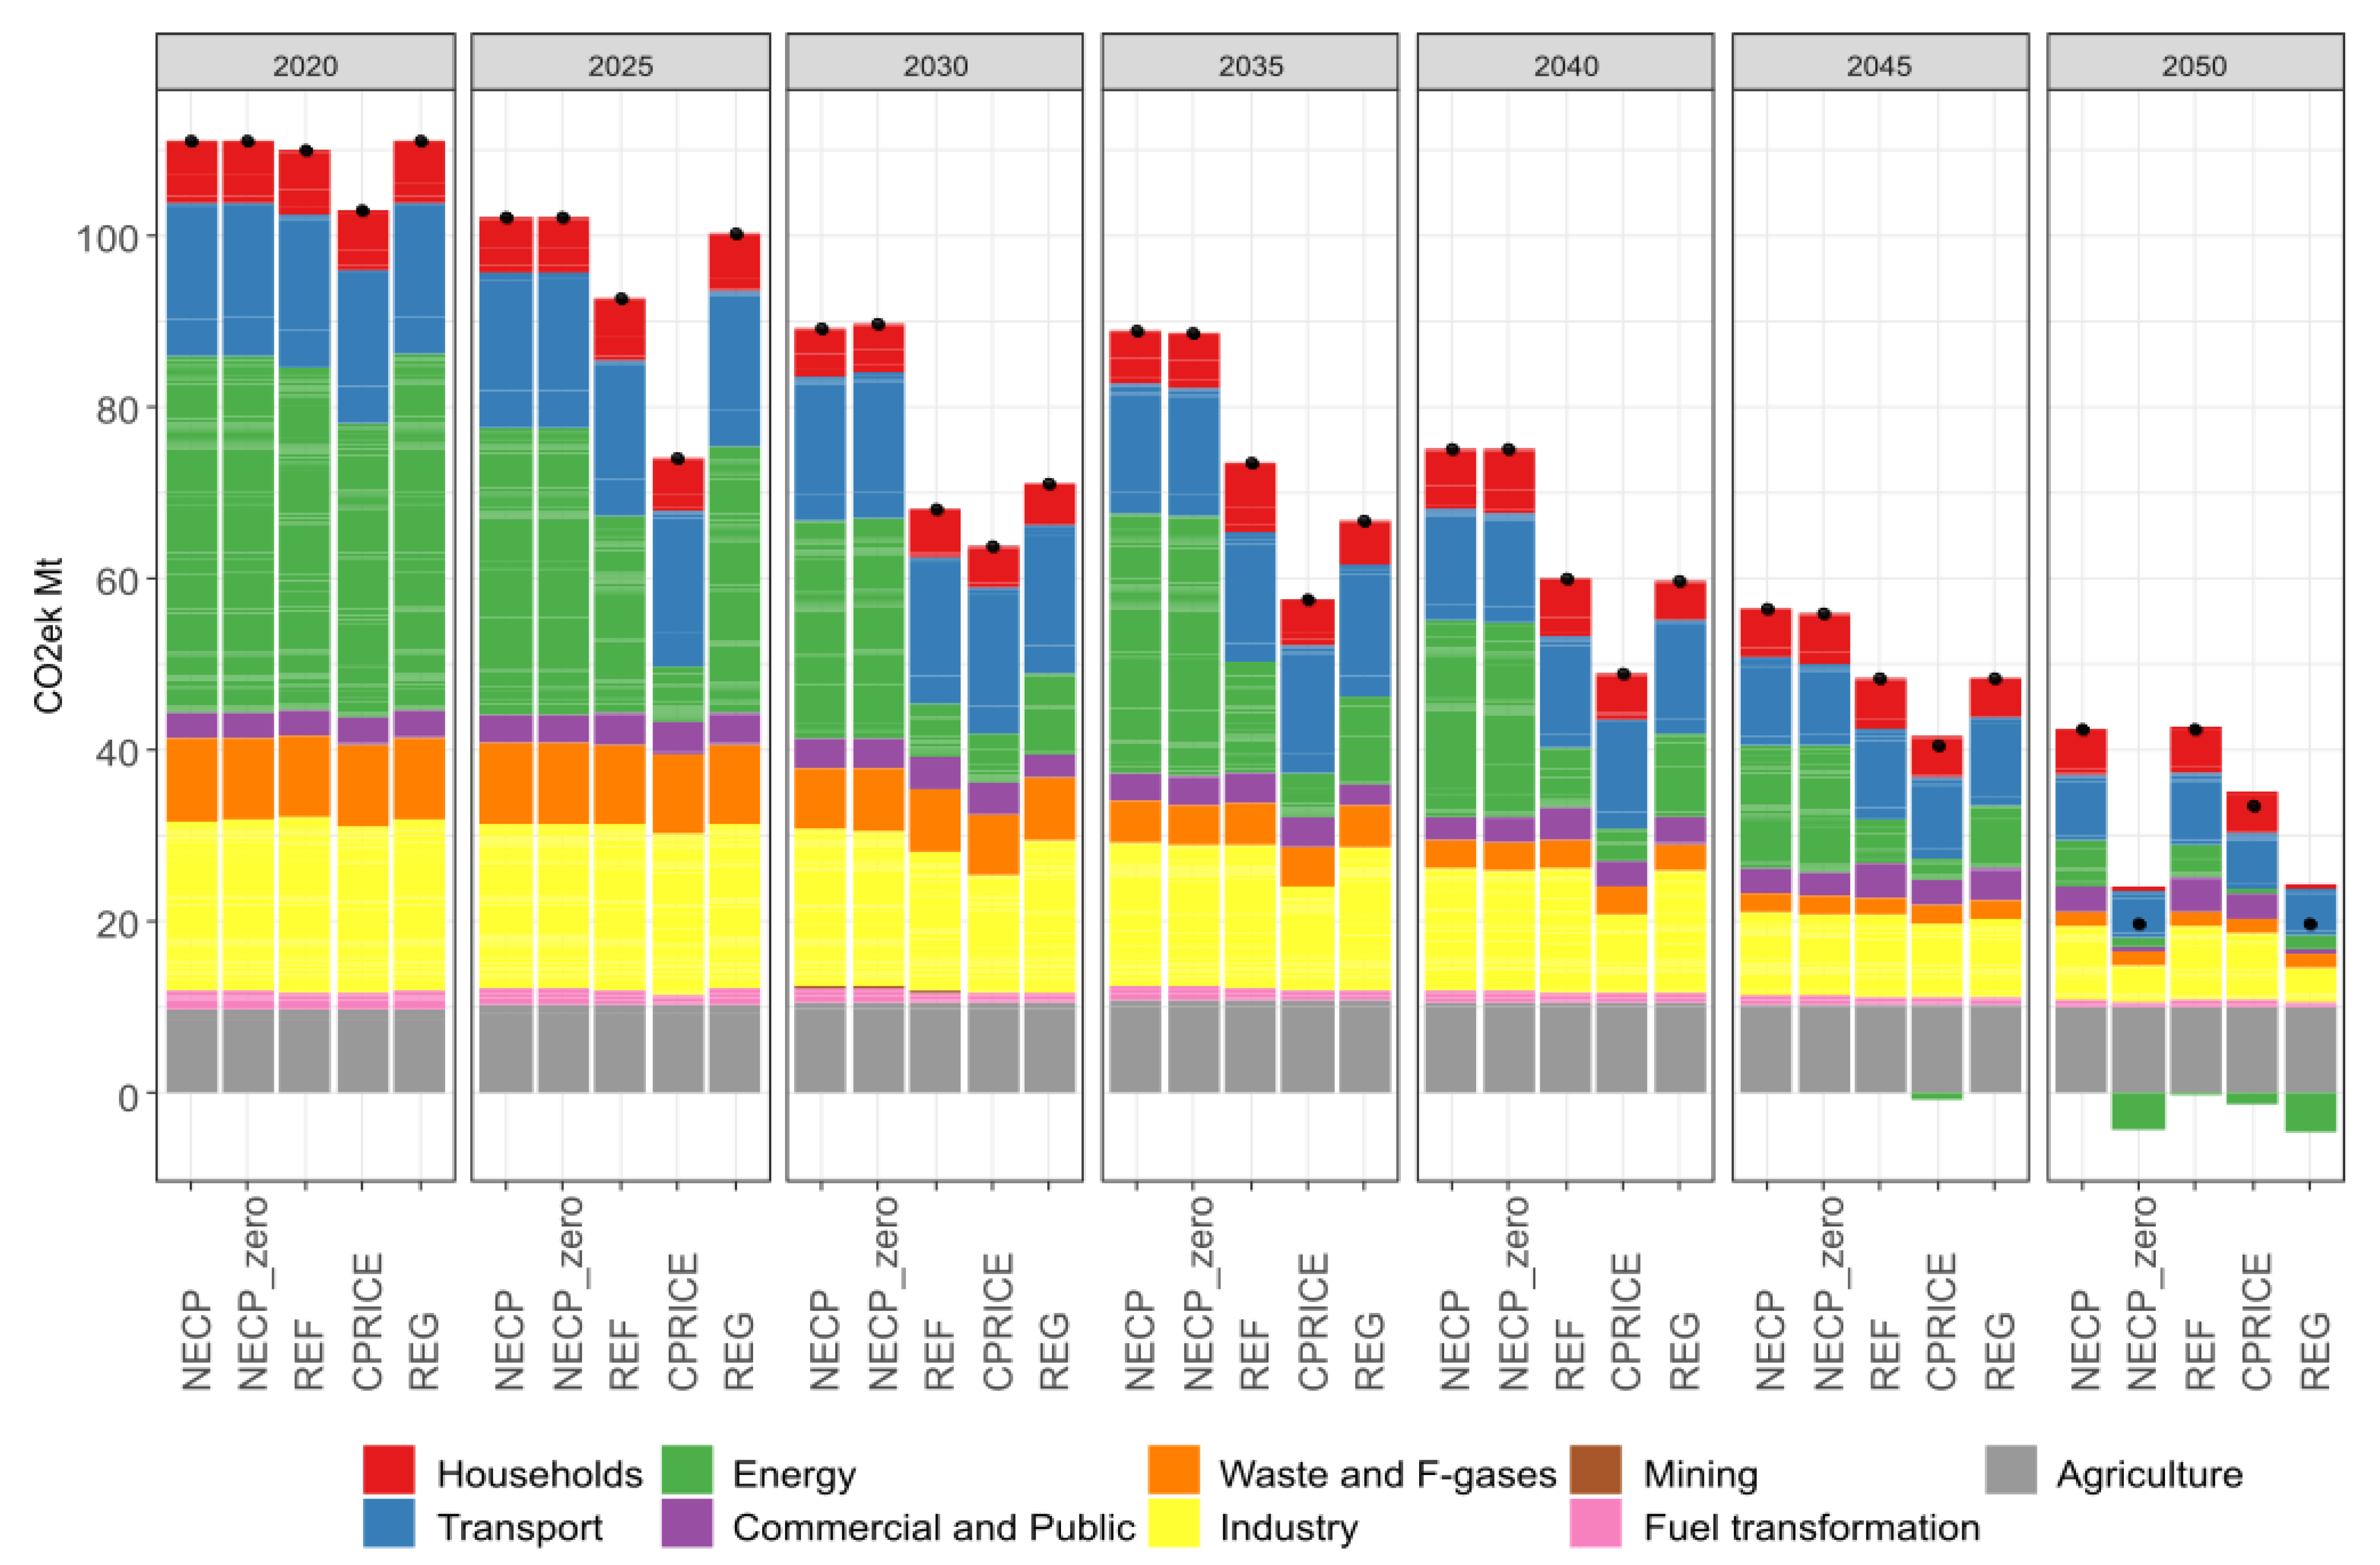
The GHG emissions decline fastest and most significantly in the energy sector, across all scenarios. In the CPRICE, NECP_zero, REG and REF scenarios, the power sector even has a negative GHG emission balance, thanks to CCS technology in biomass electricity and heat production. In the scenarios with the lowest GHG emissions, NECP_zero and REG, the most significant GHG emitter is agriculture (9 Mt CO2ek), followed by transport and industry (Figure 7). GHG emissions from agriculture, waste, and F-gases are included in the model as exogeneous assumption.
The CCS is piloted in 2030 in the CPRICE and REF scenarios. It is used to the least extent in the NECP scenario for lime production. In contrast, it is the most significant in the REG (20 Mt CO2ek) and NECP_zero (17.5 Mt CO2ek) scenarios, where CCS is mainly applied in the production of electricity and heat from natural gas and biomass, as shown in Figure 8.

GHG Emission Savings and Comparison with the EC REF2020 Scenario

We evaluate the GHG emission savings and consider them in the context of the EC REF2020 scenario to assess the policy scenarios and determine if the EC REF2020 scenario is too ambitious for Czechia or not.
The overall GHG emission savings in 2030 of 55% compared to 1990 are realistic even at the Czech level, but mainly due to emission reductions in the EU ETS sectors. Table 7 shows the savings in total GHG emissions compared to 1990 and the savings in non-ETS sectors outside LULUCF (i.e., in ESR sectors) compared to 2005 for each scenario. The NECP and NECP_zero scenarios are the only scenarios that do not achieve an overall GHG emission reduction of 55% compared to 1990. The rate of GHG emission reductions in the ESR sectors is slow in all scenarios, which is also due to the increasing demand for energy services, and in 2030, GHG emissions in the ESR sectors are only reduced by 15 (REG) to 22% (NECP and NECP_zero) compared to 2005. After 2030, the rate of emission reductions in ESR sectors increases until 2050.
In 2050, the savings in total GHG emissions including LULUCF emissions range from 81% (NECP and REF) to 93% (NECP_zero and REG).
Table 8 shows the GHG emission savings in the EC REF2020 scenario and compares the main scenarios of this study with this scenario. We infer that the PRIMES model is most likely not able to correctly distinguish between ETS and non-ETS sectors due to its aggregation. In the REF2020 scenario, emissions in the ETS sectors are higher than the verified EU ETS emissions [49] and, conversely, emissions from the non-ETS sectors are underestimated (in 2005, ETS emissions in the REF2020 scenario are 8 Mt CO2ek higher than verified emissions, in 2010 4.5 Mt CO2ek higher, in 2015 8 Mt CO2ek higher and in 2020 2 Mt CO2ek higher. Again, this results in the REF2020 scenario achieving higher GHG savings in the non-ETS sectors than the scenarios modeled in this study.
The NECP and NECP_zero scenarios have higher GHG emissions than the REF2020 scenario in 2030. The other scenarios, which apply additional policy measures on emissions, have lower total GHG emissions than REF2020 in 2030. The difference in non-ETS emissions between the modeled scenarios and the REF2020 scenario might be affected by the different structure of ETS and non-ETS sectors between the models.
In 2050, even the NECP scenario reaches 41% lower total GHG emissions than the REF2020 scenario.
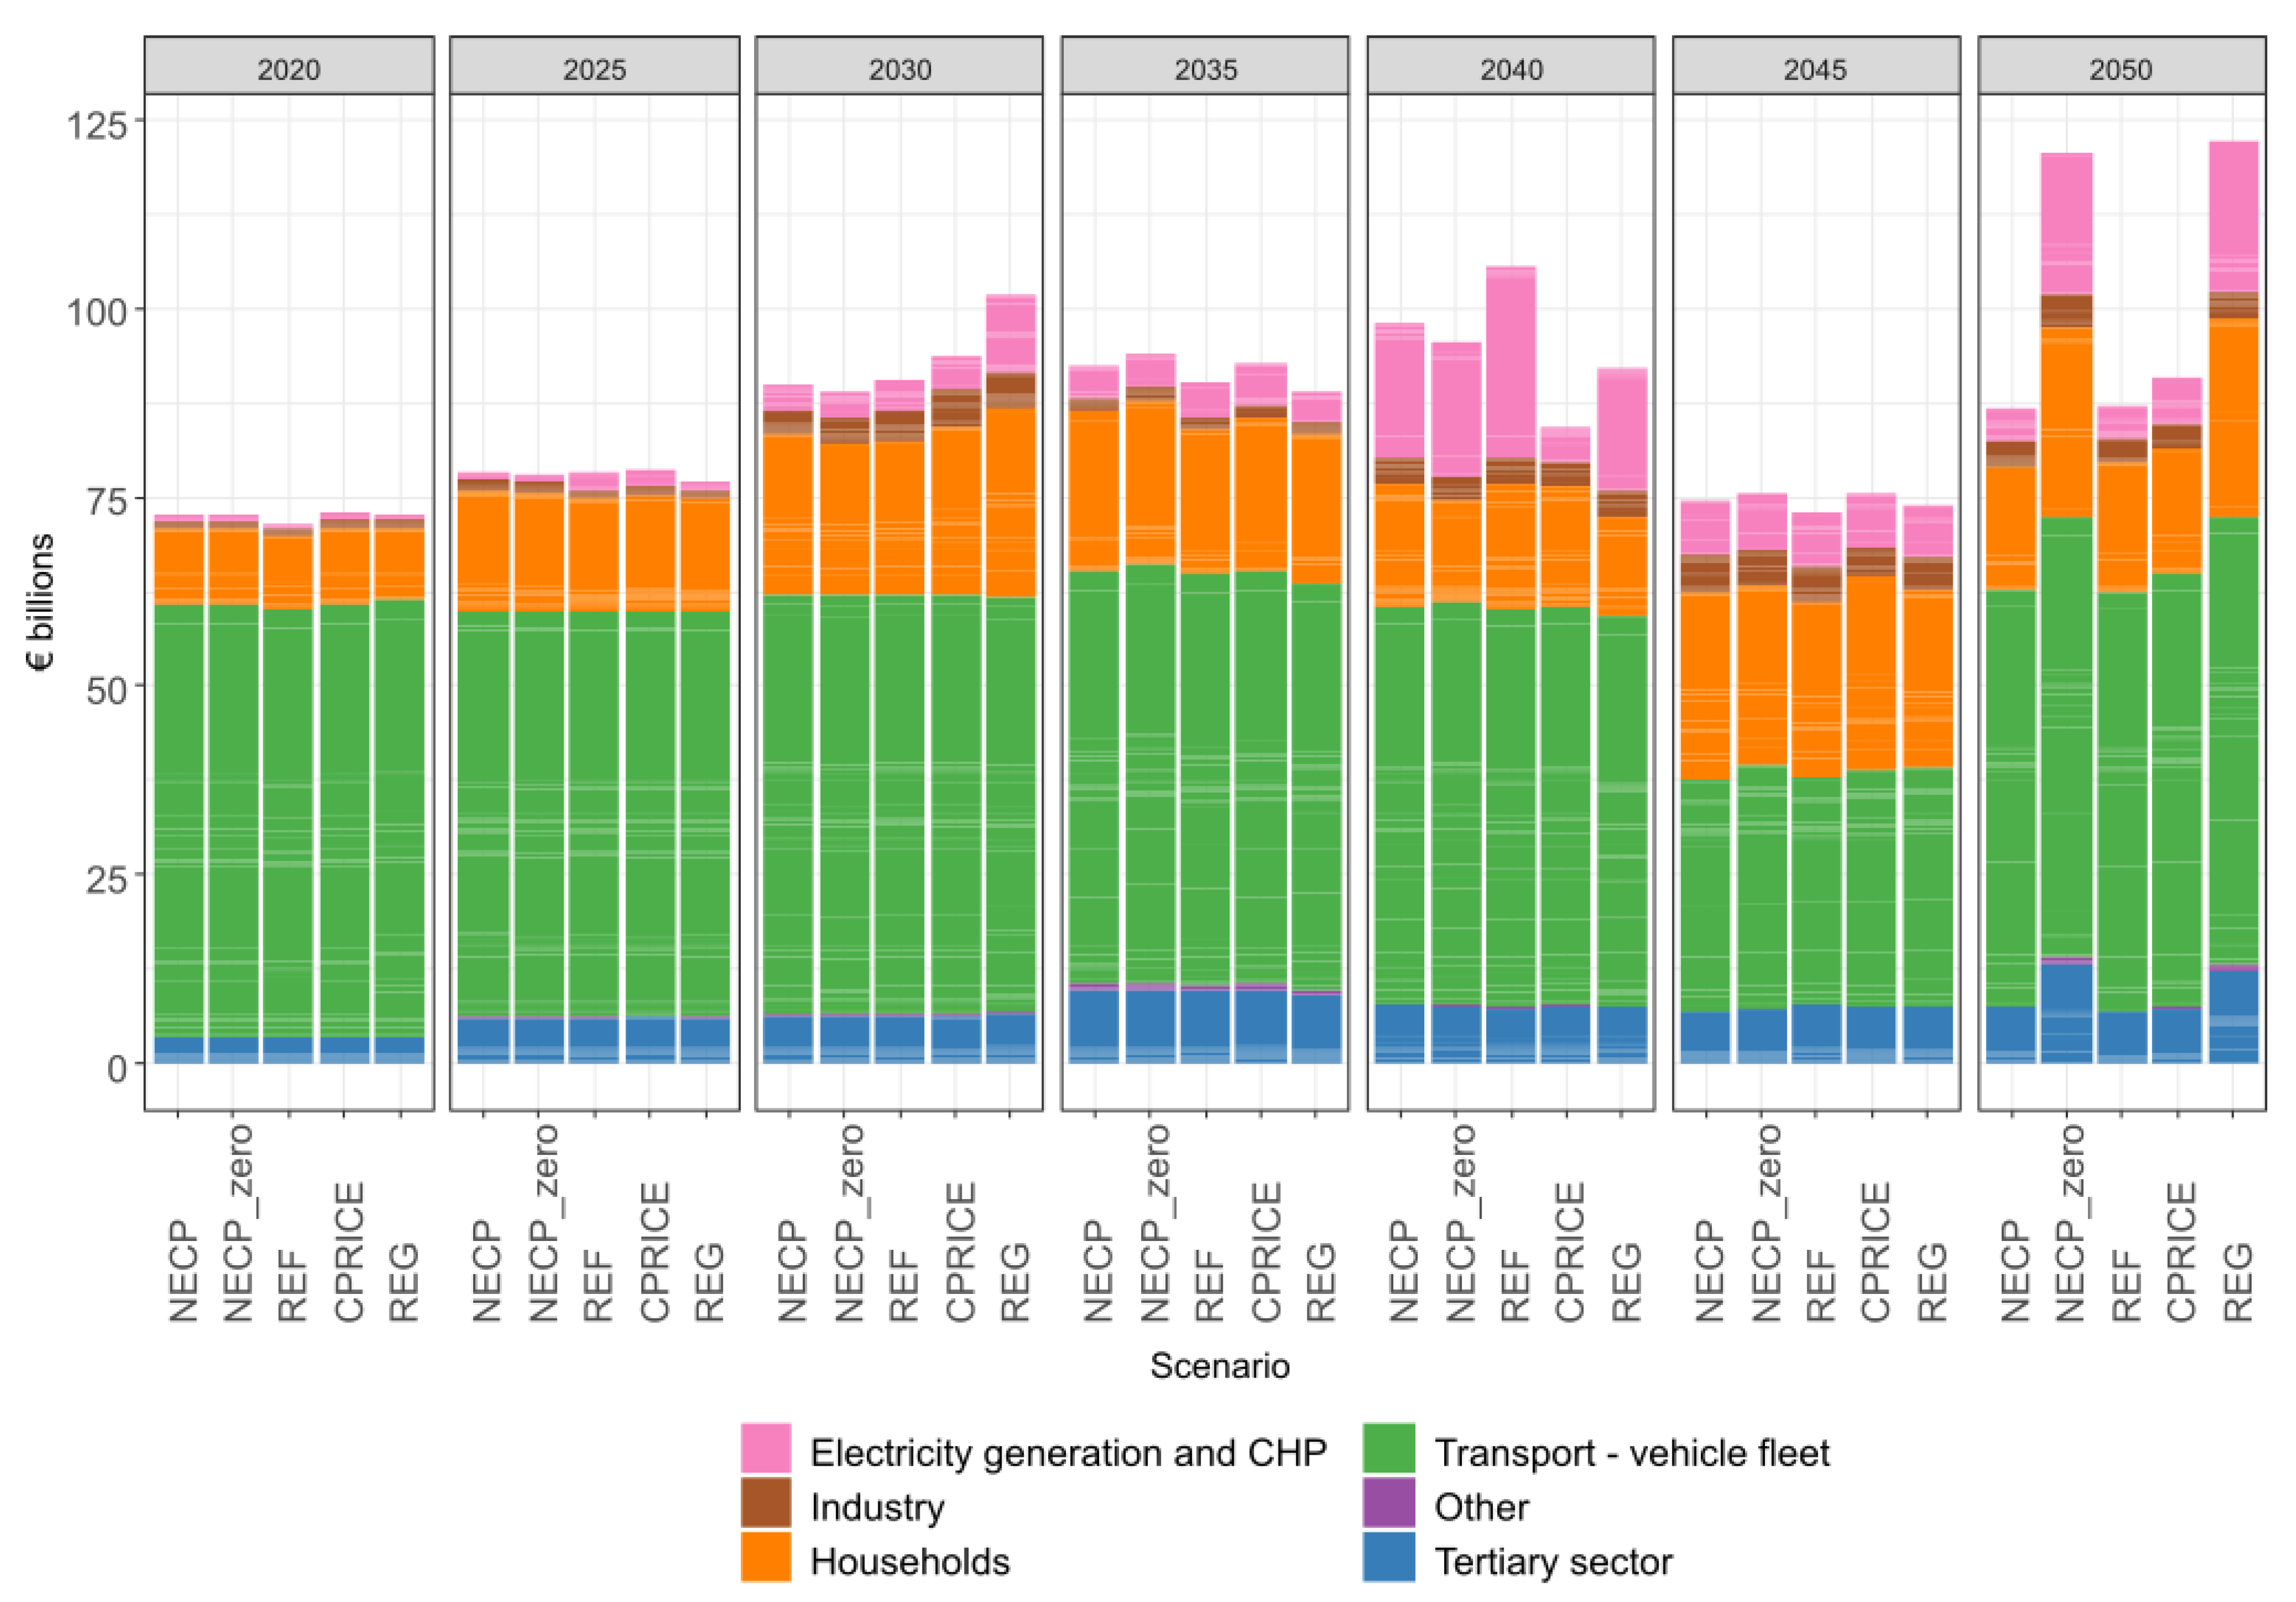
4.5. Share of Renewable Energy Sources

Renewable energy sources (RESs) make an increasing contribution to meeting energy needs in all scenarios. Table 9 shows the share of RESs in final energy consumption (RES) and electricity generation (RES-E). In 2030, the share of RESs in final energy consumption varies across scenarios from 21 (REF) to 25% (REG), and in 2050 from 39 (REF) to 49% (NECP_zero). Compared to today, the use of ambient energy in heat pumps, solar energy and, after 2040, geothermal and wind energy, increases in particular. The share of RESs in electricity generation ranges from 22.6% (REF) to 31.6% (REG) in 2030 and from 38% (REG) to 46.6% (NECP) in 2050. The second smallest electricity generation in the NECP scenario (after CPRICE) increases the RES-E share in NECP.

4.6. Cost

The investment costs of the whole system are on an increasing trend and are the most significant in the total cost structure of the whole energy system (including transport, industry, households, etc.) for all scenarios. Figure 9 shows the overnight investment costs by sector, always aggregated over a 5-year period (e.g., “2030” covers the period 2028–2032), and Figure 10 shows their differences from the NECP scenario, which serves as a reference scenario.
Road vehicles account for the largest share of investment costs. The drop in investment costs in road vehicles in 2045 is mainly due to the purchase of hydrogen vehicles in 2040 and partly due to some discrepancy in transport module, where detailed assumptions about available technologies end in 2040. This discrepancy is common to all scenarios and thus does not affect the assessment of the impacts of individual policies. All costs are the same as 2020 prices, excluding VAT.
It should be emphasized that, given the age of most of the technological units in the Czech Republic and the expected development of emission allowance prices, significant investments in new energy sources and energy savings will be necessary in the coming decades, regardless of the 2050 emission targets. Other significant investments are triggered by the natural renewal of technologies, e.g., the vehicle fleet, again regardless of emission targets. These (natural) investment costs (which would occur anyway) are quantified in the NECP scenario, which is the reference scenario in this respect.
In the NECP scenario, over the monitored period from 2018 to 2052, the cumulative investment costs in road vehicles—encompassing fleet replacement and partial transition to electromobility—amount to EUR 359 billion (i.e., 61% of the total cumulative investment cost and on average EUR 10 billion per year); in households, the cumulative investment costs amount to EUR 126 billion (i.e., EUR 4 billion per year on average), in the tertiary sector EUR 48 billion (i.e., EUR 1.4 billion per year on average) and in the electricity and CHP sector EUR 39 billion (i.e., EUR 1.1 billion per year on average), and industrial investments related to energy processes or energy management amount to EUR 19 billion (i.e., EUR 0.5 billion per year on average). The total cumulative investment costs over 35 years in the NECP reference scenario amount to a total of EUR 591 billion (EUR 17 billion on average per year).
In terms of dynamics, investment in the energy sector for electricity and heat generation and in households grow the most over time (see Figure 11). Newly installed nuclear units in 2040 in all scenarios (exogenous assumption) except CPRICE increase the investment in electricity and heat generation by EUR 13 billion (NECP_zero, NECP, REG) and EUR 20 billion (REF). In the NECP scenario, investment in new nuclear power plants accounts for one-third of all investment in the electricity and heat generation sector over the whole period.
In the NECP_zero and REG scenarios, which target GHG emission neutrality, the investment costs in electricity and heat generation, households and the tertiary sector increase significantly after 2045. In the last period between 2048 and 2052, investment costs in the electricity and CHP sector are EUR 15 billion (+335%, i.e., EUR 3 billion per year on average) higher in NECP_zero than in the NECP scenario. In the tertiary sector, including public institutions, investment costs are EUR 6 billion (+75%, i.e., EUR 1.1 billion per year on average) higher in this period.
In REG, investment costs in the electricity and CHP sector are EUR 16 billion (+365%, i.e., EUR 3.2 billion per year on average) higher than in the NECP scenario over the period 2048–2052. In the tertiary sector, including public institutions, investment costs are EUR 5 billion (+63%, i.e., EUR 1 billion per year on average) higher in this period than in the NECP scenario.
For comparison, the gross fixed capital formation of the whole Czech economy was EUR 57 billion in 2020 [50], and the annual average of induced investment for the NECP reference scenario is around EUR 17 billion [50]. For the REG scenario in the period 2048 to 2050, in which the average annual additional investment costs are not higher, they represent around 13% of the total gross fixed capital formation of the pandemic year 2020. In this comparison, the average annual additional investment in the electricity and CHP sector represents less than 6% of the total gross fixed capital formation in 2020.
The CPRICE scenario has the lowest total investment costs over the whole period, with the largest decreases in investment in electricity generation and CHP (no new nuclear units plus net electricity imports) compared to the other scenarios, while investment mainly in households and fleet renewal is higher than in the NECP and REF scenarios, which also do not have a 2050 emissions target.
Annualized costs spread the investment costs over time according to the expected lifetime of the investment. In addition to the annualized investment, the energy (fuel) costs, operating costs and the cost of emission allowances are added to the total annualized costs.
Investments before 2020 are not quantified in the model, so energy costs are higher than annualized investment costs until 2025, after which annualized investment costs have the largest share of total annualized costs and account for more than half of total annualized costs in 2050.
Energy costs do not rise significantly over time. The cost of emission allowances (EUAs) differs the most between scenarios. The CPRICE scenario has the highest projected cost of an emission allowance and extends the emission allowance system to transport and buildings from 2030 onwards; therefore, it has the highest cost of acquiring EUAs.
Annualized investment support includes support from envisaged subsidy programs. We assume a total volume of investment support for energy savings and new sources of heat and electricity in households and enterprises in the aggregate amount of 20 billion. A previous study on the development of renewable sources in Czechia up to 2030 [23], however, showed that even the scenario with the originally planned volume of RES support from the Modernisation Fund of EUR 2.8 billion does not lead to a greater development of RESs than that foreseen in the National Plan.
Figure 12 and Figure 13 show the absolute level of annualized costs and their difference from the NECP scenario.
Compared to the NECP scenario, the increased annualized investment, variable and fixed costs (and in the case of the CPRICE scenario also the cost of EUA emission allowances) are offset by at least two-thirds by lower energy costs in all scenarios. Energy costs are lower due to lower assumed fossil fuel prices and lower energy consumption compared to the NECP scenario.

4.7. Composition of the Vehicle Fleet

The composition of the vehicle fleet does not differ significantly between the scenarios, given the slow pace of its renewal. In 2030, there is a clear presence of battery electric vehicles (BEVs), which gradually become the dominant powertrain in passenger cars (Figure 14). Hydrogen propulsion is also represented from 2040 onwards but does not grow significantly in the following years. Still, the number of ICE cars keeps growing in all scenarios until 2035, after which they are displaced mainly by BEVs.
For other vehicles, the largest differences between scenarios are seen in the medium and heavy goods vehicles and bus categories. In the NECP_zero and REG scenarios, hydrogen buses account for about 15% of the total number of buses in 2050. Emission trading extension to the transport sector (CPRICE) or a strict emission target (NECP_zero and REG) leads to a higher share of electric vehicles in the medium goods vehicles category at the expense of hybrids (Figure 15). For the same reasons, hydrogen vehicles are more prominent in the CPRICE, NECP_zero and REG scenarios in 2050.

5. Discussion

Our modeling shows that achieving a 55% reduction in total GHG emissions by 2030 is realistic for a small open economy such as that of Czechia, mainly due to emission reductions in the EU ETS sectors. Only the NECP and NECP_zero scenarios fail to meet the 2030 target due to positive GHG emissions from LULUCF. However, based on the results of other scenarios and other studies, higher prices for EUAs or fossil fuels—which Europe has been facing since the post-COVID recovery [51]—might lead to further GHG emissions reduction. On the other hand, the pace of GHG emission reductions in the non-ETS sectors is slow in all scenarios, which is also due to the increasing demand for energy services. In 2030, GHG emissions in the ESR sectors are reduced by 15 (REG) to 22% (NECP and NECP_zero) compared to 2005. In contrast, climate neutrality is not achieved in any scenario by 2050, and 10 Mt CO2ek remains in the NECP_zero and REG scenarios even when accounting for emission sinks from LULUCF and CCS. There are several reasons for this, primarily stemming from modeling assumptions. First, all scenarios assume national self-sufficiency in renewables, hydrogen production and electricity generation, and the modeling results clearly show how restricting these assumptions are, especially for the decarbonization of industry. Second, two sectors with non-negligible GHG emissions, agriculture and waste, are not directly modeled and the emission trajectories used for them are not in line with ambitious climate policies that will strive for deeper uptake of circularity principles and waste hierarchy, progressive uptake of GHG abatement practices in livestock and farming practices as well as profound dietary changes in the population. Third, the imposed maximum potentials of solar and wind are rather conservative, and can be overcome with the deployment of more advanced technologies and better coordination. Fourth, the assumptions about the costs of emissions allowances and fossil fuels represent an outlook prior to the Russian aggression on Ukraine. Everything that follows, including full or partial embargoes on imports of coal, oil and gas from Russia and a large shift to LNG imports, will likely have a lasting effect on energy prices, energy policies and consequently entire energy systems.
Importantly, even under rather restrictive assumptions about self-sufficiency and the maximal potentials of renewable energy sources, these are projected to make an increasing contribution to meeting energy needs in all scenarios. The share of RESs in final energy consumption rises to 21–25% by 2030 and to 39–49% by 2050. Compared to today, the use of ambient energy in heat pumps, solar energy and, after 2040, geothermal and wind energy increases in particular. It is worth noting that solar energy deployment is constrained by the assumed maximum annual installation of 1 GWe of PV, with this limit being reached in one or two five-year periods between 2025 and 2040 in all the scenarios. The RES share predicted for Czechia in European Commission’s REF2020 scenario and the three core policy scenarios presented along with Fit for 55 impact assessment [2] is broadly comparable to our results. In the REF2020 scenario, the share of RESs in gross final energy consumption is predicted to increase to 22.6% in 2030 and 32.1% in 2050. In core policy scenarios, the RES share in 2030 increases to 27.9%, 28.5% and 31.3% in MIX-CP, MIX and REG scenarios, respectively. The results of less ambitious scenarios for 2030 from older Czech studies [18,21,23] are comparable to NECP and NECP_zero results in 2030; the results of the most ambitious [19,22,23] are comparable to the CPRICE and REG scenarios in 2030.
We also show that the costs of decarbonization will be substantial, but there will also be savings, some of which we have estimated, and vast benefits from climate change mitigation that are not reflected in the analysis. Savings and energy efficiency improvements are crucial to achieving emission targets, and among other measures, the extension of the ETS to buildings and road transport seems particularly relevant. A clear downward trend in primary energy consumption is portrayed in all scenarios modeled, with a 24–30% decrease in 2050 compared to 2015, with a slightly more moderate decrease in final energy consumption, being 12.5 to 20% lower in 2050 than in 2015. In this respect, the REF2020 scenario predicts a 23% reduction in primary energy consumption by 2030 and beyond, while core policy scenarios predict 28%, 30% and 30% reductions by 2030 in the MIX-CP, MIX and REG scenarios, respectively. Final energy consumption is predicted to decline by 10% by 2030 and 13% by 2050 in REF2020 scenario, and by 14%, 16% and 16% in the MIX-CP, MIX and REG scenarios, respectively.
The huge volume of required investment costs is partly concealed by the fact that the bulk of the investment goes into the renewal of the road vehicle fleet, which is largely routine. This can be seen in Figure 10, where the difference against a baseline scenario is portrayed. The other single investment item is the new nuclear power plant with estimated overnight costs of EUR 13 or 20 billion depending on installed capacity. This roughly corresponds to one-third of all investment in the electricity and heat generation sector in the baseline (NECP) scenario, and when the decision on the investment is left to the cost optimization algorithm, no new nuclear power plant is installed (CPRICE scenario), and the import of electricity increases to almost 20%.

6. Conclusions

The paper applies the energy optimization model TIMES-CZ to analyze Czechia’s ability to meet the climate targets by 2030 and 2050. The TIMES-CZ model covers the whole energy balance of Czechia, including power, heat, industry and the residential sector, and a vehicle module accounting for flow–stock. We define a baseline scenario (NECP) derived from the National Energy and Climate Plan and three policy scenarios (CPRICE, REF, REG) to assess the impacts of the extension of the EU ETS to buildings and transport (EU ETS 2) and the coal phase-out on the Czech energy system. The REG scenario aims at approaching climate neutrality in 2050. In addition, the NECP_zero scenario does not assess the impacts of EU ETS 2 or coal phase-out but searches for the optimal path to achieving climate neutrality in 2050.
Our results show that achieving a 55% reduction in total GHG emissions by 2030 is realistic even in Czechia. Only the NECP and NECP_zero scenarios, which assume pre-COVID prices for EUAs and fossil fuels, fail to meet the 2030 target due to positive GHG emissions from LULUCF. In contrast, climate neutrality is not achieved in any scenario by 2050, and 10 Mt CO2ek remains in the NECP_zero and REG scenarios even when accounting for emission sinks from LULUCF and CCS.
Emphasizing energy efficiency is one of the key measures for successful decarbonization. NECP_zero, the most ambitious scenario, reduces final energy consumption by only 20% compared to the 2015 levels and fails to meet carbon neutrality by 2050.
However, the scenario assumptions and model limitations should be considered in the interpretation of the results. Scaling up green hydrogen production in the EU and imports to the EU [52] would enable us to relax our conservative assumption about Czechia’s self-sufficiency in hydrogen production. This would allow a deeper decarbonization of the metallurgy and chemical industry.
From an investors’ point of view, the presented results should be taken with a grain of salt. The TIMES-CZ model does not take into account the investment risks in addition to differentiating the discount rate sector and technology type (from 7 up to 12%) to calculate the net present value of the cost and revenue stream for the respective technologies. It does not consider the predictability of national, regional and local policies, the stringency of different state aid regimes or other political influences that may affect investment decisions, the length of approval by public authorities or public acceptability. One can be wary in this respect based on the previous de facto dismantling of the feed-in-tariff scheme for PV in Czechia in several steps between 2010 and 2014 [53].
The cumulative capital cost of the baseline (NECP) scenario is EUR 592 billion, but the largest difference in the cumulative capital cost from the NECP scenario is 6% or EUR 36 billion. At the same time, Czechia has a tremendous opportunity to use the substantial financial resources available for climate policies from EU funds. It is estimated that the key funds—European Structural and Investment Funds, Just Transition Fund, Recovery and Resilience Facility, Modernization Fund, Innovation Fund and the newly proposed Social Climate Fund—will provide around CZK 450–800 billion (approx. EUR 18–32 billion) by 2030 [54], and more funding in the subsequent Multiannual Financial Framework, to support a rapid but socially just transition to climate neutrality in Czechia.

Author Contributions

Conceptualization, L.R., V.M. and M.Š.; methodology, L.R.; software, L.R.; validation, L.R., V.M. and M.Š.; formal analysis, L.R.; investigation, L.R., V.M. and M.Š.; resources, L.R., V.M. and M.Š.; data curation, L.R. and V.M.; writing—original draft preparation, L.R. and V.M.; writing—review and editing, L.R., V.M. and M.Š.; visualization, L.R. and V.M.; supervision, L.R. and M.Š.; project administration, L.R. and M.Š.; funding acquisition, L.R. and M.Š. All authors have read and agreed to the published version of the manuscript.

Funding

This research was funded by the Technology Agency of the Czech Republic under the THÉTA Programme, grant number TK01010119: “Integrated models for regulatory impact analysis and simulation of long-term scenarios of energy sector development” (RegSim), and The APC was waived.

Data Availability Statement

Not applicable.

Conflicts of Interest

The authors declare no conflict of interest. The funders had no role in the design of the study; in the collection, analyses or interpretation of data; in the writing of the manuscript; or in the decision to publish the results.

References

  1. EC. Commission Staff Working Document Impact Assessment Accompanying the Document Communication from the Commission to the European Parliament, the Council, the European Economic and Social Committee and the Committee of the Regions Stepping up Europe’s 2030 Climate Ambition—Investing in a Climate-Neutral Future for the Benefit of Our People; European Commission: Brussels, Belgium, 2020. [Google Scholar]
  2. Directorate-General for Climate Action (European Commission). Policy Scenarios for Delivering the European Green Deal; European Commission: Luxembourg, 2021. [Google Scholar]
  3. Pietzcker, R.C.; Osorio, S.; Rodrigues, R. Tightening EU ETS Targets in Line with the European Green Deal: Impacts on the Decarbonization of the EU Power Sector. Appl. Energy 2021, 293, 116914. [Google Scholar] [CrossRef]
  4. Kattelmann, F.; Siegle, J.; Cunha Montenegro, R.; Sehn, V.; Blesl, M.; Fahl, U. How to Reach the New Green Deal Targets: Analysing the Necessary Burden Sharing within the EU Using a Multi-Model Approach. Energies 2021, 14, 7971. [Google Scholar] [CrossRef]
  5. Vinck, N. The Fit for 55 Package and the European Climate Ambitions an Assessment of Their Impacts on the European Metallurgical Silicon Industry. In Proceedings of the Silicon for the Chemical & Solar Industry XVI, Trondheim, Norway, 14–16 June 2022. [Google Scholar] [CrossRef]
  6. Temursho, U.; Weitzel, M.; Vandyck, T. Distributional Impacts of Reaching Ambitious Near-Term Climate Targets across Households with Heterogeneous Consumption Patterns: A Quantitative Macro-Micro Assessment for the 2030 Climate Target Plan of the EU Green Deal; JRC Research Reports JRC121765; Joint Research Centre: Seville, Spain, 2020. [Google Scholar]
  7. Ovaere, M.; Proost, S. Cost-Effective Reduction of Fossil Energy Use in the European Transport Sector: An Assessment of the Fit for 55 Package. Energy Policy 2022, 168, 113085. [Google Scholar] [CrossRef]
  8. Oxera. Assessment of the Impact of the Fit for 55 Policies on Airports; Oxera: Oxford, UK, 2022; 93p. [Google Scholar]
  9. Mallouppas, G.; Yfantis, E.A.; Ktoris, A.; Ioannou, C. Methodology to Assess the Technoeconomic Impacts of the EU Fit for 55 Legislation Package in Relation to Shipping. J. Mar. Sci. Eng. 2022, 10, 1006. [Google Scholar] [CrossRef]
  10. García Vaquero, M.; Sánchez-Bayón, A.; Lominchar, J. European Green Deal and Recovery Plan: Green Jobs, Skills and Wellbeing Economics in Spain. Energies 2021, 14, 4145. [Google Scholar] [CrossRef]
  11. Dráb, J.; Engeľ, M.; Nánásiová, K. Analýza Vplyvov Balíka Fit for 55; Inštitút Environmentálnej Politiky: Bratislava, Slovakia, 2022; 119p. [Google Scholar]
  12. Ščasný, M.; Ang, B.W.; Rečka, L. Decomposition Analysis of Air Pollutants during the Transition and Post-Transition Periods in the Czech Republic. Renew. Sustain. Energy Rev. 2021, 145, 111137. [Google Scholar] [CrossRef]
  13. Eurostat. Gross Value Added and Income by A*10 Industry Breakdowns. Available online: https://ec.europa.eu/eurostat/databrowser/view/NAMA_10_A10/default/table?lang=en&category=na10.nama10.nama_10_bbr (accessed on 16 December 2022).
  14. Tiseo, I. EU: GHG Emissions per Capita by Country 2020. Available online: https://www.statista.com/statistics/986392/co2-emissions-per-cap-by-country-eu/ (accessed on 16 December 2022).
  15. Alberini, A.; Bigano, A.; Ščasný, M.; Zvěřinová, I. Preferences for Energy Efficiency vs. Renewables: What Is the Willingness to Pay to Reduce CO2 Emissions? Ecol. Econ. 2018, 144, 171–185. [Google Scholar] [CrossRef]
  16. Ščasný, M.; Zvěřinová, I.; Czajkowski, M.; Kyselá, E.; Zagórska, K. Public Acceptability of Climate Change Mitigation Policies: A Discrete Choice Experiment. Clim. Policy 2017, 17, S111–S130. [Google Scholar] [CrossRef] [Green Version]
  17. Lehotský, L.; Černoch, F.; Osička, J.; Ocelík, P. When Climate Change Is Missing: Media Discourse on Coal Mining in the Czech Republic. Energy Policy 2019, 129, 774–786. [Google Scholar] [CrossRef]
  18. Hanzlík, V.; Javůrek, V.; Smeets, B.; Svoboda, D. Klimaticky Neutrální Česko—Cesty k Dekarbonizaci Ekonomiky; McKinsey & Company: Prague, Czech Republic, 2020; 70p. [Google Scholar]
  19. Rosslowe, C. Coal-Free Czechia 2030; Ember: London, UK, 2020; 45p, Available online: https://ember-climate.org/insights/research/coal-free-czechia-2030/#supporting-material-downloads (accessed on 2 February 2023).
  20. Schierhorn, P.-P. Czech Power Grid without Electricity from Coal by 2030: Possibilities for Integration of Renewable Resources and Transition into a System Based on Decentralized Sources; Energynautics: Darmstadt, Germany, 2018; 50p. [Google Scholar]
  21. Poseidon, K. Decarbonization of Eastern Europe’s Energy Mix Key to Higher EU Climate Goals; BloombergNEF: New York, NY, USA, 2020; 21p, Available online: https://assets.bbhub.io/professional/sites/24/BloombergNEF-Decarbonization-of-Eastern-Europe%E2%80%99s-Energy-Mix-Key-to-Higher-EU-Climate-Goals-Nov-2020.pdf (accessed on 2 February 2023).
  22. Deloitte Advisory. Rozvoj Obnovitelných Zdrojů do Roku 2030. Analýza Zpracována pro Svaz Moderní Energetiky; Deloitte: Prague, Czech Republic, 2020. [Google Scholar]
  23. Rečka, L.; Ščasný, M.; Máca, V.; Kopečná, V. Rozvoj Obnovitelných Zdrojů v ČR Do Roku 2030; Charles University Environment Centre: Prague, Czech Republic, 2021. [Google Scholar]
  24. Deloitte. Studie Dopadů Balíčku Fit for 55 na Hospodářství ČR; Deloitte: Prague, Czech Republic, 2022; 166p. [Google Scholar]
  25. Rečka, L.; Ščasný, M. Brown Coal and Nuclear Energy Deployment: Effects on Fuel-Mix, Carbon Targets, and External Costs in the Czech Republic up to 2050. Fuel 2018, 216, 494–502. [Google Scholar] [CrossRef]
  26. Rečka, L.; Ščasný, M. Impacts of Reclassified Brown Coal Reserves on the Energy System and Deep Decarbonisation Target in the Czech Republic. Energies 2017, 10, 1947. [Google Scholar] [CrossRef] [Green Version]
  27. MIT. The National Energy and Climate Plan of the Czech Republic; MIT: Cambridge, MA, USA, 2019. [Google Scholar]
  28. Directorate-General for Climate Action (European Commission); Directorate-General for Energy (European Commission); Directorate-General for Mobility and Transport (European Commission); De Vita, A.; Capros, P.; Paroussos, L.; Fragkiadakis, K.; Karkatsoulis, P.; Höglund-Isaksson, L.; Winiwarter, W.; et al. EU Reference Scenario 2020: Energy, Transport and GHG Emissions: Trends to 2050; Publications Office of the European Union: Luxembourg, 2021; ISBN 978-92-76-39356-6. [Google Scholar]
  29. IEA-ETSAP. Times. Available online: https://iea-etsap.org/index.php/etsap-tools/model-generators/times (accessed on 16 December 2022).
  30. Loulou, R.; Lehtilä, A.; Kanudia, A.; Remme, U.; Goldstein, G. Documentation for the TIMES Model Part II; Energy Technology Systems Analysis Programme: Washington, DC, USA, 2020; Available online: https://iea-etsap.org/docs/Documentation_for_the_TIMES_Model-PartII.pdf (accessed on 16 December 2022).
  31. Capros, P.; Paroussos, L.; Fragkos, P.; Tsani, S.; Boitier, B.; Wagner, F.; Busch, S.; Resch, G.; Blesl, M.; Bollen, J. Description of Models and Scenarios Used to Assess European Decarbonisation Pathways. Energy Strategy Rev. 2014, 2, 220–230. [Google Scholar] [CrossRef]
  32. CHMI. Emission Balance of the Czech Republic. Available online: https://www.chmi.cz/files/portal/docs/uoco/oez/emisnibilance_CZ.html (accessed on 31 January 2023).
  33. European Parliament. European Council Directive 2003/87/EC of the European Parliament and of the Council. Available online: https://eur-lex.europa.eu/legal-content/EN/TXT/HTML/?uri=CELEX:02003L0087-20230121&from=EN (accessed on 17 February 2023).
  34. Emisia Copert. Available online: https://www.emisia.com/utilities/copert/ (accessed on 16 December 2022).
  35. Nijs, W.; Ruiz, P. 01_JRC-EU-TIMES Full model. European Commission, Joint Research Centre (JRC). 2019. Available online: http://data.europa.eu/89h/8141a398-41a8-42fa-81a4-5b825a51761b (accessed on 17 February 2023).
  36. Schröder, A.; Kunz, F.; Meiss, J.; Mendelevitch, R.; Hirschhausen, V.C. Current and Prospective Costs of Electricity Generation until 2050; Deutsches Institut für Wirtschaftsforschung: Berlin, Germany, 2013. [Google Scholar]
  37. IEA. World Energy Outlook 2020; IEA: Paris, France, 2020. [Google Scholar]
  38. CHMI. Integrated Reporting on Greenhouse Gas Policies and Measures and on Projections in the Czech Republic; Czech Hydrometeorological Institute: Prague, Czech Republic, 2021. [Google Scholar]
  39. Lucas, P.L.; van Vuuren, D.P.; Olivier, J.G.J.; den Elzen, M.G.J. Long-Term Reduction Potential of Non-CO2 Greenhouse Gases. Environ. Sci. Policy 2007, 10, 85–103. [Google Scholar] [CrossRef] [Green Version]
  40. MoE. National Inventory Report (NIR); Ministry of the Environment of the Czech Republic: Prague, Czech Republic, 2021. [Google Scholar]
  41. TACR. Modelling of Sustainable Forestry Scenarios Contributing to Climate Change Adaptation—Examining the Impacts on Energy Sector and GHG Emissions in the Czech Republic and Public Acceptability of These Scenarios by Czech Population; Technology Agency of the Czech Republic. Available online: https://starfos.tacr.cz/cs/project/TL02000440 (accessed on 16 December 2022).
  42. MIT. State Energy Policy [Státní Energetická Koncepce]; Ministry of Industry and Trade: Prague, Czech Republic, 2015. [Google Scholar]
  43. MIT. The Czech Republic’s Hydrogen Strategy; Ministry of Industry and Trade: Prague, Czech Republic, 2021. [Google Scholar]
  44. Messad, P. France, Germany Aim for “Common Roadmap” on Clean Hydrogen. Available online: https://www.euractiv.com/section/energy/news/france-germany-aim-for-common-roadmap-on-decarbonised-hydrogen/ (accessed on 2 February 2023).
  45. IEA; CIEP. Hydrogen in North-Western Europe; International Energy Agency: Paris, France; Clingendael International Energy Programme: The Hague, The Netherlands, 2021. [Google Scholar]
  46. Timmerberg, S.; Kaltschmitt, M. Hydrogen from Renewables: Supply from North Africa to Central Europe as Blend in Existing Pipelines—Potentials and Costs. Appl. Energy 2019, 237, 795–809. [Google Scholar] [CrossRef]
  47. Lux, B.; Pfluger, B. A Supply Curve of Electricity-Based Hydrogen in a Decarbonized European Energy System in 2050. Appl. Energy 2020, 269, 115011. [Google Scholar] [CrossRef]
  48. ERU. Annual Report on Electricity System Operation for 2020; ERU: Jihlava, Czech Republic, 2020. [Google Scholar]
  49. EEA. EU Emissions Trading System (ETS) Data Viewer—European Environment Agency. Available online: https://www.eea.europa.eu/data-and-maps/dashboards/emissions-trading-viewer-1 (accessed on 9 January 2023).
  50. CZSO. GDP by the Expenditure Approach. Available online: https://apl.czso.cz/pll/rocenka/rocenkavyber.makroek_vydaj (accessed on 9 January 2023).
  51. Kotek, P.; Selei, A.; Takácsné Tóth, B.; Felsmann, B. What Can the EU Do to Address the High Natural Gas Prices? Energy Policy 2023, 173, 113312. [Google Scholar] [CrossRef]
  52. Mills, R. Maximizing Europe’s Green Hydrogen Supply. Available online: https://rmi.org/maximizing-europes-green-hydrogen-supply/ (accessed on 1 February 2023).
  53. Gürtler, K.; Postpischil, R.; Quitzow, R. The Dismantling of Renewable Energy Policies: The Cases of Spain and the Czech Republic. Energy Policy 2019, 133, 110881. [Google Scholar] [CrossRef]
  54. Fakta o Klimatu. Finance z Fondů EU na Klimatická Opatření v ČR. Available online: https://faktaoklimatu.cz/infografiky/fondy-eu (accessed on 25 January 2023).
Figure 1. Consumption of primary energy sources.
Energies 16 02152 g001
Figure 2. Energy input for heat and power generation.
Energies 16 02152 g002
Figure 3. New installed electricity generation capacity—5-year increments.
Energies 16 02152 g003
Figure 4. Total final energy consumption.
Energies 16 02152 g004
Figure 5. Final energy—selected energy carriers.
Energies 16 02152 g005
Figure 6. Emissions of GHG from ETS and non-ETS sectors (without GH4 and NO2 from EU ETS and without LULUCF).
Energies 16 02152 g006
Figure 7. Emissions of GHG by sector (without LULUCF).
Energies 16 02152 g007
Figure 8. Carbon capture by fuel or industry (left panel) and by sector (right panel).
Energies 16 02152 g008
Figure 9. Investment cost by sector (sum over 5-year period, EUR 2020, without VAT).
Energies 16 02152 g009
Figure 10. Difference in investment costs compared to NECP scenario (sum over 5-year period, EUR 2020, without VAT).
Energies 16 02152 g010
Figure 11. Investment cost—heat and power generation (sum over 5-year period, EUR 2020, without VAT).
Energies 16 02152 g011
Figure 12. Annualized system cost (EUR 2020, without VAT).
Energies 16 02152 g012
Figure 13. Annualized system cost—difference from NECP.
Energies 16 02152 g013
Figure 14. Structure of passenger car fleet by powertrain.
Energies 16 02152 g014
Figure 15. Structure of freight road vehicle fleet by categories and powertrain.
Energies 16 02152 g015
Table 1. Estimated investment cost of PV and wind turbines (EUR 2015/kWp).
2020202520302035204020452050
PV residential139811761103915760630523
PV large770649601499414343285
PV industrial1015852793658546453376
Wind turbine 1917186418121776120811961184
Source: Alliance for Energy Self-Reliance, own adaptations based on https://www.pv-magazine.com/module-price-index/ (accessed on 5 March 2021) and IEA World Energy Outlook—World Energy Model 2020 [37].
Table 2. Exogenous assumptions about the evolution of GHG emissions from agriculture, waste, and F-gas and LULUCF [kt CO2ek].
20152020202520302035204020452050
Agriculture84838639912496829899989998999899
Waste and F-gases88379557925571814774323021191605
LULUCF−664117,82361272315−4366−6880−6454−6105
Note: GHG emissions from agriculture are taken from the emission projection by Czech Hydrometeorological Institute [38], assuming a constant level from 2040 onwards. This assumption on GHG emissions from agriculture is very conservative. The EC REF2020 scenario [28] and many studies (e.g., [4,39]) assume that the number of livestock and thus GHG emissions will be reduced by about half by 2050 due to lifestyle changes and better farming practices. Assumptions of GHG emissions from waste and F-gases combine historical values from emission inventories [40] and their trends from the EC REF2020 scenario. The GHG emissions from the LULUCF sector and forest biomass potentials are taken from the Red scenario projection of the Forests-ADAPT project [41].
Table 3. Net electricity imports (TWh).
Reference2020202520302035204020452050
National Plan [27]−10.2 *−8.4−8.4−7.4−4.6−2.90.0
EC REF2020−10.2 *−1.18.12.2−1.6−1.8−1.6
Note: * The value for 2020 is adjusted according to the Annual Report on Electricity System Operation for 2020 [48].
Table 4. EUA emission allowance price (EUR 2020/t CO2).
Scenarios2020202520302035204020452050Reference
REF26.628325385127159EC REF2020
REG24.829345587129161EC REG, REF2020
NECP, NECP_zero24.8243645536070NECP 2019
CPRICE, NECP_C24.8556483115157189EC CPRICE, REF2020
Sensitivity Analysis (SA)9024.8709090909090
14024.87090100110120140
20024.880120145170185200WEO 2021 (APS, SDS)
25024.890130165205230250WEO 2021 (NZE)
Note: APS—announced pledges scenario, NZE—net-zero scenario, SDS—sustainable development scenario.
Table 5. Fossil fuel prices (EUR 2020/PJ).
Scenarios 202020252030 2035 2040 2045 2050 Reference
NECP NECP_zeroOil11.214.816.317.018.018.819.8NECP 2019
Natural gas (NCV)7.910.111.011.712.112.713.2
Black coal2.73.03.63.83.94.14.3
CPRICE REGOil7.38.010.09.39.310.08.6CTP2030
Natural gas (NCV)4.44.95.15.36.06.05.6
Black coal2.32.52.62.72.72.72.7
REFOil5.38.010.612.012.914.015.7REF2020
Natural gas (NCV)2.64.05.35.96.97.47.6
Black coal1.21.82.32.52.72.82.9
SA_200Oil5.24.94.54.13.83.43.0WEO SDS
Natural gas (NCV)3.23.23.23.33.43.43.4
Black coal1.41.51.61.61.61.61.5
SA_250Oil5.24.94.54.13.83.43.0WEO NZE
Natural gas (NCV)3.23.12.92.92.92.82.7
Black coal1.41.41.41.41.31.21.2
Table 6. Cumulative new installations of electricity generation capacities (GWe).
NECPNECP_ZeroREFCPRICEREG
Biomass0.90.70.80.70.8
Biomass CCS 0.80.10.30.8
Biogas1.21.21.01.21.1
Geothermal0.30.30.30.30.3
Hydro0.10.10.10.10.1
Nuclear1.61.62.7 1.6
Waste0.20.10.20.10.1
Other0.00.0
PV19.219.319.319.119.2
Wind3.93.93.93.93.9
Natural gas2.82.43.82.05.4
Natural gas CCS 5.20.42.26.5
Note: PV solar installations include re-installations of solar PV sources installed since 2009 at the end of their lifetime.
Table 7. GHG emission savings compared to 1990 and 2005 levels.
2020202520302035204020452050
NECP_zeroTotal GHG incl. LULUCF (savings vs. 1990)34%44%53%57%65%75%93%
non-ETS without LULUCF (saving vs. 2005)17%19%22%27%29%40%75%
CPRICETotal GHG incl. LULUCF (saving vs. 1990)38%59%66%73%78%82%86%
non-ETS without LULUCF (saving vs. 2005)17%17%21%28%34%45%55%
NECPTotal GHG incl. LULUCF (savings vs. 1990)34%44%53%57%65%74%81%
non-ETS without LULUCF (saving vs. 2005)17%19%22%27%29%39%45%
REFTotal GHG incl. LULUCF (savings vs. 1990)34%49%64%65%73%79%81%
non-ETS without LULUCF (saving vs. 2005)16%15%19%20%26%36%43%
REGTotal GHG incl. LULUCF (savings vs. 1990)34%45%62%68%73%78%93%
non-ETS without LULUCF (saving vs. 2005)17%17%15%20%24%33%75%
Table 8. GHG emission savings in EC REF2020 and comparison of the scenarios of this study with EC REF2020.
2020202520302035204020452050
REF2020ETS (kt CO2ek)56,97844,30535,35034,76725,23321,76722,753
non-ETS (kt CO2ek)55,37155,23649,33845,04341,15139,82338,780
Total GHG without LULUCF (kt CO2ek)112,34999,54184,68879,81066,38461,59061,533
LULUCF (REF2020) Globiom/G4M (kt CO2ek)4.6−4.91.6−4.14.5−2.45.1
Savings—total GHG incl. LULUCF (1990 level)42%49%56%59%66%68%68%
Savings—non-ETS without LULUCF (2005 level)16%16%25%32%38%40%41%
Difference in GHG emissions compared to REF2020 scenario
NECP_zeroTotal GHG incl. LULUCF14%8%8%5%2%−20%−78%
non-ETS without LULUCF−1%−3%5%7%14%0%−58%
CPRICETotal GHG incl. LULUCF7%−20%−22%−34%−37%−45%−56%
non-ETS without LULUCF−1%−1%5%6%6%−9%−23%
NECPTotal GHG incl. LULUCF14%8%8%5%2%−19%−41%
non-ETS without LULUCF−1%−3%4%7%13%0%−7%
REFTotal GHG incl. LULUCF13%−1%−17%−14%−20%−32%−41%
non-ETS without LULUCF0%2%8%17%19%6%−2%
REGTotal GHG incl. LULUCF14%6%−13%−22%−21%−32%−78%
non-ETS without LULUCF−1%−1%14%18%22%10%−57%
Note: REF2020 scenario results from the July 2021 PRIMES model [28]. The grey color highlights the target year of the Fit for 55 package.
Table 9. Share of renewable energy sources in final energy consumption (RES) and electricity generation (RES-E) (%).
20152020202520302035204020452050
RESNECP_zero15.516.818.823.727.529.935.448.6
CPRICE15.517.218.724.127.732.437.341.1
NECP15.516.818.724.227.331.136.140.6
REF15.515.716.121.321.927.734.138.9
REG15.516.316.725.227.629.533.147
RES-ENECP_zero14.114.116.623.426.230.840.441.5
CPRICE14.115.717.62628.832.840.445.2
NECP14.114.016.62426.431.441.346.6
REF14.113.71622.625.931.540.345.9
REG14.113.816.231.632.934.942.238.2
Note: Share of renewables according to the Eurostat’s SHARES methodology 2020 manual. Share of RESs in electricity generation (RES-E) calibrated to 2015 baseline. The calculation of the share of renewables in final consumption does not fully include self-consumption for electricity and heat production, which causes an overestimation of the RES value by about 0.5 percentage points compared to the RES share in gross final consumption according to the SHARES 2020 manual. However, this overestimation decreases as the share of RESs in electricity and heat production increases.
Disclaimer/Publisher’s Note: The statements, opinions and data contained in all publications are solely those of the individual author(s) and contributor(s) and not of MDPI and/or the editor(s). MDPI and/or the editor(s) disclaim responsibility for any injury to people or property resulting from any ideas, methods, instructions or products referred to in the content.

