Abstract
Solar-cell panels use sunlight as a source of energy to generate electricity. However, the performances of solar panels decline when they degrade, owing to defects. Some common defects in solar-cell panels include hot spots, cracking, and dust. Hence, it is important to efficiently detect defects in solar-cell panels and repair them. In this study, we propose a lightweight inception residual convolutional network (LIRNet) to detect defects in solar-cell panels. LIRNet is a neural network model that utilizes deep learning techniques. To achieve high model performance on solar panels, including high fault detection accuracy and processing speed, LIRNet draws on hierarchical learning, which is a two-phase solar-panel-defect classification method. The first phase is the data-preprocessing stage. We use the K-means clustering algorithm to refine the dataset. The second phase is the training of the model. We designed a powerful and lightweight neural network model to enhance accuracy and speed up the training time. In the experiment, LIRNet improved the accuracy by approximately 8% and performed ten times faster than EfficientNet.
1. Introduction
Solar energy can be used widely in the world—e.g., for hot water, heating, and power generation,. Solar energy is a clean alternative energy that causes no air or water emissions and poses no threats to people’s health [1]. According to the International Energy Agency, despite rising prices, solar energy still dominates renewable energy capacity additions. Despite the surging commodity prices and increasing manufacturing costs for solar energy, its capacity additions were forecast to grow by 17% in 2021. This set a new annual record of almost 160 GW. Solar photovoltaic cells account for 60% of all renewable capacity additions. Approximately 1100 GW will become operational over the forecast period in our main case, which is double the rate of the previous five years [2]. This indicates that solar energy will become increasingly important in the future. Currently, people value utilizing solar-cell panels to obtain solar energy [3]. Hence, many researchers have recently focused on solar panels. For example, take the solution—processed organic solar cells (OSCs), tandem solar cells (TSCs), and the nonfullerene-blend solar cells system. Solution-processed OSCs provide low cost and convenience, and impressive power conversion efficiencies (PCEs) [4]. TSCs made of multiple junction devices have high open-circuit voltages, tunable optical bandgaps, and low energy losses [5]. Nonfullerene-blend solar cell systems have broad absorption and semitransparency features [6]. Additionally, to assess the energy and environment impacts, lifecycle assessment studies related to these systems are constantly increasing [7]. Moreover, the absorptivity of solar-cell panels has been a critical issue recently because the lower absorption rate means the less energy created and stored. However, many factors decrease the absorptivity of solar-cell panels. In this study, we refer to these causes as solar-cell panel defects. Examples are cracking or dust on the solar panel, and hotspots on a solar panel’s diode. Hence, it necessary to design an efficient technique for detecting defects in the solar-cell panels [8].
Various approaches for detecting defects in solar-cell panels have been proposed over time. Some are classed as sensor-based defect detection methods, and others are classed as image-based defect detection methods. Approaches such as solar panel shadow detection and solar panel electrical diagnostics are sensor-based defect detection methods [9,10]. Deep learning image defect detection is a form of image-based defect detection [11]. In this study, we used a deep learning image-based method to detect defects in solar-cell panels. The biggest difference between sensor-based and image-based methods is that sensor-based detection requires a lot of both time and money to detect defects in solar panels. This is because the sensor hardware is more expensive than image-based software, and the sensor hardware needs to be implemented for longer than the deep learning software. Therefore, using deep learning techniques to recognize defects in solar-cell panels is crucial. Several approaches for detecting defects in solar-cell panels using deep learning have been proposed. The approaches include utilizing transfer learning techniques with VGG16 [12], VGG19 [13], GoogLeNet [14], ResNet18 [15], Unet [16], FPN [17], LinkNet [18], and EfficientNet [19] to detect the defects on solar-cell panels [20].
In this study, we used neural network models such as VGG16, VGG19, GoogLeNet, ResNet, and EfficientNet to detect defects in solar-cell panels. To improve the accuracy and speed performance, we designed a new neural network, the lightweight inception residual network (LIRNet), to recognize defects in solar panels. LIRNet is a low-overload convolutional neural network with a residual block and an inception module. It is a robust model. It is based on using hierarchical classification concepts to detect defects in solar panels. The main ideas have been divided into two parts, regarding the hierarchical classification concepts. The first part is the data preprocessing stage. Here, we use the clustering algorithm to combine similar clusters and guide the neural network model for better classification. The second part involves training the LIRNet model. Here, we designed a LIRNet to be trained on defects of solar-cell panels. Due to the properties of solar-cell panels, the images of solar panels in datasets are usually thermal images, and people use unmanned aerial vehicles (UAVs) to collect such datasets. As solar panels are located on the tops of buildings, using a UAV to take pictures of them is reasonable and convenient. In addition, solar panels need to be covered by sunlight to extract solar energy, so there can be severe light reflection when attempting to find defects on solar panels in normal pictures. Hence, using thermal images for solar panels is suitable for detecting defects. For the experiment, the solar-cell-panel images were all thermal images, and we used 20,000 pieces of pictures [8].
Herein, we used deep learning techniques to detect defects in solar-cell panels, such as cracking and hot spots, and then returned the detected results to the solar panels’ maintenance engineers so that they could repair them. Therefore, maintenance engineers need to directly and in real-time know the issues of solar panels through deep learning techniques. In the experiment, we focused on designing a more efficient neural network model and methods to enhance performance (i.e., accuracy and running speed). The contributions of this study are summarized below.
- We explain the detection of defects in solar panels in simple terms and focus on deep learning techniques that can be used to detect the defects. Regarding deep learning methods, we implemented the neural network models of STOA to recognize the faults and compared them in a performance evaluation. In addition, we propose a new effective neural network model, LIRNet. LIRNet’s accuracy was 89%, and its average inference time was 1.39 ms. Its throughput was 27,841 input/s, which is higher than those of other neural network models, such as EfficientNet, GoogLeNet, and ResNet.
- The primary value of LIRNet is in the data preprocessing stage, where the K-means clustering algorithm is used to improve the imbalance problem of the dataset. As similar categories will have similar characteristics, the distances between similar categories and the center of the group will be similar. After using K-means grouping, similar categories are merged. Finally, we can merge the unbalanced data of some original categories with other categories to alleviate the problem of unbalanced data. Hence, we adopted the unsupervised learning approach to modify our supervised learning model.
This paper is organized as follows: The introduction and an overview of solar energy and solar-cell panels are presented in Section 1. We have also described many approaches for detecting defects and the core methods used herein. Section 2 presents the related works on deep learning for the classification of defects and some techniques. The core methods we propose are discussed in Section 3. Here, we introduce the method’s architecture and the idea used. The experiments are presented in Section 4. We show many experiment results for our proposed method and various comparison experiments. Finally, the conclusions of the study are presented in Section 5.
2. Related Works
2.1. Deep Learning for the Classification of Defects in Solar-Cell Panels
In this study, we define a factor that reduces the absorptivity of a solar panel as a defect of solar-cell panels [21]. Approximately ten years ago, several approaches were proposed to detect defects in solar-cell panels. Some were manual detection methods, and others, automatic detection approaches. In manual detection approaches, the solar energy—electric power conversion device or the solar panel itself is observed (or both). When the conversion rate drops or damage is visible, there is a problem. In addition, some methods use optical inspection of charge-coupled devices, which are integrated circuits. A charge-coupled device’s alternating voltage allows electric charges to be transferred on the surface of the semiconductor to read or store signals and to generate electricity through the photoelectric effect components, forming a digital image. The image can be transmitted to the storage device to analyze its defects [22]. However, the above-mentioned approach took a long time to detect defects in solar panels. Therefore, some people have proposed automatic detection methods, including Bluetooth-based device detection methods [23] and automatic deep learning detection methods that use solar panel images. Deep learning methods are widely used in research. Owing to their non-contact nature and automatic operation, the problem of finding defects in solar panel is simplified. The usage time of the testing is relatively low, and the problem of the detection machine failing to detect is relatively rare [24]. For a preliminary understanding of solar panel defects, some common solar panel defects are described below [25].
- Hot spots on solar panels accelerate battery aging: When there are defects in solar panels, such as cracks and poor welding, they produce high resistance, and hot spots are formed by long-term damage, which causes scorch marks, thereby reducing the absorption efficiency of solar cells. They can eventually lead to fires [26].
- Accumulation of dust on the panel blocks solar energy absorption: When solar panels are installed on a roof at an inclined angle, the rainwater after rain accumulates on the frame of the solar panel, and dust remains on the frame after the moisture evaporates. The dust easily forms unnecessary shading that may decrease the absorption efficiency of solar energy [27].
- Cracks on solar panels reduce power output: Not all solar panel module production lines are the same, and a bad production line may cause the solar panels to be broken by any strong impact. The damaged solar panels do not conduct current, which decreases the yield of electrical energy, and the cracks may generate hot spots, resulting in defects in subsequent hot spots [28].
- Poor connections of solar cells reduces performance: Solar panels are welded into an interconnected structure when they are connected in series. Thus, their efficacy is reduced [29].
- Voltage-induced degradation (PID) damage to solar cells: PID is the problem of declining battery power generation when there is a high voltage difference between the solar cell and the ground. As solar inverters require a high voltage to start, installing a long string of solar-panel-module arrays is necessary. Each solar panel needs to be grounded, which makes the panels have a high-intensity voltage difference for a long time, causing leakage current of the battery panel, which declines power generation [30].
2.2. Data Preprocessing
Deep learning data preprocessing methods include data cleaning, data integration, and data transformation. In this study, we focused on data integration. We used the K-means clustering algorithm to improve data classification. Data integration is also known as merging data, and it combines data from different datasets or data sheets. Although data have come from the same data sheets, they may become two different classes when merged owing to the differences between the labeled data. When integrating data, we must first check the two data sheets, the available attributes, and how the data are recorded, and then discuss how to turn the differences into the same. Schema integration is the merging of data attributes. Data conversion makes the numerical value of the data less prone to misjudgment errors during analysis. The common methods of data conversion include smoothing, generalization, and standardization. Smoothing is used when the data are filled with considerable noise, making the data look cluttered. The smoothing method reduces the interference caused by noise. Generalization makes data detailed and normalized. Standardization reduces the value of the data to an interval to avoid magnifying or reducing the influence of an attribute [31].
3. Proposed Methods
3.1. Architecture
LIRNet is a neural network model. Its architecture and the core method, “two-phase deep learning classification”, are based on hierarchical classification concepts. We use a hierarchical classifier that maps input data into defined output categories. The classification happens first on a low level with highly specific pieces of input data. The classifications of the individual pieces of data are combined and classified on a higher level iteratively until an output is produced. Additionally, we separately run the first stage in two phases. The first phase involves using the K-means clustering algorithm to cluster similar classes for better accuracy. Subsequently, we use hand-crafted augmentation for data augmentation to reduce the dataset-imbalance problems by under-sampling and over-sampling the data. We use the unsupervised learning K-means method to modify supervised learning performance. The second stage is the training. We designed LIRNet to train the model. It is a lightweight convolutional neural network with an inception module and a residual block to enhance its performance. We added the inception module to level two of neural network and the residual block to the last layer of the neural network. The architecture is shown in Figure 1.
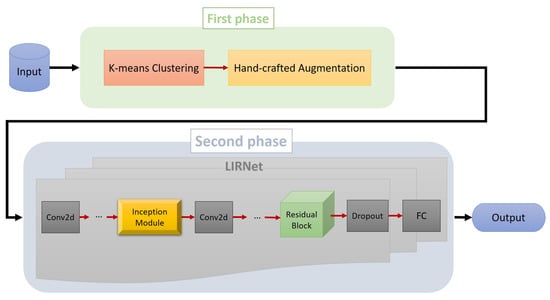
Figure 1.
The proposed architecture.
3.2. Two-Phase Deep Learning Classification
Two-phase deep learning classification is the core method in this study. In the first phase, we focus on data preprocessing. We use the K-means clustering algorithm and hand-crafted augmentation. In the second phase, we focus on training the neural network model. The details of each phase are described below.
- First phase—data preprocessing: In a typical convolutional neural network model for supervised classification and identification, a feature extractor is trained through multiple convolutional layers, and a fully connected layer is used to form a classifier. The convolutional neural network model will be trained directly with the data and cooperate with the classifier to do the classification task. K-means clustering can merge the classification task’s categories with similar features, so it can merge some original categories for the unbalanced data with other categories to alleviate the problem of unbalanced data. A poor classification-task target can be combined with a better-learned classification-task target to guide the classification success of the poor classifier and improve the recognition accuracy of the overall model. In addition, the classifiers that have done well before the merger are not affected by the poorly merged categories because the features learned from the correctly classified data samples do not change; thus, the original better classifiers are not affected. The classification will still be correct. K-means is a type of unsupervised learning. It uses the concept of clustering of objects for machines to perform grouping actions on the original data. For the set number of groups, a set number of group centers are randomly given, and the correlation between each datum pair is obtained. The distances among the data classify the data into cluster centers with similar distances, and then, these data are used to set up new cluster centers. The above steps are continued until convergence. Similar categories will also have similar characteristics, and K-means means that the distances between similar categories and the center of the group are similar; therefore, similar categories are merged after using K-means grouping. Through K-means, the number of learning categories can slightly alleviate the problem of unbalanced original data. The architecture of K-means clustering used in this study is shown Figure 2. Hand-crafted augmentation is a normal technique of data augmentation focused on remedying the over-sampling or under-sampling of datasets. We observed the number of each class and increased or decreased the datasets to balance the data.
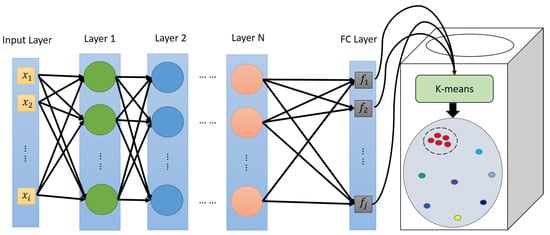 Figure 2. The architecture of K-means clustering.
 - Second phase—LIRNet: LIRNet is based on a lightweight convolutional neural network with an inception module and a residual block. It is hybrid method to enhance the neural network’s performance. The inception module in GoogLeNet was added to the neural network to allow multiple convolution kernels to extract information in different dimensions of the image together, and finally, perform fusion and an operation to obtain better image capture features. In the inception module, convolution kernels of different scales are used for feature extraction. The 1 × 1 convolution, 3 × 3 convolution, 5 × 5 convolution, and 3× convolution kernels are used to obtain features in different dimensions. The 1 × 1 convolution kernel can be used to reduce the amount of computation because after each channel passes through a 1 × 1 convolution kernel, its length and width do not change, but its depth will become 1. Therefore, the number of operations can be reduced when all cross-sections are multiplied and added to the values in the convolution kernel. The number of reductions is shown in Figure 3. The input images are W × H in size and 256 in depth. The filter size in the middle is 5 × 5 × 64. Therefore, the non-inception module’s convolutional computation requires 409,600 WH. When we use the inception module, the convolutional computation becomes 33,792 WH—less complex computation.
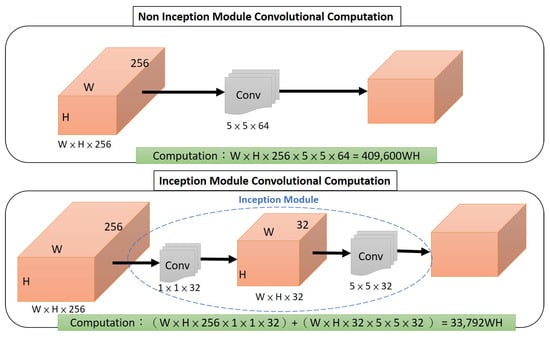 Figure 3. The reduction in computation cost.
In the training of neural networks, a network architecture with more layers will more easily cause the problem of degradation because when calculating the back-propagation, the layers’ information is transmitted from the back-end to the front-end. Specifically, the vanishing gradient problem makes the calculated gradient disappear, making the training stagnant. More training has no significant effect on the later stage of training owing to excessive accumulation of errors or information loss. Therefore, to reduce the occurrence of the above situation, a residual block is used in LIRNet. A residual block can add a shortcut to the original network layer to prevent degradation. The block with a shortcut connection, we call the residual block. Through this shortcut, the input is directly superimposed on the output layer, and simple addition does not add extra parameters or serious calculations to the network model. The shortcut solves the network degradation issue because during the reverse transfer, the gradient of the previous derivation is passed between the two layers, which is equivalent to increasing the gradient transfer and can reduce the possibility of gradient disappearance. The formula of the number of residual block learning rounds is shown in Equation (1):
where F is the function after passing through the convolutional layer, such as , is a feature vector, W is the weight matrix, and is the shortcut identity transform. Therefore, based on the above formula, we know that the learning feature formula from layer a to layer b is
Therefore, the features of the next observable layer must contain the features learned from the previous layer and will not be affected. If you look at it from the perspective of backward transmission, the formula is:
The nature of the calculation changes from multiplication to addition, and addition is more stable than multiplication. The short-circuit mechanism can transfer gradients relatively losslessly. That is, no matter the layer, the gradient of the higher layer can also be passed through addition. Figure 4 is a schematic illustration of the residual block.
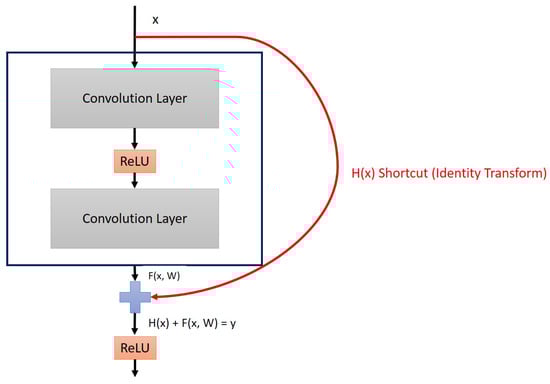
Figure 4.
The residual block in LIRNet.
In LIRNet, a residual block is used in the sixteenth layer of the neural network because at the end of training, the problem of network degradation easily occurs. There is no huge error in the good feature direction learned ahead, and the training continues in the right direction.
4. Experiment
4.1. Environment Setup and Dataset
In the experiment, we used a personal computing device to set up, as summarized in Table 1. The dataset consists of 20,000 infrared images [8] that are 24 by 40 pixels each. There are 12 classes of solar-cell panels: 11 anomaly classes and one no-anomaly class. Data were collected using a UAV system equipped with midwave or longwave infrared (3–13.5 µm) and visible spectrum imaging systems. The dataset’s description is summarized in Table 2. The dataset of the experiment is a photo dataset of monolithic solar panels under infrared light, which have been labeled. The ratio of the training dataset to the validation dataset was 8:2. The data classification in the experiment was based on the problems encountered by solar panels in the real world under normal conditions. There are 12 categories. In addition, the learning rate was set to 0.0002, and the kernel size of the CNN is 5 × 5. We adopted ReLU as the activation function and used the Adam optimizer.

Table 1.
Environment setup.
Table 2.
Dataset description.
4.2. Evaluation of the Model Performance
Three main performance evaluations were used in this study (i.e., precision, recall, and F1-score), and the data of its confusion matrix are attached. Before introducing the content of the indicator, we define the terms used internally. A true positive (TP) is a situation where the actual answer is positive and the prediction is successful, that is, a correct positive prediction. A false negative (FN) is a situation where the actual answer is negative and the prediction is wrong, that is, wrong negative prediction. A false positive (FP) is a situation where the actual answer is positive and the prediction is wrong, that is, a wrong positive prediction. A true negative (TN) is a situation where the actual answer is negative and the prediction is correct, that is, a correct negative prediction.
The performance of the proposed architecture was evaluated as summarized in Table 3. As we used K-means clustering to hand-modify some classes, the number of classes was changed. The confusion matrix is shown in Figure 5. We compared it with those of other state-of-the-art neural network models. The experimental results indicate that our proposed method provides significantly improved accuracy and speed of inference, as summarized in Table 4.
Table 3.
The performance of each class based on K-means combined when K = 8.

Figure 5.
The confusion matrix of the proposed method based on K = 8.
Table 4.
The comparison of other models based on K-means combined when K = 8.
4.3. Ablation Experiment
In this test dataset, using K-means, the analysis was mainly performed with 6, 7, 8, 9, and 10 clusters, as K < 6 and K > 10 are not suitable for the case. When the number of clusters is 8, the data distribution is relatively average. Therefore, in the first phase, using K = 8 effectively improves the classification accuracy. We performed the evaluation for different K-means, such as non-K-means, K = 6, K = 7, K = 8, K = 9, and K = 10. K = 8 produced the best accuracy, as summarized in Table 5.
Table 5.
Comparison of the accuracy before and after K-means.
The second part mainly involved the ablation experiments related to LIRNet, for which we show the performance evaluation indicators. Among them, the CNN is a general convolutional neural network, as summarized in Table 6, and the results of the evaluation are presented in Table 7.
Table 6.
The architecture of the CNN used in the comparison.
Table 7.
The ablation experiments of with/without the inception module and residual block.
5. Conclusions
The use of deep learning methods to identify the defects in solar panels is relatively common. This study discussed the problem of the identification of defects in solar panels. A neural network model was proposed in this study, LIRNet, and it was compared with the current common neural network models, such as VGG-16, VGG-19, GoogLeNet, ResNet, and EfficientNet, through identification accuracy and general performance evaluation. The experimental results indicate that LIRNet is better than most. In LIRNet, it is crucial to use the two-phase deep learning classification. It increased the training stability and slightly improved the recognition accuracy. The LIRNet model also makes some progress in the learning curve of training; that is, it is balanced compared to other common neural network models. LIRNet has better recognition accuracy than other neural network models; however, it needs higher recognition accuracy to be practically applied in real scenarios. The accuracy rate should be significantly improved to 95%. The learning curve of the model will not be severely overfitted, which is one of the research directions for the future. The K-means clustering of LIRNet can be proved from the experimental results to have specific utility for the identification problem of solar panels, but it may only be effective on some datasets. For example, this method of reducing the number of learning categories to improve the recognition accuracy could also be useful if applied to the recognition of a fruit. Therefore, a future task to do the method proposed in this study for different situations to verify the broad practicability of the experimental method.
Author Contributions
Conceptualization and methodology, S.-H.L. and L.-C.Y.; formal analysis, S.-H.L. and L.-C.Y.; supervision, C.-S.Y.; project administration, S.-H.L. and C.-S.Y.; writing—original draft preparation, S.-H.L.; writing—review and editing, S.-H.L. All authors have read and agreed to the published version of the manuscript.
Funding
This research is financially supported by National Science and Technology Council of Taiwan (under grant No. 111-2221-E-006-124-).
Data Availability Statement
The dataset is available for download at https://github.com/RaptorMaps/InfraredSolarModules (accessed on 13 January 2023).
Conflicts of Interest
The authors declare no conflict of interest.
References
- Haupt, S.; Kosovic, B.; Jensen, T.; Lazo, J.; Lee, J.; Jimenez, P.; Cowie, J.; Wiener, G.; McCandless, T.; Rogers, M.; et al. Building the Sun4Cast System: Improvements in Solar Power Forecasting. Bull. Am. Meteorol. Soc. 2018, 99, 121–136. [Google Scholar] [CrossRef] [Green Version]
- IEA. World Energy Outlook 2021. Available online: https://www.iea.org/newsroom (accessed on 13 February 2023).
- Tsai, D.-M.; Wu, S.-C.; Chiu, W.-Y. Defect Detection in Solar Modules Using ICA Basis Images. IEEE Trans. Ind. Inform. 2013, 9, 122–131. [Google Scholar] [CrossRef]
- Liang, Q.; Yao, J.; Hu, Z.; Wei, P.; Lu, H.; Yin, Y.; Wang, K.; Liu, J. Recent Advances of Film-Forming Kinetics in Organic Solar Cells. Energies 2021, 15, 5344. [Google Scholar] [CrossRef]
- Liang, Q.; Chang, Y.; Liang, C.; Zhu, H.; Guo, Z.; Liu, J. Application of Crystallization Kinetics Strategy in Morphology Control of Solar Cells Based on Nonfullerene Blends. Acta Phys.-Chim. Sin. 2023, 2212006. Available online: http://www.whxb.pku.edu.cn/EN/10.3866/PKU.WHXB202212006 (accessed on 13 January 2023).
- Yan, C.; Huang, J.; Li, D.; Li, G. Recent progress of metal-halide perovskite-based tandem solar cells. Mater. Chem. Front. 2021, 5, 4538. [Google Scholar] [CrossRef]
- Vincenzo, M.; Maurizio, C.; Domenico, C.; Vincenzo, F.; Sonia, L.; Marina, M.; Maria, L.P. Review on Life Cycle Assessment of Solar Photovoltaic Panels. Energies 2020, 13, 252. [Google Scholar] [CrossRef] [Green Version]
- Matthew, M.; Edward, O.; Nikhil, V. Infrared Solar Module Dataset for Anomaly Detection. In Proceedings of the ICLR, Addis Ababa, Ethiopia, 25–30 April 2020. [Google Scholar]
- Martin, G.; Kelvin Yiwen, H.; Henry Shu-Hung, C.; Jianfeng, Z.; Lo, A.W.L. Photovoltaic Panel Health Diagnostic System for Solar Power Plants. IEEE Appl. Power Electron. Conf. Expo. (APEC) 2019, 3, 1078–1083. [Google Scholar]
- Sander, M.; Henke, B.; Schweizer, S.; Ebert, M.; Bagdahn, J. PV module defect detection by combination of mechanical and electrical analysis methods. In Proceedings of the IEEE Photovoltaic Specialists Conference, Honolulu, HI, USA, 20–25 June 2010. [Google Scholar]
- Pierdicca, R.; Malinverni, E.; Piccinini, F.; Paolanti, M.; Felicetti, A.; Zingaretti, P. Deep Convolutional Neural Network for Automatic Detection of Damaged Photovotaic Cells. ISPRS—Int. Arch. Photogramm. Remote Sens. Spat. Inf. Sci. 2018, 42, 893–900. [Google Scholar] [CrossRef] [Green Version]
- Simonyan, K.; Zisserman, A. Very Deep Convolutional Networks for Large-Scale Image Recognition. In Proceedings of the IAPR Asian Conference on Pattern Recognition (ACPR), Kuala Lumpur, Malaysia, 3–6 November 2015. [Google Scholar]
- Long, W.; Li, X.; Li, X.; Liang, G. A New Transfer Learning Based on VGG-19 Network for Fault Diagnosis. In Proceedings of the IEEE 23rd International Conference on Computer Supported Cooperative Work in Design (CSCWD) 2019, Porto, Portugal, 6–8 May 2019. [Google Scholar]
- Szegedy, C.; Liu, W.; Jia, Y.; Sermanet, P.; Reed, S.; Anguelov, D.; Erhan, D.; Vanhoucke, V.; Rabinovich, A. Going deeper with convolutions. In Proceedings of the IEEE Conference on Computer Vision and Pattern Recognition (CVPR), Boston, MA, USA, 7–12 June 2015. [Google Scholar]
- He, K.; Zhang, X.; Ren, S.; Sun, J. Deep Residual Learning for Image Recognition. In Proceedings of the IEEE Conference on Computer Vision and Pattern Recognition (CVPR), Las Vegas, NV, USA, 27–30 June 2016. [Google Scholar]
- Ronneberger, O.; Fischer, P.; Brox, T. U-Net: Convolutional Networks for Biomedical Image Segmentation. In Proceedings of the Medical Image Computing and Computer-Assisted Intervention—MICCAI, Munisch, Germany, 5–9 October 2015. [Google Scholar]
- Lin, T.-Y.; Dollár, P.; Girshick, R.; He, K.; Hariharan, B.; Belongie, S. Feature Pyramid Networks for Object Detection. In Proceedings of the IEEE Conference on Computer Vision and Pattern Recognition (CVPR), Honolulu, HI, USA, 21–26 July 2017. [Google Scholar]
- Chaurasia, A.; Culurciello, E. LinkNet: Exploiting encoder representations for efficient semantic segmentation. In Proceedings of the IEEE Visual Communications and Image Processing (VCIP), St. Petersburg, FL, USA, 10–13 December 2017. [Google Scholar]
- Tan, M.; Le, Q. EfficientNet: Rethinking Model Scaling for Convolutional Neural Networks. In Proceedings of the 36th International Conference on Machine Learning (ICML), Long Beach, CA, USA, 9–15 June 2019. [Google Scholar]
- Le, M.; Luong, V.; Nguyen, K.; Dao, V.; Hung, V.; Vu, H. Remote Anomaly Detection and Classification of Solar Photovoltaic Modules Based on Deep Neural Network. Sustain. Energy Technol. Assess. 2021, 48, 101–545. [Google Scholar] [CrossRef]
- Liu, J.; Wang, J.; Tan, Z.; Meng, Y.; Xu, X. The analysis and application of solar energy PV power. In Proceedings of the International Conference on Advanced Power System Automation and Protection, Beijing, China, 16–20 October 2011. [Google Scholar]
- Anthony, T.; Mattias, J. Correcting the inherent distortion in luminescence images of silicon solar cells. In Proceedings of the IEEE 42nd Photovoltaic Specialist Conference (PVSC), New Orleans, LA, USA, 14–19 June 2015. [Google Scholar]
- Padmavathi, N.; Chilambuchelvan, A. Fault detection and identification of solar panels using Bluetooth. In Proceedings of the International Conference on Energy, Communication, Data Analytics and Soft Computing (ICECDS), Chennai, India, 1–2 August 2017. [Google Scholar]
- Addabbo, P.; Angrisano, A.; Bernardi, M.L.; Gagliarde, G.; Mennella, A.; Nisi, M.; Ullo, S. A UAV infrared measurement approach for defect detection in photovoltaic plants. In Proceedings of the IEEE International Workshop on Metrology for AeroSpace (MetroAeroSpace), Padua, Italy, 21–23 June 2017. [Google Scholar]
- Ali, M.; Katherine, A.; Brian, J.; Philip, T.; Alejandro, D. Fault impacts on solar power unit reliability. In Proceedings of the Twenty-Sixth Annual IEEE 403 Applied Power Electronics Conference and Exposition (APEC), Fort Worth, TX, USA, 6–11 March 2011.
- Katherine, A.; Gab-Su, S.; Bo-Hyung, C.; Philip, K. Photovoltaic Hot-Spot Detection for Solar Panel Substrings Using AC Parameter Characterization. IEEE Trans. Power Electron. 2016, 31, 1121–1130. [Google Scholar]
- Maghami, M.; Hizam, H.; Gomes, C. Impact of dust on solar energy generation based on actual performance. In Proceedings of the IEEE International Conference on Power and Energy (PECon), Kuching, Malaysia, 1–3 December 2014. [Google Scholar]
- Gabor, A.M.; Schneller, E.J.; Seigneur, H.; Rowell, M.W.; Colvin, D.; Hopwood, M.; Davis, K.O. The Impact of Cracked Solar Cells on Solar Panel Energy Delivery. In Proceedings of the 47th IEEE Photovoltaic Specialists Conference (PVSC), Calgary, AB, Canada, 15 June–21 August 2020. [Google Scholar]
- Ziar, H.; Mansourpour, S.; Afjei, E.; Kazemi, M. Bypass diode characteristic effect on the behavior of solar PV array at shadow condition. In Proceedings of the Power Electronics and Drive Systems Technology (PEDSTC), Tehran, Iran, 15–16 February 2012. [Google Scholar]
- Pingel, S.; Frank, O.; Winkler, M.; Daryan, S.; Geipel, T.; Hoehne, H.; Berghold, J. Potential Induced Degradation of solar cells and panels. In Proceedings of the 35th IEEE Photovoltaic Specialists Conference, Honolulu, HI, USA, 20–25 June 2010. [Google Scholar]
- TensorFlow. Data Augmentation. Available online: https://www.tensorflow.org/tutorials/images/data_augmentation (accessed on 13 February 2023).
Disclaimer/Publisher’s Note: The statements, opinions and data contained in all publications are solely those of the individual author(s) and contributor(s) and not of MDPI and/or the editor(s). MDPI and/or the editor(s) disclaim responsibility for any injury to people or property resulting from any ideas, methods, instructions or products referred to in the content. |
© 2023 by the authors. Licensee MDPI, Basel, Switzerland. This article is an open access article distributed under the terms and conditions of the Creative Commons Attribution (CC BY) license (https://creativecommons.org/licenses/by/4.0/).