Article

Energetic, Economic and Environmental (3E) Analysis of a RES-Waste Gasification Plant with Syngas Storage Cooperation

by
Jacek Roman
1,*,
Robert Wróblewski
1,
Beata Klojzy-Karczmarczyk
2 and
Bartosz Ceran
1
1
Institute of Electrical Power Engineering, Faculty of Environmental Engineering and Energy, Poznan University of Technology, 5 Piotrowo Street, 61-138 Poznan, Poland
2
Mineral and Energy Economy Research Institute, Polish Academy of Sciences, 7A J. Wybickiego Street, 31-261 Krakow, Poland
*
Author to whom correspondence should be addressed.
Energies 2023, 16(4), 2062; https://doi.org/10.3390/en16042062
Submission received: 30 January 2023 / Revised: 15 February 2023 / Accepted: 18 February 2023 / Published: 20 February 2023

Abstract

:
Today, the increasing amount of waste is a growing ecological and financial problem. Another issue is the need to limit the share of controllable sources powered by fossil fuels. A hybrid generation system (HGS) is proposed to solve both problems. The system consists of renewable energy sources (RES) and a waste gasification system. Contrary to many papers, it is proposed to include syngas storage and use gas turbines as balancing sources. The HGS was modeled, and electricity generation, capacity factors, and efficiencies were calculated. The economic (LCOE and PP) and environmental parameters (CO2 emission and reduction) were analyzed and calculated for different RES capacities. The results show that the proposed HGS covered 45.7–80% of municipal demand. The HGS was characterized by high CO2 emissions, due to the low efficiency of gasification-gas turbine installation and the need to compress syngas. However, the HGS can be environmentally beneficial due to the reduction in waste disposal in landfills. The LCOE was EUR 174–191 with a minimum at the RES capacity of 14 MW. Any change in waste disposal costs and emission allowances would cause significant changes in the LCOE. It was found that it can be beneficial to use a gasification system as a balancing source in a HGS.

1. Introduction

Today, the generation of municipal solid waste (MSW) in highly developed countries is a growing problem. The amount of waste increases with the wealth of citizens [1]. Waste landfilling involves significant environmental costs and an increasing use of land. Furthermore, in countries such as Poland, it is prohibited to landfill high-calorific waste (as regards Poland, the prohibition is on waste with a gross calorific value exceeding 6 MJ/kg). Waste prevention is recognized as the best method of dealing with waste, and the best ways to make use of the waste that has already been created are reuse or recycling. Unfortunately, not all MSW can be managed with these methods. Such waste should be subjected to other recovery methods, including energy recovery in waste-to-energy plants (WtE). The fraction of municipal waste that cannot be reused or recycled is called the oversieve fraction. It is extracted in mechanical biological treatment plants (MBP). According to Ściążko and Nowak [2], this fraction is 30–45% of the total stream of municipal mixed waste. In Poland, after the waste management system has been tightened up and when the waste incineration projects currently in development have been completed, there will still be approximately 1.5 million Mg of oversieve fraction of waste per year, according to Wielgosiński [1]. Moreover, a properly selected undersieve fraction from MBP and alternative fuels made from these fractions are suitable for use in WtE installations.
Biological and thermal methods are used for the recovery of energy from waste. Among thermal methods, three main technologies can be distinguished: incineration, gasification and pyrolysis [3].
Incineration is the most common method for thermal WtE systems. Fixed and fluidized bed boilers are mainly used for this process [1]. This method consists of the direct combustion of MSW in a boiler, and then the generation of electricity and useful heat in the steam cycle.
Gasification is a thermal-chemical process in which gas is produced from feedstock (e.g., waste). This process is a partial oxidation of the fuel. The products of this process include syngas (consisting mainly of CO, CO2, CH4, H2O, and H2), ash and impurities (tars, H2S, HCl, COS, NH3, and HCN) [4]. The gasification agents can be oxygen, air, steam or carbon dioxide. Gasification is generally carried out at atmospheric pressure and temperatures of 550–900 °C [4]. Syngas can be burned in a boiler or used in engines or gas turbines. It can also be co-fired with another fuel, and its heat might be used both to dry the feedstock and to supply the heating systems [5]. There are several types of gasifiers: fixed bed (updraft and downdraft), with a fluidized bed (bubble and circulating), and jet [4]. Gasification requires proper fuel preparation and fuel with a stable chemical composition. Because gasification is a surface process, the feedstock should be dry and have adequate granulation [6].
In order to achieve commercial success, gasification installations have to reduce the tar content in generated gas [7,8]. Tars are a mixture of organic compounds. They are characterized by high boiling points and cause significant technical problems. By condensation and deposition, they cause plugging and fouling problems. Moreover, they cause environmental problems due to catalyst deactivation and the need to manage products of wet cleaning [7]. Tars also cause corrosion and contain a significant amount of energy [9]. Reducing tars’ content would not only avoid technical problems but also increase overall efficiency. Methods to control and remove tars from syngas are divided into two groups: primary and secondary. Primary methods relate to the gasifier (e.g., its design, selection of parameters, and catalysts). On the other hand, secondary methods involve removing tars from already generated syngas. They include cracking and using cyclones and electrostatic filters [8].
Pyrolysis is conducted in the absence of or with a minimum amount of oxidant at temperatures of 500–800 °C. The products of this process include gas (consisting of CO, H2, CH4, and other hydrocarbons) and impurities (tars, H2S, HCl, COS, NH3, and HCN) [4]. Both pyrolysis and gasification have a higher potential to reduce waste volume than incineration [3]. The gas produced in these processes can be purified before combustion, which can allow emissions to be reduced at lower purification costs [4]. Emissions can be reduced using the same approach in gasification plants. In paper [10], the authors reported that by removing dust from syngas before combustion, its content in flue gas can be reduced from milligrams to micrograms.
Apart from the three main technologies, there are some new processes under development for converting MSW into fuel: plasma gasification, hydrothermal processing and torrefaction. A coking process is also being developed.
Plasma gasification is a technology in which MSW is turned into gas at a very high temperature, which allows a greater reduction in pollutant emissions from the installation [1]. However, this technology requires a significant energy input to produce the plasma.
In hydrothermal processing, MSW is treated in water which is in either liquid form or a supercritical state [11]. This process makes it possible to omit the drying of feedstock. As a result, it can be more energetically favorable than, for example, pyrolysis (for wet feedstock) [12]. In hydrothermal processing both liquid and gas fuels, as well as biochar, are produced. However, the products have complex compositions and high acidity [11].
Torrefaction is a technology that turns biomass into fuel in which feedstock is heated in an oxygen-deficient atmosphere to a maximum of 350 °C [13]. This process, as well as coking, requires an energy supply and long time to achieve suitable fuel properties [13,14].
Waste gasification is increasingly being presented as an alternative to waste incineration. Dong et al. [15] conducted a life cycle analysis of waste gasification, pyrolysis, and incineration systems integrated with combined heat and power (CHP) installations, both theoretically, and using the examples of existing technical facilities. They determined that CHP models with gasification and pyrolysis achieve higher efficiencies and lower emissions than direct combustion systems. However, syngas purification technologies do not achieve the quality standards adopted in models. Due to this fact, the gas turbine maintenance is very complex. The authors stated that in order for gasification and pyrolysis plants to be commercially successful, the development of the entire chain of waste preparation for thermal processing is necessary. In contrast, in the study by Rodrigues et al. [16], incineration plants are superior in terms of energy factors. However, the authors determined that waste gasification installations are more advantageous economically. This is due to the lower costs associated with maintaining environmental standards. Satiada and Calderon [17] performed a comparative analysis of existing WtE installations. They were compared in terms of technology, economics, environmental aspects and fuel quality. According to the criteria adopted by the authors, the recommended technology is gasification because of its environmental aspects and the high nominal power it produces (only incineration can generate higher power). Rezaei et al. [18] conducted an economic analysis of the generation of electricity from MSW using gasification and incineration under Iranian conditions. They concluded that the gasification technology would be more profitable than MSW incineration.
Some studies also include fermentation. Abdeljaber et al. [19] performed an energy, economic, and environmental analysis. The highest energy recovery was predicted in the gasification system, followed by incineration, fermentation, and mechanical and biological processing. The last two processes followed by gasification had the smallest carbon footprint. In the 25-year period, the most financially beneficial installation was gasification. Very similar results were obtained by Alzate et al. [20]. They studied gasification, incineration, landfilling and fermentation. They concluded that gasification was the best technology based on economic factors. Environmentally, however, fermentation was better. In spite of the research results cited, there are still fewer municipal waste gasification than incineration installations. However, there are indications of the anticipated development of this technology, particularly in Asia [3].
Another problem facing the world today is the increasing demand for electricity and, at the same time, the need to reduce CO2 emissions. In countries such as Poland, there has been a rapid increase in renewable energy sources (RES) installed in the power system. Within 2 years (2019–2021), the installed RES capacity in Poland doubled [21]. These are photovoltaic (PV) and wind sources, in which the generation of electricity is stochastic. In addition, the generation is seasonally variable. These are mostly sources with low nominal power and they are classified as distributed generation. Due to this growth, it becomes necessary to increase the capacity of storage facilities and the power of sources that can balance the fluctuations of stochastic generation of electricity in RES. Such sources may be hydroelectric or gas power plants (considering their quick start-up time). However, due to the landforms in Poland, there is no potential for further development of hydropower. In the case of gas turbines, the current international situation has proven that there may be problems with natural gas supplies for countries that do not have their own sources. Moreover, the price of gas can reach very high levels. Another approach to balancing electricity generation with consumption are hybrid generation systems (HGS). In particular, they can be used as part of distributed generation. Such systems consist of two or more renewable and/or non-renewable sources as well as energy storage. Their goal is to exploit the advantages of all sources and minimize their disadvantages [22]. However, these systems are much more expensive as they require oversizing and usually the use of energy storage [23].
Photovoltaic and wind turbine (WT) sources are very often proposed as sources in HGS [24,25]. This is due to the fact that they generally do not reach generation peaks at the same time [24] and, as a result, they can complement each other. Because of their stochasticity of electricity generation, it is usually necessary to use energy storages. Using them to balance generation from RES with demand is beneficial from an energy perspective. It allows the storage of excess electricity from RES and the use of it when weather conditions are worse and these sources do not cover the demand. Batteries are often used in such systems. However, they are expensive and difficult to implement in large-scale HGS [24]. Some of them also contain toxic substances [22]. Another form of electrical energy storage consists of electrolyzers and fuel cell systems with hydrogen storage. As a result of the low density of hydrogen, it is necessary to use very high pressures in such storage facilities. Individual components are subject to aging, significantly deteriorating their operational characteristics [26]. They are also expensive because they require the use of expensive catalysts [22]. The use of large-scale energy storage such as pumped storage power plants or CAES requires large-scale investment and appropriate terrain. Therefore, researchers are developing HGS concepts that also include sources with stable electricity generation. Solutions that contain hydroelectric power plants are proposed [27]. HGS also use controllable sources powered by fossil fuels: diesel engines [28,29] and gas turbines [29,30]. In the case of such solutions, it is important to note that their work involves fuel costs and, in the European Union, increasing costs of CO2 emissions.
In recent years, many researchers have proposed that gasification can be used in hybrid generation systems. They focus mainly on the use of biomass rather than waste. Singh et al. [31] proposed a system consisting of a connection to the power grid, PV sources, batteries, wind turbines and a biomass gasification installation. The balancing function of the system was covered mainly by batteries, but biomass was also used from time to time. Marchenko et al. [32] analyzed a system consisting of wood biomass gasification, PV sources, wind turbines, batteries and a backup power supply in the form of a diesel generator. This arrangement significantly increased the reliability of the power supply.
The use of biomass gasification in HGS is also often proposed for developing countries or for rural areas. Younas et al. [33] compared hybrid systems in Pakistan consisting of a combination of sources, including PV, micro hydropower and biomass gasification. The combination of all these sources was characterized by the lowest energy price. The most expensive energy was in the system without a hydroelectric power plant, as the gasification installation had to a have higher nominal power. Aslam et al. [34] concluded that in countries such as Tanzania, gasification of biomass waste could increase the availability of electricity. Ribó-Pérez et al. [35] proposed a new method of selecting technologies to supply rural consumers with HGS. They used many criteria based on economics, environmental impacts, institutional support, and social and technical aspects. They divided the whole process into three phases: a literature review, a panel of experts and implementation of the Analytic Network Process method. The results obtained indicated that the best system for the analyzed environment would be a combination of PV and wind sources with biomass gasification as a backup source. El-Sattar et al. [36] modeled a system consisting of biomass gasification, batteries, PV and WT to supply power to consumers in Egypt. They determined the optimal working conditions of each source. To balance the generation with the demand, they used batteries and a gasifier.
Waste is often used in proposals for power systems for urban centers. Singh and Basak [37] performed a technical and economic analysis of a hybrid system including the fermentation and gasification of waste, as well as photovoltaic sources and batteries. The aim of the work was to power a village. However, the authors noted that the waste had to come from a small town. They also used an artificial bee colony algorithm to achieve the cheapest configuration. The gasification system in this HGS operated with constant power. The LCOE of the tested system for the Indian conditions was estimated at USD 0.0737/kWh. Van Leeuwen et al. [38] presented a system completely powered by renewable sources, which included gasification of organic waste combined with SOFC cells, photovoltaic and wind sources. Because the location considered in the study was Amsterdam, the peak of biomass electricity generation was in winter, while generation in other RES was reduced. Bagheri et al. [39] proposed hybrid systems to power a part of Vancouver. These systems consisted of batteries, biomass waste gasification with an engine, wind turbines and PV sources. Regardless of the scale, energy prices were similar in such a system, while in terms of the environment and space occupied, medium-scale systems turned out to be better than large- and small-scale systems. Esfilar et al. [40] analyzed two systems using waste gasification to power the Victoria University campus. The first system was a standalone gasification system, and the second was a hybrid system consisting of waste gasification and other renewable sources and batteries. The authors of the study concluded that in addition to the financial and environmental benefits of reducing electricity consumption from the power grid, benefits are also derived from reducing landfill. Hybrid systems have been used not only to meet the demand for electricity. Garcia et al. [41] performed an economic, environmental and energy analysis of a generation system consisting of waste gasification, a gas engine and PV sources. In this system, gasification with steam as a gasification agent was used. The syngas was combusted in a CHP system. They also compared this system with waste incineration and a co-current gas generator. The best solution according to their criteria turned out to be the proposed solution followed by co-current gasification. Sun et al. [42] examined a hybrid system designed to supply consumers with electricity, heat and gas. This system consisted of a connection to the grid (gas and electricity), waste gasification, fermentation of kitchen waste, PV and wind sources, a fuel cell and a storage system, which consisted of heat, hydrogen and biogas storage. The results indicated that the operation of a multi-energy system was possible.
In addition to engines, gas turbines and boilers, fuel cells can also be fueled by syngas produced from waste. Zahedi et al. [43] studied the demand coverage and the environmental impact of a system consisting of wind sources, a fuel cell with hydrogen storage, and a gasification reactor. Hydrogen was separated from syngas and used to power the fuel cell. Hydrogen was also produced in the electrolyzer. This system was tested for off-grid operation. The use of gasification improved the stability and capacity of the system. In the paper by Van Leeuwen et al. [38], syngas was consumed in SOFC cells.
Research examining different forms of cooperation with the power grid is relatively rare. Eliasu et al. [44] examined the operation of a municipal waste gasification system in three scenarios of cooperation with the grid: a standalone gasification system, an installation cooperating with the grid and grid-only. The authors stated that economically and technically, a standalone installation was not the optimal choice. However, cooperation with the grid was more profitable than powering from the grid alone. Ghenai et al. [45] investigated whether it was possible to use a hybrid system consisting of photovoltaic sources, a wind turbine and batteries for the production of alternative fuel as a result of plastic waste pyrolysis. Their results showed that the off-grid system was the best in environmental terms, but it involved significantly higher costs than the on-grid system.
There is lack of studies with experimental results of HGS with waste gasification. However, some research has been conducted to examine other forms of HGS. In the paper [46], the authors presented both dynamic modelling and experimental results of a HGS which consisted of PV, a wind turbine and batteries. The results were consistent with only some discrepancies caused by different specifications and weather conditions in the experiments. In the article [47], the authors studied an off-grid wind-diesel HGS. Modelling allowed them to optimize the system, and the experimental studies revealed some problems (for example losing frequency when the load increases) but also confirmed the system’s suitable operation. Yamegueu et al. [48] confirmed the feasibility of a PV-diesel system based on their experimental results. In the paper [49], an HGS was experimentally studied. It consisted of wind turbines, photovoltaic panels, biomass gasification, and a battery bank. The results showed that wind generation was characterized by high levels of fluctuations in the power production, which influenced both the gasifier and batteries. The authors stated that feasibility studies have to be conducted in order to develop HGS.
It should be noted that, in some papers, synthesis gas storage was not used. With sudden changes in the generated electrical power, a reactor with a significant inertia could not change the load or start-up in time. This can be seen in El-Sattar et al. [36] or Jahangir and Cheraghi [50], who balanced generation in PV and wind sources using batteries but also using biomass gasification. A similar problem can be seen in Kozlov et al. [51], who studied hybrid systems consisting of biomass gasification, diesel power plants, photovoltaic sources and batteries. This problem was also observed by Van Leeuwen et al. [38], who presented, among other things, the addition of syngas storage as a direction for further research. Storage was used in the work of Garcia et al. [41]. However, it was used to reduce the impact of fluctuations of the gas generated in the reactor on the engine. Syngas storage was used to improve the operation of the gas generator in the authors’ earlier work [52]. However, this was a preliminary technical and economic analysis of one system, and it is necessary to significantly further develop the study in terms of energy, environmental aspects and economics, as well as to analyze various scenarios. In solutions in which the gas generator was used to produce fuel from which hydrogen was then separated, hydrogen storage facilities were used [42,43].
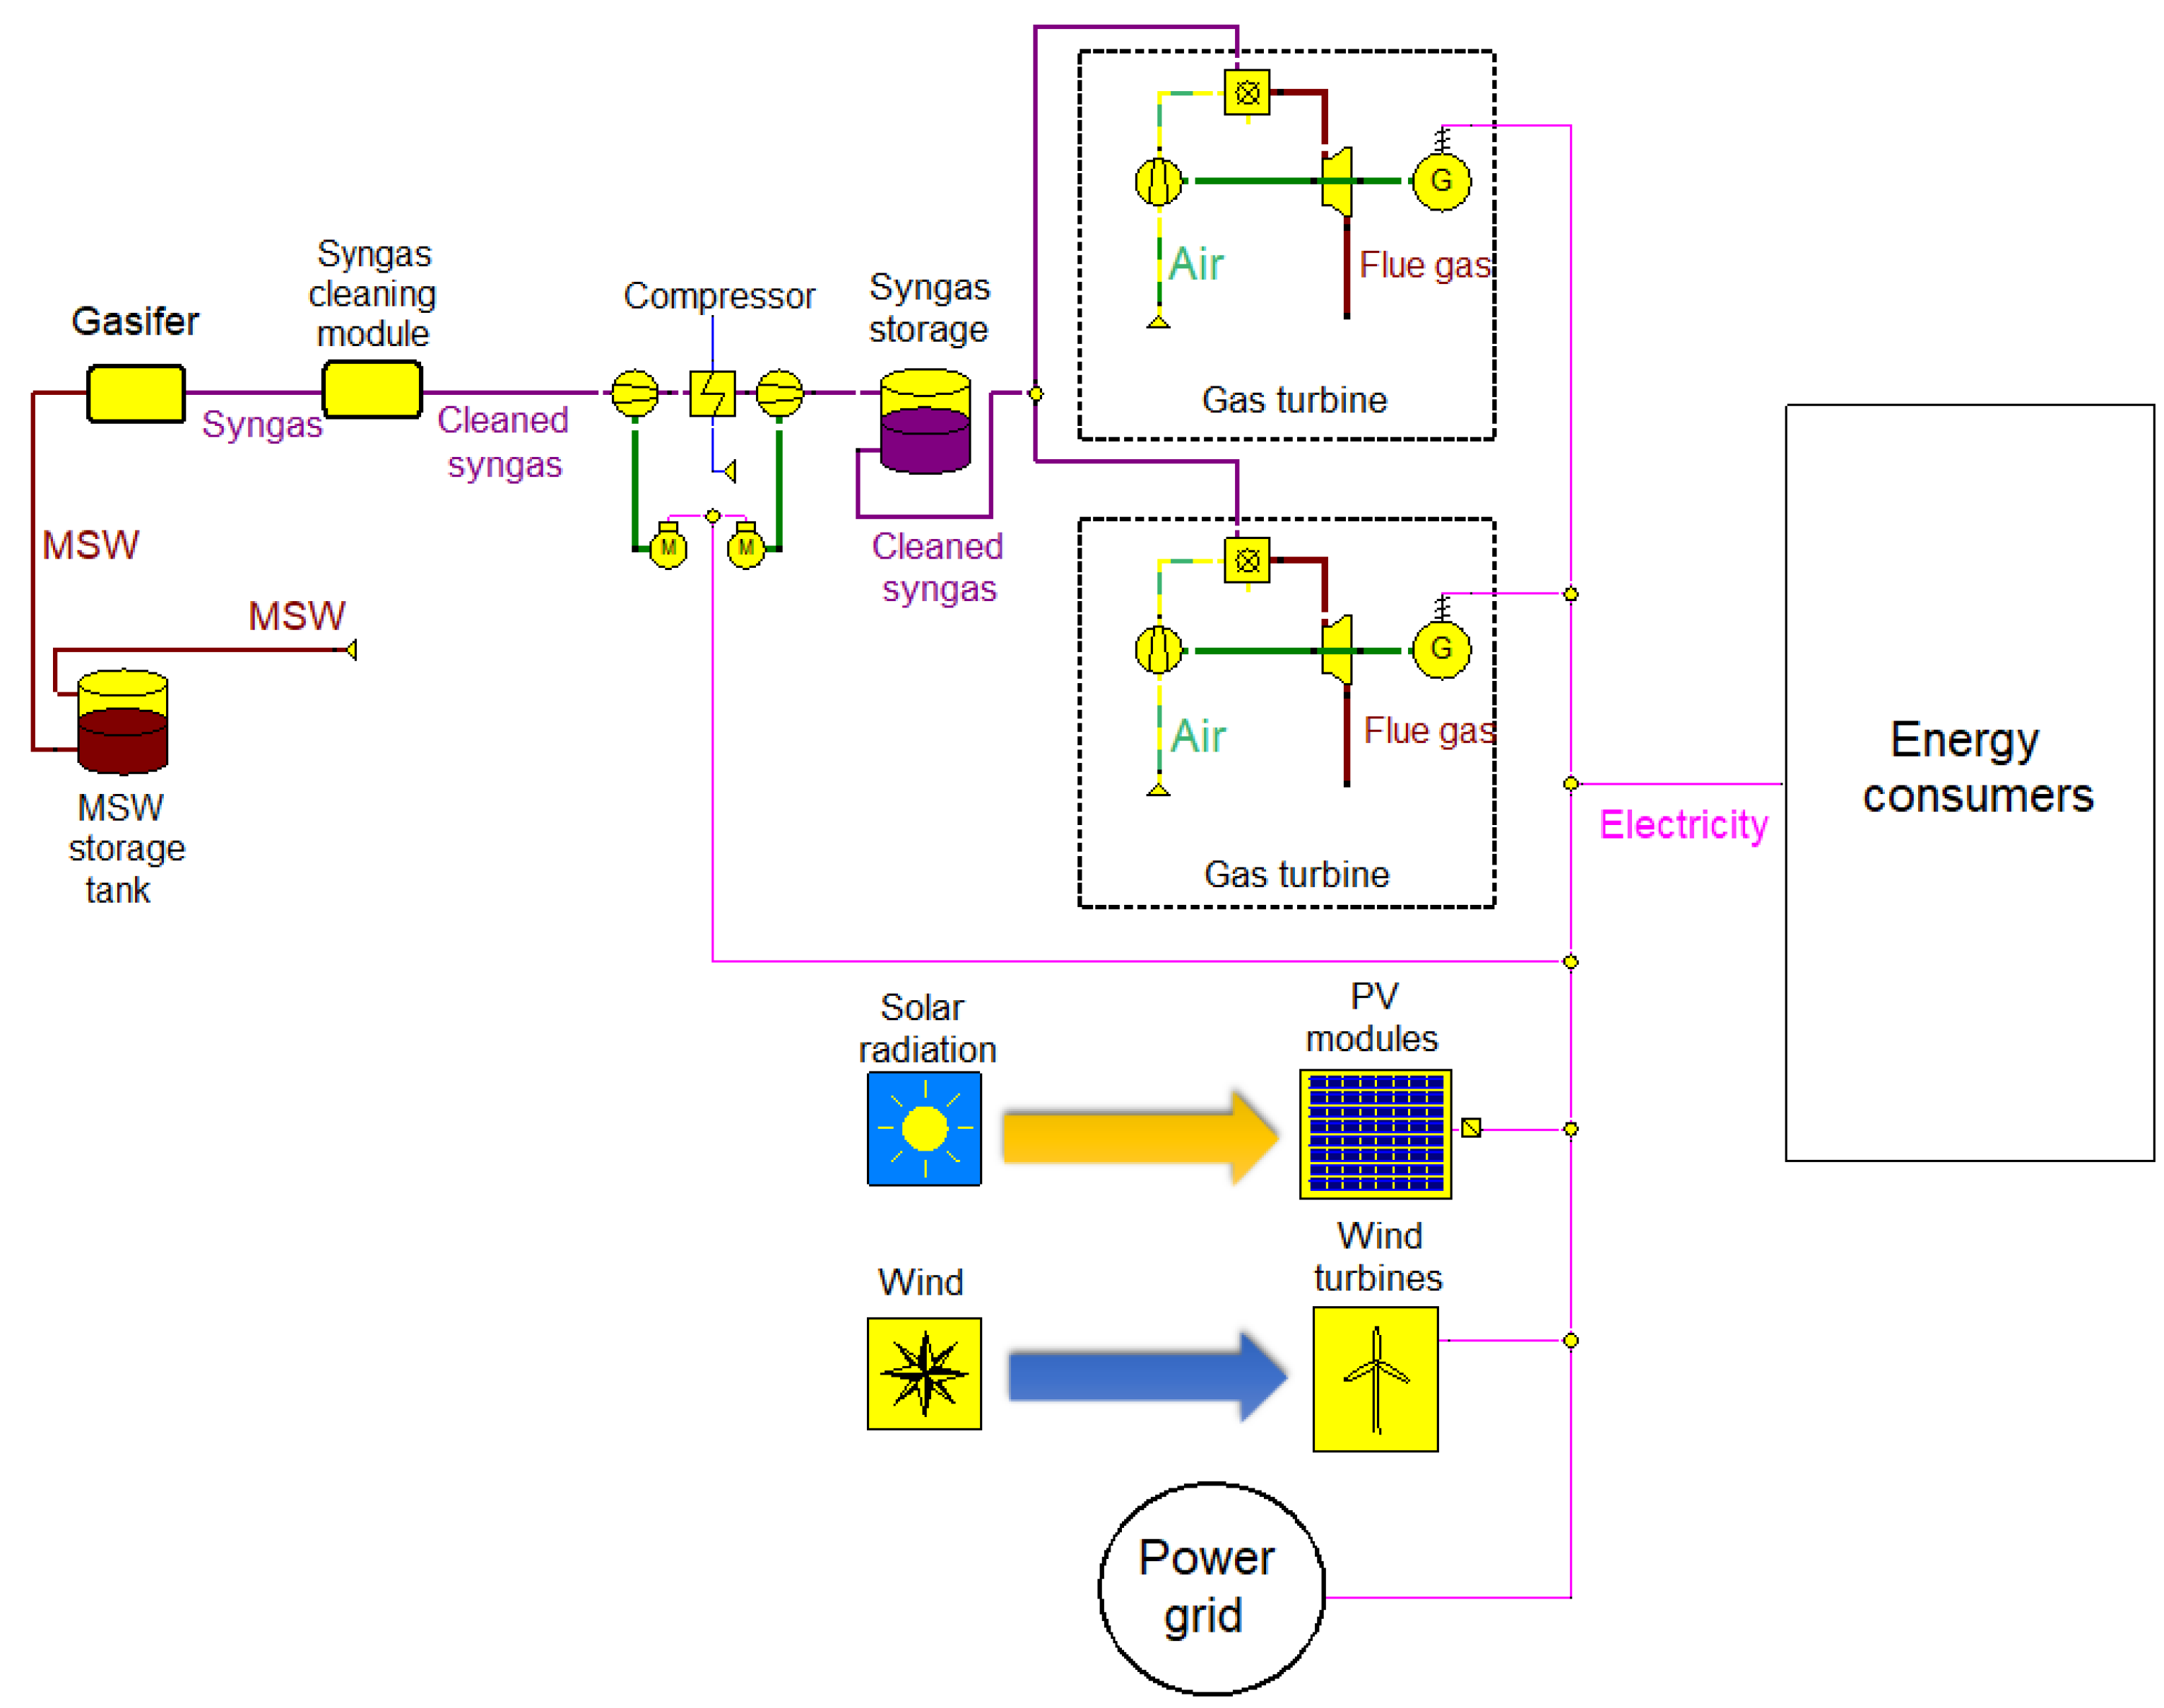
Due to the problems presented above, new ways to ensure the reliability of power supply and to deal with the increasing amount of municipal waste are needed. This article proposes the use of municipal waste gasification in hybrid generation systems to balance generation in renewable sources with demand. Contrary to the research results presented by other authors, no electrical energy storage was used. The only balancing source was the gasification installation with syngas storage and gas turbines. Energetic, economic and environmental analyses were conducted. Furthermore, the impacts of changes in the installed capacity of renewable sources on the operation and profitability of HGS were examined. To the best of the authors’ knowledge, there are no studies that analyze such an installation in a broad economic, environmental and energy context.

2. Materials and Methods

2.1. Hybrid Generation System Case Study

The electricity demand in the analyzed system was based on data from the Polish distribution network operator Enea Operator [53]. The consumer was defined as municipal with a maximum electricity consumption of 10 MW and annual electrical energy demand of 42.351 GWh. Assuming an average household energy consumption of 2 MWh/year, this would correspond to the demand of approximately 21,000 households. Chart A in Figure 1 shows the annual distribution of demand for this consumer in 2021. Chart B shows the average daily distribution of demand.
Figure 2A presents wind speed data at the measurement altitude on a 10-min cycle. The data was taken from IMGW [54]. Insolation data on an hourly cycle was taken from the government’s website for typical meteorological years [55]. The data refers to the city of Poznań (52°24′ N, 16°57′ E).
It was assumed that the gasification system consumed 17,000 Mg of waste oversieve fraction per year. The morphological composition of this fraction fed to the gasification installation would be stochastically variable and unpredictable. Moreover, because the waste would be stored and processed in MBP installations, there would be no seasonal variations in the oversieve fraction. The only predictable variability of waste composition is the annual variability, which depends, among other things, on legal conditions (for example, regarding the ban on landfilling certain fractions or the hierarchy of waste management). For these reasons, the average composition of the oversize fraction of waste entering the installation was used, which was determined on the basis of the article by Primus and Rosik-Dulewska [56]. The elemental composition was calculated on the basis of this data and the average elemental compositions of individual fractions are presented in [57] (Table 1).
The HGS analyzed consists of renewable sources (PV and wind) and two gas turbines powered by syngas. The gas turbines are the balancing power sources in the system. They are fueled by syngas storage, which is supposed to enable the gas turbines to be started independently of the operation of the gasifier. To increase the gas pressure in the storage, a two-stage compressor with intercooling is included in the model. The model of this system was made in the Ebsilon®Professional software. The HGS diagram is shown in Figure 3.
The system was designed to cover as much of the electricity demand as possible. An additional objective was peak-shaving. To achieve this, the power drawn from the grid was constant throughout the analyzed period and was part of the base load. As a result, the HGS covered only the part of the demand that exceeded the baseline covered by the power grid. However, in the case of RES generation in excess of demand, it must be assumed that it would be limited. Such assumptions reduce the profitability of the installation, as some of the potential electricity generation is lost.
Depending on the nominal power of the RES, the energy they generated differed. As a result, in order to cover the entire demand, the power drawn from the grid differed between the variants. This is shown in Figure 4.
Variants in which the installed RES capacity ranged from 6 to 18 MW were modeled and analyzed. The distribution of installed WT and PV power was even. It was assumed that the power of a single gas turbine would be 3.5 MW in all the variants. The syngas pressure in storage and in the gas turbine was determined using the function of maximizing the efficiency of the system operating at 100% load. The parameters of the system are listed in Table 2.

2.2. Gasification System

The model of a downdraft fixed-bed gasifier was used in the study. Air was used as the gasifying agent. In such gasifiers, there are the following zones: drying, pyrolysis, combustion and gasification (reduction). Each zone was modeled using a separate component. At each stage of the process, the elemental composition of the products was determined. Furthermore, the amount of air was determined as the minimum needed for the zero-energy balance of the reactor. The energy from exothermic processes was used to balance the energy necessary for endothermic processes. Ebsilon Professional software was used to model the system. Figure 5A shows a block diagram of the gasifier, and Figure 5B presents a model of the gasifier.
The gas generator was modeled using the following components: a Gibbs reactor (pyrolysis) and a combustion chamber with heat output (combustion and gasification). All the components were set to calculate the gas composition and energy balance by minimizing the Gibbs free energy function. Figure 5B also shows the bypass located behind the pyrolysis zone. It was used to model the amount of CH4 contained in the final gas with greater accuracy. The model uses an exhaust gas purification component, which includes impurity separation modules, coolers and water injection into the scrubber.
Three-stage models have already been used many times to present gas generators in scientific papers. In their studies, Ghorbani et al. [58] showed that the results obtained in such a model were very similar to the data obtained in the literature for downdraft gasifiers. Moreover, such a system allows the analysis of each of the reaction zones in the gasifier. In the study by Diyoke et al. [59], a three-zone model was used for biomass gasification, consisting of the following zones: (1) heating, drying and pyrolysis, (2) combustion, and (3) gasification. The model also demonstrated a good representation of the composition of the generated gas. In particular, it accurately simulated the amount of CO and CO2 in syngas. Xu and Shi [60] modeled the gasification of plastics in a three-stage model in the Aspen Plus software. The results they obtained were very close to the experimental results.
The approach based on determining the syngas composition using the minimization of the Gibbs free energy function is often found in the literature for computer modeling of the gasification process. Almpantis and Zabaniotou [61] used this method in the Aspen Plus program to model the gasification of rice hulls. The method modeled the amount of H2 accurately but produced a less accurate representation for the other components. However, they used a one-stage model. A single-stage reactor using this function has also been used to model municipal waste gasification by both Rokni [62] and Salman and Omer [63]. The results obtained by Begum et al. [64] when modeling waste gasification with the use of this function indicate a confidence level of 96% in comparing the modeling against experimental results. However, Santos and Hanak [65] noted that the use of such a reactor was usually associated with excess H2 generation and CO2 and CH4 deficiencies. Minutillo et al. [66] used a three-stage system consisting of three components with minimization of the Gibbs free energy function to model the gas generator.
Formula (1) for cold gas efficiency was used to calculate the gasification efficiency for municipal waste:
η c g = N C V s g m s g N C V M S W m M S W
where NCVsg is the syngas net calorific value, msg is the syngas mass, NCVMSW is the net calorific value, mMSW is the mass, and ηcg is the cold gas efficiency.

2.3. Validation of the Gas Generation Model

Table 3 presents the validation results for the gas generator model. The composition of purified syngas obtained in the model was compared with the gas composition provided by the manufacturer of gas generators [66] and obtained during the operation of the test system (recalculated to 100%) [67]. Both source gas generators operated on biomass.
On the basis of the results, it can be concluded that the composition of syngas obtained as a result of modeling is very similar to the values obtained under experimental conditions. Therefore, it is possible to use this model for further analysis. However, it should be noted that the individual gas components differ. In the case of both systems, it can be seen that the hydrogen content obtained in the model is higher than the average. However, the results obtained in the model are within the range of values presented by Minutillo [66]. In both publications, a small content of O2 is also observed, which results from the design of gas generators and the unevenness of the process. However, the model assumes an ideal process that fully uses the gasifying agent. A small amount of oxygen in syngas does not significantly affect the energy balance and composition of the gas. Compared with the data in [67], it can be seen that the modeled syngas contains more CO and less CO2. This is due to the fact that the amount of gasifying agent is equal to the amount necessary to achieve the zero-energy balance of the gas generator.

2.4. Calculation of the Work of Energy Sources, Syngas Storage and Power Grid

To calculate the electricity generation in PV, the position of the sun for the analyzed points was considered. The tilt of the panels was 40 degrees. Insolation data was converted into radiation incident on the surface of the panels according to Formula (2) [68]:
S S r e f = M ( G b G r e f R b e a m K τ α , d + G d G r e f K τ α , d 1 + c o s β 2 + G ρ G r e f K τ α , g 1 + c o s β 2 )
where S is radiance (W/m2), Sref is absorbed radiance at cell standard conditions (W/m2), Gb is beam radiance (W/m2), Rbeam is the tilted surface ratio factor (-), Gd is diffuse radiance (W/m2), is ground radiance (W/m2), β is slope (°), and Kτα is the transmittance ratio at an incidence angle to transmittance at angle equal to 0° (-).
The data was then converted into generated electricity using the characteristics of the cells according to Formula (3):
P = c f P V P n
where Pn is nominal power (kW), cfPV is the capacity factor for radiance S, and P is generated power (kW).
Wind speed data from the height of the measuring mast was used for wind turbine calculations. It was converted to the height of the gondola according to Formula (4):
v 2 ( h 2 ) = v 1 ( h 1 ) ln ( h 2 z ) ln ( h 1 z )
where v1 is the wind speed (m/s) at height h1, v2 is the wind speed (m/s) at height h2, and z is the roughness length (-).
The power generated by the turbine is calculated according to Formula (5):
P = ρ A 2 π R 2 v 2 3 c p
where P is the generated power (W), ρA is air density (kg/m3), R is rotor radius (m), v2 is the wind speed at hub height (m/s), and cp is a power coefficient (-).
The value of the cp coefficient for a given wind point is determined on the basis of the operational characteristics.
The gas turbine was modeled using three components (compressor/fan, combustion chamber of a gas turbine and gas expander). The efficiency of the turbine for a given power was calculated using the characteristics of each piece of equipment included in the installation. The power of the gas turbine in a given period was calculated according to Formula (6):
P G T = D P W T P P V P g r i d
where D is demand (kW), PGT is the gas turbine power (kW), PWT is the wind turbine power (kW), PPV is PV power (kW), and Pgrid is the power from the power grid (kW).
The minimum power of the gas turbines was 20% of the rated power. In cases where Formula (6) produced a result lower than this value, the PGT assumed the value of 20% of the rated power.
The characteristics of all sources are shown in Figure 6. Figure 6A shows the cf (vw) and cp (vw) characteristics of a wind turbine. The characteristics of the PV panels, cf (E) and η (E), are shown in Figure 6B. As a result of the balancing function of gas turbines, it is necessary to show the operating characteristics of these devices. The diagram of η (P/Pzn) is shown in Figure 6C.
The gasification installation works independently of the gas turbine. This is due to the need to avoid load changes (high inertia of the gas generator) and frequent start-ups of the installation, which require much time. Furthermore, to avoid load changes, it was assumed that the gas generator would operate in two operating states: 0% load and 100% load. As a result, the formula for the current gas storage level is presented below (Formula (7)):
F i = F i 1 + m s g i · T 10 P G T i η G T i · N C V s g · T 10
where Fi is the syngas storage fulfillment in i interval (-), Fi−1 is the syngas storage fulfillment at (i − 1) interval (-), NCVsg is the syngas net calorific value (kJ/kg), msgi is the mass flow of generated syngas in i interval (kg/s), PGTi is the GT power in i interval (kW), ηGTi is the GT efficiency in i interval, and T10 the time of single interval (s).

2.5. Energetic Analysis

The purpose of the hybrid system energy analysis was to determine the following parameters: annual electricity generation Ea, annual net electricity generation Ea,net, excess generation in RES Eover, energy taken from the grid Egrid, coverage of demand DC, efficiency η and capacity factor cf. These calculations were performed for each source and for the HGS as a whole.
The annual energy generation for all sources was calculated according to Formula (8):
E a =   P i T 10 3600
where Ea is the annual electricity generation (MWh), and Pi is the power at i interval (MW).
The energy analysis was conducted using Formulas (9)–(15):
E a , n e t G S = E a G S   P i c o m p r e s s T 10 3600
E a , n e t W T = E a W T E o v e r W T
E a , n e t P V = E a P V E o v e r P V
E o v e r W T =   ( P i G S + P i W T + P i P V + P g r i d D i ) T 10 3600 · P i W T P i W T + P i P V
E o v e r P V =   ( P i G S + P i W T + P i P V + P g r i d D i ) T 10 3600 · P i P V P i W T + P i P V
E g r i d = 8760 P g r i d
D C = E a , n e t D 100 %
where Ea,netGS is the annual electricity generation in the gasification system (MWh), Ea,netWT is the annual electricity generation in the wind turbines (MWh), Ea,netPV is the annual electricity generation in PV (MWh), Picompress is the compressor power demand (MW), EoverWT is the redundant potential of the wind turbines (MWh), EoverPV is the redundant potential of PV (MWh), Egrid is the electricity from the power grid (MWh), and DC is the demand coverage by HGS ratio (%).
The efficiencies of the electrical energy sources were calculated according to the following formulas: GT (16), WT (17), and PV (18). Formula (19) calculates cf.
η G T = E a , n e t G S N C V M S W ·   m M S W i T 10
η W T = E a , n e t W T   ρ A 2 π R 2 v 2 i 3
η P V = E a , n e t P V   S i A
c f = E a , n e t P n 8760

2.6. Environmental Analysis

The annual CO2 emissions of HGS were calculated. The only sources of carbon dioxide in the system are the gasification system and the gas turbine. The syngas consists of: CO, CO2, CH4, H2, and N2 and O2. The oxidation reactions of CO and CH4 are listed below:
2 CO + O 2 2 CO 2
CH 4 + 2 O 2 CO 2 + 2 H 2 O
The specific emission factor ECO2 was determined according to Formula (22):
E C O 2 = M C O 2 E a , n e t
where MCO2 is the mass of CO2 emitted (Mg/y),and ECO2 is the emission factor (Mg/MWh).
The mass MCO2 was determined from Formula (23):
M C O 2 = m C O 2 + 44 28 m C O + 44 16 m C H 4
where mCO2 is the mass of CO2 in syngas (Mg/y), mCO is the mass of CO in syngas (Mg/y), and mCH4 is the mass of CH4 in syngas (Mg/y).
In addition, the reduction in CO2 emissions was calculated. The equivalent landfill emissions were included in the analysis. Due to the fact that CO2 and CH4 emissions from landfills are unpredictable, averaged emissions per waste mass unit were based on data from the literature. Data published by Garcia et al. was used, and it was assumed that the emission from 1 Mg of waste would be to 270 kg of CO2 [41]. These emissions are high because a significant part of landfill emissions is methane, whose global warming potential (GWP) is 25 times higher than the GWP of CO2. The equation is shown below:
C O 2   R e d u c t i o n = M C O 2 g r i d + 0.27 · 8760 · M w a s t e M C O 2
where, CO2 Reduction is the reduction in CO2 emissions (Mg/y), and MCO2grid is the mass of CO2 emitted in the grid to cover demand (Mg/y).

2.7. Economic Analysis

The total investment cost was calculated as the sum of the investment costs of the individual elements according to Formula (25). These costs were calculated according to the formulas presented in Table 4. Due to the fact that these formulas were developed for data from several years ago, it was necessary to recalculate them into current values. This was performed using the Chemical Engineering Plant Cost Index (CEPCI) according to Formula (26). The investment cost for each component was multiplied by ratio of 2022’s CEPCI value to the CEPCI value of the reference year (year of origin of the equation):
C i   2022 =   C i · C E P C I 2022 C E P C I r e f
C i   s u m 2022 =   C i   2022
where Ci is the investment cost of a single element of the system (EUR), Ci2022 is the investment cost of a single element recalculated to 2022 values (EUR), Cisum2022 is the investment cost of the system recalculated to 2022 values (EUR), CEPCI2022 is the value of the Chemical Engineering Plant Cost Index in the year 2022 (-), and CEPCIref is the value of the Chemical Engineering Plant Cost Index in the reference year (-).
Table 5 shows the formulas used to calculate the operating costs. The operating costs of the gasifier-gas turbine system were estimated based on data from biomass gasification installations presented by Malaťáková [76]. The coefficient was assumed to be the average for the installation.
The costs did not include the cost of fuel, due to the use of the oversieve fraction of municipal waste, which is characterized by a negative price. This means, that the facility would receive a “gate fee” for the gasification and disposal. In the calculations, the baseline variant of such a fee was assumed to be 74 EUR/Mg.
Furthermore, CO2 emission charges should be included in the operating costs. In the EU, installations disposing waste are currently exempt from these fees. However, it is planned to include them in the EU ETS system, which could cause a significant decline in the profitability of such installations. The base variant of the emission fee was assumed to be 42 EUR/Mg CO2.
In order to perform an economic analysis of the systems and compare them with each other, the Levelized Cost of Electricity (LCOE) was calculated according to Formula (27). Furthermore, for the energy price range of 85–300 EUR, the Payback Period (PP) was calculated according to Formula (28). The base variant of the electricity price for PP calculations was assumed to be 200 EUR/MWh. The operation time of the system was defined as 20 years and the construction time as 2 years. The change in the value of money over time was also considered. The discount factor was assumed to be 0.06. Formulas (27) and (28) are as follows:
L C O E =   I t + M t + F c t ( 1 + r ) t   E t ( 1 + r ) t
P P = t b r e a k 1 + I u n r N P t ( 1 + r ) t
where LCOE is the Levelized Cost of Electricity (EUR/y), It is the investment cost in year t (EUR), Iunr is the unrecovered amount of investment cost in year t (EUR), Mt is the operating cost in year t (EUR), Fct is the fuel costs in year t EUR), Et is the electricity generation in year t (MWh), and r is the discount factor (-).
The sensitivity of LCOE and PP to changes in electricity costs, gate fees and CO2 emission costs was also examined.

3. Results and Discussion

3.1. Gasifier

The base variant of the electricity price for PP calculations was assumed to be 200 EUR/MWh.
Table 6 presents the results of modeling an installation which gasifies the oversieve fraction of municipal waste. The composition of the generated gas, calorific value and gasification efficiency are shown.
The table shows that in relation to the results of biomass gasification (presented in Section 2.3), the content of CO and H2 is higher. However, the CO2 content is lower. This is due to the composition of the oversieve fraction and its lower moisture, which required a smaller amount of air.
The net calorific value of syngas is within the range achieved by MSW gasification, between 4 and 6.2 MJ/m3 [44]. Furthermore, the composition of the gas was similar to the results of the modeling of fuel from waste gasification with air [77]. However, it differs from the values obtained experimentally because the experimental results show a lower CO content and a higher CO2 content. However, the content of CH4 is similar [77,78].

3.2. Generation of Electricity in Sources

Figure 7 shows the distribution of electric power generation in individual sources and the power drawn from the power grid.
It can be observed in Figure 7 that a considerably larger generation of PV energy occurs in the summer months, whereas WT generates more power in the winter and spring months. In particular, in the case of WT, significant variability in electricity generation is visible. It is also seen that higher powers are achieved by WT than by PV (despite equal nominal powers). The power from the power system is constant throughout the period. Figure 7A shows that lower waste electricity generation is required in the summer months than in winter. This is due to the fact that there is smaller energy demand in the summer, and during daytime there is a relatively stable, high generation from PV.
Figure 8 presents graphs showing the coverage of demand by all sources on two exemplary days for the RES power variant of 10 MW. January 4 represents a winter day and 4 July a summer day.
Figure 8A shows a low PV generation. In addition, the generation occurs over a few hours only. On the contrary, on 4 July, PV covers most of the demand for part of the day. Wind energy generation is very variable. On both days presented, the greatest coverage of the demand by GT occurred in the evening hours. There was an excess potential of RES generation during some hours on those days. During these periods, the generation in renewable sources was reduced.
Figure 9 presents a diagram of the gasifier load and the gas storage tank filling for the case considered.
In the summer months, as a result of the lower consumption of syngas, the charging periods are shorter than in winter. In the winter months, the periods between subsequent start-ups of the gas generator are shorter. Figure 10 presents the average and minimum operation time of the gas generator during the year.
The minimum operation time of the gas generator was 115.3 h for the variant with RES power at 10 MW. In the case of variants with lower RES power, the gas generator had to work longer to fill the syngas storage, as the GTs worked more often, even in the summer. The average operation time of the gas generator was almost constant with increasing RES installed capacity.

3.3. Results of Energy Analysis

Table 7 shows the simulation results.
Figure 11 presents the coverage of the demand by all electricity sources.
The rate of demand coverage by gas turbines ranges from 27.4% to 32.8%. This variability is caused by the fact that, in some variants, the GT is more likely to operate in the high-efficiency area, due to which, increased overall generation of electricity is possible. As RES capacity increases, generation increases and the system contribution decreases. The diagram shows that the linear increase in RES power results in a nonlinear increase in demand coverage (increasing RES power from 6 MW to 8 MW increases demand coverage by RES by 5.4 pp, with 8–10 MW by 4.7 pp, with 10–12 MW by 4.3 pp, at 12–14 MW by 4.1 pp, and at 16–18 MW by 3.3 pp). However, as RES nominal power increases, so does excess generation. Therefore, the capacity factor of the sources decreases.
Generation in renewable sources ranged from 18.3% of demand at RES power of 6 MW to 43.8% at 18 MW.
The graphs of excess RES generation by source are shown in Figure 12.
Excess generation in the sources increased as RES installed capacity increased. It was a second-degree polynomial growth. In particular, the unused generation potential in PV was growing very fast. It increased 12.5 times between PRES equal to 6 MW and 18 MW. At the same time, the unused generation potential in WT increased 7.2 times.
Unused generation resulted in cf changes, as shown in Figure 13.
The capacity factor decreased with the increasing installed capacity, both in RES and in all of the HGS. It increased only in the case of GS.
Piasecki et al. [79] estimated that in an area close to Poznań, the theoretical cf for PV is approximately 10.5–11%, which is higher than that obtained in this study. In the case of wind turbines in the region east of Poznań, the capacity factor may even exceed 25%. However, to the west of Poznań, this rate may be only around 8%. It can be seen that the analyzed system is characterized by lower cf due to the necessity to limit electricity generation.
The capacity factor of the gas turbines was also below its achievable level. The reason for this is the way the HGS works. GS is responsible for aligning generation with demand.
The gasifier-gas turbine system was characterized by low efficiency (15.2–18.3%). It is significantly lower than the rated efficiency of a gas turbine (38%). This is caused by taking into account the efficiency of the gasification process and the operation of the turbine with partial load, which translates into lower efficiency. Moreover, a significant energy loss in the system is caused by the need to compress the syngas before storage. The inlet syngas for the gas turbine must be at a high pressure. Due to its low net calorific value, a significant volume of syngas must be supplied to the GT, which results in a decrease in efficiency. More than 30% of the electricity generated in the gas turbine is consumed by the syngas compressor.

3.4. Results of Environmental Analysis

Table 8 presents the results of the environmental analysis of the system. The table shows the mass of CO2 emitted during the year and the emission factor in the HGS. Figure 14 presents a comparison of the system emission factor results with the emissions data from the Polish power system [80] and from hard coal and lignite power plants [81].
Due to the fact that the amount of MSW does not change, the CO2 emission is almost constant. The CO2 emission factor was variable. Along with the increase in the installed capacity of RES, the amount of CO2 emitted when generating a unit of electricity decreased. However, these were not linear declines. The higher the installed capacity of RES, the smaller the decrease in the emission factor. This is due to the fact that increasing amounts of energy produced in RES is not used to cover demand.
The diagram also shows that the emission factor of the Polish power system was not achieved in any of the analyzed variants. However, with an installed capacity of RES equal to or greater than 8 MW, the emissivity is lower than in lignite-fired power plants. Furthermore, at 14 MW, the unit emission factor is lower than in coal-fired power plants.
Figure 15 presents graphs of the reduction in CO2 emission in relation to electricity generation, taking into account emissions from landfill waste disposal. A HGS containing waste gasification was compared with emissions from the power system, hard coal and lignite power plants.
In relation to energy generation in the power system (with landfill), the proposed HGS would have lower CO2 emissions only with an installed RES capacity greater than 12 MW. The proposed system could reduce emissions compared with lignite-fired power plants (in all variants) and hard coal-fired power plants (from RES capacity equal to 10 MW). Garcia et al. [41] calculated the reduction in CO2 emissions using a HGS consisting of MSW gasification and PV panels. They found that emissions are reduced by about one-third compared with the power system. Esfilar et al. [40] estimated that a hybrid system consisting of waste gasification, RES and batteries would help avoid 88 t of CO2 per year from electricity production and 30 t of CO2 from landfill. These values are proportionately higher than those achieved in the HGS analyzed here, where, without taking into account landfill emissions, there can be no CO2 reduction in most variants. However, because in countries such as Poland, the storage of high-calorific waste is prohibited, it is necessary to dispose of it in a different way, for example, by incinerating it without energy recovery, which would result in even greater emissions.

3.5. Results of Economic Analysis

Table 9 presents data and results of the simulation. The results of LCOE and PP for all variants are presented.
An analysis of the impact of parameter changes on the LCOE value was also performed. The RES power of 10 MW and the financial data in Table 9 were defined as the reference point. The results of this analysis are presented in Figure 16.
The diagram shows that the cost of electricity decreases linearly as the gate fee increases. With a gate fee of 0 EUR/Mg, the LCOE is 231 EUR/MWh, and when the fee is 148 EUR/Mg, the LCOE is 128 EUR/MWh. Increasing the cost of CO2 emissions results in a linear increase in LCOE. For a 100% change in emission costs, the LCOE changes by 23.2%. The discount rate has the greatest impact on the energy price. As r increases, LCOE increases parabolically.
Despite higher investment costs, increasing the installed capacity of RES reduces LCOE because RES generate more electricity. However, the greater the installed capacity, the smaller the decrease in LCOE. This is caused by the fact that increasing amounts of energy are unused and unsold, and therefore, profits do not grow. As a result, the minimum LCOE is achieved at a RES power equal to 14 MW, and after exceeding this value, the cost of energy increases.
The results indicate that in the variant where RES equals 10 MW, the LCOE is 176.5 EUR/MWh. Comparing the results with the current state of knowledge, it is much less than in the study by Bagheri et al. [39], where a system including PV, batteries, WT and a biomass gas generator had an LCOE of 300–370 USD/MWh. In addition, 176.5 USD/MWh is more than 2.5 times less than the result obtained by Samy and Barakat when examining a system consisting of biomass gasification, PV sources and a battery system [82]. They also found that the battery cost was 52.3% of the total cost. In the study by El-Sattar et al. [36], which examined a HGS consisting of PV, WT, batteries and biomass gasification, the battery accounted for 43.5% of the costs, and for as much as 48.9% in the system without PV. Therefore, the system that we propose, one that does not contain batteries, has the potential to be much cheaper than systems containing this type of energy storage. Furthermore, the use of waste as fuel avoided fuel costs, resulting in additional profits. Similar results (LCOE of 173–181 USD/MWh) were obtained by Singh et al. [31] for a system of PV, WT, batteries and biomass gasification.
Figure 17 presents the results of the analysis of the impact of changes in the system parameters on the HGS payback period.
The graph shows that the price of electricity is the most influential factor. This is due to the fact that, unlike CO2 emissions and the price of waste, this parameter applies to all generated energy. If the price is reduced to 179 EUR/MWh, this installation is no longer profitable. On the other hand, increasing the price to 400 EUR/MWh reduces the payback time to less than 6 years. The same applies in the case of LCOE. Increasing the RES power is associated with a decrease in PP, whereas the higher the values, the smaller the decreases. The minimum value of Cwaste guaranteeing a return over a period of 20 years is 44.5 EUR/Mg. The maximum cost of CO2 emissions at which a return was possible was less than 54 EUR/Mg.

4. Conclusions

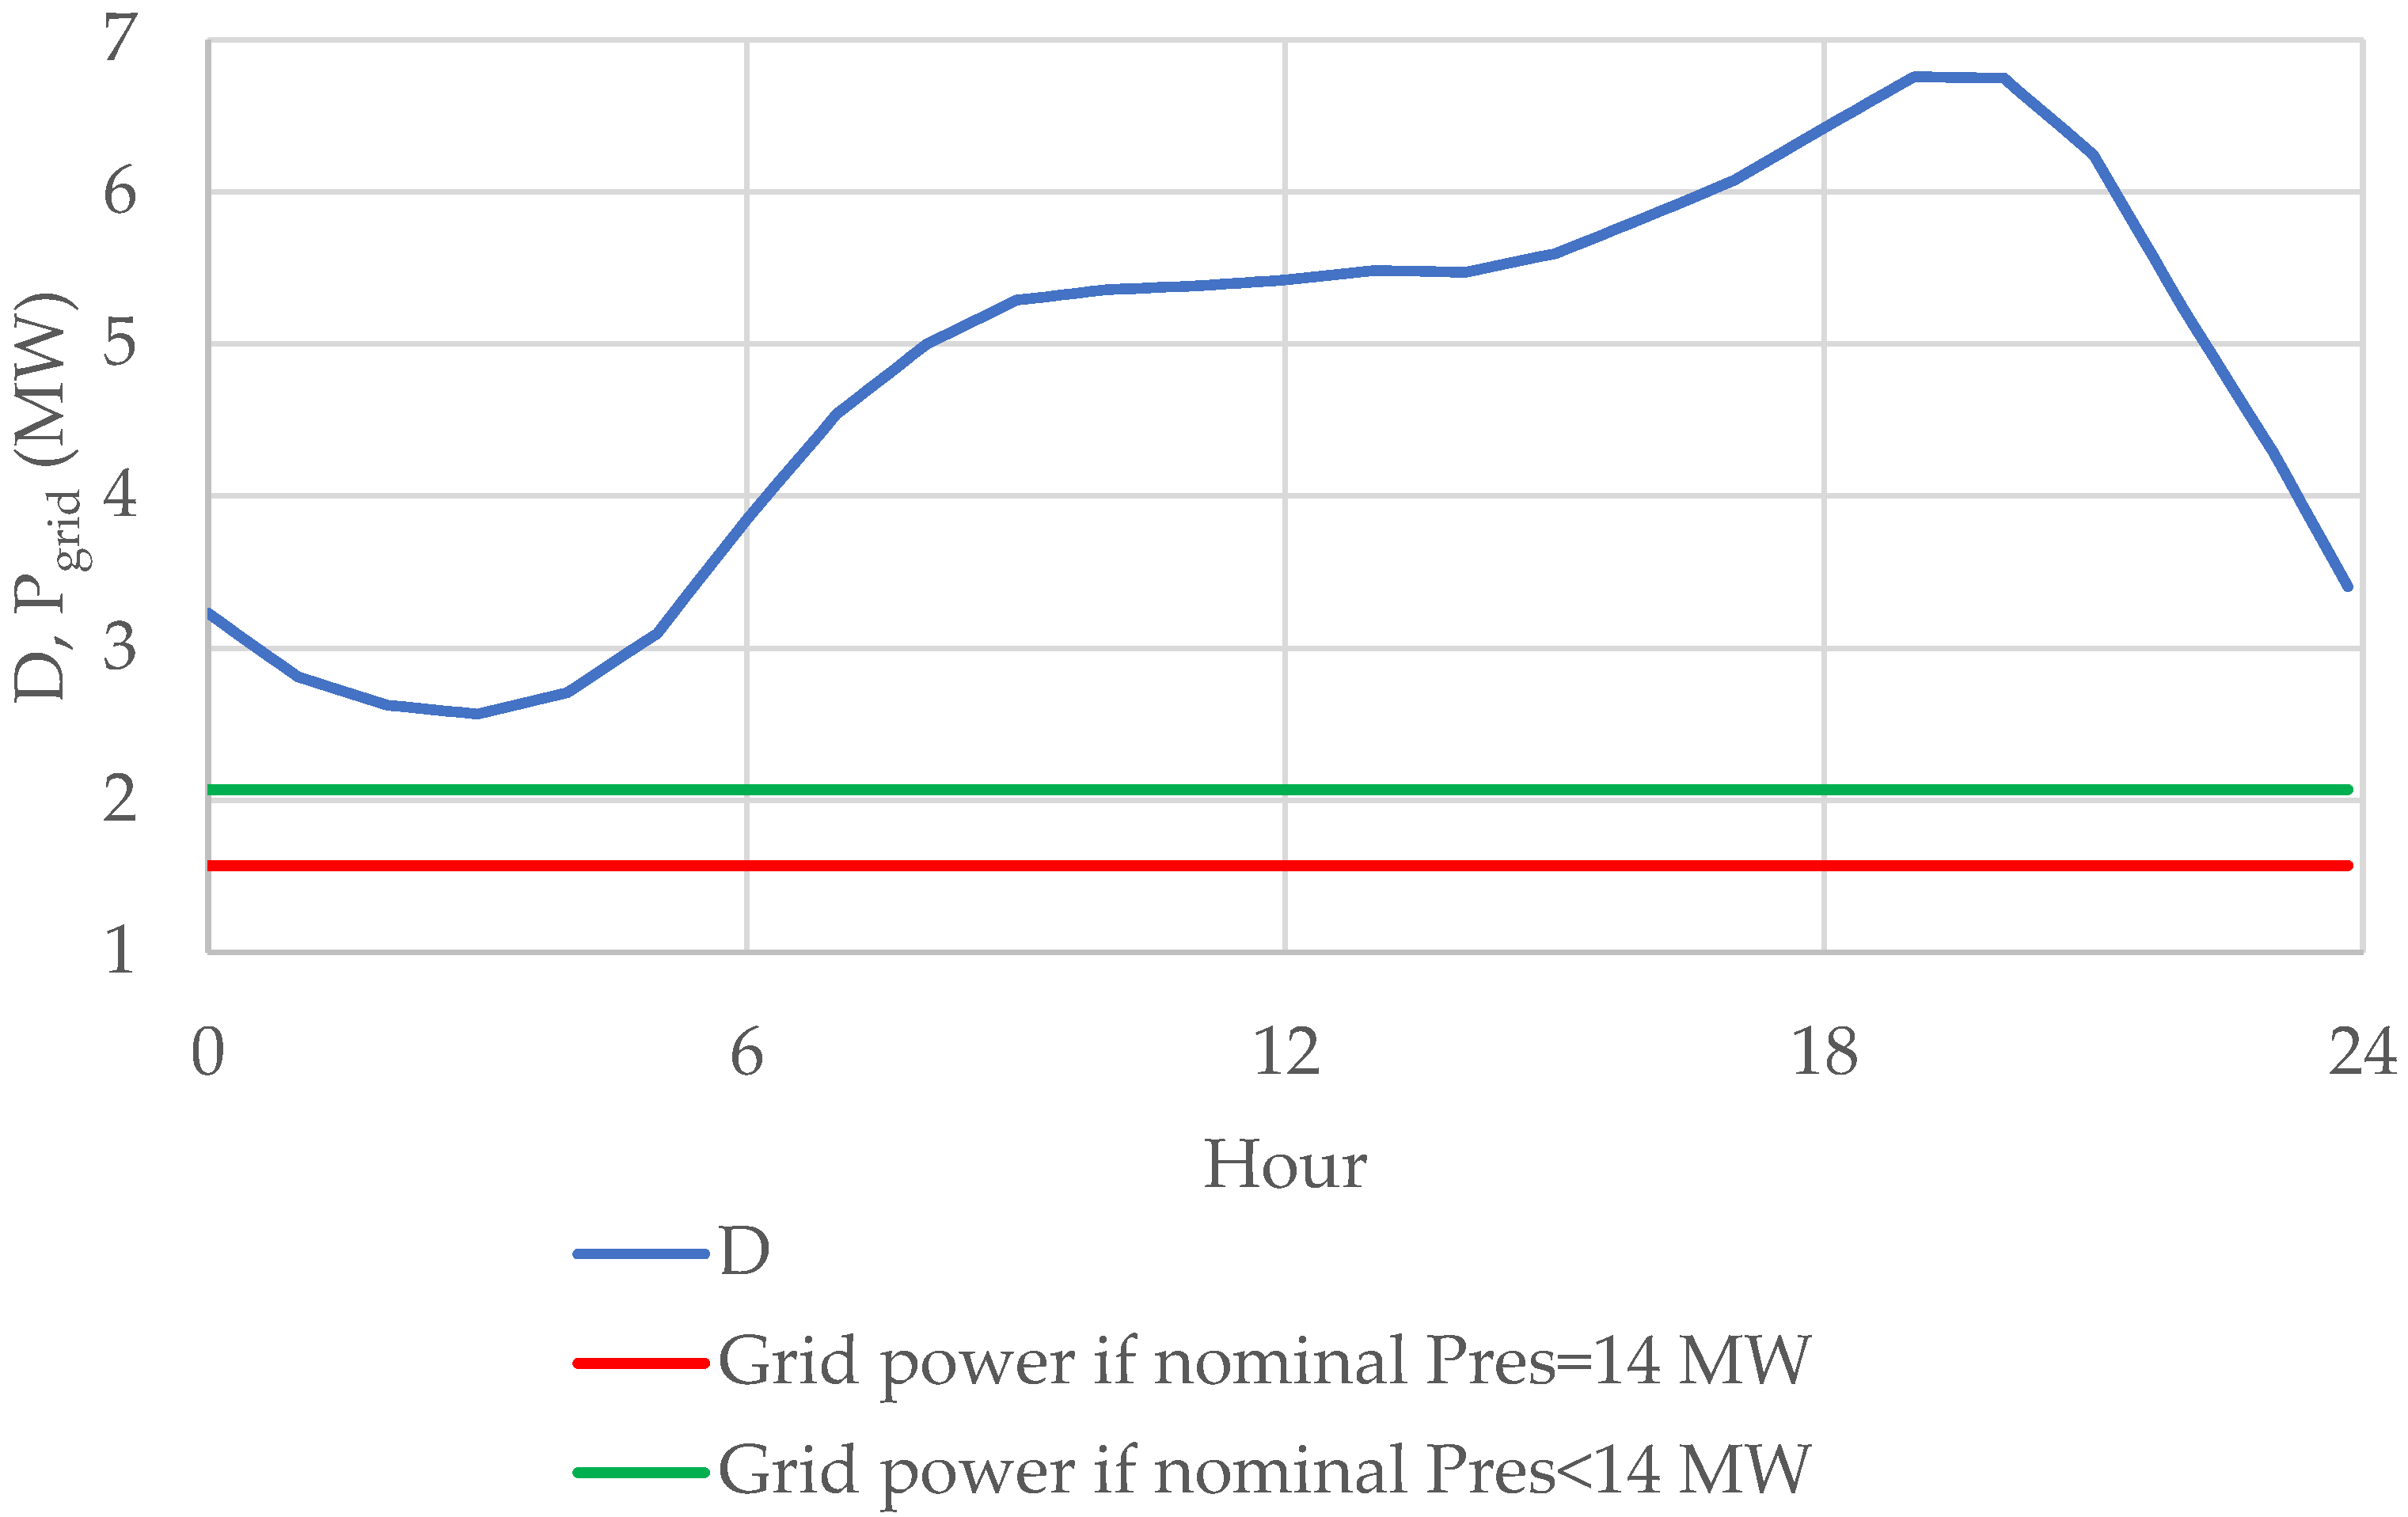
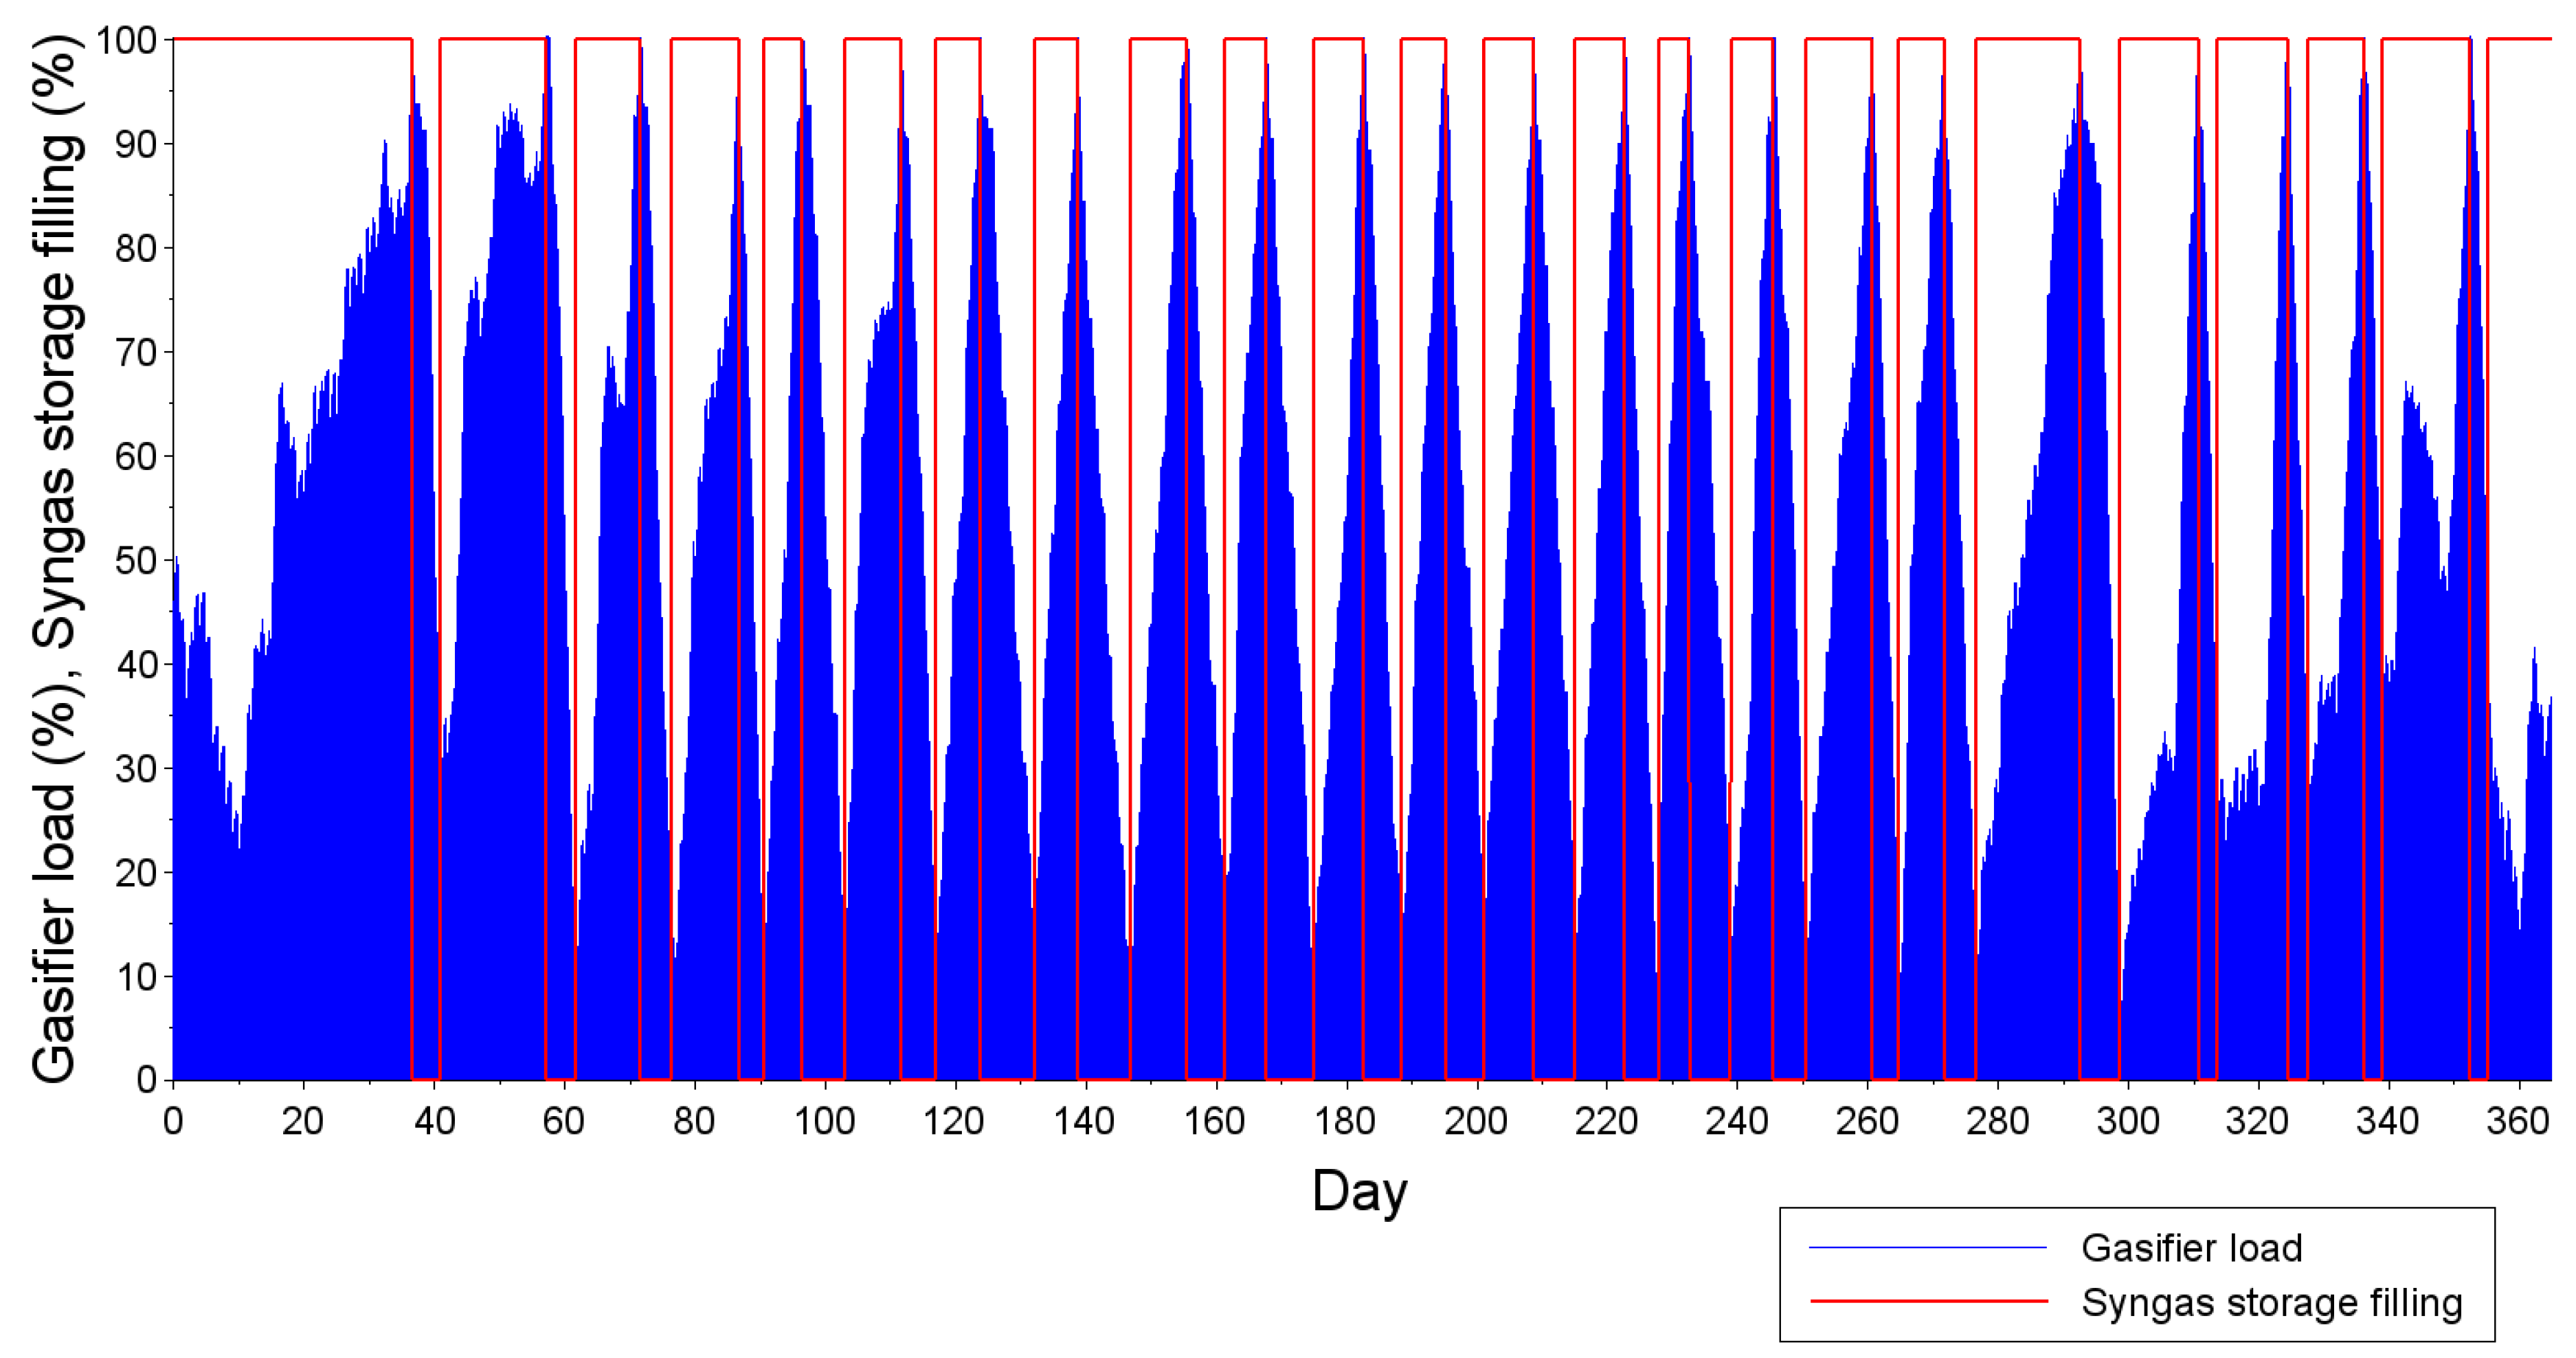
Based on the results obtained and presented in this paper, we conclude that the hybrid system consisting of RES with a waste gasification installation has positive technical, economic and environmental features. With the use of syngas storage, it is possible to use GS as a balancing power source to balance the unstable generation in RES. As a result, power consumption from the power grid is constant. Therefore, it is possible to reduce the negative impact of renewable sources and variable consumption on the power system. The use of the MSW oversieve fraction as fuel results in lower operating costs. However, due to its MSW composition and low overall efficiency, such a system is characterized by very high CO2 emissions.
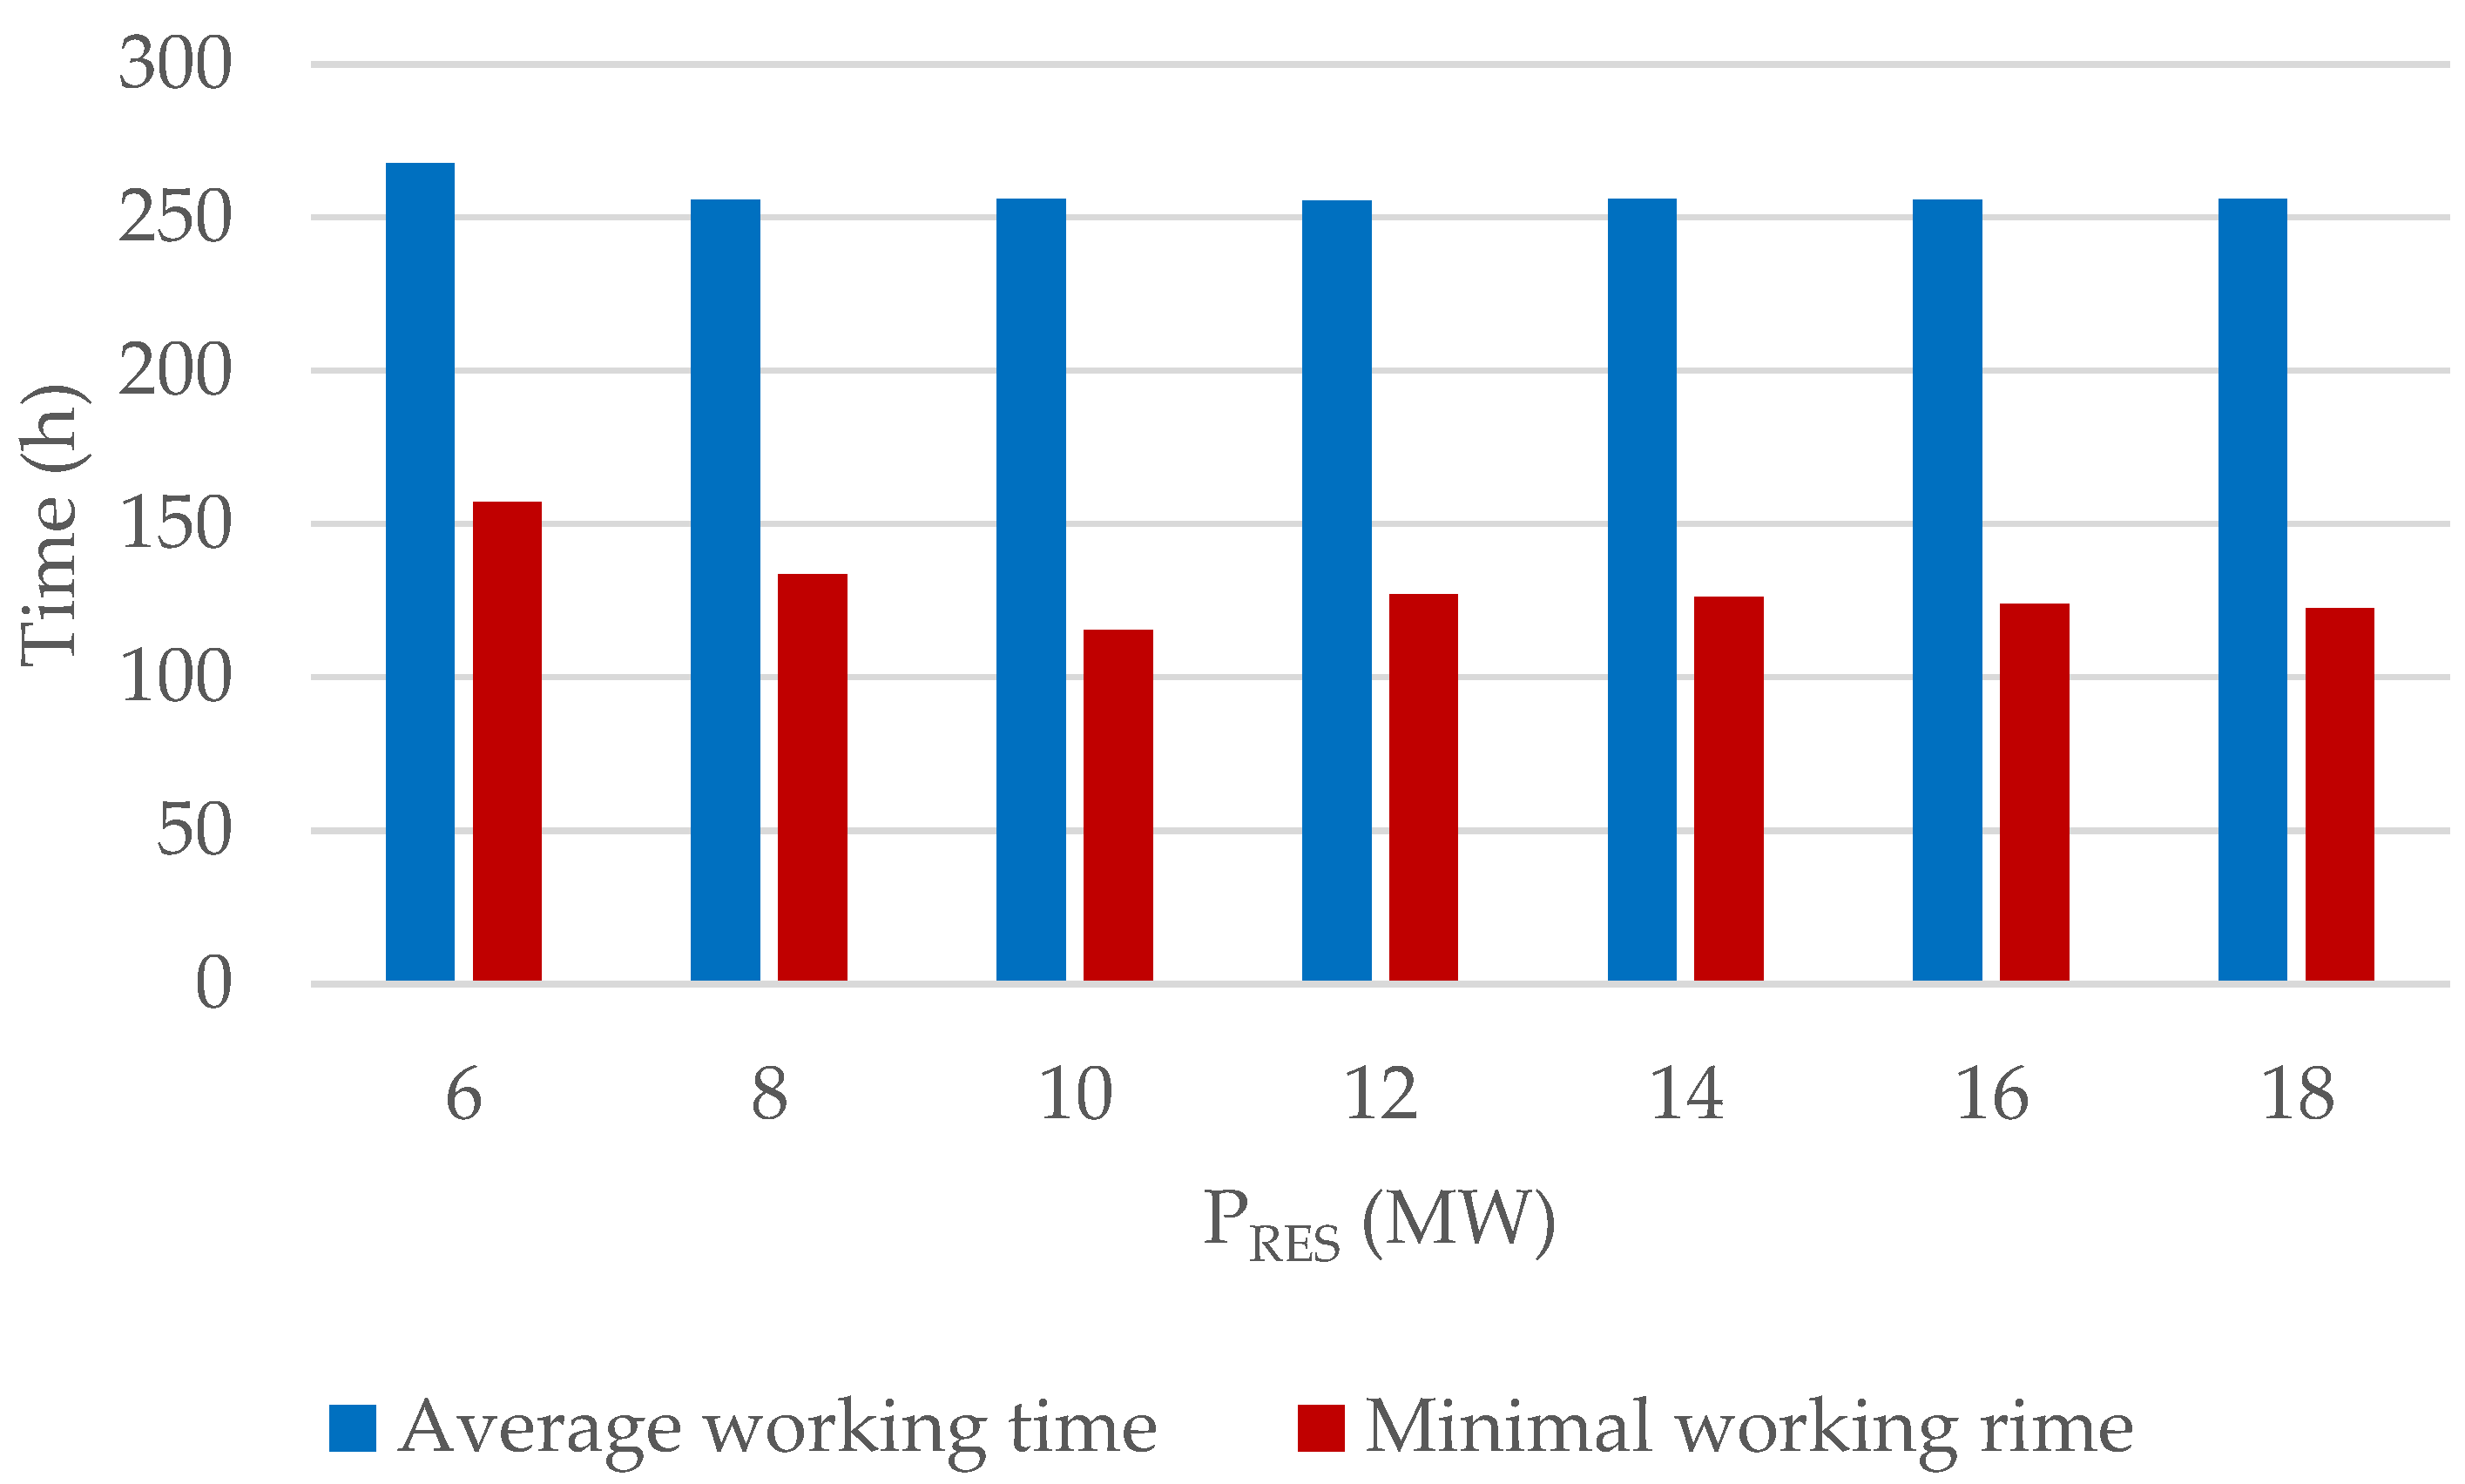
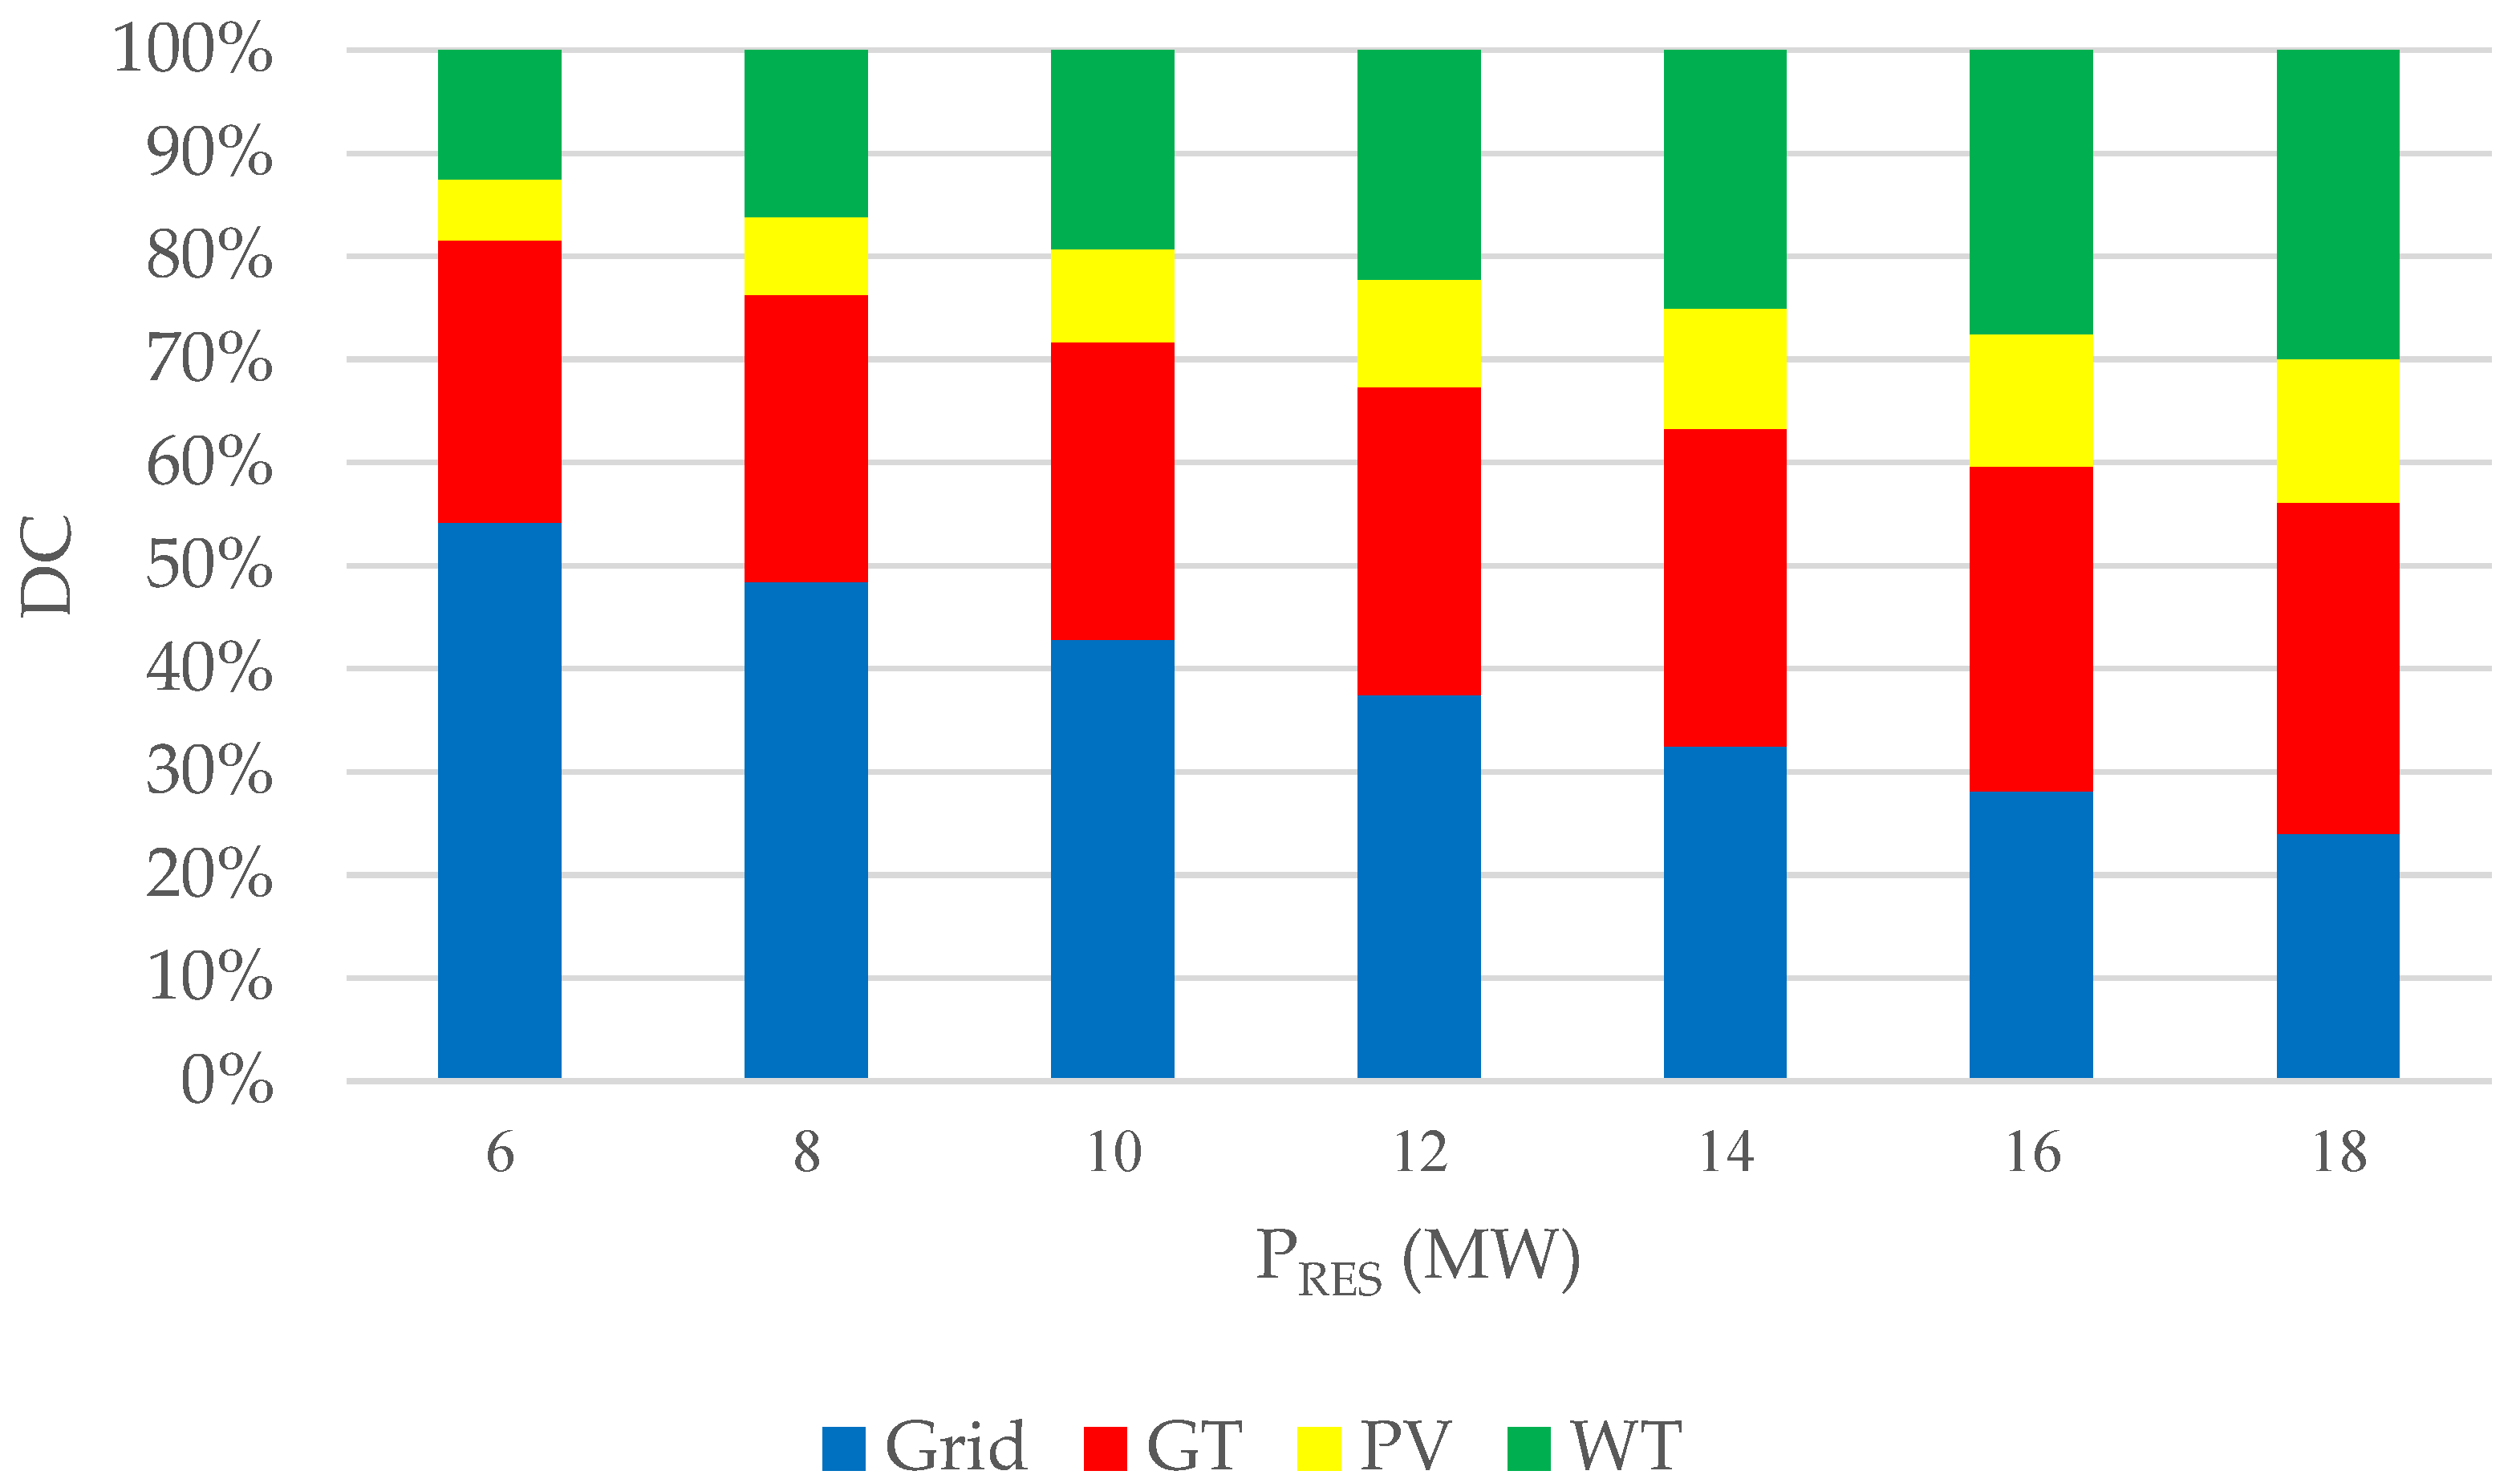
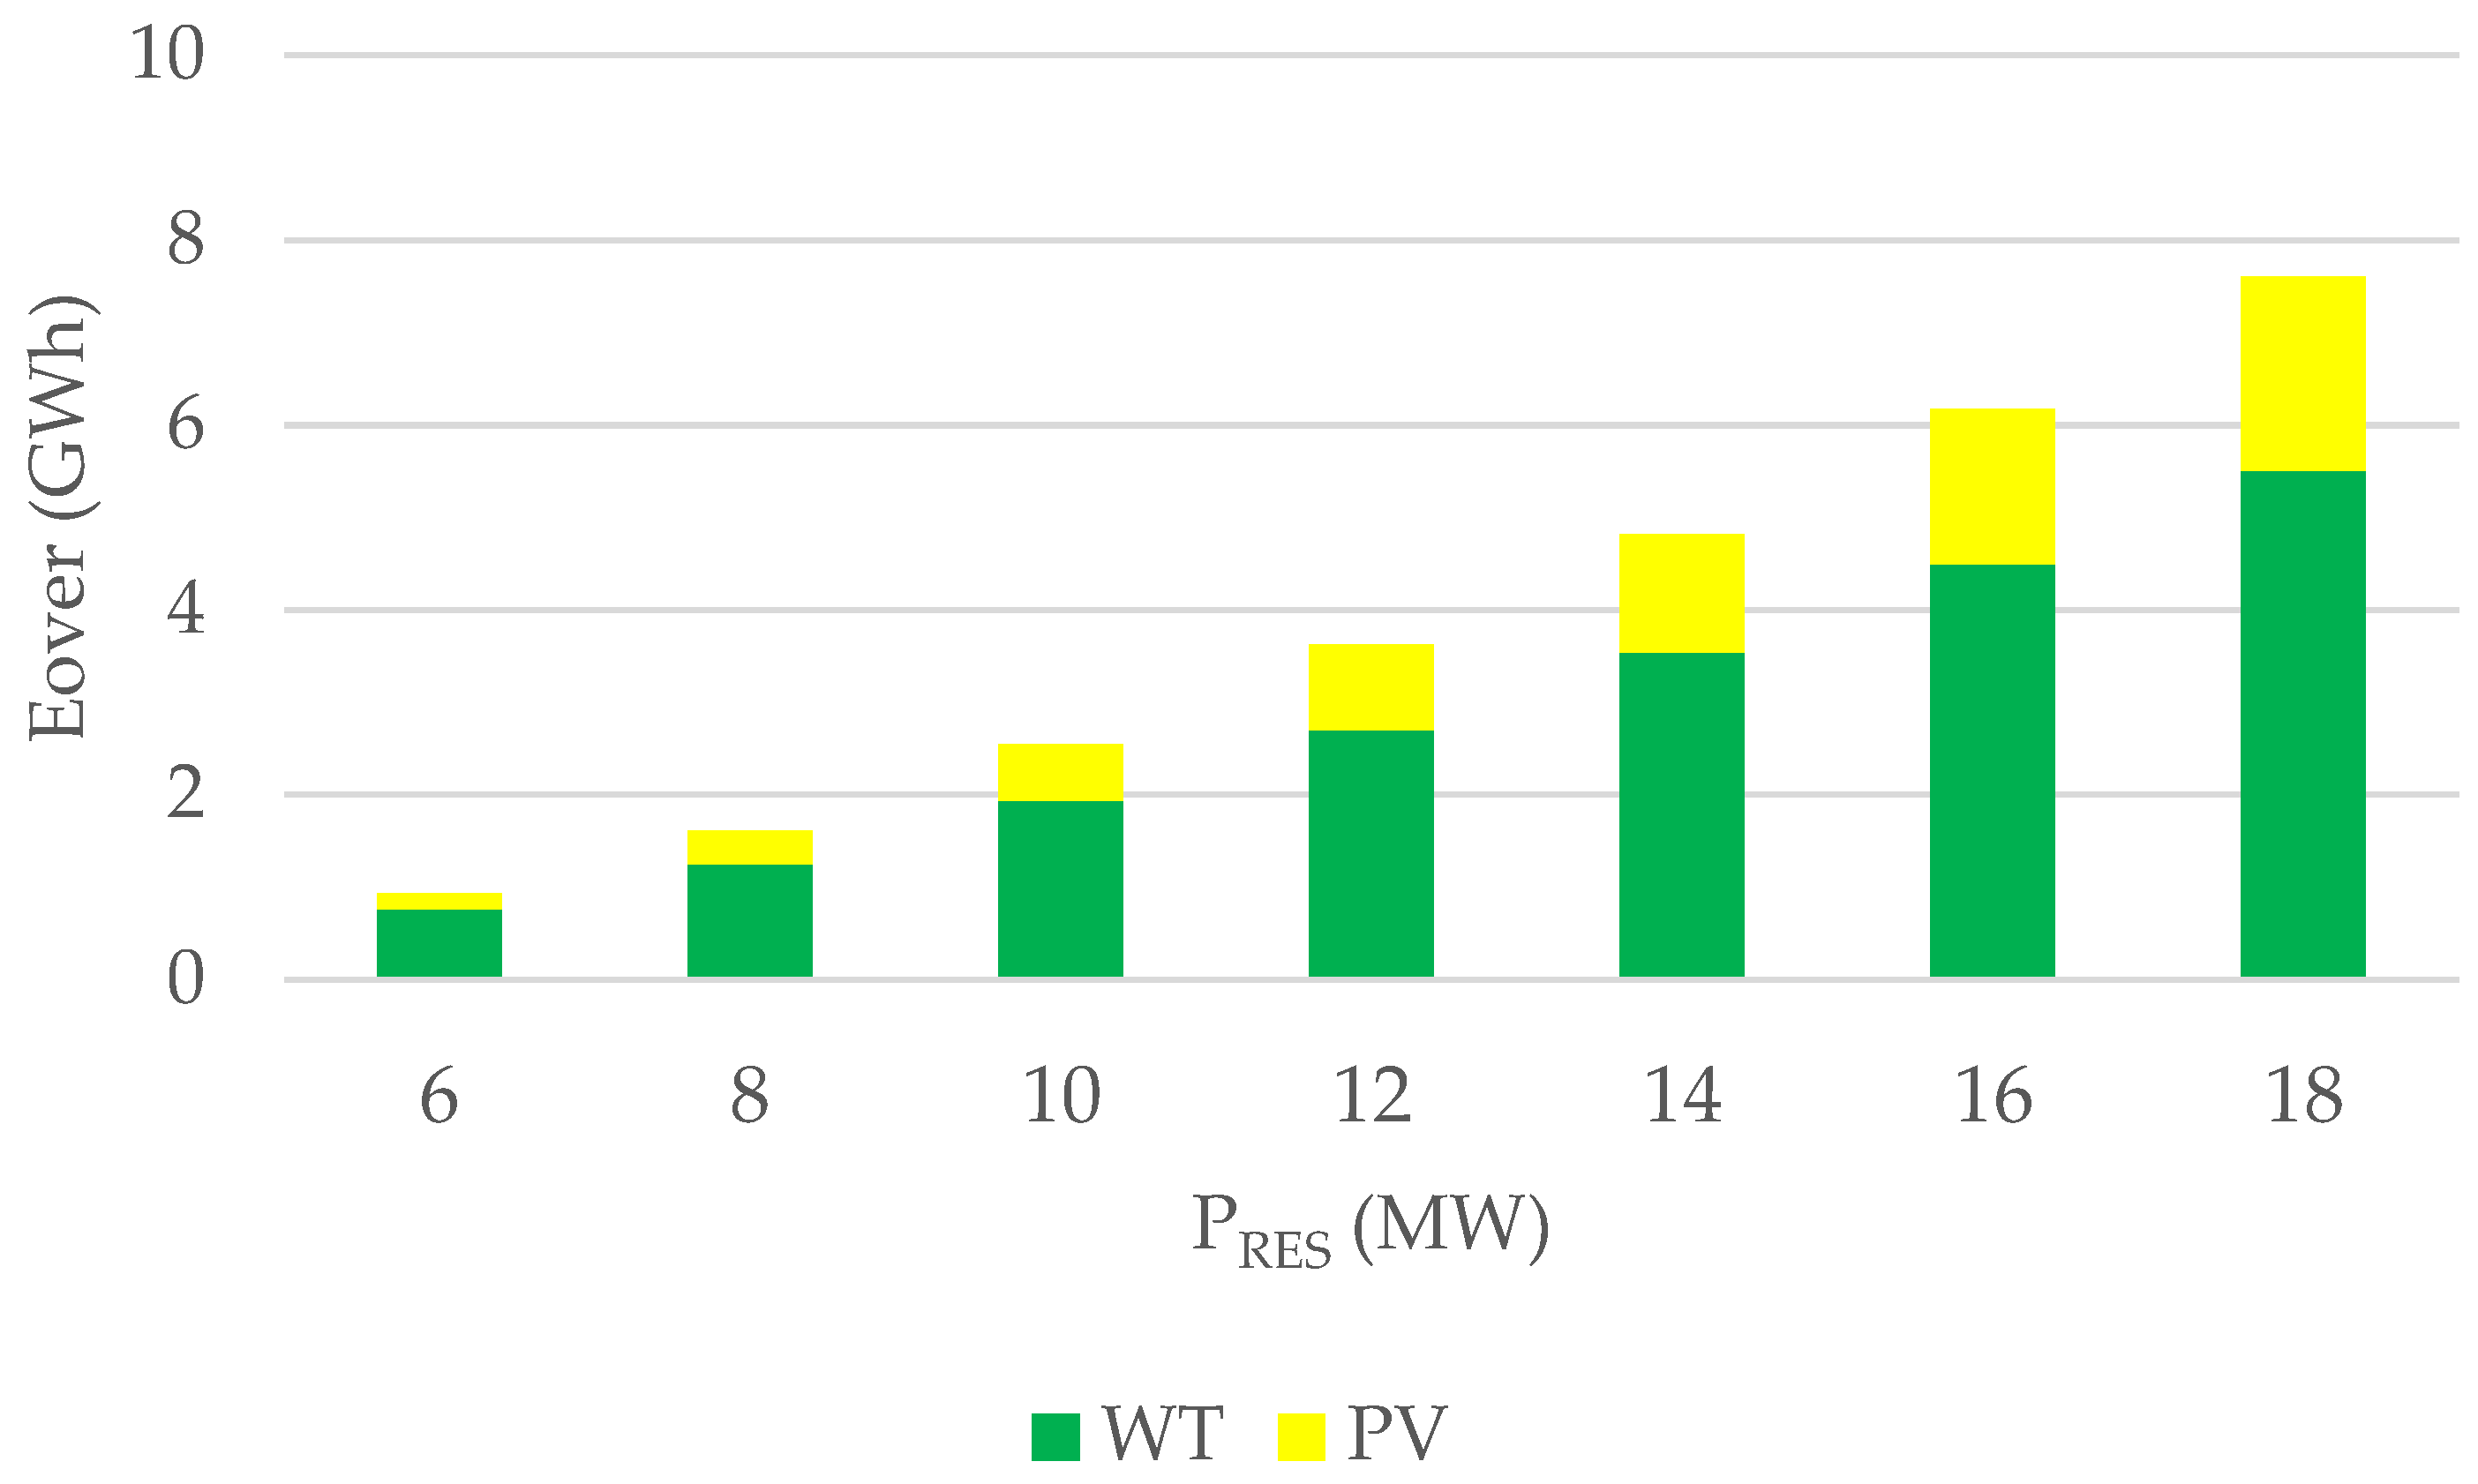
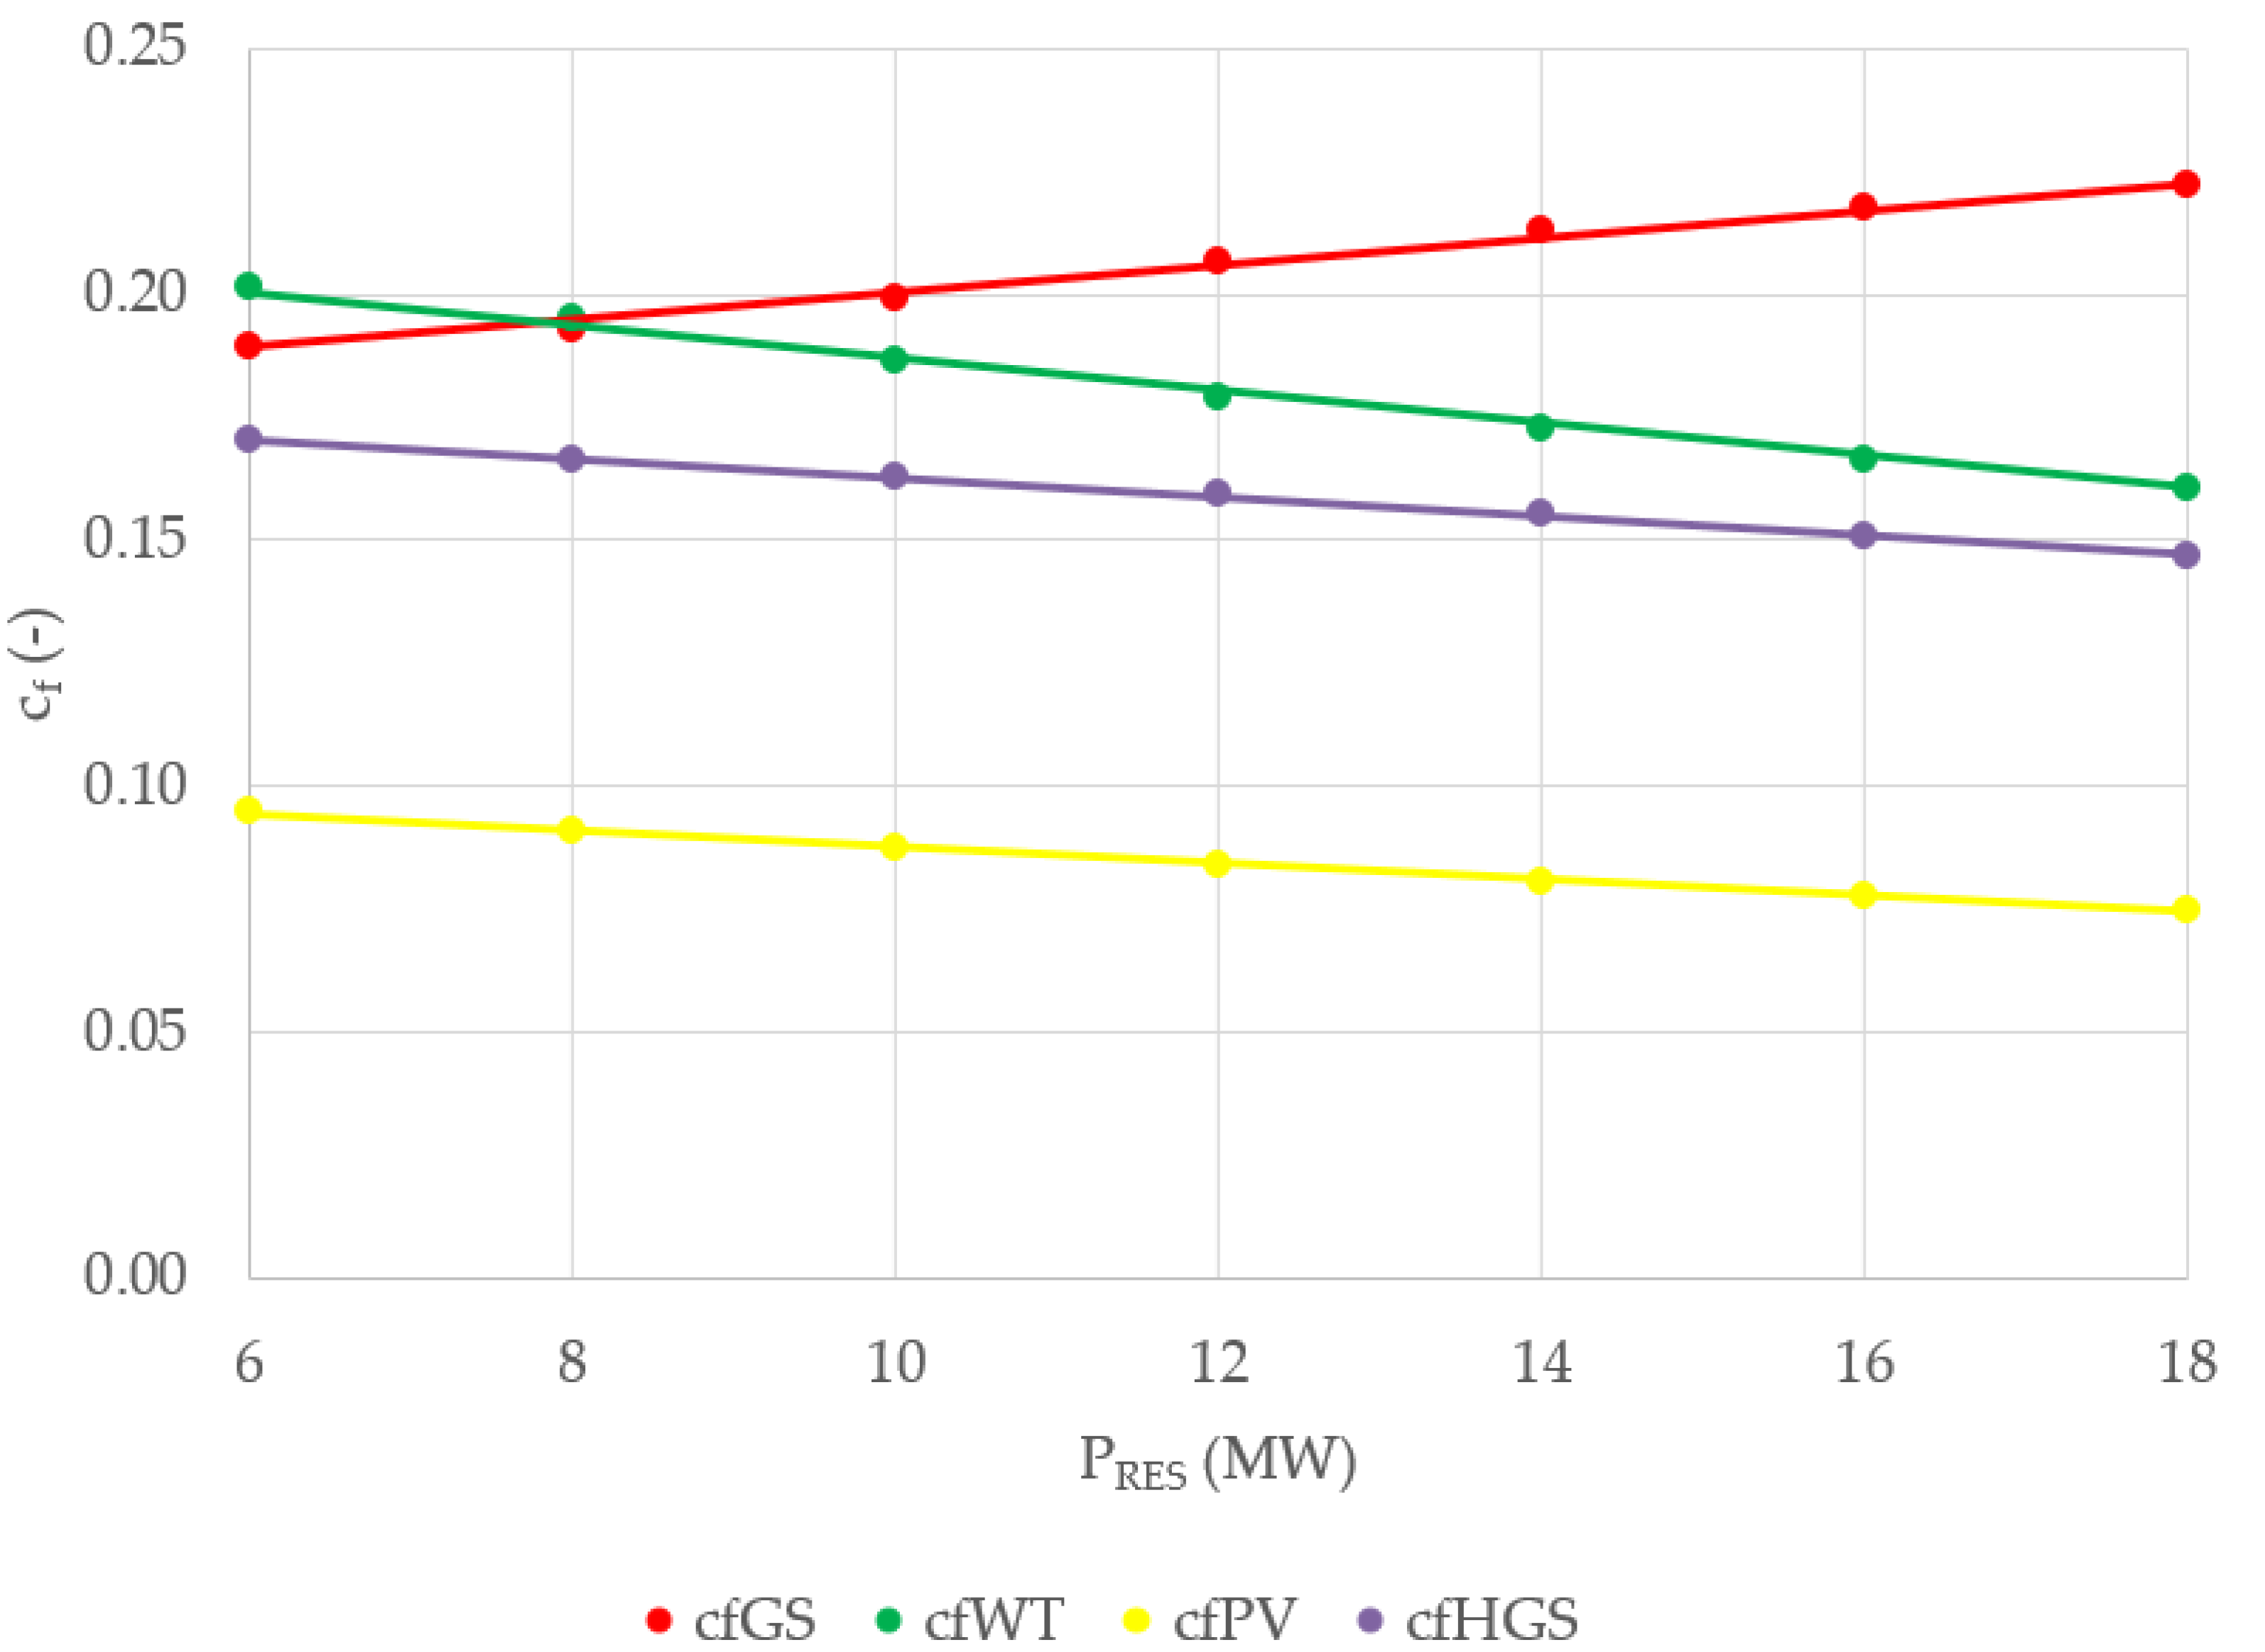
The HGS covered 46–80% of the electricity demand depending on the RES capacity. However, it was necessary to oversize the RES installed capacity beyond the maximum demand, which resulted in a significant unused potential for electricity generation equal to 1.2–7.6 GWh. However, the lower capacity of renewable sources results a in smaller coverage of demand by the HGS. Yet, there is also a parabolic decrease in excess generation. With larger RES nominal powers, the efficiency and capacity factors of PV and WT decreased as more electricity generation was unused. However, the capacity factor of the gasification system increased.
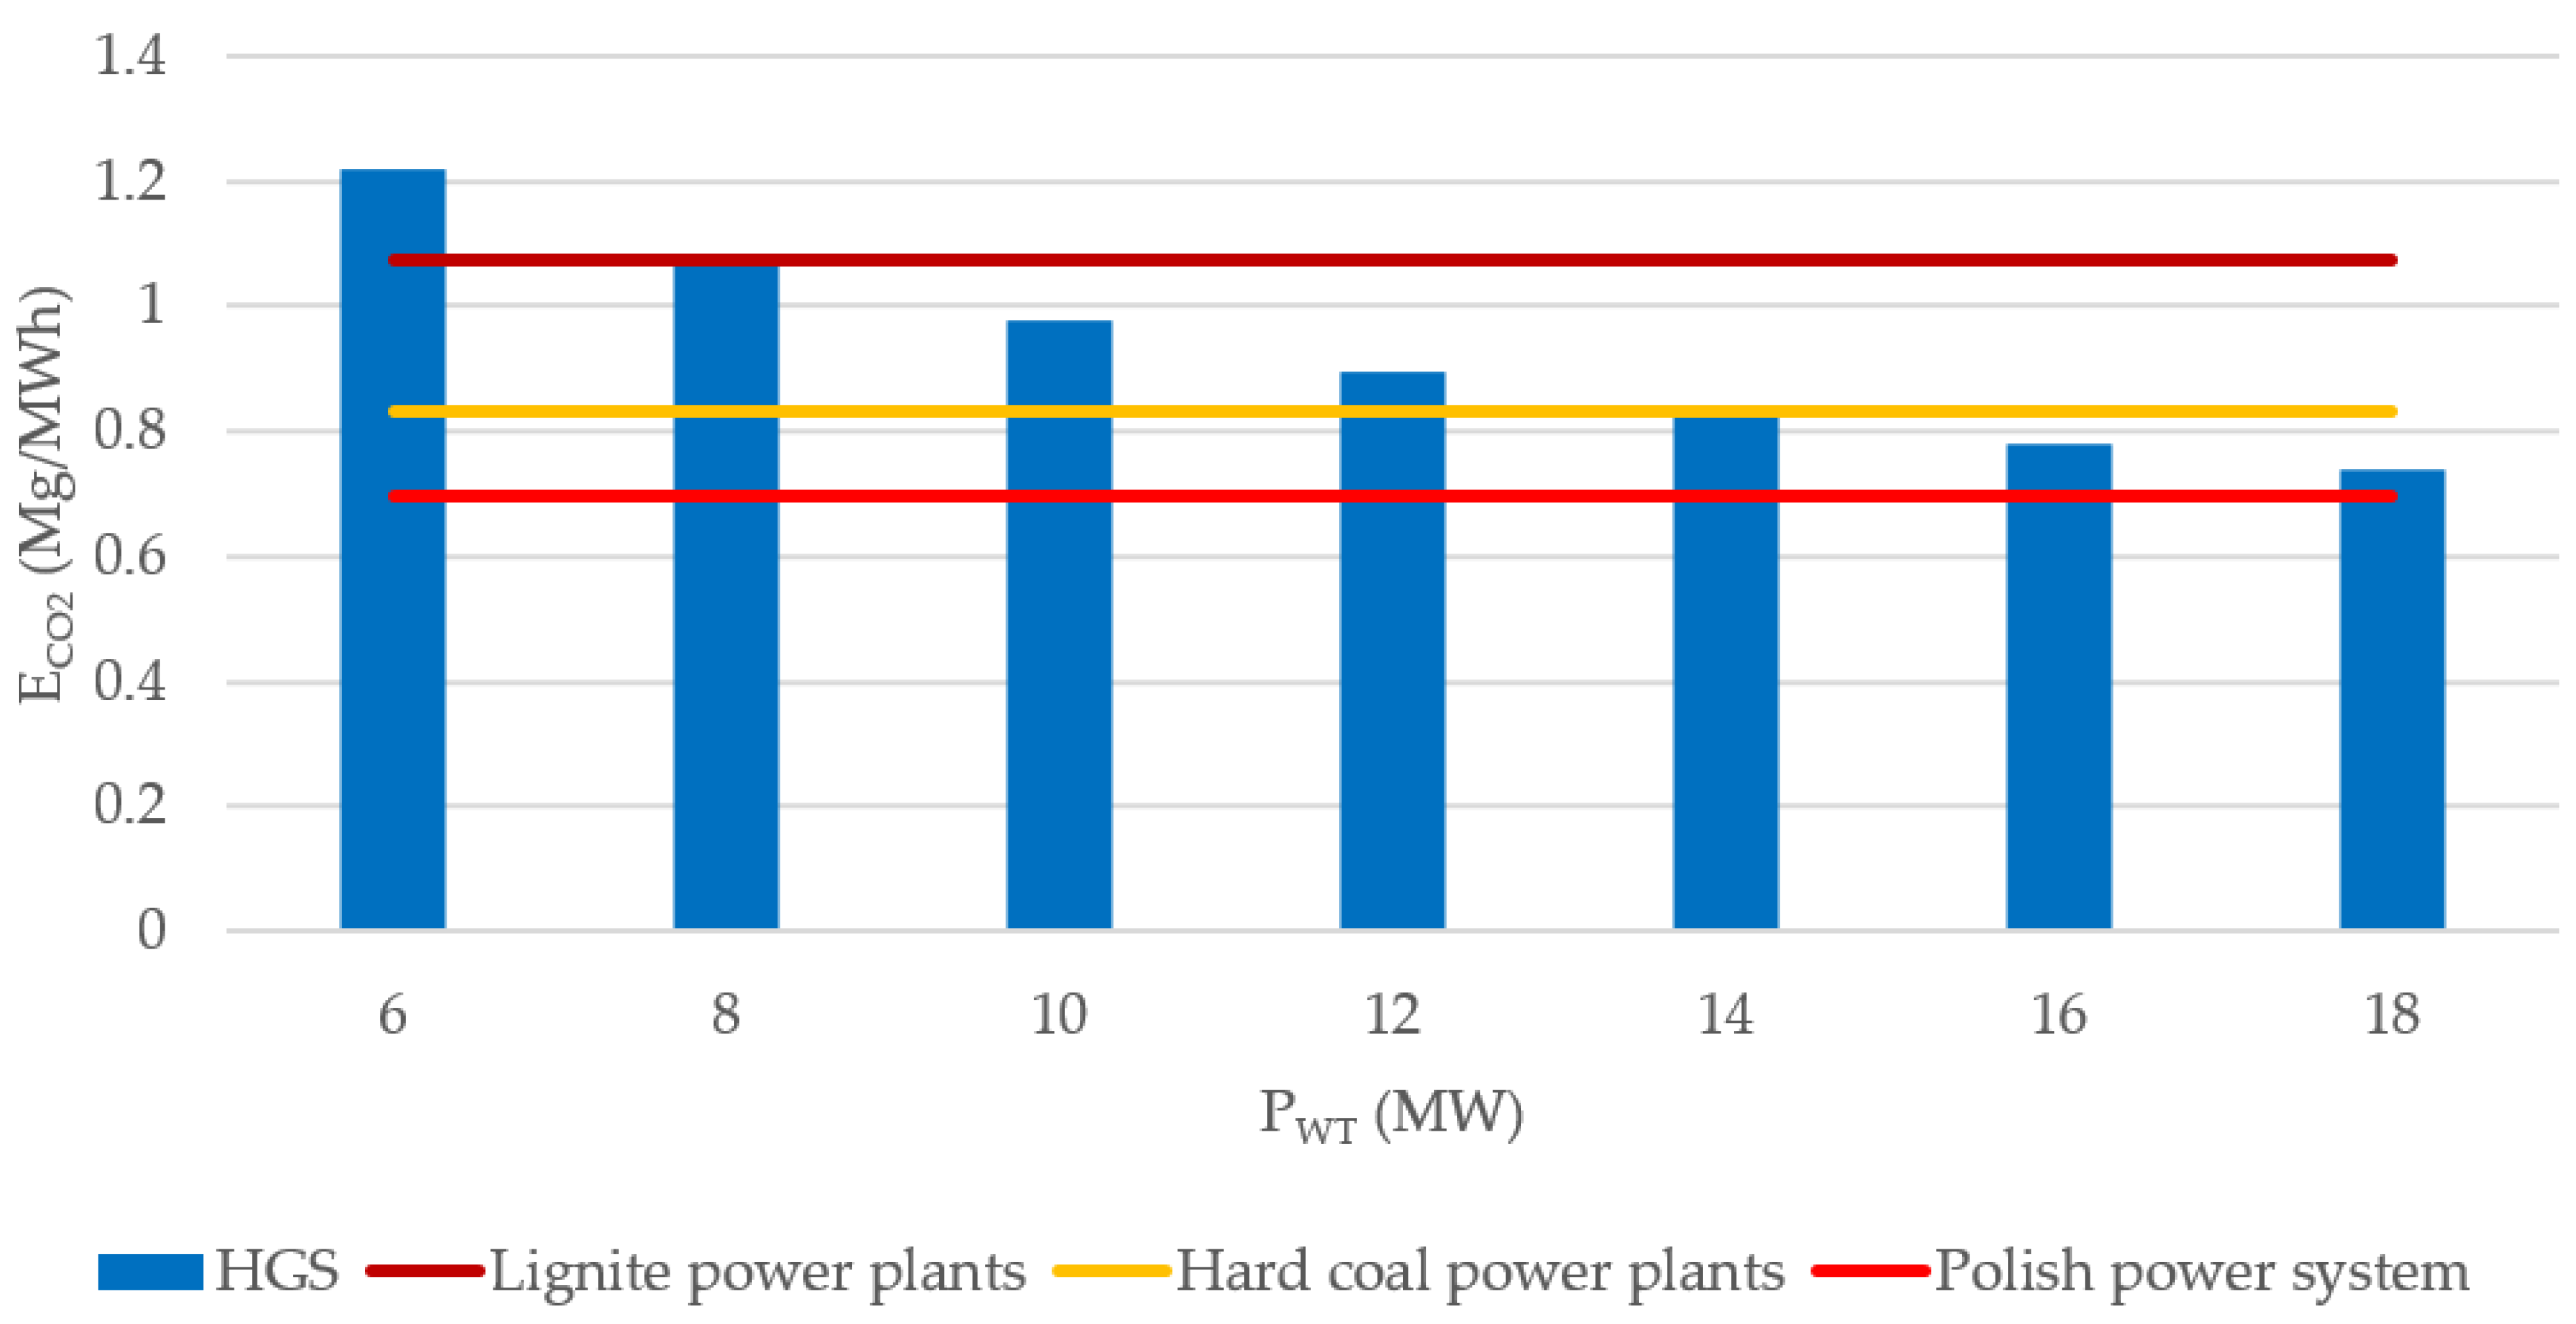
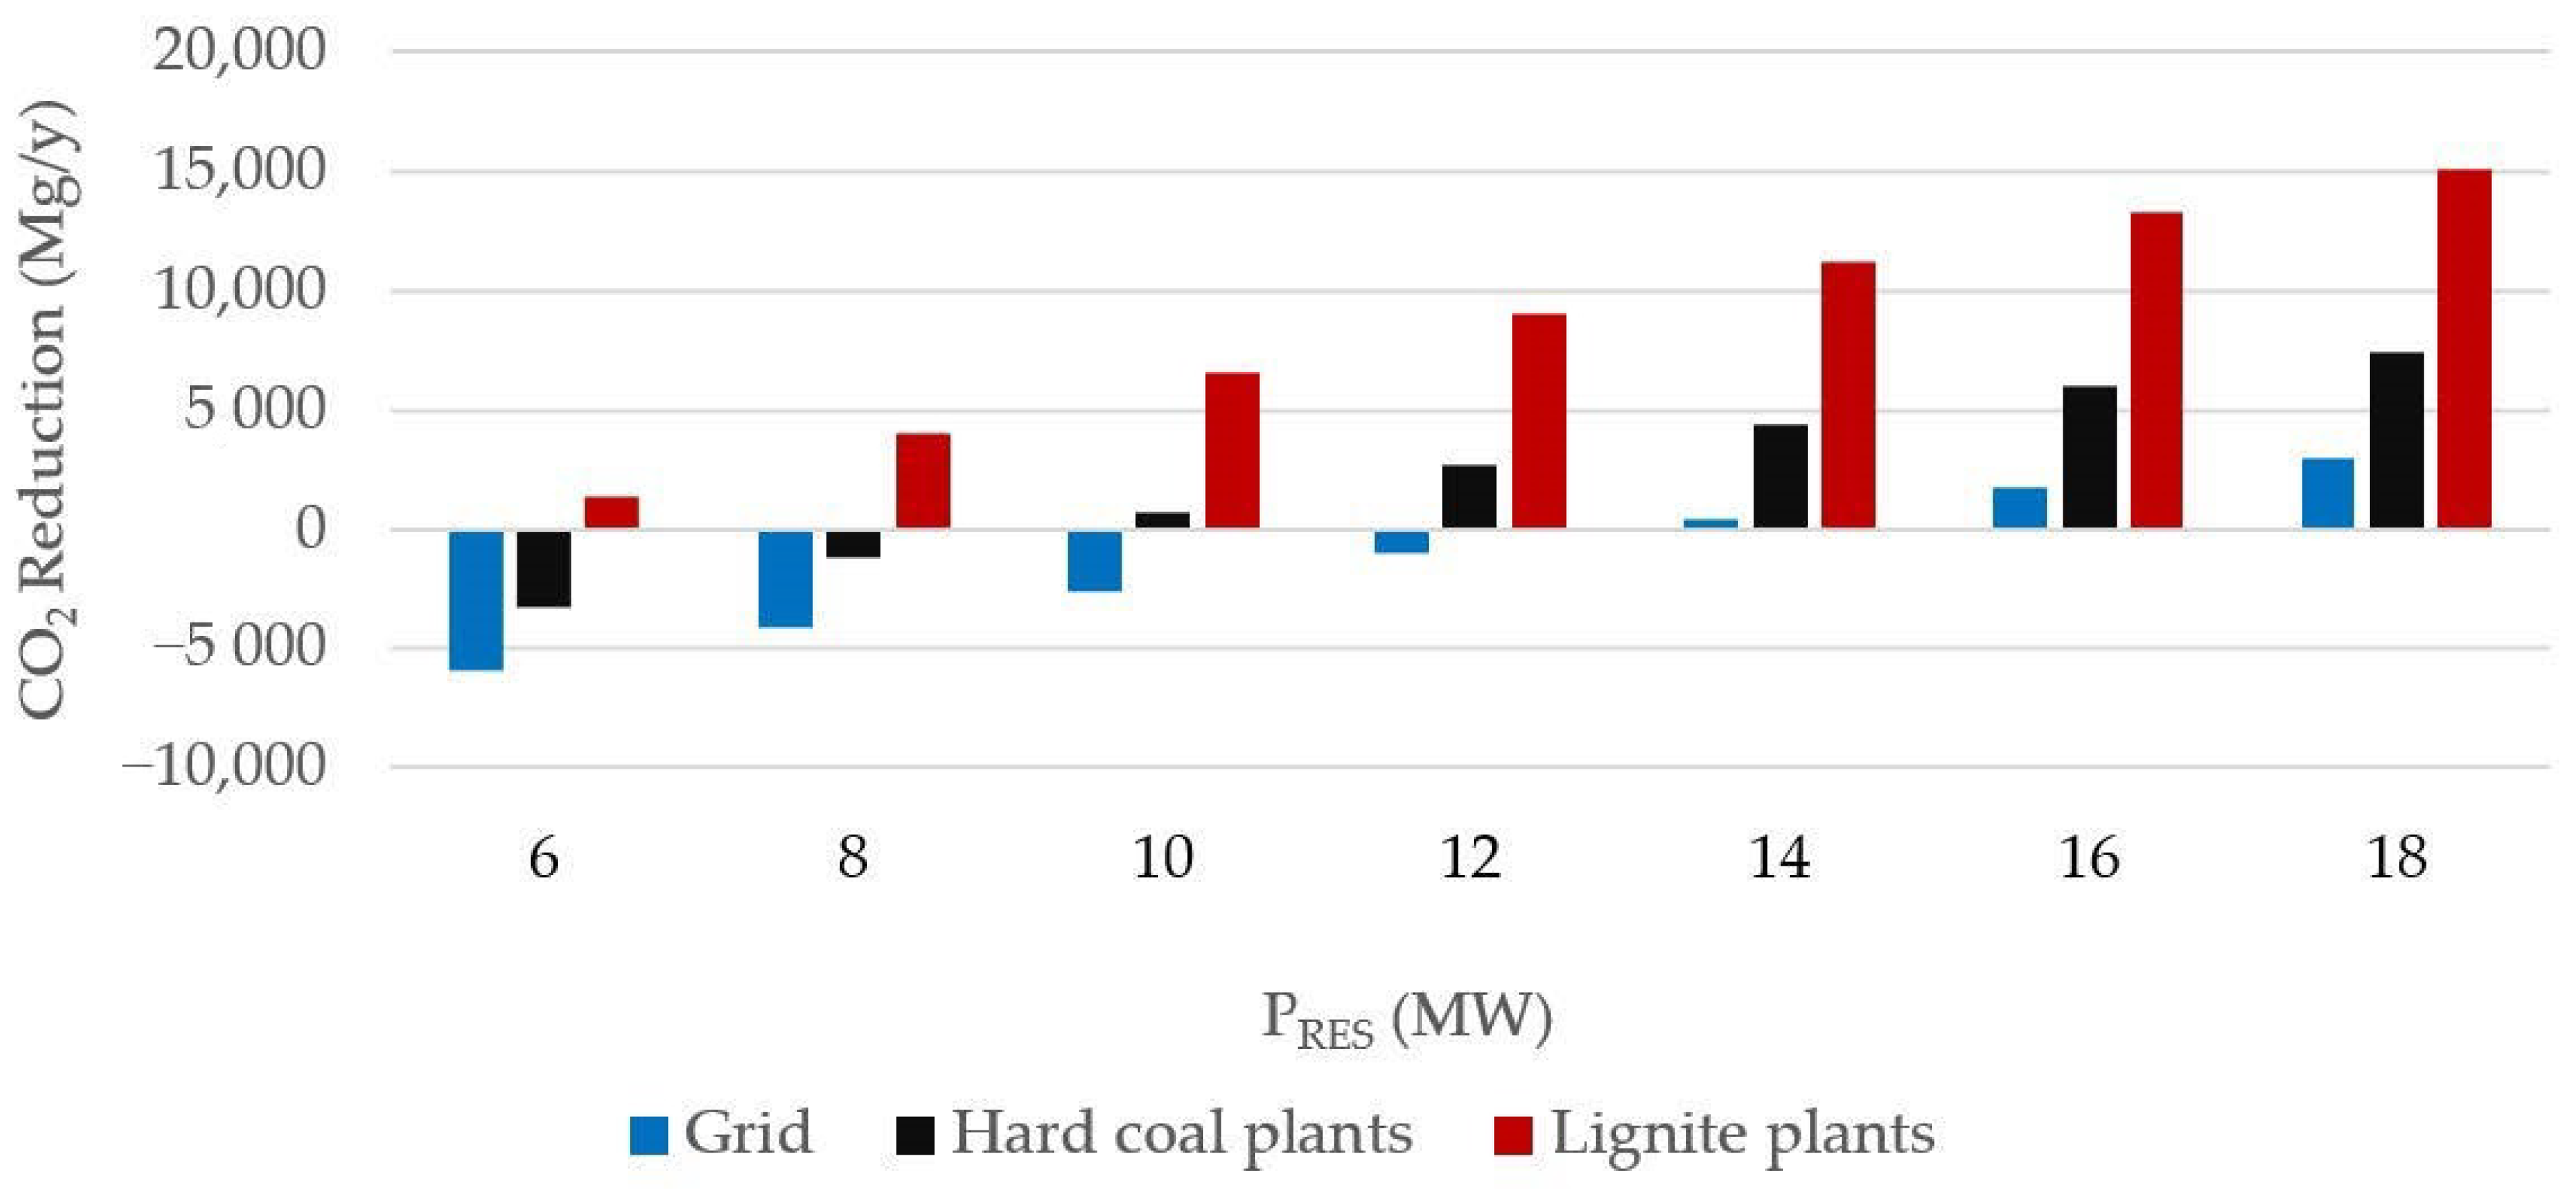
The HGS analyzed here is characterized by high CO2 emissions, which exceed the emission factor of the Polish power system. However, in most variants, it is lower than the emissivity of lignite-fired power plants and, with an RES capacity greater than 14 MW, lower than that of hard coal-fired power plants. Moreover, the gasification system disposes of waste, and thus reduces the requirements for landfill and the emissions of harmful substances from landfills (particularly CH4). The HGS can reduce greenhouse gas emissions compared with electricity generation in the power system including waste landfilling.
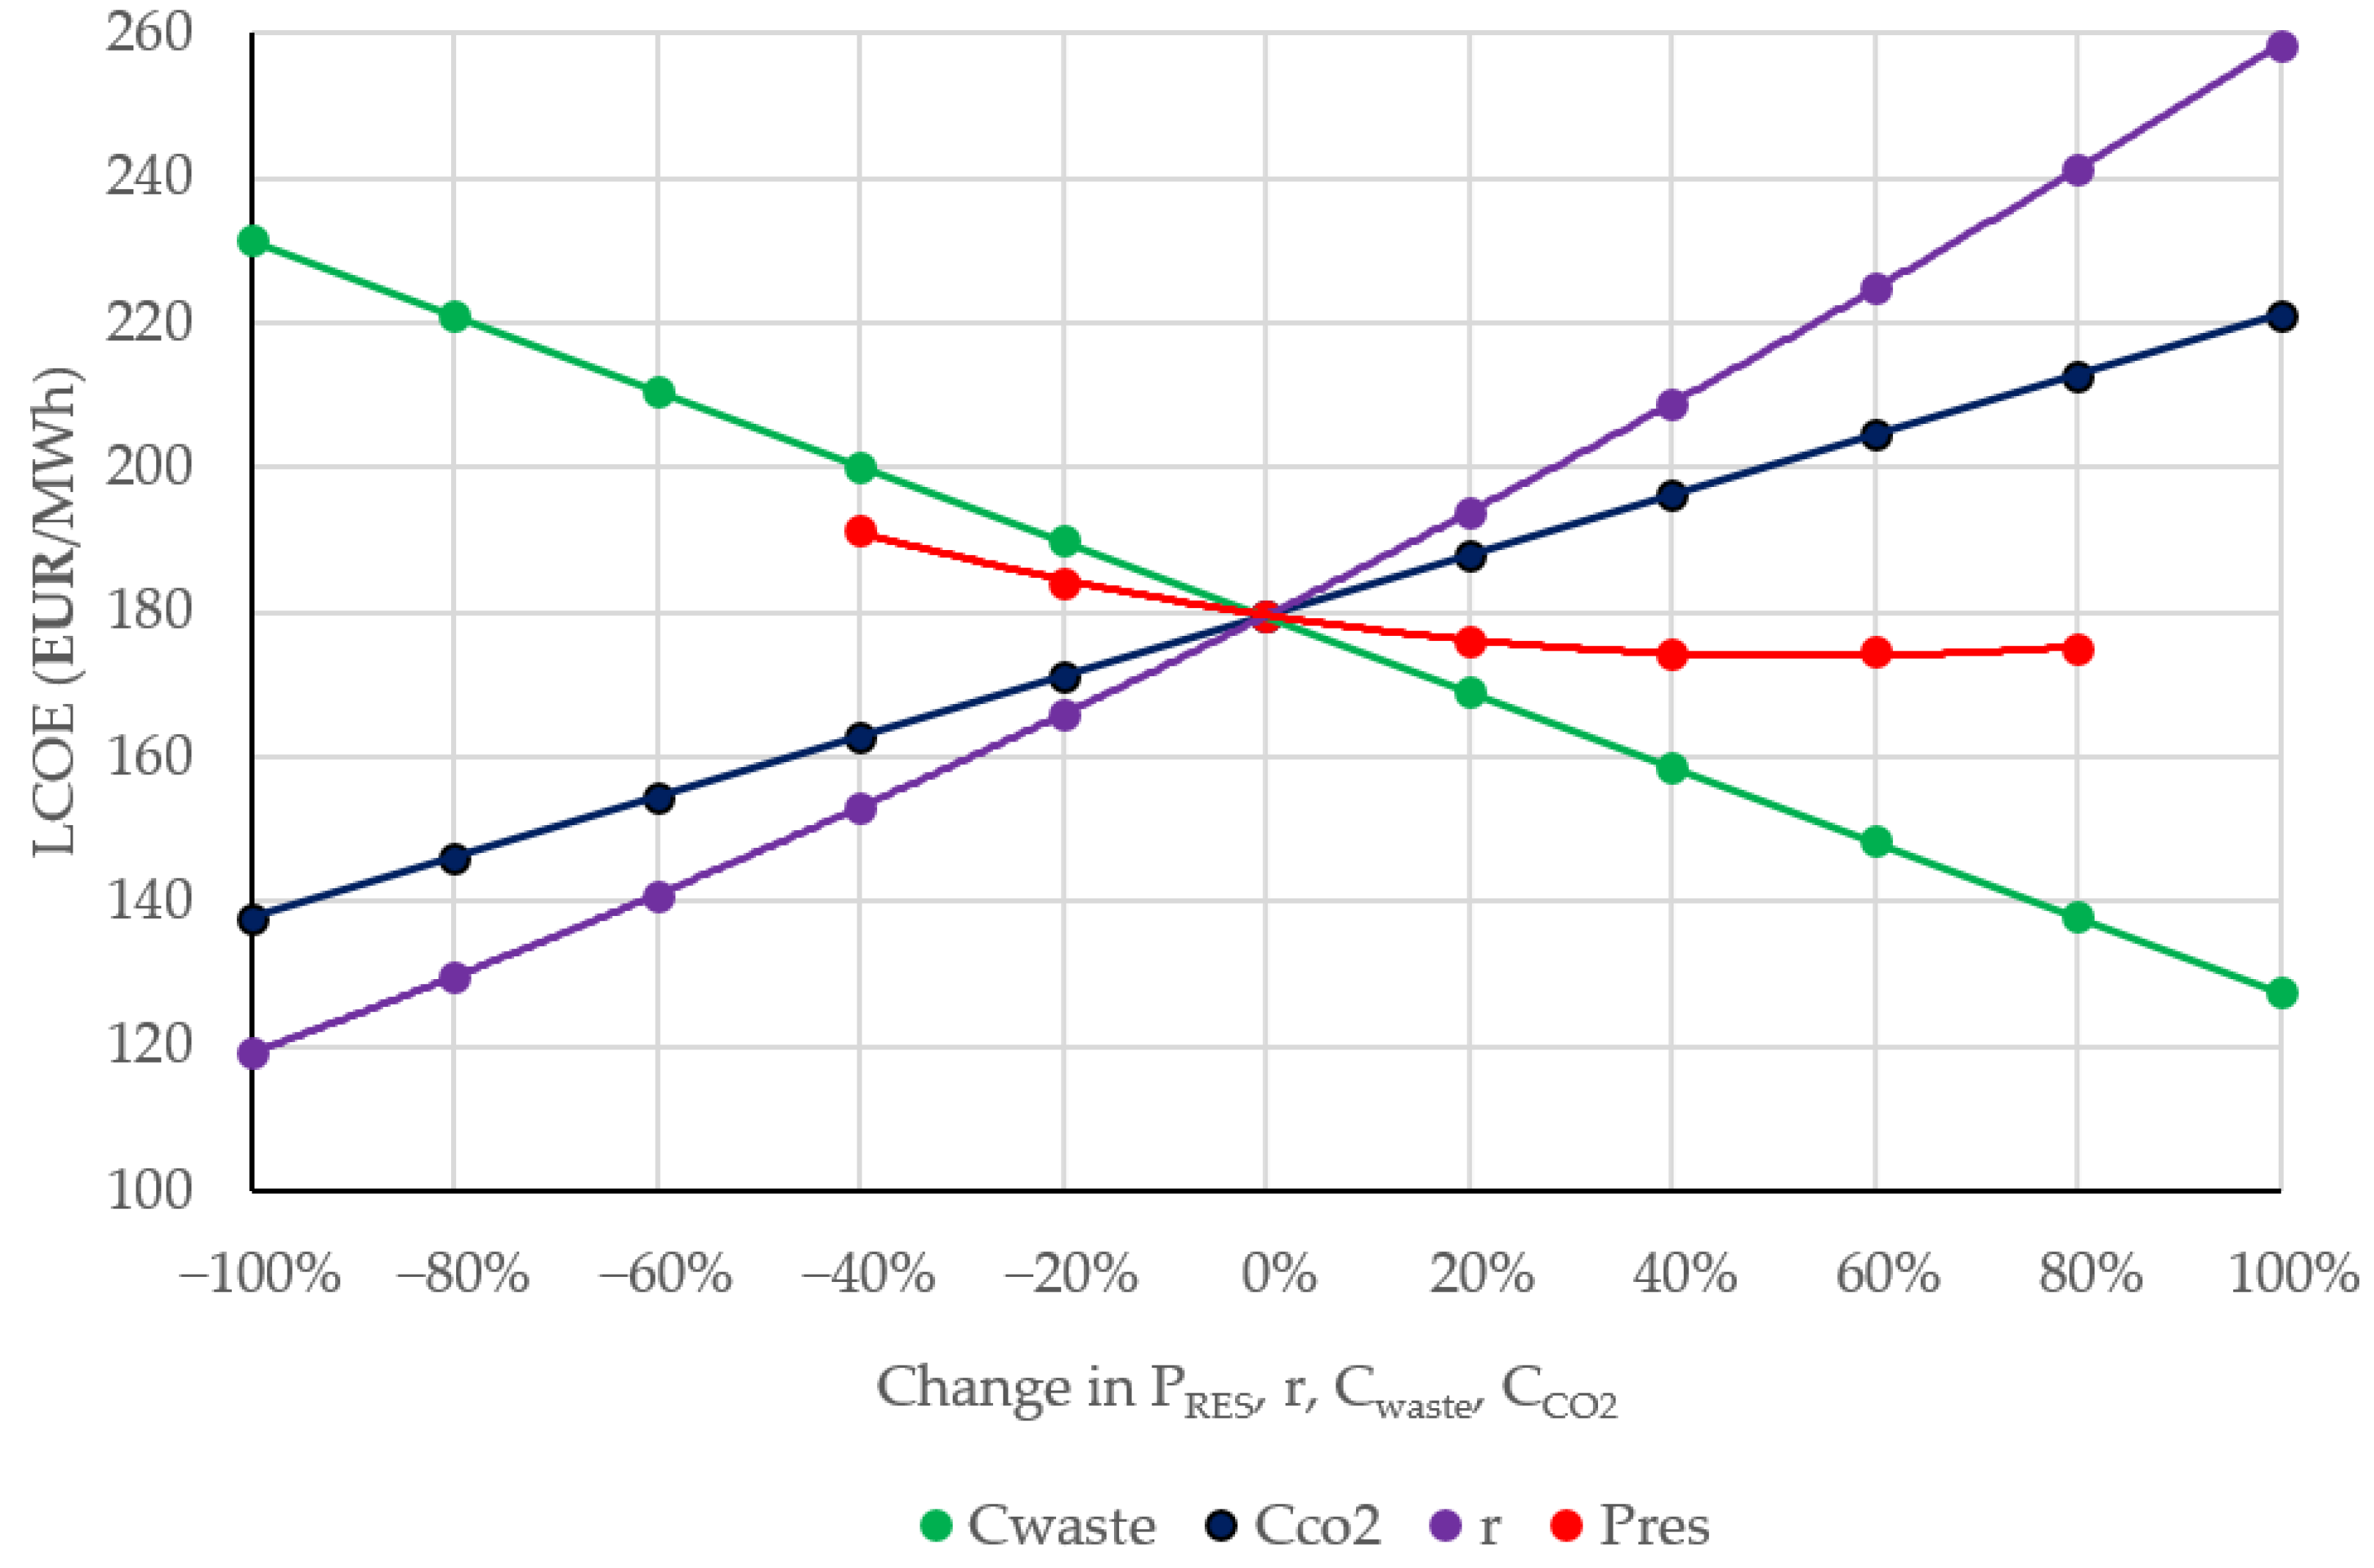
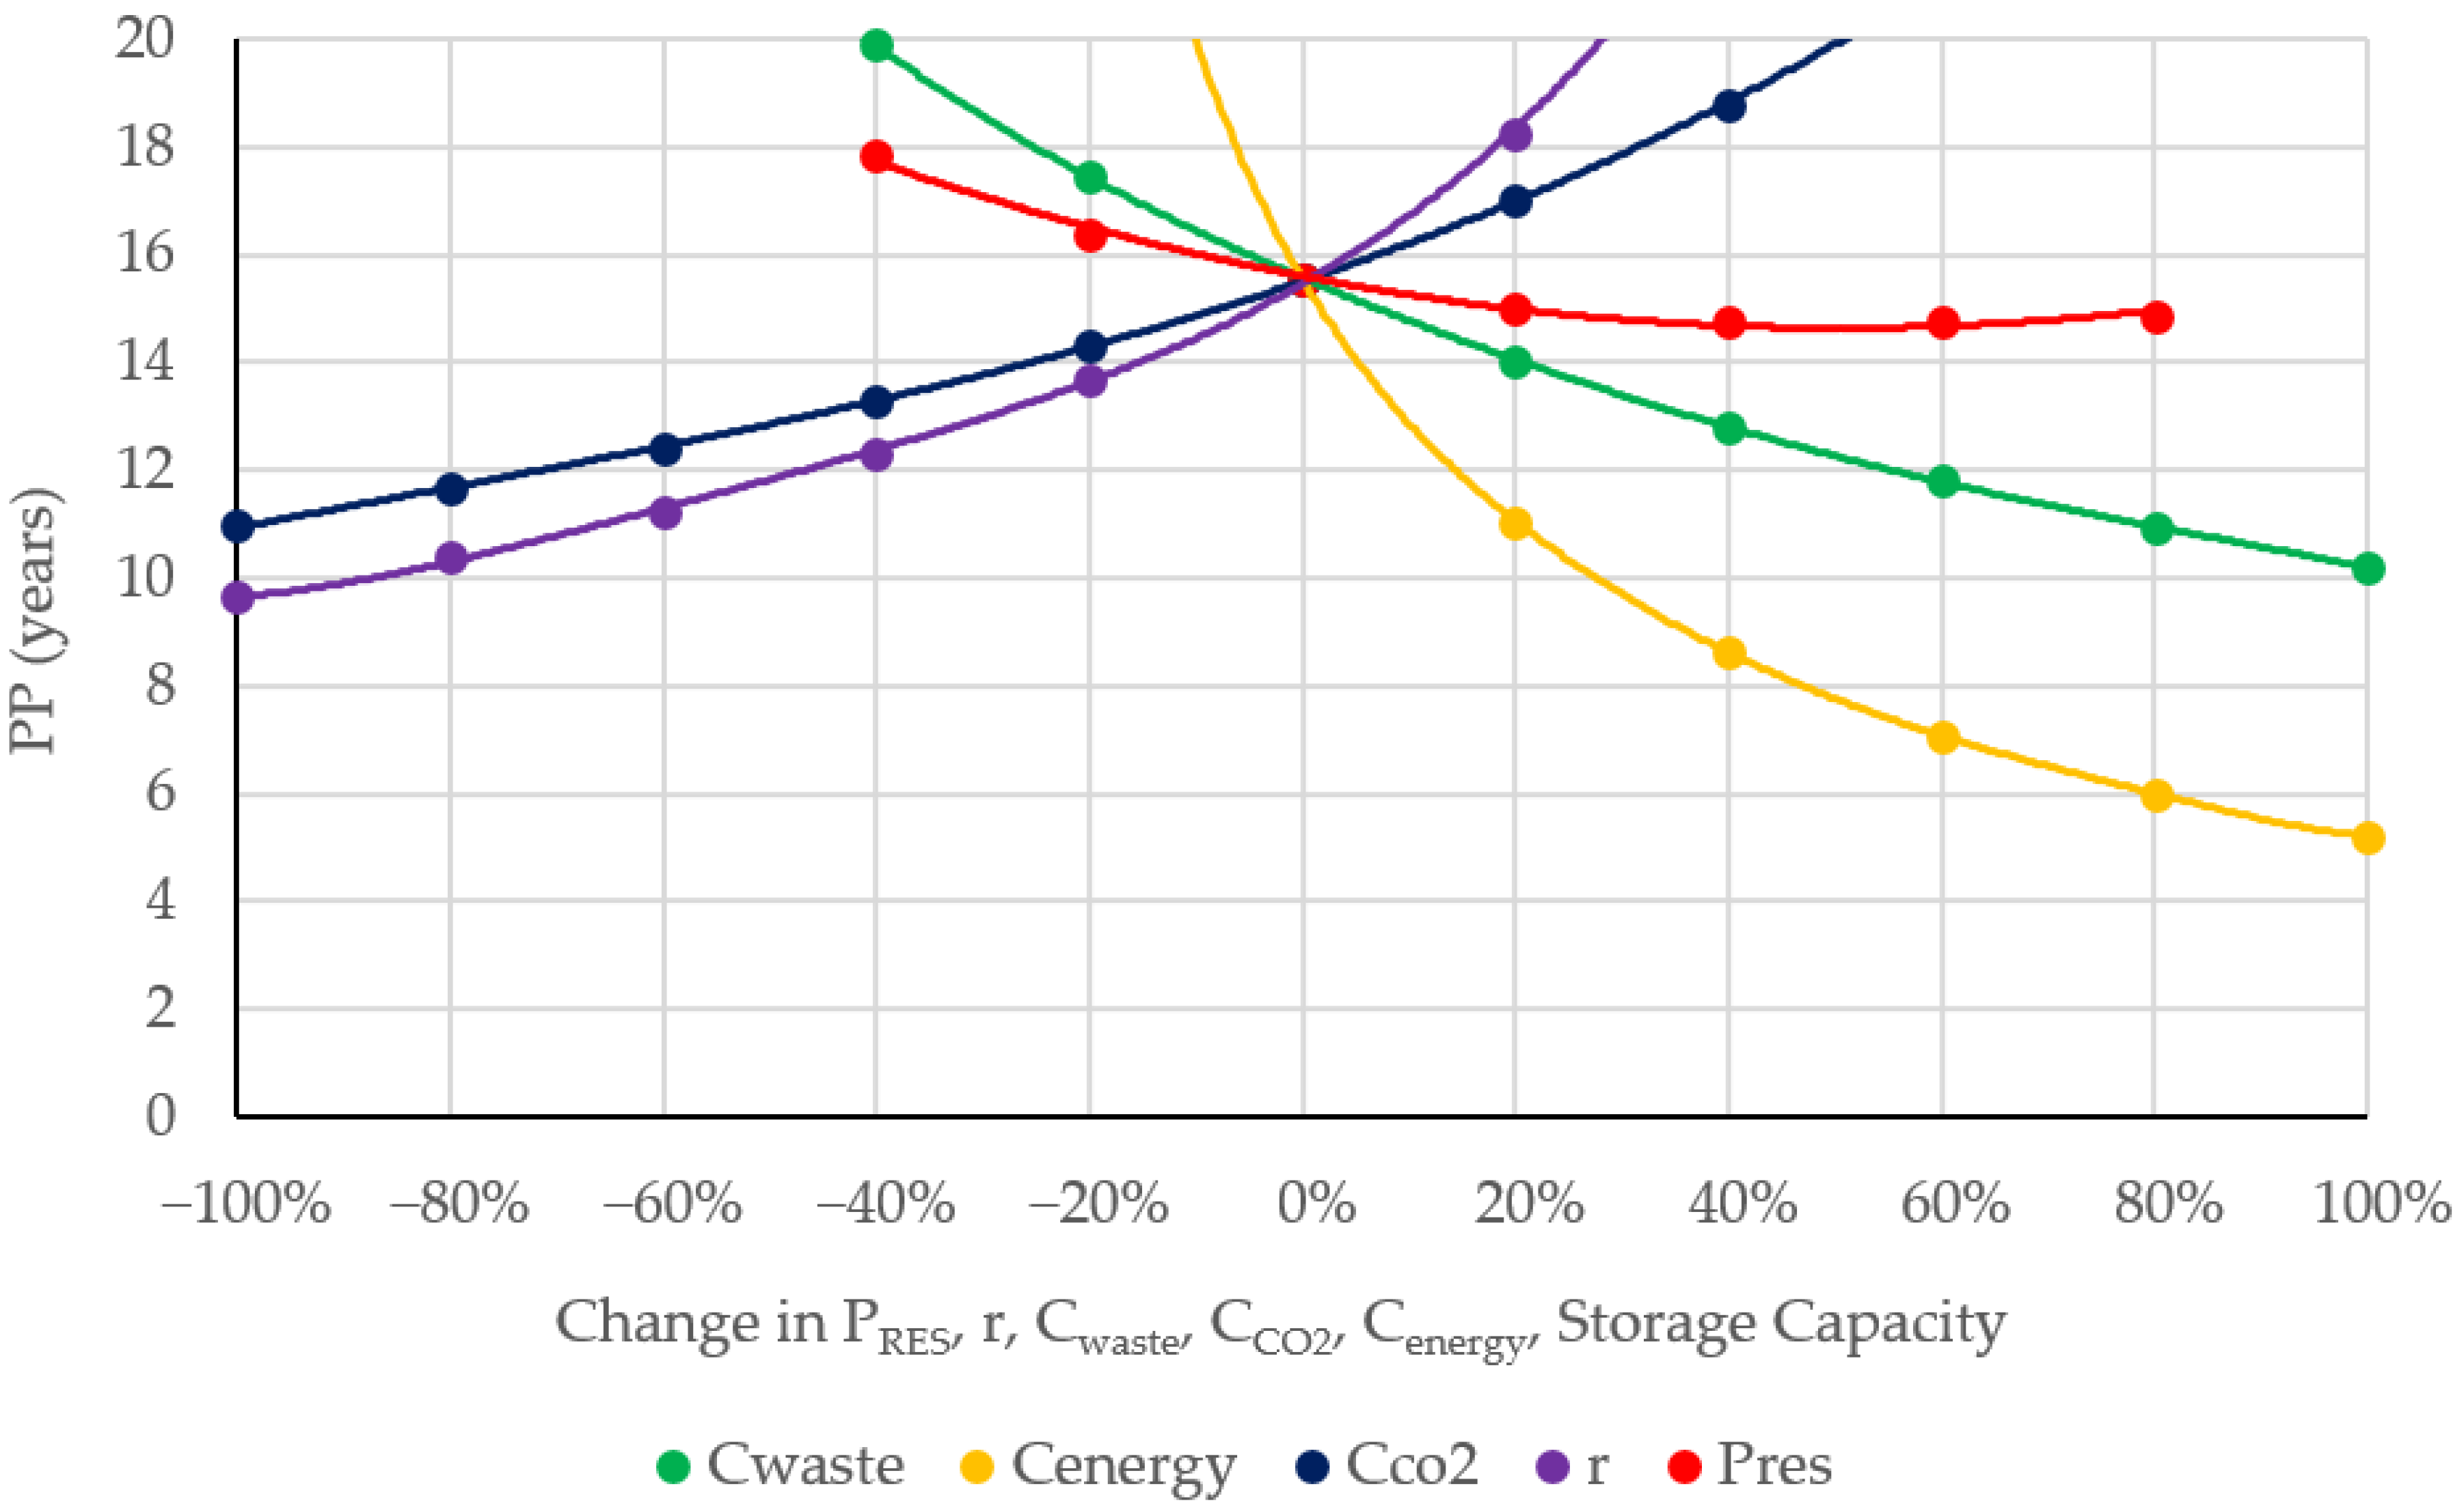
The tested system can be economically profitable. For the basic variant, the LCOE is 179.5 EUR/MWh, and the PP for an energy price of 200 EUR/MWh is 15.55 years. This was determined assuming a waste disposal fee of EUR74/Mg and CO2 emission prices of EUR42/Mg. Both of these values heavily influence the profitability, as a 100% change in these costs leads to changes in the LCOE of 29% and 23%, respectively. These factors also strongly influence the payback period. If the gate fee decreases more than 40% or energy price more than 10%, the HGS is no longer profitable in the analyzed period. The HGS is unprofitable also if the price of emission allowances increases more than 50% or the discount rate more than 30% from the base values. The current price for CO2 emissions in the EU is about twice as high as in the base variant of this study. However, due to the fact that it is not known how waste processing installations will be covered by the European Union’s ETS, it was decided to investigate the effect of changes in this parameter on profitability. Furthermore, with an increase in the installed capacity of RES, the profitability of the system increases. This occurs despite increasing investment costs. However, this is not a linear change, and with this increase in RES nominal power, the increase in profitability decreases. The analyzed system is more profitable than the hybrid systems with biomass gasification found in the literature, due to the lack of batteries and the negative price of the fuel.
In order to operate, the proposed installation must have a syngas storage with a very large capacity. However, due to the high costs of other methods for electricity storage, its use is profitable.
The results from this research can be fully applied only to the analyzed region. Waste composition and weather conditions influence the operation of an HGS. Moreover, economic parameters, such as CO2 emission fees or gate fees, differ in many countries. In order to acquire results relevant to other countries, further analyses have to be performed based on specific economic and weather conditions.
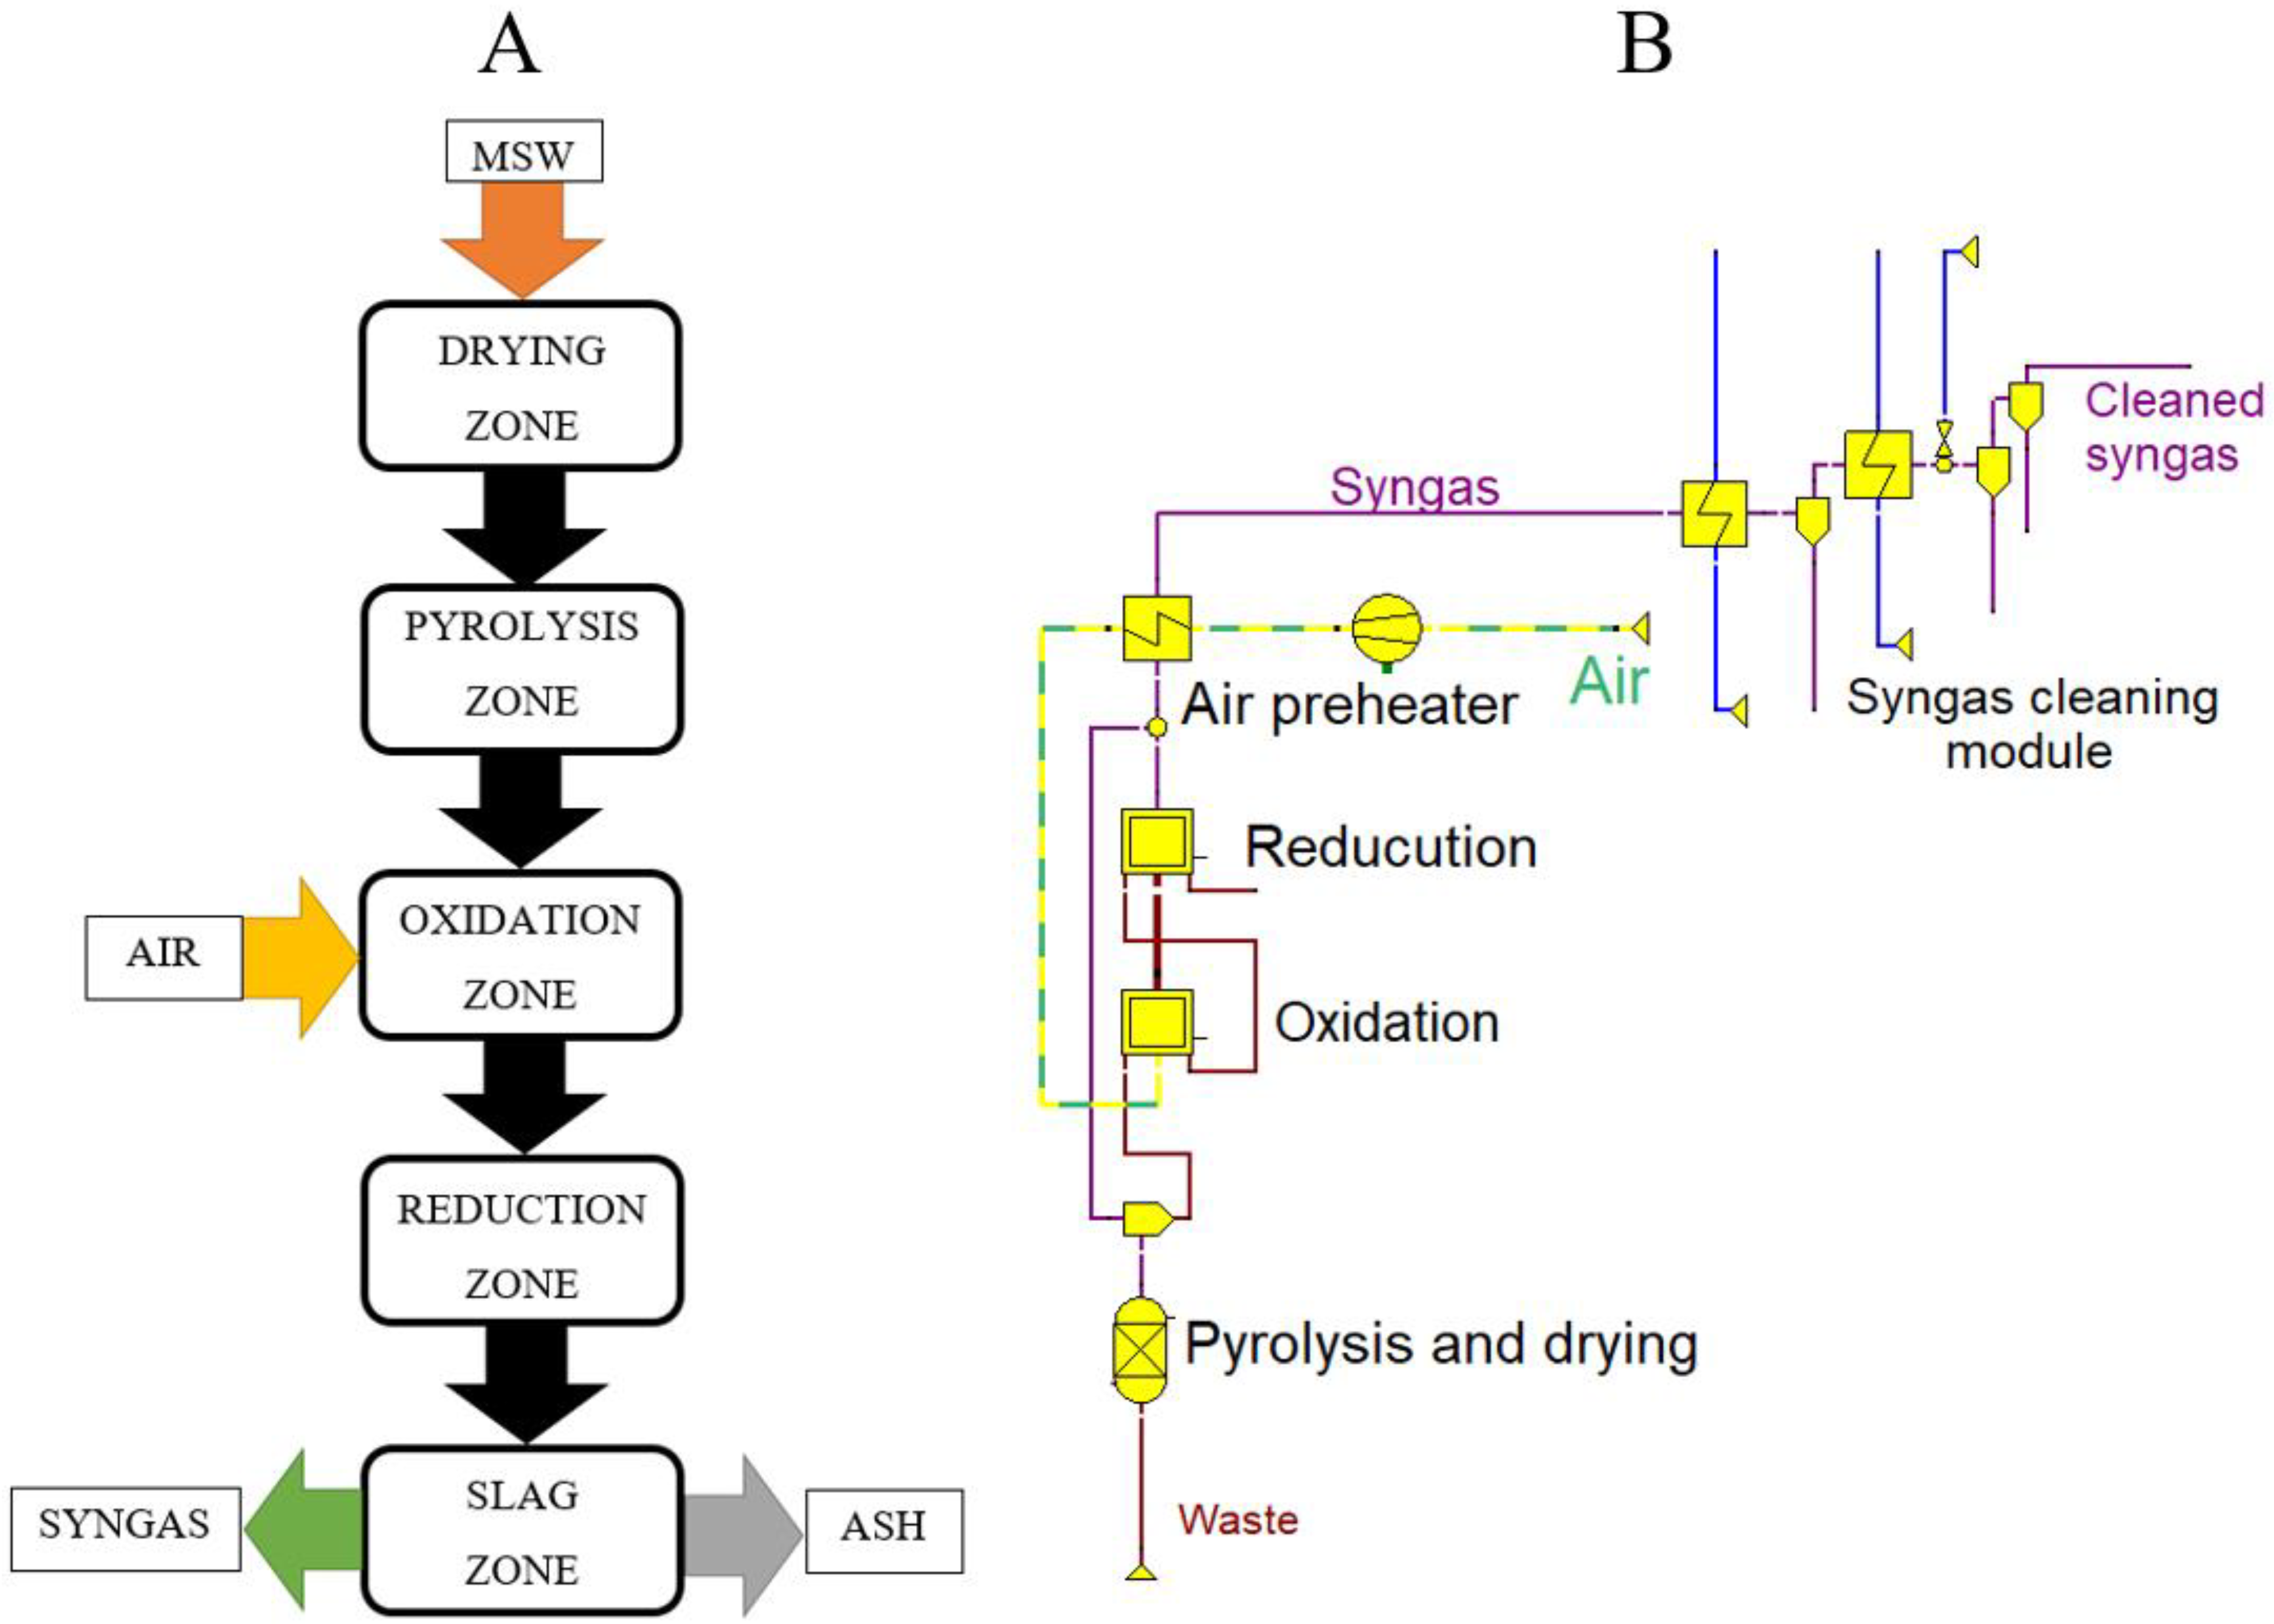
As a result of the research, a model of a downdraft gas generator with a syngas purification and storage system was developed. In future studies, the authors plan to analyze the effects of the variability of fuel composition, which has not been covered in this article.

Author Contributions

Conceptualization, J.R. and B.C.; methodology, J.R.; software, J.R.; validation, R.W., B.K.-K. and B.C.; formal analysis, J.R.; investigation, J.R.; writing—original draft preparation, J.R.; writing—review and editing, J.R.; supervision, R.W., B.K.-K. and B.C. All authors have read and agreed to the published version of the manuscript.

Funding

This research was funded by the Ministry of Education and Science of Poland, grant number 0711/SBAD/4651.

Data Availability Statement

The data presented in this study are available on request from the corresponding author.

Conflicts of Interest

The authors declare no conflict of interest. The funders had no role in the design of the study; in the collection, analyses, or interpretation of data; in the writing of the manuscript; or in the decision to publish the results.

Abbreviations

AheHeat exchanger area
CEPCIChemical Engineering Plant Cost Index
cfCapacity factor
CiInvestment cost of a single element of the system
Ci2022Investment cost of a single element recalculated to 2022 value
Cisum2022Investment cost of the system recalculated to 2022 value
cpPower coefficient
CHPCombined heat and power
COAnnual operating cost
CO2ReductionReduction in CO2 emissions
DPower demand
DCDemand coverage by HGS ratio
EaAnnual gross electricity generation
Ea,netAnnual net electricity generation
ECO2Emission factor
EgridElectricity from the power grid
EoverRedundant potential of electricity generation
EtElectricity generation in year t
FSyngas storage fulfillment
FctFuel costs in year t
GbBeam radiance
GdDiffuse radiance
GSGasification system
GρGround radiance
hHeight
HGSHybrid generation system
ItInvestment costs in year t
IunrUnrecovered amount of investment cost in year t
KταTransmittance ratio to transmittance at angle equal to 0°
LCOELevelized cost of electricity
mMass
MBPMechanical biological treatment plants
MCO2Mass of CO2 emitted annually
MSWMunicipal solid waste
MtOperating costs in year t
NCVNet calorific value
PGenerated power
PcompressCompressor power demand
PgridPower from the power grid
PGTGas turbine power
PiPower in i interval
PnomNominal power
PPPayback period
PPVPhotovoltaics power
PWTWind turbines power
PVPhotovoltaic
rDiscount factor
RRotor radius
RbeamTilted surface ratio factor
RESRenewable energy sources
SRadiance
sgSyngas
T10Time of single interval
vwind speed
VinInlet volume flow
VoutOutlet volume flow
VoutVolume of the syngas storage
WTWind turbine
WtEWaste-to-Energy plant
βSlope
ηefficiency
ηcgCold gas efficiency
ρAair density

References

  1. Wielgosiński, G. Termiczne Przekształcanie Odpadów; Wydawnictwo Nowa Energia: Racibórz, Poland, 2020. [Google Scholar]
  2. Ściążko, M.; Nowak, W. Technologie Zgazowania Odpadów Komunalnych. Nowa Energy 2017, 55, 22–26. [Google Scholar]
  3. Kumar, A.; Samadder, S.R. A Review on Technological Options of Waste to Energy for Effective Management of Municipal Solid Waste. Waste Manag. 2017, 69, 407–422. [Google Scholar] [CrossRef]
  4. Arena, U. Process and Technological Aspects of Municipal Solid Waste Gasification. A Review. Waste Manag. 2012, 32, 625–639. [Google Scholar] [CrossRef] [PubMed]
  5. Rajca, P.; Zajemska, M. Ocena Możliwości wykorzystania paliwa RDF na cele energetyczne. Rynek Energii 2018, 4, 29–37. [Google Scholar]
  6. Nadziakiewicz, J.; Wacławiak, K.; Stelmach, S. Procesy Termiczne Utylizacji Odpadów; Wydawnictwo Politechniki Śląskiej: Gliwice, Poland, 2007. [Google Scholar]
  7. Hernández, J.J.; Ballesteros, R.; Aranda, G. Characterization of tars from biomass gasification: Effect of the operating conditions. Energy 2013, 50, 333–342. [Google Scholar] [CrossRef]
  8. Font Palma, C. Modelling of tar formation and evolution for biomass gasification: A review. Appl. Energy 2013, 111, 129–141. [Google Scholar] [CrossRef]
  9. Cortazar, M.; Santamaria, L.; Lopez, G.; Alvarez, J.; Zhang, L.; Wang, R.; Bi, X.; Olazar, M. A comprehensive review of primary strategies for tar removal in biomass gasification. Energy Convers. Manag. 2023, 276, 116496. [Google Scholar] [CrossRef]
  10. Sitka, A.; Jodkowski, W.; Szulc, P.; Smykowski, D.; Szumiło, B.; Redzicki, R.; Tietze, T. Badanie możliwości zastosowania filtra ceramicznego oraz skuteczności jego odpylania w procesie zgazowania biomasy. Rynek Energii 2022, 1, 42–47. [Google Scholar]
  11. Zhao, P.; Shen, Y.; Ge, S.; Chen, Z.; Yoshikawa, K. Clean solid biofuel production from high moisture content waste biomass employing hydrothermal treatment. Appl. Energy 2014, 131, 345–367. [Google Scholar] [CrossRef] [Green Version]
  12. Berge, N.D.; Ro, K.S.; Mao, J.; Flora, J.R.V.; Chappell, M.A.; Bae, S. Hydrothermal carbonization of municipal waste streams. Environ. Sci. Technol. 2011, 45, 5696–5703. [Google Scholar] [CrossRef]
  13. Nordin, A.; Pommer, L.; Nordwaeger, M.; Olofsson, I. Biomass conversion through torrefaction. In Technologies for Converting Biomass to Useful Energy, 1st ed.; Dahlquist, E., Ed.; CRC Press: London, UK, 2013; pp. 217–244. [Google Scholar]
  14. Paukov, A.; Magaril, R.; Magaril, E. An Investigation of the Feasibility of the Organic Municipal Solid Waste Processing by Coking. Sustainability 2019, 11, 389. [Google Scholar] [CrossRef] [Green Version]
  15. Dong, J.; Tang, Y.; Nzihou, A.; Chi, Y.; Weiss-Hortala, E.; Ni, M. Life Cycle Assessment of Pyrolysis, Gasification and Incineration Waste-to-Energy Technologies: Theoretical Analysis and Case Study of Commercial Plants. Sci. Total Environ. 2018, 626, 744–753. [Google Scholar] [CrossRef]
  16. Rodrigues, L.F.; dos Santos, I.F.S.; dos Santos, T.I.S.; Barros, R.M.; Tiago Filho, G.L. Energy and Economic Evaluation of MSW Incineration and Gasification in Brazil. Renew. Energy 2022, 188, 933–944. [Google Scholar] [CrossRef]
  17. Satiada, M.A.; Calderon, A. Comparative Analysis of Existing Waste-to-Energy Reference Plants for Municipal Solid Waste. Clean. Environ. Syst. 2021, 3, 100063. [Google Scholar] [CrossRef]
  18. Rezaei, M.; Ghobadian, B.; Samadi, S.H.; Karimi, S. Electric Power Generation from Municipal Solid Waste: A Techno-Economical Assessment under Different Scenarios in Iran. Energy 2018, 152, 46–56. [Google Scholar] [CrossRef]
  19. Abdeljaber, A.; Zannerni, R.; Masoud, W.; Abdallah, M.; Rocha-Meneses, L. Eco-Efficiency Analysis of Integrated Waste Management Strategies Based on Gasification and Mechanical Biological Treatment. Sustainability 2022, 14, 3899. [Google Scholar] [CrossRef]
  20. Alzate, S.; Restrepo-Cuestas, B.; Jaramillo-Duque, Á. Municipal Solid Waste as a Source of Electric Power Generation in Colombia: A Techno-Economic Evaluation under Different Scenarios. Resources 2019, 8, 51. [Google Scholar] [CrossRef] [Green Version]
  21. Polskie Sieci Elektroenergetycze Raport 2021 KSE 2022. Available online: https://www.pse.pl/dane-systemowe/funkcjonowanie-kse/raporty-roczne-z-funkcjonowania-kse-za-rok/raporty-za-rok-2021#t1_1 (accessed on 6 July 2022).
  22. Paska, J. Rozproszone Źródła Energii; Oficyna Wydawnicza Politechniki Warszawskiej: Warszawa, Poland, 2017. [Google Scholar]
  23. Ceran, B. The Concept of Use of PV/WT/FC Hybrid Power Generation System for Smoothing the Energy Profile of the Consumer. Energy 2019, 167, 853–865. [Google Scholar] [CrossRef]
  24. Ding, Z.; Hou, H.; Yu, G.; Hu, E.; Duan, L.; Zhao, J. Performance Analysis of a Wind-Solar Hybrid Power Generation System. Energy Convers. Manag. 2019, 181, 223–234. [Google Scholar] [CrossRef]
  25. Khare, V.; Nema, S.; Baredar, P. Solar–Wind Hybrid Renewable Energy System: A Review. Renew. Sustain. Energy Rev. 2016, 58, 23–33. [Google Scholar] [CrossRef]
  26. Ceran, B.; Orłowska, A. The Impact of Power Source Performance Decrease in a PV/WT/FC Hybrid Power Generation System on the Result of a Multi-Criteria Analysis of Load Distribution. Energies 2019, 12, 3453. [Google Scholar] [CrossRef] [Green Version]
  27. Agarkar, B.D.; Barve, S.B. A Review on Hybrid Solar/Wind/Hydro Power Generation System. Int. J. Curr. Eng. Technol. 2016, 4, 188–191. [Google Scholar]
  28. Usman, M.; Khan, M.T.; Rana, A.S.; Ali, S. Techno-Economic Analysis of Hybrid Solar-Diesel-Grid Connected Power Generation System. J. Electr. Syst. Inf. Technol. 2018, 5, 653–662. [Google Scholar] [CrossRef]
  29. Khirennas, A.; Talha, A.; Kaabeche, A.; Bakelli, Y. Overview of Fossil Fuel-Based Hybrid Power Generation Systems within Mini-Grids–The Experience of Storage-Less PV System Integration into Three of the Great Algerian South Mini-Grids. Energy Convers. Manag. 2020, 221, 113191. [Google Scholar] [CrossRef]
  30. Kalantar, M. Dynamic Behavior of a Stand-Alone Hybrid Power Generation System of Wind Turbine, Microturbine, Solar Array and Battery Storage. Appl. Energy 2010, 87, 3051–3064. [Google Scholar] [CrossRef]
  31. Singh, S.; Singh, M.; Kaushik, S.C. Feasibility Study of an Islanded Microgrid in Rural Area Consisting of PV, Wind, Biomass and Battery Energy Storage System. Energy Convers. Manag. 2016, 128, 178–190. [Google Scholar] [CrossRef]
  32. Marchenko, O.; Solomin, S.; Shamanskiy, V.; Donskoy, I. Evaluation of the Effectiveness of Joint Use of Wood and Other Renewable Energy Sources in the Baikal Region. Appl. Sci. 2022, 12, 1254. [Google Scholar] [CrossRef]
  33. Younas, M.; Kamal, R.; Khalid, M.S.; Qamar, A. Economic Planning for Remote Community Microgrid Containing Solar PV, Biomass Gasifier and Microhydro. In Proceedings of the IEEE 2018 Clemson University Power Systems Conference (PSC), Charleston, SC, USA, 4–7 September 2018; pp. 1–7. [Google Scholar]
  34. Aslam, Z.; Li, H.; Hammerton, J.; Andrews, G.; Ross, A.; Lovett, J.C. Increasing Access to Electricity: An Assessment of the Energy and Power Generation Potential from Biomass Waste Residues in Tanzania. Energies 2021, 14, 1793. [Google Scholar] [CrossRef]
  35. Ribó-Pérez, D.; Bastida-Molina, P.; Gómez-Navarro, T.; Hurtado-Pérez, E. Hybrid Assessment for a Hybrid Microgrid: A Novel Methodology to Critically Analyse Generation Technologies for Hybrid Microgrids. Renew. Energy 2020, 157, 874–887. [Google Scholar] [CrossRef]
  36. Abd El-Sattar, H.; Sultan, H.M.; Kamel, S.; Khurshaid, T.; Rahmann, C. Optimal Design of Stand-Alone Hybrid PV/Wind/Biomass/Battery Energy Storage System in Abu-Monqar, Egypt. J. Energy Storage 2021, 44, 103336. [Google Scholar] [CrossRef]
  37. Singh, A.; Basak, P. Conceptualization and Techno-Economic Evaluation of Municipal Solid Waste Based Microgrid. Energy 2022, 238, 121711. [Google Scholar] [CrossRef]
  38. van Leeuwen, L.B.; Cappon, H.J.; Keesman, K.J. Urban Bio-Waste as a Flexible Source of Electricity in a Fully Renewable Energy System. Biomass Bioenergy 2021, 145, 105931. [Google Scholar] [CrossRef]
  39. Bagheri, M.; Shirzadi, N.; Bazdar, E.; Kennedy, C.A. Optimal Planning of Hybrid Renewable Energy Infrastructure for Urban Sustainability: Green Vancouver. Renew. Sustain. Energy Rev. 2018, 95, 254–264. [Google Scholar] [CrossRef]
  40. Esfilar, R.; Bagheri, M.; Golestani, B. Technoeconomic Feasibility Review of Hybrid Waste to Energy System in the Campus: A Case Study for the University of Victoria. Renew. Sustain. Energy Rev. 2021, 146, 111190. [Google Scholar] [CrossRef]
  41. Garcia, A.Q.; Nishiumi, N.; Saito, A.; Matsumura, E.; Senda, J. Economic, Environmental and Energetic Analysis of a Distributed Generation System Composed by Waste Gasification and Photovoltaic Panels. Energies 2021, 14, 3889. [Google Scholar] [CrossRef]
  42. Sun, P.; Yun, T.; Chen, Z. Multi-Objective Robust Optimization of Multi-Energy Microgrid with Waste Treatment. Renew. Energy 2021, 178, 1198–1210. [Google Scholar] [CrossRef]
  43. Zahedi, R.; Ahmadi, A.; Sadeh, M. Investigation of the Load Management and Environmental Impact of the Hybrid Cogeneration of the Wind Power Plant and Fuel Cell. Energy Rep. 2021, 7, 2930–2939. [Google Scholar] [CrossRef]
  44. Eliasu, A.; Derkyi, N.S.A.; Gyamfi, S. Techno-Economic Analysis of Municipal Solid Waste Gasification for Electricity Generation. Int. J. Energy Econ. Policy 2022, 12, 342–348. [Google Scholar] [CrossRef]
  45. Ghenai, C.; Rasheed, M.A.; Alshamsi, M.J.; Alkamali, M.A.; Ahmad, F.F.; Inayat, A. Design of Hybrid Solar Photovoltaics/Shrouded Wind Turbine Power System for Thermal Pyrolysis of Plastic Waste. Case Stud. Therm. Eng. 2020, 22, 100773. [Google Scholar] [CrossRef]
  46. Kim, S.K.; Jeon, J.H.; Cho, C.H.; Ahn, J.B.; Kwon, S.H. Dynamic modeling and control of a grid-connected hybrid generation system with versatile power transfer. IEEE Trans. Ind. Electron. 2008, 55, 1677–1688. [Google Scholar] [CrossRef]
  47. Saha, T.K.; Kastha, D. Design Optimization and Dynamic Performance Analysis of a Stand-Alone Hybrid Wind–Diesel Electrical Power Generation System. IEEE Trans. Energy Convers. 2010, 25, 1209–1217. [Google Scholar] [CrossRef]
  48. Yamegueu, D.; Azoumah, T.; Py, X.; Kottin, H. Experimental analysis of a solar PV/diesel hybrid system without storage: Focus on its dynamic behavior. Electr. Power Energy Syst. 2013, 44, 267–274. [Google Scholar] [CrossRef]
  49. Pérez-Navarro, A.; Alfonso, D.; Ariza, H.; Cárcel-Carrasco, F.-J.; Correcher, A.; Escrivá-Escrivá, G.; Hurtado, E.; Ibáñez, F.; Peñalvo, E.; Roig, R.; et al. Experimental verification of hybrid renewable systems as feasible energy sources. Renew. Energy 2016, 86, 384–391. [Google Scholar] [CrossRef]
  50. Jahangir, M.H.; Cheraghi, R. Economic and Environmental Assessment of Solar-Wind-Biomass Hybrid Renewable Energy System Supplying Rural Settlement Load. Sustain. Energy Technol. Assess. 2020, 42, 100895. [Google Scholar] [CrossRef]
  51. Kozlov, A.N.; Tomin, N.V.; Sidorov, D.N.; Lora, E.E.; Kurbatsky, V.G. Optimal Operation Control of PV-Biomass Gasifier-Diesel-Hybrid Systems Using Reinforcement Learning Techniques. Energies 2020, 13, 2632. [Google Scholar] [CrossRef]
  52. Roman, J. Preliminary Techno-Economic Analysis of the Potential of Using Municipal Waste Gasification Installations in a Hybrid Electricity Generation System. Energy Policy J. 2022, 4, 55–72. [Google Scholar] [CrossRef]
  53. Enea Operator Standardowe Profile Zużycia Energii Na 2021 Rok. Available online: https://www.operator.enea.pl/uploads-ev2/Operator/us%C5%82ugidystrybucyjne/iriesd/zalacznik_4_iriesd_profile_2021.xlsx (accessed on 10 May 2022).
  54. IMGW Public Data. Available online: https://danepubliczne.imgw.pl/datastore (accessed on 6 May 2022).
  55. Dane Do Obliczeń Energetycznych Budynków. Available online: https://www.gov.pl/web/archiwum-inwestycje-rozwoj/dane-do-obliczen-energetycznych-budynkow (accessed on 6 May 2022).
  56. Primus, A.; Rosik-Dulewska, C. Potencjał Paliwowy Frakcji Nadsitowej Odpadów Komunalnych i Jego Rola w Krajowym Modelu Gospodarki Odpadami. Zesz. Nauk. Inst. Gospod. Surowcami Miner. Pol. Akad. Nauk. 2018, 105, 121–134. [Google Scholar]
  57. Meraz, L.; Domínguez, A.; Kornhauser, I.; Rojas, F. A Thermochemical Concept-Based Equation to Estimate Waste Combustion Enthalpy from Elemental Composition. Fuel 2003, 82, 1499–1507. [Google Scholar] [CrossRef]
  58. Ghorbani, S.; Atashkari, K.; Borji, M. Three-Stage Modelling and Parametric Analysis of a Downdraft Biomass Gasifier. Int. J. Hydrogen Energy 2022, 47, 14799–14822. [Google Scholar] [CrossRef]
  59. Diyoke, C.; Gao, N.; Aneke, M.; Wang, M.; Wu, C. Modelling of Down-Draft Gasification of Biomass–An Integrated Pyrolysis, Combustion and Reduction Process. Appl. Therm. Eng. 2018, 142, 444–456. [Google Scholar] [CrossRef] [Green Version]
  60. Xu, H.; Shi, B. Design and System Evaluation of Mixed Waste Plastic Gasification Process Based on Integrated Gasification Combined Cycle System. Processes 2022, 10, 499. [Google Scholar] [CrossRef]
  61. Almpantis, D.; Zabaniotou, A. Technological Solutions and Tools for Circular Bioeconomy in Low-Carbon Transition: Simulation Modeling of Rice Husks Gasification for CHP by Aspen PLUS V9 and Feasibility Study by Aspen Process Economic Analyzer. Energies 2021, 14, 2006. [Google Scholar] [CrossRef]
  62. Rokni, M. Thermodynamic Analyses of Municipal Solid Waste Gasification Plant Integrated with Solid Oxide Fuel Cell and Stirling Hybrid System. Int. J. Hydrogen Energy 2015, 40, 7855–7869. [Google Scholar] [CrossRef] [Green Version]
  63. Salman, C.A.; Omer, C.B. Process Modelling and Simulation of Waste Gasification-Based Flexible Polygeneration Facilities for Power, Heat and Biofuels Production. Energies 2020, 13, 4264. [Google Scholar] [CrossRef]
  64. Begum, S.; Rasul, M.G.; Akbar, D. A Numerical Investigation of Municipal Solid Waste Gasification Using Aspen Plus. Procedia Eng. 2014, 90, 710–717. [Google Scholar] [CrossRef] [Green Version]
  65. Santos, M.P.; Hanak, D.P. Techno-Economic Feasibility Assessment of Sorption Enhanced Gasification of Municipal Solid Waste for Hydrogen Production. Int. J. Hydrogen Energy 2022, 47, 6586–6604. [Google Scholar] [CrossRef]
  66. Minutillo, M.; Perna, A.; Jannelli, E.; Cigolotti, V.; Nam, S.W.; Yoon, S.P.; Kwon, B.W. Coupling of Biomass Gasification and SOFC–Gas Turbine Hybrid System for Small Scale Cogeneration Applications. Energy Procedia 2017, 105, 730–737. [Google Scholar] [CrossRef]
  67. Ferreira, S.; Monteiro, E.; Calado, L.; Silva, V.; Brito, P.; Vilarinho, C. Experimental and Modeling Analysis of Brewers’ Spent Grains Gasification in a Downdraft Reactor. Energies 2019, 12, 4413. [Google Scholar] [CrossRef] [Green Version]
  68. STEAG. EBSILON®Professional Documentation. Available online: https://help.ebsilon.com/EN/EBSILON_Professional_Documentation.html (accessed on 17 February 2023).
  69. Piecuch, T.; Dąbrowski, J. Projekt Koncepcyjno-Technologiczny Zakładu Termicznego Przekształcania Odpadów Komunalnych Dla Regionu Środkowopomorskiego; Middle Pomeranian Scientific Society of The Environment Protection: Koszalin, Poland, 2014. [Google Scholar]
  70. Abdoulmoumine, N.; Kulkarni, A.; Adhikari, S.; Taylor, S.; Loewenstein, E. Economic Analysis of Municipal Power Generation from Gasification of Urban Green Wastes: Case Study of F Ultondale, A Labama, USA. Biofuels Bioprod. Biorefining 2012, 6, 521–533. [Google Scholar] [CrossRef]
  71. Hosseinpour, J.; Chitsaz, A.; Liu, L.; Gao, Y. Simulation of Eco-Friendly and Affordable Energy Production via Solid Oxide Fuel Cell Integrated with Biomass Gasification Plant Using Various Gasification Agents. Renew. Energy 2020, 145, 757–771. [Google Scholar] [CrossRef]
  72. Esmaili, E.; Mostafavi, E.; Mahinpey, N. Economic Assessment of Integrated Coal Gasification Combined Cycle with Sorbent CO2 Capture. Appl. Energy 2016, 169, 341–352. [Google Scholar] [CrossRef]
  73. Wu, Z.; Zhu, P.; Yao, J.; Zhang, S.; Ren, J.; Yang, F.; Zhang, Z. Combined Biomass Gasification, SOFC, IC Engine, and Waste Heat Recovery System for Power and Heat Generation: Energy, Exergy, Exergoeconomic, Environmental (4E) Evaluations. Appl. Energy 2020, 279, 115794. [Google Scholar] [CrossRef]
  74. Cau, G.; Cocco, D.; Serra, F. Energy and Cost Analysis of Small-Size Integrated Coal Gasification and Syngas Storage Power Plants. Energy Convers. Manag. 2012, 56, 121–129. [Google Scholar] [CrossRef]
  75. IRENA Renewable Power Generation Costs in 2019; International Renewable Energy Agency: Abu Dhabi, United Arab Emirates, 2020; ISBN 978-92-9260-244-4.
  76. Malat’áková, J.; Jankovskỳ, M.; Malat’ák, J.; Velebil, J.; Tamelová, B.; Gendek, A.; Aniszewska, M. Evaluation of Small-Scale Gasification for CHP for Wood from Salvage Logging in the Czech Republic. Forests 2021, 12, 1448. [Google Scholar] [CrossRef]
  77. Marques, T.E.; Castillo Santiago, Y.; Renó, M.L.G.; Yepes Maya, D.M.; Sphaier, L.A.; Shi, Y.; Ratner, A. Environmental and Energetic Evaluation of Refuse-Derived Fuel Gasification for Electricity Generation. Processes 2021, 9, 2255. [Google Scholar] [CrossRef]
  78. Kazimierski, P.; Kluska, J.; Ochnio, M.; Tiutiurski, P.; Kardaś, D. Charakterystyka Porównawcza Zgazowania Drewna Bukowego i RDF w Reaktorze Przeciwprądowym. Inżynieria I Apar. Chem. 2017, 2, 38–40. [Google Scholar]
  79. Piasecki, A.; Jurasz, J.; Kies, A. Measurements and Reanalysis Data on Wind Speed and Solar Irradiation from Energy Generation Perspectives at Several Locations in Poland. SN Appl. Sci. 2019, 1, 865. [Google Scholar] [CrossRef] [Green Version]
  80. KOBiZE WSKAŹNIKI EMISYJNOŚCI CO2, SO2, NOx, CO i Pyłu Całkowitego DLA ENERGII ELEKTRYCZNEJ Na Podstawie Informacji Zawartych w Krajowej Bazie o Emisjach Gazów Cieplarnianych i Innych Substancji Za 2020 Rok; 2020. Available online: https://www.kobize.pl/uploads/materialy/materialy_do_pobrania/wskazniki_emisyjnosci/Wskazniki_emisyjnosci_grudzien_2020.pdf (accessed on 13 September 2022).
  81. Agencja Rynku Energii Statystyka Elektroenergetyki Polskiej 2020; ARE: Warszawa, Poland, 2021.
  82. Samy, M.M.; Barakat, S. Hybrid Invasive Weed Optimization-Particle Swarm Optimization Algorithm for Biomass/PV Micro-Grid Power System. In Proceedings of the IEEE 2019 21st International Middle East Power Systems Conference (MEPCON), Cairo, Egypt, 17–19 December 2019; pp. 377–382. [Google Scholar]
Figure 1. Distribution of power demand (D): (A) during the year, and (B) average during the day in particular seasons of the year.
Energies 16 02062 g001
Figure 2. Annual distribution: (A) wind speed, and (B) solar radiation.
Energies 16 02062 g002
Figure 3. HGS diagram.
Energies 16 02062 g003
Figure 4. Consumption of power from the grid.
Energies 16 02062 g004
Figure 5. Gasifier: (A) block diagram, and (B) model.
Energies 16 02062 g005
Figure 6. Characteristics of (A) wind turbines, (B) PV panels, and (C) gas turbines.
Energies 16 02062 g006
Figure 7. Generation of electrical power in (A) GT, (B) WT, and (C) PV. (D) power consumption from the grid for RES nominal power equal to 10 MW.
Energies 16 02062 g007
Figure 8. Demand coverage by electricity sources on exemplary days for RES power variant of 10 MW: (A) 4 January, and (B) 4 July.
Energies 16 02062 g008
Figure 9. Diagram of the gasifier load and gas storage filling for the RES nominal power of 10 MW.
Energies 16 02062 g009
Figure 10. Average and minimum operation time of the gasifier.
Energies 16 02062 g010
Figure 11. Demand coverage by all electricity sources.
Energies 16 02062 g011
Figure 12. Excess RES generation by source.
Energies 16 02062 g012
Figure 13. Capacity factor by source in the HGS.
Energies 16 02062 g013
Figure 14. Emission factors of HGS, Polish power system, lignite and hard coal power plants.
Energies 16 02062 g014
Figure 15. CO2 emission reductions.
Energies 16 02062 g015
Figure 16. Impact of parameter changes on the LCOE.
Energies 16 02062 g016
Figure 17. Impact of changes in the system parameters on the payback period.
Energies 16 02062 g017
Table 1. Composition of oversieve fraction of waste.
Morphological composition% mas.
PaperMulti-material wastePlasticsTextilesWoodKitchen wasteNon-flammable fractions
18.815.131.110.81.413.29.6
Elemental composition% mas.MJ/kg
CHSNOClAshH2ONCV
40.895.130.090.6124.290.9715.2012.8116.096
NCV—net calorific value (MJ/kg).
Table 2. Parameters of the system.
ParameterUnitValue
Gasifier maximum temperature°C1000
Gasifier pressurebar1
Syngas storage pressurebar22.8
Syngas storage capacitym330,000
Outlet pressure of gas turbinebar1.03
Flue gas temperature before expanderoC1200
Isentropic efficiency of expander-0.85
Isentropic efficiency of compressor-0.85
Table 3. Gasifier model validation.
Gas Component% vol.Standard Deviation
COH2CO2CH4N2O2
Model18.7217.8813.343.1047.120.002.00
Data [67]16.4 ± 0.516.2 ± 0.916.1 ± 0.43.2 ± 0.345.7 ± 1.42.5 ± 0.4
Model21.7717.7811.593.2245.810.002.00
Data [66]21 ± 316 ± 411 ± 31.75 ± 0.75500.55 ± 0.35
Table 4. Investment cost equations.
ComponentFormulaSource
Waste storage C i = 3.162 · 10 7 · m w a s t e ˙ 12 · 0.21 Own based on [69]
Gas generator C i = 23,604 · ( m w a s t e ˙ · 1000 ) 0.6 · 1 [70]
Air preheater C i = 3 · 130 · ( A h e 0.093 ) 0.78 · 1 [71]
Syngas coolers C i = 130 · ( A h e 0.093 ) 0.78 · 1 [71]
Cyclone C i = 7000 · ( V o u t 4.7 ) 0.66 · 1 [72]
Scrubber C i = 1.244 · 10 7 69,196 V i n · 3600 · 1 Own based on [69]
Sulphur and mercury removal C i = 960 · ( 2.205 · m g a s ) 0.7 · 1 [72]
NCH and NH3 removal C i = 390 · ( 2.205 · m g a s ) 0.7 · 1 [72]
Syngas compressor C i = 91,652 ( P 455 ) 0.67 · 1 [73]
Gas turbine C i = 31.5 · 10 6 ( m a i r 209 ) 0.67 [65]
Grid connection C i = 8138 · P 0.537 · 1 [70]
Syngas storage C i = 80,000 + 65 · V s t [74]
Wind farm C i = 1800 · P · 1 [75]
Photovoltaic farm C i = 1130 · P · 1 [75]
Abbreviations: mwaste—mass flow of waste (kg/h), Ahe—heat exchanger area (m2), Vout—outlet volume flow (m3/s), Vin—inlet volume flow (m3/s), mgas—inlet gas mass flow (kg/s), mair—inlet air mass flow (kg/s), Vst—volume of the syngas storage (m3).
Table 5. Operating costs equations.
ComponentFormulaSource
Waste processing installation C o = 0.046 · C i Own based on [76]
Wind farm C o = 40 · P [75]
Photovoltaic farm C o = 18.3 · P [75]
Abbreviations: Co—annual operating cost [EUR/y].
Table 6. Gasifier modeling results.
Syngas CompositionηcgNCVNCVmsyngas/mwaste
% vol.
COH2CO2CH4N2%MJ/kgMJ/Nm3kg/kg
23.3119.058.143.8645.7380.925.9725.6752.181
Table 7. Results of energy analysis.
DataUnitPRES (MW)
681012141618
EaGSGWh17.25617.51417.91218.34718.74819.02419.307
Ea.netGSGWh11.56811.82912.22412.66513.05613.34213.623
EaWTGWh6.0578.07710.09612.11514.13416.15318.172
Ea.netWTGWh5.2946.8288.1639.41810.59411.65912.666
EaPVGWh2.6673.5554.4445.3336.2227.1118.000
Ea.netPVGWh2.4983.1953.8294.4104.9475.4345.899
EaHGSGWh25.98029.14632.45235.79539.10442.28845.479
Ea.netHGSGWh19.36021.85324.21626.49428.59630.43632.188
ηGS-0.1520.1560.1610.1670.1720.1760.180
ηWT-0.3410.3300.3160.3030.2930.2820.272
ηPV-0.1520.1460.1400.1340.1290.1240.120
cfGS-0.1890.1930.1990.2070.2130.2180.222
cfWT-0.2010.1950.1860.1790.1730.1660.161
cfPV-0.0950.0910.0870.0840.0810.0780.075
cfHGS-0.1700.1660.1630.1590.1550.1510.147
Table 8. CO2 emission and HGS emission factor.
PRESMCO2ECO2
MWMg/yMg/MWh
624,0111.219
824,0071.079
1024,0230.979
1224,0030.896
1424,0460.835
1623,9950.782
1824,0100.741
Table 9. Results of economic analysis.
DataResults
CwasteCCO2CenergyRPRESLCOEPP
EUR/MGEUR/MGEUR/MWh-MWEUR/MWhYears
−74422000.066191.317.84
8184.216.36
10179.515.55
12176.215.00
14174.414.76
16174.514.78
18175.014.88
Disclaimer/Publisher’s Note: The statements, opinions and data contained in all publications are solely those of the individual author(s) and contributor(s) and not of MDPI and/or the editor(s). MDPI and/or the editor(s) disclaim responsibility for any injury to people or property resulting from any ideas, methods, instructions or products referred to in the content.

