Comparative Levelized Cost Analysis of Transmitting Renewable Solar Energy
Abstract
1. Introduction and Background
2. Approach
2.1. System Description and Logic
2.2. All-Electric Pathway Assumptions
2.2.1. Power Lines
2.2.2. Transformers
2.2.3. Battery
2.3. Hydrogen Pathway Assumptions
2.3.1. Transmission Pipeline
2.3.2. Transmission Compressor
2.3.3. Underground Storage
2.3.4. Linepack
| Component | Cost (USD) | Lifespan (Years) | η |
|---|---|---|---|
| Fixed PV Generation Site w/Boost Converter (USD/kW) | 1030 [37] | 30 | 0.95 [43] |
| PV Site Inverter (USD/kW) | 47 [42] | 30 | 0.95 [59] |
| Electrolyzer (USD/kWout) | 600–800 [60] | 12 | 0.71 [61] |
| Compressor Substation (USD/kW) | 3300 [51] | 20 | Calc. [27] |
| Transmission Pipeline (USD/mi) | Calc. [26] | 30 | 0.99 [62] |
| Underground Storage Site (USD/kWh) | Calc. [56] | 30 | 1 [56] |
| Fuel Cell (USD/kW) | 2800–3500 [63,64] | 10 | 0.60 [65] |
| Gas Turbine Power Plant (USD/kW) | 1000–1150 [66,67] | 20 | 0.60 [68] |
| 230 kV Double Circuit Power Line (USD/mi) | 4,495,000 [69] | 30 | Calc. |
| 500 kV Double Circuit Power Line (USD/mi) | 9,382,000 [69] | 30 | Calc. |
| 230 kV Substation Base Cost (USD) | 17,710,000 [69] | 35 | N/A |
| 500 kV Substation Base Cost (USD) | 36,194,000 [69] | 35 | N/A |
| 230/66 kV Power Transformer (USD/kVA) | 15.6 [14,45,69] | 40 | 0.97 [42,43] |
| 500/230 kV Power Transformer (USD/kVA) | 16.7 [14,45,69] | 40 | 0.97 [42,43] |
| Li-Ion Energy Storage System (USD/kWh) | 250–350 [69,70] | 20 | 0.69 [46] |
2.4. Dynamics and Cost Calculations
3. Results
3.1. Levelized Cost of Transmission
3.2. Levelized Cost of Electricity (LCOE)
4. Discussion
4.1. Transmission Congestion
4.2. Reliability and Safety
4.3. Scalability
5. Summary and Conclusions
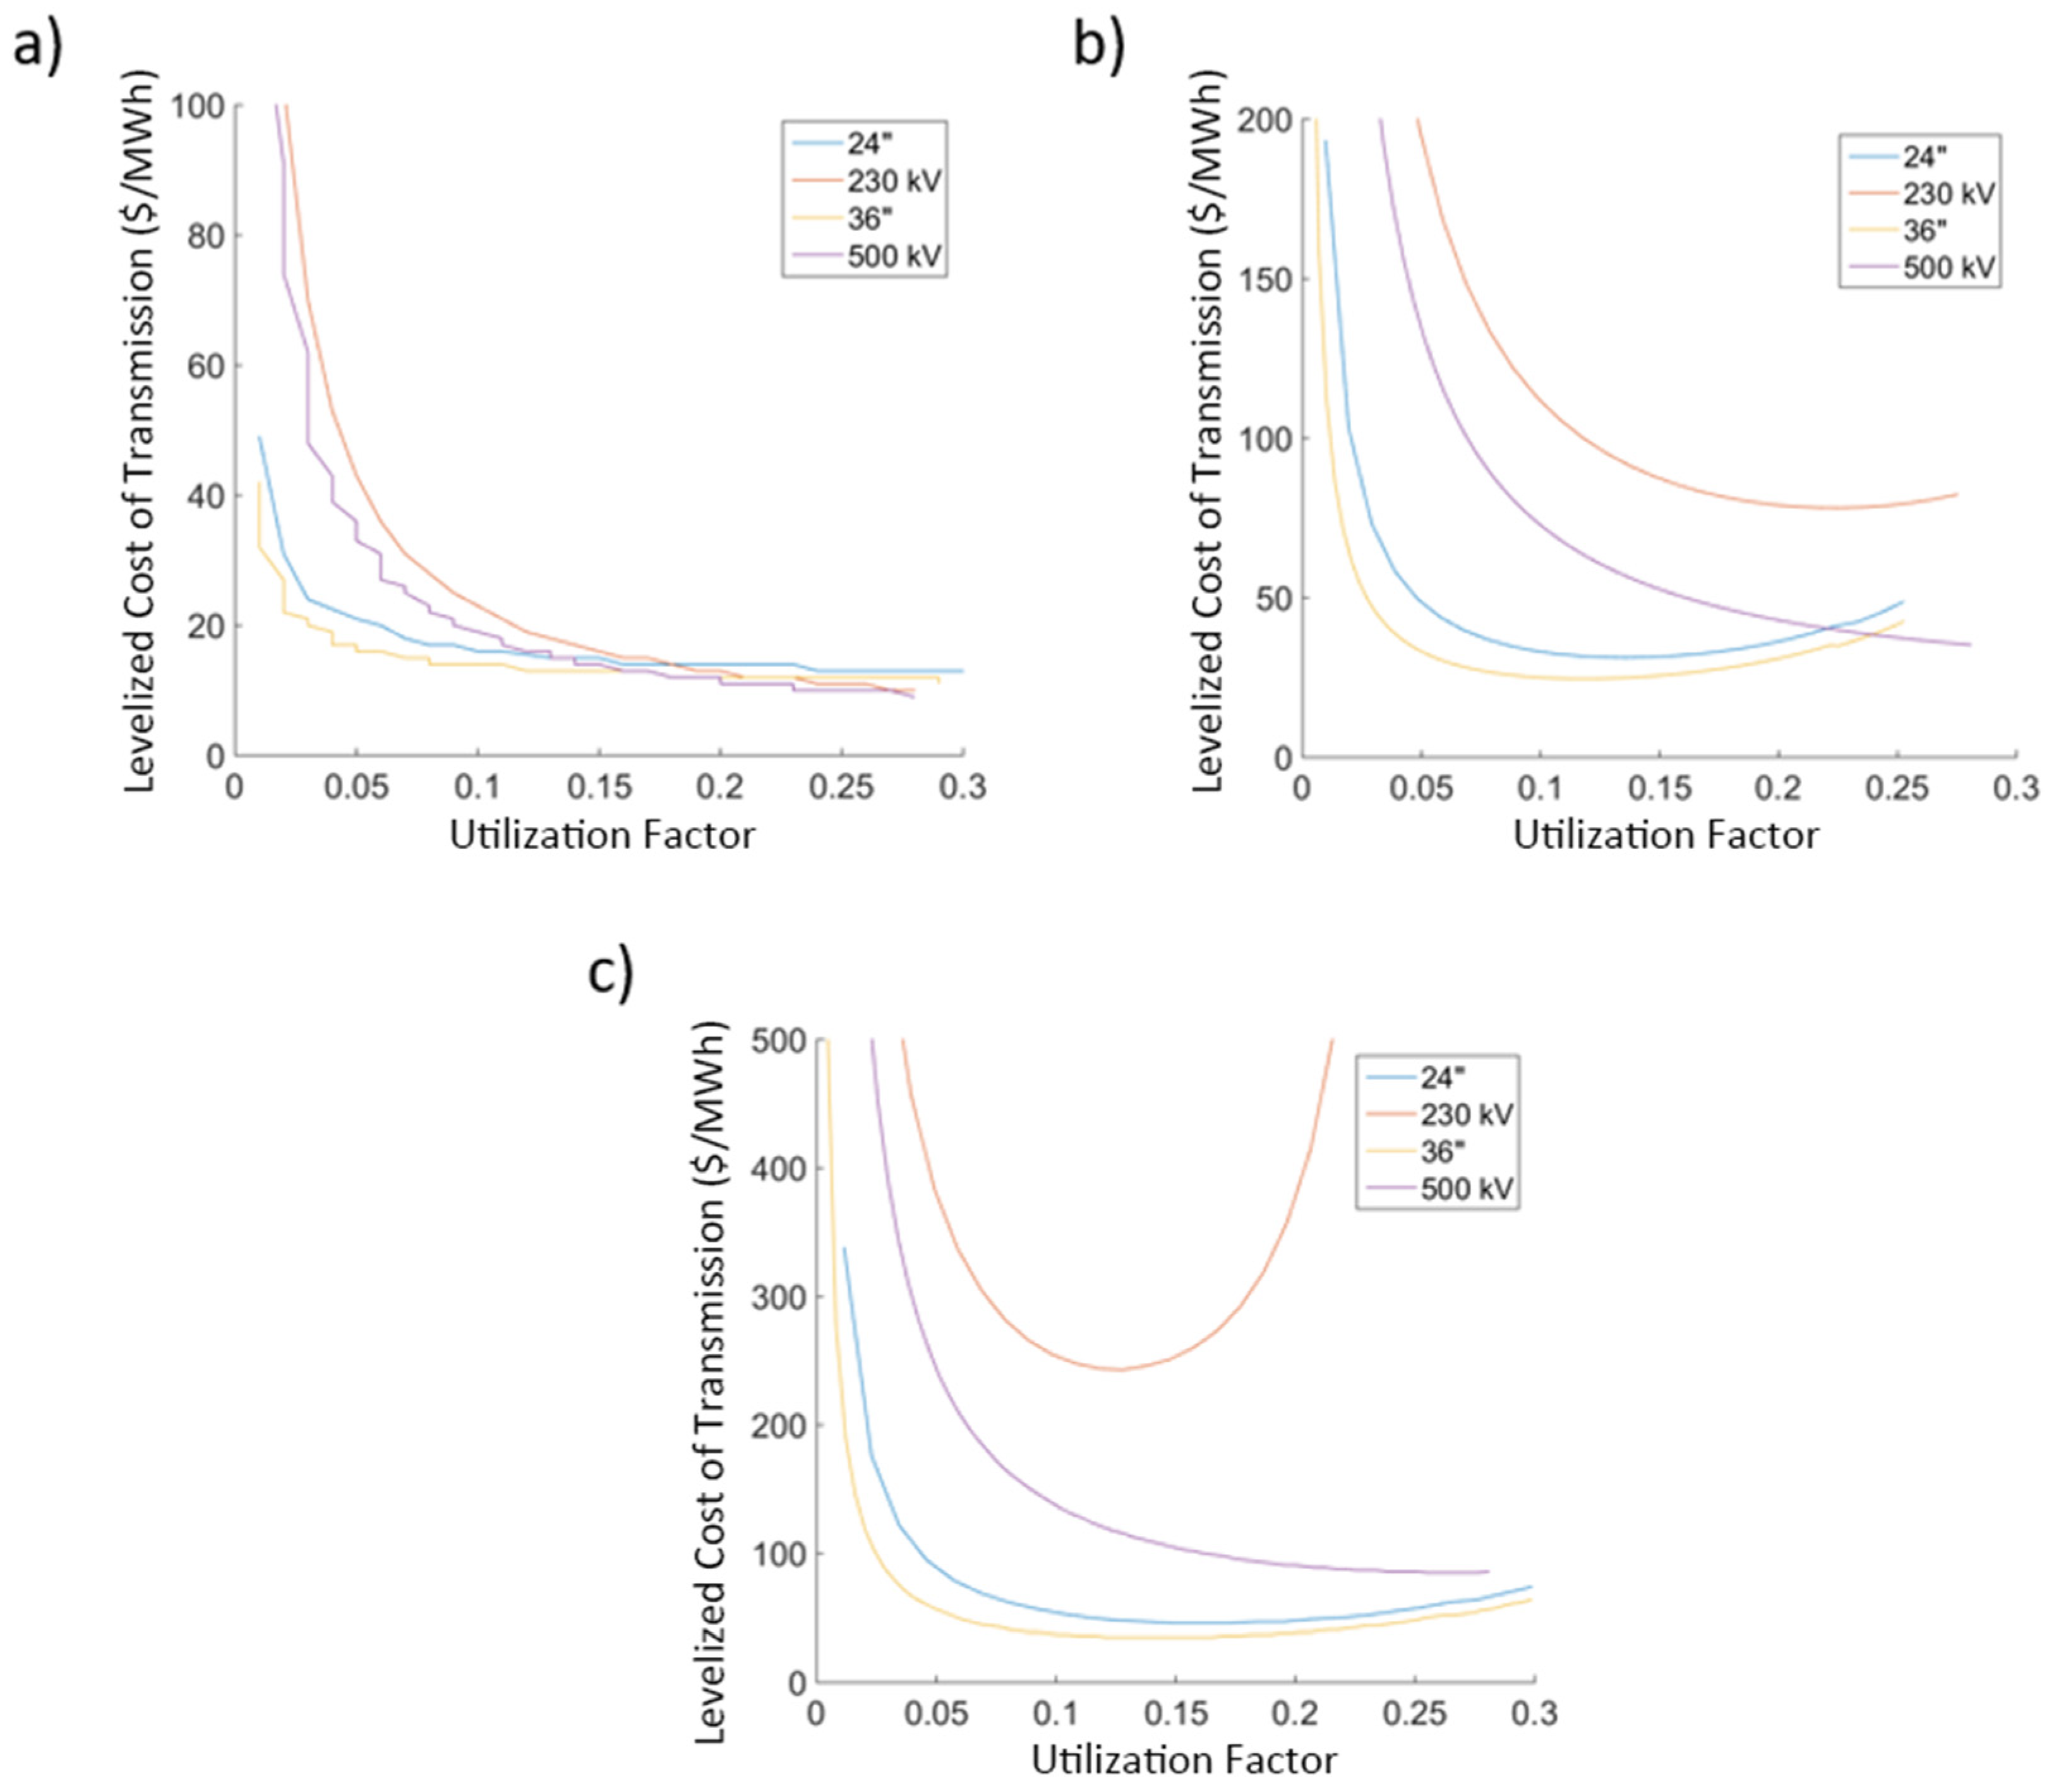
- Levelized costs for energy transmission when delivering only solar PV energy over 100 miles via hydrogen through pipelines and electricity through power lines are comparable at roughly 10 USD/MWh to 15 USD/MWh.
- At lower transmission medium utilization factors, pipelines are significantly cheaper than power lines for delivering energy (e.g., 25 USD/MWh to 30 USD/MWh for pipelines at 10% utilization over 500 miles as opposed to 72 USD/MWh to 118 USD/MWh for power lines).
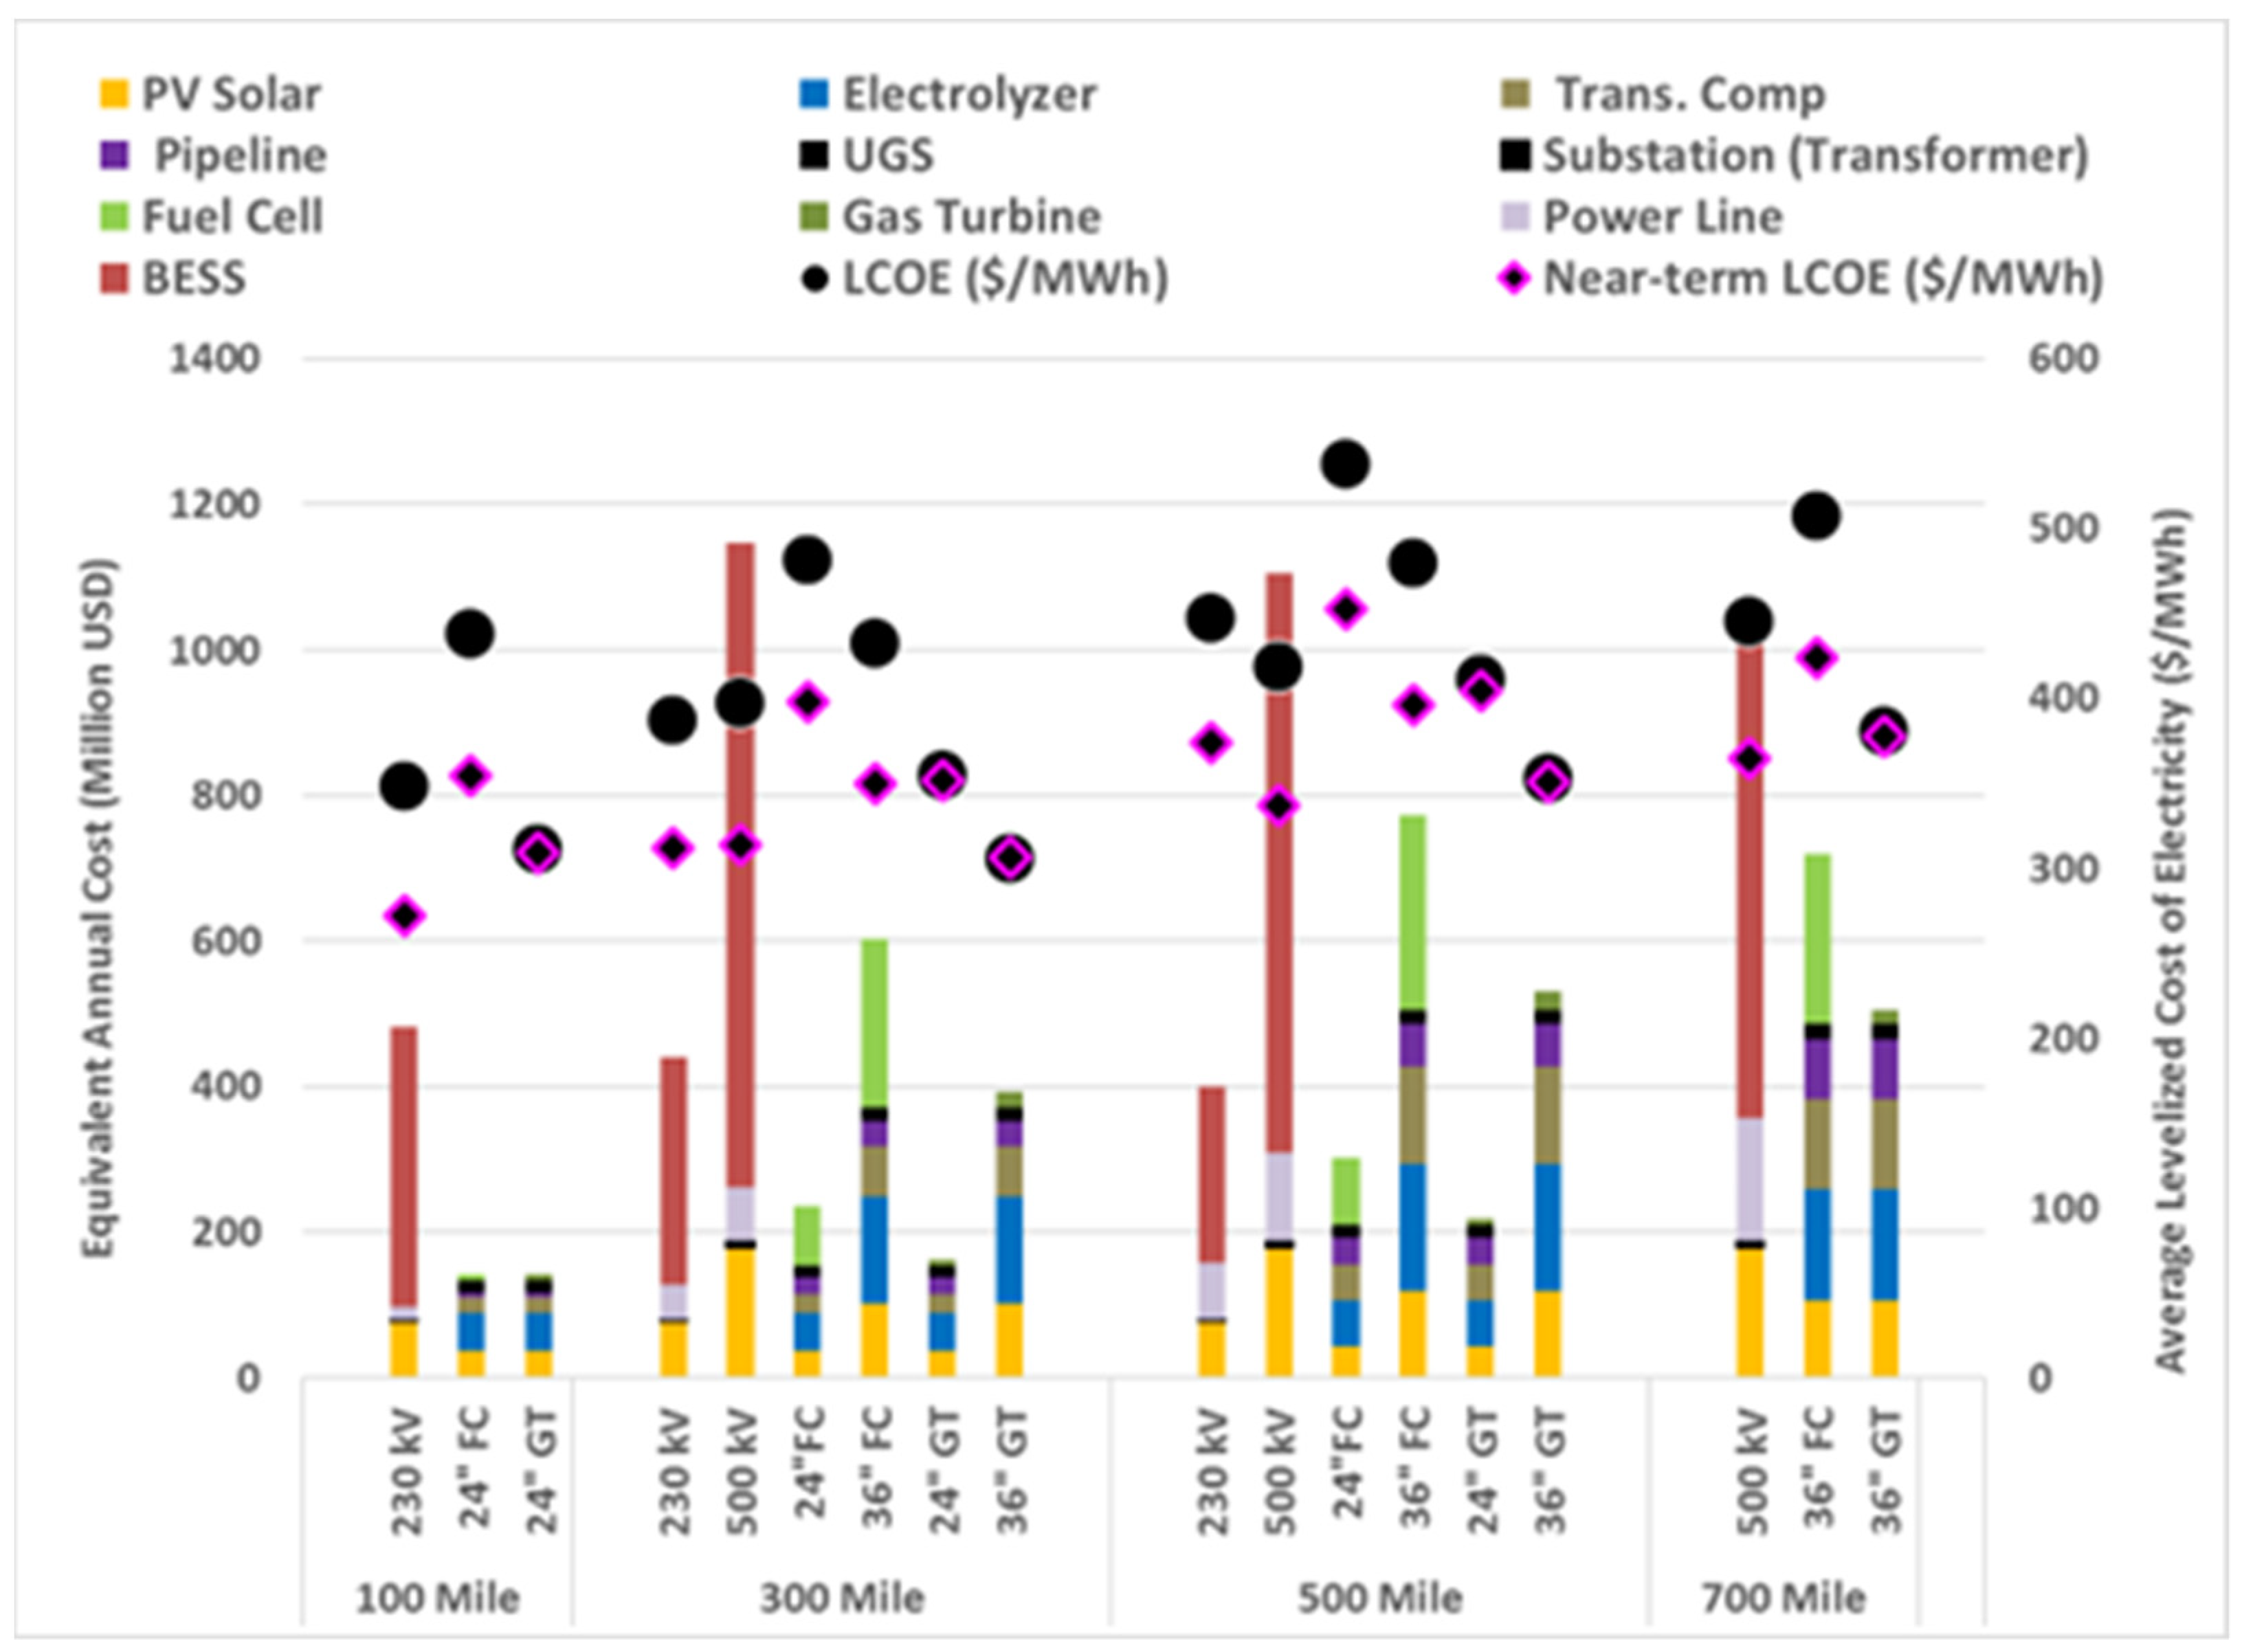
- Hydrogen pathways utilizing a gas turbine system for reconversion to electricity are generally the cheapest for meeting electric demand in all scenarios as low as 311, 278, and 278 USD/MWh delivered 100 miles for the 18% utilization scenario, 95% demand, and 100% demand scenarios, respectively.
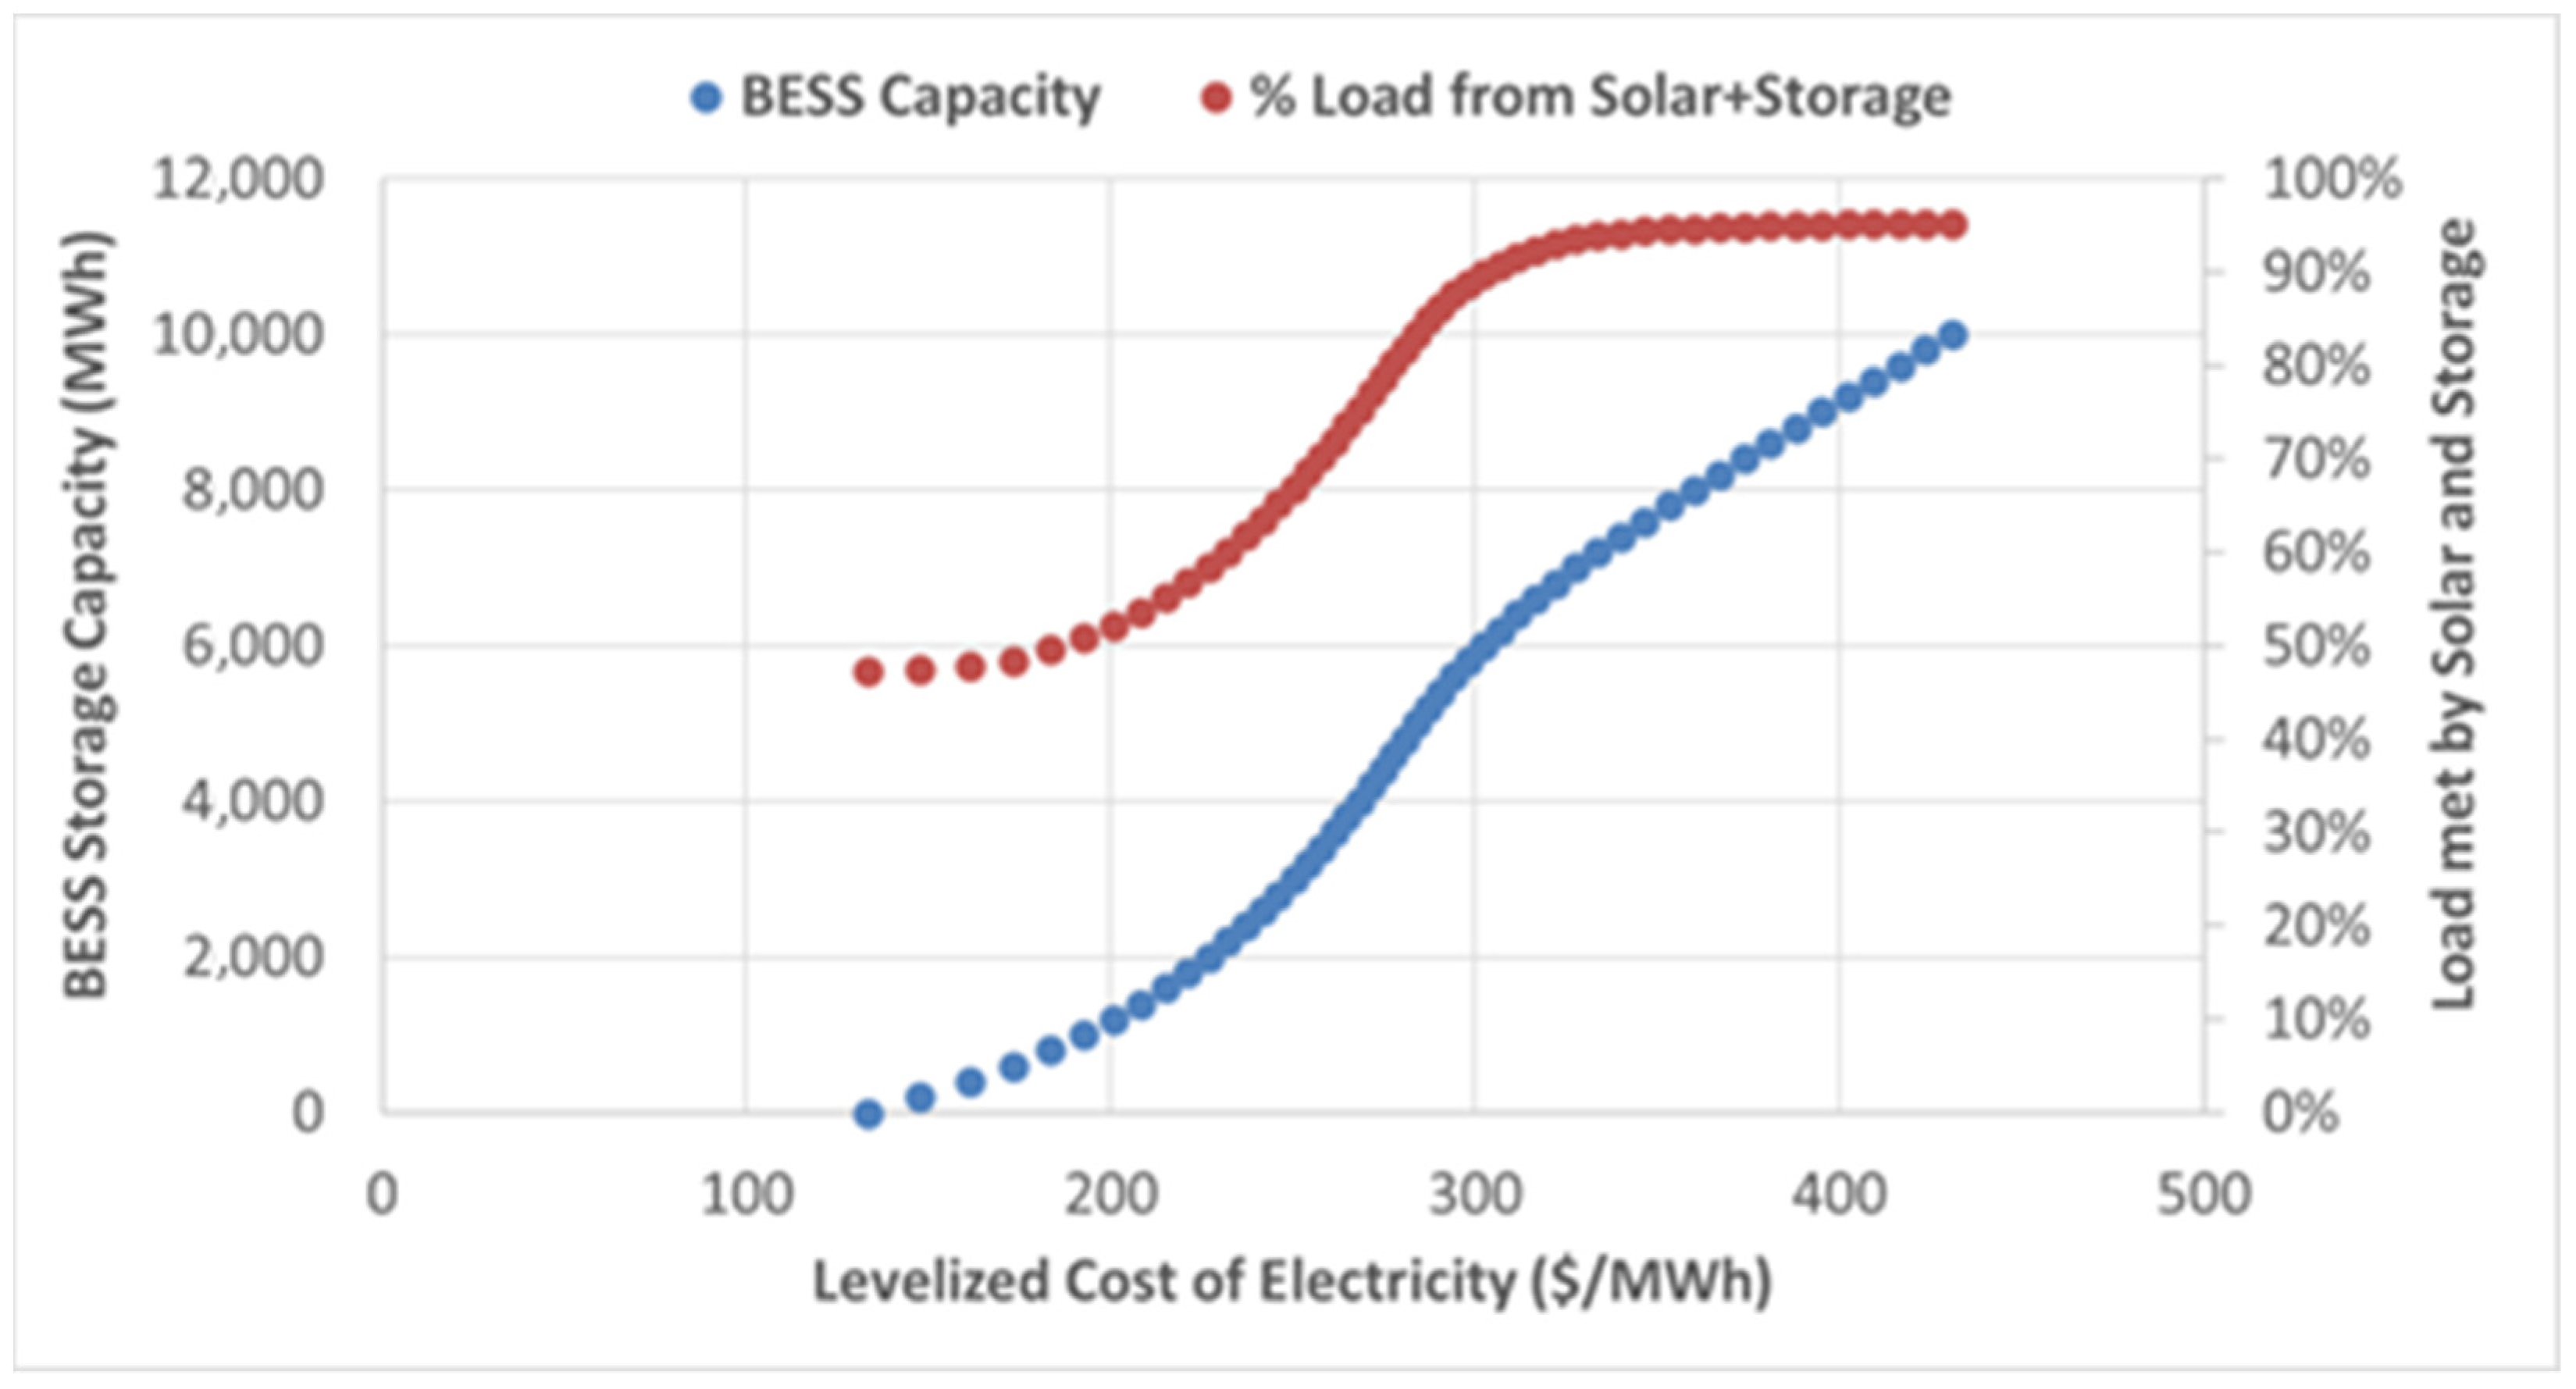
- For meeting 95% of demand, the all-electric scenarios are cheaper than the hydrogen pathways which utilize fuel cells (e.g., 356 USD/MWh for all-electric versus 405 USD/MWh for the fuel cell pathway at 100 miles).
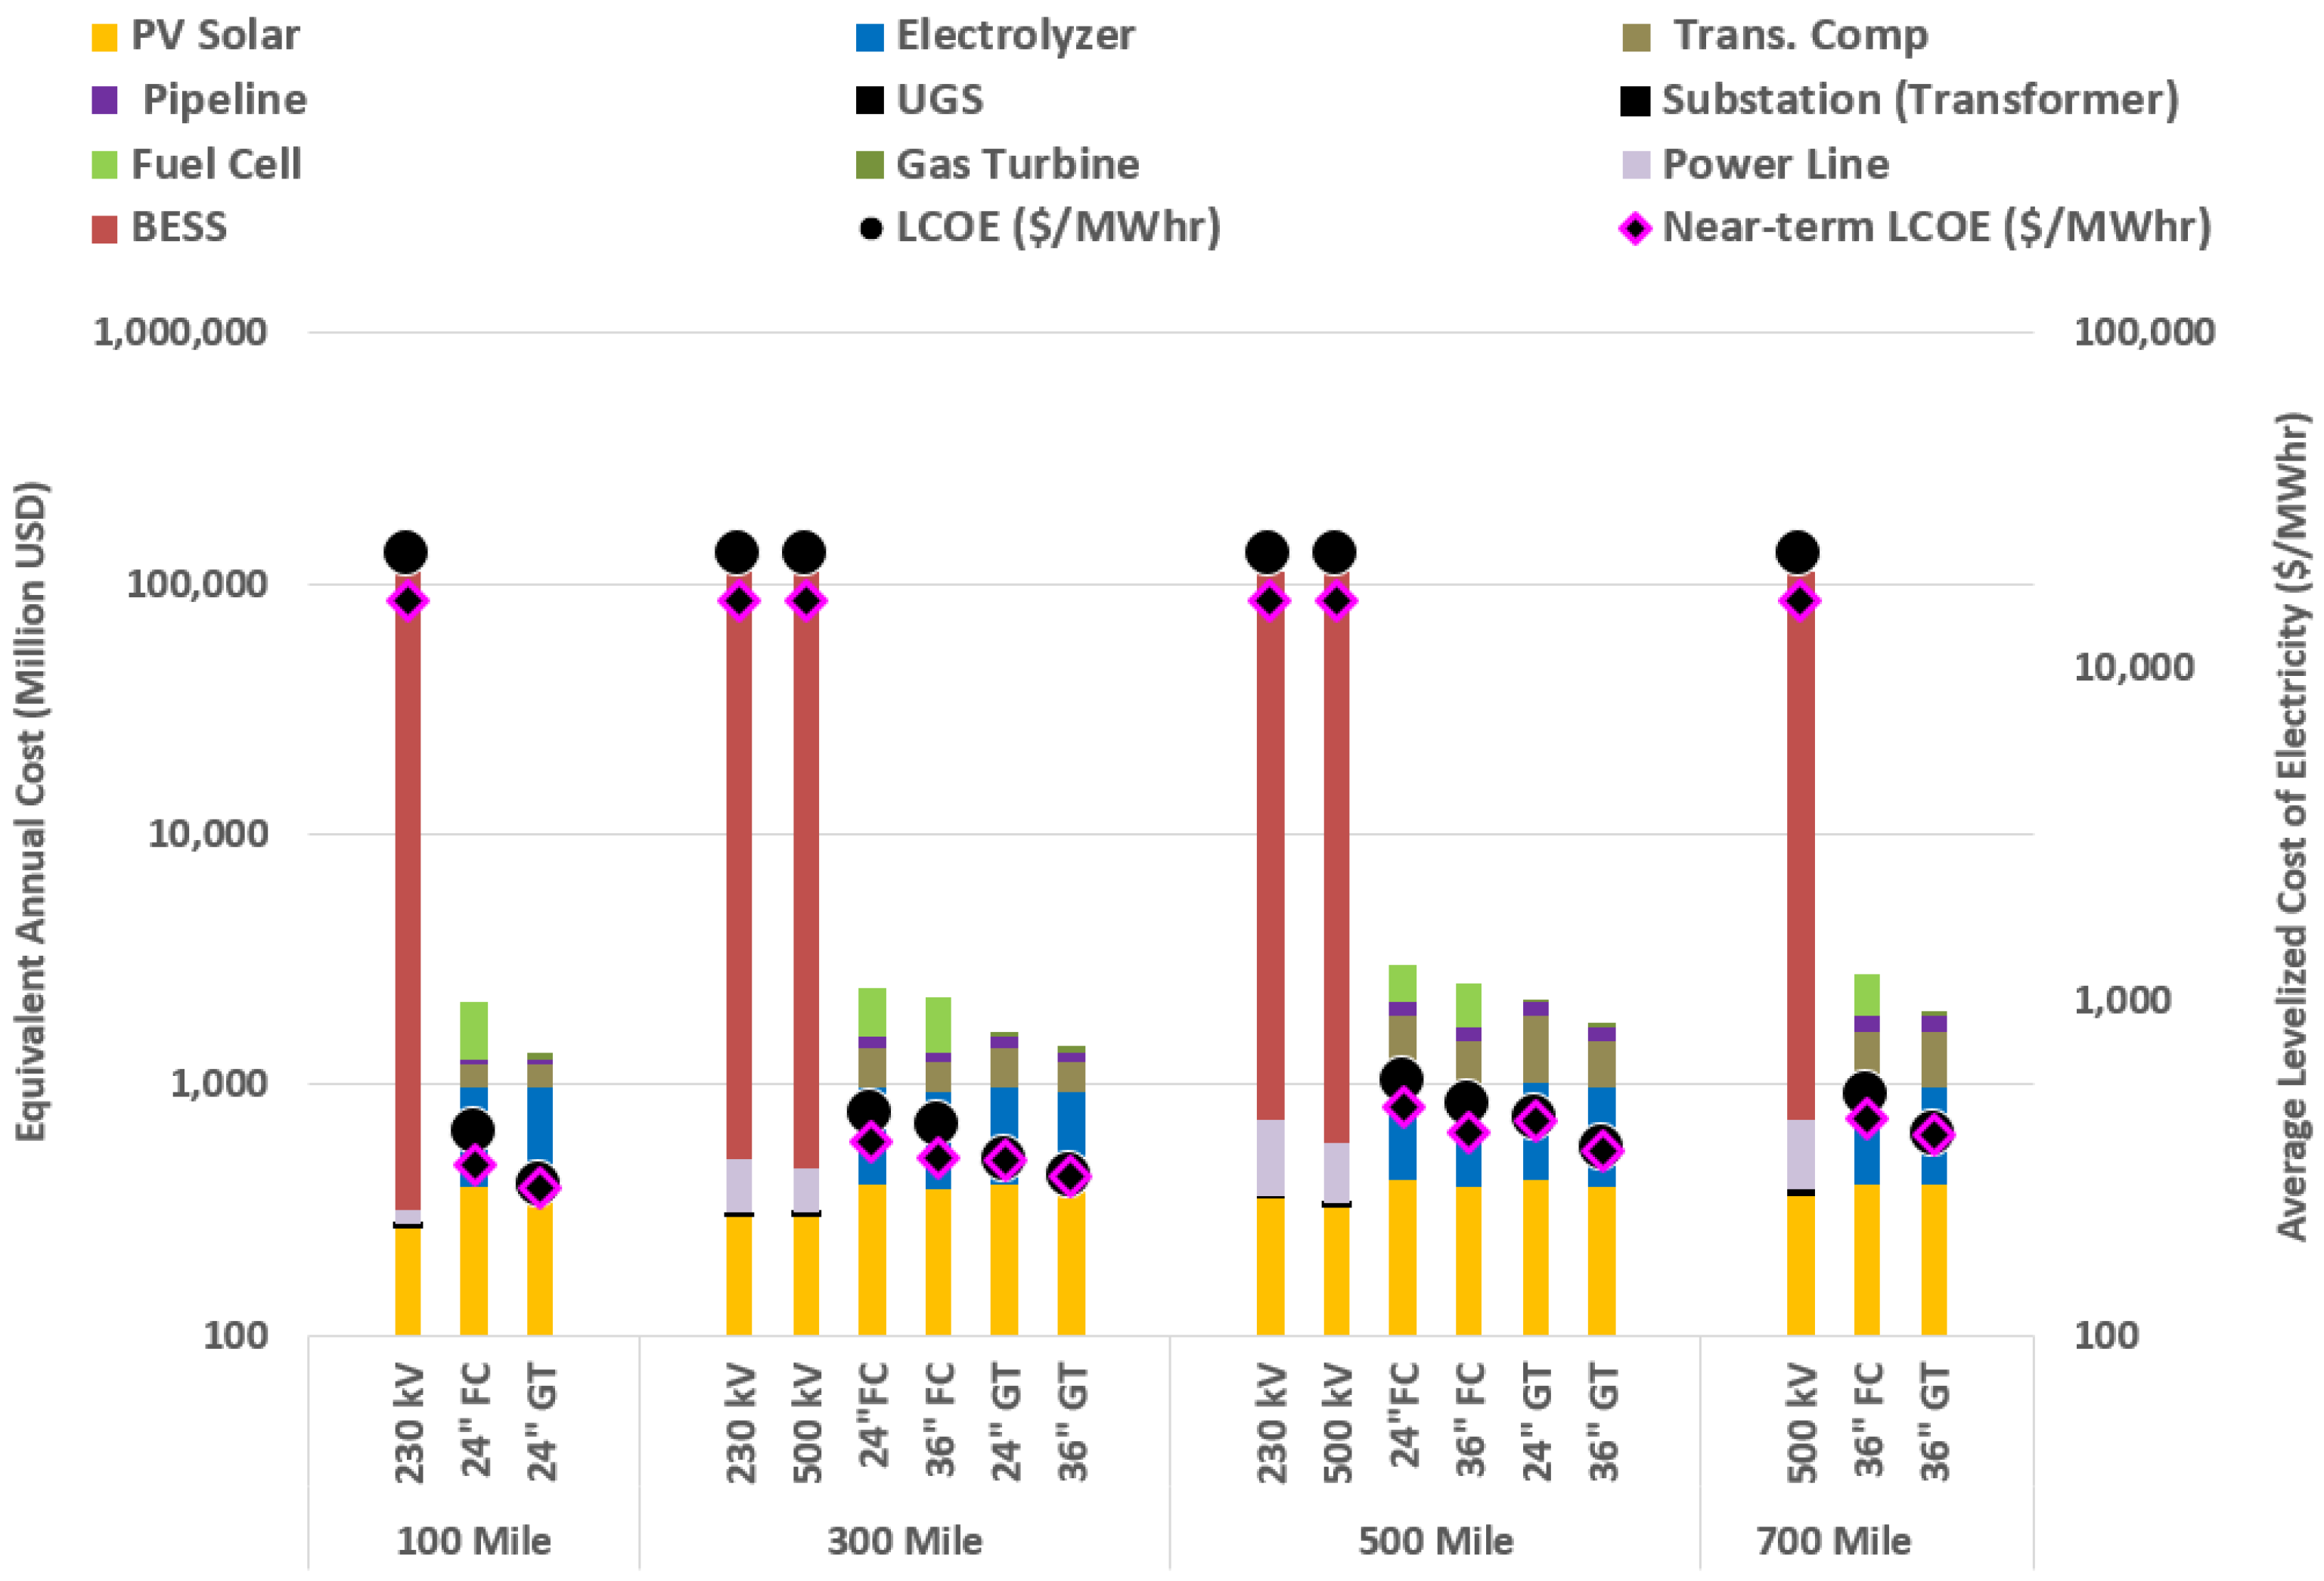
- For meeting 100% of the demand, the hydrogen pathways are two orders of magnitude cheaper than the all-electric pathways due to a marginal increase in cost for hydrogen energy storage (only the gaseous storage component itself must be enlarged) compared to large increases in cost to install larger numbers of complete battery systems (e.g., 405 USD/MWh to 570 USD/MWh for the fuel cell pathway or 278 USD/MWh to 443 USD/MWh for the gas turbine pathway as opposed to the all-electric pathway range of 21,655 to 21,834 USD/MWh).
- Pipeline linepack energy storage, 55 and 119 GWh with 24-inch and 36-inch pipelines over 100 miles, respectively, is more than sufficient to meet daily shifting demands, roughly 8 GWh in the all-electric pathway and slightly higher in the hydrogen pathways. The pipeline linepack energy storage of 36-inch pipelines over 500 miles nearly provides sufficient storage to meet seasonal storage requirements, roughly 605 GWh in the all-electric pathway, for the PV energy that it transmits.
Supplementary Materials
Author Contributions
Funding
Data Availability Statement
Conflicts of Interest
References
- Eto, J.H. Building Electric Transmission Lines: A Review of Recent Transmission Projects; Ernest Orlando Lawrence Berkeley National Laboratory: Berkeley, CA, USA, 2016. [Google Scholar]
- Tran, T.H.; French, S.; Ashman, R.; Kent, E. Linepack planning models for gas transmission network under uncertainty. Eur. J. Oper. Res. 2018, 268, 688–702. [Google Scholar] [CrossRef]
- Fallahi, F.; Maghouli, P. Integrated unit commitment and natural gas network operational planning under renewable generation uncertainty. Int. J. Electr. Power Energy Syst. 2019, 117, 105647. [Google Scholar] [CrossRef]
- Arvesen, T.; Medbø, V.; Fleten, S.-E.; Tomasgard, A.; Westgaard, S. Linepack storage valuation under price uncertainty. Energy 2013, 52, 155–164. [Google Scholar] [CrossRef]
- Weisenmiller, R.B.; Douglas, K.; McAllister, A.; Hochschild, D.; Scott, J.A.; Bozorgchami, P.; Froess, L.; Meyer, C.; Ashuckian, D.; Bohan, D. Building Energy Efficiency Standards for Residential and Nonresidential Buildings. 2018. Available online: https://www.energy.ca.gov/sites/default/files/2021-06/CEC-400-2018-020-CMF_0.pdf (accessed on 30 May 2019).
- Brouwer, J. Realizing a Renewable Energy Future through Power-to-Gas California Fuel Cell Partnership. Presented at California Fuel Cell Partnership Meeting, University of California, Los Angeles, CA, USA, 2017. Available online: https://h2fcp.org/sites/default/files/20170425_EB_3_RH2-Brouwer2.pdf (accessed on 9 March 2019).
- Oney, F.; Lu, T.N.V.; Dulger, Z. Evaluation of pipeline transportation of hydrogen and natural gas mixtures. Int. J. Hydrogen Energy 1994, 19, 813–822. [Google Scholar] [CrossRef]
- Mills, A.; Wiser, R.; Porter, K. The cost of transmission for wind energy in the United States: A review of transmission planning studies. Renew. Sustain. Energy Rev. 2012, 16, 1–19. [Google Scholar] [CrossRef]
- Kishore, T.; Singal, S. Optimal economic planning of power transmission lines: A review. Renew. Sustain. Energy Rev. 2014, 39, 949–974. [Google Scholar] [CrossRef]
- EIA. Table 8.3. Revenue and Expense Statistics for Major U.S. Investor-Owned Utilities. Available online: https://www.eia.gov/electricity/annual/html/epa_08_03.html (accessed on 2 April 2020).
- Public Service Commission of Wisconsin. Underground Electric Transmission Lines; Public Service Commission of Wisconsin: Madison, WI, USA, 2011; pp. 1–22.
- Eastern Interconnection Planning Collaborative. Phase 2 Report: Interregional Transmission Development and Analysis for Three Stakeholder Selected Scenarios And Gas-Electric System Interface Study; EIPC: Verona, WI, USA, 2015. [Google Scholar]
- CPUC. Rule 21 Interconnection. 2018. Available online: http://www.cpuc.ca.gov/Rule21/ (accessed on 18 September 2018).
- Pletka, R.; Khangura, J.; Rawlines, A.; Waldren, E.; Wilson, D. Capital Costs for Transmission and Substations; Western Electricity Coordinating Council: Salt Lake City, UT, USA, 2014. [Google Scholar]
- The University of Texas at Austin Energy Institute. The Full Cost of Electricity (FCe-): Estimation of Transmission Costs for New Generation. 2017. Available online: https://energy.utexas.edu/sites/default/files/UTAustin_FCe_TransmissionCosts_2017.pdf (accessed on 6 July 2019).
- Midcontinent Independent System Operator. Transmission Cost Estimation Guide; MISO: Carmel, IN, USA, 2019. [Google Scholar]
- Dismukes, D.E.; Cope, R.F.; Mesyanzhinov, D. Capacity and economies of scale in electric power transmission. Util. Policy 1998, 7, 155–162. [Google Scholar] [CrossRef]
- Denholm, P.; Hand, M. Grid flexibility and storage required to achieve very high penetration of variable renewable electricity. Energy Policy 2011, 39, 1817–1830. [Google Scholar] [CrossRef]
- Lai, C.S.; McCulloch, M.D. Levelized cost of electricity for solar photovoltaic and electrical energy storage. Appl. Energy 2017, 190, 191–203. [Google Scholar] [CrossRef]
- Tu, Q.; Betz, R.; Mo, J.; Fan, Y.; Liu, Y. Achieving grid parity of wind power in China—Present levelized cost of electricity and future evolution. Appl. Energy 2019, 250, 1053–1064. [Google Scholar] [CrossRef]
- Chadee, X.T.; Clarke, R.M. Wind resources and the levelized cost of wind generated electricity in the Caribbean islands of Trinidad and Tobago. Renew. Sustain. Energy Rev. 2018, 81, 2526–2540. [Google Scholar] [CrossRef]
- Schmidt, O.; Melchior, S.; Hawkes, A.; Staffell, I. Projecting the Future Levelized Cost of Electricity Storage Technologies. Joule 2019, 3, 81–100. [Google Scholar] [CrossRef]
- Jülch, V. Comparison of electricity storage options using levelized cost of storage (LCOS) method. Appl. Energy 2016, 183, 1594–1606. [Google Scholar] [CrossRef]
- U.S. Energy Information Administration. Levelized Cost and Levelized Avoided Cost of New Generation Resources in the Annual Energy Outlook 2016; U.S. EIA: Washington, DC, USA, 2020; pp. 1–20.
- Yang, C.; Ogden, J. Determining the lowest-cost hydrogen delivery mode. Int. J. Hydrogen Energy 2007, 32, 268–286. [Google Scholar] [CrossRef]
- Parker, N. Using Natural Gas Transmission Pipeline Costs to Estimate Hydrogen Pipeline Costs; Institute of Transportation Studies: Davis, CA, USA, 2004; p. 86. [Google Scholar]
- Department of Energy. DOE Hydrogen and Fuel Cells Program: DOE H2A Delivery Analysis. Available online: https://www.hydrogen.energy.gov/h2a_delivery.html (accessed on 27 October 2019).
- Singh, N.; McFarland, E.W. Levelized cost of energy and sensitivity analysis for the hydrogen–bromine flow battery. J. Power Sources 2015, 288, 187–198. [Google Scholar] [CrossRef]
- Weidner, S.; Faltenbacher, M.; François, I.; Thomas, D.; Skùlason, J.; Maggi, C. Feasibility study of large scale hydrogen power-to-gas applications and cost of the systems evolving with scaling up in Germany, Belgium and Iceland. Int. J. Hydrogen Energy 2018, 43, 15625–15638. [Google Scholar] [CrossRef]
- Mohsin, M.; Rasheed, A.; Saidur, R. Economic viability and production capacity of wind generated renewable hydrogen. Int. J. Hydrogen Energy 2018, 43, 2621–2630. [Google Scholar] [CrossRef]
- Kluschke, P.; Neumann, F. Interaction of a Hydrogen Refueling Station Network for Heavy-Duty Vehicles and the Power System in Germany for 2050. arXiv 2019, arXiv:1908.10119. [Google Scholar]
- California Energy Commission. Status of all Projects. Webpage. 2016. Available online: http://www.energy.ca.gov/sitingcases/all_projects.html (accessed on 4 May 2018).
- Islam, R.; Guo, Y.; Zhu, J. Power Converters for Small- to Large-Scale Photovoltaic Power Plants. Green Energy Technol. 2014, 182, 17–49. [Google Scholar] [CrossRef]
- Kumar, B.S.; Sudhakar, K. Performance evaluation of 10 MW grid connected solar photovoltaic power plant in India. Energy Rep. 2015, 1, 184–192. [Google Scholar] [CrossRef]
- Aldali, Y.; Henderson, D.; Muneer, T. A 50 MW very large-scale photovoltaic power plant for Al-Kufra, Libya: Energetic, economic and environmental impact analysis. Int. J. Low-Carbon Technol. 2011, 6, 277–293. [Google Scholar] [CrossRef]
- California Electric Transmission Line. Available online: https://cecgis-caenergy.opendata.arcgis.com/datasets/california-electric-substation/data (accessed on 11 May 2018).
- Fu, R.; Feldman, D.; Margolis, R.; Woodhouse, M.; Ardani, K. U.S. Solar Photovoltaic System Cost Benchmark: Q1. 2017. Available online: https://www.nrel.gov/docs/fy17osti/68925.pdf (accessed on 8 January 2019).
- SCE Conceptual Transmission Requirements and Costs for Integrating Renewable Resources Southern California Edison Company. 2007. Available online: https://docs.cpuc.ca.gov/word_pdf/AGENDA_RESOLUTION/70203.pdf (accessed on 18 January 2019).
- Riverside Transmission Reliability Project (Rtrp) 230 kV Underground Alternatives Desktop Study July 2015. Available online: https://ia.cpuc.ca.gov/environment/info/panoramaenv/RTRP/PDF/Deficiency4/Attachments/DR4Q.12_%20Attachment2.pdf (accessed on 18 January 2019).
- Conductor Data Sheet Aluminum Conductors Steel Reinforced (ACSR). Available online: https://www.midalcable.com/sites/default/files/ACSR-metric.PDF (accessed on 18 September 2019).
- Southern California Edison Company. Local Capacity Area Substation List. No. 4. 2011. Available online: https://www.sce.com/sites/default/files/inline-files/SCE_LocalCapacityAreaSubstationList%20%281%29.pdf (accessed on 11 May 2019).
- Baggini, A. Power Transformers—Introduction to Measurement of Losses. 2016. Available online: https://www.intas-testing.eu/storage/app/media/INTAS_trasformers_descr.pdf (accessed on 17 May 2019).
- Zini, G.; Rosa, A.D. Hydrogen systems for large-scale photovoltaic plants: Simulation with forecast and real production data. Int. J. Hydrogen Energy 2014, 39, 107–118. [Google Scholar] [CrossRef]
- Department of Energy. Large Power Transformers and the U.S. Electric Grid; Department of Energy: Washington, DC, USA, 2014.
- Dagle, J.; Brown, D. Electric Power Substation Capital Costs; Department of Energy: Washington, DC, USA, 1997. [CrossRef]
- Baker, J.; Cross, J.; Lloyd, I. CLNR: Lessons Learned Report: Electrical Energy Storage. Customer-Led Network Revolution—Northern Powergrid, No. December, 2014. Available online: http://www.networkrevolution.co.uk/wp-content/uploads/2014/12/CLNR_L163-EES-Lessons-Learned-Report-v1.0.pdf (accessed on 4 May 2019).
- Lazard. Lazard’s Levelized Cost of Storage Analysis—Version 4.0. 2018. Available online: https://www.lazard.com/media/450774/lazards-levelized-cost-of-storage-version-40-vfinal.pdf (accessed on 29 August 2019).
- Langelandsvik, L.I.; Postvoll, W.; Aarhus, B.; Kaste, K.K. Accurate Calculation of Pipeline Transport Capacity. In Proceedings of the 24th World Gas Conference, Buenos Aires, Argentina, 5–9 October 2009. [Google Scholar]
- Fekete, J.R.; Sowards, J.W.; Amaro, R.L. Economic impact of applying high strength steels in hydrogen gas pipelines. Int. J. Hydrogen Energy 2015, 40, 10547–10558. [Google Scholar] [CrossRef]
- Socalgas Direct Testimony of Beth Musich (Gas Transmission Operation) October 6, 2017. Available online: https://www.socalgas.com/regulatory/documents/a-17-10-008/SCG-206-%20Gas%20Transmission%20Operation%20B.%20Musich%20Final.pdf (accessed on 8 January 2019).
- Zhao, Y.; Rui, Z. Pipeline compressor station construction cost analysis. Int. J. Oil Gas Coal Technol. 2014, 8, 41. [Google Scholar] [CrossRef]
- EPA. Methane Emissions from the Natural Gas Industry, Volume 9: Underground Pipelines; EPA: Washington, DC, USA, 1996; Volume 9.
- Melaina, M.W.; Antonia, O.; Penev, M. Blending Hydrogen into Natural Gas Pipeline Networks: A Review of Key Issues; NREL: Golden, CO, USA, 2013. [Google Scholar]
- Mejia, A.H.; Brouwer, J.; Mac Kinnon, M. Hydrogen leaks at the same rate as natural gas in typical low-pressure gas infrastructure. Int. J. Hydrogen Energy 2020, 45, 8810–8826. [Google Scholar] [CrossRef]
- Hedegaard, K.; Meibom, P. Wind power impacts and electricity storage—A time scale perspective. Renew. Energy 2012, 37, 318–324. [Google Scholar] [CrossRef]
- Lord, A.S.; Kobos, P.H.; Borns, D.J. Geologic storage of hydrogen: Scaling up to meet city transportation demands. Int. J. Hydrogen Energy 2014, 39, 15570–15582. [Google Scholar] [CrossRef]
- Amid, A.; Mignard, D.; Wilkinson, M. Seasonal storage of hydrogen in a depleted natural gas reservoir. Int. J. Hydrogen Energy 2016, 41, 5549–5558. [Google Scholar] [CrossRef]
- Meng, B.; Gu, C.; Zhang, L.; Zhou, C.; Li, X.; Zhao, Y.; Zheng, J.; Chen, X.; Han, Y. Hydrogen effects on X80 pipeline steel in high-pressure natural gas/hydrogen mixtures. Int. J. Hydrogen Energy 2016, 42, 7404–7412. [Google Scholar] [CrossRef]
- PV Performance Modeling Collaborative|CEC Inverter Test Protocol. Available online: https://pvpmc.sandia.gov/modeling-steps/dc-to-ac-conversion/cec-inverter-test-protocol/ (accessed on 13 December 2020).
- Mayyas, A.T.; Ruth, M.F.; Pivovar, B.S.; Bender, G.; Wipke, K.B. Manufacturing Cost Analysis for Proton Exchange Membrane Water Electrolyzers; National Renewable Energy Laboratory: Golden, CO, USA, 2019. [Google Scholar]
- Bertuccioli, L.; Chan, A.; Hart, D.; Lehner, F.; Madden, B.; Standen, E. Study on Development of Water Electrolysis in the EU, LC-GC North, No. February, 2014. Presented at IEA Annex 30 Workshop, Herten, Germany. Available online: https://www.sintef.no/contentassets/1ac5d74dbeac4e5ea19aa3079df0997a/01-05_lehner_e4tech.pdf (accessed on 30 August 2019).
- S. C. E. Southern California Gas Company; Pacific Gas & Electric Company; San Diego Gas & Electric Company; Southwest Gas Corporation; City of Long Beach Gas & Oil Department. 2016 California Gas Report Prepared by the California Gas and Electric Utilities. 2014. Available online: https://www.pge.com/pipeline_resources/pdf/library/regulatory/downloads/cgr16.pdf (accessed on 6 September 2019).
- Körner, A. Technology Roadmap—Hydrogen and Fuel Cells. 2015. Available online: https://meteor.springer.com/springerreference.jsf (accessed on 17 May 2018).
- Battelle Memorial Institute. Manufacturing Cost Analysis of 100 and 250 kW Fuel Cell Systems for Primary Power and Combined Heat and Power Applications. 2016. Available online: https://www.energy.gov/eere/fuelcells/articles/manufacturing-cost-analysis-100-and-250-kw-fuel-cell-systems-primary-power (accessed on 7 July 2021).
- DOE. Fuel Cell Technologies Office: Fuel Cells. Available online: https://www.energy.gov/sites/prod/files/2015/11/f27/fcto_fuel_cells_fact_sheet.pdf (accessed on 28 October 2019).
- Steward, D.; Saur, G.; Penev, M.; Ramsden, T. Lifecycle Cost Analysis of Hydrogen Versus Other Technologies for Electrical Energy Storage; NREL: Golden, CO, USA, 2009. [Google Scholar]
- Energy Information Administration. Capital Cost Estimates for Utility Scale Electricity Generating Plants; Energy Information Administration: Washington, DC, USA, 2016. [Google Scholar]
- Fukuda, M.; Dozono, Y. Double Reheat Rankine Cycle for Hydrogen-Combustion, Turbine Power Plants. J. Propuls. Power 2000, 16, 562–567. [Google Scholar] [CrossRef]
- Southern California Edison Company. SCE 2017 Per Unit Cost Guide.2017. Available online: https://www.caiso.com/Documents/SCE2017FinalPerUnitCostGuide.xls (accessed on 21 May 2018).
- Cole, W.; Frazier, A.W.; Cole, W.; Frazier, A.W. Cost Projections for Utility- Scale Battery Storage; NREL: Golden, CO, USA, 2019. [Google Scholar]
- OASIS—OASIS Prod—PUBLIC—0. Available online: http://oasis.caiso.com/mrioasis/logon.do (accessed on 30 May 2019).
- Mills, A.D.; Wiser, R.; Porter, K. The Cost of Transmission for Wind Energy: A Review of Transmission Planning Studies; U.S. Department of Energy: Washington, DC, USA, 2009; pp. 1–17. [CrossRef]
- Le Duigou, A.; Bader, A.-G.; Lanoix, J.-C.; Nadau, L. Relevance and costs of large scale underground hydrogen storage in France. Int. J. Hydrogen Energy 2017, 42, 22987–23003. [Google Scholar] [CrossRef]
- Liss, W.; Rowley, P. Assessment of Natural Gas and Electric Distribution Service Reliability GTI Topical Report; Gas Technology Institute: Des Plaines, IL, USA, 2018. [Google Scholar]
- Colbertaldo, P.; Agustin, S.B.; Campanari, S.; Brouwer, J. Impact of hydrogen energy storage on California electric power system: Towards 100% renewable electricity. Int. J. Hydrogen Energy 2019, 44, 9558–9576. [Google Scholar] [CrossRef]
- California ISO—Todays Outlook. Available online: http://www.caiso.com/TodaysOutlook/Pages/default.aspx (accessed on 5 September 2019).
- CEC. California Natural Gas Pipeline. 2018. Available online: https://cecgis-caenergy.opendata.arcgis.com/datasets/california-natural-gas-pipeline/data?geometry=-124.289%2C32.276%2C-110.413%2C35.468 (accessed on 11 May 2018).


| (a) | |||||||||
|---|---|---|---|---|---|---|---|---|---|
| Transmission Miles | PV | Substation & Transformers | Power Line | Battery | |||||
| 230 kV Power Line Scenario | |||||||||
| 100 | 100% | 100% | 100% | 100% | |||||
| 300 | 109% | 103% | 473% | 100% | |||||
| 500 | 118% | 120% | 788% | 98% | |||||
| 500 kV Power Line Scenario | |||||||||
| 300 | 100% | 100% | 100% | 100% | |||||
| 500 | 106% | 102% | 167% | 100% | |||||
| 700 | 115% | 105% | 233% | 100% | |||||
| (b) | |||||||||
| Transmission Miles | PV | Electrolyzer | Compressor | Pipeline | Fuel Cell | Underground Geological Storage | |||
| 24-Inch Pipeline Scenario | |||||||||
| 100 | 100% | 100% | 100% | 100% | 100% | 100% | |||
| 300 | 100% | 100% | 160% | 299% | 100% | 96% | |||
| 500 | 100% | 100% | 278% | 499% | 100% | 92% | |||
| 36-Inch Pipeline Scenario | |||||||||
| 300 | 100% | 100% | 100% | 100% | 100% | 100% | |||
| 500 | 98% | 98% | 172% | 167% | 98% | 99% | |||
| 700 | 98% | 98% | 205% | 233% | 98% | 99% | |||
Disclaimer/Publisher’s Note: The statements, opinions and data contained in all publications are solely those of the individual author(s) and contributor(s) and not of MDPI and/or the editor(s). MDPI and/or the editor(s) disclaim responsibility for any injury to people or property resulting from any ideas, methods, instructions or products referred to in the content. |
© 2023 by the authors. Licensee MDPI, Basel, Switzerland. This article is an open access article distributed under the terms and conditions of the Creative Commons Attribution (CC BY) license (https://creativecommons.org/licenses/by/4.0/).
Share and Cite
Thai, C.; Brouwer, J. Comparative Levelized Cost Analysis of Transmitting Renewable Solar Energy. Energies 2023, 16, 1880. https://doi.org/10.3390/en16041880
Thai C, Brouwer J. Comparative Levelized Cost Analysis of Transmitting Renewable Solar Energy. Energies. 2023; 16(4):1880. https://doi.org/10.3390/en16041880
Chicago/Turabian StyleThai, Clinton, and Jack Brouwer. 2023. "Comparative Levelized Cost Analysis of Transmitting Renewable Solar Energy" Energies 16, no. 4: 1880. https://doi.org/10.3390/en16041880
APA StyleThai, C., & Brouwer, J. (2023). Comparative Levelized Cost Analysis of Transmitting Renewable Solar Energy. Energies, 16(4), 1880. https://doi.org/10.3390/en16041880


