1. Introduction
The European Union’s (EU) energy policy aims to reduce total energy consumption and achieve carbon neutrality, with numerous distinctive features. A critical part of the policy is dedicated to reducing energy consumption and emissions in the residential sector, primarily because of technological advancements in the renewable energy area that can be applied in this particular sector [
1]. EU established the legal framework for making buildings more energy efficient, starting in 2010 to reach decarbonized buildings by 2050. The EU residential sector is crucial for achieving EU targets in the environmental and energy areas and creating more jobs in the green sector, alleviating poverty, improving health conditions and increasing people’s comfort. The residential sector’s contribution to total world energy consumption is more than one third (25% in the EU), and to total pollution up to (40%) [
2]. Furthermore, the EU legal framework has introduced minimum energy performance standards and released energy performance certificates to support building renovations to achieve energy efficiency goals [
3].
Many EU funds are allocated for innovation in technological processes, pilot plants, and smart grids [
4]. In addition, the European Investment Bank grants technical assistance to support building investments. However, EU financial support varies across EU countries, and so do the countries’ performances in renewable energy use in buildings [
5]. As a result, renewable energy in the building sector has increased in the EU. Nevertheless, it has increased at a slower pace than in other sectors. The most significant shares are found in Baltic countries, Balkan countries (such as Romania, Bulgaria, Slovenia, Croatia, and Greece), Scandinavian countries (such as Sweden and Finland), as well as France, Germany, and Italy [
6,
7].
Pollution has caused severe climate changes across the world, and buildings in Southern Europe cannot quickly adapt to these severe changes [
8]. Increased heat waves during the summertime require solutions for cooling the building space in this part of Europe. The residential sector in Portugal represents a critical share (18%) of the country’s total energy consumption, despite the share of total energy consumption in Southern Europe being lower than in other European countries. This situation is due to Portugal’s reliance on fossil fuels (around 75% of total energy consumption) and its vulnerability to severe climate changes [
9,
10,
11,
12]. Portugal has many old buildings with low energy performance and high energy consumption [
13] that require significant renovation [
11,
14]. However, Portugal ranks 2nd among the countries with the lowest energy consumption in the residential sector in Europe, after Malta [
15]. Despite this, Portugal’s programs for improving energy efficiency are not as developed or performant as those of other European countries [
16]. One crucial program adopted by Portugal to achieve its 2050 targets for zero-carbon emissions is the evaluation of buildings in terms of energy efficiency and the release of green-houses certificates for houses with high energy efficiency [
17]. Since 2009, all buildings in Portugal must have an energy certificate, and the legislation for this was updated in 2013 [
12].
Some previous researchers have linked low energy performance to Portuguese energy poverty [
18] and the high price level of electricity and gas for households compared to the EU average [
19]. Portugal is also one of the first countries to release energy performance certificates for buildings [
12]. In addition, some previous studies have shown that energy efficiency programs and building performance tools are crucial for reducing total energy consumption in the residential sector [
20]. In contrast, others have found that financial or fiscal subsidies or incentives are more effective in achieving this goal [
9,
21].
Previous research has shown that fiscal and credit incentives can support building renovation, increase energy efficiency, and reduce energy consumption [
9,
22,
23]. Fuinhas et al. [
12] investigated the impact of energy policy in 19 Portuguese districts between 2014 and 2021. They found that Gross Domestic Product (GDP) per capita negatively impacted households with energy performance certificates, but the fiscal and financial incentives or credit per capita had mixed impacts on households with energy performance certificates. The income level was found to be insufficient for promoting high-efficiency energy certificates for buildings. Some studies found that fiscal and financial subsidies even impede energy-efficiency programs because of their continuous evolution and diversity [
24,
25]. Despite mixed results in previous studies on the impact of fiscal and financial incentives on energy-efficiency targets, the current research is essential in filling this gap. The study aims to investigate the impact of fiscal/financial incentives on energy-efficiency certificates for houses in Lisbon municipalities, using GDP per capita, credit granted for house construction or purchase, number of new houses constructions, and number of reconstructions as control variables. The study applies Ordinary Least Squares (OLS) with the fixed effects method and Method of Moments Quantile Regression (MM-QR) for 18 municipalities in the Lisbon area between 2014 and 2020.
Thus, the contribution of this research is as follows:
It aims to investigate whether fiscal and credit incentives can support building renovations in Lisbon, where there are many old buildings, and if this can increase energy efficiency and reduce energy consumption for households;
It aims to analyse the impact of economic growth, new dwelling constructions, and the number of reconstructions on eco-friendly houses with certificates;
It applies 2nd generation techniques for estimations, including a detailed analysis for quantiles (MM-QR) to elaborate adequate and specific policy measures in this regard.
This research can support Portugal’s goal of decreasing its total energy consumption, increasing energy efficiency, increasing the consumption of renewable energy sources, and promoting technological advancements in the residential sector to achieve carbon neutrality by 2050. It also addresses the severe effects of climate change that have significantly impacted Southern Europe, particularly in the form of significant heat waves during the last decade. This study aims to deepen the analysis carried out in previous studies on the Portugal case [
11,
12] by introducing new control variables into the econometric model, focusing on the municipalities of the Lisbon area, and applying new quantitative methods in this field. Previous studies have yielded mixed results on the relationship between fiscal and credit incentives and the increase in eco-friendly houses with energy efficiency certificates, including those few existing studies that have been conducted on Portugal, where the results have varied depending on the type of dwelling, with high-energy efficiency and low-energy efficiency. Fiscal and credit incentives are expected to support the increase in eco-friendly houses with energy efficiency certificates.
Section 2 presents the findings of previous studies on this topic, while
Section 3 presents the applied methodology.
Section 4 presents the results.
Section 5 discusses the results and correlates them with the findings of previous studies.
Section 6 presents the limitations and directions for future research. Finally,
Section 7 presents the conclusions and some policy recommendations.
2. Literature Review
Incentive policies to increase energy efficiency in the residential sector can take different forms, including direct and indirect incentives such as subsidies, tax exemptions, direct grants, and research and development programs. Sarker et al. [
26] investigated the role of financial incentives in promoting energy efficiency in the industrial sector of four Asian countries (India, Japan, China, and Indonesia). They found that market-based instruments (MBIs) like white certificates and tendering schemes significantly reduced energy intensity, while direct subsidies had limited results despite their high costs for the government. Trotta [
27], for England, using the survey data “England Housing” with the probit model, found that households living in London were more likely to invest in building retrofits than in the northeast. Additionally, the results found that households that received a mortgage were more likely to invest in increasing the energy efficiency of their homes than actual owners. Finally, Trotta et al. [
9] evaluated energy efficiency in the residential sector of Hungary, Finland, Italy, the United Kingdom (UK), and Spain. They found that the UK has adopted a better range of private-sector policies and initiatives.
On the other hand, Finland’s lack of adequate policies led to increased energy consumption. Hungary, Spain, and Italy used attractive financial incentives. Filippini et al. [
22] for the European Union (EU)-27 from 1996 to 2009 stated that the residential sector of the European Union had a high potential to reduce energy consumption caused by inefficiency. Financial incentives and performance standards also played an influential role in promoting energy efficiency.
Noailly [
28], for seven European countries from 1989 to 2004, found that a (10%) increase in wall insulation standards led to a (3%) improvement in technological innovations. Additionally, the increase in Research and Development (R&D) costs positively affected energy efficiency, but the price did not significantly affect energy efficiency. Lakić et al. [
29], for Slovenian households in 2017, found that energy efficiency was the second most crucial factor in property purchase after energy price. The results indicated that households paid more attention to energy efficiency when investment costs were higher. He and Chen [
30] found that subsidies positively affected the development of green buildings.
Additionally, the results showed that the subsidy paid to consumers had more positive effects than the subsidy to developers, and the subsidy paid to consumers and developers brought the most benefits for developers and the highest welfare. Villca-Pozo and Gonzales-Bustos [
31] found that tax incentives for energy efficiency were insufficient in a Spanish housing energy efficiency study. Bonifaci and Copiello [
32] investigated the effect of tax incentive policies on energy efficiency in the residential sector in Italy. They found that incentive policies could not fully promote minimum energy standards in buildings. Neveu and Sherlock [
33] found that tax credits for energy efficiency were vertically inequitable. The results showed that taxpayers in states with colder weather claimed tax credits, while taxpayers with higher electricity costs claimed more significant tax credit amounts. In a study of Kuwait’s residential sector, Ameer and Krarti [
34] stated that both households and the government benefited from strict energy efficiency codes even under high energy price subsidies.
Shen et al. [
35] investigated the energy efficiency of buildings in seven selected countries and regions using three policy statements categories: mandatory, incentive, and voluntary implementation tools. The authors found that different policy initiatives have helped improve building efficiency. Chen and Hong [
36] investigated suitable subsidy policies for green building development. The results indicated that construction policies influence subsidy policies and that removing asymmetric information can help create more green areas and fewer subsidies. In a study for Italy, Alberini and Bigano [
37] addressed the effectiveness of energy efficiency incentive programs. The authors found that monetary incentives, such as tax incentives, have more significant effects on replacing heating systems with more efficient equipment than non-monetary incentives, such as potential reductions in CO
2 emissions. Charlier [
38], in a study for France using a Tobit model, found that tenants have high energy costs due to energy-inefficient buildings. Because of their lower income level than homeowners, they cannot invest in energy saving. Moreover, the results indicated that the tax credit division in the tax incentives between owners and tenants was inefficient. Dubois and Allacker [
39] stated that subsidies for renovating residential buildings with a partial energy increase led to worsening overall energy consumption because it locks in energy-inefficient houses. The authors found that taxes on virgin land use would have to be increased to convince people to invest in demolishing and rebuilding old homes.
Pasichnyi et al. [
40] assessed the quality of energy performance certificates (EPCs) using Sweden’s data quality assurance method. The authors found that EPC data could be improved by adding or revising EPC features and ensuring the interoperability of EPC datasets. Murphy et al. [
24] conducted a study to improve the energy performance of the Netherlands and found that current policy instruments are unsuitable for improving the long-term energy-saving performance of existing residential buildings. Linden et al. [
41] researched the residential sector of Switzerland and stated that extensive information campaigns during the oil crisis of the 1970s and energy labelling of household appliances were effective policy instruments in this sector. Tambach et al. [
42] researched the Netherlands’ residential sector and stated that although existing policy instruments are appropriate to some extent, additional policy instruments are needed to stimulate and pressure residential renovation. Boza-Kiss et al. [
43] evaluated the enhancement of energy efficiency of buildings. They found that although policy instruments such as product standards and labels can have a high impact on energy savings, a clear prioritization of the policy instruments reviewed is not possible in terms of cost-effectiveness. Nair et al. [
44] conducted a study in Sweden and stated that reducing household energy consumption was essential for most homeowners. Personal characteristics such as education, income, age, and contextual factors, including home age, past investment, and energy cost, influence homeowners’ preferences for a particular energy efficiency measure. In
Table 1, a summary of the literature review is given.
Although various studies have been conducted in different countries and regions on the effects of financial incentives, to the best of our knowledge no study has been conducted on the effects of financial incentives on energy efficiency in Lisbon, Portugal. Additionally, in most studies, one or two variables (such as subsidies and tax exemptions) have been considered financial incentives. However, this research’s financial incentive includes grants, subsidies, and tax exemptions. On the other hand, in this research, the new MM-QR econometric model and the OLS with fixed effect method are applied to estimate the financial incentives for energy efficiency. Therefore, the next part of this research will deal with the data presentation and the method used in this research.
3. Data and Methods
This section presents the variables and methodological approach used. The first subsection, 3.1, will describe the data and variables, while the second subsection, 3.2, will outline the methodological approach.
3.1. Data
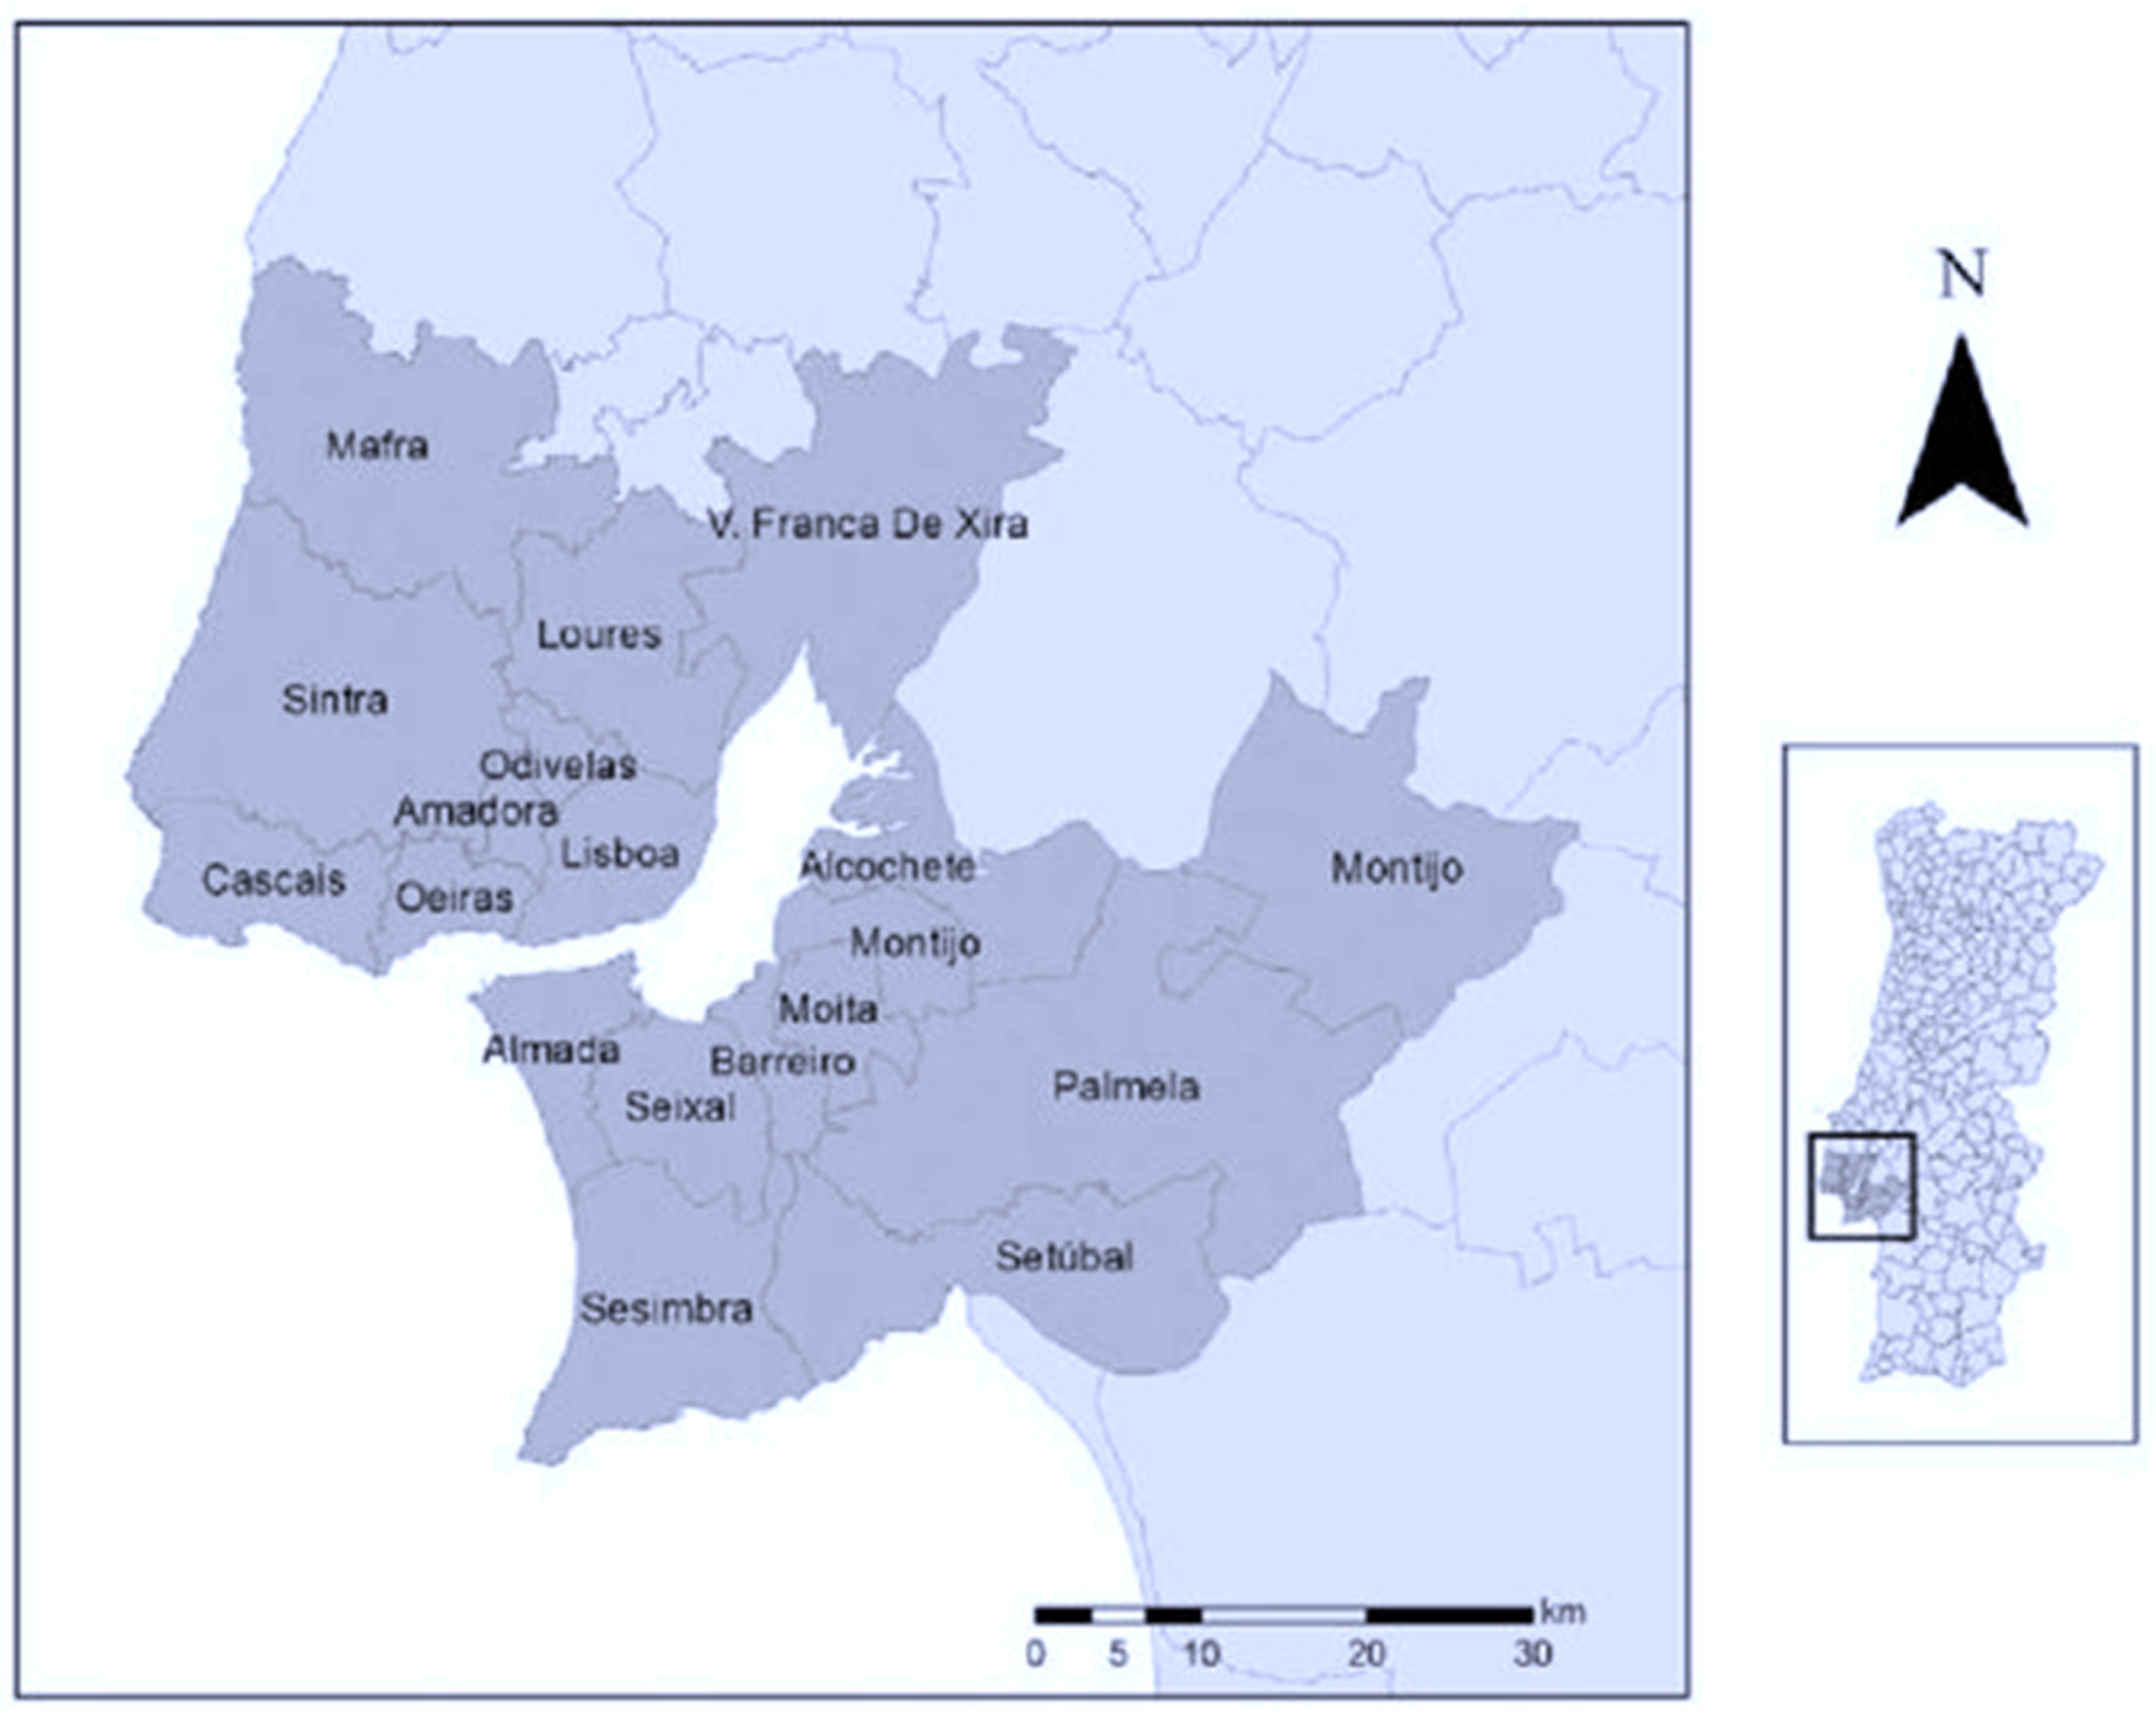
Eighteen municipalities from the Lisbon metropolitan area were selected to carry out this examination, such as
Alcochete,
Almada,
Amadora,
Barreiro,
Cascais,
Lisbon,
Loures,
Mafra,
Moita,
Montijo,
Odivelas,
Oeiras,
Palmela,
Seixal,
Sesimbra,
Setúbal,
Sintra, and
Vila Franca de Xira (see
Figure 1 below).
This group of municipalities was selected due to the significant number of eco-friendly houses/dwellings in Portugal concentrated in this region. Moreover, this region receives the most investments in the construction and reconstruction of homes. The period between 2014 and 2020 will be used in this study due to data availability for all municipalities. In other words, this study is limited by the data used. In this empirical investigation, the variables that will be used are presented in
Table 2 below.
In this investigation, the dwelling with high energy efficiency certificate ratings (e.g., A+, A, B, and B−) were used as a proxy for “green” or “eco-friendly” dwellings for the following reason. A dwelling or building to be considered “green” or “eco-friendly” needs to have attributes such as ventilation systems designed for efficient heating and cooling, energy-efficient lighting and appliances, adaptive reuse of older buildings, water-saving plumbing fixtures, among others, as mentioned by Ragheb et al. [
54]. This same situation occurs in the real estate market, where numerous rating systems assess the environmental impact of dwellings or buildings and classify them as “green” or “eco-friendly” [
55]. Energy performance certificates (EPCs) is one of them, as Koengkan et al. [
11] and Fuinhas et al. [
12] have cited. Furthermore, the EPCs report energy efficiency and recommendations for cost-effective improvements to raise the rating of a dwelling or building [
9].
3.2. Method
The following methodology will be employed to carry out this empirical investigation (as illustrated in
Figure 2 below).
3.2.1. Preliminary Tests
Before conducting the main regressions, it is necessary to perform preliminary tests to verify the characteristics of the variables. For example:
- (a)
Descriptive statistics of the variables. This test checks the attributes of the variables;
- (b)
The Shapiro–Francia test [
56] checks for normality in the model’s variables. The null hypothesis of this test is that the data are normally distributed;
- (c)
The Shapiro–Wilk test [
57] checks for normality in the model’s variables. The null hypothesis of this test is similar to the Shapiro–Francia test;
- (d)
The Variance Inflation Factor (VIF) test [
58] checks for multicollinearity between the variables;
- (e)
The Cross-Sectional Dependence (CSD) test [
59] checks for CSD in the panel data;
- (f)
The Fisher-type unit-root test [
60] tests for the presence of a unit root (i.e., nonstationarity) in the all-time series in the panel;
- (g)
The Hausman test checks for heterogeneity in the panel, i.e., whether it has random effects (RE) or fixed effects (FE).
3.2.2. OLS with Fixed Effects
The ordinary least squares regression (OLS) with fixed effects is used in this investigation. This estimator was chosen for this study because, as Koengkan et al. [
11] mention, it allows for estimating the slope and intercepts for a set of observations and further estimates the mean response for the fixed predictors using the conditional mean function. In the literature, this estimation follows the general equation below:
where
are the intercepts, and
is the value of fixed covariates being fitted to predict the dependent variable
,
εi is the error term, and each independent variable enters regression for municipality
i at year
t (e.g.,
,
,
,
, and
).
3.2.3. MM-QR
This investigation also includes the computation of quantile regressions using the method of moments (MM-QR) to check the previous model’s robustness. This estimator was selected for this study because, as mentioned by Koengkan et al. [
11], it allows for the estimation of models with endogenous variables in the presence of cross-sectional data. In the literature, the MM-QR estimator follows the general equation shown below:
where
from a panel of n individuals
i = 1,…,
n over
T time-periods with
. Furthermore, the parameters
, capture the individual
i fixed-effects, and
is a k-vector of known differentiable (with probability 1) transformations of the components of
with element
l given by
. The sequence
is
i.i.d. for any fixed
i and independent across
t.
are
i.i.d. (across
i and
t), statistically independent of
, and normalised to satisfy the moment condition
.
This study conducted all preliminary tests and model estimations using
Stata 17.0. The Stata commands used are presented in three forms for easy access: through a QR code displayed in
Figure 3, in the notes accompanying each results table, and in the
Appendix A of this article. The QR code, notes, and appendix provide complete test and regression model instructions.
4. Empirical Results
This section presents the results of the preliminary tests and main models (OLS with fixed effects and MM-QR). First, the descriptive statistics of the variables are presented.
Table 3 below shows that GDP and CRT have the most significant and most minor means among the model variables, respectively.
After displaying the descriptive statistics of the variables, preliminary tests were examined. The first tests were the Shapiro–Francia test and the Shapiro–Wilk test, which were used to check the normality of the data. The results of these tests are illustrated in
Table 4 below. The results of the Shapiro–Francia test reject the normal distribution for all variables except for POL. Furthermore, the Shapiro–Wilk test results also support the rejection of the normal distribution for all data. Thus, these findings support the usage of quantile-based estimation methods.
The next test conducted was the variance inflation factor (VIF) test to examine the presence of multicollinearity among the variables. As shown in
Table 5, the mean VIF is 1.53, which is less than 6, indicating no severe multicollinearity problem.
The next test is the cross-sectional dependence (CSD). The CSD test recognizes the presence of cross-sectional dependence in the panel data. Based on the results of
Table 6 below, all the variables have significant
p-values at the (1%) level, so the null hypothesis is not rejected and there is cross-sectional dependence in all variables. However, the CSD test did not show any results for the variable CRT.
The panel unit root test (Fisher-type) was also conducted. This test detects the presence of unit roots. The results from the Fisher-type unit root test are presented in
Table 7. The results show that all variables without and with trends appear to be somewhere boundary between I(0) and I(1).
After conducting the Fisher-type unit root test it is necessary to perform the final preliminary test. The Hausman test is used to verify heterogeneity, specifically whether the panel has fixed effects (FE) or random effects (RE).
Table 8 below shows the results of the Hausman test. The outcomes reject the null hypotheses, indicating that there are fixed effects in the model.
After reviewing the preliminary tests, it is time to estimate the primary model’s regression. Therefore, the following estimators have been used: fixed effects (FE), FE robust standard errors (FE Robust), and FE Driscoll and Kraay (FE D.-K.).
Table 9 below illustrates the findings from the OLS with a fixed effect model.
The findings of the OLS with a fixed effect model indicate that the impact of the CRT variable (−70.8735) on the dependent variable GHC is negative and significant. However, the variables GDP (0.0000), HGC (0.0004), POL (137.7112), and CDT (1.9145) have a positive and significant effect on GHC. Therefore, the next step after reviewing the principal model regression is checking the robustness of the results. For this purpose, the MM-QR model has been used in this research. This method has been estimated at different quantiles (0.1, 0.25, 0.5, 0.75, and 0.9). The results of the MM-QR model regression are shown in
Table 10 and
Figure 4 below.
The MM-QR results demonstrate that the variable CRT has a negative and significant impact on GHC in the 0.1, 0.25, and 0.5 quantiles. However, the impact of the variables GDP, POL, and CDT on GHC is positive and significant in all quantiles. In addition, HGC positively and significantly impacts the dependent variable GHC in the 0.5, 0.75, and 0.9 quantiles. Therefore, the outcomes of MM-QR confirm that the OLS results are reliable and robust.
In addition, the effect of independent variables on the dependent variable is summarized in
Figure 5 below. This figure is based on the findings of
Table 9 and
Table 10 above.
In this section, the empirical results of this investigation are presented. Furthermore, in the next section, the discussion will be presented.
5. Discussion
Following the results of the OLS model, corroborated by the MM-QR results, the variable GDP has a positive and significant impact on the dependent variable (i.e., Green House with a certificate/Eco-friendly House with a certificate—GHC). Even though economic growth is usually positively related to energy use, recent data has shown signs of a tendency towards decoupling between economic growth rates and energy demand [
61]. One of the factors contributing to this trend is the increasing demand of consumers in developed countries for more energy-efficient utilities (and houses) due to increased environmental consciousness and the cost-reducing effect that energy efficiency can have on household energy costs [
61]. Therefore, the signal of the relationship was not surprising. However, its small coefficient raises some questions regarding growth’s impact on promoting more eco-friendly houses (in the Portuguese case).
Regarding the impact of HGC on GHC, it was also positive. As in the case of Fuinhas et al. [
12], the credit variable demonstrates a positive impact on energy efficiency, contributing to the promotion of more energy-efficient houses. In sum, credit is a tool households can use to materialize their energy-efficient house projects. The variable CDT (number of completed dwellings in new constructions for family housing) also positively impacted GHC, which is unsurprising given the increased demand for energy-efficient utilities and houses. However, the variable CRT (number of completed dwellings in rebuilt houses) negatively impacted GHC, suggesting differences between newly built and rebuilt houses. For example, older buildings often require many steps in the process [
62]. As a result, they have high renovation costs [
63] that may impede energy-efficient renovations.
Now, regarding the variable POL (fiscal/financial incentive policies for energy efficiency for the residential sector), we can see from the results from both
Table 9 and
Table 10 that the impact of this variable on GHC is positive and statistically significant (in all quantiles). Once again, the results of Fuinhas et al. [
12] support this same output. In their estimations, fiscal policies also positively impacted higher-grade certified residential properties (e.g., A+, A, B, and B−). If governments want to promote more energy-efficient households, financial and fiscal incentives can be a powerful tool to achieve this objective. As an example of this fact, we can state the “
Programa de Apoio Edifícios mais Sustentáveis” (in English, “More Sustainable Buildings Support Program”), which was first launched in 2021 by the Portuguese Government. In this program, the Government called for applications from households interested in financial support to increase their houses’ energy efficiency/energy comfort. After the first phase the government had to quickly move to a second one due to the increased interest of households in this program. Indeed, the Ministry of the Environment started this second phase of the “
Programa de Apoio Edifícios mais Sustentáveis” with an endowment of EUR 30 million, but due to high demand this endowment quickly rose to EUR 60 million. It is expected that this endowment will increase again soon, primarily due to the resources which will be provided by the “
Programa de Recuperação e Resiliência” (PRR)—“Recovery and Resilience Program” for the “
Fundo Ambiental” (Environmental Fund) [
64,
65]. In sum, this means that the financial incentives provided by the Government are showing a high degree of success, being a tool in which the Portuguese Government has placed its trust to promote more eco-friendly residences and buildings.
6. Limitations and Future Recommendations
This research was constrained by data limitations that resulted from the short period under analysis (from 2014 to 2020) and the moderate number of individuals (municipalities) available. Indeed, when working with a micro panel we have limited confidence in the time stability of the relationships found. This restriction also reduces the capacity to analyse temporal effects and can blur the presence of dynamic effects. Thus, these shortcomings can severely constrain the analysis in the presence of viscous variables.
The research also suffers from common trends (cross-sectional dependence), which imposes some econometric drawbacks. Indeed, Lisbon’s metropolitan area is particular as it is rich by Portuguese standards and simultaneously one of the most expensive cities in the world context. Hence, comparing the Oporto metropolitan area and other municipalities with the results found in the Lisbon metropolitan area could clarify the general validity of the research findings.
The methodological approach endures the insufficiency of working with proxies for green and eco-friendly dwellings. Indeed, the variable of houses with energy efficiency certificate ratings can only be considered a rough approximation for “green” or “eco-friendly” dwellings. Another methodological variant that can raise new insights and have theoretical consequences is using variables per capita.
Finally, one severe limitation was that the scarce-specific literature imposes constraints in formulating the conceptual framework and restrains the assertiveness of findings. These limitations could compromise the generalisation of results achieved in this research and have put demanding and unanticipated challenges during the realisation of this study.
The housing sector is a critical energy consumer and, consequently, a source of pollution. Hence, there is a need for massive investment to implement the energy transition by the deadlines required to dampen ecological damage and global warming. Therefore, humankind must explore the effect of energy-saving technologies on “green” or “eco-friendly” dwellings.
The significant challenges in the housing sector are the decisions to renovate buildings or build new dwellings. The decision favouring one of these two alternatives has environmental impacts that deserve further research. For example, understanding the implications (i) of renovating buildings to achieve energy efficiency goals, or (ii) what kind of interventions on old buildings can better cope with the harsh winters and summers motivated by climate changes. The former reason is especially worrisome given that it will expose people to the necessity of increasing energy consumption. This issue makes green or eco-friendly houses a priority over a business-as-usual scenario.
Achieving a stage of maturity of energy efficiency technologies will strongly impact the development of the housing sector. Adapting to renewable energy optimises passive energy consumption by improving energy efficiency (better climatisation). Indeed, it will actively contribute to decarbonisation by allowing renewable energy generation. Consequently, investing in fundamental research and patents that support innovation will facilitate the management transition to green and eco-friendly dwellings.
Moreover, linking energy efficiency and housing renewable energy generation with demand management can reduce carbon dioxide emissions. Therefore, further research on policy instruments, like non-financial incentives or penalties for not achieving eco-efficiency certificates, should be pursued to promote these linkages. It can be done, for example, by adding the possibility of creating valences for the generation of renewable energies (e.g., photovoltaic energy and management of energy stored in batteries) in new and renovated dwellings or stimulating the innovation in technological processes that facilitates the adoption of green or eco-friendly dwelling.
In short, what needs to be studied are the interactions between energy-saving building technologies, policy incentives, and the financing of dwellings. These issues require a better understanding of: (i) energy poverty and affordability of energy; (ii) the effect of economies of scale on renovating dwellings; (iii) the other kinds of incentives that are also effective in encouraging the adoption of eco-friendly houses in Portugal and elsewhere; and (iv) the availability and ease of obtaining credit to finance, as well as the conditions for obtaining credit (term, grace period, etc.), are contributing to expanding the knowledge of the determinants and accelerating the implementation of eco-friendly houses. Indeed, the mix of incentives is far from clear in the present state of the art.
There are several topics requiring further research. For example: (i) how to achieve a balance between saving and emitting CO2, as renovated buildings also generate large amounts of CO2 emissions and other greenhouse gases, or how to make the recycling of construction residues economically attractive; (ii) exploring the finding of this research that new buildings are different from renovated or rebuilt structures; (iii) searching for evidence that identifies specific determinants to design better policies to promote “green” or “eco-friendly” dwellings; (iv) performing similar studies to ensure cross-validation of the findings achieved in this research; (v) pursuing a double verification of this research to confirm (a) if the results are valid in other metropolitan areas, and (b) if the conclusions are generalisable to other contexts that are not metropolitan areas; and (vi) identifying relationships between the several factors that may impact green or eco-friendly dwellings to allow for a comprehensive understanding of how the housing sector can contribute to decarbonising economies.
7. Conclusions and Policy Implications
This article focuses on studying the impact of tax and financial incentives on energy efficiency certificates for houses in 18 municipalities in the Lisbon metropolitan region from 2014 through 2020. The study found that energy efficiency is one of the challenges governments and society face in promoting sustainable economic development and growth, which impacts the population’s well-being and quality of life.
In addition, the implementation of economic instruments through the creation of financial and fiscal incentives facilitates the implementation of energy efficiency by reducing energy consumption and public spending on energy, the environment, and health. Furthermore, economic instruments serve as an incentive to motivate people who have not yet adopted actions in favour of energy efficiency.
Europe has implemented energy efficiency measures to promote the rationalization of energy consumption and reduce environmental impact. For example, in Portugal the National Energy and Climate Plan has set decarbonization targets by 2030, emphasizing the importance of replacing electricity production from coal with the large-scale use of renewable energy. The government of Portugal has also encouraged increased energy efficiency in houses and the use of renewable energy for self-consumption. By doing so, the country will be able to face the effects of climate change caused by elevated temperatures increasing in frequency and intensity in many regions of Europe.
Based on the results obtained, this article has enormous potential to contribute to formulating and improving public policies in Portugal aimed at energy efficiency and compliance with the carbon neutrality goal by 2050. This contribution includes the reduction in total energy consumption, investments in technologies in the residential sector, increased consumption of renewable energy, and actions to encourage science, technology, and innovation.
The search for energy efficiency in residential properties plays a key role, as climate change has negatively impacted ecosystems, the economy, and human health in Europe. Furthermore, fiscal and financial incentives for technological development in renewable sources of clean energy promote significant advances in renewable energy production chains. Therefore, for the effective implementation of public policies aimed at energy efficiency and to promote improvements in terms of energy and environmental performance of buildings, Portugal created the “More Sustainable Buildings Support Program”, which aims to finance measures that boost rehabilitation, decarbonization, energy efficiency, water efficiency, and the circular economy.
In this sense, the work advances to deepen the discussions around energy efficiency in residential properties in Portugal and to investigate the effectiveness of tax incentive policies for energy efficiency seals as an instrument for promoting eco-friendly houses in the municipalities of Lisbon. Likewise, the study highlights the need to focus on the Portuguese capital as it is the most populous city in the country and concentrates a large part of the economic activity.
Finally, it appears that the effective implementation of energy efficiency policies with financial and fiscal incentives and benefits is an important mechanism to promote the energy transition, establishing practices that aim to reduce the economic, social, and environmental impacts of changes caused by long-term weather patterns.


 ,
, 


