Abstract
Dual fuel combustion leverages a high-reactivity fuel (HRF) to ignite a premixed low reactivity fuel (LRF)–air mixture to achieve high efficiencies and low engine-out emissions. The difference in the relative amounts of these fuels and in-cylinder fuel reactivity stratification profoundly impacts dual fuel combustion. The effect of increasing LRF energy substitution on dual fuel combustion at various fixed HRF (diesel) quantities was experimentally studied for two different LRFs (natural gas and propane) on a heavy-duty single cylinder engine at a constant intake pressure of 1.5 bar and injection pressure of 500 bar. Further, this effect was studied for three different HRF start of injection (SOI) timings of 310 CAD (50° BTDC), 330 CAD (30° BTDC), and 350 CAD (10° BTDC). For 310 CAD SOI, increasing the LRF substitution at a fixed HRF resulted in higher loads, peak cylinder pressures, and peak apparent heat release rates (AHRR). The onset of low temperature heat release (LTHR) was advanced as the LR fuel flowrate increased at a given pilot quantity for diesel–NG but remained constant for diesel–propane dual fuel combustion at these SOIs due to the impact of propane on the temperature at which the onset of LTHR occurs. The indicated fuel conversion efficiency (IFCE) ranged from 35% at 4 bar IMEPg to 47% at 9 bar IMEPg with NG as the LRF and from 35% at 3 bar IMEPg to 51% at 8 bar IMEPg with propane as the LRF. For 330 CAD SOI, the HC and CO emissions decreased at a higher fixed HRF quantity and an increasing LRF substitution. However, this was accompanied by significantly higher oxides of nitrogen (NOx) emissions for both NG and propane as LRFs. For 350 CAD SOI, increasing the LRF substitution at constant HRF consistently led to a higher second stage AHRR, whereas the first stage AHRR remained relatively unchanged for both NG and propane as LRFs. This was accompanied by higher IFCE for all fixed HRF quantities as LRF substitution was increased. For all SOIs studied, the HC and CO emissions were substantially lower and combustion stability was significantly improved as the LRF substitution (and consequently, the load) was increased. To the best of the authors’ knowledge, the present work is unique in that it involves the first systematic experimental study of the impact of LRF energy substitution at fixed HRF quantities over a range of SOIs, providing comparative results for two different LRFs (NG and propane) on the same engine platform.
1. Introduction
Dual fuel combustion has been a pivotal milestone in achieving commercially viable high efficiency, low-emissions engine technologies. The literature shows that dual fuel combustion technology has been researched since the 1950s [1,2]. After Elliot and Moore [1], which is one of the first known dual fuel combustion publications, researchers have investigated the potential of various fuel combinations including diesel-methane, diesel-propane, diesel-gasoline, and ethanol-gasoline [3,4,5,6,7] to meet the increasingly stringent emissions regulations while maintaining high fuel conversion efficiencies. Dual fuel engines have plenty of avenues for commercial implementation including marine engines and stationary power plants. Heavy duty dual fuel engines such as MAN 49/60DF and Wartsila 25DF, which are designed to run on alternate fuels such as methanol, ammonia, and hydrogen are being used currently for marine applications and stationary power production. These engines are designed and manufactured to champion the industry’s call for total decarbonization, i.e., to achieve net-zero greenhouse gas emissions by 2030. [8,9,10].
The use of a gaseous fuel in conjunction with diesel has been a widely published solution to minimize engine-out emissions, and amongst those, the use of natural gas as a secondary fuel is a very popular strategy [11,12]. The data from the Annual Energy Outlook 2022 show that the energy consumption from natural gas is almost equal to the consumption from petroleum and other fossil fuels and is projected to increase by another 20% by 2050 [13]. The widespread availability of natural gas and the ability to produce natural gas renewably has played a major role in this substantial increase in usage of natural gas for energy production. Hence, extensive research has been performed to investigate the potential to use natural gas as the gaseous fuel in dual fuel engines.
Shioji et al. [14] performed experimental studies on a single cylinder engine and showed that substantial improvements in smoke and THC emissions than normal diesel operation was achievable using diesel–natural gas dual fuel combustion. The authors investigated the effect of the pilot fuel quantity at a retarded injection timing and demonstrated that a higher pilot fuel quantity is effective in improving the combustion efficiency and reducing the THC emissions at low and medium equivalence ratios, but similar high pilot fuel quantities might lead to the onset of knock at higher equivalence ratios.
Yousefi et al. [15,16,17,18] investigated the effect of diesel injection timing, diesel injection split, natural gas energy fraction, and the type of premixed fuel in diesel-based dual fuel combustion by performing both experimental and numerical studies on compression ignition engines. The authors demonstrated that at retarded injection timings (6–10 BTDC), increasing the natural gas energy fraction reduces the peak pressure and the peak pressure rise rate drastically and, hence, the bulk in-cylinder temperatures as well. This leads to a reduction in the ISNOx emissions. At these conditions, an increase in the natural gas energy fraction led to a decrease in the indicated thermal efficiency, since the combustion phasing is retarded and most of the energy is released during the expansion stroke. However, the authors also indicated that even though a reduction in NOx emissions were observed at these conditions, the values were still marginally greater than the Euro VI emissions standards.
Reactivity-controlled compression ignition (RCCI) [19,20,21,22,23,24,25,26,27] and dual fuel low temperature combustion (LTC) [28,29] are dual fuel combustion strategies that demonstrate the ability to achieve drastic NOx emissions reduction.
RCCI combustion employs two fuels of different reactivity: a high-reactivity fuel (HRF) which is pilot ignited first and a low-reactivity fuel (LRF) which is ignited with the aid of the energy from the pilot fuel combustion. The low-reactivity fuel is generally fumigated in the intake manifold and a well-premixed LR fuel–air mixture is admitted into the cylinder. Jia et al. [30] performed diesel–natural gas RCCI experiments on a single cylinder AVL 501 engine and investigated the effect of dual diesel injection timings and compression ratio on emissions and engine performance. The authors were able to observe NOx values < 1 g/kWh and low soot values < 0.01 g/kWh. The authors also observed that at well-advanced first injections, the THC emissions were high (>20 g/kWh). This was attributed to the overall leaner equivalence ratios present at such advanced timings, which led to incomplete combustion and, hence, increased unburned HCs.
Various strategies have been investigated to reduce engine-out emissions from dual fuel combustion, since some of their operational modes have a propensity to produce high HC and CO emissions and soot [31,32,33].
Papagiannakis et al. [31] performed constant pilot quantity experiments and showed that an increase in brake specific fuel consumption efficiency was possible at higher pilot quantities due to the higher heat release of the premixed combustion stage. This places the combustion charge at a higher temperature, causing the burn rates of gaseous fuel to be faster; hence, natural gas–diesel dual fuel combustion has a higher brake specific fuel conversion efficiency. The authors also showed that CO emissions can be decreased by injecting a greater pilot quantity, due to the improvement in the gaseous fuel combustion rate. However, the NOx emissions increased slightly due to the higher peak cylinder pressures, which in turn correspond to higher peak temperatures at higher constant pilot quantities (higher loads).
Hariharan et al. [33] performed experimental investigations to study the effect of various parameters such as percentage energy substitution (PES) of LR fuel, boost pressure and rail pressure on HC, CO, and NOx emissions in diesel–NG, and polyoxymethylene di-methyl ether (POMDME)–NG dual fuel combustion. The authors observed that ultra-low NOx values (~0.1 g/kWh) were observed at very early SOIs (40–60° BTDC) and parameters such as PES, boost, and rail pressures were adjusted to minimize the high HC and CO emissions found at these conditions. The authors observed that introducing a short second injection later than the first injection improved the combustion stability and reduced cyclic variations. This improved the combustion efficiency and caused a HC and CO reduction. The authors observed that a reduction in intake boost pressure was extremely effective in reducing HC and CO emissions, as a reduction in boost pressure meant an increase in local equivalence ratios and, hence, higher combustion efficiencies. The authors were able to reduce HC and CO emissions in excess of 60% from the baseline single injection point and were also able to demonstrate an indicated fuel conversion efficiency (IFCE) increase of ~10% points by optimizing the aforementioned parameters.
Apart from parameters such as boost and rail pressure, the relative amounts of high and LRF in the combustion mixture and the stratification of HRF play a significant role in the behavior of dual fuel RCCI combustion and emissions reduction. An effective method to vary the relative fuel quantities, as observed in the dual fuel literature, was to keep the pilot fuel quantity and injection timing a constant and vary the LRF quantity.
Karim [34] performed constant pilot quantity experiments and categorized combustion energy release due to dual fuel combustion into three zones: combustion of the pilot fuel, combustion of the gaseous fuel that is in the near vicinity of the pilot fuel, and due to the flame propagation after the autoignition of the gaseous fuel. Karim showed that at 20 BTDC injection timings, the total energy released will rise sharply as the gaseous fuel quantity is increased, due to the enhanced flame propagation. Karim also observed that at greater gaseous fuel flow rates, there will be a greater overlap between energy released due to the autoignition and energy released due to flame propagation, which will culminate in the amalgamation of these two zones at a very high gaseous fuel flow rate.
Polk et al. [35] compared diesel methane and diesel propane dual fuel combustion through a series of constant pilot quantity experiments performed on a Volkswagen TDI engine and showed that, at late injection timings, the second stage AHRR increased when the gaseous fuel concentration increased, due to the availability of increased gaseous fuel to be combusted by the ignition of diesel droplets. At higher pilot fuel quantities, they showed that CA50 advances with increased gaseous fuel for diesel–propane and remains nearly the same for diesel–methane combustion. The authors also showed that, for almost all the pilot quantities, an increase in gaseous fuel led to a decrease in brake specific oxides of nitrogen (BSNOx) emissions and an increase in smoke emissions.
2. Materials and Methods
Experiments were performed on a single-cylinder version of a production multi-cylinder heavy-duty engine. Table 1 shows the basic engine specifications and Figure 1 shows the schematic of the engine test setup.

Table 1.
Engine specifications.
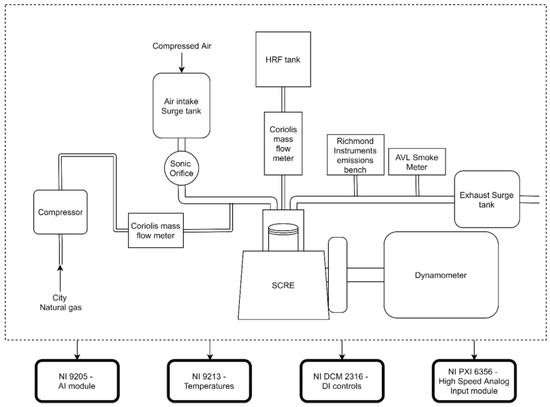
Figure 1.
Single cylinder research engine schematic.
The engine was directly coupled to a 393 HP Dyne systems AC dynamometer, which was controlled using the Interloc-V dyno controller. The mass flow rate and the pressure of compressed air into the engine were controlled in a closed loop system by a Proportion Air QB1X pressure regulator and Setra model 206 pressure transducer providing feedback to the regulator. The intake mass flow rate was measured using a FlowMaxx SN16 sonic nozzle. The sonic nozzle consists of a converging–diverging section and precise flowrate measurements can be performed by achieving choked flow in the throat section. At this condition, the flowrate depends only on the pressure and temperature at the inlet of the nozzle, and an Omega PX119 pressure transducer and Omega K-type thermocouple provide the necessary measurements to calculate the mass flow rates.
A Delphi DFP5 fuel pump was used to supply pressurized fuel to the common rail and a solenoid-controlled inlet metering valve in combination with a high-pressure relief valve on the rail were used to regulate the pressure of the fuel supplied. A Kistler piezoresistive sensor (4067E) in conjunction with the piezoresistive amplifier, Kistler 4624A, was used to monitor the fuel injection pressure. The fuel injection system, lubrication system, and coolant system ran independently and do not extract any power from the engine for their operation. HR fuel injection timing and duration were controlled by National Instruments Direct Injector Control and Measurement Device (NI DCM 2316) and the Vieletech Combustion Analysis (VCAT) software was used to interface with the data acquisition system and the DCM.
The LR fuel supply was metered to the engine using a software-based PID control which was implemented on a Hanbay MCM050AB actuator, and it was fumigated into the intake air upstream of the engine. Emerson micromotion Coriolis flowmeters were used to measure the mass flow rates of both LR and HR fuels.
A 50% ethylene glycol and 50% water mixture was supplied as coolant and SAE grade oil was supplied as the lubricant to the engine. Omega PX119 pressure transducers and Omega K-type thermocouples were used to measure the coolant and lubricant temperatures. The coolant is used to cool the lubricant through Bell and Gossett BP400 brazen plate heat exchangers. Oil and coolant temperature was maintained using Quality Control VG7844 actuators which controlled three-way valves which regulated the flow of liquids into the engine or to the cooling circuit.
Cylinder pressure measurements were performed using Kistler Piezoelectric transducer (Kistler 6124a) and it was coupled to a Kistler 5018a charge amplifier. Intake and exhaust dynamic pressure was measured using Kistler 4049A pressure transducer and a piezo resistive amplifier was used to convert the measurements to voltage signals. A Pintek PA 500 was used to measure injection current and a BEI XH25D-SS-3600-ABZC-28V/V-SM18 encoder attached to the crankshaft was used to phase the cylinder pressure, the injection current, and the dynamic pressures with respect to crank angle.
High-speed crank resolved data were recorded on the NI PXI 6356 analog input module, which was attached to a NI PXI 1071 chassis. The NI 9213 thermocouple module and NI 9205 analog input module were used to measure temperatures, and steady state pressures and flowrate, by interfacing with a NI cDAQ 9189 module.
Engine-out emissions were measured using a standard five gas emissions bench which used a nondispersive infrared (NDIR) analyzer to measure CO2 and CO emissions, a FID analyzer to measure unburnt hydrocarbons, and a CLD analyzer to measure NOx emissions.
Experimental Methodology
The experiments were performed at different constant HR fuel quantities and the LR fuel flow rate was varied to vary the natural gas energy input. LRF flowrates were varied at different constant pilot quantities for three SOIs–310 CAD (50 BTDC), 330 CAD (30 BTDC), 350 CAD (10 BTDC). These SOIs were considered to be representative of early, intermediate, and late injection timings. The rail pressure was maintained constant at 500 bar, the intake pressure was also constant at 1.5 bar, and intake temperature was maintained at ~25 deg C, and these experiments were performed at 1339 RPM, which was computed to be the “B speed” for the engine. At each injection timing, the constant pilot quantities were varied from 0.4 kg/h to 1 kg/h and at each constant pilot quantity an LRF flowrate sweep was performed. The load and the percentage energy substitution (PES) were allowed to vary as a consequence of the LRF flow as shown in Table 2. The fuel properties for the fuels used in this study are shown in Table 3. PES is defined as:
Table 2.
Engine operating conditions.
Table 3.
Fuel properties.
In Equation (1), m refers to the mass flow rate of the fuel and QLHV refers to the lower heating value of the corresponding fuel.
Crank resolved data for 1000 cycles were recorded and then post-processed to obtain the experimental heat release rates. The experimental apparent heat release rates (AHRR) are calculated by the formula:
P refers to the instantaneous in-cylinder pressure at any crank angle and V represents the instantaneous cylinder volume at any crank angle. and are the derivatives of the pressure and volume at any given crank angle. The specific heat ratio, , was computed using an in-house code involving chemical equilibrium calculations. The bulk in-cylinder temperature was calculated using the Redlich-Kwong equation of state for a real gas.
The cyclic cylinder pressure data was filtered and smoothed using a Butterworth filter, and the ensemble average cylinder pressure of the filtered data are presented in the following section.
3. Results and Discussion
Constant pilot quantity experiments were performed for diesel–natural gas and diesel–propane dual fuel combustion and the engine performance and emissions results are presented in this section. Cylinder pressure data was recorded for 1000 cycles and an in-house data processing code was used to compute heat release rates and associated combustion parameters. The engine operating parameters and the range of SOIs were selected by imposing a maximum pressure rise limit of 15 bar/CAD and a COV of IMEPg limit of 10%, which was selected to avoid excessive misfiring cycles and cyclic variations. The effect of varying the LRF energy substitution at a constant pilot quantity was studied at early, late, and intermediate injection timings and the load and PES of natural gas varied with the natural gas mass flow rate. The results presented are based on the consideration that 0 CAD is gas exchange TDC.
3.1. Early Injection Timing Results
Figure 2 shows the cylinder pressure curves for diesel–NG constant pilot quantity experiments performed at 310 CAD SOI and Figure 3 shows the cylinder pressure curves for diesel–propane at the same SOI. The plots also show the locations of CA5, CA50, and CA90, which are the crank angles at which 5%, 50%, and 90% of cumulative heat release occurs. Since the total mass of fuel in the combustion mixture increases, the heat release due to combustion increases, causing the peak cylinder pressure to increase from ~110 bar to ~160 bar when the LRF flowrate changed from ~1 kg/h to ~2 kg/h. An increase in the global equivalence ratios due to the addition of more fuel also causes the fuel–air mixture to combust easily, which can be seen with the advancement in combustion phasing as both CA5 and CA50 occur earlier with shorter CA90 durations at a higher LR fuel flowrate.
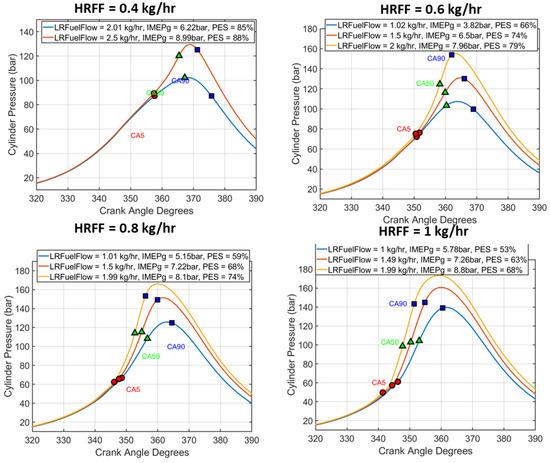
Figure 2.
Cylinder pressure plots for diesel_natural gas combustion at 310 CAD SOI, also highlighting combustion parameters such as CA5, CA50 and CA90.
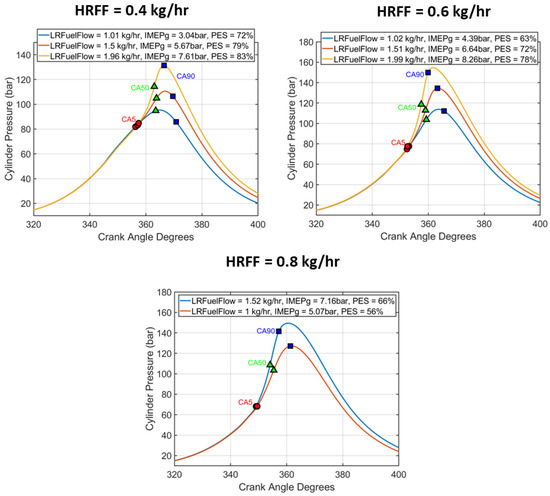
Figure 3.
Cylinder pressure at different pilot quantities for diesel–propane dual fuel combustion at 310 CAD SOI.
Figure 4 shows the AHRR profiles for diesel–NG dual fuel combustion at different pilot quantities and at each pilot quantity, increasing the NG flowrate leads to an increase in the magnitude of the AHRR due to the increase in the amount of fuel being combusted. The rate of heat release also becomes faster, and this can be corroborated by the advancement in the peak of HTHR and the increased slope of the AHRR profiles. The peak AHRR approximately doubles as the LRFF increases by 0.5 kg/h for all pilot quantities, e.g., from 120 J/CAD to ~280 J/CAD as the NG flowrate increases from 2 kg/h to 2.5 kg/h. The AHRR traces at a diesel pilot quantity of 1 kg/h show traces of ringing/oscillations which is indicative of knock, due to the likely richer equivalence ratios at high HRF flowrates.
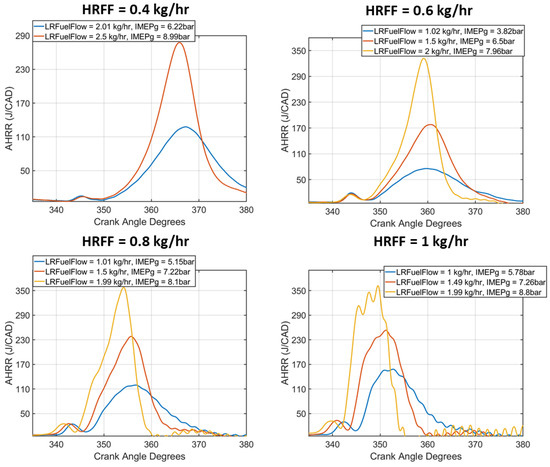
Figure 4.
Apparent heat release rate (AHRR) profiles for different pilot quantities for diesel–NG dual fuel combustion.
Figure 5 shows the low temperature teat release (LTHR) with respect to crank angle and it is evident from the plots that the onset of LTHR advances as the LR fuel flow rate increases. The peak heat release and combustion phasing advance indicate that the ignition delay is reduced as the LR fuel flowrate increases. The bulk gas temperature vs crank angle trends show that as the LR fuel flowrate increases, the temperature at a given crank angle increases and the combustion chamber gets hotter as more fuel is being combusted and more energy is being released. The temperature at 340 CAD for 0.6 kg/h pilot quantity is around 770 K for 1 kg/h LRFF and increases to ~810 K as the LRFF increases to 2 kg/h. It is also evident that for diesel–natural gas dual fuel combustion, the onset of LTHR occurs around ~780 K. Curran et al. [36] showed that the low temperature oxidation of the HRF, which can be characterized by the production of ketohydroperoxides, are exothermic reactions and observed that those reactions occur at temperatures lower than 900 K. The low temperature reactions are sensitive to bulk temperature changes, and this is corroborated by the onset of LTHR occurring around the same temperature irrespective of changes in the relative amounts of fuel. The temperature for the onset of LTHR can be reached at advanced crank angle degrees for higher fuel flowrate cases, due to an increase in the load and higher energy released.
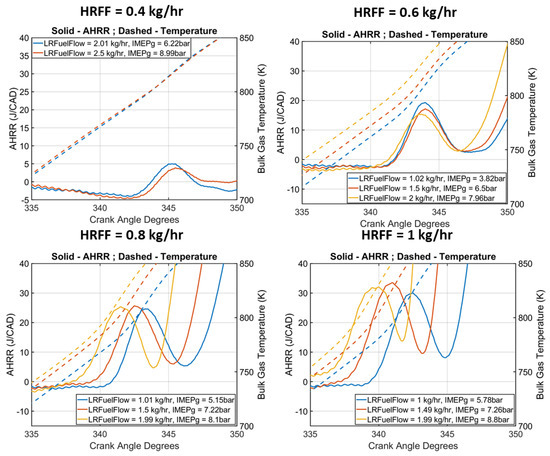
Figure 5.
AHRR vs crank angle plotted along with bulk gas temperatures vs CAD for the LTHR region of diesel–NG dual fuel combustion to illustrate the advancement of onset of LTHR.
Figure 6 and Figure 7 show the AHRR, and additionally the bulk gas temperature (Figure 7) plotted against the crank angle for diesel–propane dual fuel combustion. At a given pilot quantity, increasing the propane quantity has a similar effect to that of increasing NG, where the peak heat release increases and combustion phasing advances due to the reasons mentioned earlier. Propane tends to produce more energy per unit volume when it is combusted. This causes the peak heat release for propane combustion to be higher than NG, and also results in higher IMEPg for similar fuel flowrates. Figure 7 shows that the temperature at the onset of LTHR increases as the propane flowrate increases, irrespective of the diesel pilot quantity. The higher temperatures required for low temperature oxidation of propane at higher propane quantities are achieved at advanced crank angles due to the increased in-cylinder temperatures which are an outcome of the greater energy release. Hence, a noticeable advancement in the onset of LTHR with respect to the crank angle in diesel–propane combustion is not visible.
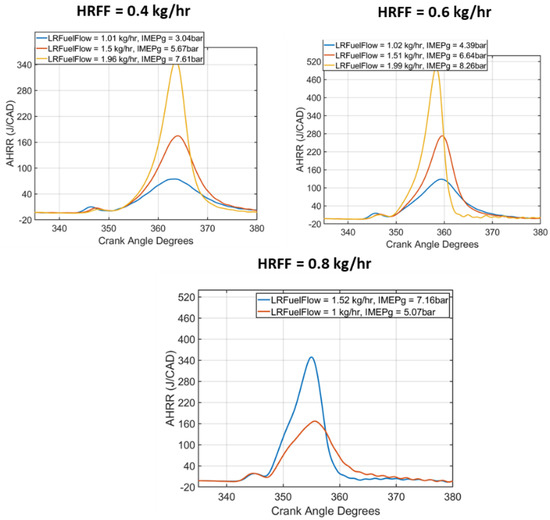
Figure 6.
AHRR profiles for diesel–propane dual-fuel combustion establishing the effect of increasing propane flowrate at different pilot quantities.
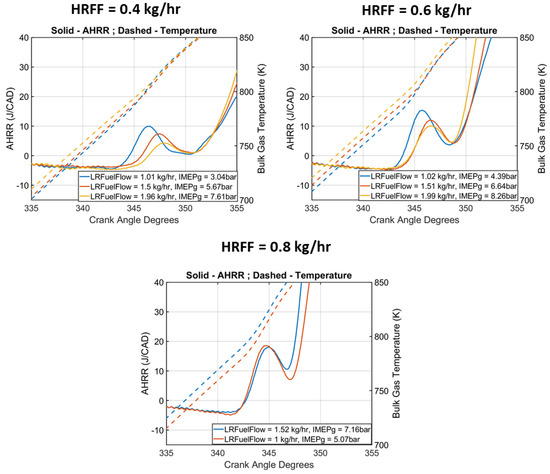
Figure 7.
AHRR profiles showing the LTHR region along with the variation in bulk gas temperature with respect to crank angle for diesel–propane dual fuel combustion.
The indicated specific emissions are plotted in Figure 8 with respect to the PES and a decrease in indicated specific HC (ISHC) and indicated specific CO emissions (ISCO) are observed with an increasing PES (ISHC reduction from 30 g/kWh to 5 g/kWh and ISCO reduction from 120 g/kWh to 5 g/kWh), whereas the NOx increases as higher in-cylinder temperatures are prevalent at a higher PES. An increase in the PES at a given pilot quantity is achievable only by an increase in LRF flowrate and a decrease in the PES is achievable by a decrease in the LRF flowrate, since the HRF flowrate is maintained constant at any given operating condition. Increasing the PES at a given pilot quantity also means an increase in the IMEPg as more fuel is being burnt. The sharp decrease in CO emissions can be attributed to bulk in-cylinder temperatures being greater than 1500 K [37] at higher LR fuel flowrates. CO oxidation is aided at such higher temperatures and from Figure 9, it can be seen that residence times at higher temperatures are lower for lower PES and a PES of 79% at 0.6 kg/h pilot quantity has a residence time of around 25 CAD at temperatures greater than 1500 K which will promote CO oxidation inside the combustion chamber. Figure 8 (bottom) also shows the variation of indicated specific emissions with respect to IMEPg. A combination of high load (~8 bar) and PES in the range of 60–70% yielded low HC and CO emissions while maintaining NOx emissions < 1 g/kWh. At lower loads (≤ 5 bar IMEPg), the ISNOx emissions were ~0.1 kg/hr, but the ISHC and ISCO emissions increased from 10 g/kWh to 30 g/kWh and 20 g/kWh to 120 g/kWh, respectively. At those low load operating points, the pilot quantities were smaller and, hence, the PES of NG exceeded 80% and, hence, the propensity for producing higher unburnt hydrocarbons in the form of methane is increased. The lower in-cylinder temperatures at these lower loads also reduce the possibility of CO oxidation and, hence, an increase in CO emissions is observed.
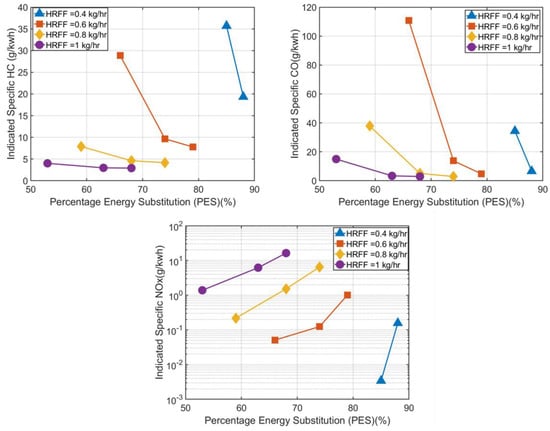
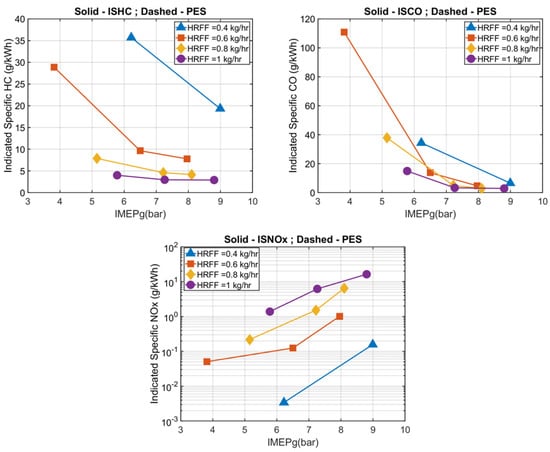
Figure 8.
Variations in indicated specific HC, CO, and NOx emissions with increasing PES (top) and with respect to IMEPg (bottom) for diesel–NG dual fuel combustion at different pilot quantities.
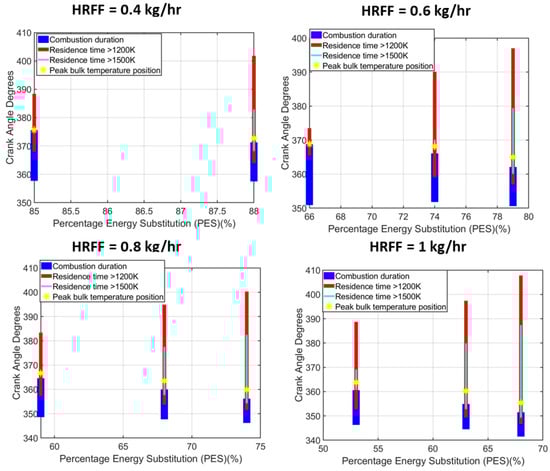
Figure 9.
Location of peak in-cylinder temperature and residence time plots for 1200 K and 1500 K for different PES for diesel–NG dual fuel combustion.
Figure 10 shows the variation of indicated specific emissions in diesel–propane dual fuel combustion and a similar reduction in diesel–NG combustion in ISHC and ISCO can be observed. The ISHC emissions are at a maximum of 34 g/kWh for 0.4 kg/h diesel and ~70% PES, but it drops to a minimum of 4 g/kWh at 0.8 kg/h diesel at 65% PES of propane. ISCO emissions reduce as the propane flowrate increases due to the increase in load and, consequently, local bulk gas temperatures (in excess of 1500 K) which promote CO oxidation. There is, however, a slight NOx penalty as the propane flowrate/PES increases and at higher pilot quantities as NOx increases from <0.1 g/kWh to slightly greater than 1 g/kWh. Based on the trends from both diesel–NG and diesel–propane dual fuel combustion, it can be inferred that at high load operating conditions, where fuel flowrates are high, the higher local temperatures aid in ISCO reduction and the improved stratification of HRF leads to a more complete combustion, which in turn contributes to a substantial reduction in ISHC emissions. However, at low load operating conditions, operating at a higher pilot quantity or additional strategies employed in Hariharan et al. [34] might be required to achieve substantial HC and CO reductions. As observed in diesel–NG combustion, a combination of a high load and a PES ~60% yielded lower HC and CO emissions in diesel–propane combustion as well. Figure 10 (bottom) shows the variation of indicated specific emissions with respect to IMEP and PES, and it can be concluded that at 310 CAD, SOI, ISHC, and ISCO reduction is favorable at high loads irrespective of the LR fuel type.
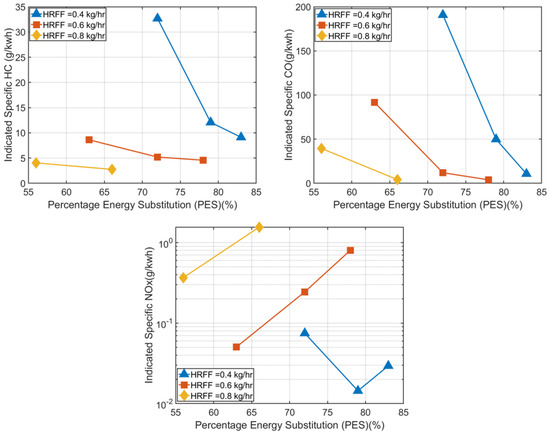
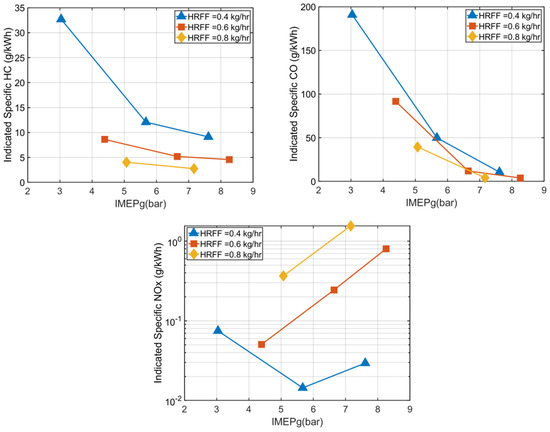
Figure 10.
Variations in indicated specific emissions with PES (top) and IMEPg (bottom) for diesel–propane dual fuel combustion.
Figure 11 shows the trends in the IFCE and combustion efficiency for diesel–NG and diesel–propane dual fuel combustion at different pilot quantities. Combustion efficiency can be defined using the formula provided, for example, by Krishnan et al. [4] as follows:
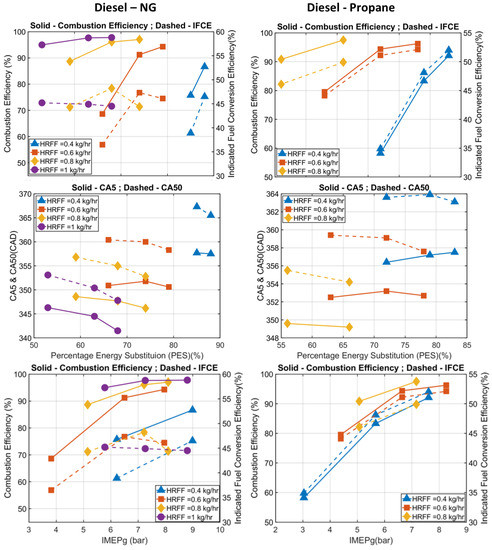
Figure 11.
Indicated fuel conversion efficiency and combustion efficiency as a function of PES for diesel–NG and diesel–propane experiments and start of combustion and combustion phasing (CA 5 and CA50) for the respective cases plotted to explain trends in IFCE. The bottom portion of the figure shows IFCE and combustion efficiency as a function of IMEPg.
In Equation (3), Xi refers to the mass fractions of CO, H2, and HC, whereas QLHVi represents the lower heating values (LHV) of the respective species, mf and ma refer to the mass flowrates of fuel and air, and QLHVf represents the LHV of the fuel. The figure in the bottom shows CA5 and CA50 trends for both the fuel combinations. For both the fuel combinations, the combustion efficiency increases as the pilot quantity increases, as it leads to increased stratification and the likely increase in fuel rich spots inside the combustion chamber results in robust ignition, and a more complete combustion. At a given pilot quantity, as the PES increases, the IMEPg increases, and the cylinder temperatures become progressively hotter. The higher temperatures promote diesel autoignition and in turn a more complete combustion of the LRF leading to higher combustion efficiencies. The combustion efficiencies vary from a minimum of 70% to a maximum of 98% for the diesel–NG dual fuel combustion and from 59% to 95% in the diesel–propane dual fuel combustion with increasing LRF flowrate. The IFCE also follows a similar trend for most pilot quantities as they increase from 37% to 47% (diesel–NG) and 35% to 52% (diesel–propane) with the increase in PES. However, the combustion phasing also plays a vital role in the IFCE trends, and in a few cases, for example, the 1 kg/h pilot quantity study in diesel–NG combustion, a slight decrease in the IFCE can be observed as the PES increases. As the CA50 moves further away from the TDC (advanced or retarded), the combustion phasing becomes suboptimal and, hence, the fuel conversion efficiencies drop. As the PES increases, the load increases and the hotter in-cylinder temperatures lead to a reduced ignition delay. This is corroborated by the advancement in CA5 (start of combustion) from 346 CAD to 340 CAD, and that in turn advances the CA50 from 354 CAD to 348 CAD. The combustion phasing can be thought of being too advanced and, hence, a 1%-point reduction in the IFCE is observed at these conditions. The highest IFCE of 52% is observed in the diesel–propane study at a pilot quantity of 0.8 kg/h and a PES of 65%. The CA50 for that condition was found to be around 356 CAD (4 deg BTDC) and, since the combustion phasing was favorably positioned, it leads to higher IFCEs. The IFCE and combustion efficiency trends with respect to IMEPg show that an increase in the IMEP increases the efficiencies linearly for 0.4 kg/h–0.8 kg/h pilot quantities for diesel–NG and diesel–propane dual fuel combustion. Higher LR fuel flowrates and/or higher pilot quantities were required to achieve higher loads at this SOI and the cumulative energy release will increase, consequently. This leads to better IFCEs and the higher stratification at higher fuel flowrates will increase the combustion efficiency. However, for a pilot quantity of 1 kg/h in diesel–NG combustion, the IFCE decreases slightly due to the sub-optimal combustion phasing as discussed earlier.
Figure 12 shows the variation in maximum pressure rise rates and the COV of IMEPg as the PES increases at the different pilot quantities. This plot can be used to discuss the tendency to knock and the combustion stability at these conditions. The engine was designed such that an MPRR of 15 bar/CAD was considered to be the onset of knock. At a given pilot quantity, as the PES increases, the rate of heat release increases as seen from the AHRR plots and, hence, the peak pressure rise rates also increase. However, since the SOI is well advanced (50 BTDC), there is increased time for mixing and the mixture is nearly homogenous. This ensured that most of the operating conditions investigated in this study had an MPRR < 15 bar/CAD. The COV of IMEPg is a measure of cyclic combustion variations and a higher COV indicates the presence of increased cycle to cycle variations and combustion instability. Increasing the pilot quantity ensures increased stratification, which promotes more complete combustion and, hence, reduced combustion instability. Higher LRF flowrates also ensure more combustion stability due to the higher cylinder temperatures promoting HRF autoignition. Hence, at the lowest pilot quantities, for example at the 0.4 kg/h diesel flowrate and 80% PES condition, the COV of IMEPg was > 10% and it was an extremely unstable operating point with large fluctuations in IMEPg. However, as the PES increased to 90%, a substantial drop in the COV to <5% was observed and the engine operation became more stable. At this SOI, and for this single cylinder engine platform, the engine operation is extremely unstable at low pilot quantities and low LR fuel flowrates. To ensure stable engine operation, pilot quantities must be maintained > 0.4 kg/h for both diesel–NG and diesel–propane dual fuel combustion. The MPRR and COV of IMEPg were plotted with respect to IMEPg in Figure 12 (bottom) and loads which yield a stable engine operation were identified. At the lowest pilot quantity of 0.4 kg/hr, 6 bar IMEPg in diesel–NG dual fuel combustion had a COV of ~10% and the engine operation proved to be extremely unstable. However, as the LRF amount increased the load increased, and the COV dropped to 2% at 9 bar IMEPg. At that load, for all pilot quantities in diesel–NG and diesel–propane dual fuel combustion, the COV was around 2% indicating excellent combustion stability. The maximum pressure rise rate (MPRR) was also <15 bar/CAD which was considered to be the onset of knock for this engine.
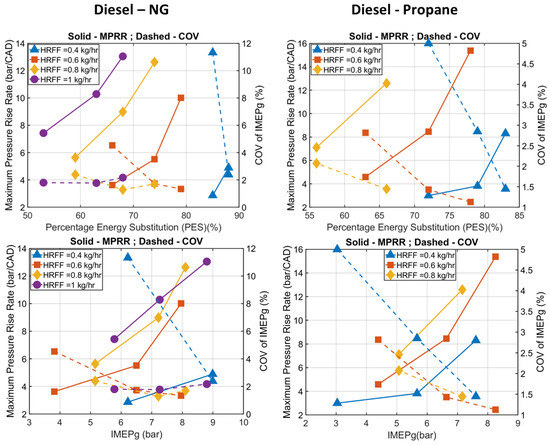
Figure 12.
Maximum pressure rise rate (MPRR) and COV of IMEPg for diesel–NG and diesel–propane combustion as a function of PES (top) and IMEPg (bottom) at different pilot quantities.
3.2. Intermediate Injection Timing Results
This section presents the results from the constant pilot quantity diesel–NG and diesel–propane experiments performed at 330 CAD SOI (30 deg BTDC), which is representative of an intermediate injection timing. Figure 13 shows the cylinder pressure curves for diesel–NG constant pilot quantity experiments performed at 330 CAD SOI along with the respective CA5, CA50, and CA90 values. At a given pilot quantity, the increase in natural gas flowrate leads to an increase in peak cylinder pressure and the load also increases from ~2–4 bar IMEPg to > 9 bar IMEPg as the LR fuel flowrate increases from 1 kg/h to 3 kg/h at different pilot quantities. The increase in peak pressure is due to the increased energy release as the amount of fuel supplied is progressively increased. At this SOI, the least pilot quantity at which the engine operation was stable was 0.3 kg/h, whereas at the 310 CAD SOI, the engine operation became extremely unstable below 0.4 kg/h diesel flowrate. At the intermediate SOI, the temperature and pressure at the injection timing is greater than the advanced SOI, and the time available for HRF to mix with the air–LR fuel charge is minimized. This ensures the reliability of diesel autoignition even at lower pilot quantities and, hence, improves combustion stability.
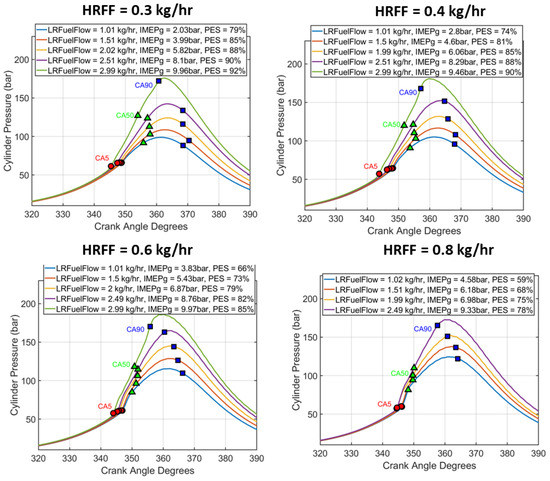
Figure 13.
Cylinder pressure curves for LR fuel flowrate sweep at different pilot quantities for diesel–NG experiments at 330 CAD SOI.
Figure 14 shows the cylinder pressure traces for diesel propane dual fuel combustion at different pilot quantities. As the trends in combustion characteristics and emissions were found to be repeatable, the pilot quantities chosen for the sake of brevity in this study were 0.4 kg/h, 0.6 kg/h, and 0.8 kg/h only. The cylinder pressure increase as the LR fuel flowrate increases in a given pilot quantity can be attributed to the increase in energy released as a result of combusting more fuel. It was also observed that for the same fuel flowrate combination, diesel–propane dual fuel combustion has a higher IMEPg when compared to the diesel–NG dual fuel combustion. This can be explained using the AHRR curves which are presented in Figure 15 and Figure 16.
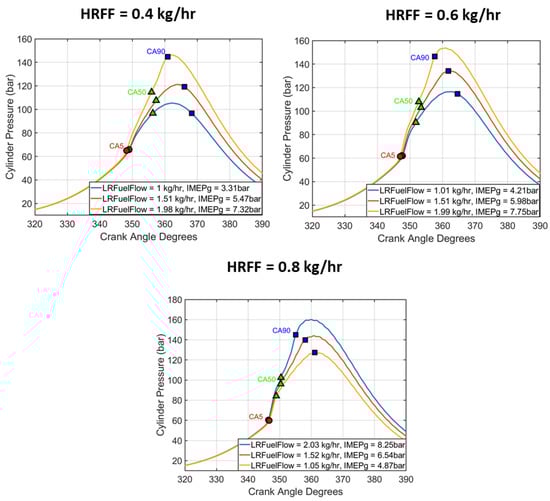
Figure 14.
Cylinder pressure curves for LR fuel flowrate sweep at different pilot quantities for diesel–propane dual fuel combustion at 330 CAD SOI.
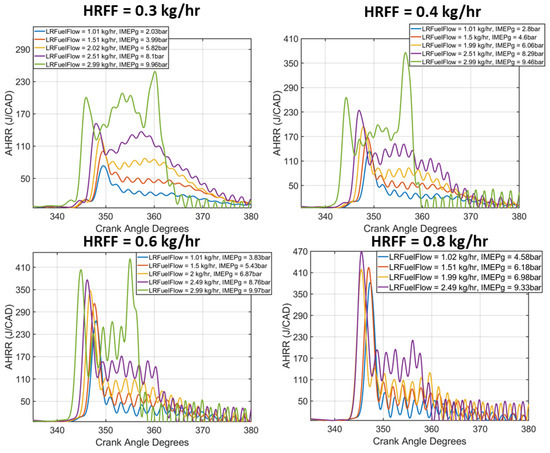
Figure 15.
AHRR curves for increasing LR fuel flowrates at different pilot quantities for diesel–NG dual fuel combustion at 330 CAD SOI.
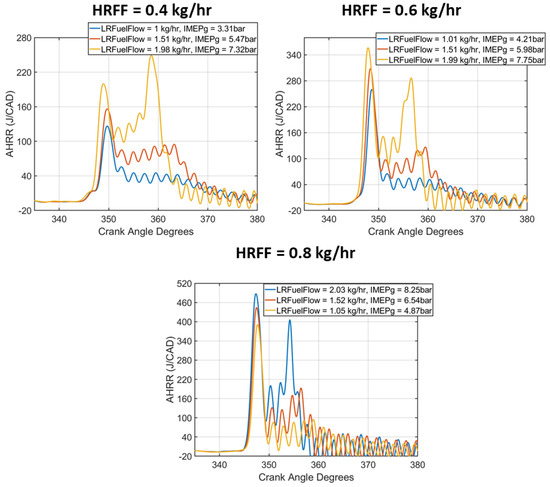
Figure 16.
AHRR curves for increasing LR fuel flowrate plotted at different pilot quantities for diesel–propane dual fuel combustion at 330 CAD SOI.
Figure 15 shows the AHRR curves for diesel–NG constant pilot quantity experiments at 330 CAD SOI and it is evident from these plots that the onset of AHRR is advanced as the NG flowrate increases, due to the increased in-cylinder temperatures at higher loads promoting earlier diesel autoignition. It is also interesting to note that the shape of the heat release is transformed from a single-stage heat release profile for 310 CAD SOI to a two-stage heat release profile for 330 CAD SOI. Such AHRR shape transformations with SOI variations have been observed with various fuel and engine combinations in dual fuel combustion. For example, recently Partridge et al. [38] observed this AHRR shape transformation between the SOIs of 330 CAD and 320 CAD for diesel–NG dual fuel combustion and attributed the reason for AHRR shape transformation to local equivalence ratio stratification differences between the SOIs. Since 330 CAD SOI is at the beginning of the transformation region, traces of two-stage heat release can be observed here. The increase in NG flowrate increases the magnitude of the peak of the second stage heat release as it increases from almost 50 J/CAD to 240 J/CAD at 0.4 kg/h pilot quantity. At a given pilot quantity the stratification of HRF will be constant, but as the NG fuel flowrate increases, the amount of NG around the diesel pockets increases and more fuel is entrained by the pilot fuel ignition. Hence, a substantial increase in second stage heat release can be observed at these conditions. Another observation of note is the absence of a distinct LTHR region at this injection timing when compared to the 310 CAD SOI. As the SOI moves closer to the TDC, the time available for the HRF to mix and disperse in the LR fuel–air charge, before autoignition conditions are reached, is minimized. Hence, at the temperatures < 900 K, where the low temperature reaction pathways are favored, it is likely that the stratification is unfavorable for those reactions to occur and, hence, there is a lack of LTHR. There are distinct fluctuations visible in the heat release and the amplitude of these fluctuations increase as the pilot quantity and/or the LR fuel flowrate is increased. This might be due to the onset of knock at these conditions and this hypothesis can be explained using the MPRR trends which will be discussed later in this section. Figure 16 shows the AHRR curves for diesel–propane dual fuel combustion at 330 CAD SOI and it can be observed that the magnitude of heat release in diesel–propane dual fuel combustion is higher for a given flowrate combination than diesel–NG. This is, again, due to the increase in energy produced per unit volume during the combustion of propane and it leads to a slightly higher cylinder pressure and IMEPg as shown in the previous section. However, the onset of heat release at a given pilot quantity seems to be uniform for both these cases as they depend upon the stratification of HRF, which will be uniform due to similar injection timings and the injected quantity. The combustion durations are also slight faster for diesel–propane which is evident from the advanced phasing of CA90 (end of combustion) for diesel–NG and diesel–propane dual fuel combustion.
Figure 17 (top) shows the trends in indicated specific HC, CO, and NOx emissions for constant pilot quantity experiments performed at 330 CAD SOI for diesel–NG dual fuel combustion. As mentioned in the previous section, trends are plotted with respect to the percentage energy substitution (PES) of the LRF, and at a given pilot quantity, increasing the LRF leads to increasing the PES and vice versa. The load/IMEPg also rises when the LRF is increased at a given pilot quantity. The ISHC and ISCO trends are similar as the NG flowrate increases at a given pilot quantity. The ISHC drops from a peak value of 120 g/kWh to <20 g/kWh at a pilot quantity of 0.3 kg/h as the PES increases from 80 to 90%. The ISCO emissions drop from 80 g/kWh to <5 g/kWh as the PES increases from 80 to 90% at the same pilot quantity. As the pilot quantity increases, the peak ISHC and ISCO values (observed at the lowest NG flowrate) reduce, but the ISHC and ISCO values seem to converge around the same minimum value of <20 g/kWh and <5 g/kWh at the highest PES operating point at each pilot quantity. The ISHC reduction as NG flowrate increases can be attributed to the more complete combustion arising from the increased in-cylinder temperatures and pressures which promote diesel autoignition. The diesel ignition centers ensure that the NG combustion is more complete, hence, reducing the engine–out unburnt hydrocarbon. Figure 18 shows the residence time at which the bulk gas temperatures are greater than 1200 K and 1500 K, in addition to the combustion duration. It is evident from the plot that as the PES increases, the residence times at temperatures greater than 1500 K increase and for the highest PES the temperatures are greater than 1500 K for almost the entirety or greater than the duration of the combustion duration. As mentioned in the previous section, temperatures greater than 1500 K promote CO oxidation and, hence, the reduction in CO emissions as NG flowrate increases. ISNOx emissions scale with the HRF flow rates, i.e., for any given PES, the lowest NOx emissions are recorded for the lowest HRF flow rates that can sustain combustion. This trend is consistent with the fact that NOx scales with pilot diesel quantity because of the increased stratification and the likely occurrence of richer equivalence ratios and high local temperatures (>1800 K) that favor NOx formation according to the thermal Zeldovich mechanism.
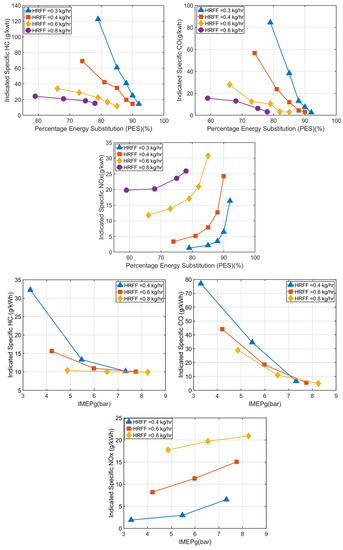
Figure 17.
Indicated specific HC, CO, and NOx emissions with respect to PES (top) and IMEPg (bottom) for diesel–NG constant pilot quantity studies at 330 CAD SOI.
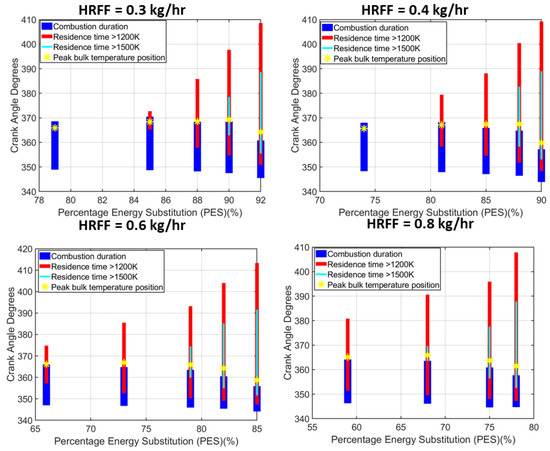
Figure 18.
Residence time plots showing the duration at which the temperatures exceed 1200 K and 1500 K in addition to combustion duration for diesel–NG dual fuel combustion at 330 CAD SOI.
Figure 17 (bottom) shows the variation of indicated specific emissions with respect to IMEPg and it is observed that for all pilot quantities, as the PES increases beyond 80%, the load, ISHC, and ISCO emissions seem to be insensitive to the changes in LRFF. Unlike in 310 CAD SOI, where a higher PES yielded higher HC emissions, higher PES values are achieved at higher loads and, hence, the higher in-cylinder temperatures and more complete combustion led to lower ISCO and ISHC emissions, respectively. At this SOI, the lower mixing time leads to a higher stratification of the HRF and, hence, at higher PES values, the engine operation is stable despite the presence of higher amounts of LRF. Optimum emissions values were observed at a higher load ~9 bar IMEPg similar to the 310 CAD SOI case; however, at this SOI the optimum PES value shifted from 60% at 310 CAD SOI to 90%.
Figure 19 shows the variation of ISHC, ISCO, and ISNOx for diesel–propane dual fuel combustion with respect to the PES at different pilot quantities. The ISHC and ISCO emissions reduce from a peak value of ~33 g/kWh to around 10 g/kWh and from ~80 g/kWh to 5 g/kWh as the pilot quantities increase. However, the PES values associated with such low emissions range from 72% to ~85% at different pilot quantities. Based on the load requirements, an appropriate PES range and, consequently, the fuel flowrate combination can be chosen as optimum operating points. The residence times greater than 1500 K and higher load (higher in-cylinder temperatures), promoting more complete combustion, can be attributed to the trends in ISCO and ISHC emissions, respectively. The ISNOx emissions also follow a trend similar to that of diesel–NG, wherein a linear NOx increase is observed as the NG flowrate increases and all cases have an ISNOx value < 1 g/kWh, whereas at 310 CAD SOI, ISNOx emissions close to 0.1 g/kWh were achieved. The increase in NOx values at higher pilot quantities can also be attributed to the increased stratification at this SOI, arising from the reduced mixing time when compared to 310 CAD SOI. From Figure 19 (bottom), where indicated specific emissions are plotted as a function of IMEPg, it can be concurred that increasing the LRF amount at a fixed pilot quantity to increase the load favors an ISHC and ISCO reduction, but the resulting higher in-cylinder temperatures cause a substantial increase in NOx emissions. A load and PES combination of 7 bar IMEPg and ~80% PES seem to have ISHC and ISCO emissions < 10 g/kWh while having a ISNOx value of 10 g/kWh which is almost half of the peak ISNOx values observed at this SOI.
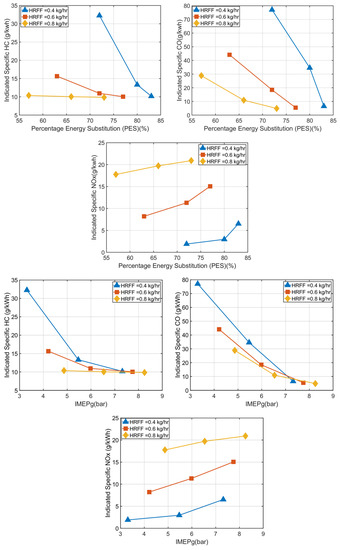
Figure 19.
Indicated specific HC, CO, and NOx emissions with respect to PES (top) and IMEPg (bottom) for diesel–propane dual fuel combustion at 330 CAD SOI.
Figure 20 shows the indicated fuel conversion efficiencies and combustion efficiencies as a function of the PES at different pilot quantities for diesel–NG and diesel–propane dual fuel combustion at 330 CAD SOI. Both the efficiencies increase progressively as the PES is increased at a given pilot quantity and they seem to converge towards an IFCE of 45% in diesel–NG and 50% in diesel–propane, and to a combustion efficiency of ~91% in diesel–NG and ~92% in diesel–propane dual fuel combustion. As the LR fuel flowrate is increased, the CA50 slightly retards by ~2 CAD for both diesel–NG and diesel–propane combustion (e.g., 354–356 for 0.3 kg/h diesel–NG and 356–358 CAD for 0.4 kg/h diesel–propane) and then advances again as the PES and, consequently, the LRF amount reaches a maximum. The combustion phasing starts very close to the TDC and since it further moves towards the TDC initially as the LR fuel flowrate increases, the IFCE increases and as the CA50 moves away from the TDC when it advances, a slight drop in IFCE can be observed in the diesel–NG study. The combustion efficiency increase as the PES increases can be attributed once again to the more complete combustion being favored at higher flowrates, as seen from the unburnt hydrocarbon trends. In addition, as the pilot quantity increases, combustion efficiencies increase too, due to the increased stratification, which leads to higher diesel ignition spots and a more complete LR fuel combustion. The IFCE values are slightly higher for the diesel–propane studies than the diesel–NG study due to the higher energy released per volume of propane which leads to a higher indicated power production at identical flowrates. The IFCE and combustion efficiency were plotted with respect to IMEPg in Figure 20 (bottom) and it was observed that the best IFCE of ~45% was achieved around 10 bar IMEPg in diesel–NG and ~49% was achieved around 8 bar IMEPg in diesel–propane. The relative amounts of high and low reactivity fuels did not affect the efficiencies at this SOI once the optimum load was reached. At lower loads, a combination of a higher pilot quantity and a lower LRF yielded better efficiencies.
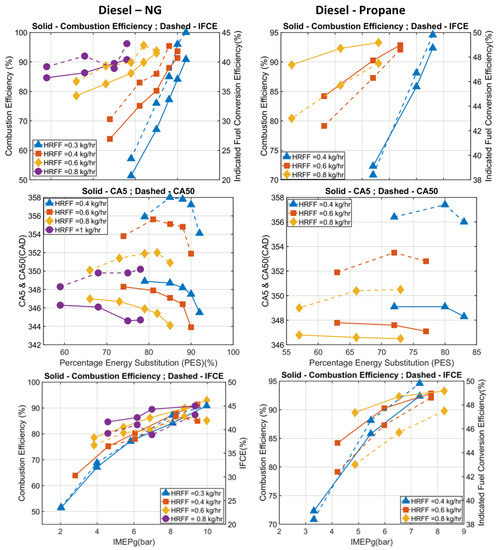
Figure 20.
Indicated fuel conversion efficiency and combustion efficiency as a function of PES for diesel–NG and diesel–propane dual fuel combustion (Top); CA5 and CA50 as a function of LR fuel flowrate at 330 CAD SOI (Bottom).
Figure 21 shows the MPRR and COV of IMEPg for diesel–NG and diesel–propane dual fuel combustion to investigate the propensity to knock and the combustion stabilities at this condition. It is evident that the maximum pressure rise rate for diesel–NG is less than 15 bar/CAD for all the flowrate combinations investigated and, hence, it is likely that the onset of knock was mitigated. However, the MPRR increases almost linearly as the PES increases at a given pilot quantity as the rate of heat release is greater due to the greater mass of fuel being combusted. The shorter mixing time available for the HRF at 330 CAD than 310 CAD SOI improves mixture stratification and, hence, the COV of IMEPg is <5% for all operating conditions in both the diesel–NG and diesel–propane studies. As the fuel flowrates increase, the combustion stability increases and the COV of IMEP drops from a maximum of 4.5% to 1.5% in diesel–NG and from 3% to 1.8% in diesel–propane dual fuel combustion. The MPRR for the diesel–propane combustion exceeds 15 bar/CAD at 0.6 kg/h and 0.8 kg/h pilot quantities and, hence, the engine was susceptible to the onset of knock. This can also be confirmed by the “ringing” observed in the AHRR curves and the fluctuations in AHRR for diesel–propane combustion seemed to increase in amplitude as the fuel flowrates increase. Figure 21 (bottom) shows the variation of MPRR and COV with IMEPg for diesel–NG and diesel–propane dual fuel combustion. For both the fuel combinations, an increase in IMEPg leads to an increase in the MPRR and a decrease in the COV of IMEPg. To achieve higher loads, more fuel quantities are required and, hence, the combustion stability and rate of energy release increases. The 10 bar IMEPg operating points in diesel–NG, which were identified to have the best efficiencies, had an MPRR of 9–14 bar/CAD (depending on the pilot quantity) and a COV of <3%, which is lower than the limits set for the onset of knock and instability for this engine.
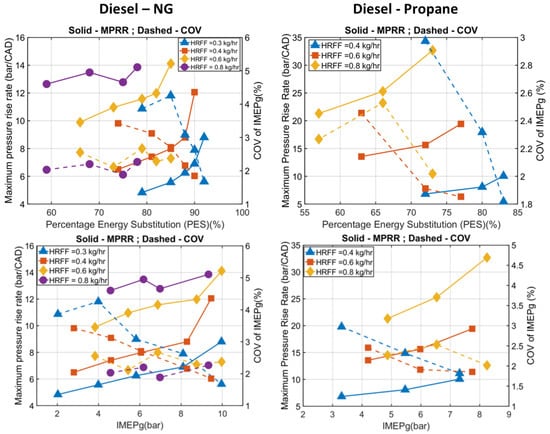
Figure 21.
Maximum pressure rise rate and COV of IMEPg plotted with respect to PES for diesel–NG and diesel–propane dual fuel combustion at 330 CAD SOI.
3.3. Late Injection Timing Results
This section presents the analysis and discussion of constant pilot quantity experiments performed at 350 CAD SOI with diesel–NG and diesel–propane as the HRF and LRF combination. Figure 22 and Figure 23 show the cylinder pressure curves for diesel–NG and diesel–propane dual fuel combustion at 350 CAD SOI, respectively. By the time the fuel injection event occurs, the pressures and temperatures inside the combustion chamber are likely to be very close to the diesel autoignition conditions and, hence, the ignition delay would be minimal. As a result, the CA5 (start of combustion) is phased very similarly for all LR fuel flowrates at a given pilot quantity. The peak cylinder pressure increases as the LR fuel flowrate increases at a given pilot quantity due to the greater energy being released at higher fuel flowrates. The CA50 is also phased > 2 deg aTDC (>362 CAD) for all the fuel flowrate combinations in both diesel–NG and diesel–propane dual fuel combustion and the phasing moves further away from the TDC as the pilot quantity increases. The increased diesel flowrate and the lack of mixing time available between the SOI and the start of the ignition likely leads to a richer stratification and, hence, the combustion takes place over a longer duration (evident from the CA5–CA90 duration) which phases the CA50 away from the TDC.
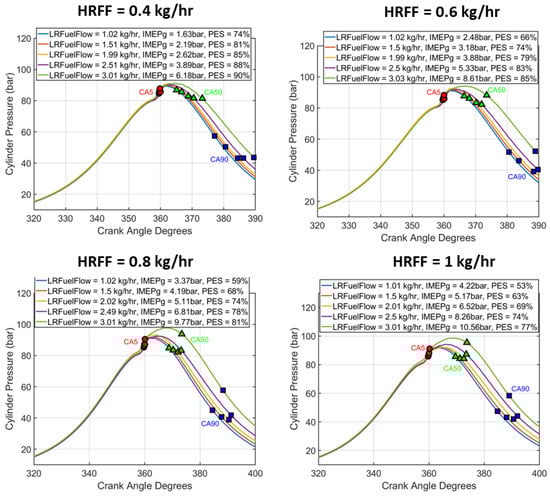
Figure 22.
Cylinder pressure traces for four different pilot quantities of diesel–NG dual fuel experiments performed at 350 CAD SOI, also showing the trends in CA5, CA50, and CA90.
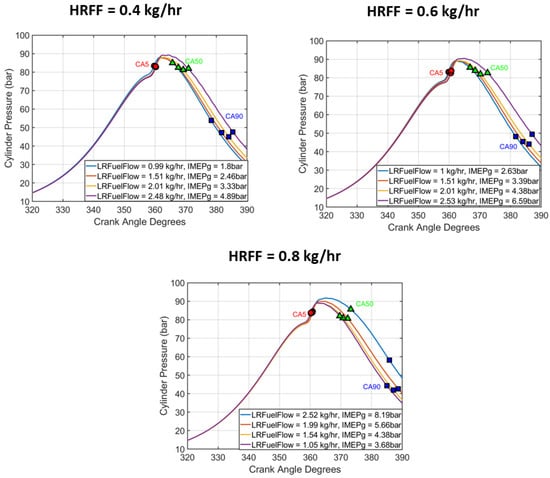
Figure 23.
Cylinder pressure traces and CA5, CA50, and CA90 trends for diesel–propane constant pilot quantity experiments performed at 350 CAD SOI.
Figure 24 and Figure 25 show the AHRR traces for diesel–NG and diesel–propane constant pilot quantity experiments performed at 350 CAD SOI. The AHRR profiles for both the fuel combinations exhibit a two-stage behavior, and as the LR fuel flowrate increases the magnitude of the second stage AHRR increases for both diesel–NG and diesel–propane. However, the onset of the first stage of heat release and the peak of the first stage heat release does not change substantially as the LR fuel flowrate increases. The first stage AHRR is predominantly due to the energy released from the diesel combustion and since the ignition delays and stratification are the same for all LR fuel flowrates at a given pilot quantity, the changes in first stage AHRR are minimal. However, the peak of the second stage AHRR rises substantially as the LR fuel flowrate is increased. The second stage heat release occurs likely due to the energy released from the combustion of the LR fuel. These observations seem to align with the findings from the prior constant pilot quantity experiments literature; for example, Karim [35] observed a similar trend with the second stage heat release as the LR fuel quantity increased. This increase in the cumulative energy released with the increase in LR fuel flowrate also causes a rise in the IMEPg (engine load) of > 5 bar as the LR fuel flowrate varies from 1 kg/h to 3 kg/h at all pilot quantities in diesel–NG, and an increase of > 4 bar as the LR fuel flowrate varies from 1 kg/h to 2.5 kg/h in diesel–propane. The higher amount of energy released per unit volume during propane combustion also causes an increase in the peak of the AHRR of up to 160 J/CAD at 0.6 kg/h pilot quantity from 140 J/CAD which was the peak heat release for 0.6 kg/h pilot quantity in the diesel–NG study.
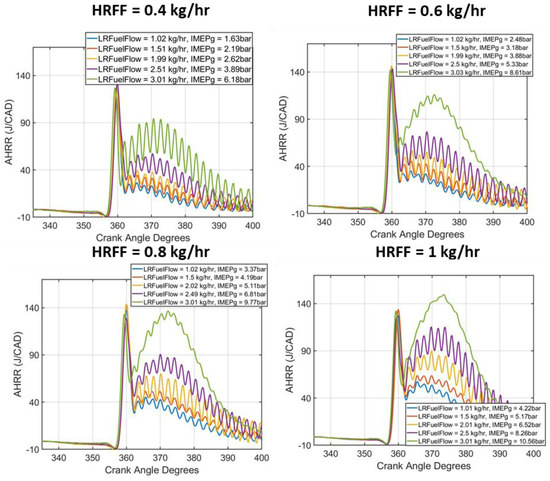
Figure 24.
AHRR profiles for different pilot quantities for diesel–NG dual fuel combustion experiments performed at 350 CAD SOI.
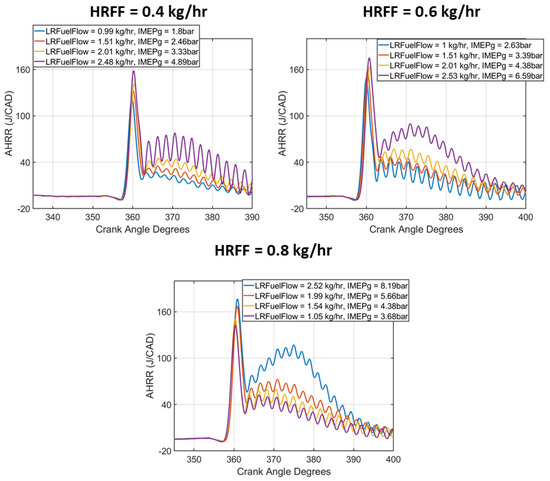
Figure 25.
AHRR traces for diesel–propane constant pilot quantity experiments performed at 350 CAD SOI.
Figure 26 shows the variation in indicated specific HC, CO, and NOx with PES for diesel–NG dual fuel combustion at 350 CAD SOI. The ISHC trends align with the observations from 310 CAD SOI and 330 CAD SOI, where a reduction in the HC values is observed as the LR fuel flowrate increases. For example, in the 0.4 kg/h pilot quantity case, an ISHC reduction from ~200 g/kWh to ~80 g/kWh was achieved as the PES increased from 65% to 85%. The presence of unburnt hydrocarbons in the exhaust is minimized as the PES increase leads to higher in-cylinder temperatures favoring diesel autoignition and in turn leading to a more complete combustion. The ISCO trends however are different from the other injection timings. The ISCO emissions increase as the PES increases initially for all pilot quantities and decrease as the PES increases beyond 75%.
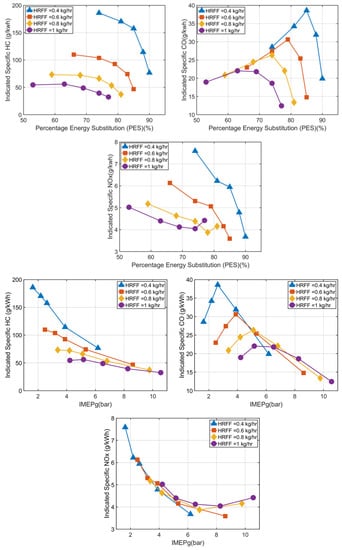
Figure 26.
Indicated specific HC, CO, and NOx emissions for diesel–NG as a function of PES (top) and IMEPg (bottom) constant pilot quantity experiments performed at 350 CAD SOI.
Figure 27 shows the bulk gas temperature as a function of the crank angle for all the pilot quantity studies performed with diesel–NG at 350 CAD. For low NG flowrates, it is evident that the peak bulk gas temperatures are lower than 1200 K for all the pilot quantities and bulk gas temperatures reach 1500 K for NG flowrates exceeding 2.5 kg/h at 0.8 kg/h pilot quantity only. Hence, the likelihood of local temperatures exceeding 1500 K are greatly minimized. As the LR fuel flowrate increases, the amount of fuel being combusted increases and, hence, the propensity to produce more CO radicals increases. However, the local temperatures are not higher than 1500 K to favor CO oxidation reactions and, hence, ISCO emissions increase by ~10 g/kWh as the LR fuel flowrate increases, and then reduces as the bulk in-cylinder temperatures move closer towards 1500 K at an LR fuel flowrate > 2.5 kg/h. The trends in NOx emissions can be explained in a similar manner using the in-cylinder temperature trends. It has been established in the literature (Hariharan et al. [34]) that a higher percentage energy substitution of NG leads to lower NOx values at low loads. For pilot quantities < 0.6 kg/h, the stratification is likely to be leaner, and that contributes towards reducing the ISNOx emissions by ~3 g/kWh with an increasing LRF. However, for the 0.8 kg/h and 1 kg/h pilot quantity study, at the highest PES, a slight increase in ISNOx (~1 g/kWh) is observed due to richer stratification at larger pilot quantities, which favor NOx production according to the Zel’dovich mechanism. The ISHC and ISCO trends with respect to IMEPg (Figure 27 bottom) follow a similar pattern to that of the trend with the LRF flowrate, as the increase in the LRF flowrate at a given pilot quantity leads to an increase in the load. As the load increases from ~2 bar at 0.4 kg/h pilot quantity and I kg/h NG flowrate to 10 bar at 1 kg/h diesel and 3 kg/h NG flowrates, the ISHC and ISCO emissions reduce from 200 to 50 g/kWh and 30 to 20 g/kWh, respectively. Higher PES values also contribute to a reduction in NOx and, hence, at these operating conditions, maintaining PES values in excess of 75% seems to be favorable to achieve a reduction in ISHC, ISCO, and ISNOx emissions.
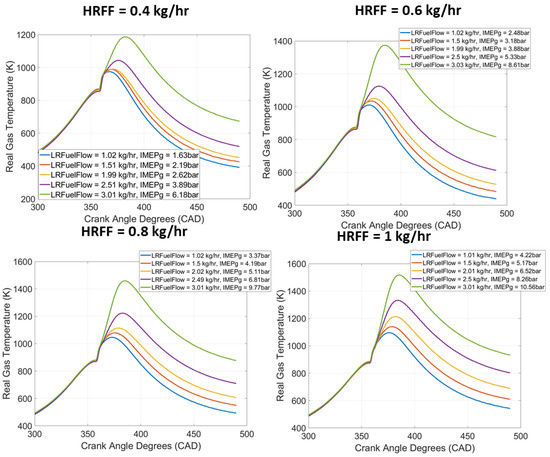
Figure 27.
Bulk gas temperature as a function of crank angle for diesel–NG pilot quantity experiments performed to illustrate trends in indicated specific emissions.
The trends in indicated specific emissions for diesel–propane experiments were found to match the trends in diesel–NG experiments, as shown in Figure 28. The ISHC emissions drop from a peak value of ~120 g/kWh at a combination of the lowest pilot quantity and the lowest LR fuel flowrate to a minimum of ~40 g/kWh at a combination of the highest pilot quantity and the highest LR fuel flowrate. ISCO emissions also increase by ~10 g/kWh as the PES increases > 70%, but an ISCO reduction is achieved as the PES is increased further to its maximum value at a given pilot quantity. ISNOx emissions also undergo a marginal reduction of ~2 g/kWh as the PES increases at different pilot quantities, due to the lower in-cylinder temperatures observed at these operating conditions. Figure 28 (bottom) shows the trends in indicated specific emissions with respect to IMEPg and as the load increases from 2 bar to 8 bar, the ISHC and ISCO emissions reduce from 120 to 20 g/kWh and 40 to 20 g/kWh, respectively. The ISNOx emissions reduce despite an increase in the load, which is likely due to the combined effect of an increase in the PES and leaner stratification at lower pilot quantities. At low loads and PES > 80%, ISHC, ISCO and, ISNOx emissions remain at sub-optimal values for this SOI. As the load increases beyond 6 bar and the PES lowers slightly to ~70–75%, a stark reduction in hydrocarbon emissions is observed. Lower ISCO and ISNOx values are also noticeable and, hence, the optimum PES and load range for this SOI seems to be around 75% and 7–8 bar IMEPg.
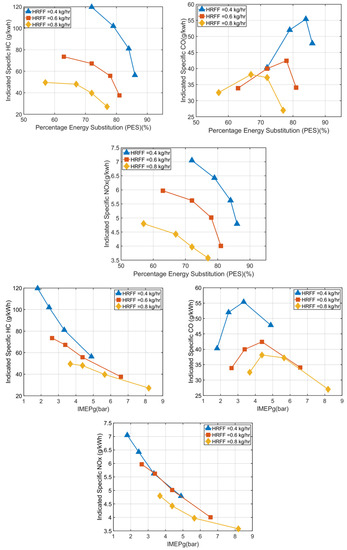
Figure 28.
Indicated specific HC, CO, and NOx emissions as a function of PES (top) and IMEPg (bottom) for diesel–propane constant pilot quantity experiments performed at 350 CAD SOI.
Figure 29 shows the indicated fuel conversion efficiencies and combustion efficiencies for diesel–NG and diesel–propane constant pilot quantity experiments at 350 CAD SOI. Combustion efficiency increases by 20% points and 10% points for 0.4 and 0.6 kg/h pilot quantities as the PES increases for diesel–NG and diesel–propane dual fuel combustion, respectively. Combustion efficiency increases almost linearly as the LR fuel flowrate increases for 0.8 kg/h and 1 kg/h pilot quantities, but the increase is ~5% (from 75% to 80%) at these higher pilot quantities. The combustion efficiency increase can be attributed to the increased fuel quantity being combusted and a more complete combustion being likelier at the increased LR fuel flowrates. The IFCEs, however, seem to follow a parabolic trend where they reduce slightly with an increasing PES, reach a minimum at 70–80% PES for different pilot quantities, and increase back again. The variation in CA50 is presented in the bottom half of the figure and it is evident that for both diesel–NG and diesel–propane dual fuel combustion, the CA50 is progressively phased away from TDC as the PES increases at a fixed pilot quantity. This leads to a “sub-optimal” combustion phasing, which results in a decrease in the IFCE. However, as the PES is further increased (implies that the LRF increased beyond 2 kg/h), the indicated power that is being produced increases as more fuel mass is being combusted. The effect of the increasing indicated power on the IFCE might be more predominant than the effect of combustion phasing and, hence, the IFCE increases from 35% to 40% for the highest plot quantity and LR fuel flowrate combination for both diesel–NG and diesel–propane dual fuel combustion. Another observation of note is the insensitivity of CA5 phasing to the PES or pilot quantity at the late SOIs, as the CA5 is located around the TDC (360 CAD) for all the operating points studied in both diesel–NG and diesel–propane dual fuel combustion. Figure 29 (bottom) shows the IFCE and combustion efficiency as a function of IMEPg and at each pilot quantity, the maximum IFCE and combustion efficiency is observed at the highest load achieved for both diesel–NG and diesel–propane dual fuel combustion. The peak load at each pilot quantity also seems to increase almost linearly as the pilot quantity increases from 0.4 kg/h to 0.8 kg/h in diesel propane and to 1 kg/h in diesel–NG. At this SOI, the best IFCE of 40% is observed at a load of 10 bar IMEPg in diesel–NG and at 8 bar IMEPg in diesel–propane combustion. Unlike 330 CAD SOI, where the peak load was achievable at both a higher pilot quantity and low LRF quantity, and a low pilot quantity and high LRF quantity, the peak loads at 350 CAD SOI were only achieved at higher pilot quantities, which was likely due to the combustion phasing positioned after the TDC.
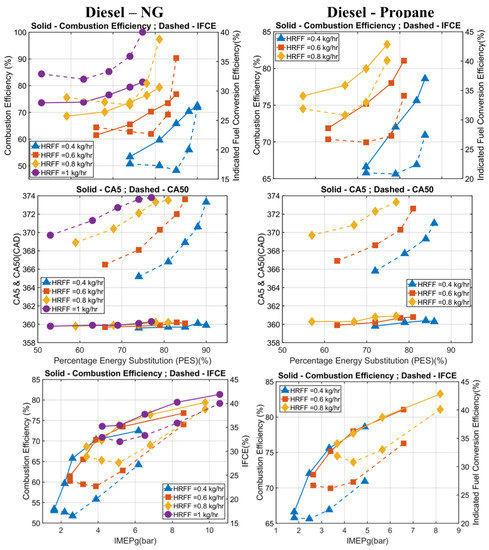
Figure 29.
Indicated fuel conversion efficiencies and combustion efficiencies for diesel–NG and diesel–propane experiments at 350 CAD SOI; CA5 and CA50 as a function of PES for diesel–NG and diesel–propane experiments; IFCE and combustion efficiencies as a function of IMEPg.
Figure 30 shows the variation of the MPRR and the COV of IMEPg with respect to the PES for diesel–NG and diesel–propane dual fuel combustion at 350 CAD SOI. Since the injection timing is very close to the TDC and the time available for mixing between the SOI and the start of combustion is very minimal, the diesel droplets have less time to atomize and disperse with the LRF–air mixture and might lead to “sub-optimal” stratification. Increasing the PES at a given pilot quantity increases the presence of low-cetane fuel inside the combustion chamber. The improper stratification and the increased presence of a fuel that is difficult to autoignite combine to increase the combustion instability and, hence, the COV of IMEPg increases as the LR fuel flowrate increases at all pilot quantities for diesel–NG and diesel–propane dual fuel combustion. The increase in the energy substitution of low–cetane fuel at these operating conditions also ensures that the rate of heat release is reduced and, hence, the maximum pressure rise rates reduce with increasing LR fuel flowrates by ~2 bar/CAD for lower pilot quantities at diesel–NG and diesel–propane dual fuel combustion. Figure 30 (bottom) shows the MPRR and the COV as a function of IMEPg and it is observed that at all loads MPRR was <5 bar/CAD for diesel–NG and <8 bar/CAD for diesel–propane. This is significantly lower than the limit of 15 bar/CAD and the COV of IMEPg did not exceed 10% for all the load conditions. The COV of IMEPg at a fixed pilot quantity increases slightly for both diesel–NG and diesel–propane as the load increases, i.e., more LRF amount is added to increase the load. This is likely due to the presence of a higher amount of low-cetane fuel which reduces the reactivity of the mixture and, hence, lowers the combustion stability.
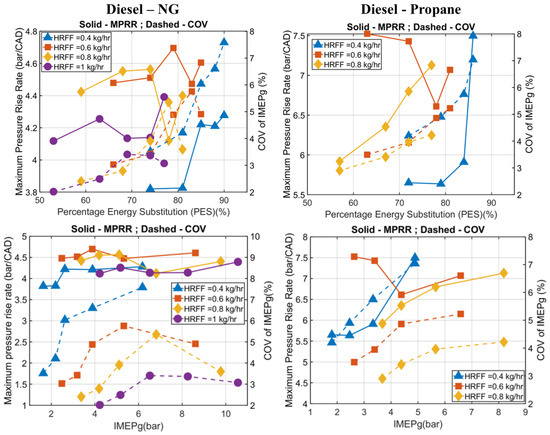
Figure 30.
Maximum pressure rise rates and COV of IMEPg as a function of PES (top) and IMEPg (bottom) for diesel–NG and diesel–propane experiments at 350 CAD SOI.
4. Conclusions
An experimental study of the effect of low reactivity fuel (LRF) energy substitution and the effect of relative quantities of high reactivity fuel (HRF) and LRF on engine performance and emissions were performed on a single cylinder engine platform at three HRF injection timings (early SOI: 310 CAD, intermediate SOI: 330 CAD, and late SOI: 350 CAD). These experiments were performed with diesel as the HRF and methane or propane as the LRF. For each operating point, one thousand cycles of cylinder pressure data and emissions measurements using a five-gas emissions bench were obtained and postprocessed. Cylinder pressure and AHRR traces indicated that specific emissions and fuel conversion efficiencies were analyzed, leading to the following conclusions:
- At all SOIs, increasing the LRF flowrate at a given HRF quantity led to an increase in the peak pressure, AHRR, and load (IMEPg) due to the higher energy release associated with a greater mass of fuel being combusted.
- For the early and intermediate SOIs, the peak AHRR increased by ~20 J/CAD for diesel–propane compared to diesel–NG combustion due to the faster combustion rates associated with propane. The combustion durations were slightly shorter for diesel–propane due to the increased reactivity of propane, when compared to NG.
- For the early SOI of 310 CAD, the onset of LTHR was advanced with respect to the crank angle as the LRF flowrate increases but the temperature at which LTHR occurs remained invariant. Higher in-cylinder temperatures due to the increased load at higher LRF flowrates caused the low temperature reaction pathways to occur earlier with respect to the crank angle.
- For all SOIs, increasing the PES at a given pilot quantity reduced the ISHC emissions, resulting in a minimum ISHC of ~20 g/kWh at 310 CAD SOI, ~10 g/kWh at 330 CAD SOI, and ~50 g/kWh at 350 CAD SOI for diesel–NG and diesel–propane dual fuel combustion.
- The ISCO trends are similar to the ISHC trends for 310 CAD and 330 CAD SOI, as increasing the PES increased the in-cylinder temperatures, and temperatures in excess of 1500 K (which favor CO oxidation) are reached for these SOIs. However, for 350 CAD SOI, ISCO emissions increased slightly as the LRF flowrate was initially increased due to lower in-cylinder temperatures, which does not aid the oxidation of additional CO being produced. An ISCO reduction was achieved at PES values > 75% at this SOI, owing to higher peak temperatures due to greater loads.
- ISNOx increased as the LRF flowrate increased for early and intermediate SOIs for both diesel–NG and diesel–propane dual fuel combustion, due to the higher in-cylinder temperatures resulting from more energy being released. However, for most operating conditions for 310 CAD SOI, ISNOx values remained <1 g/kWh.
- At each SOI, indicated specific emissions were plotted with respect to IMEPg, which enabled the identification of the optimum load and PES operating ranges which yield lowest emissions values at a given SOI.
- The IFCE and the combustion efficiency increased as the LRF flowrate increased for both diesel–NG and diesel–propane dual fuel combustion. The highest IFCE achieved was ~51% for diesel–propane dual fuel combustion for 310 CAD SOI. It was also observed that the best fuel conversion efficiencies were achieved at operating points which had a CA50 close to the TDC (±5 CAD after the TDC).
- For early and intermediate SOIs, increasing the LRF flowrate increased the combustion stability, which was evident from the reduction in the COV of IMEPg. However, the addition of more LRF increased the COV of IMEPg for late SOIs.
- At lower loads and lower pilot quantities, ISHC and ISCO emissions in excess of 100 g/kWh were observed and, hence, additional strategies such as boost pressure reductions or multiple injections were required for ISHC and ISCO mitigation, as reported in previous work [34]. For higher pilot quantities and higher LRF flowrates, the single injection strategy was sufficient to keep ISHC and ISCO emissions below 10 g/kWh.
- For a 0.8 kg/h pilot quantity for diesel–propane combustion at 330 CAD SOI, the MPRR exceeded the limit of onset of knock for this engine, and clear traces of “ringing” were visible in the AHRR curves, which confirmed this phenomenon.
Author Contributions
Conceptualization, K.K.S. and S.R.K.; Data curation, A.N.; Formal analysis, A.N.; Funding acquisition, K.K.S. and S.R.K.; Investigation, A.N., D.H., K.R.P., A.L.P., K.K.S. and S.R.K.; Methodology, A.N., D.H., K.R.P., A.L.P., K.K.S. and S.R.K.; Project administration, S.R.K.; Resources, K.K.S. and S.R.K.; Software, D.H., K.R.P. and A.L.P.; Supervision, K.K.S. and S.R.K.; Validation, D.H., K.R.P., A.L.P., K.K.S. and S.R.K.; Visualization, A.N.; Writing—original draft, A.N.; Writing—review and editing, K.K.S. and S.R.K. All authors have read and agreed to the published version of the manuscript.
Funding
This journal article was developed based on partial funding from the Alliance for Sustainable Energy, LLC, Managing and Operating Contractor for the National Renewable Energy Laboratory for the U.S. Department of Energy (Prime Award # DE-AC36-08GO28308; Subaward # NHQ-9-656 82305-01). The first author (A.N.) gratefully acknowledges funding from the University of Alabama’s graduate council fellowship (GCF).
Data Availability Statement
The data presented in this paper will be provided by the authors on request.
Acknowledgments
The authors thank Vijayaraghavan Sridhar and Yamini Baskara Babu for their contributions in improving the in-house data processing code.
Conflicts of Interest
The authors declare that they have no known competing financial interest or personal relationships that could have appeared to influence the work reported in this paper.
Nomenclature
| IMEPg | Gross Indicated Mean Effective Pressure |
| LTC | Low Temperature Combustion |
| SOI | Start of Injection |
| HRF | High Reactivity Fuel |
| LRF | Low Reactivity Fuel |
| NG | Natural Gas |
| CAD | Crank Angle Degree |
| LHV | Lower Heating Value |
| COV | Coefficient of Variation |
| SD | Standard Deviation |
| SCRE | Single Cylinder Research Engine |
| CAx | Crank angle at which x percent of the cumulative heat release occurs |
| HTHR | High temperature heat release |
| LTHR | Low temperature heat release |
References
- Elliott, M.A.; Davis, R.F. Dual-Fuel Combustion in Diesel Engines. Ind. Eng. Chem. 1951, 43, 2854–2864. [Google Scholar] [CrossRef]
- Moore, N.P.W.; Mitchell, R.W.S. Combustion in dual fuel engines. Proc. IMechE 1955, 330, 300–309, 25–27 October. Institution of Mechanical Engineers: London, UK. [Google Scholar]
- Guerry, S.E.; Raihan, M.S.; Srinivasan, K.K.; Krishnan, S.R.; Sohail, A. Injection timing effects on partially premixed diesel–methane dual fuel low temperature combustion. Appl. Energ. 2016, 162, 99–113. [Google Scholar] [CrossRef]
- Krishnan, S.R.; Srinivasan, K.K.; Raihan, M.S. The effect of injection parameters and boost pressure on diesel-propane dual fuel low temperature combustion in a single-cylinder research engine. Fuel 2016, 184, 490–502. [Google Scholar] [CrossRef]
- Hodges, K.A.; Aniello, A.; Krishnan, S.R.; Srinivasan, K.K. Impact of propane energy fraction on diesel-ignited propane dual fuel low temperature combustion. Fuel 2017, 209, 769–775. [Google Scholar] [CrossRef]
- Qi, D.H.; Lee, C.F. Combustion and emissions behaviour for ethanol–gasoline-blended fuels in a multipoint electronic fuel injection engine. Int. J. Sustain. Energ. 2016, 35, 323–338. [Google Scholar] [CrossRef]
- Northrop, W.; Bohac, S.; Assanis, D. Premixed low temperature combustion of biodiesel and blends in a high speed compression ignition engine. SAE Int. J. Fuels Lubr. 2009, 2, 28–40. [Google Scholar] [CrossRef]
- Stoumpos, S.; Bolbot, V.; Theotokatos, G.; Boulougouris, E. Safety performance assessment of a marine dual fuel engine by integrating failure mode, effects and criticality analysis with simulation tools. Proc. Inst. Mech. Eng. Part M J. Eng. Marit. Environ. 2022, 236, 376–393. [Google Scholar] [CrossRef]
- Theotokatos, G.; Stoumpos, S.; Bolbot, V.; Boulougouris, E. Simulation-based investigation of a marine dual-fuel engine. J. Mar. Eng. Technol. 2020, 19 (Suppl. 1), 5–16. [Google Scholar] [CrossRef]
- Mandra, J.O. MAN, Wärtsilä roll out new engines targeting decarbonization. Offshore Energy 2022. Available online: https://www.offshore-energy.biz/man-wartsila-roll-out-new-engines-targeting-decarbonization/ (accessed on 10 February 2023).
- Rakopoulos, C.D.; Kyritsis, D.C. Comparative second-law analysis of internal combustion engine operation for methane, methanol and dodecane fuels. Energy 2001, 26, 705–722. [Google Scholar] [CrossRef]
- Stone, C.R.; Ladommatos, N. Design and evaluation of a fast-burn spark-ignition combustion system for gaseous fuels at high compression ratios. J. Inst. Energy 1991, 64, 202–211. [Google Scholar]
- Eia, U. US Energy Information Administration Annual Energy Outlook 2022; US Department of Energy: Washington, DC, USA, 2022. [Google Scholar]
- Shioji, M.; Ishiyama, T.; Ikegami, M.; Mitani, S.; Shibata, H. Performance and exhaust emissions in a natural-gas fueled dual-fuel engine. JSME Int. J. 2001, 44, 641–648. [Google Scholar] [CrossRef]
- Yousefi, A.; Birouk, M.; Guo, H. An experimental and numerical study of the effect of diesel injection timing on natural gas/diesel dual-fuel combustion at low load. Fuel 2017, 203, 642–657. [Google Scholar] [CrossRef]
- Yousefi, A.; Guo, H.; Birouk, M. An experimental and numerical study on diesel injection split of a natural gas/diesel dual-fuel engine at a low engine load. Fuel 2018, 212, 332–346. [Google Scholar] [CrossRef]
- Yousefi, A.; Birouk, M.; Lawler, B.; Gharehghani, A. Performance and emissions of a dual-fuel pilot diesel ignition engine operating on various premixed fuels. Energy Convers Manag. 2015, 106, 322–336. [Google Scholar] [CrossRef]
- Yousefi, A.; Birouk, M. Investigation of natural gas energy fraction and injection timing on the performance and emissions of a dual-fuel engine with pre-combustion chamber under low engine load. Appl. Energy 2017, 189, 492–505. [Google Scholar] [CrossRef]
- Kokjohn, S.L.; Hanson, R.M.; Splitter, D.A.; Reitz, R.D. Fuel reactivity-controlled compression ignition (RCCI): A pathway to controlled high-efficiency clean combustion. Int. J. Engine Res. 2011, 12, 209–226. [Google Scholar] [CrossRef]
- Kokjohn, S.L.; Hanson, R.M.; Splitter, D.A.; Kaddatz, J.; Reitz, R.D. Fuel reactivity-controlled compression ignition (RCCI) combustion in light-and heavy-duty engines. SAE Int. J. Engines 2011, 4, 360–374. [Google Scholar] [CrossRef]
- Hanson, R.M.; Kokjohn, S.L.; Splitter, D.A.; Reitz, R.D. Fuel effects on reactivity-controlled compression ignition (RCCI) combustion at low load. SAE Int. J. Engines 2011, 4, 394–411. [Google Scholar] [CrossRef]
- Kokjohn, S.L.; Reitz, R.D. Reactivity controlled compression ignition and conventional diesel combustion: A comparison of methods to meet light-duty NOx and fuel economy targets. Int. J. Engine Res. 2013, 14, 452–468. [Google Scholar] [CrossRef]
- Splitter, D.A.; Hanson, R.M.; Kokjohn, S.L.; Reitz, R.D. Reactivity Controlled Compression Ignition (RCCI) Engine Operation at Mid and High Loads with Conventional and Alternative Fuels. In Proceedings of the SAE World Congress Exhibition, Detroit, MI, USA, 12–14 April 2011; p. 2011-01-0363. [Google Scholar]
- Paykani, A.; Garcia, A.; Shahbakhti, M.; Rahnama, P.; Reitz, R.D. Reactivity controlled compression ignition engine: Pathways towards commercial viability. Appl. Energy 2021, 282, 116174. [Google Scholar] [CrossRef]
- Benajes, J.; García, A.; Monsalve-Serrano, J.; Villalta, D. Exploring the limits of the reactivity-controlled compression ignition combustion concept in a light-duty diesel engine and the influence of the direct-injected fuel properties. Energy Convers Manag. 2018, 157, 277–287. [Google Scholar] [CrossRef]
- Kakaee, A.; Rahnama, P.; Paykani, A. Numerical study of reactivity-controlled compression ignition (RCCI) combustion in a heavy-duty diesel engine using 3D-CFD coupled with chemical kinetics. Int. J. Automot. Eng. 2014, 4, 792–804. [Google Scholar]
- Reitz, R.D.; Duraisamy, G. Review of high efficiency and clean reactivity-controlled compression ignition (RCCI) combustion in internal combustion engines. Prog. Energy Combust. Sci. 2015, 46, 12–71. [Google Scholar] [CrossRef]
- Krishnan, S.R.; Srinivasan, K.K.; Singh, S.; Bell, S.R.; Midkiff, K.C.; Gong, W.; Fiveland, S.B.; Willi, M. Strategies for Reduced NOx Emissions in Pilot-Ignited Natural Gas Engines. ASME. J. Eng. Gas Turbines Power 2004, 126, 665–671. [Google Scholar] [CrossRef]
- Raihan, M.S.; Guerry, E.S.; Dwivedi, U.; Srinivasan, K.K.; Krishnan, S.R. Experimental analysis of diesel-ignited methane dual fuel low temperature combustion in a single cylinder diesel engine. J. Energy Eng. 2014, 141, C4014007. [Google Scholar] [CrossRef]
- Jia, Z.; Denbratt, I. Experimental Investigation of Natural Gas-Diesel Dual-Fuel RCCI in a Heavy-Duty Engine. SAE Int. J. Engines 2015, 8, 797–807. [Google Scholar] [CrossRef]
- Papagiannakis, R.G.; Hountalas, D.T. Experimental investigation concerning the effect of natural gas percentage on performance and emissions of a DI dual fuel diesel engine. Appl. Eng. 2002, 23, 353–365. [Google Scholar] [CrossRef]
- Wei, L.G.P. A review on natural gas/diesel dual fuel combustion, emissions and performance. Fuel Process. Technol. 2016, 142, 264–278. [Google Scholar] [CrossRef]
- Hariharan, D.; Partridge, K.; Narayanan, A.; Srinivasan, K.K.; Krishnan, S.R. Strategies for Reduced Engine-Out HC, CO, and NOx Emissions in Diesel-Natural Gas and POMDME-Natural Gas Dual-Fuel Engine. SAE Int. J. Adv. Curr. Prac. Mobil. 2022, 4, 1264–1278. [Google Scholar]
- Karim, G.A. A review of combustion processes in the dual fuel engine—The gas diesel engine. Prog. Energy Combust. Sci. 1980, 6, 277–285. [Google Scholar] [CrossRef]
- Polk, A.C.; Gibson, C.; Shoemaker, N.; Srinivasan, K.K.; Krishnan, S.R. Detailed Characterization of Diesel-Ignited Propane and Methane Dual-Fuel Combustion in a Turbocharged Direct-Injection Diesel Engine. Proc. IMechE Part D J. Automob. Eng. 2013, 227, 17. [Google Scholar] [CrossRef]
- Curran, H.J.; Gaffuri, P.; Pitz, W.J.; Westbrook, C. A Comprehensive Modeling Study of n-Heptane Oxidation. Combust. Flame 1998, 114, 149–177. [Google Scholar] [CrossRef]
- Sjöberg, M.; Dec, J. An investigation into lowest acceptable combustion temperatures for hydrocarbon fuels in HCCI engines. Proc. Combust. Inst. 2005, 30, 2719–2726. [Google Scholar] [CrossRef]
- Partridge, K.R.; Jha, P.R.; Srinivasan, K.K.; Krishnan, S.R. An experimental and computational analysis of combustion heat release transformation in dual fuel combustion. Fuel 2023, 341, 127561. [Google Scholar] [CrossRef]
Disclaimer/Publisher’s Note: The statements, opinions and data contained in all publications are solely those of the individual author(s) and contributor(s) and not of MDPI and/or the editor(s). MDPI and/or the editor(s) disclaim responsibility for any injury to people or property resulting from any ideas, methods, instructions or products referred to in the content. |
© 2023 by the authors. Licensee MDPI, Basel, Switzerland. This article is an open access article distributed under the terms and conditions of the Creative Commons Attribution (CC BY) license (https://creativecommons.org/licenses/by/4.0/).