1. Introduction
Over the past decade, efforts have intensified worldwide to electrify the transportation sector and reduce emissions. All over the world, programs and incentives have been introduced to increase electric vehicle (EV) adoption and EV charging station deployment, going as far as future bans on conventional vehicle sales [
1]. For example, Canada is only allowing the sales of zero-emission vehicles (ZEVs), including battery electric vehicles (BEVs), plug-in hybrid electric vehicles, and fuel cell electric vehicles by 2035 as part of the Incentives for Zero-Emission Vehicles Program [
2,
3]. Similarly, the California Air Resource Board implemented its Zero-Emission Vehicle Program, obligating certain manufacturers to meet ZEV sales targets incrementally in the future [
4]. The Zero-Emission Vehicle Program has since been adopted by nine other states and the Canadian provinces of Quebec and British Columbia [
4,
5,
6]. To satisfy the charging demand for a growing number of EVs, policies such as the Zero Emission Vehicle Infrastructure Program incentivize the deployment of charging stations [
7]. As a consequence of these programs, EV sales have grown significantly, requiring the intensified and ubiquitous deployment of electric vehicle supply equipment (EVSE) [
8,
9]. To meet EVSE infrastructure goals, most chargers are yet to be deployed in several countries [
10]. However, EVSE allocation itself can function as a stimulus for EV adoption [
11,
12,
13,
14,
15], creating a reinforcing loop that naturally fuels the demand for electricity needed to recharge these vehicles.
While a thorough understanding of EV user behavior is important for an optimal placement of EVSE infrastructure, Faria et al. [
16] emphasized the importance of seasonality for EV life cycle emission assessments. More specifically, the underlying electricity mix used to charge EVs is a key aspect of EV lifecycle emission assessment [
16,
17]. While lifecycle emissions are not the focus of this paper, charging habits regarding time and location should be carefully understood to derive conclusions about the benefits of EVs.
Furthermore, exploring and understanding user behavioral patterns is vital to ensure grid stability. The additional electricity demand during peak times through widespread EV adoption may produce excessive loads and cause damage to transformers [
18,
19,
20,
21]. Risks for the grid may be further amplified by direct current fast charging (DCFC), which multiplies the grid’s peak load during peak charging times [
22,
23,
24,
25,
26]. Nevertheless, DCFC has become more prevalent in recent years due to its faster charging times [
27,
28], which is particularly convenient for long-distance travel [
10,
29]. A detailed review of charging systems and plug types can be found in [
26,
30]. Global DCFC deployment growth rates have surpassed standard chargers in recent years despite their relatively high installation and electricity costs [
9,
31]. While the severity varies based on charger type and time of use, EVSE utilization plays a significant role in future grid stability. Constrained charging and load management are broadly mentioned as a solution to prevent grid instability and damage through EV charging demands [
21,
22,
23,
32,
33] and require an understanding of EV user charging behavior and its main drivers.
Therefore, this study aims to contribute to the literature by applying a holistic approach to exploring and understanding EV user charging behavior in Canada. Charging session data from residential and public EVSE in Quebec and British Columbia were analyzed. The analysis included the application of a computational group of algorithms named clustered hierarchical anomaly and outlier detection algorithms (CHAODA) and advanced statistical methods to identify charging behavior in terms of energy demand, time of charging, duration of charging, and station utilization. Potential differences in charging habits between public and private charging and between public DCFC and public Level 2 charging will be identified. Findings are expected to support policymakers, electric utilities, and infrastructure planners in improving their user-centered EVSE infrastructure deployment strategies to ensure grid stability, energy efficiency, and high utilization.
2. Literature Review
Several studies have examined EV user charging behavior in the past decade, varying in focus, approach, and data source. Early research on early adopter charging behavior has mainly focused on residential charging behavior [
34,
35,
36]. Quirós-Tortós et al. investigated residential charging behavior in the UK, finding that 70% of users are connected once a day, regardless of the day of the week [
34]. Franke and Krems studied charging behavior using driving surveys from 79 participants over six months [
35]. With 80% of all charging events being conducted at residential locations, the results of this early study reveal little about behavioral patterns at public EVSE [
35]. Similarly, Smart and Schey analyzed driving data to analyze charging events undertaken in predominantly residential settings [
36]. The results included findings on the starting state of charge (SOC) and the frequency of charging on a vehicle level [
36]. Present and future widespread adoption of EVs requires intensified investments in public EVSE infrastructure, making a detailed understanding of public EVSE utilization critical for future planning and allocation efforts. More recent studies have, therefore, examined charging behavior under higher adoption levels, including public and work charging.
While recent research efforts have shifted to including public charging behavior, studies often lack a holistic approach in analyzing contemporary charging behavior, including public and residential charging. For example, Flammini et al. analyzed data collected at 1750 public charging stations between 2012 and 2016 in the Netherlands [
37]. Similarly, Gellrich et al. investigated charging events from public EVSE units in Switzerland [
38]. The authors state that the utilization of public chargers is concentrated on workdays and normal work hours, depending on the location. Both studies lack consideration of DCFC, which is crucial with further and accelerated demand for this charging infrastructure.
Yang et al. [
39] aimed to model DCFC demand based on more than 2000 charging events from 130 private BEVs in Beijing, China, collected over seven months. Starting SOC, driving behavior, weather, and previous user habits were identified as the main factors impacting charging behavior [
39]. However, differences in station utilization between Level 2 and public DCFC have been shown, making a differentiation essential [
40,
41].
Morrissey et al. provided evidence that charging behavior between standard (including Level 1 and Level 2) and fast charging can differ considerably, applying various methods to explore charging behavior in Ireland [
40]. While more than 40,000 charging events at Level 2 and DCFC public and residential charging stations were analyzed, results come from the early phases of EV adoption. Updated insights on public EVSE utilization were performed by Borlaug et al., who studied the United States nationwide public Level 2 and DCFC stations [
41]. The authors state that the sensitivity of station utilization is significantly different between Level 2 and DCFC. While venue type was not significant for station utilization, Borlaug et al. found that EV adoption rates greatly affect the utilization of both types of chargers, amplifying the importance of updated and repeated station utilization analyses [
41]. Another study by Lee et al. [
42] used a survey of California EV owners to identify different socio-economic factors related to EV charging behavior. According to their results, vehicle characteristics, commute behavior, and the availability of workplace charging play an important role in the consumer choice of charging locations.
As shown above, studies exploring charging behavior were primarily conducted in the early phases of EV adoption [
34,
35,
36,
40] or do not focus on actual EV charging behavior alone [
35,
36,
38,
39]. With increased adoption and station deployment, charging behavior and station utilization are subject to change, making recurring analyses crucial to ensure user-centered infrastructure planning [
41]. Gnann et al. summarized that current research on EV user behavior still lacks the necessary empirical data to fully understand DCFC behavioral patterns and their impacting factors [
38].
This paper aims to contribute to the literature by empirically analyzing current public and residential EVSE data across Canada. The following research questions are explored: (1) How does residential charging behavior differ from public charging behavior? (2) Do users use DCFC differently compared to Level 2 charging? (3) Does charging behavior follow a seasonal pattern?
3. Materials and Methods
The goal of this study was to develop a holistic understanding of EV user charging behavior with regard to utilization, charging times, and seasonality. Charging-session-specific data collected at residential and public charging points in British Columbia and Quebec, Canada, were analyzed. For this study, only Level 2 charging sessions were compared to understand the differences in charging behavior between functional locations, as they are both used residentially and publicly. Similarly, only data from public Level 2 and public DCFC stations were compared to explore differences in behavior by type of charger. For the comparison of charging types, public DCFC and public Level 2 could be considered because there are currently no DCFC stations in residential locations.
For the purpose of this study, the user behavior at charging stations was investigated based on a consideration of charging time, energy consumption, charging duration, and total duration. This study aims to provide detailed insights on user behavior at EV charging stations that can be used by policymakers, electric utilities, and station network providers to improve the overall service of the infrastructure.
3.1. Data
The data utilized in this study include session-specific information for every charge conducted at FLO smart chargers in Quebec and British Columbia, Canada, in partnership with FLO Services USA, Inc. Smart chargers can store and transfer data when connected to the internet. This enables the analysis of session-specific data from the considered stations shared for this study which were collected between 2018 and 2019. The data did not include any sensitive information about the users or their vehicles. Sessions were categorized by the functional location (i.e., residential chargers, public chargers). Public chargers are chargers that are generally available to the public. However, the activity related to the use of these stations remains unknown. For example, public chargers could be used as workplace chargers if they are located close to office buildings or similar. The data did not allow for further differentiation of public charging events (e.g., charging while at work, charging during recreation). For every charging event at Level 2 chargers, the following information was available per charging session: charging station identifier, session start time, session end time, charging duration (minutes), total plug-in time (minutes), and energy consumption (kilowatt-hours). The total duration of charging events conducted at DCFC stations was not recorded and, thus, not included in the analysis. Instead, DCFC charging sessions exclusively contained information about the SOC of the vehicle before and after charging. The charging frequency for every station was calculated by dividing the total number of charges by the number of days between the first and last reported use conducted at the station.
The raw data included 2,298,801 charging sessions from 7873 distinct charging stations. Data cleaning was undertaken to remove erroneous entries in the data set. These entries included sessions with an energy consumption of 0 kWh or greater than 100 kWh, sessions with a start date later than the end date, and sessions with a charging duration of more than 24 h. The maximum upper bound of 100 kWh for the energy consumption was determined based on the largest battery capacity available in EVs at the time. Following cleaning procedures described in the literature, Level 2 charging sessions with a charging duration of less than one minute [
40] and DCFC sessions with a charging duration of fewer than three minutes were removed from the data. After cleaning the data, 2,012,248 data points from 6694 different EVSEs remained for analysis.
Table 1 summarizes the data by their functional location (i.e., residential vs. public) and the EVSE type (i.e., Level 2 vs. DCFC). Of all the public chargers, 42 DCFC and 657 Level 2 stations were located in British Columbia. Consequently, 3321 Level 2 and 17 DCFC public charging locations were in Quebec. Due to a lack of GPS location, a differentiation of residential chargers by province was not possible.
3.2. Methodology
Various analyses were utilized to understand differences in charging behavior based on functional location and type of EVSE. First, a novel algorithm, CHAODA, was applied to identify the possible differences between the functional location and the EVSE type data when considering energy consumption, charging duration, and total duration. Then, tests comparing means between the functional locations and the EVSE types were performed based on key utilization variables. Lastly, the differences in start and end times and patterns in station occupancy, trends, and seasonality were also explored. The holistic methodology of applying these multi-methods in series is novel, and advances how such multifaceted data should be approached in the future.
3.2.1. Clustered Hierarchical Anomaly and Outlier Detection Algorithms
The first part of the analysis utilizes the Clustered Hierarchical Anomaly and Outlier Detection Algorithms (CHAODA). CHAODA is based on Clustered Hierarchical Entropy-Scaling Search (CHESS) [
43] and Clustered Learning of Approximate Manifolds (CLAM) [
44]. CLAM maps a manifold in a Banach space defined by an underlying distance metric and clusters to a depth at which every datum is assigned to one cluster [
44]. This approach induces a tree from the cluster graph through decision functions learned from training data sets. Every datum in the data set is represented by one vertex in the graph. By applying an ensemble of six algorithms (i.e., relative cluster cardinality, relative component cardinality, graph neighborhood, child-parent cardinality, random walks, stationary probabilities) on the graph to calculate anomalousness scores for every datum in the data, CHAODA is built on the base of CLAM [
44]. While the scores of each algorithm can form a wide range of values, a lower score generally represents lower anomalousness. The final score for each datum can be derived by computing the gaussian-normalized mean of the six scores. CHAODA was selected as the preferred algorithm because it has outperformed 18 existing approaches in 16 out of 18 datasets [
45].
The distribution of CHAODA results may differ with the respective subset of data as specific subsets could be concentrated within a certain range of scores. While analyzing large multivariate data sets often requires multi-method approaches, CHAODA can efficiently explore anomalousness in multidimensional data sets. The variables inserted into CHAODA (i.e., energy consumption, charging duration, and total duration) were normalized before calculating the anomalousness score. With CHAODA, it is possible to identify general differences between data subsets as an initial step of the holistic approach underlying this study. CHAODA was applied to identify differences between public and residential chargers as well as differences between Level 2 and DCFC chargers.
3.2.2. Comparison of Station Utilization between Different Cases
After the application of CHAODA, descriptive statistics for different considered variables (i.e., energy consumption, charging duration, total session duration, parking time, and charging frequency) for each of the specific subsets (i.e., residential chargers, public Level 2 chargers, and public DCFC chargers) were calculated. Total charging time and parking time were not available for DCFC sessions; therefore, the comparison between Level 2 and DCFC charging behavior was limited to energy consumption, charging duration, and charging frequency. Potential differences in charging behavior between functional locations and charger types were explored statistically using Mann-Whitney U tests as a standard comparison technique for non-parametric data. The null hypothesis was tested using a significance level of 𝛼 = 0.05 for all considered variables.
In addition, potential differences in patterns of charging behavior with respect to time of day and day of the week were explored. Density plots were provided for session start and end times in 30-min intervals. Chi-square tests were conducted at a 𝛼 = 0.05 significance level to determine whether there were statistical differences in start times and end times. Following the same procedure, potential differences in the day of the week the sessions were initiated were investigated.
While charging start and end times can represent temporal charging behavior, they lack a representation of the likelihood that a charging station is occupied in a given time period. Therefore, for every 30-min time interval in a day, it was tallied how often each charging station was occupied. Probability density plots displaying the occupation throughout the day were explored, and Chi-square tests were conducted to identify differences between the subsets at a significance level of α = 0.05.
Finally, charging behavior at the various functional areas and EVSE station types was investigated for trends and seasonality. Time series were computed by day and month for session counts, average energy consumption, average charging duration, and average frequency. Dickey-Fuller tests for stationarity were conducted to determine trends of charging behavior in the time series data at a significance level of 𝛼 = 0.05. Temporal autocorrelation tests were then carried out for all variables and subsets in the time series data by day with a time lag of 1–7 for days and 1–12 for months to explore patterns throughout the week and year.
4. Results
First, the results of CHAODA are described to identify differences in charging behavior at stations based on anomalousness scores computed for every session. Second, results of comparing charging behavior between residential and public Level 2 chargers are presented. To this end, summary statistics for key utilization variables, comparison of means, temporal charging behavior results, and trend analyses are described. Finally, the comparison results between public Level 2 and public DCFC stations are outlined and summarized.
4.1. CHAODA
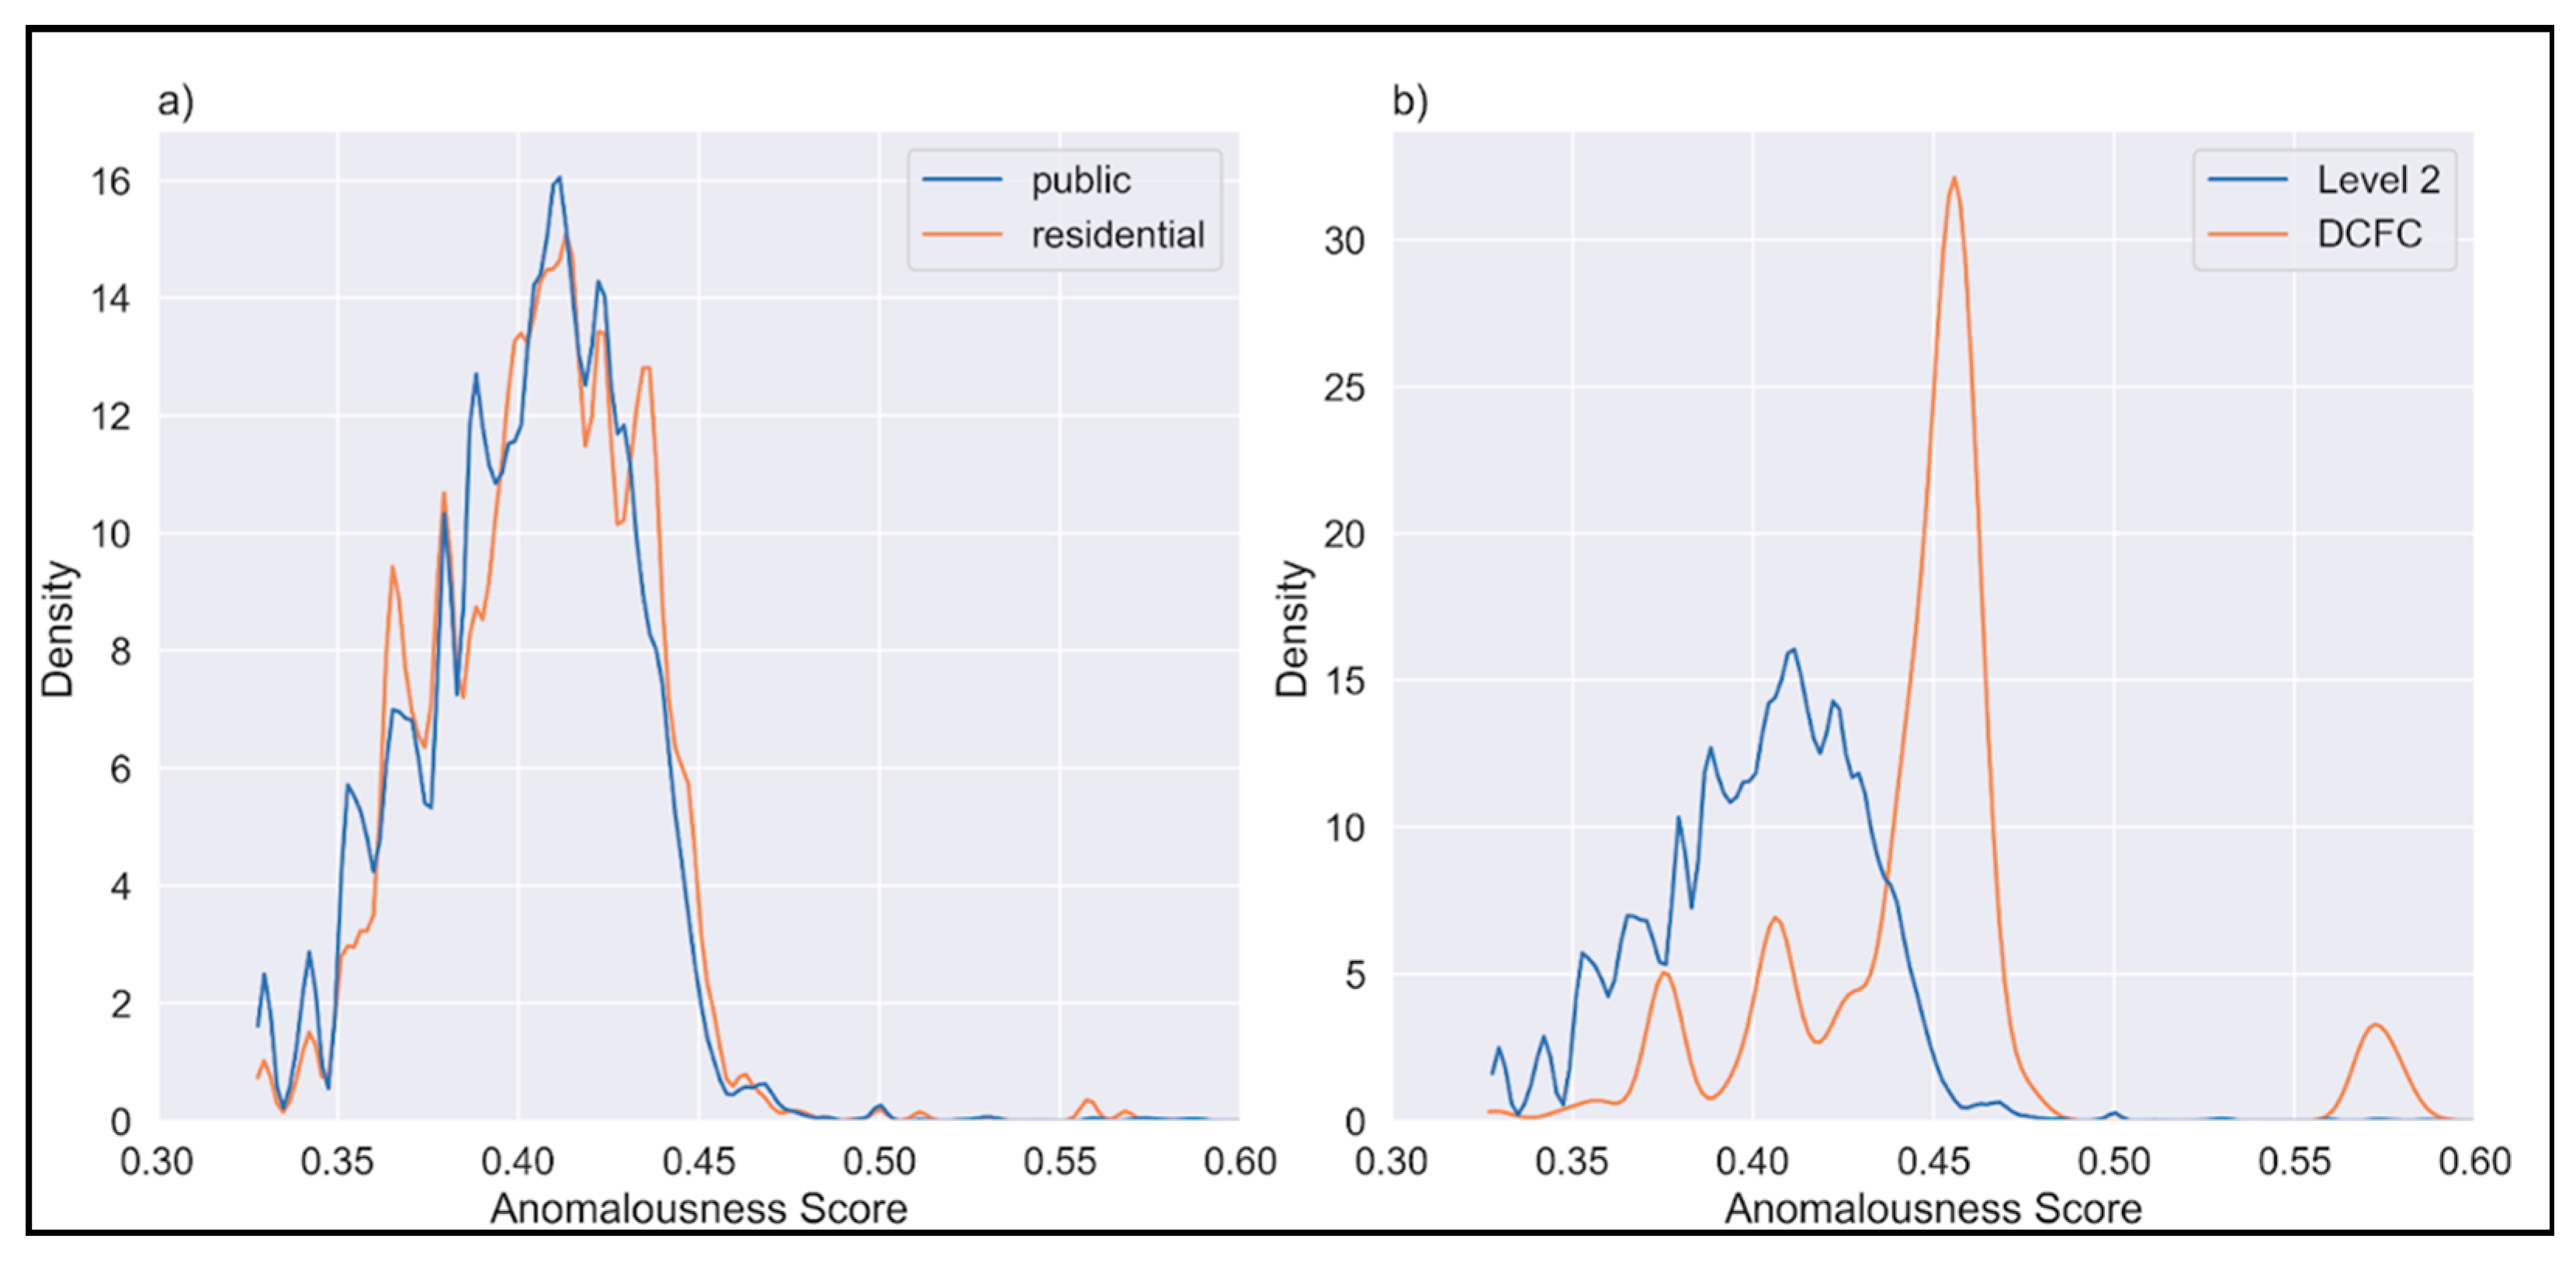
The results of CHAODA computed with the underlying normalized variables (i.e., energy consumption, charging duration, and total duration) are displayed as kernel density plots in
Figure 1. For residential Level 2 and public Level 2, most charging events within these subsets resulted in anomalousness scores between 0.35 and 0.45 (
Figure 1a); thus, there are no apparent differences in the concentration of anomalousness scores. Public Level 2 and public DCFC indicate differences in the score density, as shown in
Figure 1b. The highest density of DCFC sessions resulted in scores between 0.44 and 0.47, with a small number of sessions ranging between 0.56 and 0.58, indicating high anomalousness. Equal anomalousness scores for Level 2 and DCFC are found between 0.35 and 0.45 for a limited number of charging sessions.
4.2. Differences in Charging Behavior between Residential and Public Level 2 Charging Stations
For a general understanding of charging station utilization between functional areas, descriptive statistics of key utilization variables for residential and public Level 2 chargers are summarized in
Table 2. The mean energy consumption at public Level 2 charging stations is 8.83 kWh (
SD = 8.04), with a median total session duration of approximately three hours. Residential sessions have an average energy consumption of more than 12 kWh (
SD = 10.28) and a median plug-in duration of almost 10.5 h. On average, a vehicle remains plugged in for an additional eight hours (
SD = 12.05 h) after the charging has ended at residential chargers. The average parking time at public stations is 5.15 h (
SD = 20.36 h). Results of the Mann-Whitney U test demonstrated differences between residential and public Level 2 charging across all utilization variables (
p < 0.001), with the statistically greater charging session distribution from residential stations (
p < 0.001).
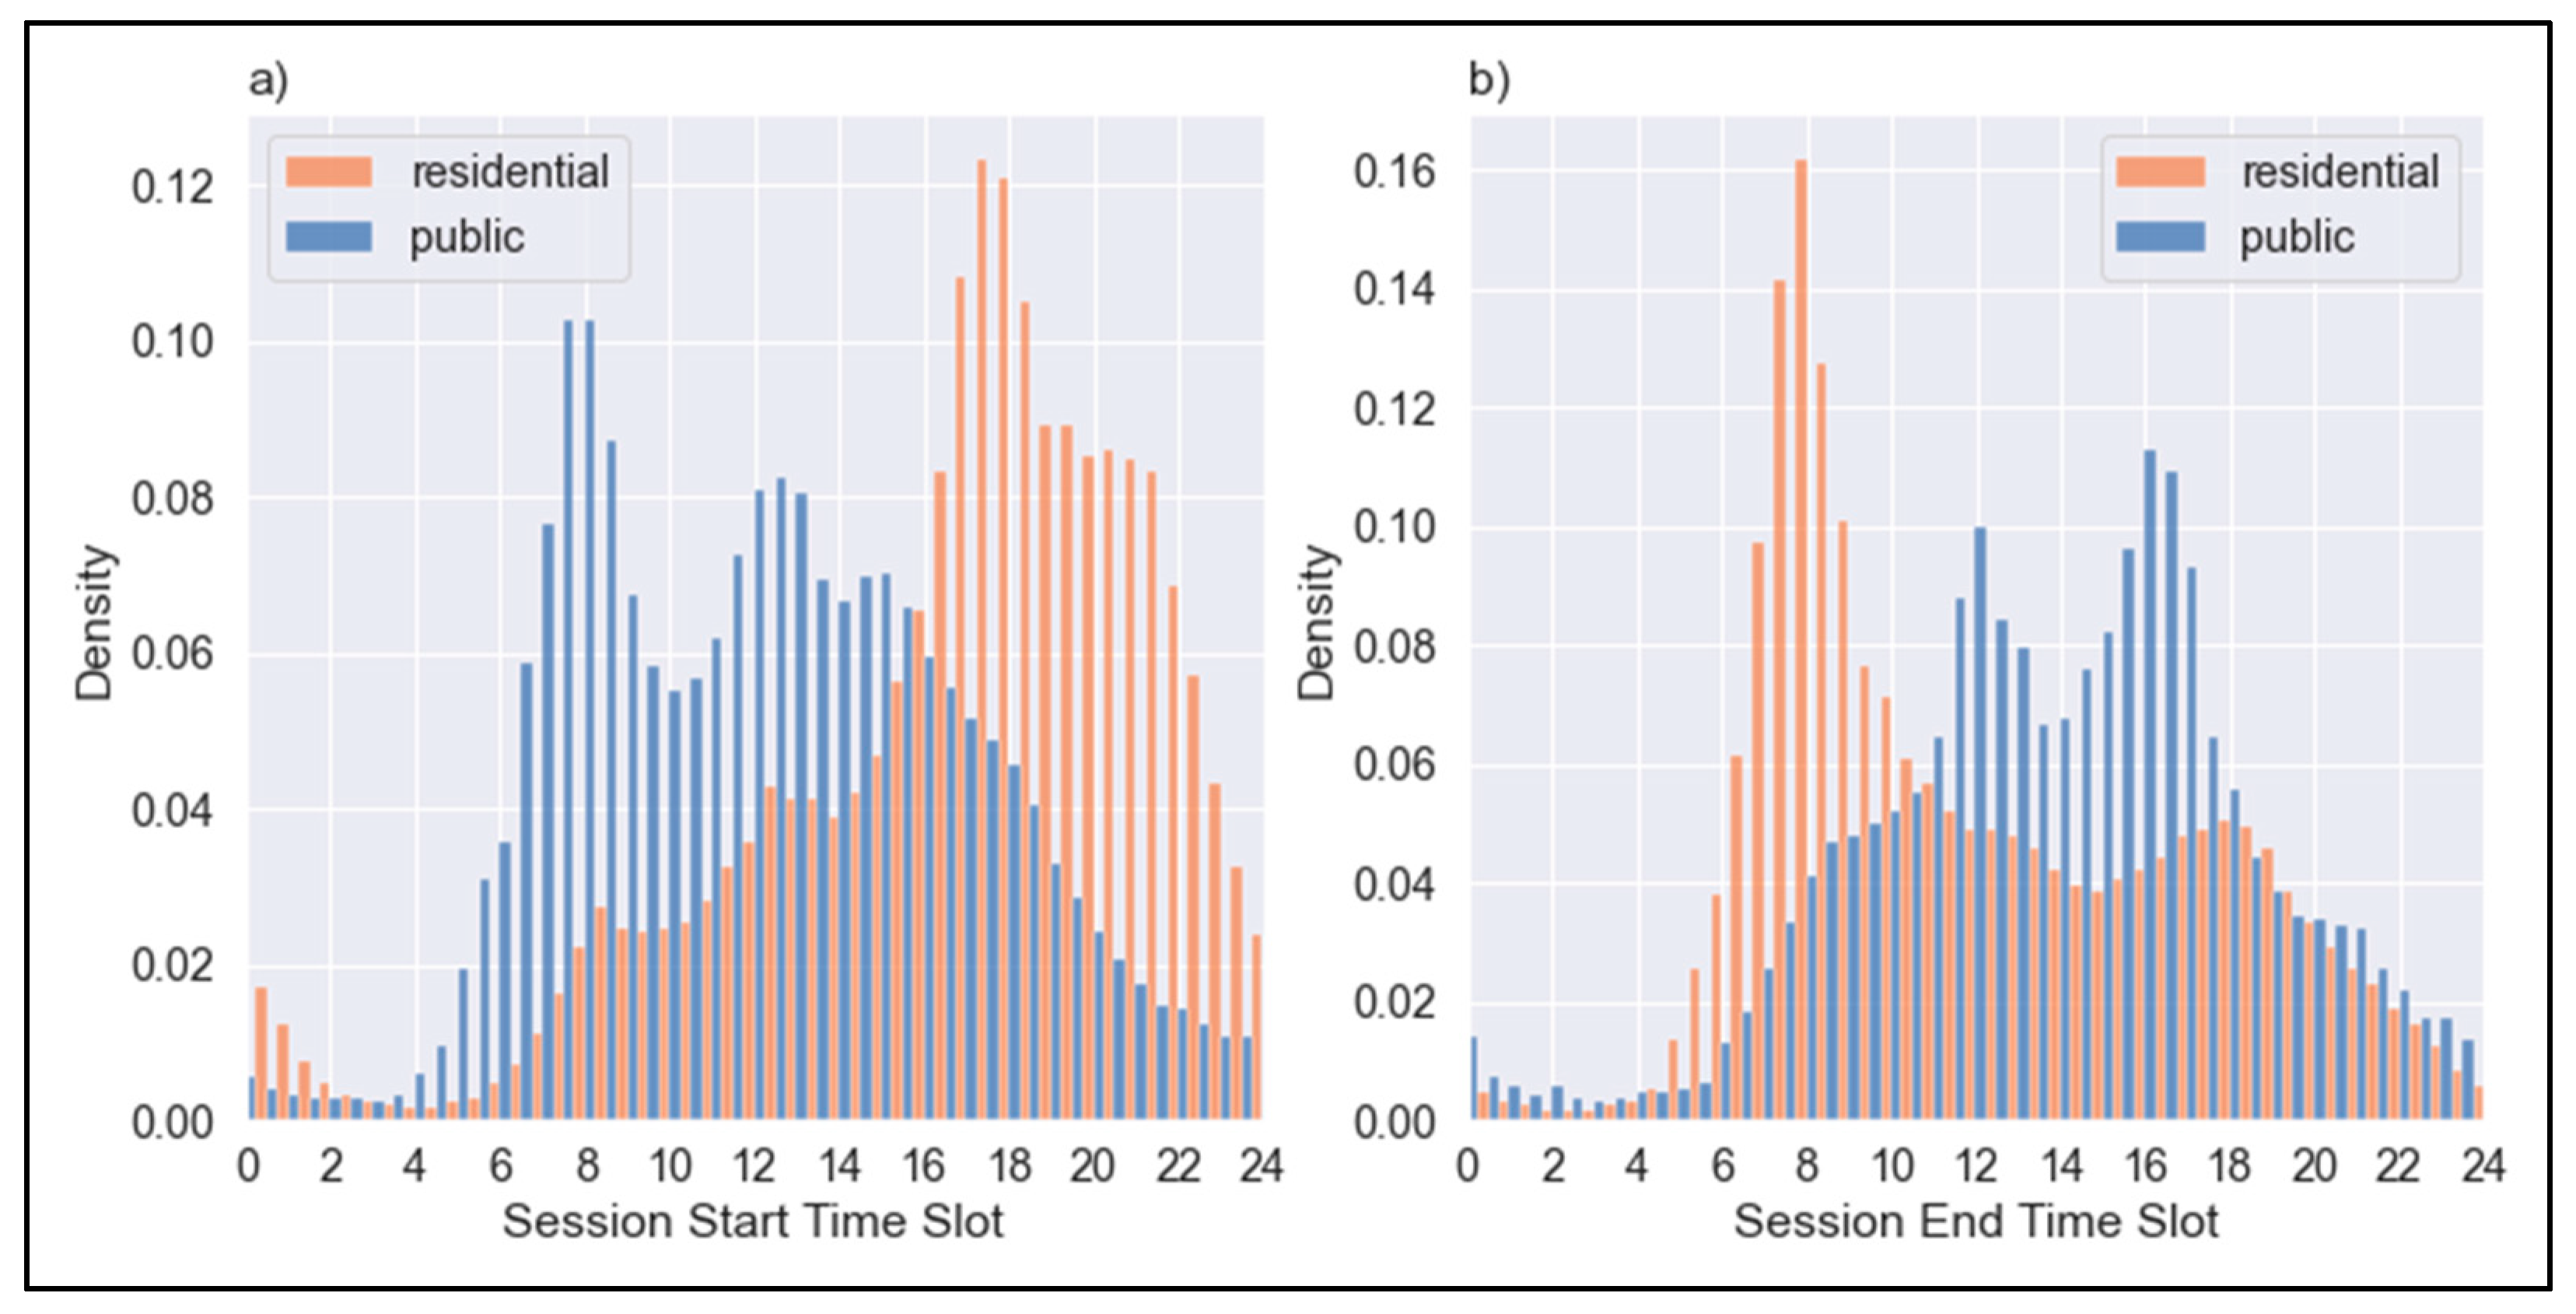
Figure 2a displays the density of charging starts and ends over 30-min intervals for residential and public Level 2 charging events. The highest density of start times for public events is between 7:30 a.m. and 8:30 a.m. A second local peak is between 12 p.m. and 1:30 p.m., before dropping slowly towards the end of the day. Charging events at residential chargers are typically initiated later in the day, with a peak between 5 p.m. and 6 p.m.
The distribution of charging ends over time of the day is displayed in
Figure 2b. Most residential events end in the morning between 7:30 a.m. and 8 a.m. Contrarily, two peaks of charging ends are observed at public stations, one between 12 p.m. and 12:30 p.m. and one between 4 p.m. and approximately 5 p.m. before dropping sharply. Chi-square test results show a significant relationship between session start time and the functional location (
p < 0.001), with the highest contribution for the three time intervals before, at, and after 9 p.m. Additionally, Chi-square test results for the end time interval and functional location confirmed a statistically significant relationship (
p < 0.001), with the highest contribution found for the three intervals before, at, and after 7:30 a.m.
The density plot of station occupation over 30-min time intervals for residential and public Level 2 charging events is depicted in
Figure 3. Residential charging stations are most likely in use between the evening, around 5 p.m., and the morning hours, around 8 a.m., before the occupation likelihood drops. Public charging stations are most likely used between approximately 8 a.m. and 4:30 p.m. The Chi-square test confirmed a significant relationship between the time slot and the functional location of the stations (
p < 0.001), with the highest contribution found at 2 p.m. and midnight.
Figure 4 displays the density of charging starts over the day of the week for residential and public Level 2 chargers. In both areas, charging sessions happen more often between Monday and Friday than on weekends. However, session counts drop on Saturday and Sunday at public charging stations. At residential chargers, the difference in event counts between weekends and weekdays is marginal. A Chi-square test was conducted for a relationship between the day of charging and the functional location, and a statistically significant relationship was found between the two variables (
p < 0.001). The highest contribution was found for Sunday, followed by Saturday.
Trend and seasonality analysis were conducted for Level 2 charging session data from both functional locations. In addition, time series data of all variable means by day and month were created from the charging data of both subsets. The Dickey-Fuller test showed that no utilization variables at public charging stations were stationary. Instead, a positive public Level 2 behavior trend was found (p > 0.05). More specifically, the test revealed that average consumption, average charging duration, average total duration, and average frequency increase over time on a daily and monthly basis. The daily and monthly charging behavioral trend at residential charging stations was also not found to be stationary, as the results of the Dickey-Fuller test indicated (p > 0.05). Contrarily, the monthly average duration of residential charging sessions was found to be stationary (p = 0.01).
In a final step, both residential and public time series data were examined for temporal autocorrelation. Temporal autocorrelation was computed for time lags between one and twelve for time series data by month and one to seven for time series data by day. The time lag with the highest autocorrelation varied by the considered variable. For public charging data, session counts (0.98), average energy consumption (0.94), and average charging duration (0.90) showed the highest correlation for a 12-month time lag. However, the mean frequency of public chargers had the highest correlation for the previous month (0.72). This shows that, with the exception of charging frequency, the monthly charging utilization of public charging stations follows a somewhat seasonal pattern as it had the highest correlation to the utilization from twelve months prior. Contrarily, across all residential charging time series variables, the highest temporal autocorrelation was found for a time lag of one (>0.8), indicating that the utilization is correlated with that of the previous month.
To analyze patterns in behavior throughout the week, autocorrelation was also computed for time series data by day for time lags between one and seven. Public charging behavior showed the strongest temporal correlation with a time lag of seven, indicating that the utilization on a given day correlates with that day the previous week. This held for session counts (0.90), average energy consumption (0.91), average charging duration (0.90), and average charging frequency (0.87). Residential charging behavior, however, depends on the specific utilization variable and is either autocorrelated most strongly with the previous day or the same day a week earlier. For example, session counts (0.98) and mean duration (0.72) showed the highest autocorrelation value for a time lag of one. On the other hand, the average daily energy consumption of residential charging sessions showed the highest autocorrelation at a time lag of seven (0.72). Similarly, the highest yet most relatively weak autocorrelation was found for charging frequency (0.34) at a time lag of seven.
Figure 5 displays the seasonality of charging demand in terms of session counts for residential and public chargers as an example. Spikes in demand between November and December can be observed at both functional locations.
4.3. Differences in Charging Behavior between Public Level 2 and Public DCFC Stations
After analyzing and comparing charging behavior at residential and public Level 2 chargers, behavioral patterns at public DCFC stations were explored and compared to public Level 2 charging behavior. Descriptive statistics for the considered and available utilization variables for DCFC charging station data are summarized in
Table 3. The average energy consumption for DCFC sessions was 12.895 kWh (
SD = 9.631). The average energy consumption at public Level 2 chargers was 8.83 kWh (
SD = 8.04). Furthermore, DCFC stations were used more frequently, with a median of once a day, than public Level 2 chargers, with a median of 0.4 charges per day. A maximum SOC before charging of 100% indicated that users plugged in although they had a fully charged battery. On average, users plugged in their vehicles when the SOC showed 34% and unplugged their vehicles when their SOC reached approximately 73%. 50% of all DCFC sessions ended with a vehicle battery SOC of at least 80%.
Across all variables that were available for both the public Level 2 charging data and the public DCFC data (i.e., energy consumption, charging duration, charging frequency), Mann-Whitney U tests showed that the samples were significantly different (p < 0.001). More specifically, energy consumption and charging frequency were significantly greater in the DCFC session data (p < 0.001), while the charging duration was significantly lower at DCFC stations than at Level 2 stations (p < 0.001).
Figure 6 displays the distribution of SOC before charging and SOC after charging at DCFC stations. Most charging events start with around 20–35% charge left and end when the SOC reaches approximately 80%.
Figure 7 displays the density of charging session start times and end times in 30-min intervals for public Level 2 and DCFC sessions. The number of DCFC plug-ins picks up slowly in the morning and plateaus between noon and 5:00 p.m., before decreasing steadily toward midnight (
Figure 7a). The main difference in session density over start time intervals between the two subsets can be observed in the morning, where the session starts for Level 2 chargers peak between 7:30 and 8:30 a.m. However, the session ends between the two subsets seem to be more similarly distributed throughout the day, as shown in
Figure 7b. The density of DCFC session ends is similar to that of the DCFC start times, with a plateau between 12:30 p.m. and approximately 5:30 p.m., whereas two peaks in the number of Level 2 session ends are apparent, one between 12 p.m. and 12:30 p.m. and one between 4 p.m. and 5 p.m.
It was found that there is a relationship between session start times and public EVSE type by applying the Chi-square test (p < 0.001). A start time of 8 a.m. was found to have the highest contribution to the test statistic. Similarly, a significant relationship was found between session end time intervals and public EVSE type (p < 0.001). The highest contribution to the test statistic was for the time slot at 10:30 p.m.
Figure 8 depicts the density of charging station occupation for the two types of EVSE. Fast chargers are most likely in use between noon and approximately 9 p.m. compared to other times. No statistically significant relationship was found between the 30-min time slot and the EVSE type for station occupation based on the Chi-square test (
p = 0.997).
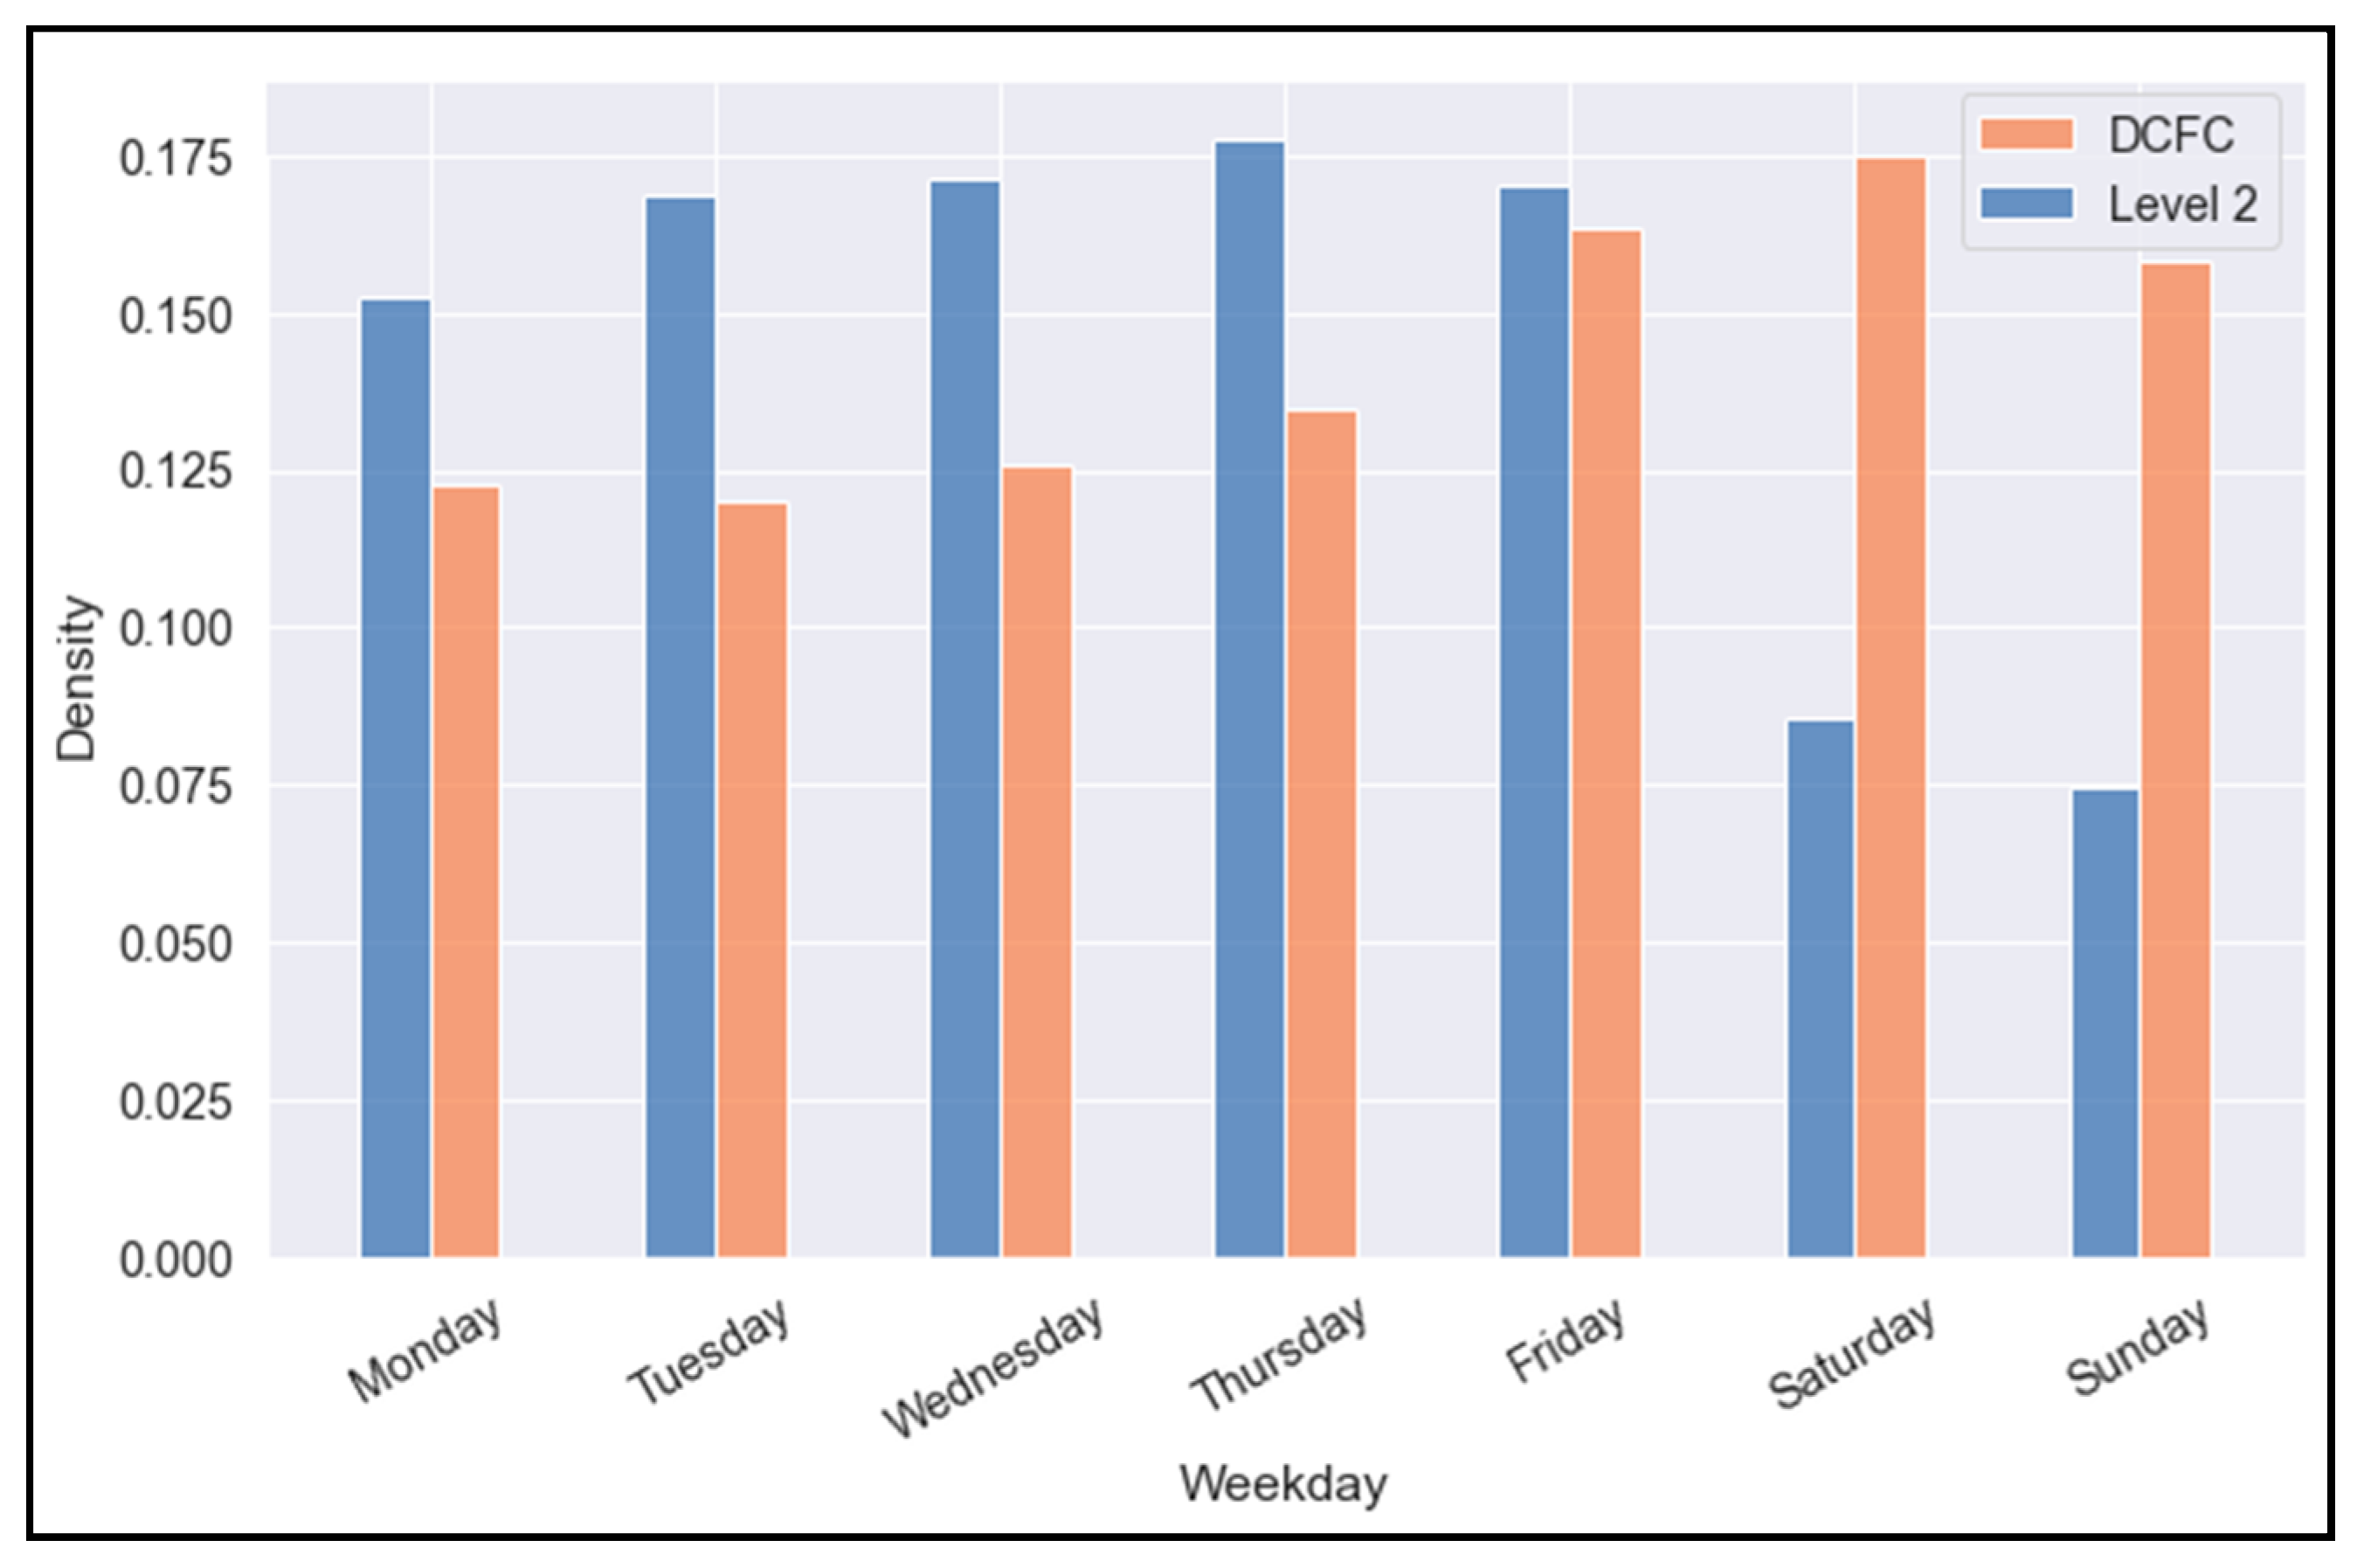
The density of sessions categorized by the day of the week for public DCFC and Level 2 is displayed in
Figure 9. The highest density of DCFC sessions was found on Saturdays, followed by Fridays and Sundays. In other words, a high percentage of DCFC events are concentrated towards the end of the week. Charging between Monday and Friday is less popular at DCFC stations than at Level 2 chargers. Conversely, DCFC demand is high on weekends when Level 2 charging is less popular. The Chi-square test statistic showed that the relationship between the day of the week and EVSE type is statistically significant at six degrees of freedom (
p < 0.001). Sunday had the highest contribution, where the lowest density of Level 2 charging can be observed.
A trend analysis was conducted for DCFC time series data by day and month for the following variables: session counts, average energy consumption, average charging duration, and average charging frequency. Similar to public Level 2 data, the Dickey-Fuller test statistic did not suggest stationarity for any of the variables in the DCFC data over time by day and month. In other words, on a daily and monthly basis, the utilization of DCFC utilization seems to follow a positive trend over time in the number of sessions (autocorrelation for months: p = 0.54, autocorrelation for days: p = 0.53), average energy consumption, (p = 0.98, p = 0.64), mean charging duration (p = 0.75, p = 0.85), and average charging frequency (p = 0.25, p = 0.23).
A seasonality analysis using temporal autocorrelation resulted in differences between public DCFC and Level 2 patterns over time. The DCFC mean duration by month showed the highest correlation with a time lag of 12 months (0.91), showing the same pattern as public level 2 charging. Differences in monthly patterns between the two EVSE types were found for session counts (0.90), mean energy consumption (0.97), and mean frequency (0.84), where the utilization of two consecutive months correlated the most. This indicates that the utilization of DCFC stations for these variables can be predicted most accurately based on the utilization of the previous months. The seasonality of session counts for both types of EVSE is depicted in
Figure 10. When looking at the daily utilization of DCFC, the autocorrelation of station counts and mean duration showed the highest autocorrelation for a time lag of seven (0.76 and 0.49, respectively). Hence, a weekly pattern at DCFC stations was found for these variables. The average frequency of DCFC charges per day showed the highest temporal correlation to the previous day (0.76).
5. Discussion
Compared to previous studies on charging behavior in the literature, this study applied a holistic, multifaceted approach to EV user charging behavior at EVSE in Canada. A novel algorithm, CHAODA, was introduced to identify behavioral differences between session samples based on anomalousness scores calculated for each charging session. Furthermore, detailed comparisons in utilization, temporal behavior, trends, and seasonality between different functional areas (i.e., residential and public chargers) and types of EVSE (public DCFC and Level 2 chargers) were assessed. For the first time, charging behavior and charging station utilization were analyzed in this manner to identify disparities between subsets based on key utilization variables (i.e., energy consumption, charging duration, plug-in duration, charging frequency, and SOC).
With respect to Research Question 1, the results revealed that residential charging sessions were related to longer charging times and higher energy consumption than public chargers and that vehicles at residential chargers remained plugged in long after active charging was completed. In combination with findings on charging times at which residential chargers are mainly used, it can be assumed that the long parking time is due to overnight charging. Electric vehicle users with access to home charging seem to predominantly charge their EVs when returning from work in the afternoon and leave their vehicles plugged in until the following day. This would also explain why the charging frequency at residential chargers is significantly higher than at public chargers during the night and early morning hours. However, a high average parking time of more than five hours was found for public Level 2 sessions, indicating that stations remain occupied for long periods although the vehicle is fully charged. Extensive parking durations reduce the available time for other users to actively charge their vehicles, consequently affecting the overall service level. It was concluded in Caperello et al. that extensive parking times and lacking etiquette inhibit users from using public charging stations [
46]. This creates a potential barrier to charging station deployment as it may negatively impact station profitability and convenience. The occurrence of long charging and parking times may also be caused by the fact that public charging in this study possibly includes workplace charging.
The findings of this study further provided evidence of an inverse relationship between public charger occupation and residential charger occupation (
Figure 3). More specifically, residential stations are most likely to be in use when public stations are not, and vice versa. The difference was most significant at noon where public sessions are more likely to be in use than residential sessions. High-demand residential and public charging times found in this study align with previous findings [
34,
47]. While previous studies have focused solely on charging session start and end times alone, this study expanded the understanding of charging station utilization based on the probability of stations being in use over the time of the day. The probability of charging station utilization throughout the day offers insights on immediate station utilization. The intensity of utilization in terms of charging demand seems to switch twice throughout the day between residential and public chargers. This switch in charging peak demand between locations aligns with the EV commuting patterns identified in the literature [
45,
48]. Accordingly, EV users commute to work between 6 a.m. and 9 a.m. and return from work around 5 p.m. These temporal patterns have important implications for electric utilities and decision-makers.
More specifically, the concentration of residential charging demand during nighttime challenges the production of the charging-based electricity demand and amplifies the electricity power production “Duck Curve” problem. The phenomenon was first discovered in California, where the non-solar electricity demand curve throughout the day follows the shape of a duck [
49]. Therefore, the “Duck Curve” issue indicates the necessity of electricity production through fossil fuels during peak demand times when there is not enough sun to produce energy [
49]. Since residential charging is predominantly undertaken at nighttime, solar as a source for the electricity needed to charge is ruled out. However, in British Columbia and Quebec, the primary source of energy exceeding 90% of their electricity generation is hydroelectric power [
50]. In areas where hydropower is not available to form part of the renewable energy mix, non-renewable energies are used to produce the energy to charge vehicles overnight. This, in return, affects the EV GHG emissions during the operation phase, impacting the life cycle emission assessment results of EVs negatively [
16,
17]. Therefore, residential charging behavioral patterns form a new “EV Duck Curve” that amplifies the previous baseline of the electricity supply “Duck Curve” issue by shifting electricity demand specifically from EVs to nighttime. Meanwhile, the residential charging demand drastically decreases during the daytime, which also exacerbates the general decline of electricity demand residentially at that time. While dynamic pricing strategies have been investigated as a possible solution, shifting electric vehicle charging behavior towards the use of public EVSE and, therefore, to daytimes could potentially ease the curve. Implementing incentives for a broad deployment of Level 2 charging stations can potentially move charging demand to times where charging with electricity from renewable energies is more likely, thus, improving the effect of EV adoption on GHG emission reduction. Future research could explore what methods can shift the charging demand toward public EVSE usage during the day and potentially mitigate the “Duck Curve” dilemma.
To address Research Question 2, differences between public Level 2 and public DCFC charging behavior were examined. By applying the novel algorithm CHAODA, fundamental differences between DCFC and Level 2 charging sessions became apparent, making a practical application of CHAODA useful in a different context. For example, electric utilities may specifically apply CHAODA on electricity demand and demand times as input variables to identify EV-owning households. This identification may better detect high-demand areas and could indicate possible grid overloads. A similar data-mining approach has been successfully applied in the literature to analyze household charging patterns [
51].
Detailed analysis and comparison of public DCFC and Level 2 data confirmed their multifaceted differences. As previously found in Morrissey et al. for charging behavior in Ireland, this study supported evidence of shorter charging duration and higher energy consumption at DCFC stations compared to Level 2 charging [
40]. Since DCFC naturally offers faster charging, this effect on charging behavior was to be expected. Shorter charging durations at DCFC allow for higher charging frequencies at this type of EVSE as it offers more distinct users the opportunity to charge their vehicle throughout the day. The DCFC data revealed that many charging sessions began with a SOC between 20–30%, presumably due to users receiving charge level warnings. A correlation between vehicles’ charge level warnings and starting SOC levels was previously indicated by Franke and Krems [
35]. However, vehicle data used in Yang et al. [
39] showed the highest number of DCFC charges starting with 0–10% SOC remaining. The higher average SOC before charging found in this study would explain the shorter charging duration compared to previous studies [
39,
40]. A high percentage of DCFC sessions ended with a SOC of around 80%, which aligns with previous findings in the literature [
38], presumably caused by the vehicle’s battery management system to maintain a high level of the battery’s state of health.
Another key finding of this study is the difference in charging times between public DCFC and public Level 2. While both types of EVSE are preliminary used during the day, the main DCFC demand period is slightly shifted to a later point during the day. In other words, fast charging demand picks up a little later than that of Level 2 and remains plateaued after Level 2 demand starts to decrease. The peak in DCFC charging mirrors charging behavior found in Sweden and Norway, where most charges were initiated between 3 p.m. and 4 p.m. [
38]. With an increasing demand for the installation of DCFC and incentives to deploy fast chargers, this could lead to an increase in the “Duck Curve” issue. In other words, the DCFC charging demand overlaps with general load peaks in the evening when EV users plug-in residentially, thus compounding the issues and drastically requiring more non-renewable power generation onboarding during the later afternoon or early evening hours. Currently, various governmental policies are targeted toward increasing the minimum required charging power of DCFC, potentially increasing peak loads even further in the future. This may result in a tradeoff between grid stability and EVSE service levels as DCFC is more convenient for users but can bear risks for the electricity grid during peak demand times. The “EV Duck Curve” effect may even be amplified by DCFC charging behavior throughout the week. Although also publicly accessible, DCFC charging does not follow the weekly patterns found for Level 2 sessions. Instead, most DCFC charging sessions occur between Friday and Sunday, with the highest number of sessions conducted on Saturday. The opposite is true for public Level 2 charging sessions. The results have further provided evidence that DCFC follows an increasing trend but is not showing the same seasonal pattern as Level 2 charging.
Concerning Research Question 3, the study also led to novel findings in charging patterns throughout the week and year for Level 2 chargers. While residential charging was found to be somewhat evenly distributed between different days of the week, there is a distinct drop in public Level 2 charging demand on weekends. These returning weekly patterns, especially for public Level 2 charging, were reflected in temporal autocorrelation at a seven-day time lag. It can be assumed that public Level 2 charging stations are more popular on weekdays because users primarily charge their vehicles at these stations while they are at work or following weekly routines. This public charging behavior should be an essential consideration for infrastructure planners and electric utilities to accurately predict and satisfy charging demand in the future while ensuring overall grid stability. In other words, grid infrastructure should be designed to handle high EV energy demand on weekdays. Furthermore, there is a general trend in EV utilization, represented by an increase in charging demand over time. This trend would also explain differences between the findings of this study and the conclusions by Morrissey et al., who found generally lower values for utilization variables [
40].
With respect to seasonal patterns, it was found that the monthly time series data of residential charging stations showed less of a seasonal pattern and is rather impacted by the behavior of the previous month. Contrarily, the results of this study revealed seasonal patterns in public EVSE charging station utilization. The number of sessions, the average energy consumption, the average duration, and the average frequency indicated seasonal user behavior with more intense utilization around November and low utilization in December and January. The winter vacation period in British Columbia and Quebec falls between December and January and may be related to lower demand during these months. A relationship between vacation times and charging demand was previously presumed in Gnann et al. [
38]. However, neither Gnann et al. nor this study investigated this potential relationship directly [
38]. While EV GHG emissions during the operation phase vary throughout the year depending on the electricity mix of the specific country, Faria et al. provided evidence that EV operation GHG emissions peak in November when electricity production through wind and solar is lower [
16]. This causes an EV efficiency dilemma as EV electricity demand reaches its peak when EV operation is least GHG-efficient. Consequently, the seasonal pattern of EVSE utilization should be considered in EV emission life cycle analyses as it can adversely impact outcomes.
Additionally, to the authors’ best knowledge, this paper is the first to analyze charging data from more than 7000 distinct charging stations, significantly surpassing data from previous studies [
46]. Yet, the analysis was limited by the specific data available for each of the station types. The SOC before and after charging was not provided for any of the Level 2 charging sessions. In return, DCFC charging sessions lacked data about the total charging time. Future research comparing total plug-in time and parking time would allow a comparison of etiquette between different types of chargers. Accordingly, a differentiation of users was not possible with the given data. Analyzing differences between charging station types and functional locations would enable an analysis of behavioral patterns on a user level. Furthermore, a more detailed classification of charging stations by venue type (e.g., curbside, commercial) was not possible. Considering functional areas as an extension of this research would add valuable insights and further increase the predictability of charging demands. Finally, the data set did not include pricing information. However, session pricing can significantly impact the utilization of charging stations.
In summary, this study analyzed a large set of EVSE charging data in Canada and provided evidence that differences in charging behavior exist between functional locations (i.e., residential and public) and EVSE type (DCFC and Level 2 charging). The findings of this study showed implications for policymakers, electric utilities, and EVSE network providers as clear patterns and behavioral seasonality emerged. Various stakeholders should use these patterns to optimize charging station deployment and allocation in a user-centered manner that considers grid stability, electricity mix, and equitability between communities. While the results of this study align with the other studies concerning general EV user behavior, this study comprehensively looks at all these previous aspects in one holistic comparison of multiple robust EV charging networks. Even though aspects of this study diverge from the literature, the growth of the network, battery capacities of new EV models, and overall EV adoption could explain these differences. Novel contributions continue to be made through the application of CHAODA and insights into the seasonality of charging behavior.


