1. Introduction
The availability and affordability of energy has an extremely important economic significance. Energy consumption is linked with economic growth and is considered an imperative of energy economics [
1]. Changes in the price of energy can affect the level of energy consumption. Wang (2022) [
2] concludes that energy consumption does not necessarily drive economic growth, and provides certain guidelines and references for regional economic development and emission reduction. The impact of energy consumption on the gross domestic product (GDP) is more pronounced in non-OECD countries due to the extensive nature of their economic development [
3]. It is estimated that the rise in international fossil fuel prices will increase the cost of living for European households in 2022 by an average of close to 7% [
4].
The geopolitical situation caused by the Russian aggression against Ukraine and the COVID-19 pandemic are burdening the global economy and leading to new shortages of materials and inputs and a sudden increase in energy costs. According to the European Central Bank (2022) [
5], inflation is expected to be more significant in emerging market economies than in advanced economies, given the greater weight of goods in the consumer baskets of emerging market economies. The COVID-19 pandemic caused an economic shock that affected private consumption and household savings in a complex way. Higher savings are largely a reflection of lower consumption, as fiscal transfers have stabilized the income of the household sector [
6]. After the COVID-19 pandemic, it is necessary balance economic recovery and reduce CO
2 emissions [
7]. The COVID-19 pandemic and the war in Ukraine indicate that the world economy is still very vulnerable and is dependent on changes in the prices of oil and other energy sources. Therefore, there is a need to quantify the effects of oil price changes and their volatility, both for developed and emerging countries [
8].
The world energy crisis can be managed by integrating renewable energy sources (RES) into electricity production [
9]. In order to protect the most vulnerable parts of society, businesses and households from the increase in energy prices, governments reduce taxes, limit energy prices and encourage the transition to RES.
The research problem of this paper is to estimate effects of the increase in world energy prices on the inflation in Croatia. Based on that research problem, the objective of this research is to estimate, in addition to the direct effects on inflation caused by an increase in the prices of energy products bought by final consumers, the increase that the rise in energy prices induces in the prices of all other goods and services in which production energy is used as intermediary input. The effects of the increase in energy prices are compared with the price effects of other exogenous shocks: the sudden growth of gross wages and salaries, the increase in the prices of manufacturing intermediate inputs and the increase in the prices of imported goods and services. To estimate the effects of the above-mentioned external shocks on the stability of the Croatian economy, an input–output (IO) price model was applied. This study fills that gap in the literature by conducting empirical research on the effects of the estimated price changes caused by the impact of external shocks on the Croatian economy. The contribution of this research is reflected in the empirical research of the current situation in Croatia caused by the increase in energy prices, which can provide guidelines for mitigating the negative effects of energy price increases in order to protect the most sensitive parts of society, companies and households. This is especially important when considering circumstances in which Croatia might adopt the EUR, as rising domestic prices could negatively affect the international competitiveness of the Croatian economy.
The remainder of the paper is organized as follows: after the introduction,
Section 2 presents a review of the recent and relevant literature on the effects of the increase in energy prices in the IO framework. The IO price model is presented in
Section 3. In
Section 4, the results of the increasing energy prices effects and the effects of other external shocks on the stability of the Croatian economy are shared. In the discussion and conclusions, policy implications and suggestions for further research are provided.
2. Literature Review
The current energy price shocks cannot be viewed in the same way as the oil price shocks in the past [
10]. Energy prices significantly affect inflation, so coordination between fiscal and monetary authorities is extremely important. The volatility of oil prices has a negative effect on the financial development and economic growth of oil importing and exporting countries. Oil exporting countries are affected by the vulnerability of oil costs [
11]. In developing countries, economic growth coupled with an increase in prices could be considered as anti-growth, and negative relationship between inflation and economic growth is found in the long and short term. The consequence of this is that oil price inflation in such countries does not have a significant favorable impact on economic growth in either the long or the short term, but raises the general level of prices in the economy [
12]. Oil price controls can only postpone the impact of oil shocks on inflation in the short term [
13]. Low fuel prices are not the main factor in the development of the country [
14]. A country, even an oil importer, can develop under higher fuel prices. Panic about high fuel prices only exacerbates the inflationary spiral. Fiscal policy should not be driven by a short-term search for opportunities to slow down inflationary processes, but, above all, by a concern for sufficiently fast economic growth, and for the current and future state of public finances.
Today, the search for a more sustainable economy is facing three distinct but interrelated shocks. The first shock is related to the costs of climate change or “climateflation”. The second shock, “fossilflation”, is linked to the inherited cost of dependence on fossil energy sources. The third category is the so-called “greenflation”. As more industries shift to low-emission technologies, green inflation can be expected to put pressure on prices across a wide range of products during the transition period [
15]. Sustainable economic development positively affects the RES deployment. The growth of GDP per capita is crucial to the consumption of renewable energy in European countries. Therefore, governments should focus more on the policies that promote economic development [
16].
A number of papers in the field of IO analysis have studied the effects of the increase in energy prices by using the IO price model. The contributions related to the impact of price changes on various national economies made using the IO price model are discussed and summarized below. Xu et al. (2022) [
17] analyzed the relationship between the energy price fluctuation and changes in economic performance under different price control scenarios by using the IO price model. Energy price fluctuation has a high transmission efficiency to the general price index in a scenario with no price regulation. The magnitude of the effect of price management is closely related to the share of energy consumption. Direct and indirect cost effects pertaining to the formation of energy prices in Greece are estimated in [
18]. The authors concluded that the largest part of energy prices is profits, mostly distributed to the energy sector. The second largest part is imports, which mainly include mining and quarrying products and coke and refined petroleum products imported from countries outside the EU. It was determined that the energy sector mainly contributes to the formation of industrial sector prices. By using the IO price model, in [
19], the impact of an increase in the energy price, namely an increase in the price of oil and gas extraction, oil and coal products, electricity and utility gas was estimated. The results indicate that increased energy prices usually increase the production costs for tradable, less labor-intensive manufacturing, in transportation and in the agricultural sub-industries. The impact of the increase in energy prices is the least pronounced in service activities. A cost transmission capacity IO price model was used to analyze how coal and electricity linkage reforms prices [
20]. The results of the analysis indicate that coal price shocks have greater effects on the energy sectors than on other economic sectors.
Versions of the IO model were applied in the analysis of energy price fluctuations. The transmission effect on the Chinese economy caused by coal price fluctuations was analyzed based on a non-competitive IO model in [
21]. The coking sector has the largest price variation, and the agricultural services sector the smallest one. Short-term inflation can be significantly mitigated by controlling domestic electricity and heating prices. In [
22], a non-competitive IO model was applied to estimate the inflationary and distributional effects of fossil energy price fluctuations in China. The authors concluded that a change in the price of coal leads to a regressive impact, while a change in the price of crude oil leads to a progressive one. By using the IO price-side model, it was found that a 10% increase in production prices in the mining sector in China raises the overall price level by 0.12–0.17% [
23]. The impact of fluctuations in the prices of oil and oil derivatives on the Iranian economy was analyzed using the IO model [
24]. The multilateral increase in the domestic prices of energy and oil-based products affects changes in all sectors. A 1% price change for local energy products is followed by a 5% price change for most products.
Apart from the standard IO model approach, studies have used IO models and their extensions to determine the impact of energy price changes on national economies. The stock-flow consistent approach with an IO model to simulate the economic and financial implications of an energy technology transition involving a reduction in energy return on investment was applied in [
25]. Econometric and IO models were applied to estimate the impact of an oil price shock on the tax revenue, employment, labor income and GDP of the Malaysian economy [
26]. A general equilibrium model and IO tables were applied to examine the impact of lower global prices of oil and agricultural products and government expenditures on the overall economy of Malaysia [
27]. An oil-economy computable general equilibrium model based on IO data was applied to simulate and evaluate the effects of increases and decreases in oil prices on China’s industrial sectors [
28]. By using the hypothetical extraction method and the multiregional IO model, the short-term effects of international trade disruptions caused by the Russian military operation in Ukraine on the production of 189 economies were analyzed in [
29].
3. Research Methodology
The estimation of the economic effects of the increasing energy prices and their comparison with the effects of other external shocks on the stability of the Croatian economy in this paper are based on the IO methodology. The IO method is a macroeconomic method that enables the analysis of the interdependence of economic sectors in a national economy [
30,
31]. The entire production system is observed through a certain number of economic sectors among which flows of goods and services are recorded. The interdependence of the economic sectors is represented by technical coefficients that present the share of the intermediate inputs delivered by one sector required to produce a unit value of output in another sector.
The detailed structure of inputs for each productive sector enables the calculation of the effects of a change in the price of one of the inputs on the total price of the delivered product. It is assumed that the production unit can completely transfer the input price increase to the buyer of the good or service. According to the model of price increase transmission through cross sectoral dependence, the initial change in the price of a certain input is included in the price of each sector according to the share of that input in the unit price of the sector’s product. As each sector increases its price level due to the initial price change of a certain input, the price at which all other units have to purchase the product increases. The initial change in the price of only one factor of production is reflected in changes in all of the prices in the economy.
In the IO model, the price that each productive sector receives per unit of output equals the total expenditure incurred during its production. Expenditures include payments for inputs purchased from the same and other productive sectors and value added. Considering an economy divided into
productive sectors, the main equations describing prices determination in the IO model are:
where
represents the output of sector
,
intermediates from sector
to sector
,
is the price of commodity
,
is the primary input to sector
and
is the factor price of the primary input. The input coefficients for the domestic intermediates are defined as:
and the input coefficient for primary input as:
By introducing input coefficients for the domestic intermediates and for the primary input, the system of Equation (1) changes to:
By dividing each equation of the system by
, gives:
The system of Equation (5) in matrix form can be written as:
where
is a column vector of the product prices for each of
domestic sectors,
v is a column vector of input coefficients for the primary input,
is the square
-by-
matrix of technical coefficients and
is a diagonal matrix with the unit factor price for the primary input.
Equation (1) transforms into:
describing that part of the price that remains available to pay for primary inputs equal to the difference between the total price of a sector’s products and the value of the intermediate inputs used.
The solution to the system (7), where
is the
-by-
identity matrix is:
Therefore, the product prices for each of the domestic sectors are equal to the product of the transposed Leontief inverse matrix
and the product of unit prices and input coefficients for the primary input
. The column vector
is usually expressed in the form of a price index. One can find a more detailed discussion of the price model in the IO framework in [
32,
33].
The column vector presents the new price level for n economic sectors because of the change in the unit factor price for the primary input . The increase in the prices of goods produced by different economic sectors is not linear. The sectors that require a greater quantity of those primary inputs whose prices changed for their production processes will also include the price increases of those primary inputs in the prices of the final products delivered to the final consumers. An increase in the price levels in various economic sectors results in an increase in expenditures on components of final demand: personal consumption, government consumption, investment and exports. The structures of various components of final demand are different, and the total increase in the prices for each of the components of final demand is calculated by multiplying the column vector p and the row vector w containing the elements that represent the shares of each sector in the individual component of final demand. Each component of final demand has a different structure of expenditures, and, therefore, the specific row vector differs for different components of final demand (personal and government consumption, investments and exports).
4. Research Results
4.1. Energy Prices Trend and Inflation in Croatia
According to the Croatian Bureau of Statistics (
https://dzs.gov.hr/ (accessed on 23 October 2022)), the weight of energy products in the basket of goods and services bought by an average Croatian household was 16.8% in 2022. Therefore, trends in the global energy prices could significantly impact inflation, as measured by the consumer price index (CPI), and, consequently, the living standards of Croatian citizens.
Figure 1 presents long-term trends in energy prices and inflation in Croatia. It can be noticed that inflation in Croatia recorded a relatively smooth pattern in the period analyzed, while energy prices showed more volatile track. From 2000 to 2020, the average annual growth rate of the CPI was 2.1%. In the same period, the average annual growth rate of energy prices was 3.2%. In the “normal” periods of stable economic growth without the presence of any political or economic disorder on a global level, energy prices usually grew at higher rates than those of other goods and services because of an increase in global demand coupled with a limited supply. Energy prices were highly sensible to the global economic situation, and a decrease in demand in recession periods could result in significant reductions in energy prices, as recorded in 2008/2009, when, in only six months, energy prices dropped to one third of the prerecession prices. After a period of stable economic growth coupled with the recovery of energy prices in the period from 2010 to 2014, in 2015/2016 a collapse in oil prices was driven by a growing supply, especially by the booming USA shale oil production. A growing demand again resulted in the revival of energy prices in the period from 2016 to 2019, while restrictions in human mobility and the sudden drop in global economic activity caused by COVID-19 negatively affected energy prices in 2020.
The global increase in energy prices started in 2021 due to growing international demand. Russia’s war against Ukraine and climatic conditions further worsened the situation on the international market.
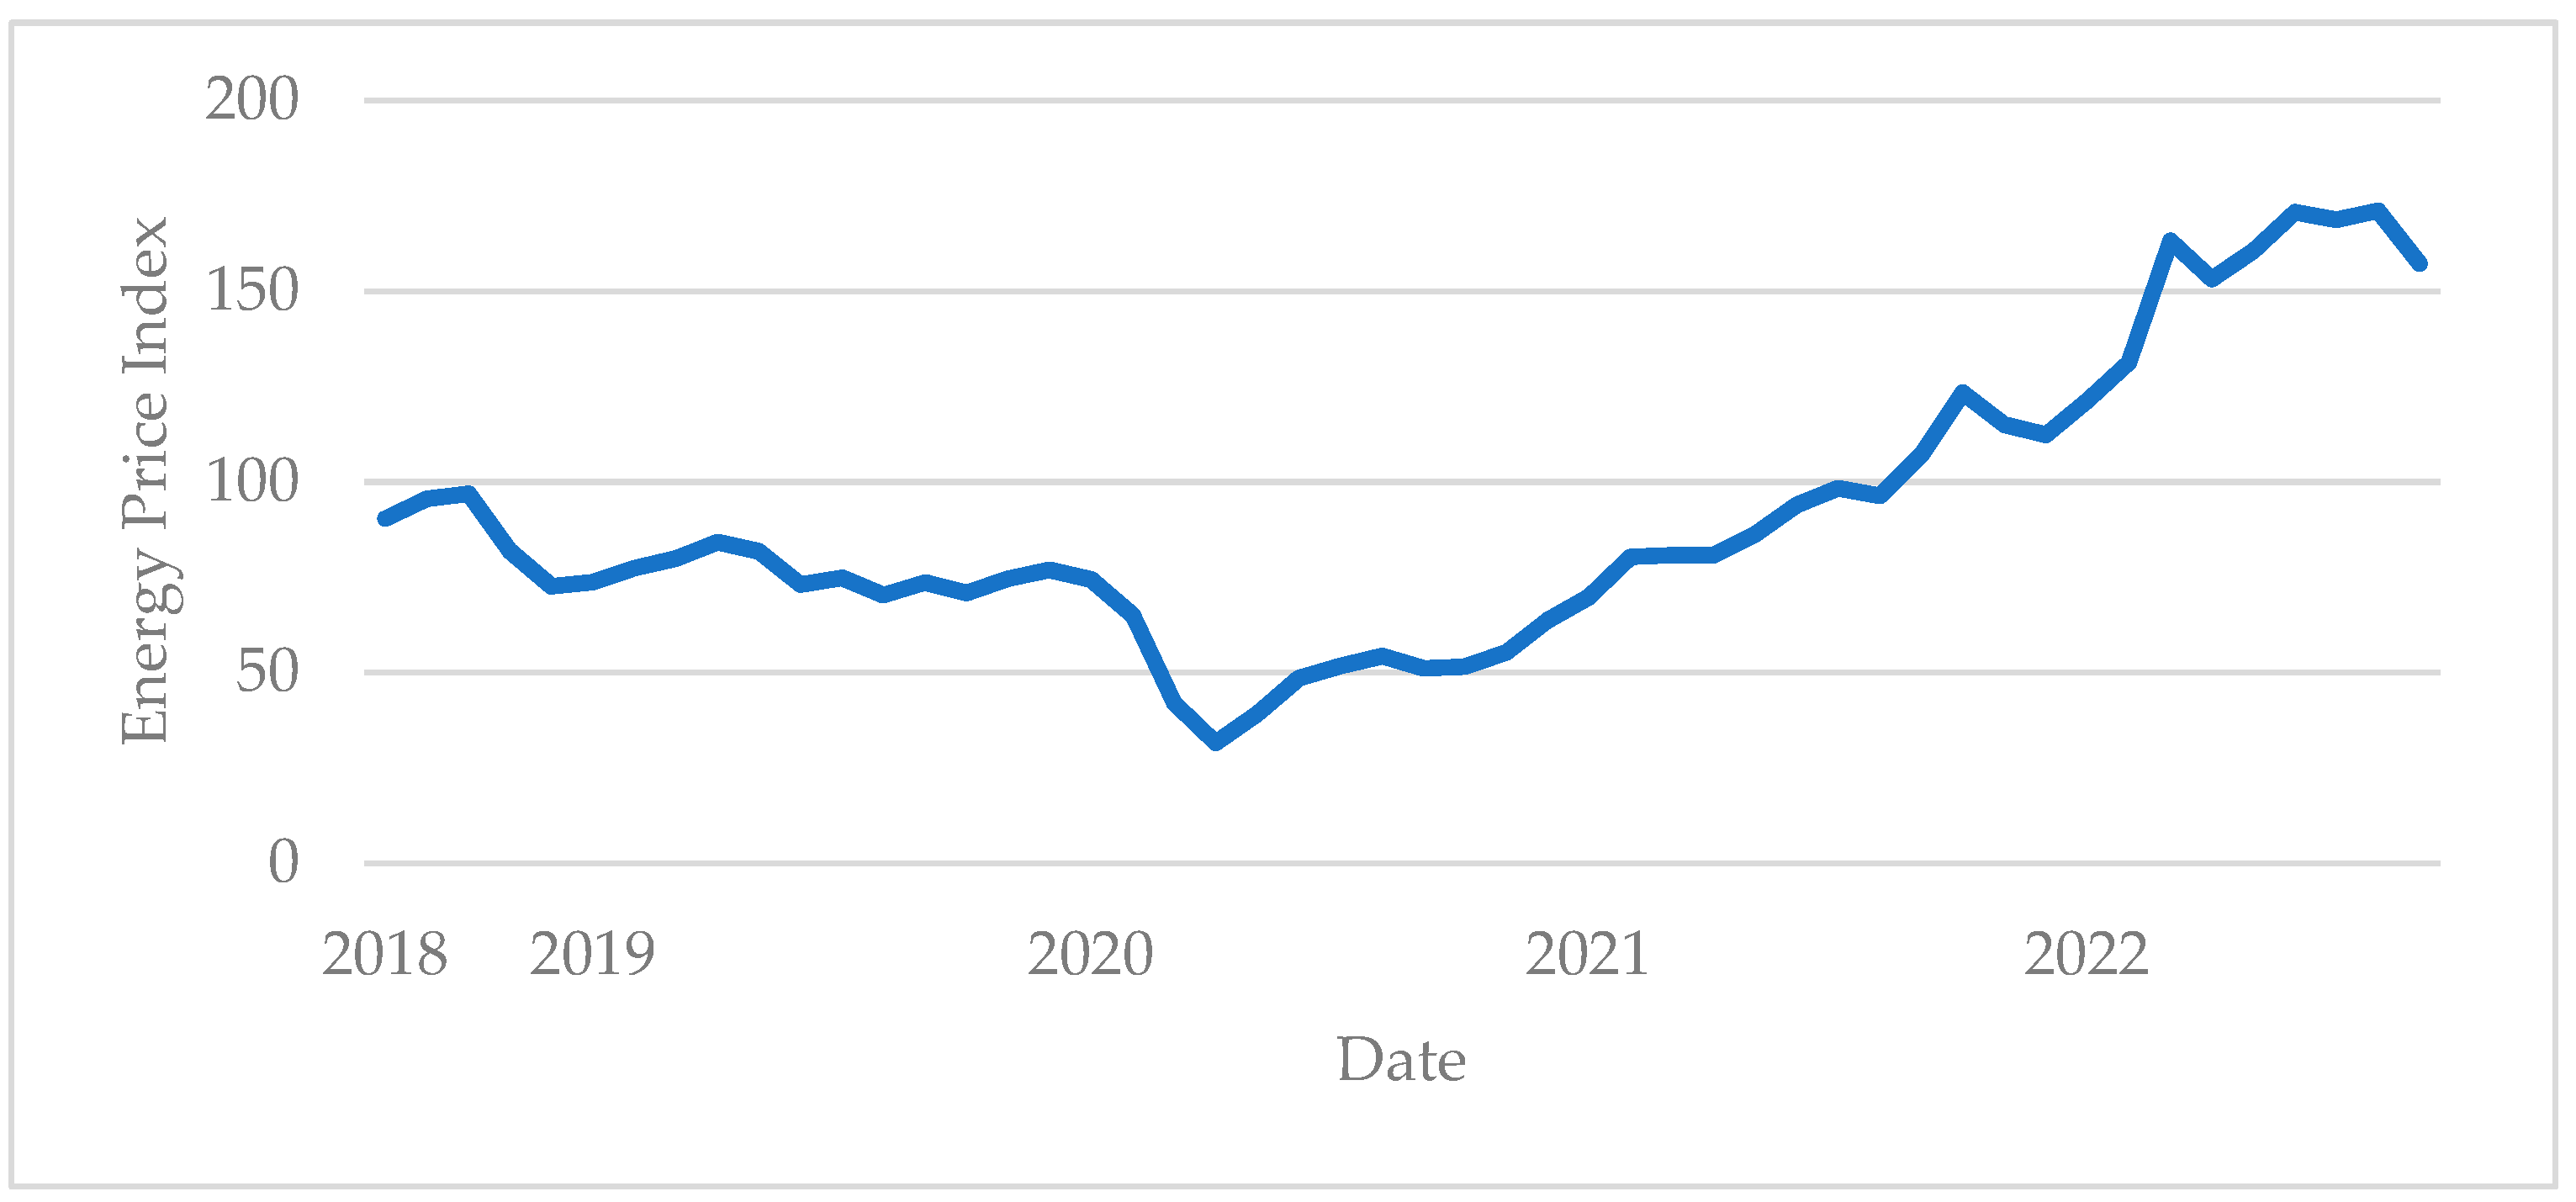
Figure 2 shows the Energy Price Index trend for the period from 2018 to 2022. In the period before the COVID-19 pandemic, the average Energy Price Index was 68, and it reached its highest value of 171 in August 2022. In relation to 2021, in 2022, the estimated growth of energy prices on the world market was 63%.
This increase in energy prices also resulted in a significant increase in inflation, especially in European countries. Thus, after a long-term, stable price growth rate in Croatia of 2.1% (average for the period from 2000 to 2020), the average inflation in the first nine months of 2022 amounted to 9.2%, with an upward trend. In August and September 2022, it was almost 13%, despite the government measures that limited the growth of the prices of oil derivatives, electricity and gas, and reduced the taxation of energy products.
4.2. The Effects of the Increase in Energy Prices on Prices in the Croatian Economy
In addition to the direct negative effect on inflation, and due to the increase in the energy prices of goods intended for final demand, the increase in energy prices significantly affects the indirect increase in price of other goods and services in the production of which energy is a production input. In this research, the main data source is the symmetric IO table for the Croatian economy for the year 2018, the last published Croatian IO table, downloaded from
https://ec.europa.eu/eurostat/databrowser/view/naio_10_cp1700/default/table?lang=en (accessed on 19 October 2022) [
34]. Based on the methodology described in the previous chapter and the IO table for 2018, the results for the effects of the increase in energy prices on various production sectors and on the overall Croatian economy are presented below. The direct and indirect effects of the increase in energy prices on the product prices for each productive sector were calculated according to Formula (8). It should be noted that the increase in energy prices on the global market does not have to be fully passed on to the final consumers. Although the most important input is the distribution of energy from the world market to the final consumer, there are also many other inputs, such as the various production inputs used in the processing and distribution channel, employee salaries and company profits, that do not have to be directly related to the price of energy on the global market, but vary with physically distributed quantities. Thus, a global increase in energy prices of 63% results in increases in the price of energy delivered to domestic consumers in the range of 46.2 to 48.7%, depending on the type of energy product.
Producers of other non-energy products and services will also have to raise the prices of their products due to the increase in the price of significant inputs, depending on the importance of energy in their production processes. In the group of other sectors, the increase in the price of the energy input will have the greatest effect on various types of transport, machine repair and certain services such as travel agencies, apartment rental activities, trade, legal and accounting services and public services in which space heating and cooling is a relatively significant input.
Figure 3 shows the sectors of the Croatian economy on which the increase in the prices of primary inputs on the world market of 63% for the activities of mining and the production of oil derivatives and electricity has the greatest effect.
Since these are inputs whose availability in Croatia is limited, any disturbance in the world market is reflected in the domestic economy, and there is no possibility of amortizing such effects through economic policy measures. According to the results of the analysis, the increase in energy prices has almost no effect on the sectors of individual public and personal services (activities of private households, postal and financial services, real estate business).
Different categories of final demand have a different share of energy expenditure, and thus are differently sensitive to the increase in energy prices on the global market. The price increase for the categories of final demand is calculated by multiplying the product prices for each productive sector obtained according to Formula (8) and the expenditure structure of each of the components of final demand . According to the results of the IO price model, the total expenditures on domestic products for personal consumption would increase by about 4.2%.
The increase in the prices of mining and the production oil derivatives and electricity has a direct impact on domestic prices for all categories of final demand (
Figure 4). The impact on import prices is only not expressed in terms of investments. Its impact on the total price index that final consumers pay for domestic and imported products is most pronounced in the prices of goods and services purchased by the household sector. The average price of all goods and services purchased by households available on the Croatian market, both domestic and imported, would increase by around 4.4%. It is interesting to note that, according to the results of the IO model, the increase in energy prices explains only 50% of the total inflation in Croatia in 2022 (4.4% compared to a total of 9.2% price growth on average in the first nine months of 2022). This supports the idea that there is a demonstration effect, and that some of the domestic producers used the increase in energy prices to increase their own prices in order to increase their profits.
While the increase in energy prices has a smaller effect on the total prices of goods and public services investment, it can be observed that the prices of Croatian export products are relatively sensitive to the increase in energy prices. Thus, an effect of 4.2% can be observed on the level of total export prices, only slightly lower than the effect on consumer prices.
4.3. Sensitivity Analysis—Effects of Different Types of Exogenous Shocks on the Prices in Croatian Economy
The intensity of the increase in global energy prices has been compared with other external shocks that can affect the price level of goods and services in the Croatian economy. Beside the modest and actual energy price shocks, the sensitivity analysis includes the following three scenarios of exogenous shocks:
Actual energy price shock in 2022 (increase in global prices +63%);
Modest increase in global energy prices (+10%),
Linear growth in gross wages and salaries (+10%) due to labor shortages or the improved bargaining power of labor unions;
Linear increase in import prices (+10%) due to exchange rate depreciation or other factors which affect global prices;
Increase in input prices for the manufacturing industry (+10%) due to shortages of certain inputs on the global market or broken supply chains.
An analysis has been conducted on the level of 64 IO economic sectors, but the results are presented in tabular form for composite sectors in
Table 1.
As
Table 1 demonstrates, the Croatian economy is less sensitive to a modest energy price shock in comparison to the other potential exogenous shocks. This is primarily related to the more favorable position of Croatia in terms of self-sufficiency in energy inputs (gas, oil and energy) in comparison to other European economies. In addition, the Croatian economy is more service oriented, with a high share of tourism and services that are less dependent on the availability of energy inputs. The share of the manufacturing industry, characterized by its high energy intensity, in Croatian economy is significantly lower than that of some other new EU members, such as Slovakia or Poland, where economic growth is based on the export of manufacturing products. Thus, the elasticity of the total price level upon an increase in energy prices in Croatia is relatively low, and an increase in global energy prices of 10% will induce an increase in the prices of final goods and services of a relatively low 0.5%.
Due to its economic structure and the significant share of services in the total gross value added, the Croatian economy is highly sensitive to the increase in labor costs. Labor shortages and an improved bargaining power for labor unions resulting in a 10% growth in wages and salaries (with a constant level of prices for other inputs) would instantly increase the overall price level in Croatia by 4.32%.
Figure 5 shows the production sectors with the smallest and largest price increases due to a hypothetical 10% increase in gross wages and salaries. The prices of goods and services that do not require a high direct or indirect labor input would not change significantly. The smallest increase in price caused by an increase in gross wages and salaries of 10% would be recorded in the price of imputed housing rent, given that it is an imputed item that has no direct labor input or high intermediate consumption. The production of oil derivatives, which in the entire production chain does not require a high labor input, would have a small price increase of only 1.7%. In the case of agricultural products, the largest part of the gross value added consists of mixed income (the income of individual farmers), and the increase in the gross wages and salary for engaged employees does not significantly affect the production costs. The biggest increase in prices would be recorded in the service industries, where wages and salaries constitute a large share of the production value. Examples include the education sector, with a price increase of almost 8%; employment services, with an increase of 9.2% and the activities of private households, which would record a price increase of as much as 10%. It should also be noted that, with an increase in the average gross wages and salaries of 10%, the total price level of domestic products for final household consumption would increase by 3.7%.
An increase in import prices due to potential exchange rate depreciation or other factors that affect global prices and an increase in the global prices of the inputs used by the Croatian manufacturing industry have similar effects on the prices. However, the sectoral effects of these two shocks are different. The effects of the increase in the prices of manufacturing inputs are concentrated among manufacturing goods and services, where the prices of final goods are expected to increase in range from 6.69% (food and textile industry) to 7.67% (manufacture of chemicals, rubber, plastic, metal and other intermediary inputs). On the other hand, the sectoral variations in the linear increase in import prices are less pronounced, although the prices of manufacturing products are expected to record higher increases than those of services.
In addition to the level of total prices in the Croatian economy, the effects of exogenous shocks differ significantly at the level of individual categories of final demand.
A comparison of the total price level for each of the components of final demand in case of changes in the production input prices is shown in
Table 2. The increase in the level of gross wages and salaries in the domestic economy has no direct impact on import prices, and the total price index that final consumers pay for domestic and imported products is slightly lower than the price index of domestic products. The increase in gross wages and salaries mostly affects the trends in the prices goods and services purchased by the government, with a high share of labor in the gross value added. In total, more than half of the 10% increase in wages and salaries is reflected in the prices paid by the government, while, for other final demand components, the effect is somewhat smaller.
In contrast to labor prices, the increase in import prices has the smallest effect on the government sector, which in consumption contains a smaller share of direct and indirect expenditures for the purchase of goods of imported origin. The increase in import prices mostly affects the increase in the prices of investment goods. In addition to the 10% increase in import prices for direct purchases of imported machinery and equipment, the increase in prices through the use of imported materials also affects the increase in the prices for producers of domestic investment goods by approximately 2.6%. The average price of all investment goods available on the Croatian market, both domestic and imported, would increase by around 4.3%. A slightly higher effect of almost 5% can be expected at the level of total export prices. The last part of
Table 2 is related to the 63% increase in the prices of mining and oil derivatives and electricity, which corresponds to the real increase in global energy prices in 2022. The increase in the prices of these inputs is mostly reflected in the prices of export products and in the prices of goods and services purchased by the household.
5. Discussions and Conclusions
A major energy crisis caused by rising oil, gas and electricity prices hit the global economy in 2021/2022 and caused economic disruptions. To assess the economic effects of energy prices and other external shocks on the stability of the national economy, the IO price model has proven to be a powerful tool [
19,
20,
21,
22]. The application of the IO price model to the Croatian economy reveals that the increase in energy prices, besides having direct negative effects on inflation in Croatia, also induces indirect effects related to increases in the prices of other goods and services that use energy as intermediate input in their production. The increase in global energy prices by 63% in 2022 resulted in rising producer prices in the electricity, gas, steam and air conditioning sector, with an increase of 48.7%; in the coke and refined petroleum sector, with an increase of 48.4% and in the mining and quarrying sector, with an increase of 46.2%. Since these are inputs whose availability in Croatia is limited, any disturbance in the world market is reflected in the domestic economy, and there is no possibility of amortizing such effects through economic policy measures. As shown in the methodological part of the paper, the rise in the prices of primary inputs such as energy, in addition to its direct effect on the energy sectors, also results in indirect effects; that is, it spills over to all other sectors of the national economy that directly or indirectly use energy in their production processes. Therefore, the increase in energy prices also indirectly has a significant impact on transportation, machine repair and various service activities such as travel agencies, apartment rental activities, trade, legal and accounting services and public services where energy is used for the heating/air conditioning of working premises. The effects on manufacturing industry in Croatia are limited because of the dominant share of traditional industries, such as the food and textile industries, which are less energy intensive than technologically more sophisticated economic sectors (for example, the car industry and the production of machinery and other metal products).
In terms of final demand categories, the increase in energy prices mostly affects the increase in the prices of goods and services for personal consumption purchased by the household sector and Croatian export products. The sudden linear increase in the level of gross wages and salaries has the most significant effect on the prices of goods and services purchased by the government and the least significant effect on exports. The sudden increase in import prices could induce the most significant increase in the prices of the investment goods and the least in government expenditures. The presented results are in line with the findings in [
33] considering the components of final demand that are least and most affected by the increase in energy prices and other exogenous shocks that can affect changes in the national economy.
The actual intensive energy shock in 2022 has serious consequences for Croatian inflation, and the extracted effect of the energy shock on the level of total prices in Croatia amounts to more than 4%. The actual increase in consumer prices in Croatia in 2022 was much higher, and energy price shock explains about one third of the total inflation. However, what the applied method of input–output analysis cannot measure exactly is the indirect demonstrative effect of this shock. Many domestic producers raised their own prices above the level that the energy intensity of their business processes would objectively require. On the other hand, the bargaining power of workers in both the private and public sectors in Croatia has significantly increased due to the lack of labor force caused by emigration to other EU members with higher salary levels. It is obvious that there is a danger that the initial supply shock related to the price of energy products, through price adjustment mechanisms is transferred to the prices of other products and wages. Thus, energy price shock will ultimately result in a much higher price level for many goods and services, which may ultimately threaten the overall competitiveness of the Croatian economy.


