Article

Study of the Influence of Dynamic and Static Capillary Forces on Production in Low-Permeability Reservoirs

1
State Key Laboratory of Shale Oil and Gas Enrichment Mechanisms and Effective Development, China Petroleum and Chemical Corporation, Beijing 100083, China
2
Research and Development Center for the Sustainable Development of Continental Sandstone Mature Oilfield by National Energy Administration, SINOPEC, Beijing 102206, China
3
School of Energy Resources, China University of Geosciences (Beijing), Beijing 100083, China
4
Exploration and Development Research Institute of PetroChina Changqing Oilfield Company, Xi’an 710018, China
*
Author to whom correspondence should be addressed.
Energies 2023, 16(3), 1554; https://doi.org/10.3390/en16031554
Submission received: 14 November 2022 / Revised: 19 December 2022 / Accepted: 20 January 2023 / Published: 3 February 2023
(This article belongs to the Topic Fluid Mechanics)

Abstract

:
Low-permeability reservoirs have strong heterogeneity, and the production prediction based on traditional seepage model is not accurate enough. The dynamic capillary-force seepage model can characterize the dynamic heterogeneity of seepage and more accurately describe the oil–water flow process. In this paper, the calculation formula of the dynamic capillary force is obtained through a real low-permeability core experiment, and the seepage model of dynamic capillary force is established. Based on the model, the authors quantitatively study the effects of formation pressure, heterogeneity and production speed on dynamic capillary force through numerical solutions. It is found that compared with the traditional static capillary-force seepage model, the dynamic capillary-force seepage model makes the predicted water cut increase and the recovery factor decrease. With the increase in development time, formation pressure and production rate will make the effect of dynamic capillary force more obvious. According to the comparison of heterogeneous reservoir models, results show that the horizontal heterogeneity will strengthen the dynamic capillary-force effect, while the vertical heterogeneity will weaken the dynamic capillary-force effect. In the range of research parameters, the recovery ratio predicted by the dynamic capillary-force seepage model can be reduced by 4.7%. A new oil–water seepage model is proposed, which can characterize the spatial difference and dynamic change of low-permeability reservoirs with time. It is of great significance for describing the remaining oil distribution of low-permeability reservoirs in detail and making decisions on efficient EOR measures.

1. Introduction

Low-permeability reservoirs have a small pore throat radius and obvious capillary force. The water-injection mode has achieved good results in the development of low-permeability reservoirs. How to further improve the production of low-permeability reservoirs is the research hotspot. With the development process of low-permeability reservoirs entering the middle and late stage, it is found that the predictive distribution of remaining oil from numerical simulation is different from the actual situation. The actual development effect is worse than that predicted by numerical simulation. The inaccurate description of capillary force is one of the important reasons for this situation [1,2]. In traditional seepage theory, capillary force is a function of wetting-phase saturation, and its value is equal to the pressure difference between oil and water in equilibrium state. However, under the actual reservoir conditions, oil and water are always in flowing states. Research has confirmed that the value of the capillary force is not only related to the saturation (static factor) but also related to the flow velocity (dynamic factor) [3,4]. In high-permeability reservoirs, pore radius is large and capillary force is small, so the influence of dynamic capillary force is usually ignored. However, in low-permeability reservoirs, pore radius is small and capillary force is large. The dynamic capillary force caused will have a certain impact on the seepage. Therefore, using the traditional static capillary force to describe the reservoir seepage will produce error, which will affect the distribution of remaining oil and development parameters. To improve the development effect of low-permeability reservoirs, it is necessary to systematically study the impact of dynamic capillary force on the production of low-permeability reservoirs [5,6].
Scholars have carried out some theoretical research work around dynamic capillary force. Hassanizadeh proposed the dynamic capillary force first [7]; he found that if the contact surface of oil and water is not balanced, the value of dynamic capillary force is constantly changing. The dynamic capillary force is not only related to the saturation of the wetting fluid but also to the velocity [8]. Joekarniasar, V. found that the viscosity ratio between two-phase fluids can affect dynamic capillary forces [9]. Wang, S. analyzed the influence of formation pressure on dynamic capillary force [10] and Helmig, R. studied the influence of heterogeneity on dynamic capillary force [11]. These studies confirm that velocity, formation pressure, and heterogeneity are important factors affecting dynamic capillary force, but the mechanism of dynamic capillary force is complex. It is better to describe dynamic capillary force based on a specific type of reservoirs [12,13].
The current theories of dynamic capillary force do not pay enough attention to the low-permeability reservoir [14,15]. It is necessary to study dynamic capillary force based on low-permeability reservoirs. Therefore, the authors tested the dynamic and static capillary forces through low-permeability cores from the Changqing oilfield and established a seepage model considering the dynamic capillary force. Then, the numerical simulation method is used to systematically analyze the influence of dynamic capillary force on water cut and oil recovery in a low-permeability reservoir.

2. Methodology

2.1. Calculation Method of Dynamic and Static Capillary Force

The capillary force is determined by the interfacial tension, reservoir wettability, and pore throat radius, and its calculation formula is:
P c = 2 σ cos θ r ,
where the oil–water interface is in equilibrium state, and the capillary force is static. According to the traditional capillary force theory, the static capillary force is a function of the saturation of the wetting phase [16,17], that is:
P c = P o P w = f ( S w e t ) ,
where the oil–water interface is in non-equilibrium state, that is, the oil and water are flowing. Then the capillary force is not only a function of the saturation of the wetting fluid, but also is affected by the change velocity of the saturation of the wetting-phase fluid with time [18,19]. That is:
P c = P o P w = f ( S w e t , S w e t t ) ,
Some authors with a view to accommodating a more complete description of the system under non-equilibrium conditions established a new formula [14,20]:
P c , d y n = P o P w = P c , s t a t + τ S w e t t ,
where p c , d y n is the dynamic capillary force, and p c , s t a t is the static capillary force. According to Equation (4), P c , dyn P c , stat and S w t conform to a linear relationship. When they are fitted as a straight line, the slope of this line is the dynamic capillary-force coefficient (τ) [21], which is related to the rock and fluid properties, such as permeability, porosity, viscosity, density, wettability, matrix type, and so on. Due to the complexity of τ, its value is usually determined by fitting the experimental results [15].

2.2. Measuring Method of Static and Dynamic Capillary Force

The static capillary force’s measuring methods include the mercury intrusion method, semi-permeable diaphragm method, etc. It is measured when oil and water reach equilibrium, there is no seepage, and the saturation no longer changes with time. Traditional numerical simulations use the static capillary-force curve. On the contrary, the dynamic capillary force is measured under the nonequilibrium condition that the fluid is flowing. Influenced by the flow, the saturation is changing with time and its value is different from that in the equilibrium state. Reservoir development is a process of fluid flowing at all times. The closer to the wellbore, the higher the fluid flow velocity. So, there is no doubt that the dynamic capillary force is more consistent with the real state of the reservoir. A dynamic capillary-force model used in reservoir numerical simulation will make the description of the remaining oil more accurate.
The capillary force experimental cores are from the Chang 8 reservoir of the Xifeng Oilfield, Changqing, China, with a length of 7.00 cm and a diameter of 2.54 cm. They are weak water-wetness and their permeability and porosity are 41.71 mD and 18.86%, respectively. The experiments were carried out at 25 °C. The viscosity of oil is 4.0 mPa·s, and the salinity of water is 38,000 mg/L.
In this paper, the semi-permeable diaphragm instrument is used to measure the static capillary force, as shown in Figure 1. Based on the basic principle of semi-permeable diaphragm method, we designed experimental equipment with semi-permeable membranes and pressure sensors to measure the dynamic capillary force, as shown in Figure 2.
First, we saturated the core with water. We weighed the core before and after the saturation operation to obtain the initial water volume. Then, we put the core into the experimental device with a semi-permeable membrane (Figure 1) and displaced the water with oil under the designed pressure until it reached the equilibrium state (no water was produced for 12 h). At this time, we recorded the produced water volume and calculated the water saturation of the core. Then, the pressure was raised for the next experiment to get the water saturation and the static capillary force under each pressure and finally drew the static capillary-force curve.
The pressure resistance of the pump can reach 35.0 MPa, and the accuracy of the monitoring system can reach 0.0001 mL. Eight small pressure sensors with semi-permeable membrane are uniformly arranged along the core holder, which can measure the saturation and pressure of points. In Figure 2, for the semi-permeable membrane sensor on one side, the oil phase can pass through but the water phase cannot, so they can measure the pressure of the oil phase, but another semi-permeable membrane sensor is opposite and they can measure the pressure of the water phase. It should be noted that to avoid the influence of gravity, the sensors are connected horizontally rather than vertically during the actual experiment.
Next, the core is placed in the core holder; the experimental equipment is connected. The confining pressure is increased to 8.00 MPa; the core is vacuumized and saturated with water and oil in turn. Based on the testing principle of the non-equilibrium state method, the constant velocity water displacement is carried out, and the saturation and corresponding dynamic capillary force at different sections and times are monitored with the sensors. We changed the displacement flow rate from 0.01 mL/min to 0.03 mL/min and 0.05 mL/min, calculated the water saturation and corresponding dynamic capillary force at different flow rates, and drew the dynamic capillary-force curve at different flow rates.

2.3. Capillary-Force Test Results

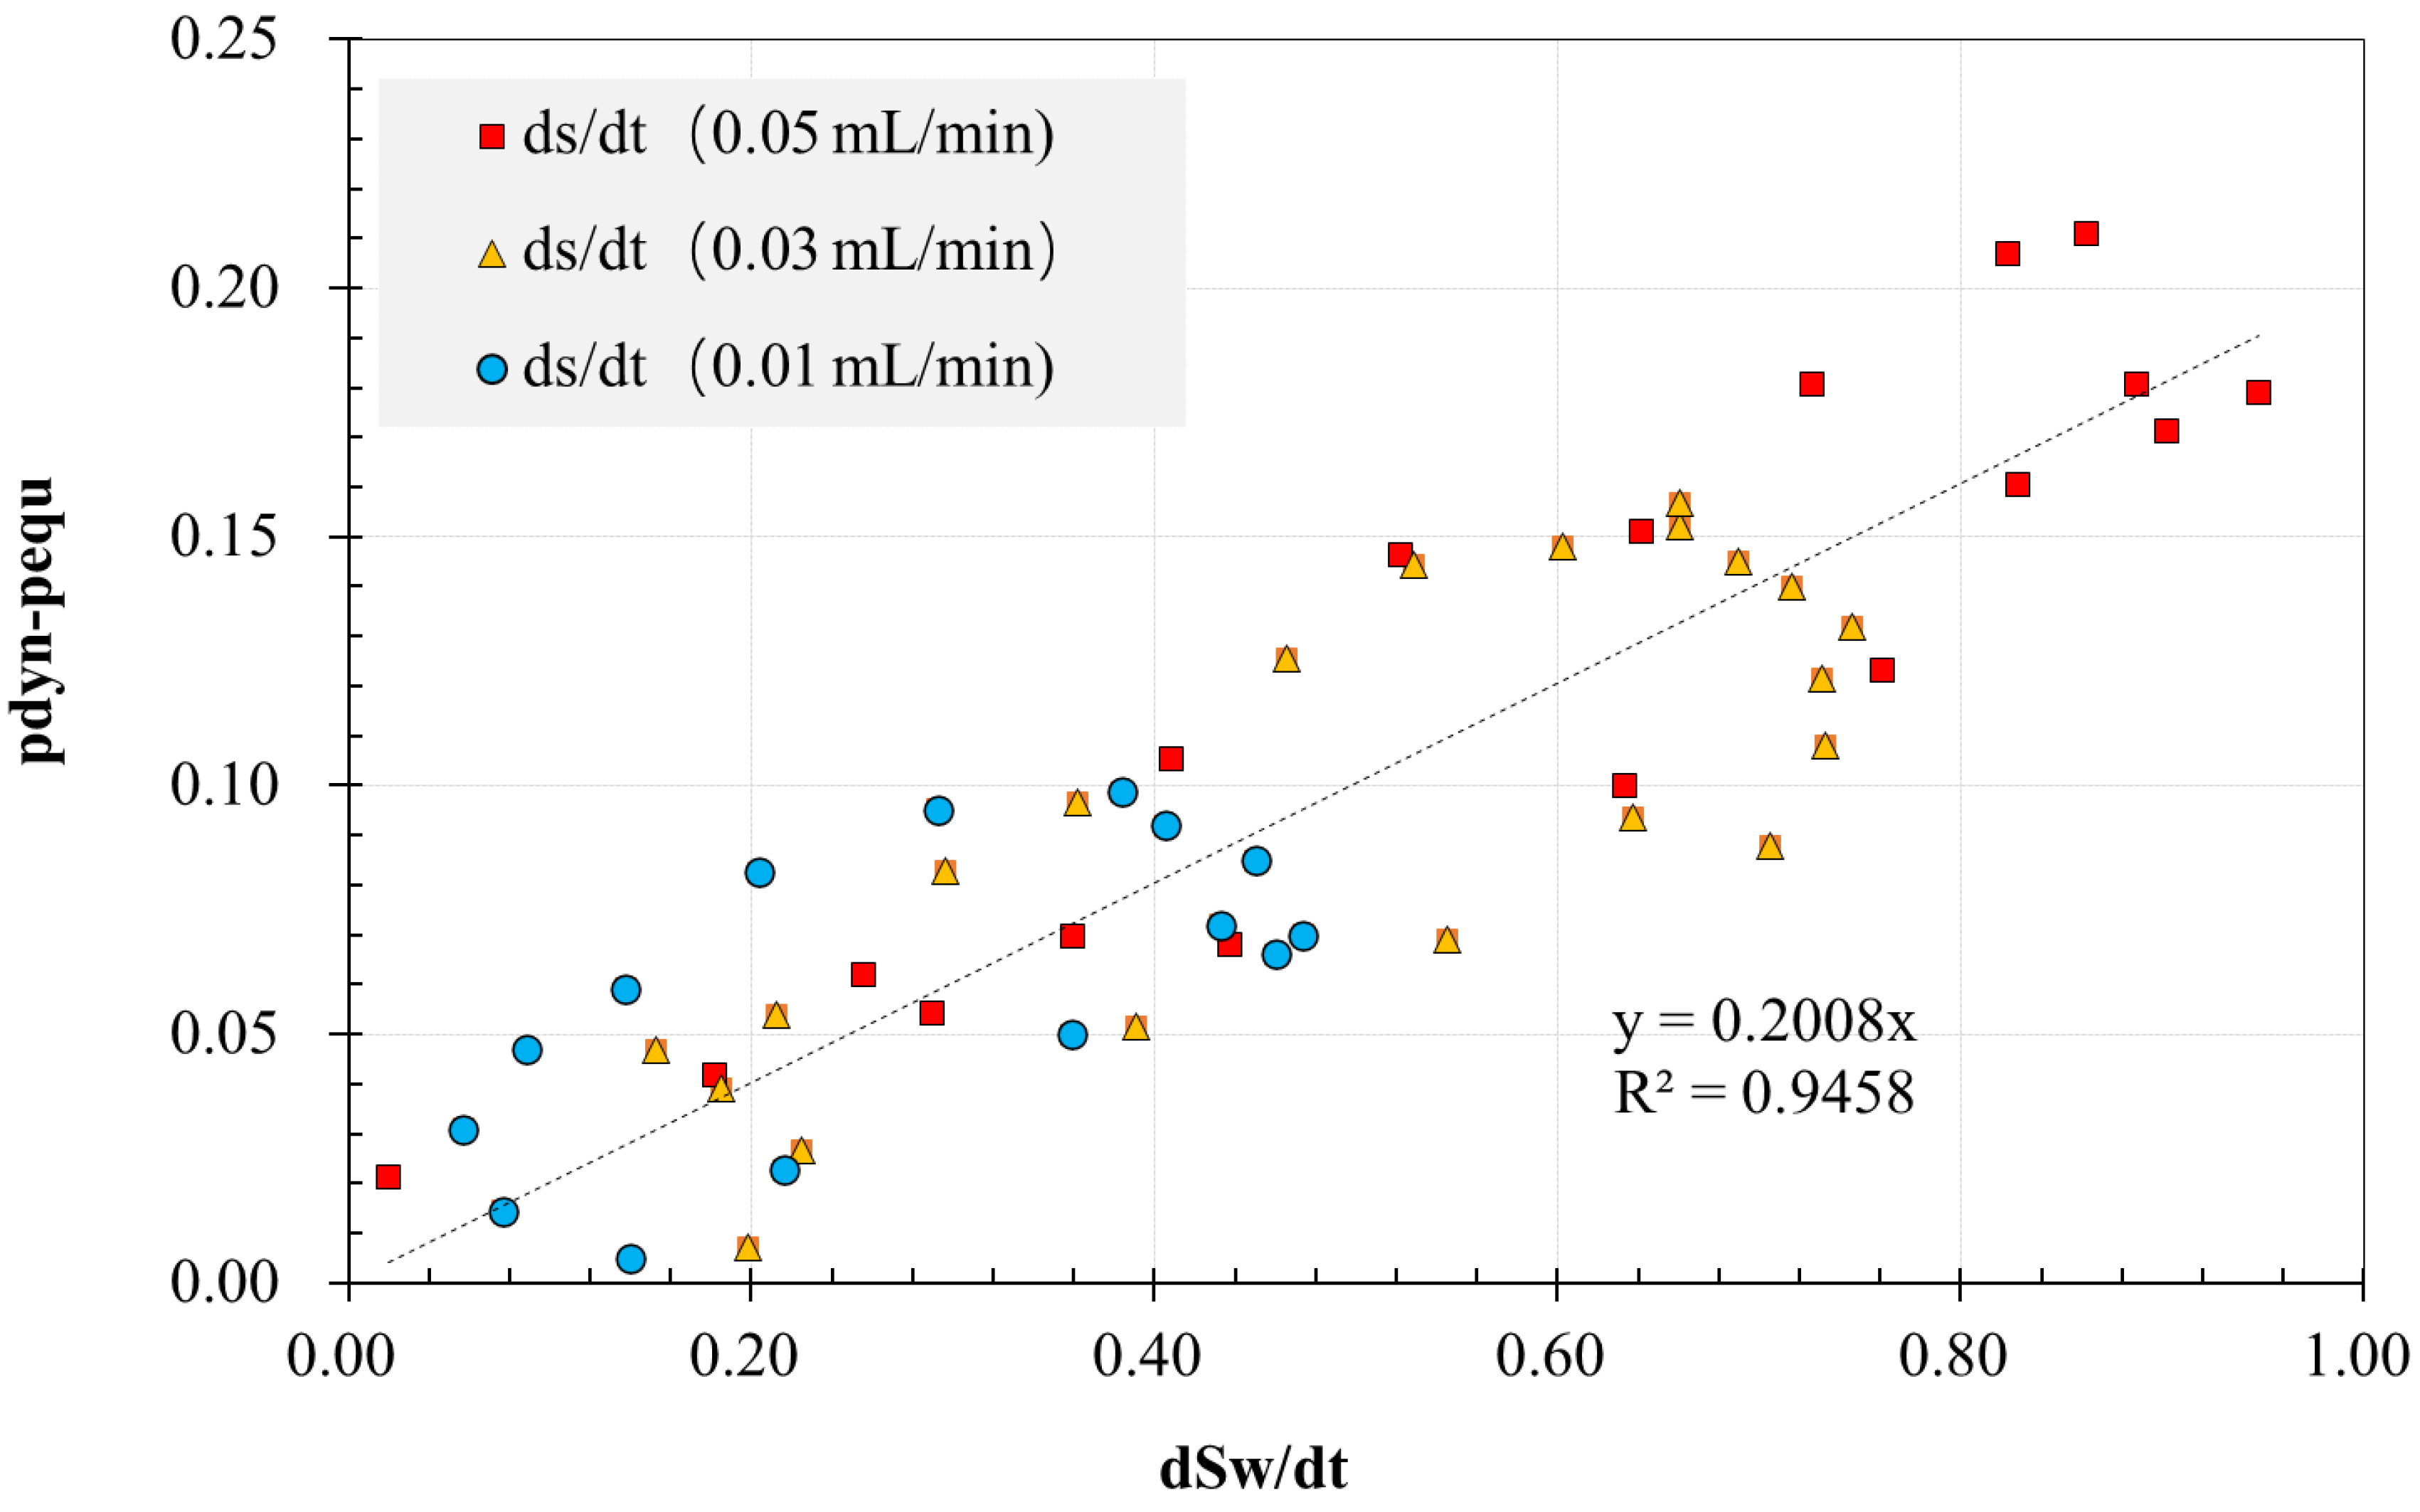
According to the measured static capillary-force curve and dynamic capillary-force curve, Figure 3 can be obtained by using Equation (4):
According to the displacement theory, oil and water saturation in cores is a function of distance and time in dynamic capillary test experiments. Therefore, with the increase in flow velocity, the change velocity of water saturation (dSw/dt) increases. The scatter plot, displayed in Figure 3, with S w t exhibited in the x axis and P c , dyn P c , stat shown in the y axis. Based on the slope of the fitting line, the dynamic capillary-force coefficient τ= 0.00334592 could be obtained.

3. Numerical Model of Low-Permeability Reservoir Considering Dynamic Capillary Force

Reservoir pressure, heterogeneity, and production influence most the development of low-permeability reservoirs [22,23]. A three-dimensional two-phase mathematical model is established. The finite difference numerical method is used to solve the mathematical model. By changing the above three factors, the influence of dynamic capillary force on reservoir recovery and water cut is studied [24,25,26].
The assumptions of the numerical model are:
(1)
The fluid in the reservoir is the oil and the water phase and the wetting phase is water and the oil phase is non-wetting phase.
(2)
The seepage process conforms to the Darcy law.
(3)
The fluid in the reservoir is isothermal seepage; the temperature does not change with time.
(4)
Pressure gradient affects the seepage process.
(5)
Dynamic capillary force and gravity affect the seepage process.
Based on oilfield reservoir characteristics and experimental parameters, set reservoir model parameters as in Table 1.
The continuity equation of two-phase seepage flow is established:
{ [ k k r o ρ o μ o ( ρ o ρ o D ) ] + q o = ( φ ρ o S o ) t [ k k r w ρ w μ w ( ρ w ρ w D ) ] + q w = ( φ ρ w S w ) t ,
Auxiliary equation:
S o + S w = 1 ,
Considering the dynamic capillary force:
p c d y n p c e q u = p c d y n ( S w S w t ) = τ S t ,
τ = 0.00334592 ,
Get the discretization equation in cartesian coordinates:
{ x [ k k r o ρ o μ o ( p o x ρ o g D x ) ] + y [ k k r o μ o ( p o y ρ o g D y ) ] + z [ k k r o μ o ( p o μ o ρ o g D z ) ] + q o = ( φ ρ o S o ) t x [ k k r w μ w ( p w x ρ w g D x ) ] + y [ k k r w μ w ( p w y ρ w g D y ) ] + z [ k k r w μ w ( p w z ρ w g D z ) ] + q w = ( φ ρ w S w ) t ,
Solve the equation:
{ Δ T o Δ p n + 1 Δ T o γ o Δ D + q o V i j k = V i j k Δ t [ ( φ ρ o S o ) n + 1 ( φ ρ o S o ) n ] Δ T n Δ p n + 1 Δ T w Δ p d y n n + 1 Δ T w γ w Δ D + q w V i j k = V i j k Δ t [ ( φ ρ w S w ) n + 1 ( φ ρ w S w ) n ] ,
V i j k = Δ x i Δ y j Δ z k ,

4. Results and Discussion

4.1. Effect of Formation Pressure

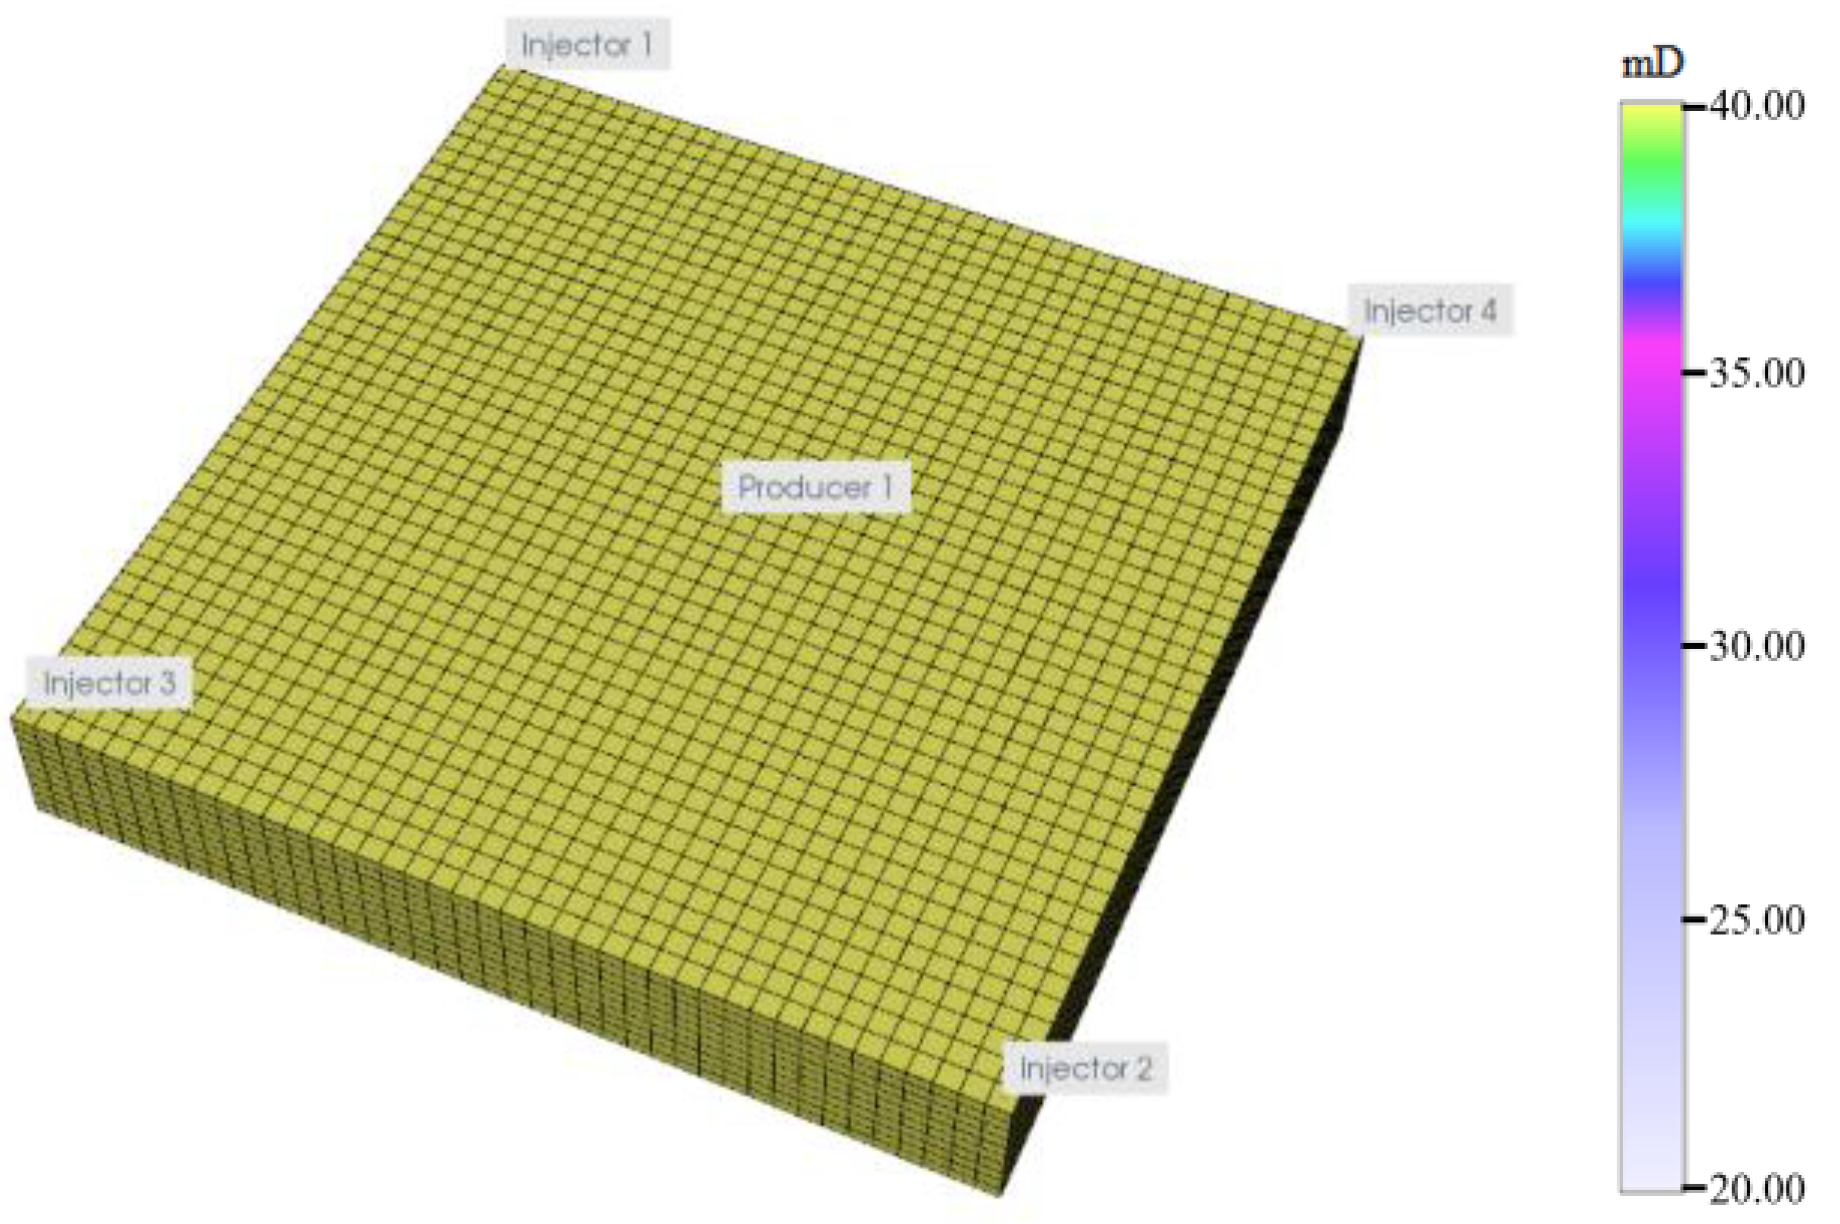
A homogeneous model was constructed as shown in Figure 4. It used five spot pattern water injection. The main parameters are considered as shown in Table 2.
Reservoir exploitation is then simulated for 15 years. The effect of dynamic capillary force on the oil recovery and water cut is compared and analyzed [19].
Dynamic capillary force takes into account the dynamic effect; its value is greater than the static capillary force. Due to the influence of dynamic factors, the value of dynamic capillary force is different in different production stages and different spatial positions [23,24,25,26,27].
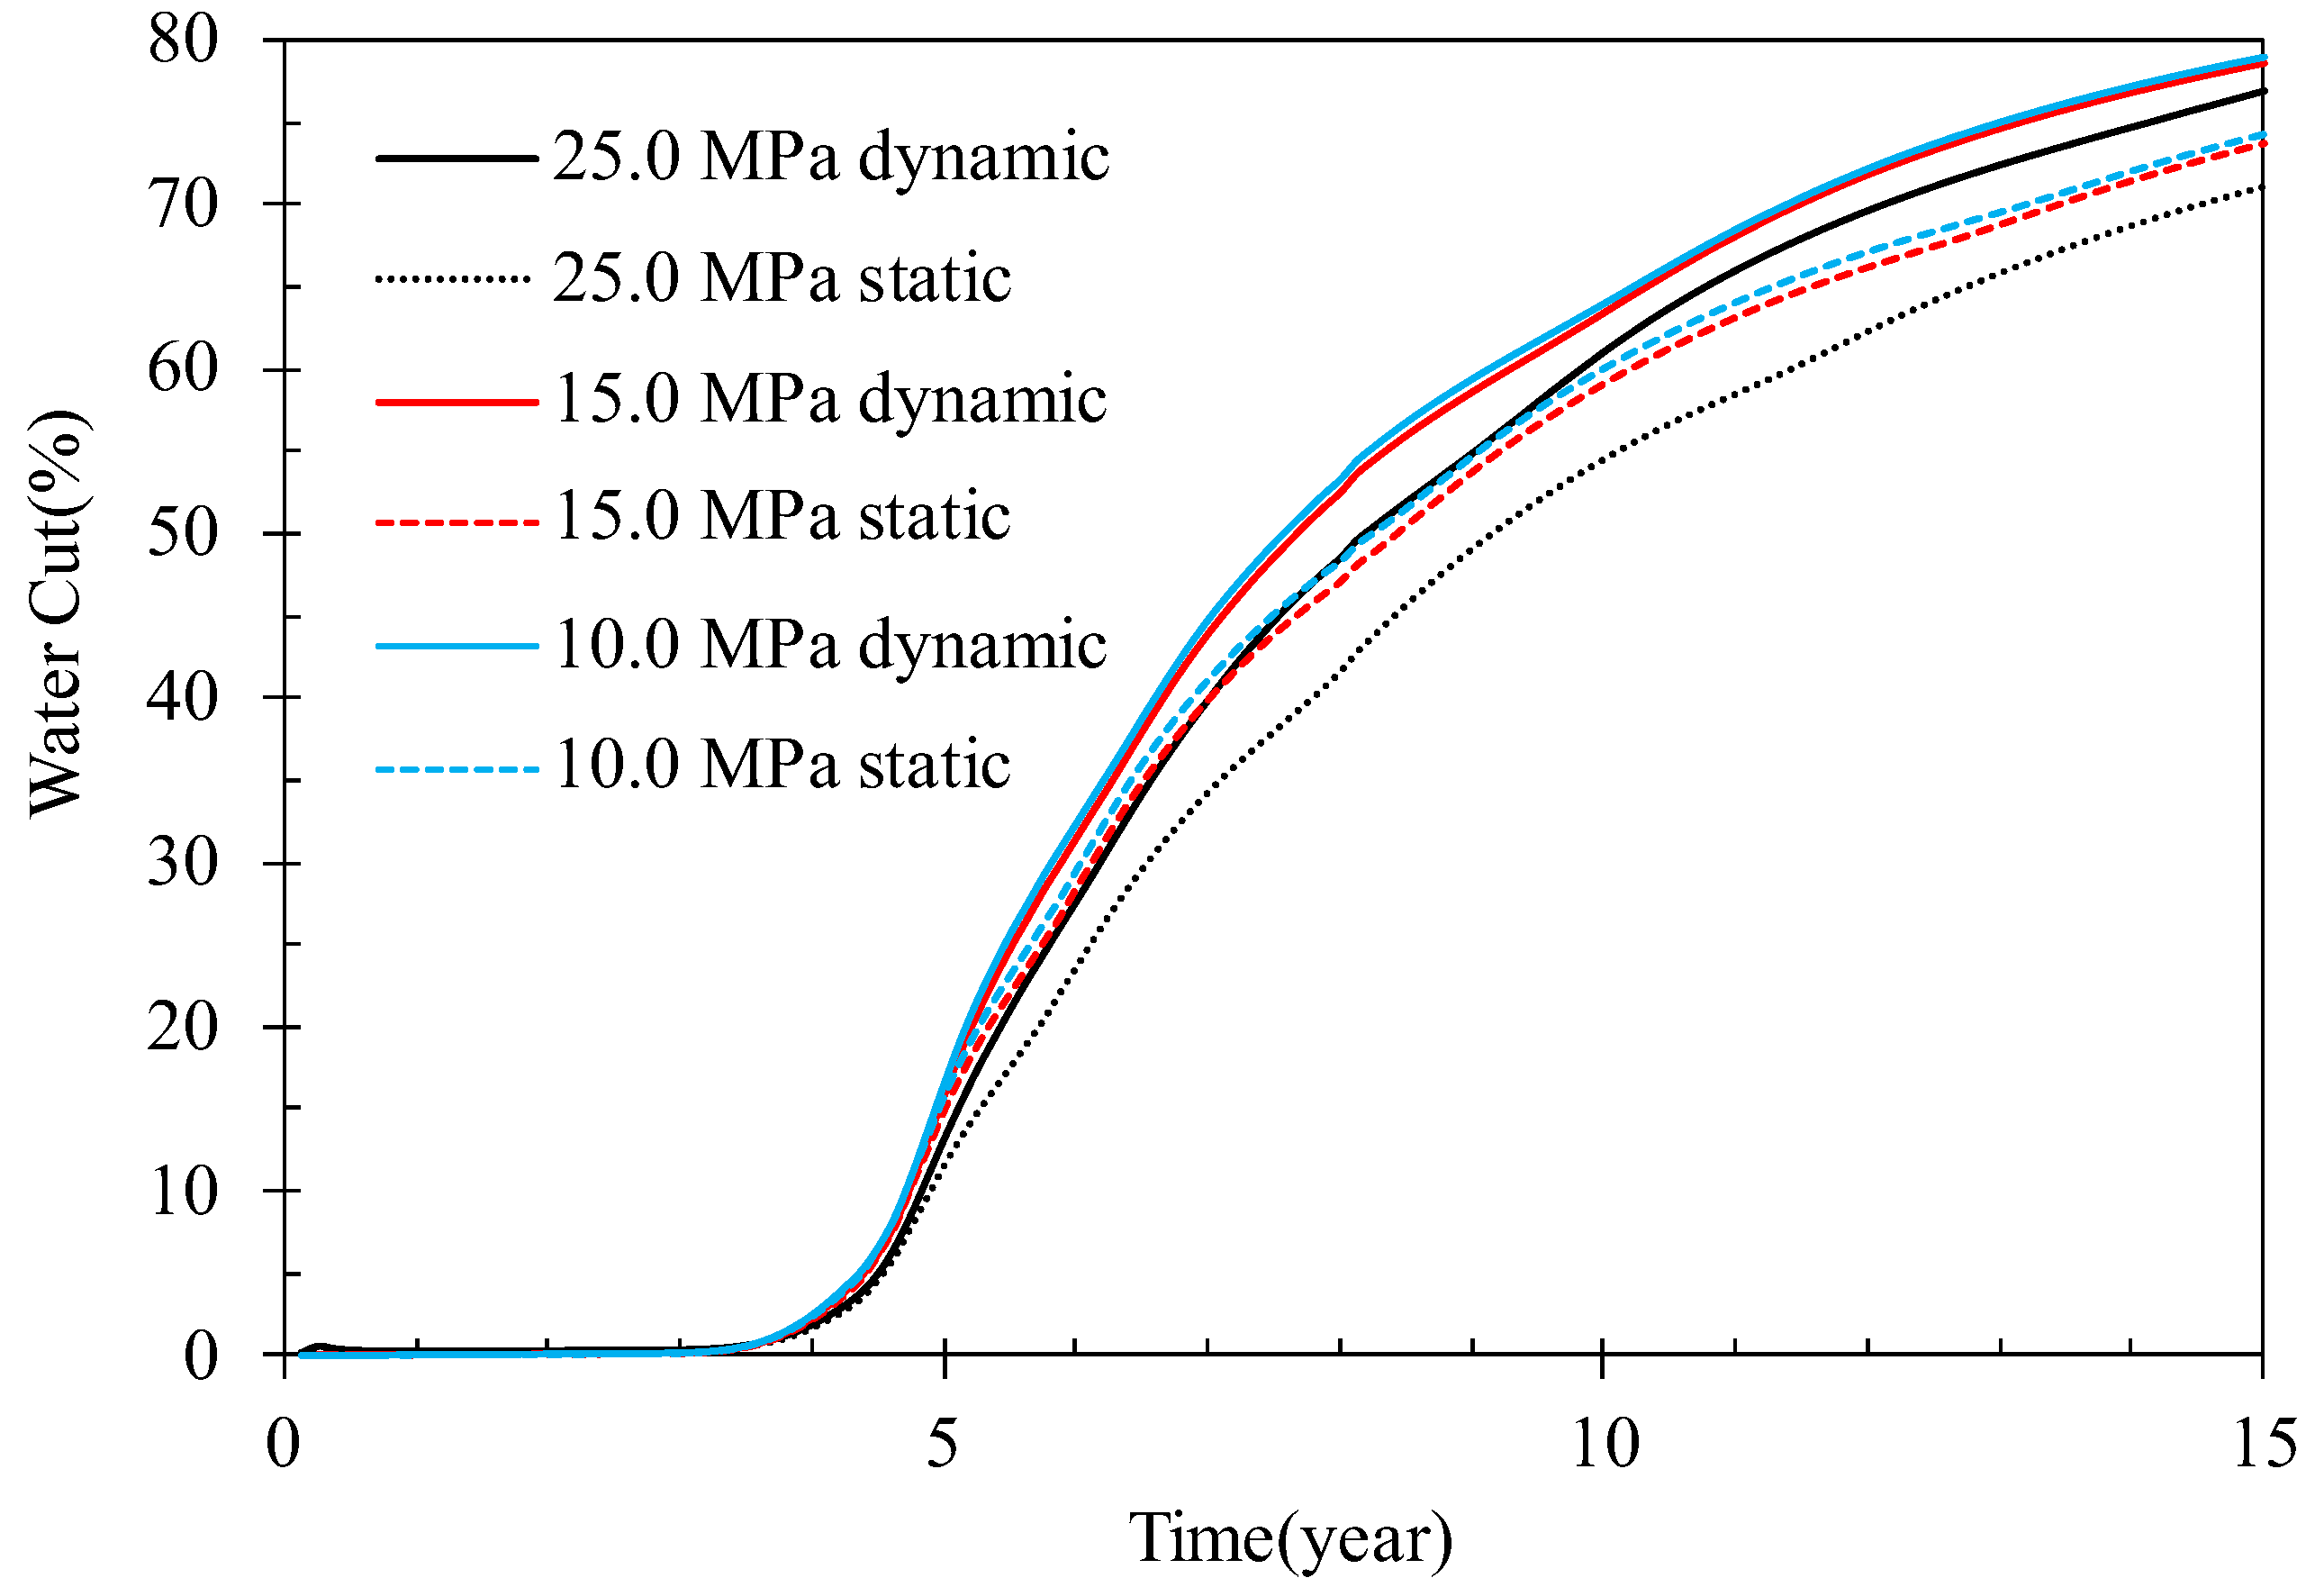
Dynamic capillary force will increase the seepage resistance and enhance the heterogeneity of the reservoir. Therefore, compared with the traditional numerical simulation method, the development effect of the low-permeability reservoir becomes worse. Figure 5 shows that compared with the traditional static capillary force, the water cut of low-permeability reservoirs increases faster under the consideration of dynamic capillary force, but the degree is different under different formation pressures. When the initial formation pressure is 10.0 MPa, the water cut will increase by 2.4% after 15 years of development. Under the initial formation pressure of 15.0 MPa, the water cut finally increases by 4.65%; under the initial formation pressure of 25.0 MPa, the water content finally increases by 5.72%. This is a big impact, and with the increase in formation pressure, the degree of water-cut increase caused by dynamic capillary force will be more obvious.
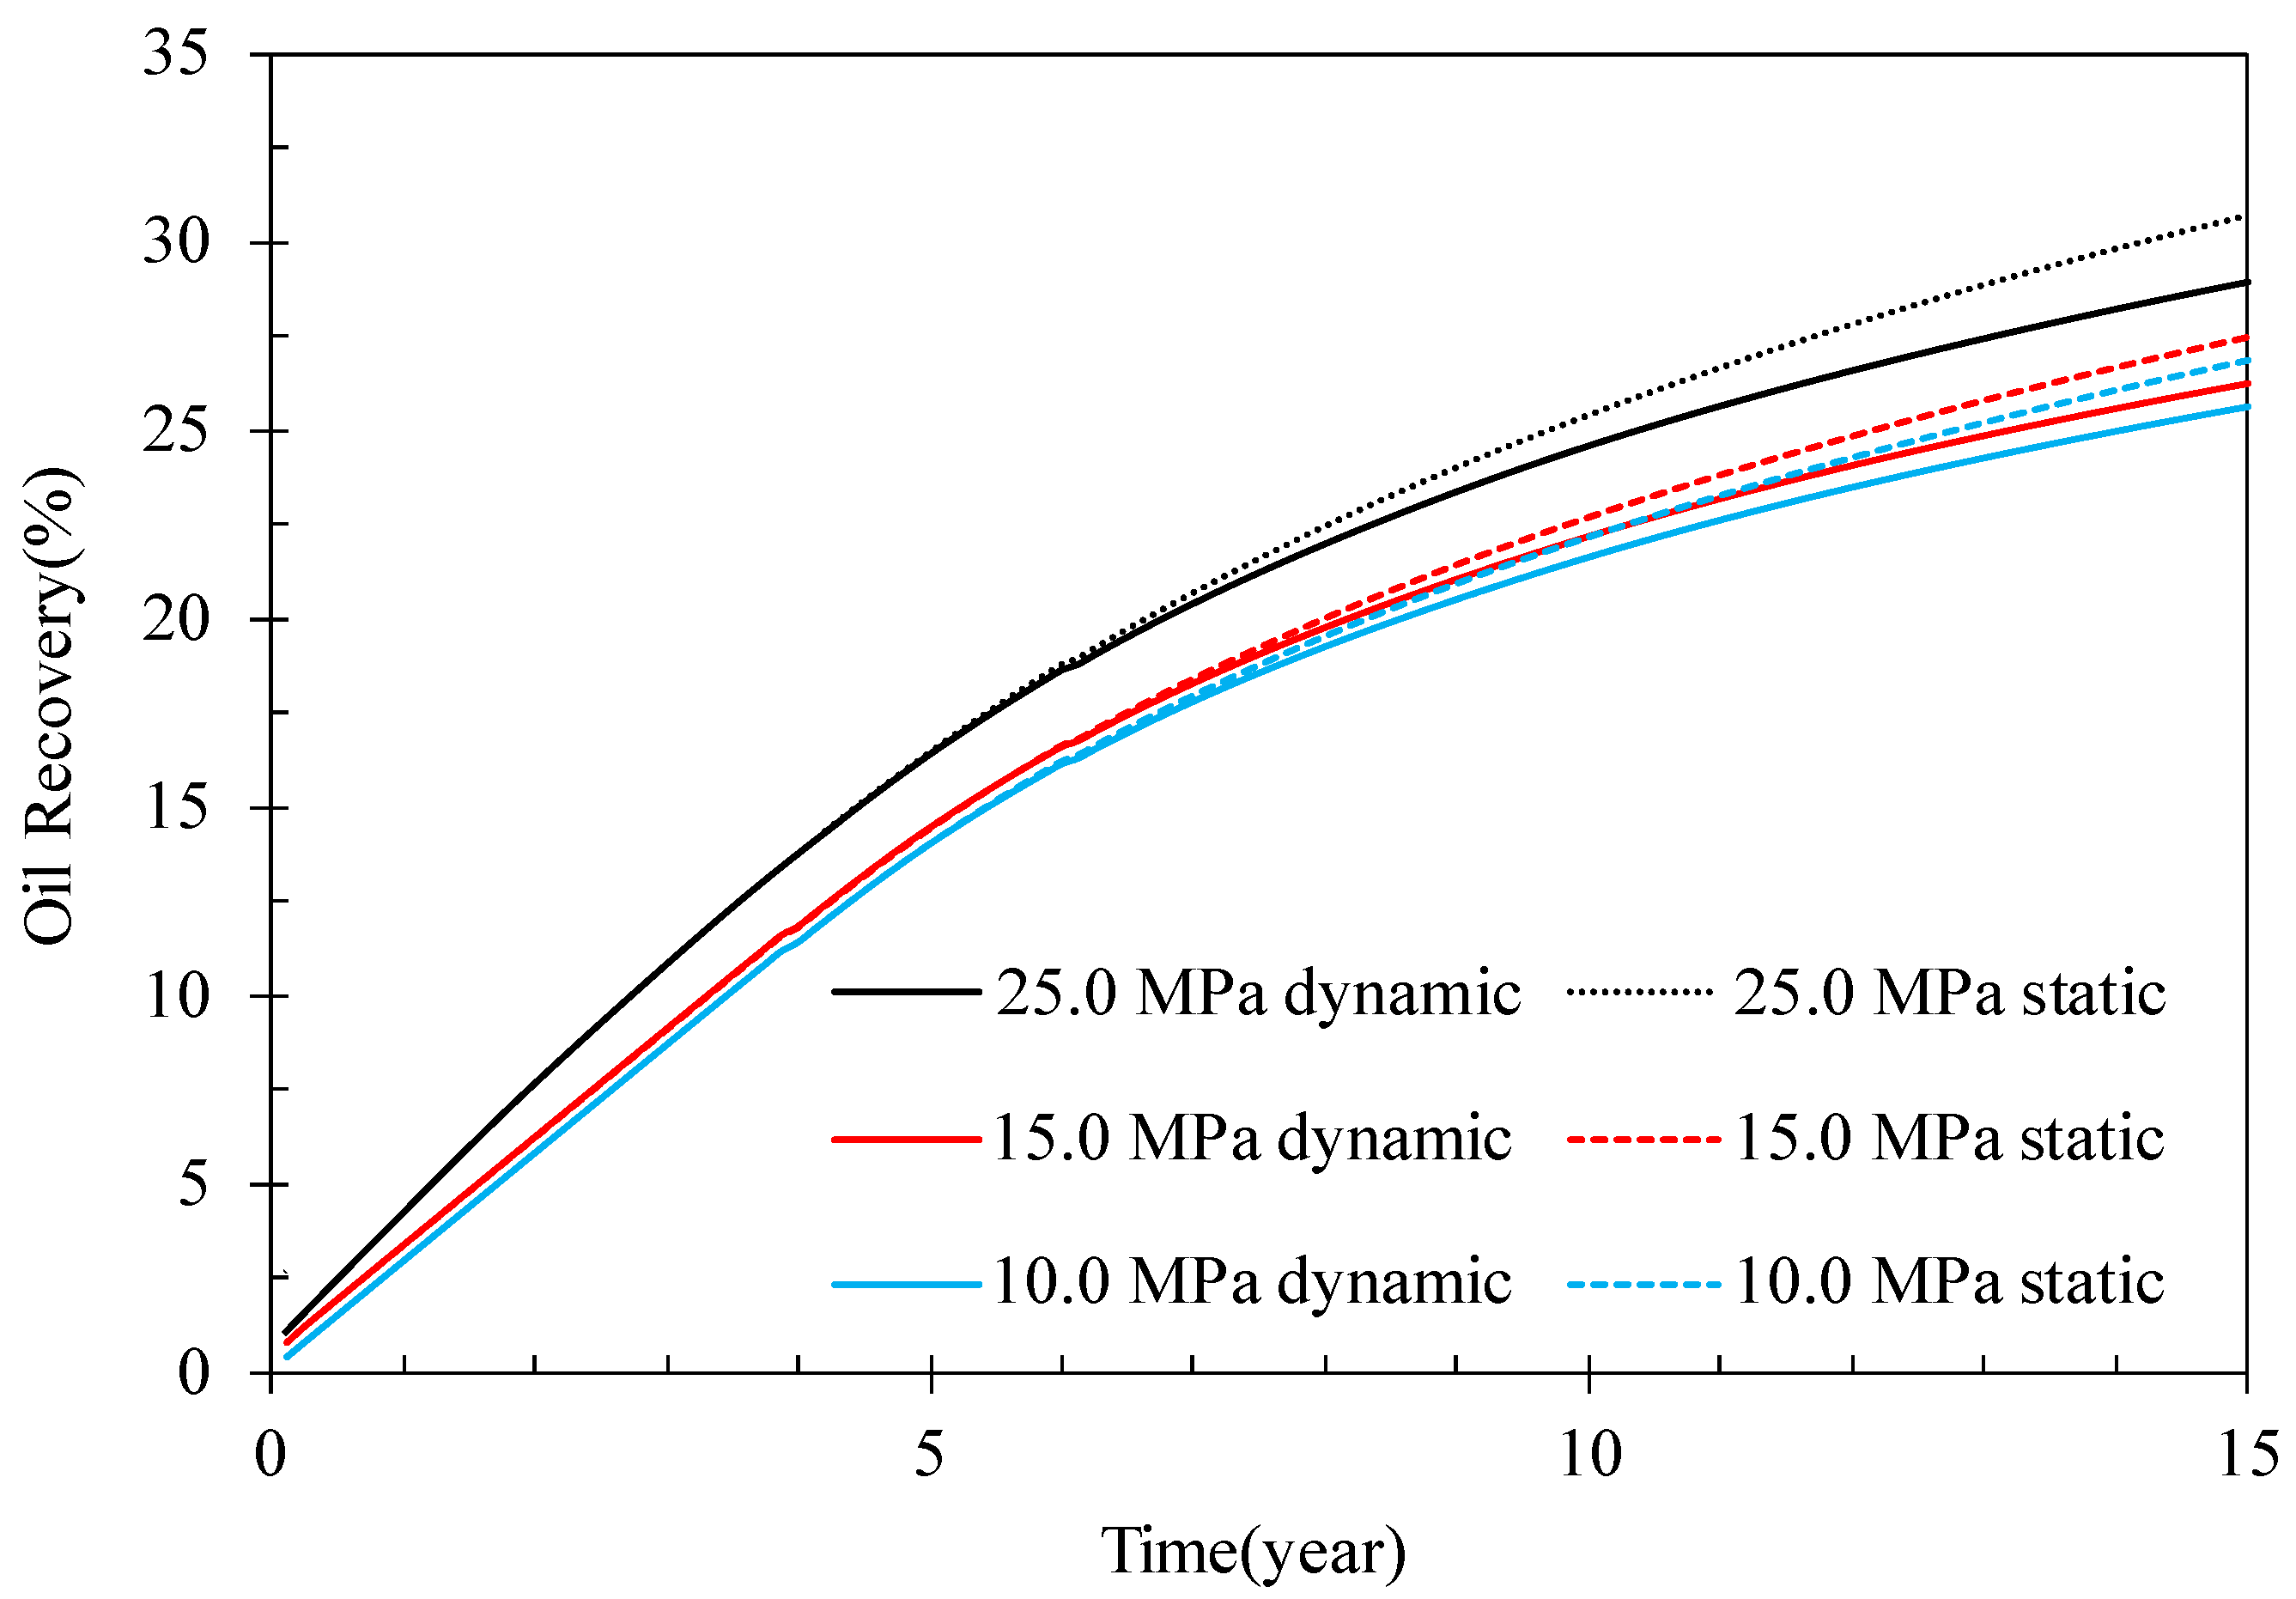
Figure 6 shows the recovery curves of the dynamic capillary-force seepage model and static capillary-force seepage model under different formation pressures. The higher the formation pressure is, the more abundant the reservoir energy and the higher the oil recovery [21]. Compared with the static capillary-force seepage model, the dynamic capillary-force seepage model will cause the decline of oil recovery. This difference is not significant in the first 6 years of development, but, in the middle and later stages of development, the difference between the two capillary-force seepage models will gradually become prominent, and the greater the original formation pressure, the more obvious the decline in oil recovery. When the formation pressure is 10.0 MPa, the dynamic capillary-force model predicts that the oil recovery will decrease by 1.21% in 15 years. When the formation pressure is 15.0 MPa, the predicted oil recovery decreases by 1.29%. When the formation pressure is 25.0 MPa, the predicted oil recovery decreases by 1.69%.

4.2. Influence of Heterogeneity

To analyze the influence of the dynamic capillary-force seepage model on the development effect of heterogeneous reservoirs, the authors designed a horizontal heterogeneous reservoir model and a vertical heterogeneous reservoir model, as displayed in Figure 7. The volumes of the high-permeability parts and low-permeability parts of these two models both account for 50%. Other parameters are the same. The main parameters are considered as shown in Table 3.
Based on the above different reservoir geological settings, the difference of dynamic capillary force seepage model and static capillary force model on the recovery of low-permeability reservoirs are compared.
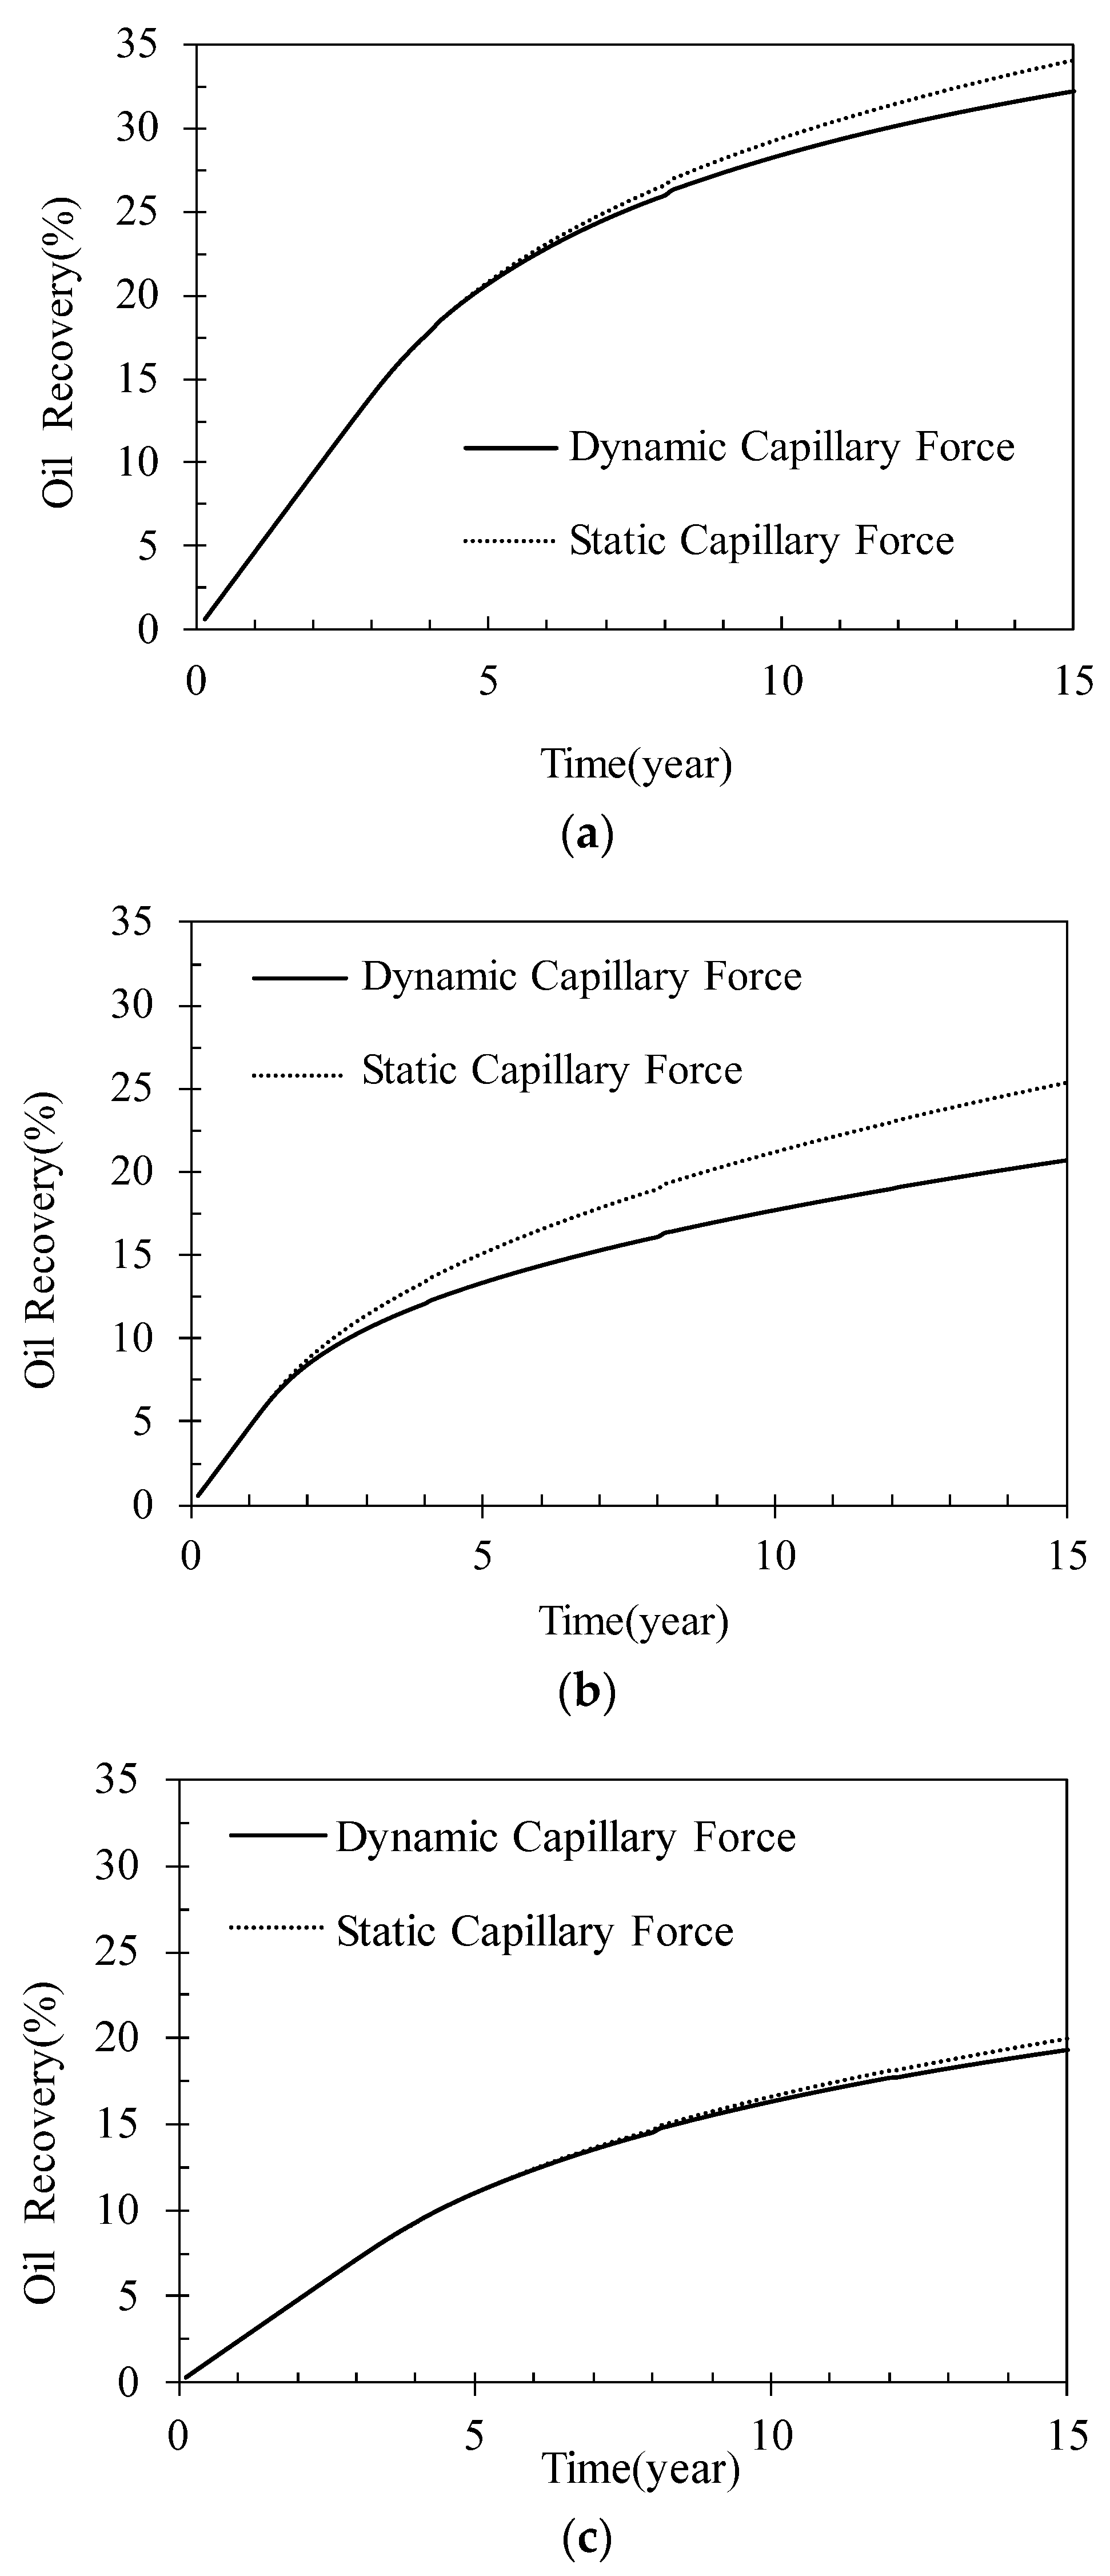
Figure 8 shows that under the same production rate, dynamic capillary force seepage models will reduce the predicted oil recovery in the three geological settings of low permeability, but they differ at different stages. For the homogeneous model, the effect of dynamic capillary force begins to appear when the model is developed until the fifth to sixth years. The horizontal heterogeneous model accelerates this process, showing obvious differences in the second year of development, and the subsequent differences continue to increase. However, the vertical heterogeneous model weakens this difference, and only in the 8th to 9th years does it show a certain difference.
The numerical simulation results show that after using the dynamic capillary-force seepage model, the final recovery ratio of homogeneous reservoir changes from 34.0% to 32.1%, decreasing by 1.9%. The final recovery ratio of the horizontal heterogeneous reservoir changed from 25.3% to 20.6%, decreasing by 4.7%; the final recovery ratio of vertical heterogeneity changes from 19.9% to 19.8%, and the decline of recovery ratio is exceedingly weak. Therefore, the above data show that the horizontal heterogeneity has more obvious influence on the dynamic capillary force than the vertical heterogeneity of a low-permeability reservoir.

4.3. Influence of Development Intensity

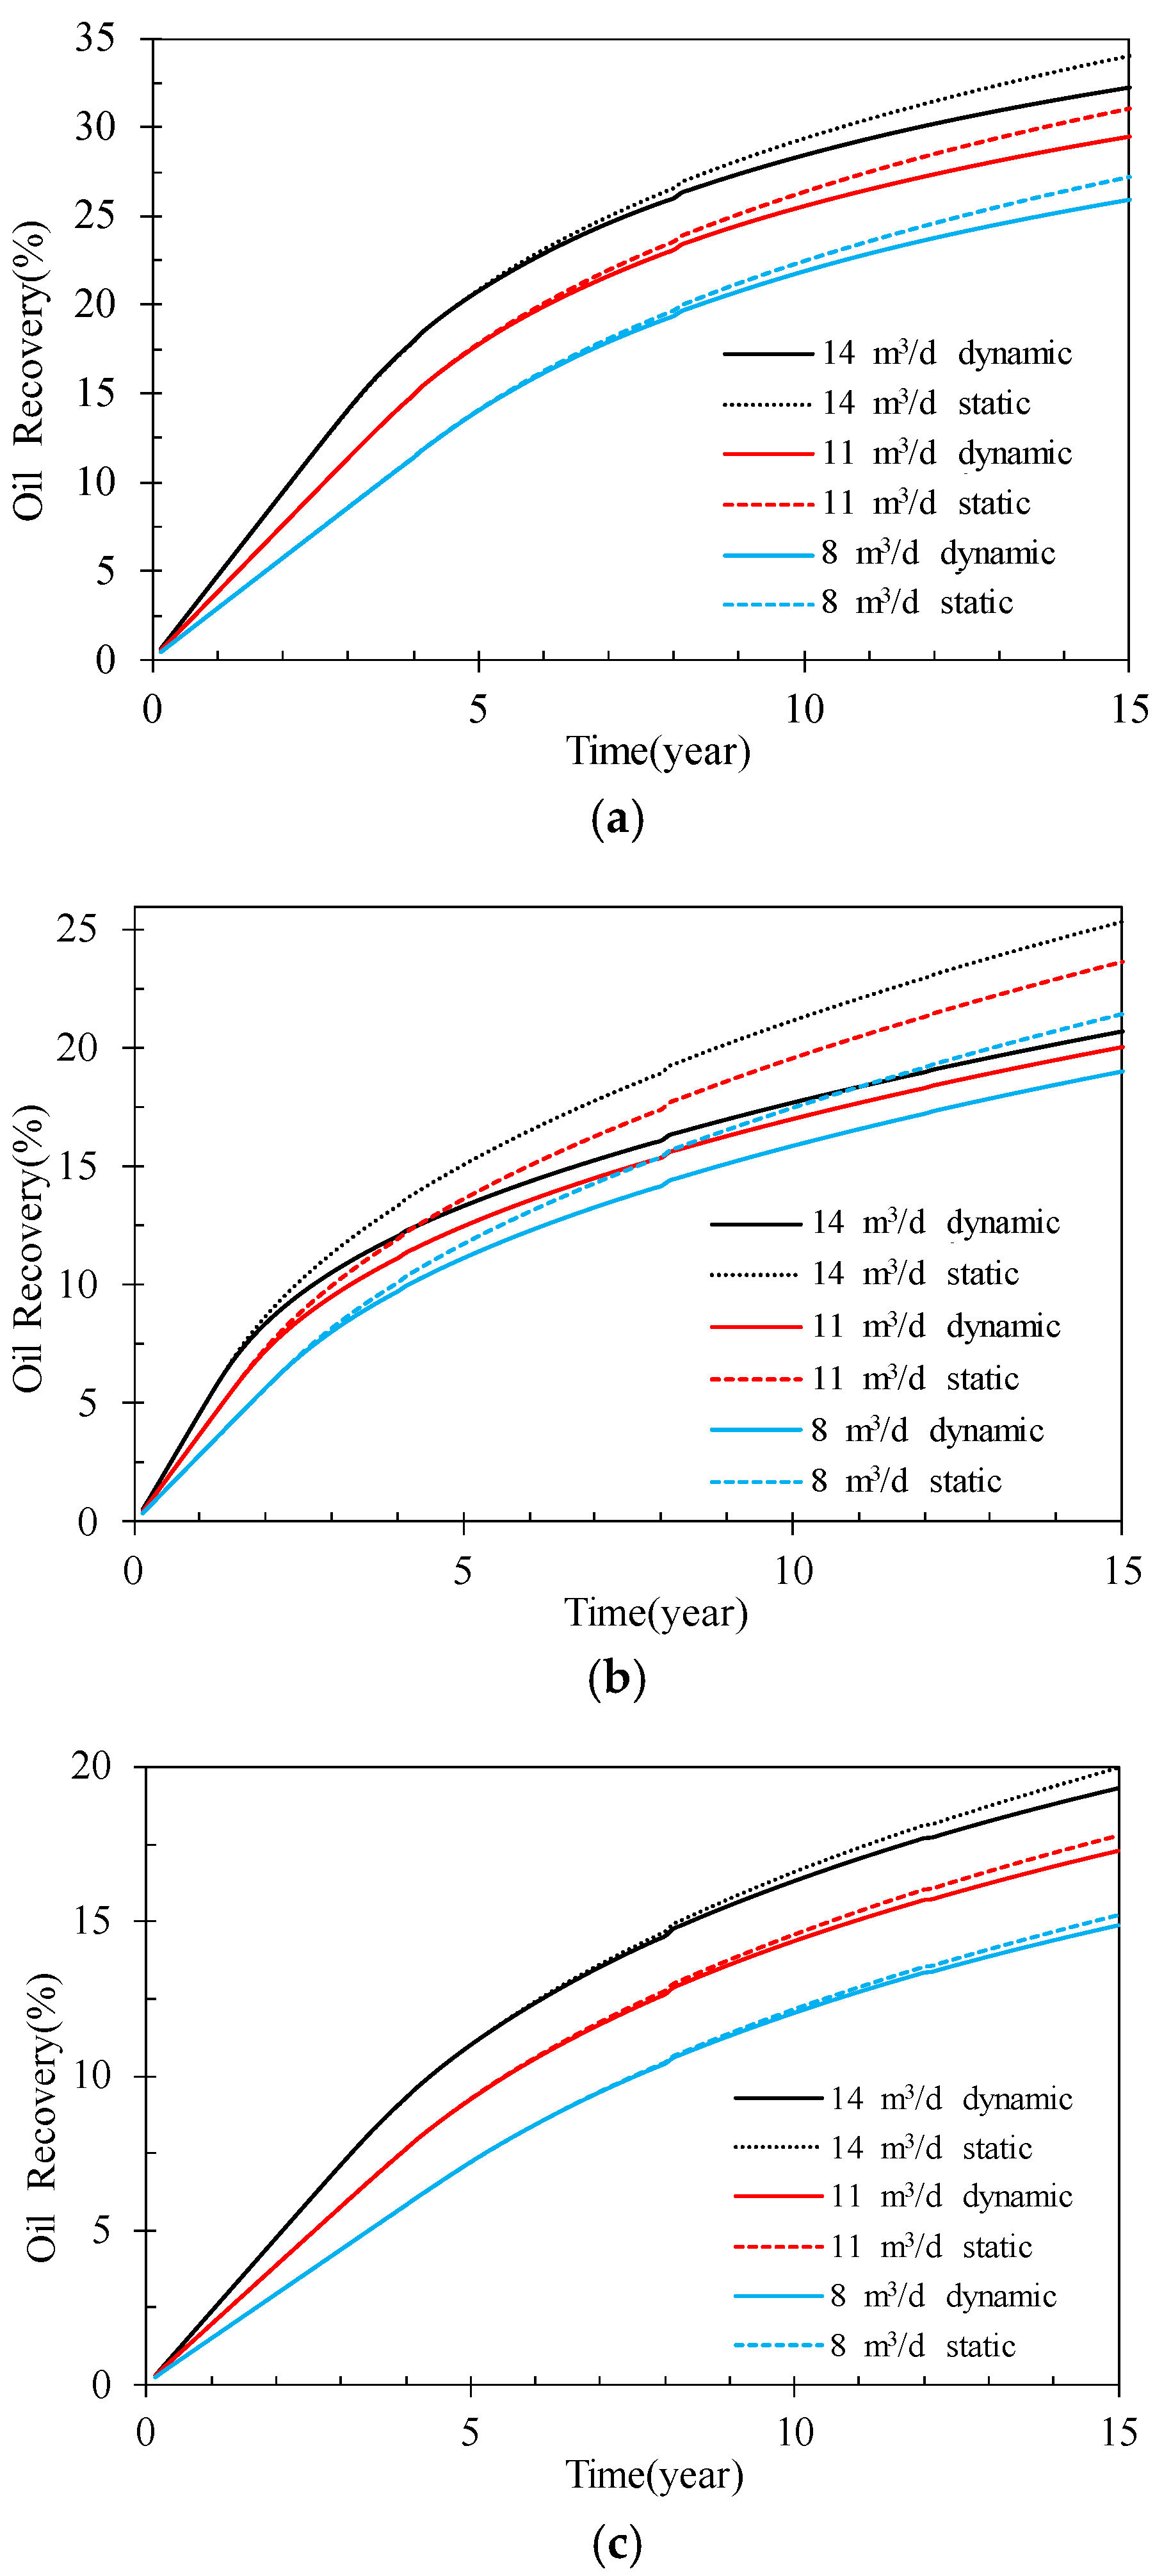
The effect of dynamic capillary force is closely related to the flow rate. To study the difference between the dynamic capillary force and the static capillary-force seepage model under different development strategies, the authors conducted research on the geological models of homogeneous reservoirs, horizontal heterogeneous reservoirs, and vertical heterogeneous reservoirs. The model formation pressure is set as 10 MPa, and the production rates are 8 m3/d, 11 m3/d, and 14 m3/d, respectively. The recovery curves predicted by the dynamic capillary-force seepage model and static capillary-force seepage model are obtained as displayed in Figure 9.
Figure 9a shows the oil recovery efficiency at different development rates in homogeneous reservoirs. We can see that with the increase in the oil production rate, the oil recovery will increase significantly in a short time. At a high production rate, the phenomenon of dynamic capillary force leading to the decline of oil recovery will be more obvious. It can be seen from the data that when the production rate is 8 m3/d, 11 m3/d, and 14 m3/d, the dynamic capillary force will reduce the recovery efficiency by 1.21%, 1.56%, and 1.85%, respectively, after 15 years, and increase the production intensity by 75% and the dynamic capillary force effect by 52.89%, from 8m3/d to 14m3/d.
In the comparison of Figure 9a,b: in horizontal heterogeneous reservoirs, the overall recovery ratio of the reservoir will decrease at the same production rate. When the production rate is 8 m3/d, 11 m3/d, and 14 m3/d, the dynamic capillary force will reduce the recovery efficiency by 2.45%, 3.50%, and 4.71%, respectively, 15 years later. Compared with homogeneous reservoirs, the effect of dynamic capillary force will increase by 102.4%, 124.1%, and 154.1%, respectively, at the same production rate. From 8 m3/d to 14 m3/d, the production intensity is increased by 75% and the dynamic capillary force effect is increased by 92.24%. In addition, the comparison shows that the static capillary-force seepage model magnifies the effect of improving the production rate in low-permeability reservoirs. In the static capillary-force seepage model, the predicted oil recovery will be changed from 21.45% to 25.35%, and the oil recovery will be increased by 3.9% when it is increased from 8 m3/d to 14 m3/d, but in the dynamic capillary-force seepage model, the predicted oil recovery will be increased from 19.00% to 20.64%, and the oil recovery will only be increased by 1.64% when it is increased from 8 m3/d to 14 m3/d. This can explain why for low-permeability reservoirs with dominant seepage channels, it is often impossible to obtain good results predicted by traditional numerical simulation methods simply by increasing the production rate [24,25,26,27].
Figure 9c shows that compared with the above two types of models, the recovery ratio of vertically heterogeneous low-permeability reservoirs is lower at the same production rate. When the production rate is 8 m3/d, 11 m3/d, and 14 m3/d, the dynamic capillary force will reduce the recovery efficiency by 0.07%, 0.47%, and 0.67%, respectively, 15 years later. Compared with homogeneous reservoirs, the effect of dynamic capillary force will decrease by 94.6%, 69.8%, and 63.7%, respectively, at the same production rate [28,29,30,31,32,33,34,35,36,37,38].
According to the above comparison in Figure 10, it can be found that the greater the production rate is, the more the difference between the dynamic and static capillary force seepage models becomes obvious. The horizontal heterogeneity will strengthen this difference, while the vertical heterogeneity will weaken this difference.

5. Conclusions

  • The capillary force of the reservoir is not only related to the static factor of wetting-phase saturation, but also to the dynamic factor of the change of saturation with time. The experiment proves that dynamic capillary force is greater than static capillary force, and there is a linear relationship between P c , dyn P c , stat and S w t . The dynamic capillary force coefficient τ = 0.2008 is obtained by fitting the experimental data.
  • In low-permeability reservoirs, there are differences between the predicted results of dynamic and static capillary-force seepage models. Compared with the static capillary force, the dynamic capillary force will continuously enhance the heterogeneity of the reservoir and increase the oil-phase seepage resistance. The predicted water cut will increase faster, and the recovery ratio will decrease.
  • Initial formation pressure and development time have influence on the effect of dynamic capillary force. With the increase in reservoir burial depth and formation pressure, the effect of dynamic capillary force is more obvious. As the reservoir enters the middle and late development stages, the effect of dynamic capillary force is gradually highlighted.
  • The effect of dynamic capillary force is different in different heterogeneous reservoirs. The horizontal heterogeneity of a reservoir will strengthen the effect of the dynamic capillary force, while the vertical heterogeneity will weaken the effect of dynamic capillary force. In other words, in the process of water flooding in low-permeability reservoirs, when the horizontal spread range is inhomogeneous, the dynamic capillary force effect is obvious; when the vertical spread range is inhomogeneous, the effect of dynamic capillary force is not obvious.
  • The greater the production rate, the greater the prediction error of static capillary force seepage model, which is more obvious in horizontal heterogeneous reservoirs. After using the dynamic capillary-force seepage model, the predicted recovery error of horizontal heterogeneous reservoir can reach 2.4%, 3.5%, and 4.7% at the production rate of 8, 11, and 14 m3/d, respectively. Therefore, the low-permeability reservoir with strong horizontal heterogeneity should pay more attention to the dynamic capillary force.

Author Contributions

As the first author, Y.Z. established the seepage model, carried out numerical simulation research, and wrote the main manuscript. As the corresponding author, S.W. has made significant contributions to the design of the works; Y.W. processed and analyzed the experimental data; J.G. and Y.C. provided real low-permeability core and carried out core experimental research. All authors discussed the results and critically reviewed the manuscript. All authors have read and agreed to the published version of the manuscript.

Funding

This research was supported by the 2021 open funding of the Research and Development Center for the Sustainable Development of Continental Sandstone Mature Oilfield by National Energy Administration (No. 33550000-22-ZC0613-0021).

Informed Consent Statement

Not applicable.

Data Availability Statement

Not applicable.

Acknowledgments

The authors thank the financial and technical support of SINOPEC petroleum exploration and production research institute and PetroChina Changqing Oilfield. We would like to express our gratitude to the senior engineer Liu Ping for guiding us to complete the fund research.

Conflicts of Interest

The authors declare no competing interest.

Nomenclature

P c capillary force, MPa
σ oil–water interfacial tension, N/m
θ wetting angle, degree
r pore radius, mm
P o oil-phase pressure, MPa
P w water-phase pressure, MPa
S w e t wetting-phase saturation, decimal
t time, s
P c , dyn dynamic capillary force, MPa
P c , stat static capillary force, MPa
τ dynamic capillary-force coefficient, MPa·s
k formation permeability, mD
k r o relative permeability of oil phase, decimal
k r w relative permeability of oil phase, decimal
ρ o density of oil phase, kg/m3
ρ w density of water phase, kg/m3
q o rate of oil phase, m3/d
φ porosity, decimal
S o saturation of oil phase, decimal
S w saturation of water phase, decimal

References

  1. Abbasi, J.; Ghaedi, M.; Riazi, M. A new numerical approach for investigation of the effects of dynamic capillary pressure in im-bibition process. J. Pet. Sci. Eng. 2018, 162, 44–54. [Google Scholar]
  2. Tian, S.; Lei, G.; He, S.; Yang, L. Dynamic effect of capillary pressure in low permeability reservoirs. Pet. Explor. Dev. 2012, 39, 405–411. [Google Scholar] [CrossRef]
  3. Civan, F. Temperature dependency of dynamic coefficient for nonequilibrium capillary force-saturation relationship. Aiche J. 2012, 58, 2282–2285. [Google Scholar]
  4. Sander, G.C.; Glidewell, O.J.; Norbury, J. Dynamic capillary pressure, hysteresis and gravity-driven fingering in porous media. J. Phys. Conf. Ser. 2008, 138, 012023. [Google Scholar] [CrossRef]
  5. Korayem, M.; Kavousi, A.; Ebrahimi, N. Dynamic analysis of tapping-mode AFM considering capillary force interactions. Sci. Iran. 2011, 18, 121–129. [Google Scholar] [CrossRef]
  6. Yan, C.Z.; Xiu-Sheng, L.I.; Chang, Y.W.; Li-Jun, Y.U.; Shi, J.Z. Development of low permeability reservoir with closely-spaced wells. Petrol. Explor. Dev. 2005, 32, 105–107. [Google Scholar]
  7. Hassanizadeh, S.M.; Gray, W.G. Toward an improved description of the physics of two-phase flow. Adv. Water Resour. 1993, 16, 53–67. [Google Scholar] [CrossRef]
  8. Hassanizadeh, S.M.; Celia, M.A.; Dahle, H.K. Dynamic effects in the capillary force–saturation relationship and its impact on unsatuvelocity d flow. Vadose Zone J. 2002, 1, 38–57. [Google Scholar]
  9. Joekar-Niasar, V.; Hassanizadeh, S.M.; Dahle, H.K. Non-equilibrium effects in capillarity and interfacial area in two-phase flow: Dynamic pore-network modelling. J. Fluid Mech. 2010, 655, 38–71. [Google Scholar] [CrossRef]
  10. Wang, S.; Liu, P.; Zhao, H.; Zhang, Y. A novel method for calculating the dynamic capillary force and correcting the pressure error in micro-tube experiment. Sci. Rep. 2017, 7, 16590. [Google Scholar] [CrossRef]
  11. Helmig, R.; Weiss, A.; Wohlmuth, B.I. Dynamic capillary effects in heterogeneous porous media. Comput. Geosci. 2007, 11, 261–274. [Google Scholar] [CrossRef]
  12. Hassanizadeh, S.; Gray, W.G. Mechanics and thermodynamics of multiphase flow in porous media including interphase boundaries. Adv. Water Resour. 1990, 13, 169–186. [Google Scholar] [CrossRef]
  13. Barenblatt, G.I.; Patzek, T.W.; Silin, D.B. The Mathematical Model of Nonequilibrium Effects in Water-Oil Displacement. SPE J. 2003, 8, 409–416. [Google Scholar] [CrossRef]
  14. Das, D.B.; Mirzaei, M. Dynamic effects in capillary force relationships for two-phase flow in porous media: Experiments and numerical analyses. Aiche J. 2012, 58, 3891–3903. [Google Scholar] [CrossRef] [Green Version]
  15. Li, Y.; Liu, C.; Li, H.; Chen, S.; Lu, K.; Zhang, Q.; Luo, H. A review on measurement of the dynamic effect in capillary pressure. J. Pet. Sci. Eng. 2022, 208, 109672. [Google Scholar] [CrossRef]
  16. Bear, J. Dynamics of Fluids in Porous Media; American Elsevier Publishing Company Inc.: New York, NY, USA, 1988; ISBN-13: 978-0-486-65675-5. [Google Scholar]
  17. Das, D.B.; Hanspal, N.S.; Nassehi, V. Analysis of hydrodynamic conditions in adjacent free and heterogeneous porous flow domains. Hydrol. Process. 2005, 19, 2775–2799. [Google Scholar] [CrossRef]
  18. Kalaydjian, F. Effect of the Flow rate on an imbibition capillary pressure curvetheory versus experiment. In SCA European Core Analysis Symposium; Institute Francais du Petrole: Rueil-Malmaison, France, 1992; pp. 175–194. [Google Scholar]
  19. Bhusan, D.; Mirzaei, M. Experimental measurement of dynamic effect in capillary pressure relationship for two-phase flow in weakly layered porous media. AIChE J. 2013, 59, 1723–1734. [Google Scholar]
  20. Bottero, S.; Hassanizadeh, S.M.; Kleingeld, P.J.; Heimovaara, T.J. Non-equilibrium capillarity effects in two-phase flow through porous media at different scales. Water Resour. Res. 2011, 47, 10. [Google Scholar] [CrossRef]
  21. Hanspal, N.S.; Das, D.B. Dynamic effects on capillary pressure–Saturation relationships for two-phase porous flow: Implications of temperature. AIChE J. 2011, 58, 1951–1965. [Google Scholar] [CrossRef]
  22. Blank, L.; Rioseco, E.M.; Caiazzo, A.; Wilbrandt, U. Modeling, simulation, and optimization of geothermal energy production from hot sedimentary aquifers. Comput. Geosci. 2020, 25, 67–104. [Google Scholar] [CrossRef]
  23. Salimi, H.; Bruining, J. Upscaling of fractured oil reservoirs using homogenization including non-equilibrium capillary force and relative permeability. Computat. Geosci. 2012, 16, 367–389. [Google Scholar] [CrossRef]
  24. Mikelić, A. A global existence result for the equations describing unsatuvelocity flow in porous media with dynamic capillary force. J. Differ. Equ. 2010, 248, 1561–1577. [Google Scholar]
  25. Camps-Roach, G.; O’Carroll, D.M.; Newson, T.A.; Sakaki, T.; Illangasekare, T.H. Experimental investigation of dynamic effects in capillary force: Grain size dependency and upscaling. Water Resour. Res. 2010, 46, 863. [Google Scholar]
  26. Juanes, R. Nonequilibrium effects in models of three-phase flow in porous media. Adv. Water Resour. 2008, 31, 661–673. [Google Scholar] [CrossRef]
  27. Fuík, R.; Mikyka, J.; Sakaki, T.; Bene, M.; Illangasekare, T.H. Significance of dynamic effect in capillarity during drainage experiments in layered porous media. Vadose Zone J. 2010, 9, 697–708. [Google Scholar]
  28. Hajibeygi, H.; Lunati, I.; Lee, S.H. Accuvelocity and efficient simulation of multiphase flow in a heterogeneous reservoir with error estimate and control in the multiscale finite-volume framework. SPE J. 2012, 17, 1071–1083. [Google Scholar]
  29. Manthey, S.; Hassanizadeh, S.M.; Helmig, R. Macro-Scale Dynamic Effects in Homogeneous and Heterogeneous Porous Media. Transp. Porous Media 2005, 58, 121–145. [Google Scholar] [CrossRef]
  30. Mirzaei, M.; Das, D.B. Dynamic effects in capillary force–saturations relationships for two-phase flow in 3D porous media: Implications of micro-heterogeneities. Chem. Eng. Sci. 2007, 62, 1927–1947. [Google Scholar] [CrossRef]
  31. Peszyńska, M.; Yi, S.-Y. Numerical methods for unsatuvelocity d flow with dynamic capillary force in het-erogeneous porous media. Int. J. Numer. Anal Mod. 2008, 5, 126–149. [Google Scholar]
  32. Lv, C.; Wang, J.; Sun, Z.G. An experimental study on starting pressure gradient of fluids flow in low permeability sandstone porous media. Petrol. Explor. Dev. 2002, 29, 86–89. [Google Scholar]
  33. Xu, M.A.; Tian, S.B.; Zhou, S.W.; Lei, G. Investigation of the effect of dynamic capillary force on water flooding in ultra-low permeability reservoirs. Sci. Technol. Eng. 2015, 15, 153–155. [Google Scholar]
  34. Liu, P.; Yuan, Z.; Li, K. An improved capillary force model using fractal geometry for coal rock. J. Pet. Sci. Eng. 2016, 145, 473–481. [Google Scholar]
  35. Beliaev, A.Y.; Hassanizadeh, S.M. A Theoretical Model of Hysteresis and Dynamic Effects in the Capillary Relation for Two-phase Flow in Porous Media. Transp. Porous Media 2001, 43, 487–510. [Google Scholar] [CrossRef]
  36. Beliaev, A.Y.; Schotting, R.J. Analysis of a new model for unsatuvelocity d flow in porous media including hysteresis and dynamic effects. Computat. Geosci. 2001, 5, 345–368. [Google Scholar]
  37. O’Carroll, D.M.; Phelan, T.J.; Abriola, L.M. Exploring dynamic effects in capillary force in multistep outflow experiments. Water Resour. Res. 2005, 41, 312–329. [Google Scholar]
  38. Abidoye, L.K.; Das, D.B. Scale dependent dynamic capillary force effect for two-phase flow in porous media. Adv. Water Resour. 2014, 74, 212–230. [Google Scholar] [CrossRef] [Green Version]
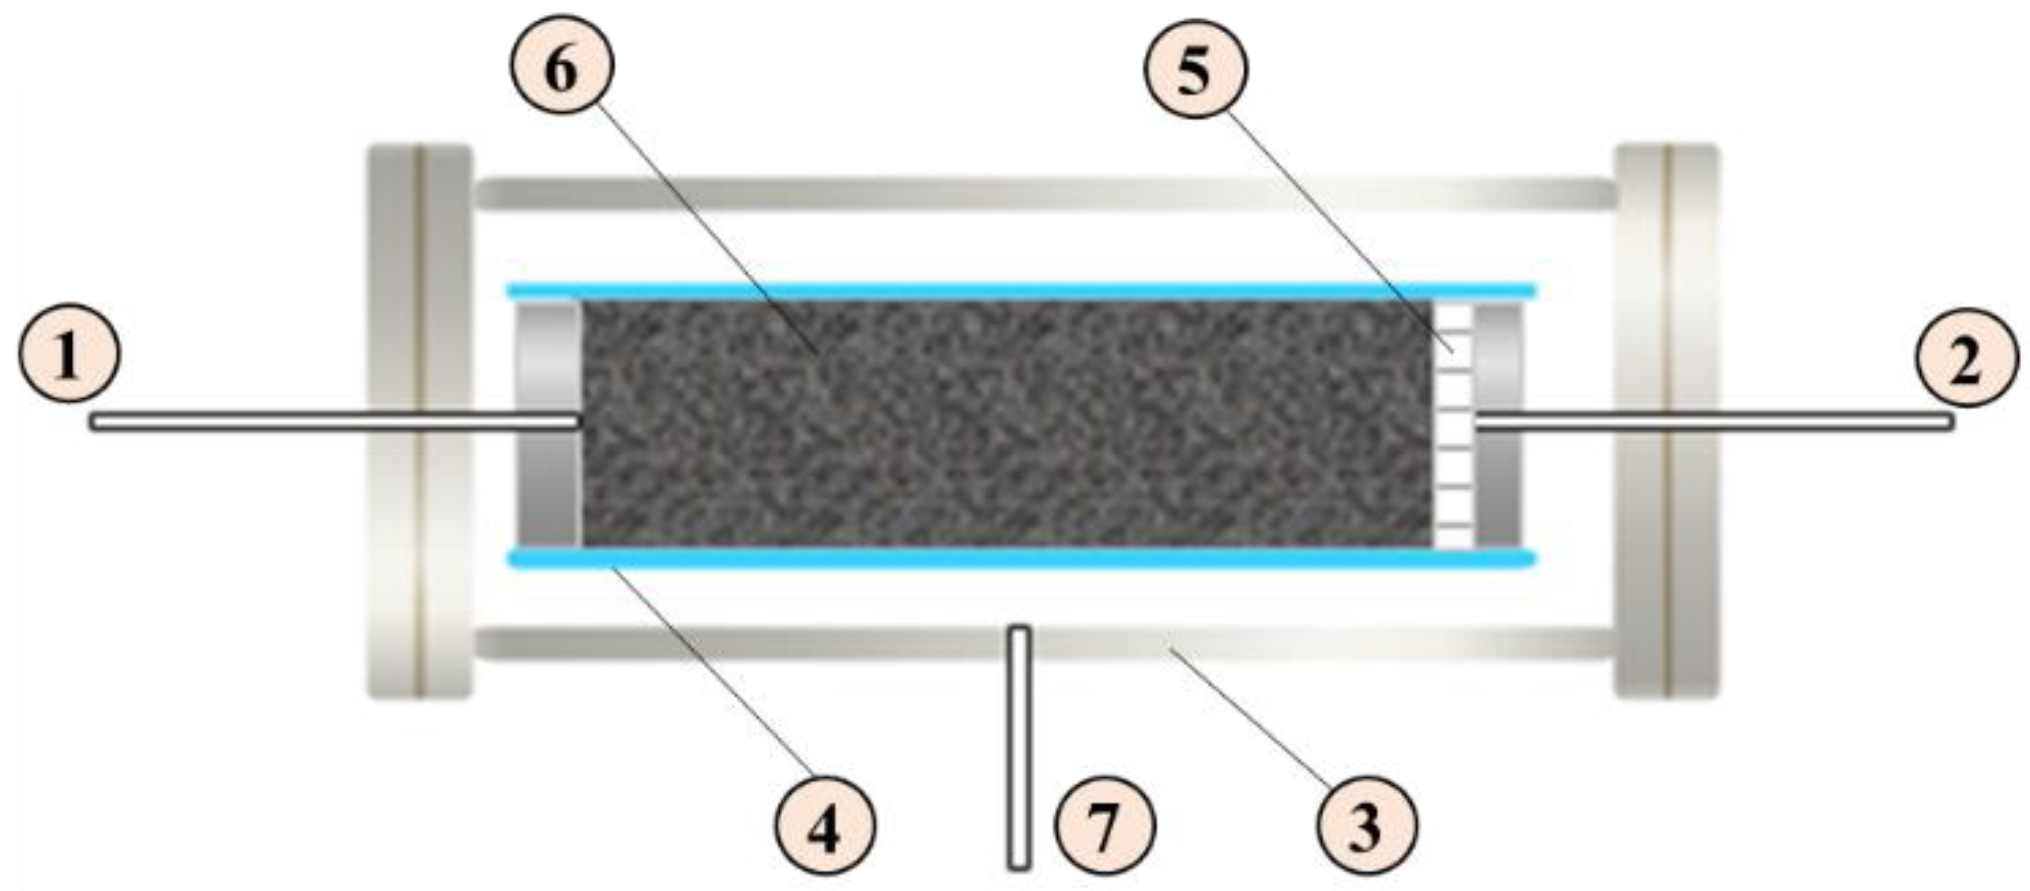
Figure 1. Static capillary-force tester based on semi-permeable membrane. ①. Fluid inlet; ②. wetting-phase outlet; ③. core holder; ④. rubber sleeve; ⑤. water wet diaphragm; ⑥. core; ⑦. confining pressure inlet.
Energies 16 01554 g001
Figure 2. Dynamic capillary-force monitoring experimental equipment. ①. Pump; ②. valves; ③. intermediate container (water); ④. intermediate container (oil); ⑤. pressure gauge; ⑥. six-way valve; ⑦. multifunction sensor; ⑧. monitoring system; ⑨. real-time metering device; ⑩. metering device.
Energies 16 01554 g002
Figure 3. Linear fitting of experimental data.
Energies 16 01554 g003
Figure 4. 3D homogeneous reservoir model containing five-spot well pattern.
Energies 16 01554 g004
Figure 5. Water cut under different formation pressures.
Energies 16 01554 g005
Figure 6. Oil recovery under different formation pressures.
Energies 16 01554 g006
Figure 7. Heterogeneous reservoir models where a five-spot well pattern is implemented: (a) horizontal heterogeneous model; (b) vertical heterogeneous model.
Energies 16 01554 g007
Figure 8. Oil recovery curves of the three different reservoir permeability distributions. (a) Oil recovery curves of the homogeneous reservoir. (b) Oil recovery curves of horizontal heterogeneous reservoir. (c) Oil recovery curves of vertical heterogeneous reservoir.
Energies 16 01554 g008
Figure 9. Comparison of oil recovery curves at different production rates of three types of geological reservoirs. (a) Oil recovery under different development strategies in the homogeneous reservoir. (b) Oil recovery under different development strategies in the horizontal heterogeneity reservoir. (c) Oil recovery under different development strategies in the vertical heterogeneity reservoir.
Energies 16 01554 g009
Figure 10. Reduction in dynamic capillary force for predicting oil recovery under different production rates.
Energies 16 01554 g010
Table 1. Reservoir basic parameters.
ParameterValueParameterValue
Thickness of reservoir (m)10Oil viscosity (mPa·s)10
Well spacing (m)200 Formation water viscosity (mPa·s)1
Porosity (%)20 Initial oil saturation (%)85
Permeability (mD)40Initial water saturation (%)15
Table 2. Numerical model parameters.
ParametersValueParametersValue
Horizontal permeability40.0 mDFormation pressure10/15/25 MPa
Vertical permeability4.0 mDProduction velocity8.0 m3/d
Porosity20.0%Injection velocity2.0 m3/d
Table 3. Parameters of heterogeneous reservoir model.
Reservoir ParametersValueReservoir ParametersValue
Formation pressure (MPa)10High permeability (mD)40
Well spacing (m)400Low permeability (mD)20
Production rate (m3/d)14Porosity 0.18
Disclaimer/Publisher’s Note: The statements, opinions and data contained in all publications are solely those of the individual author(s) and contributor(s) and not of MDPI and/or the editor(s). MDPI and/or the editor(s) disclaim responsibility for any injury to people or property resulting from any ideas, methods, instructions or products referred to in the content.