Article

Characteristics of High Flow Zones and a Balanced Development Strategy of a Thick Bioclastic Limestone Reservoir in the Mishrif Formation in X Oilfield, Iraq

Research Institute of Petroleum Exploration & Development, Petrochina, Beijing 100083, China
*
Author to whom correspondence should be addressed.
Energies 2023, 16(3), 1451; https://doi.org/10.3390/en16031451
Submission received: 27 December 2022 / Revised: 13 January 2023 / Accepted: 15 January 2023 / Published: 1 February 2023
(This article belongs to the Special Issue Advances in the Utilization of Underground Energy and Space)

Abstract

:
The Mishrif Formation in X Oilfield in Iraq is heterogeneous and has prominent development contradictions, and the development plan required urgent adjustment. Based on data regarding the core, cast thin sections, physical property, mercury injection experiments, and development performance, the main geological factors causing the unbalanced development of the Mishrif Formation are identified, and the corresponding development strategy is proposed. The results show that the High Flow Zones (HFZs) are the main geological factors causing unbalanced production in the thick bioclastic limestone reservoir. There are three kinds of HFZs in MA, MB1, and MB2 intervals, namely, the point shoal type, the tidal channel type, and the platform margin shoal type. All HFZs have different scales and distribution patterns. HFZs have ultra-high permeability and large permeability differences with the surrounding reservoir. During development, the oil mainly comes from HFZs, and the considerable reserves in the low permeability reservoir surrounding the HFZs are difficult to develop. The size of the pore throat of the HFZs greatly varies, and permeability is mainly dominated by the mega-pore throat (>10 μm) and the macro-pore throat (2.5~10 μm). In water flood development, the injected water rapidly advances along the mega-pore throat and the macro-pore throat, and the oil in the micro-pore or medium-pore throats are difficult to be displace. It can be concluded that the Mishrif Formation is vertically heterogeneous. The connectivity of HFZs in different intervals greatly varies. As a result, the Mishrif Formation is divided into three development units, MA, MB1, and MB2 + MC, and production wells are deployed in HFZs. The MA adopts a reverse nine-point injection-production pattern, for which the well spacing is 900 m using a vertical well, and the injection well should avoid the HFZs near the faults. The MB1 adopts an irregular five-point injection-production pattern using a vertical well, and the injection wells are deployed at the edge of the tidal channel or in the lagoon. MB2_1 deploys horizontal production wells, for which the well spacing is 900 m. Horizontal production wells, for which the well spacing is 300 m, are deployed in the lower MB2, and the lateral horizontal production wells are converted into injection wells after water breakthrough, and the horizontal wells deployed in the lower part of MC should moderately inject water.

Graphical Abstract

1. Introduction

The X Oilfield is located in southeastern Iraq, the frontal zone of the Mesopotamia basin [1]. The oilfield is a broad and gentle long-axis anticline with a north-south orientation, and the west flank of the anticline is steeper than the east flank (Figure 1). The X Oilfield is a carbonate oilfield with considerable remaining recoverable reserves. The main production zone is the Mishrif Formation in the Upper Cretaceous, which is thick bioclastic limestone. Due to its strong heterogeneity and poor understanding regarding the reservoir, there have been some serious problems in its development. The Mishrif Formation was exploited to depletion in its early stages, with large intervals being perforated, and production was high. Production logging tests (PLT) have shown that oil mainly comes from High Flow Zones (HFZs). HFZs refer to thin reservoirs with ultra-high permeability and large permeability differences with the surrounding reservoir [2,3,4,5]. However, the reserve in HFZs accounts for a small proportion of the Mishrif Formation, resulting in the short duration of high production. As the waterflood development was implemented, and although reservoir pressure and production have somewhat recovered, the injected water has rapidly advanced along the HFZs. High-yield oil wells have premature water breakthrough and rapidly rising water cut, which forced the shutting down of the well, while the oil in the thick medium or low permeability reservoirs was not effectively displaced. As a result, production at different intervals is extremely unbalanced. At present, the pressure of the Mishrif Formation has been reduced by 30%, the recovery ratio is only 5%, and the water cut has exceeded 10%. Therefore, the development strategy needs to be urgently adjusted.
The Mishrif Formation is one of the most important zones in the Middle East, especially in southeastern Iraq. The Mishrif Formation consists of may widely developed oilfields in this area, such as Missan, Rumaila, Majnoon, Halfaya, Ratawi, and Ahadb [6,7,8,9]. Research on the Mishrif Formation at different oilfields has been conducted and widely reported on sedimentation, genesis, reservoir characterization, and evaluation [10,11,12,13]. Previous studies on the Mishrif Formation in the X Oilfield have involved reservoir characteristics and genesis [14,15,16], rock typing [17,18,19], microstructure [20], baffles, and barriers [21]. Some geological knowledge has already been acquired, such as regarding the sequence, depositional environment, and diagenesis [22]. However, the following problems still exist. ① The reservoir heterogeneity in the Mishrif Formation is poorly understood; therefore, in the early stages of development, the whole Mishrif Formation was regarded as a homogeneous reservoir, and a commingled injection-production development method was adopted. ② HFZs are widely developed in the Mishrif Formation, and their genesis and distribution have been poorly studied. ③ The previous studies have mainly focused on characteristics descriptions and geologic processes, and the combination with developmental performance was insufficient. No corresponding advisable suggestions have been proposed for its development based on reservoir heterogeneity so far.
In view of the above problems, through the analysis of reservoir properties and perforation, this paper first determines the main causes of unbalanced development and the geological characteristics of HFLs are systematically analyzed. According to the sedimentation, the HFLs are classified and their characteristics, such as petrology, microstructure, and distribution, are clarified. Finally, in view of the connectivity and distribution of the HFLs, the corresponding strategies are proposed, which could guide the efficient waterflood development of thick bioclastic limestone reservoirs.

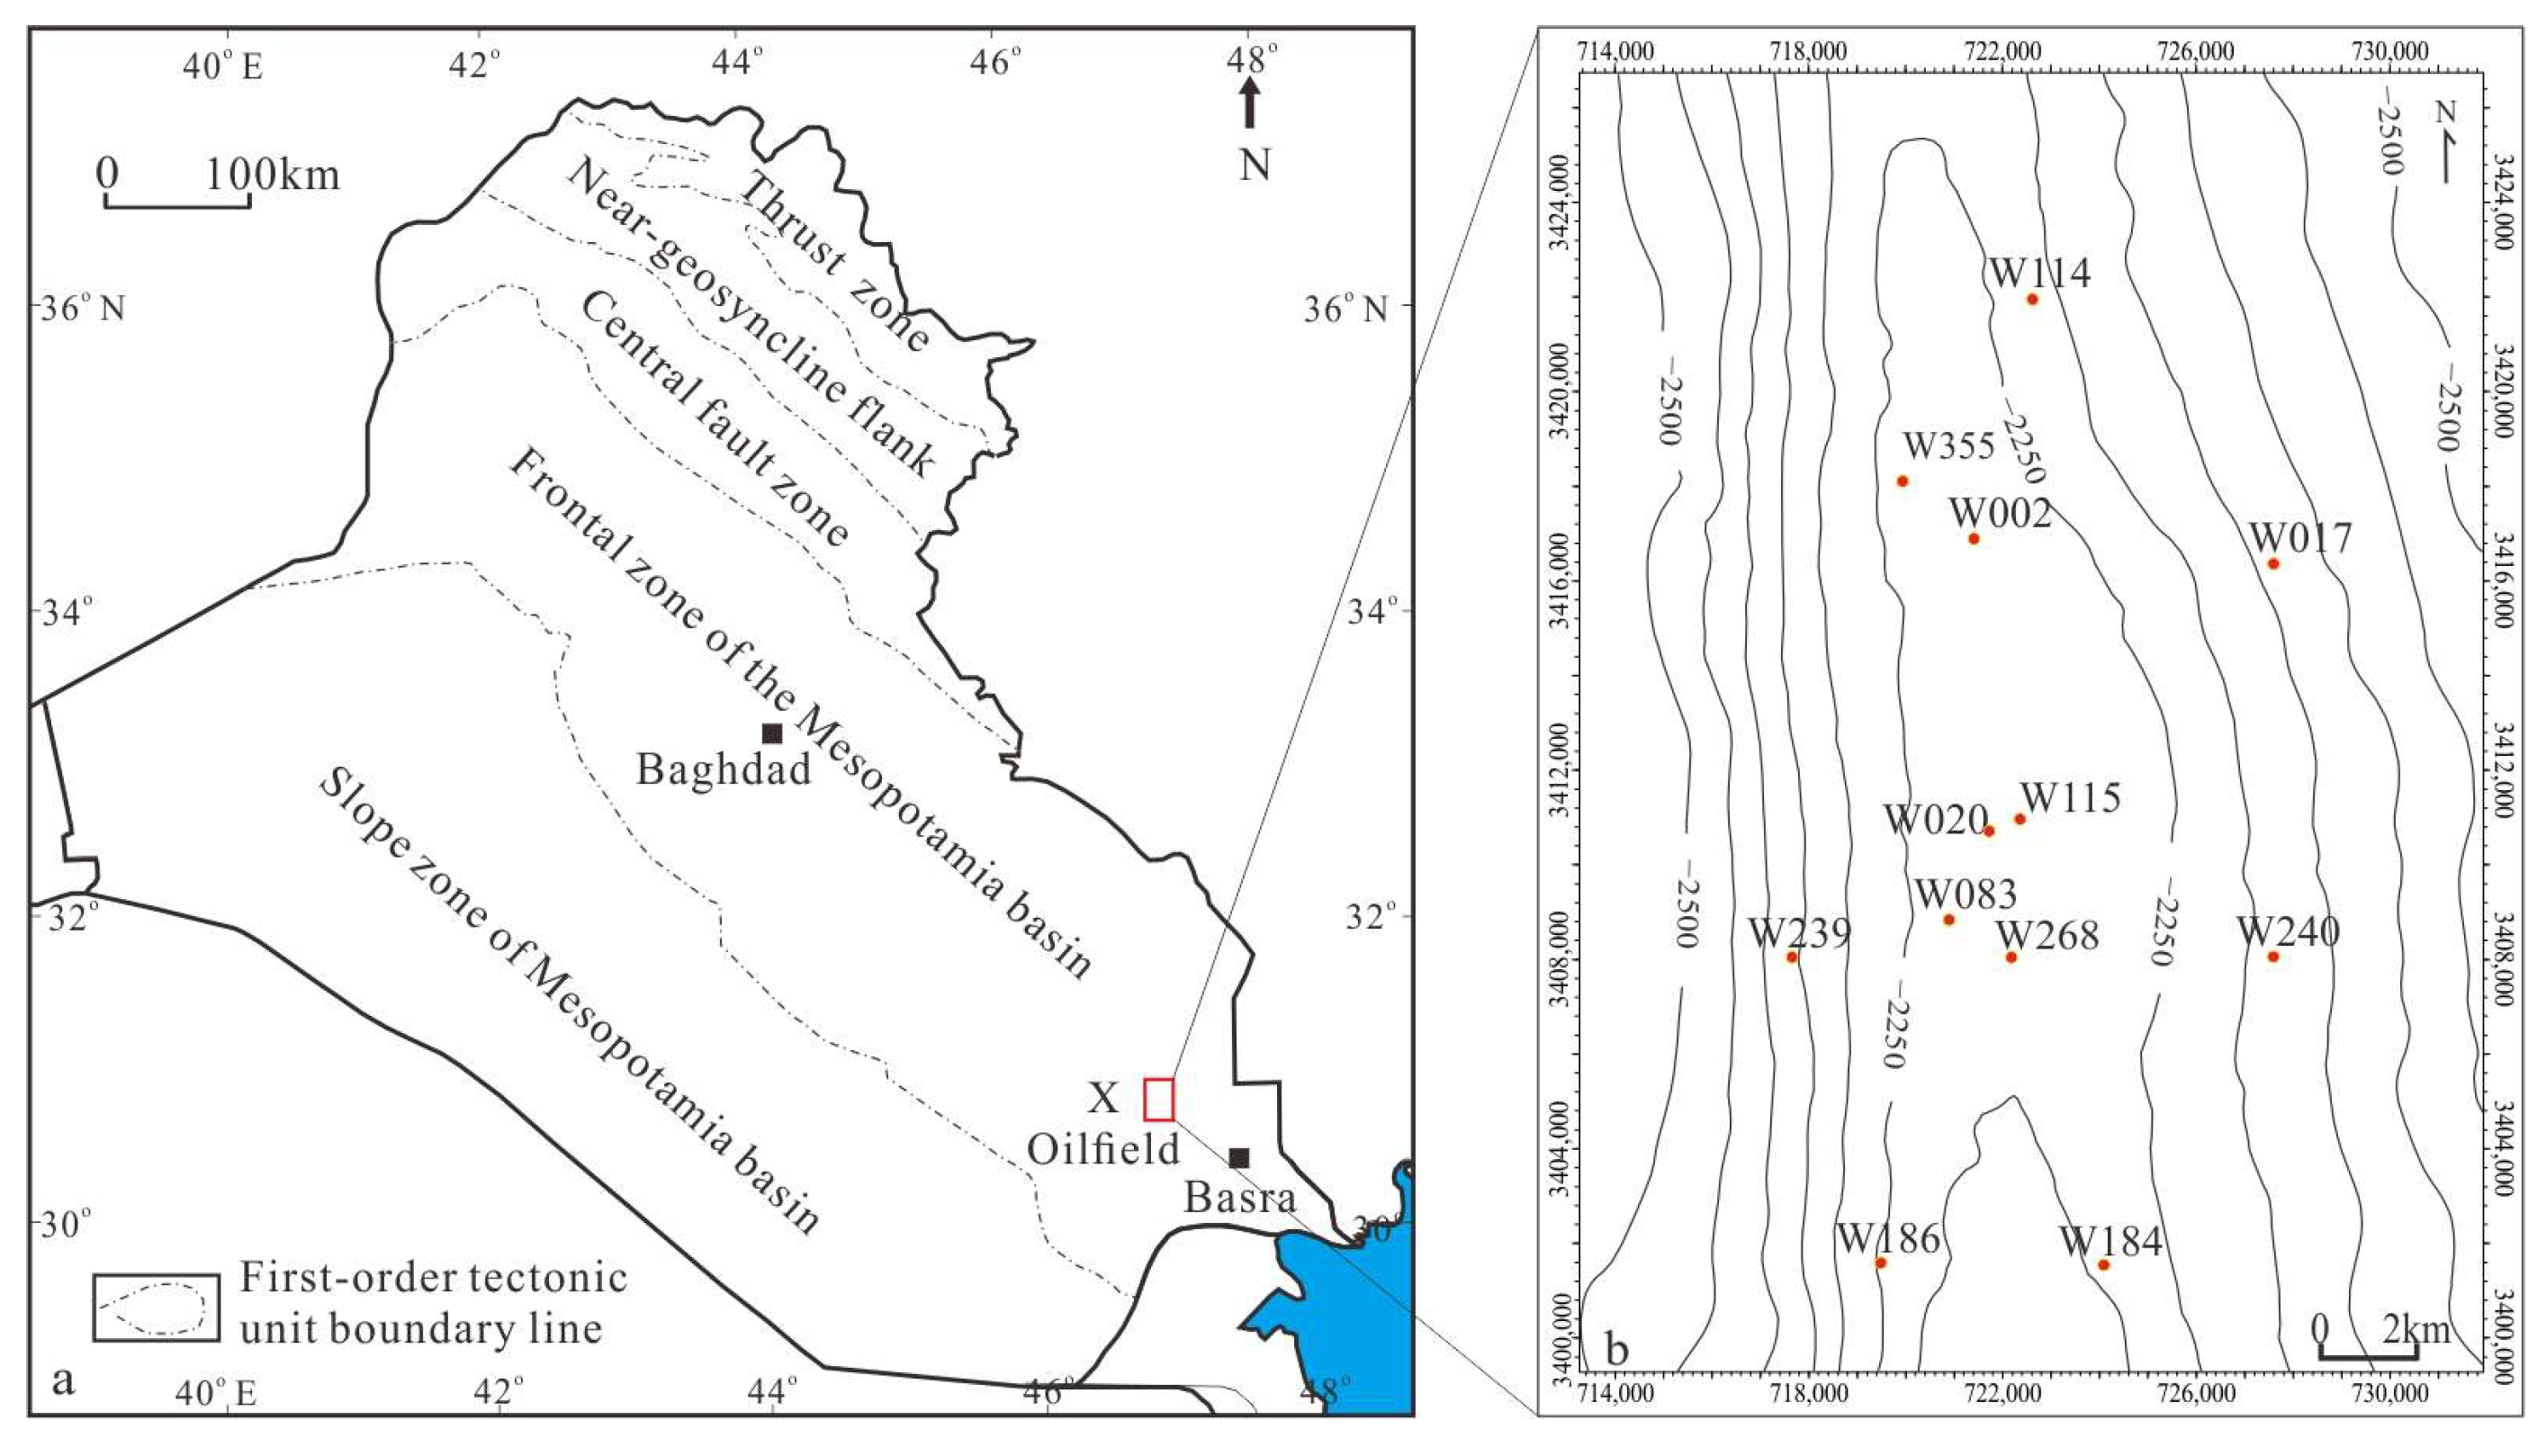
2. Geological Setting

The Cenomanian to early Turonian period in the Middle East and Africa was an important period, when many giant oil and gas reservoirs were developed [23]. During this period, the Khasib Formation, Mishrif Formation, Rumaila Formation, and Ahmadi Formation were developed in southeastern Iraq. The Ahmadi Formation underlies the Rumaila Formation, which conforms with the overlying Mishrif Formation. The Mishrif Formation is in unconformable contact with the overlying Khasib Formation [10,24,25]. During this period, southeastern Iraq was on a stable passive continental margin. The Mishrif Formation was in a ramp environment. From the land to the basin, supratidal flats, lagoons, point shoals, tidal channels, platform margin shoals, front shoal, the slope bottom, and deep shelf were developed.
Six third-order depositional sequences were developed in the Cenomanian [23]. There were four historical sequences (SQ1~SQ4) in the Mishrif Formation in the X Oilfield. Each different sequence had different depositional facies and successions. In SQ1 of the X Oilfield, the depositional succession had a deep shelf—slope bottom—front shoal—platform margin shoals. The sea level declined, but the shoal scale remained small (Figure 2a,b). The depositional succession in SQ2 had a slope bottom—front shoal—platform margin shoals in the X Oilfield. When the sea level declined, there was a prograde of the front shoal and platform margin shoals from north to south, and, in the late highstand system tract, the entire area was dominated by large scale platform margin shoals (Figure 2c–e). As the sea level rapidly declined, the lowstand system tract developed and the SQ3 began; the study area was exposed and the deposition of carbonate rocks stopped. When the sea level rose again, the water covered the exposed shoals and sedimentation occurred again. The lagoon environment developed throughout the whole area in SQ3. With the decline in sea level, the tidal action intensified in the lagoon (Figure 2f,g), The sea level continued to decline, and the facies continued to prograde southward. In the lowstand systems tract, the study area evolved into a supratidal flat (Figure 2h). With the rapid rise of sea level and the weakening of tides, the supratidal flats retreated to the north in the X Oilfield (Figure 2i), and the transgressive system tract was dominated by a lagoon environment, with small scale point shoals locally developed. The study area was mainly a developed lagoon with point shoals until the SQ4 was over (Figure 2j).
The Mishrif Formation is vertically divided into six intervals (CRI, MA, CRII, MB1, MB2, MC) with fifteen subzones (Figure 3). The MC interval is located at the bottom of the Mishrif Formation, corresponding to SQ1. The lower boundary is the bottom boundary of Mishrif Formation. The upper boundary is in contact with the MB2 interval, but there is an obvious sedimentary facies change. The MB2 interval corresponds to SQ2. The top boundary, which is a dissolution surface, is in unconformable contact with the MB1 interval. Furthermore, from MB2 to MB1, the sedimentary environment evolves from the platform margin shoal to the lagoon. The MB1 interval and CRII interval belong to the same sequence, SQ3. The MB1 interval is in conformity with the CRII interval. The only difference between the two is that the CRII interval, which is the sequence boundary of SQ3, is tighter. The boundary surface of the CRII interval and the MA interval is an obvious facies change. The MA interval and CRI interval belong to the same sequence, SQ4. The MA interval is in conformity with the CRI interval, and the top boundary is not obvious. However, the CRI interval is tighter than the MA interval. The CRI interval is located at the top of the Mishrif Formation, which is a regional unconformity surface.

3. Materials and Methods

There are a total of twelve coring wells, which are mainly concentrated in the middle and upper Mishrif Formation (Figure 3b). The cumulative length of the core is 2106.78 m, there are 598 cast thin sections (with a sampling frequency of 1 to 2/m), 3263 physical properties (with a sampling frequency of 2 to 3/m), 514 mercury injections, and 66 nuclear magnetic resonances (NMR). Furthermore, there are plentiful production logging tests (PLT).
Based on physical properties and PLT, the main controlling factors of the unbalanced development were determined first. Secondly, the HFLs parameters, types, and distribution were studied in combination with core, cast thin sections, mercury injection, nuclear magnetic resonance, and well logging. Capillary pressure curves are of great importance in reservoir characterization [26], which are used to describe the microstructure. Thirdly, reservoir connectivity was analyzed according to physical properties. Finally, a reasonable development strategy was put forward based on the geological studies.

4. Results

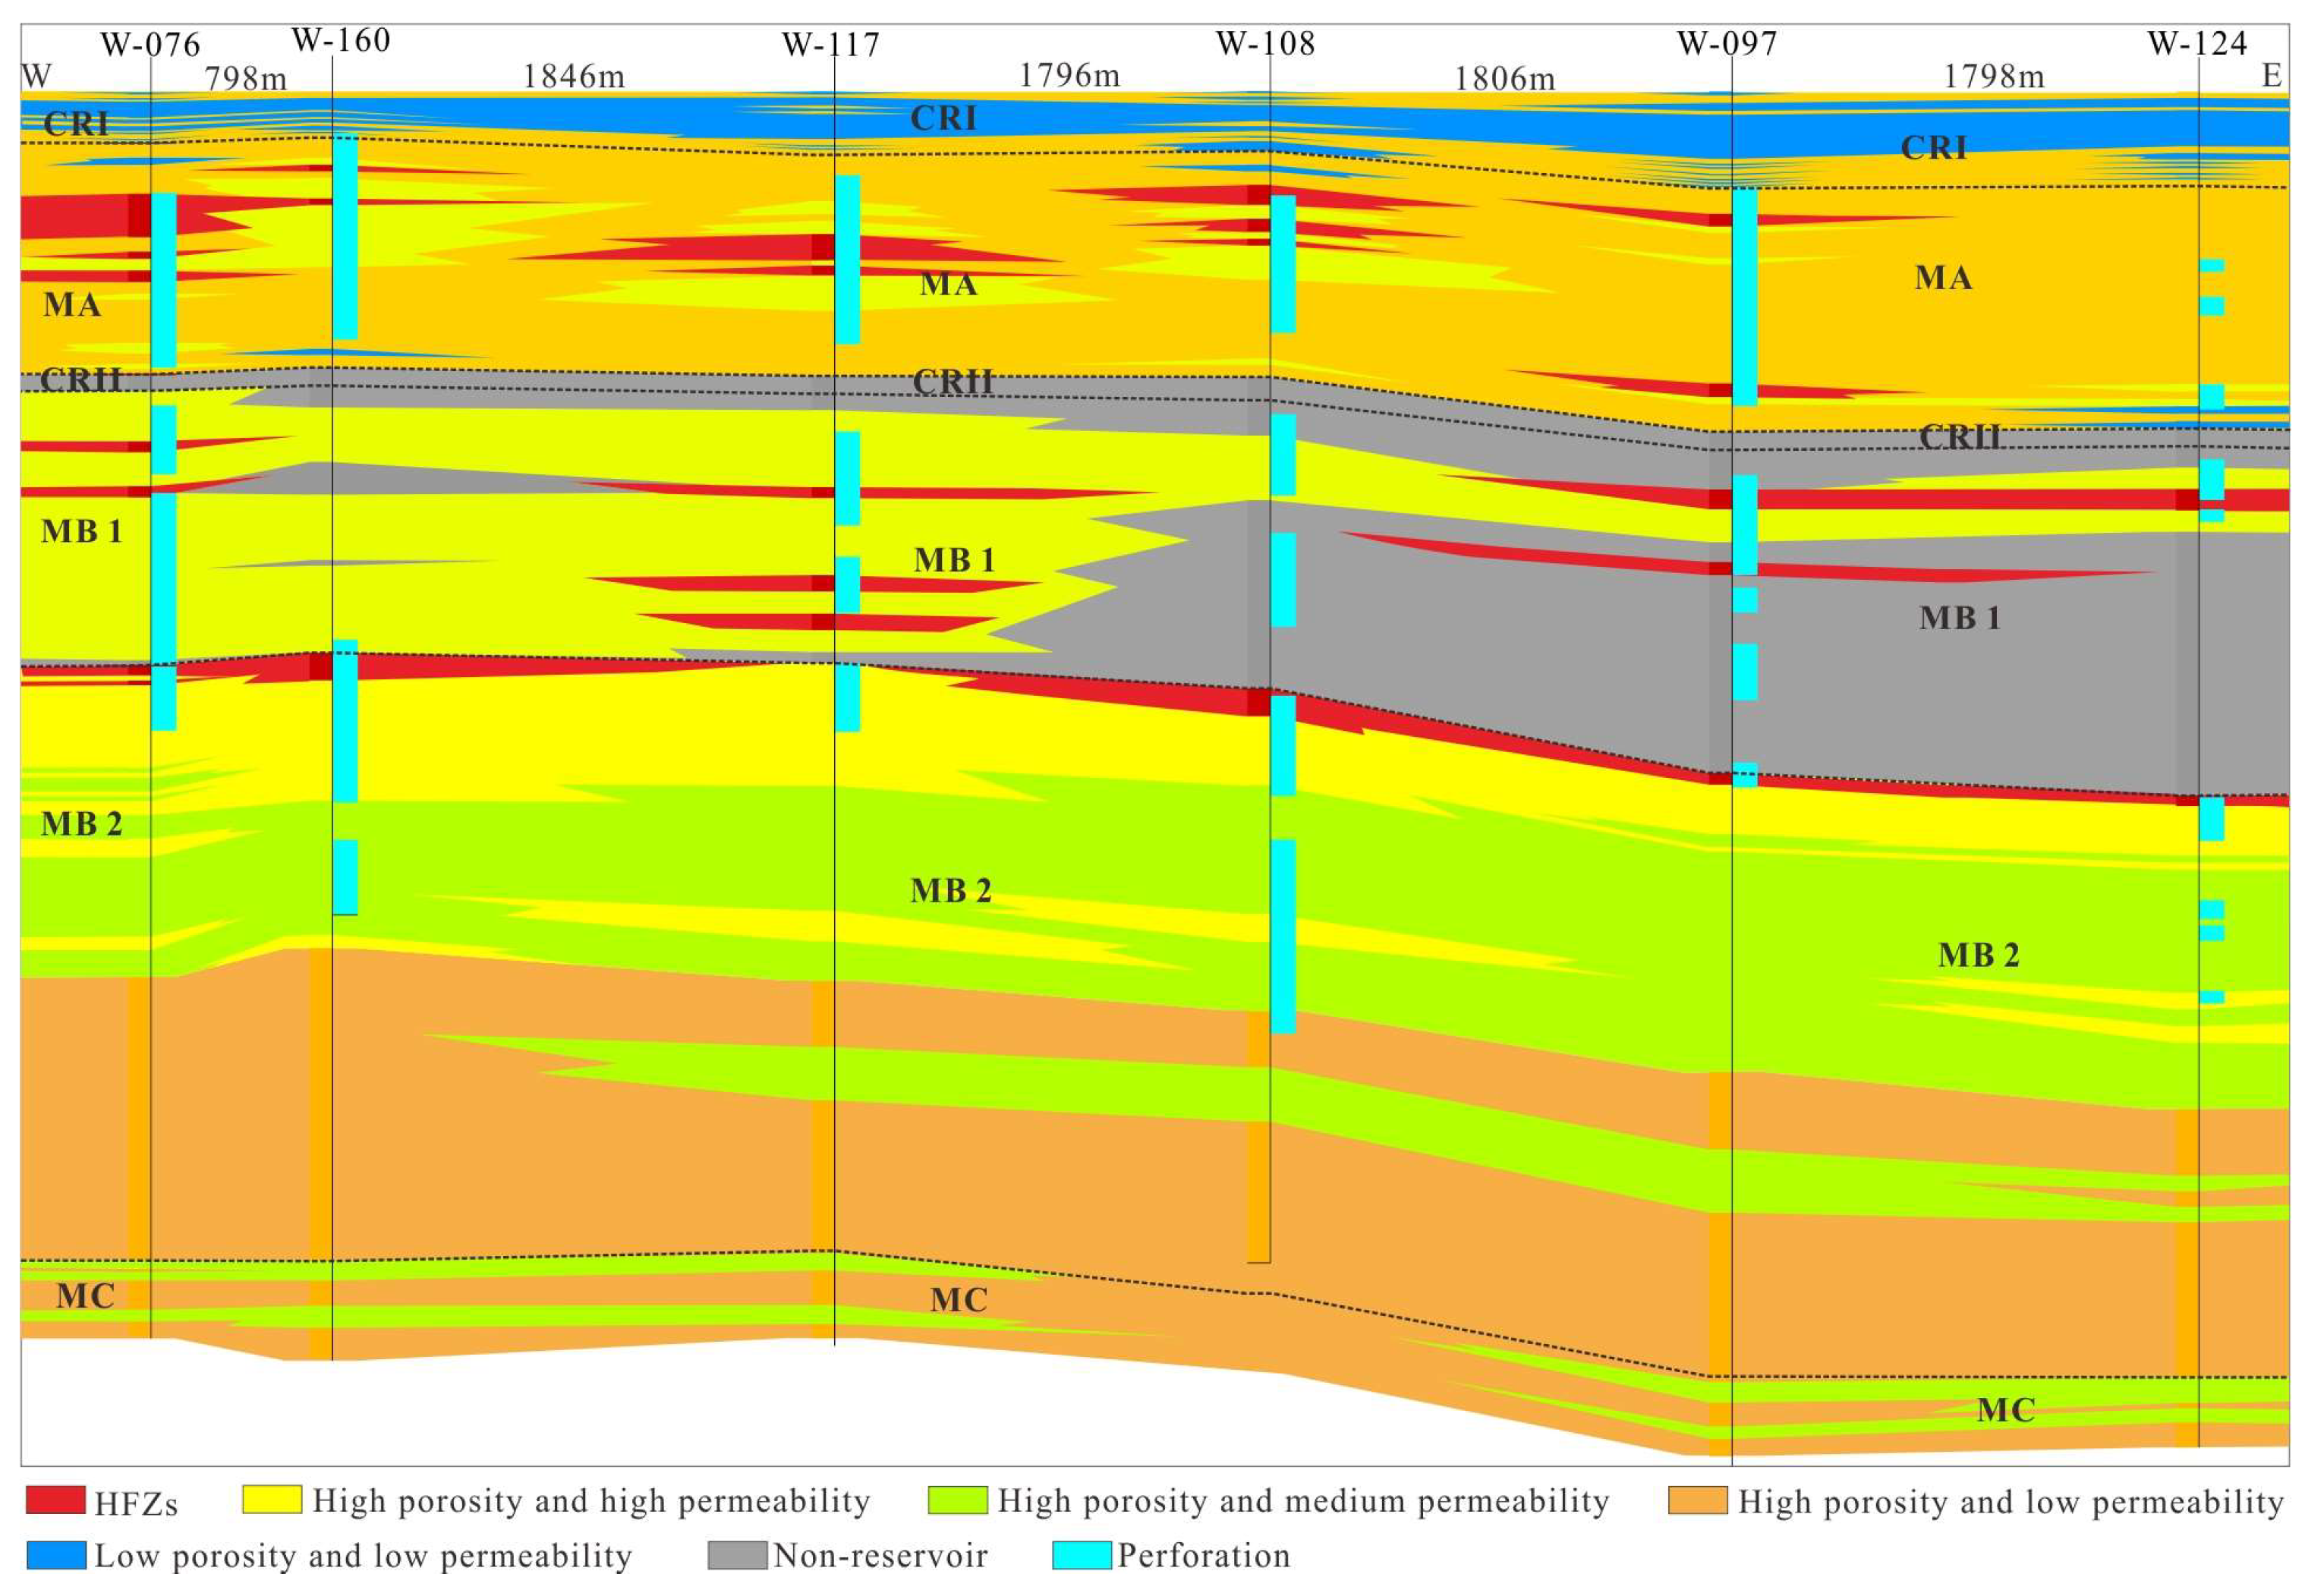
4.1. Geological Factors of Unbalanced Development

The thickness of the Mishrif Formation is nearly 400 m, and the vertical heterogeneity is intensive. The CRI interval and CRII interval are tight, which is difficult to develop. The good reservoir is mainly in the MA, MB1, MB2, and MC intervals. However, the MC interval is close to the bottom water of the reservoir, so it has not been developed. At present, perforations are mainly deployed in the MB2, MB1, and MA intervals.
The average thickness of the MB2 interval is about 100 m, and the reservoir is relatively homogeneous. The reservoir from bottom to top in MB2 has high porosity and low permeability, high porosity and medium permeability, high porosity and high permeability, and HFZs. There is a huge permeability difference between the HFZs and the underlying reservoir, and the perforation length is large (Figure 4). PLTs show that produced oil in MB2 mainly comes from the HFZs, and the oil in other reservoirs has not been developed. The HFZs are the main factors that cause the unbalanced production in MB2.
The average thickness of the MB1 interval is about 40 m, the proportion of tight reservoirs is high, and the physical properties abruptly and laterally change. The good reservoirs are high porosity and high permeability, and HFZs. Perforations are present in both reservoirs and tight reservoirs (Figure 4). PLTs show that the HFZs are the main contributors for MB1 production, while the oil in the surrounding rock is not developed.
The average thickness of the MA interval is about 40 m, with strong heterogeneity because of the many reservoir types and abrupt changes in physical properties. Perforations are present in all reservoirs (Figure 4). PLTs show that the oil in the MA intervals are mainly produced in HFZs, while the oil in the surrounding rock is not developed.
Overall, HFZs are the main geological factors causing the unbalanced development in the Mishrif Formation in X Oilfield. However, the oil is mainly in the thick medium-low permeability reservoir; that is, the permeability is between 1~100 mD. The permeability of HFZs are 1~3 orders higher than that of the reservoir, and large perforations make it difficult to evenly produce oil. During waterflood development, the injected water advances along the HFZs, and water cuts in oil wells rapidly rise [2,27,28,29], while the oil in the surrounding reservoirs are not effectively displaced.

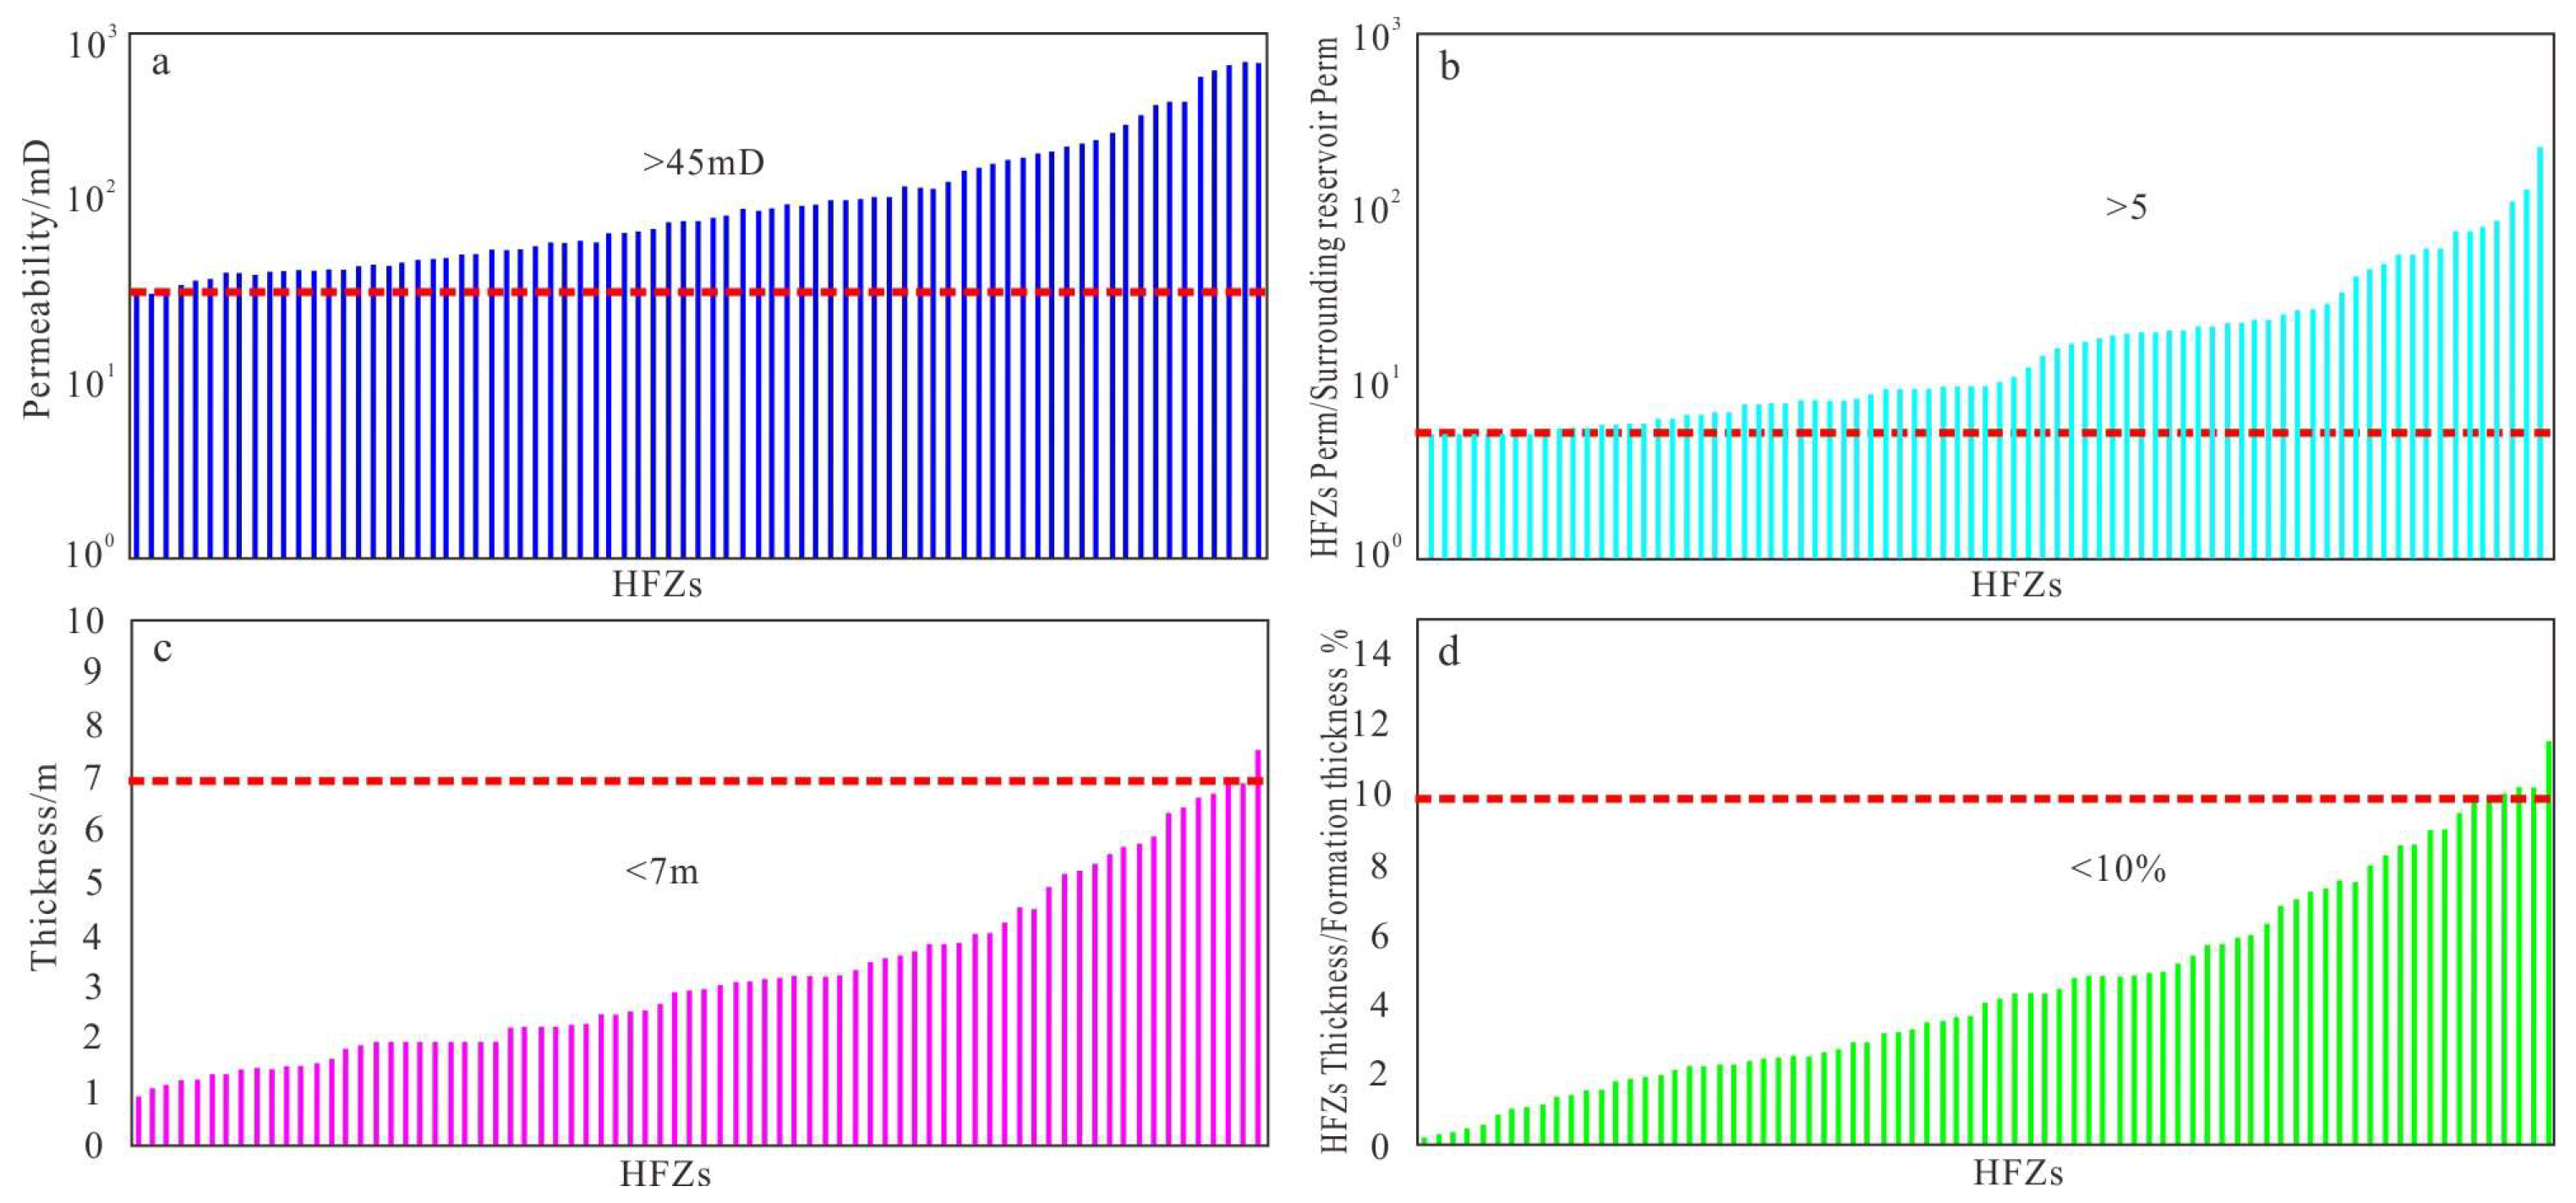
4.2. HFZs Characterization

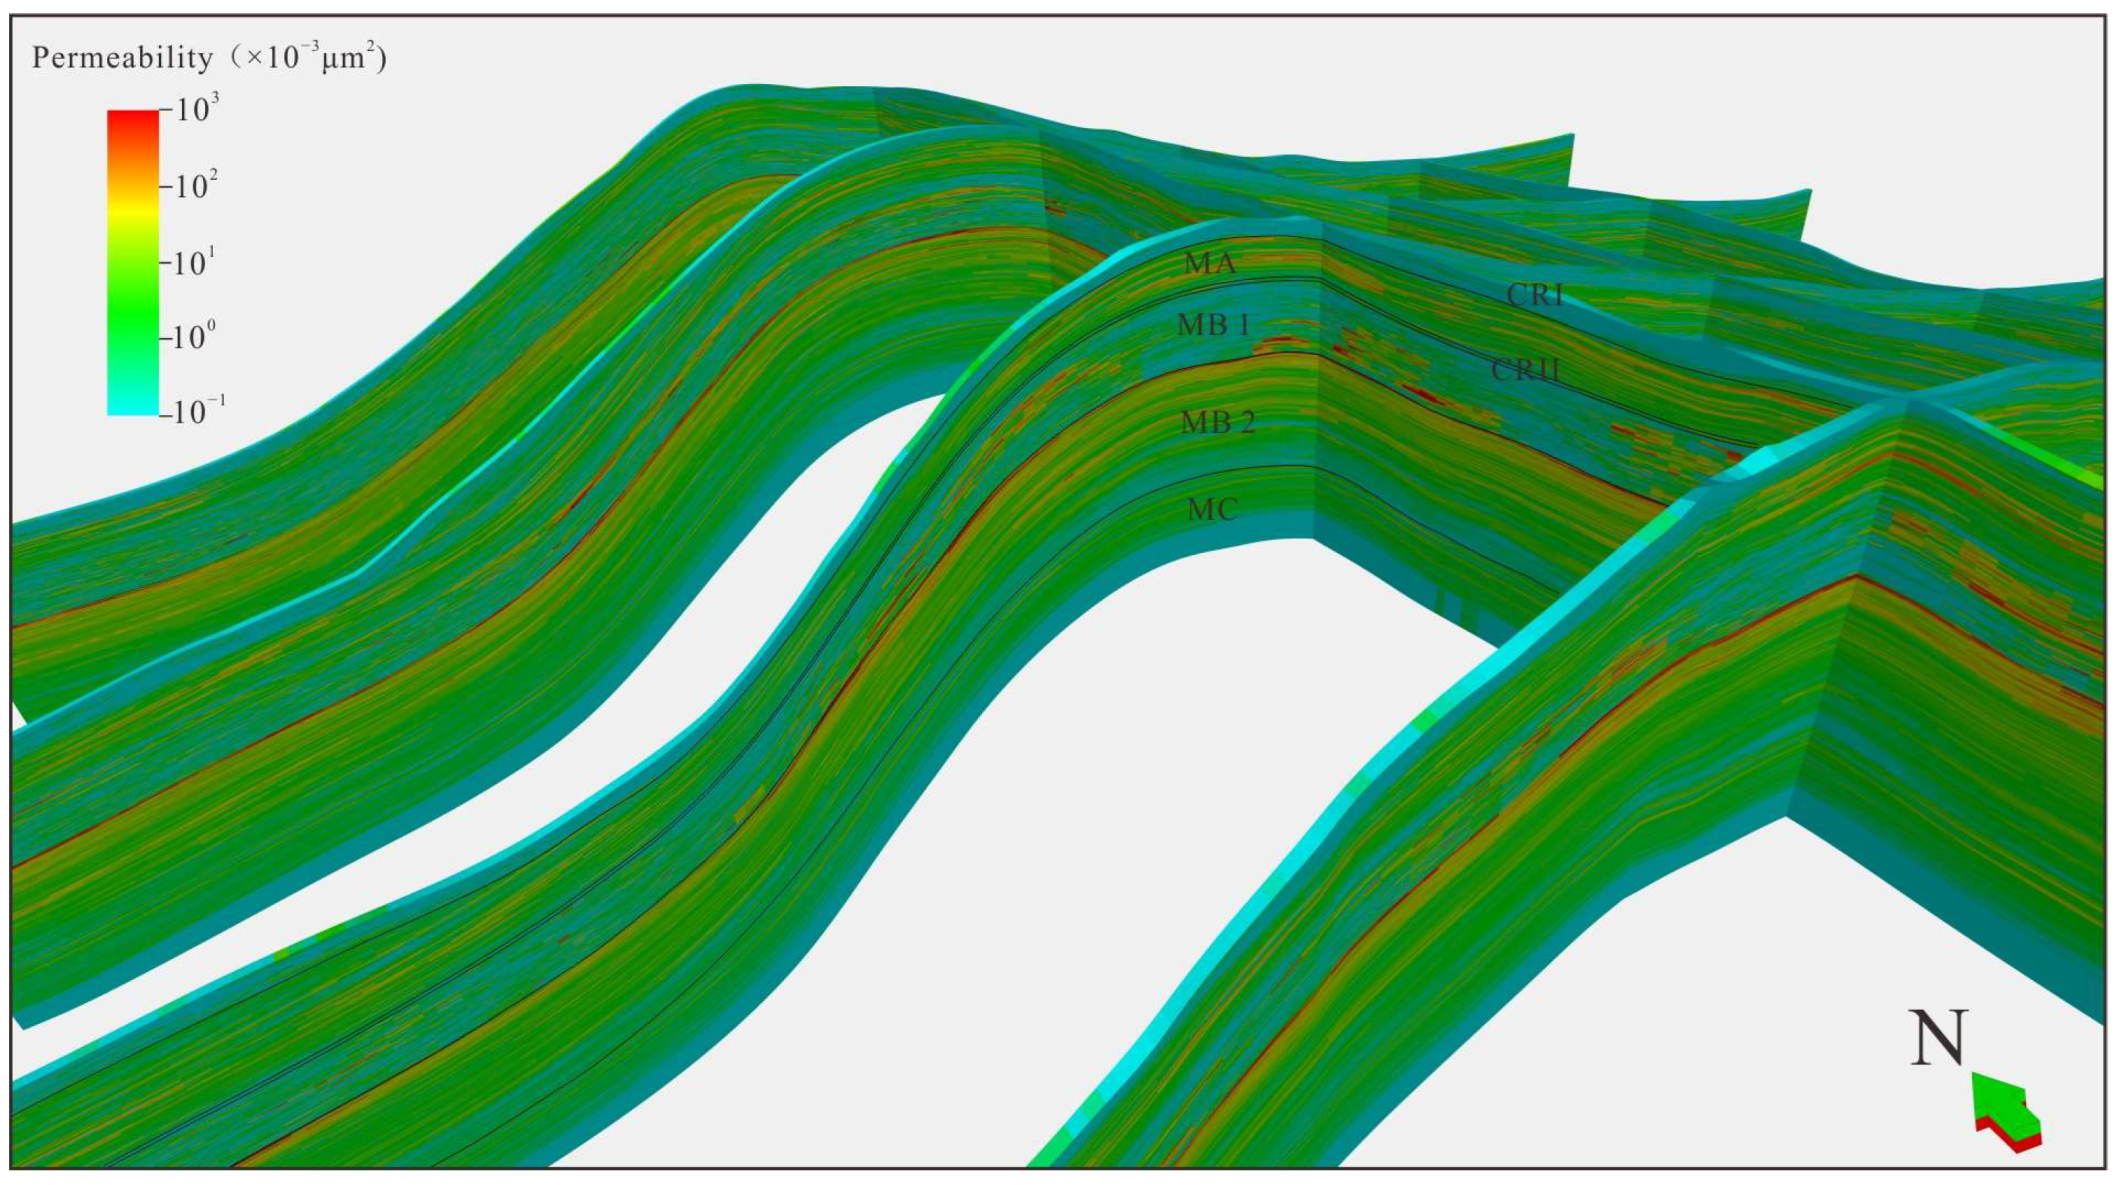
4.2.1. Permeability and Thickness

The permeability of the HFZs in the Mishrif Formation in X Oilfield is usually greater than 45 mD (Figure 5a), and the highest can reach to the Darcy level. The permeability of HFZs is at least five times greater than that of the surrounding rock, and the maximum difference can reach three orders (Figure 5b) higher. The thickness of the HFZs is generally less than 7 m (Figure 5c) and the thinnest is less than 1 m. The thickness proportion of HFZs in Mishrif Formation is generally less than 0.1 (Figure 5d), but it contributes nearly 90% of the production.

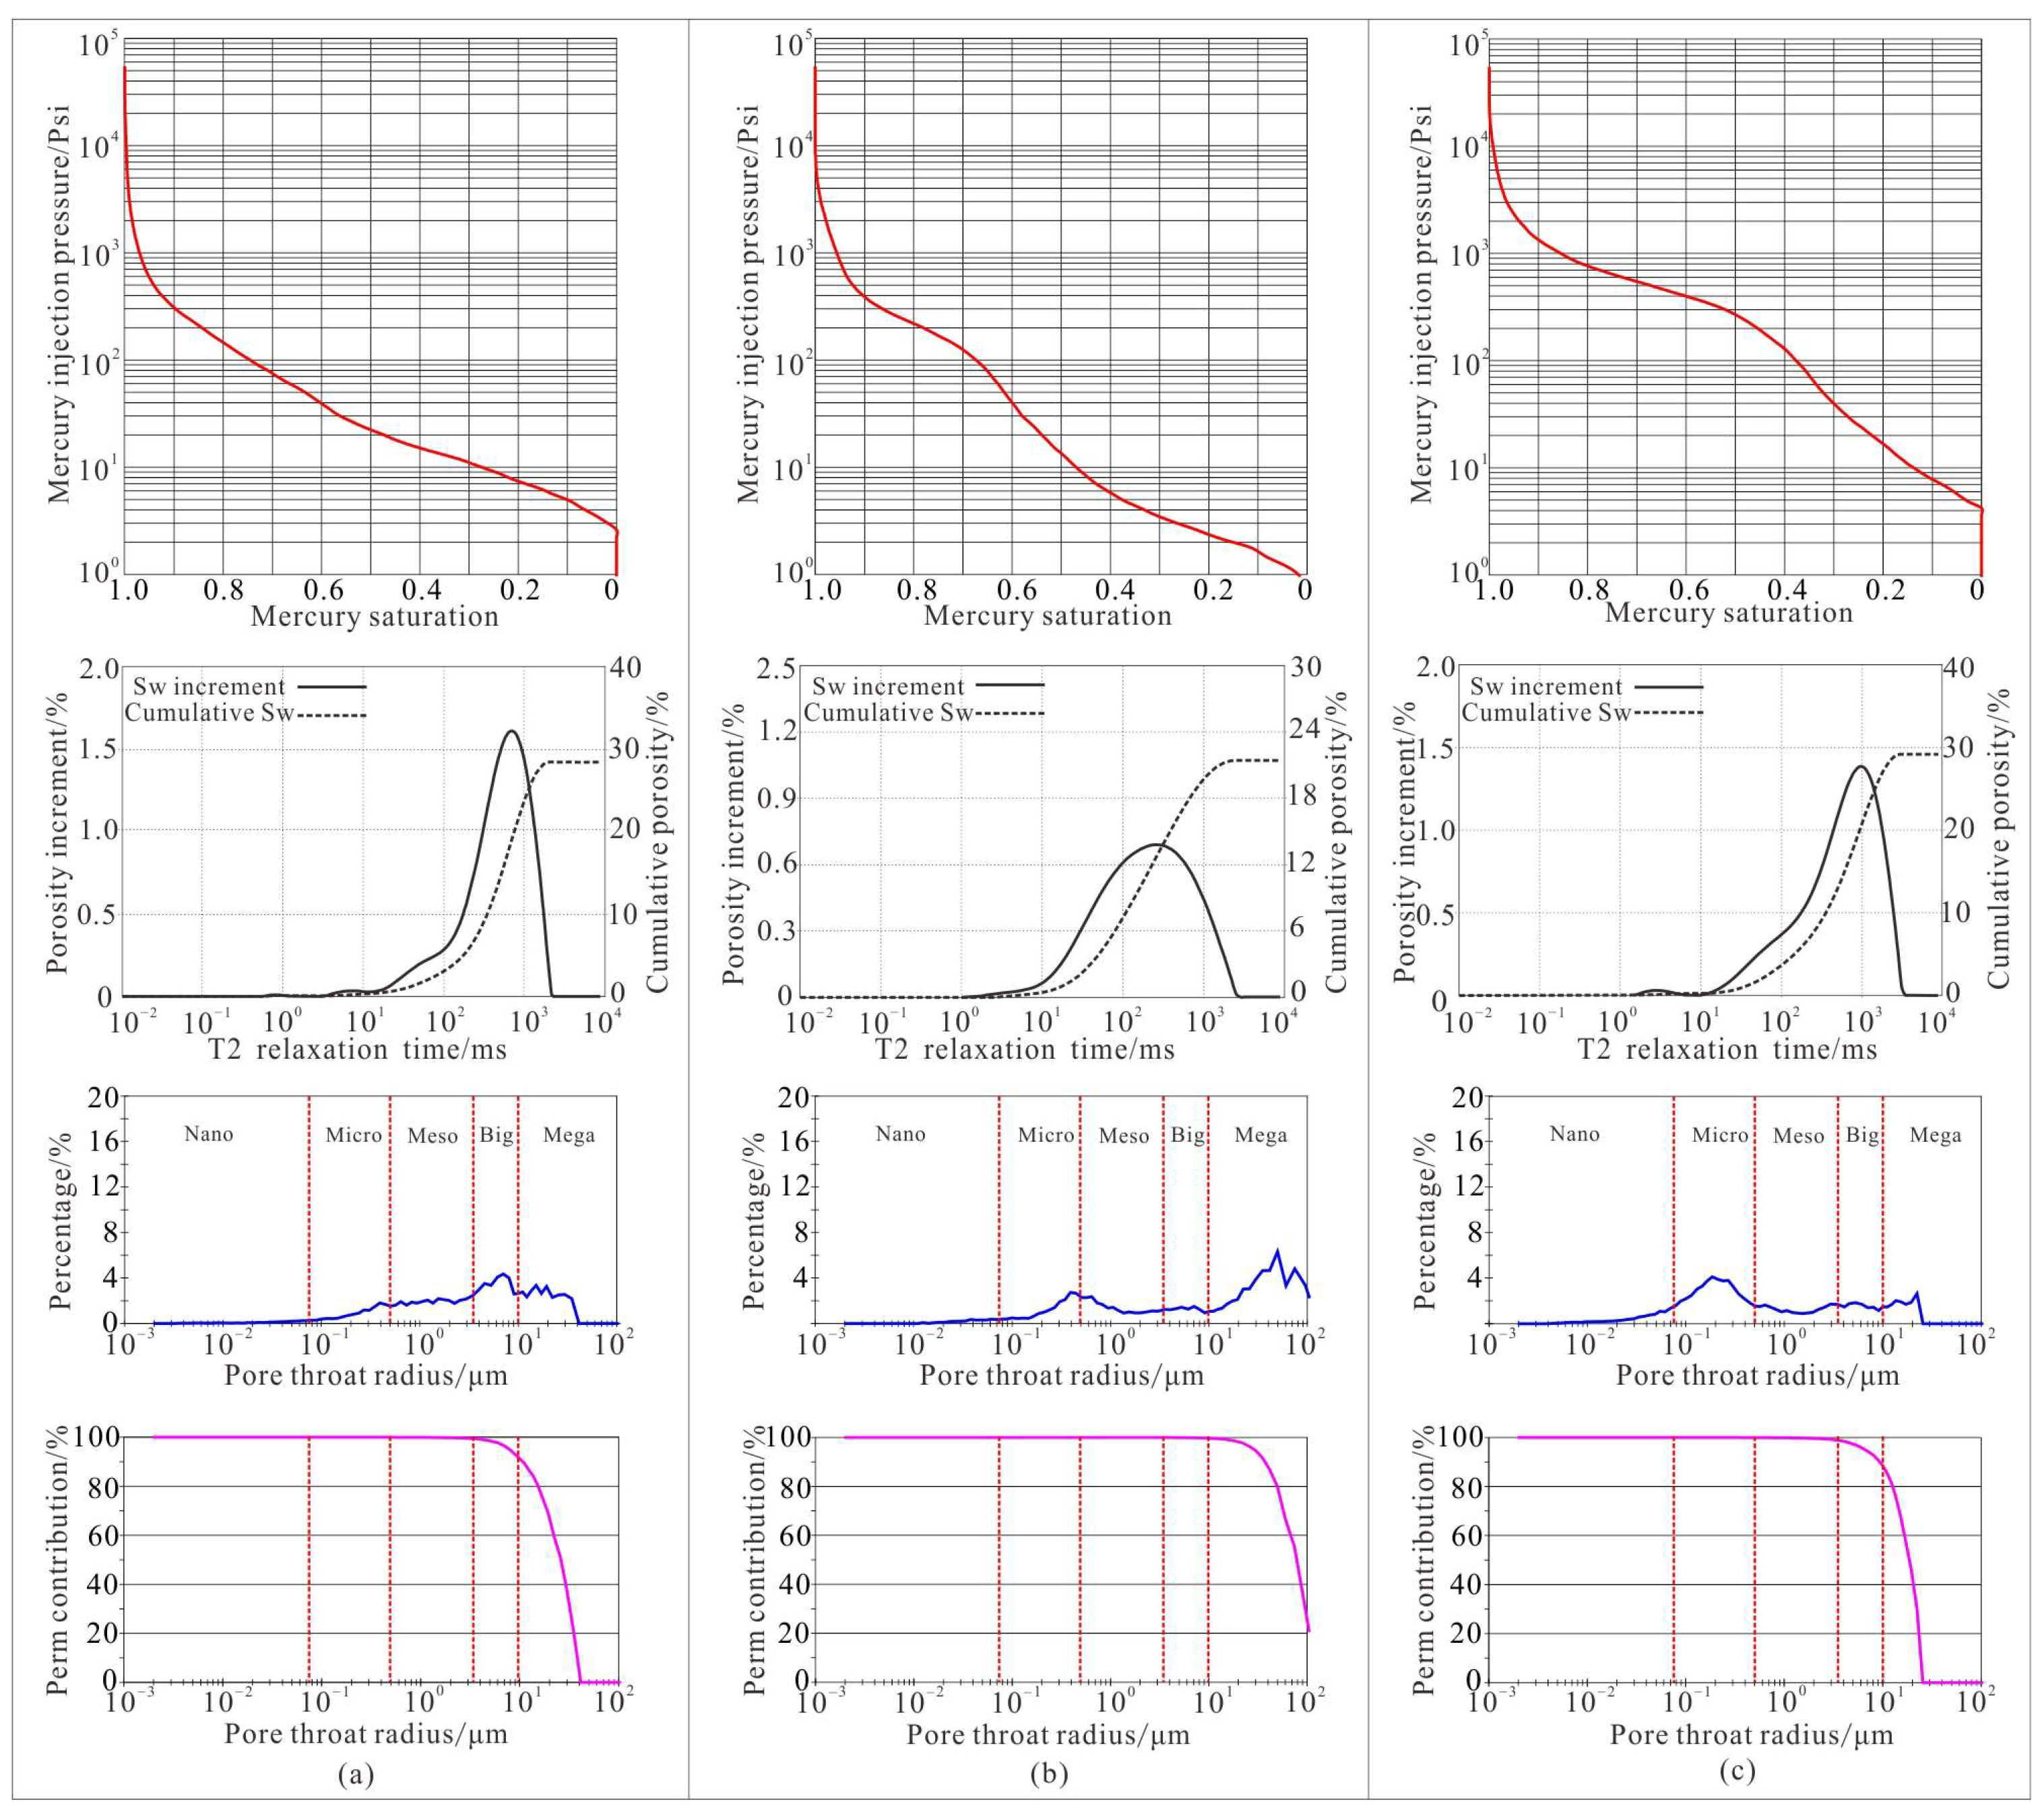
4.2.2. Types and Pores

There are 12 microfacies types in the Mishrif Formation in X Oilfield, which are MFT1~MFT12. MFT1 is wackstone with an obvious geopetal structure and birdseye structure in the cast thin sections (Figure 6a). MFT1 developed in the tidal flat. MFT2 is wackstone and a few small benthonic foraminifera can be seen in the cast thin sections (Figure 6b). MFT2 represents a low energy environment developed in a lagoon. MFT3 is packstone and a large amount of benthonic foraminifera can be seen in the cast thin sections (Figure 6c). MFT3 represents a medium energy environment developed in a lagoon or point shoal. MFT4 is grainstone and a large amount of benthonic foraminifera can be seen in the cast thin sections (Figure 6d). Particle size is small with some cement in intergranular pores, representing a high energy environment, such as a point shoal. MFT5 is grainstone with large bryozoan and small benthonic foraminifera (Figure 6e). The grains are intensely dissolved, which usually shows high water energy in a point shoal. MFT6 is grainstone with benthonic foraminifera, Bivalvia, and echinoderm (Figure 6f). The grains sort well, representing high water energy and scour ability; mainly developed in tidal channels. The MFT7 is grainstone with large amounts of small unrecognized particles, some mega rudist and benthonic foraminifera can be seen in the cast thin sections (Figure 6g). MFT7 represents medium to high water energy, which usually develops in the bottom of a platform margin shoal. MFT8 is grainstone with bivalvia and the dissolution is intense, so some moldic pores can be seen (Figure 6h). MFT8 represents high water energy and mainly develops in a platform margin shoal. MFT9 is grainstone with benthonic foraminifera and rudist. The particles sort well and a large amount of intergranular pores can be seen in the cast thin sections (Figure 6i). MFT9 represents ultra-high water energy and mainly develops at the top of a platform margin shoal. MFT10 is packstone with green algae. Dissolution here is intense and lots of moldic pores can be seen in the cast thin sections (Figure 6j). MFT10 represents medium to high water energy and mainly develops in a front shoal. MFT11 is packstone with large amounts of bioclastic particles. The particles are too small to be unrecognized (Figure 6k). MFT11 represents deep water and mainly develops in the slope bottom. MFT12 is wackstone with a few ostracoda, representing deep water and low energy, which mainly develops in the deep shelf. Based on the microfacies type and characteristics, a carbonate ramp is recognized in the Mishrif Formation in X oilfield.
Three types of HFZs in the Mishrif reservoir X field were classified in the carbonate ramp, which were of the platform margin shoal type, the tidal channel type, and the point shoal type. HFZs are the result of the coupling of a high-energy environment and constructive diagenesis. The HFZ core in the platform margin shoal is dark brown, and pores produced by dissolution are visible to the naked eye. The particles are mainly rudist detritus, which are well sorted, and develop intergranular pores and visceral foramen (Figure 7a). The HFZ core in the tidal channel is dark yellow, showing cross-bedding and bottom scour structures. The particles are dominated by bivalves, echinoderms, and benthic foraminifera, with high structural maturity, and intergranular pores are mainly developed (Figure 7b). The HFZ core in the point shoal is yellow-brown, and biological debris is visible to the naked eye. The bioclast are poor in terms of sorting and have developed micropores and vug pores (Figure 7c).

4.2.3. Microstructure
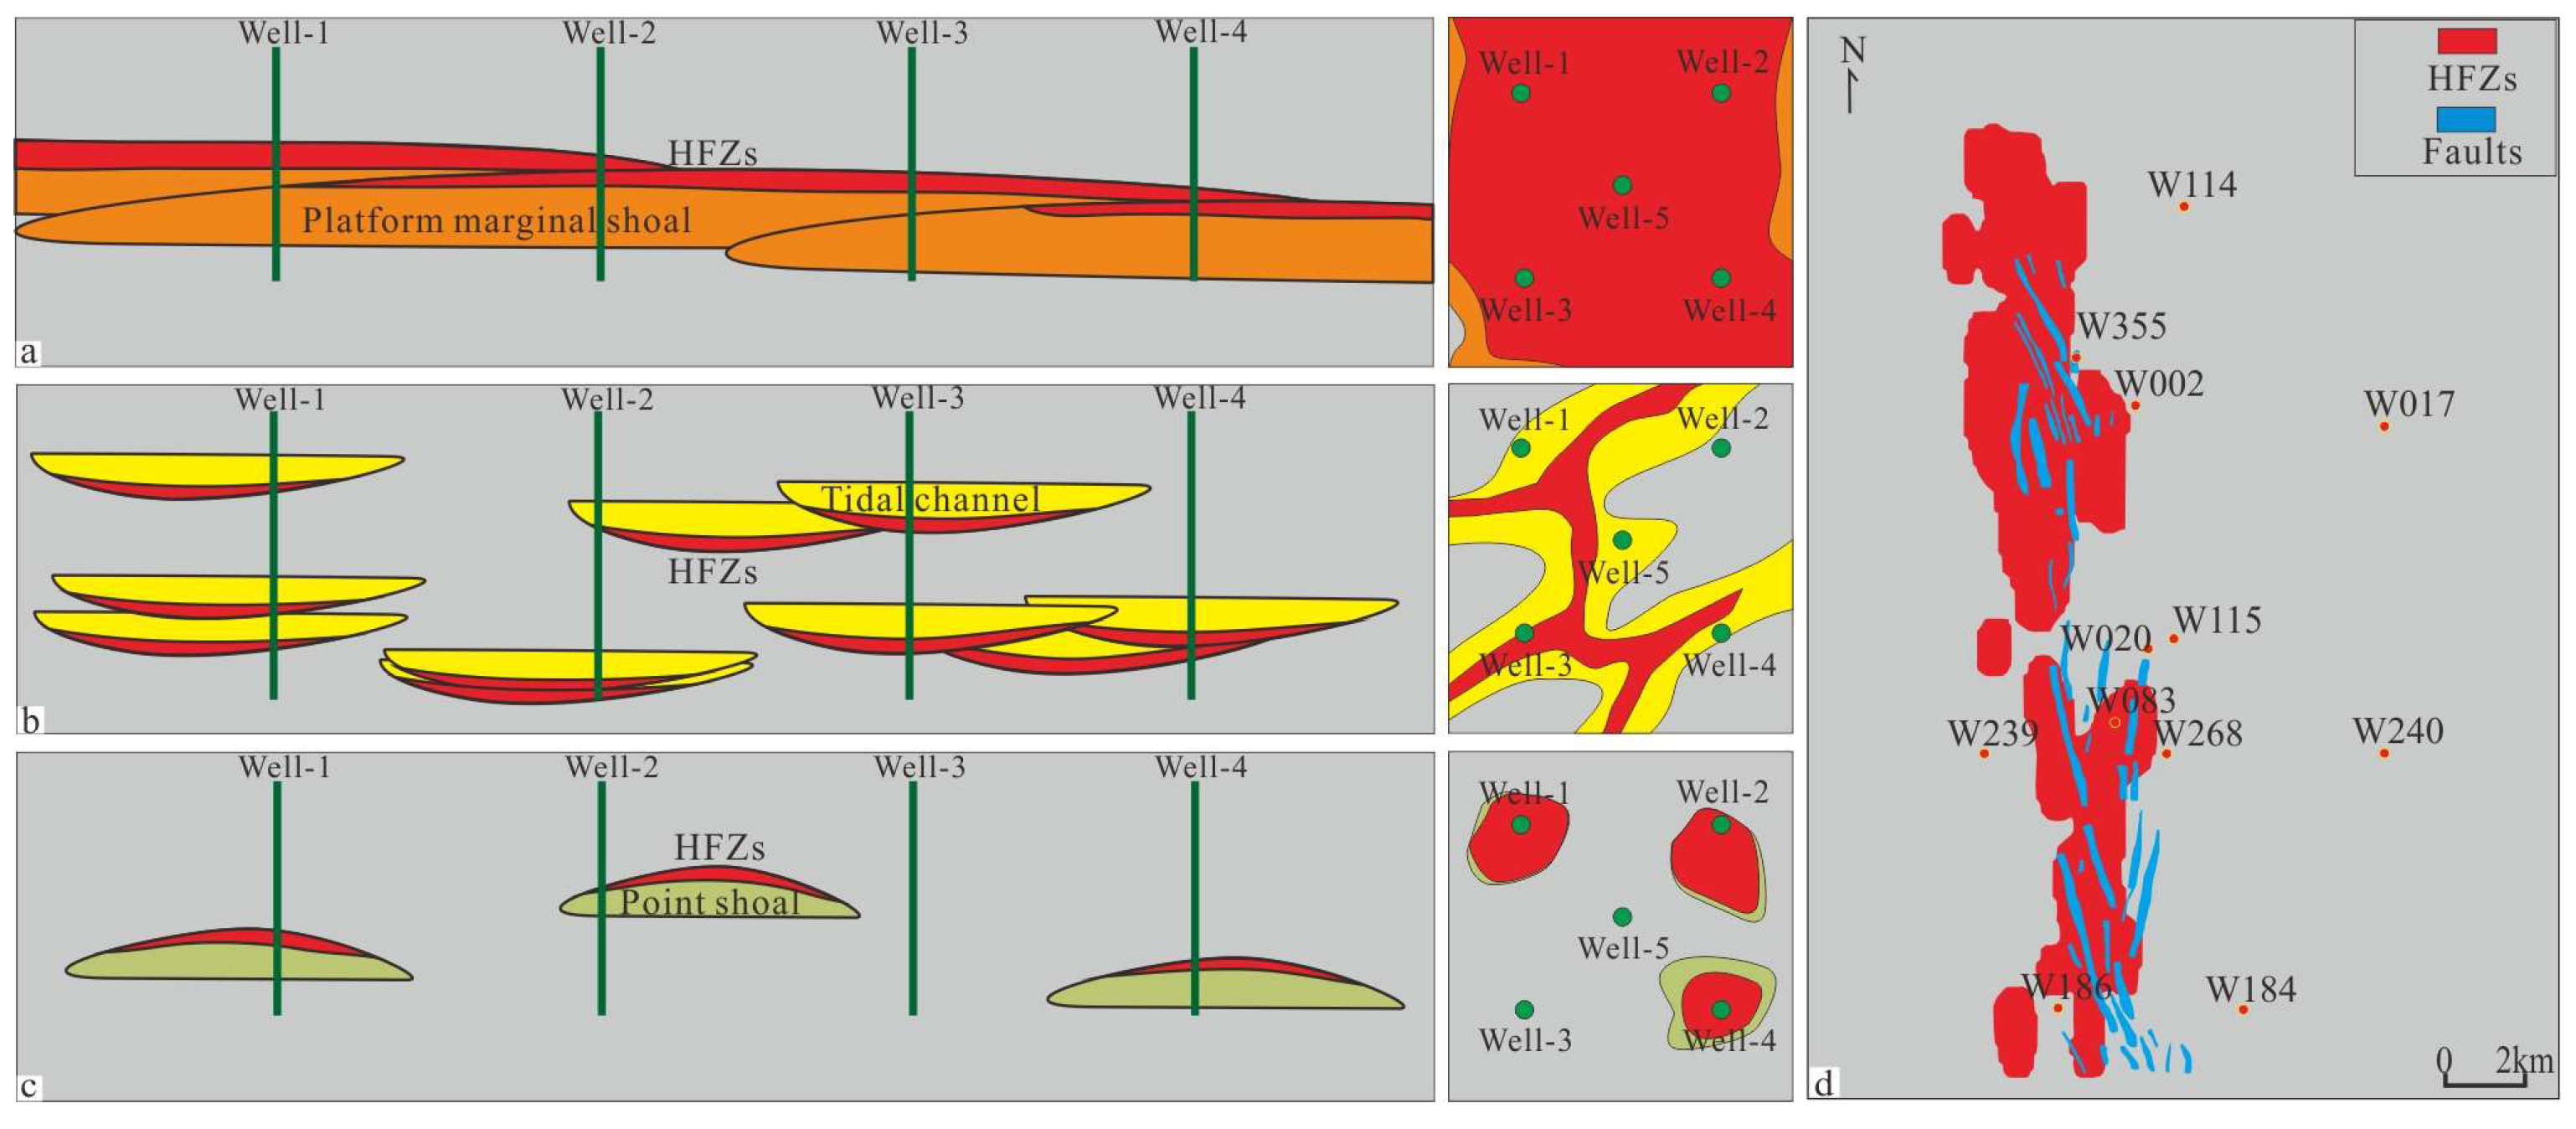
Microstructure has an important effect on waterflood development [30]. On the whole, the displacement pressure of HFZs is low, usually less than 10 psi, and the injected water is easy to break through. The mercury intrusion curve has a large degree of inclination. The span size of the pore throat radius is large, ranging from 0.01 μm to 100 μm. The pore throat sorting is poor, and the distribution curve has many peaks. The pore throats’ contribution to permeability greatly varies, and reservoir permeability is mainly controlled by the maximum pore throat.
The average permeability of the HFZs in the platform margin shoal is 1191 mD, and the maximum is 4257 mD. T2 relaxation time is between 100 ms and 1000 ms. The size of the pore throat is more than 5 μm, and the maximum can reach 25 μm (Figure 7a). A total of 90% of the permeability is contributed by the mega pore throat (>10 μm), and only 5% by the macro-pore throat (2.5~10 μm). Other types of pore throats (<2.5 μm) do not contribute to the permeability (Figure 8a).
The average permeability of the HFZs in the tidal channel is 753 mD, and the maximum is 4834 mD. T2 relaxation time is between 10 ms and 1000 ms, and the main pore throat size is between 2.5 μm and 7.5 μm (Figure 7b). Permeability is completely dominated by the giant throat (>10 μm), and other types of throats do not contribute to permeability (Figure 8b).
The average permeability of the HFZs in the point shoal is 1875 mD, and the maximum is 5000 mD. T2 relaxation time is between 100 ms and 1000 ms. The pore throat size is mostly larger than 25 μm, and the distribution is relatively concentrated (Figure 7c). A total of 95% of the permeability is contributed by the mega throat (>10 μm), and only 5% by the macro throat (2.5~10 μm). Micro throats (<0.75 μm) do not contribute to the permeability (Figure 8c).

4.2.4. Distribution

The HFZs in the platform margin shoal are distributed at the top of the MB2 interval, with a thickness of 1~4.5 m. Multiple HFZs are superimposed on each other, and the distribution is stable (Figure 9a). Drilling probability is high and the inter-well connectivity is good. The HFZs in the tidal channel are developed in the MB1 interval with an irregular pattern, and its thickness and distribution are controlled by the tidal channel. One HFZ is in a belt shape, and multiple HFZs intersect and converge in a network pattern. The HFZs along the tidal channel extend for a long distance and have good inter-well connectivity, while it rapidly pinches out and the inter-well connectivity is poor in the direction perpendicular to the tidal channel (Figure 9b). The HFZs in the point shoal are locally distributed in the upper part of the MA interval, with low drilling probability and poor inter-well connectivity (Figure 9c). The distribution of the HFZs in the point shoal is controlled by the faults. The HFZs are developed in the middle and west of the study area, and are distributed along the faults in a south-north direction. The plane distribution of HFZs match well with the faults (Figure 9d).

4.3. Balanced Development Strategy

4.3.1. Reservoir Connectivity

There is pressure conduction and fluid exchange between the MC interval and the MB2 interval. The platform margin shoal in MB2 is not connected to the lagoon in MB1, but is partially connected to the tidal channel in MB1. Between MB1 and MA, there is a stable baffle, which prevents pressure conduction and fluid exchange.
The permeability in the MC interval changes little, having 1~10 mD with good connectivity (Figure 10). The permeability in the MB2 interval greatly varies in a vertical direction, from 0.1 mD to 1000 mD; however, fluid migration still vertically occurs. The MB2 reservoir has good lateral connectivity, and the permeability gradient is usually less than 10. The permeability of the MB1 interval shows abrupt change, the reservoir connectivity is poor, and there is an obvious flow direction along the tidal channel. The permeability in the MA interval shows abrupt vertical change and gradual horizontal change. There is fluid exchange between the lagoon and the point shoal, and the reservoir connectivity is poor.
Waterflood development also verifies the connectivity of HFLs at different intervals. As shown in Figure 11, the perforations in the MB2 interval are all on the HFLs. In the MB1 interval, Wells A, B, C, D and F are deployed in the lagoon, while Wells G, H and I are deployed in the middle of the HFLs and Well E is located at the edge of the HFLs. The HFLs are not drilled in the MA interval. Well E injected water into MA, MB1, and MB2, respectively. PLT shows that all wells had water breakthrough in the MB2 interval, while in the MB1 interval, Wells G, H, and I deployed in the HFLs had water breakthrough, while Wells A, B, C, D, and F deployed in the lagoon had no water in the MB1 interval. It is considered that the HFLs in the MB2 interval have good connectivity in all directions, and when water is injected into the HFZs, the oil well breaks through faster. However, the HFZs in MB1 have an obvious direction. Well E is injected with water in the HFZs, and the injected water tends to migrate along the HFZs (Figure 11). The oil wells in the middle of the HFZs had a faster water breakthrough, while the oil wells in the lagoon did not water breakthrough.

4.3.2. Separated Development

Separated waterflood development is conducive to enhancing the recovery factor. The stable baffles lay the foundation for separated waterflood development [31]. The baffles in the CRI interval separate the MA from the overlying Khasib Formation. The MA interval lacks a stable baffle and acts as an independent development unit.
The facies in MA and MB1 are different, and a stable baffle is developed between them, so MA and MB1 are treated as two development units. Although there are many barriers in the MB1 interval, they are unstable and cannot prevent fluid migration, so the MB1 interval is no longer subdivided.
There are no stable baffles between MB1 and MB2. However, the two intervals have different facies. The platform margin shoal is only partially in contact with the tidal channel, and is mainly in contact with the lagoon. The permeability difference between the platform margin shoal and lagoon is 2 to 4 orders. Therefore, MB1 and MB2 are treated as two development unites.
MB2 and MC lack stable baffles and both are deposited in open environments. Fluid exchange widely exists in MB2 and MC. Therefore, the MB2 interval and the MC interval are regarded as one development unit. Therefore, the Mishrif Formation is subdivided into three development units: MA, MB1, and MB2 + MC (Figure 12).

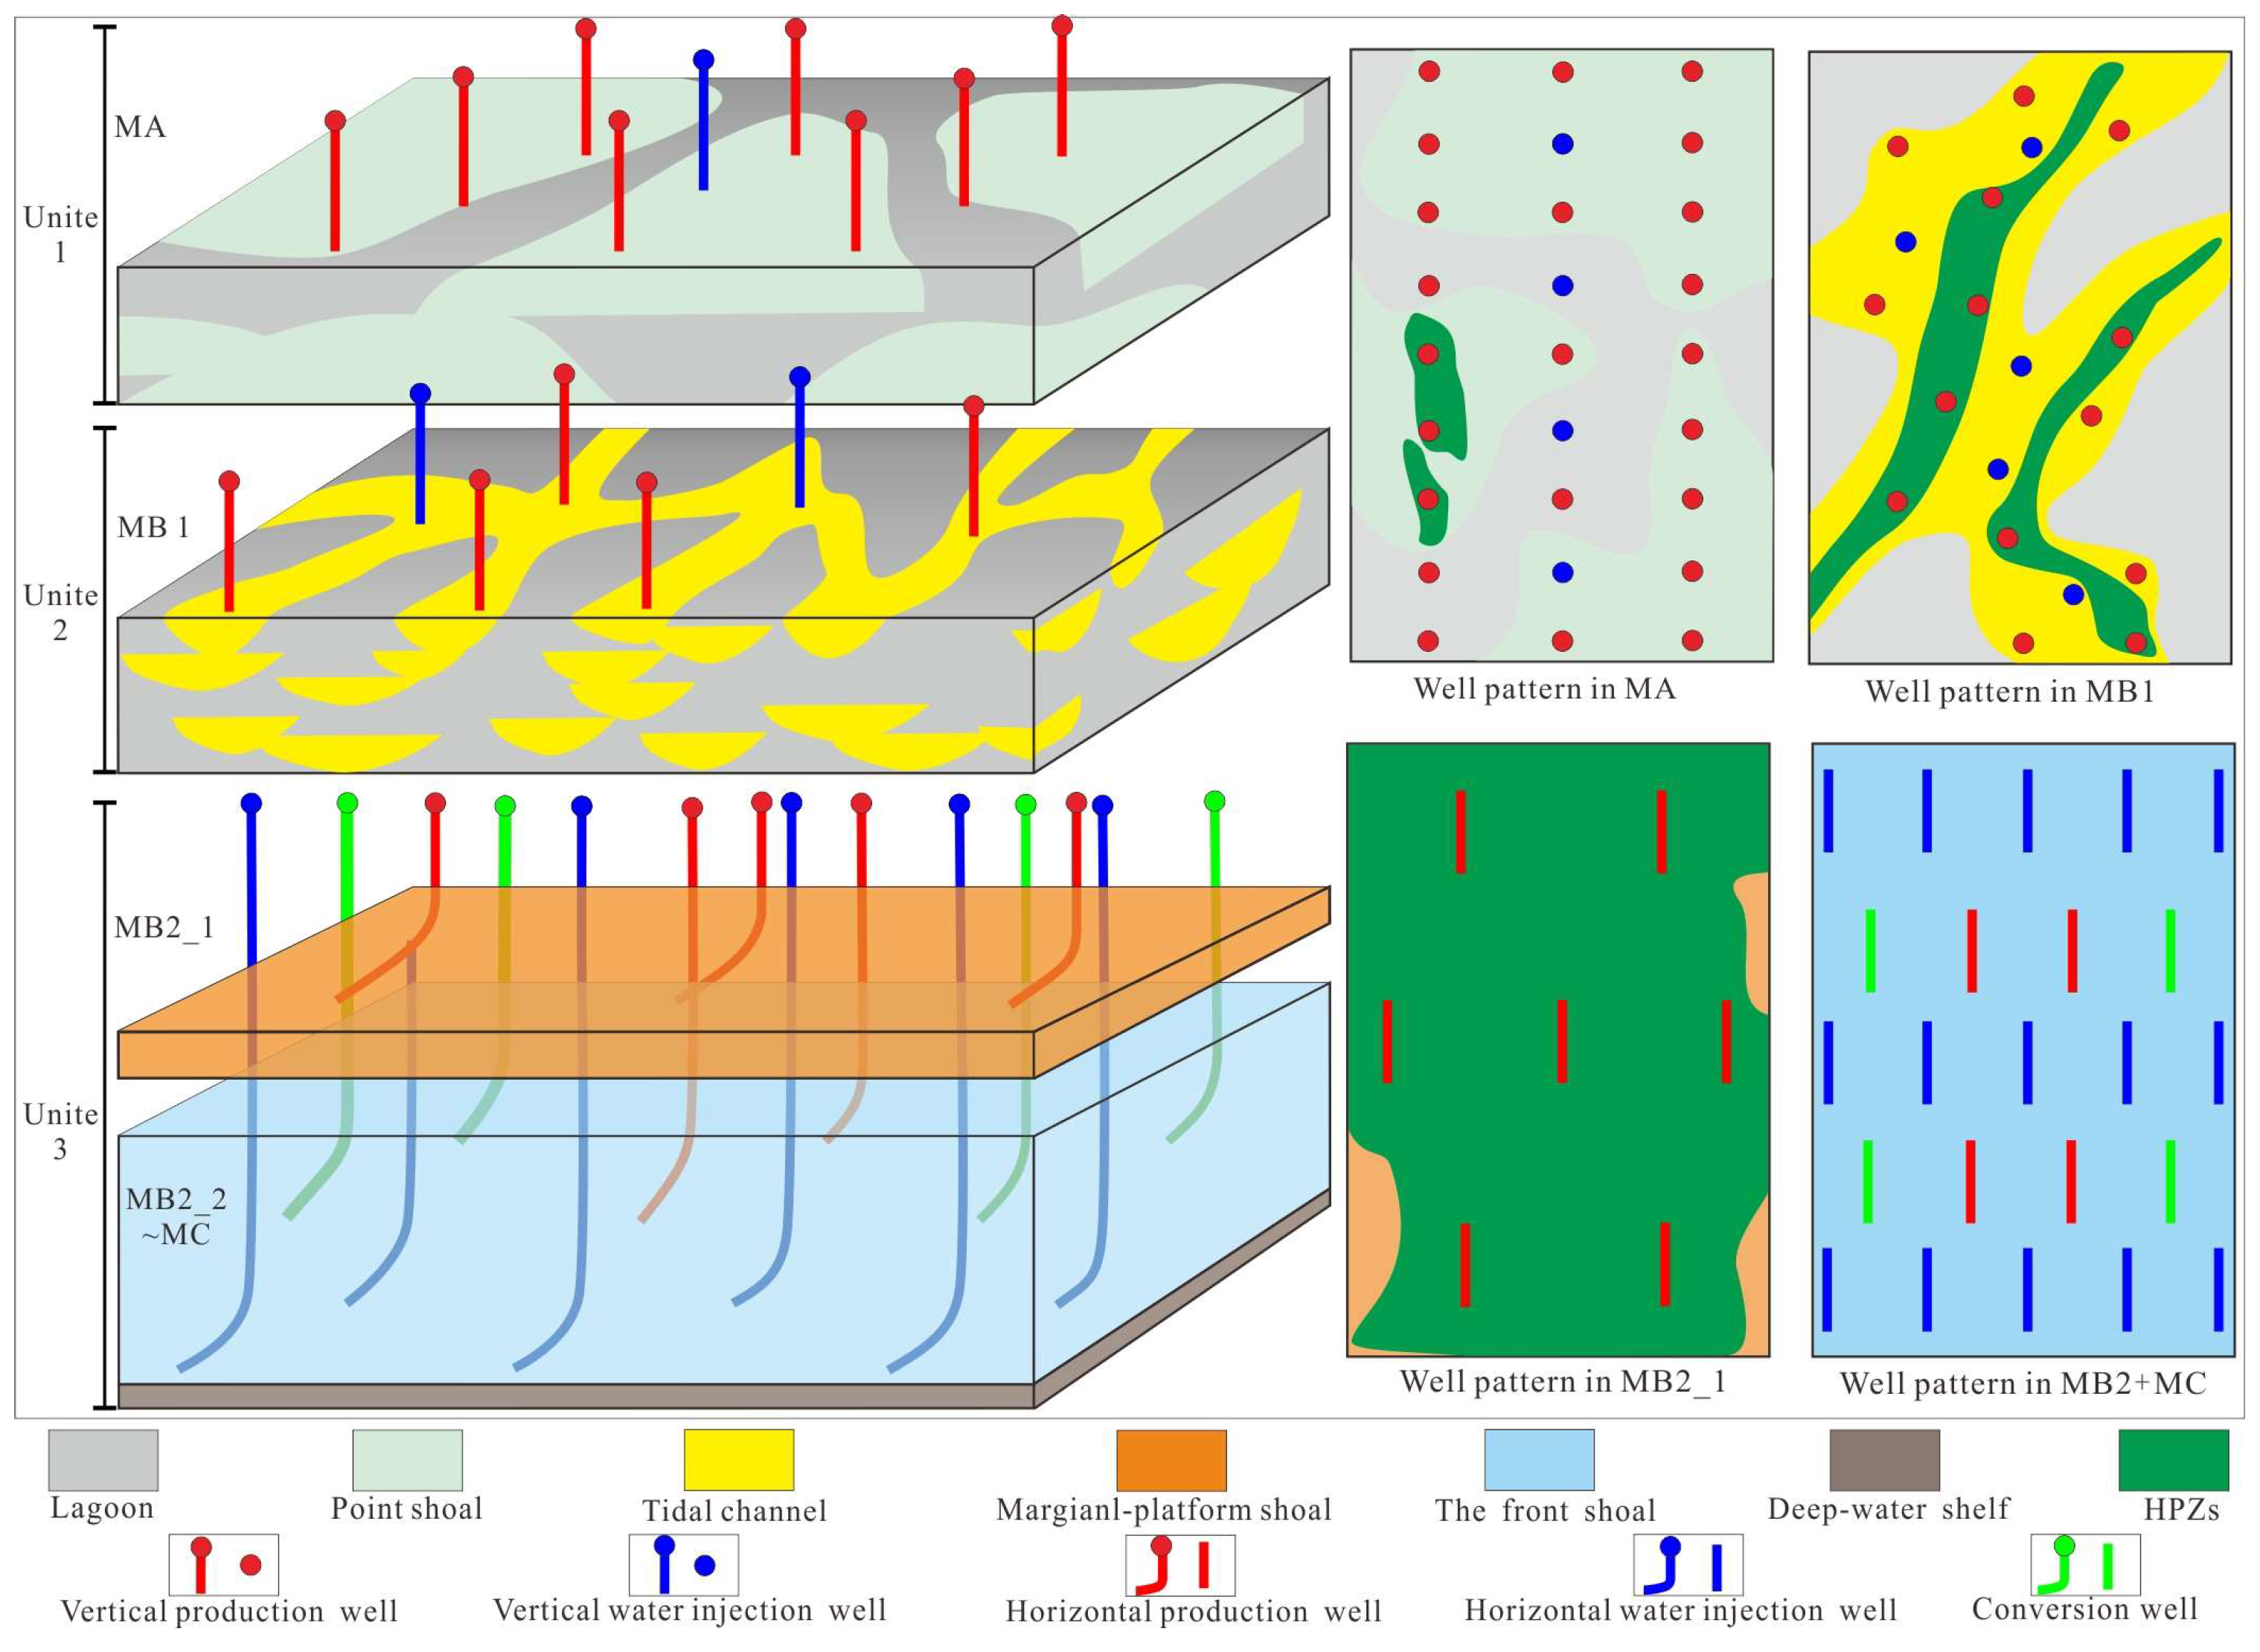
4.3.3. Differentiated Well Pattern

Different injection—production patterns are deployed in different development units. The main pay zones in the MA unit are mainly in the point shoals. A reverse nine-point injection-production pattern using a vertical well is adopted, and the well spacing is 900 m. The main pay zones in the MB1 unit are mainly in the tidal channels. The thickness and distribution in tidal channels are irregular. Therefore, the irregular five-point injection-production well pattern using a vertical well is adopted. The thickness and production in the MB2 + MC unit are considerable, especially for the MB2_1. In order to quickly increase production, this unit is developed by horizontal wells. The reservoir in MB2_1 is thin, but has good physical properties, stable distribution, and long pressure propagation. It is appropriate to just deploy horizontal production wells with large well spacings of 900 m [31]. The reservoir’s physical properties in other subzones are poor and pressure transmission is slow. Horizontal production wells, for which the well spacing is 300 m, are deployed in the lower region of MB2. The horizontal injection well with the same well spacing is deployed in the lower part of MC. When the horizontal production well at the edge of the lower MB2 experiences a water breakthrough, it is converted into an injection well (Figure 12).

4.3.4. Reasonable Utilization and Avoidance of HFZs

Considering the impact of HFZs on production and waterflood development, production wells should be deployed in HFZs, while injection wells should be deployed in tight or low permeability rock. Faults usually have great significance on the development of high quality reservoirs [32]. The HFZs in the MA unit are distributed along faults or point shoals. Production wells should be deployed along faults or point shoal reservoirs, while injection wells should be deployed in the lagoon. The HFZs in the MB1 unit are distributed in the middle of the tidal channel, and the production wells are deployed along the tidal channel, while the injection wells should be deployed at the edge of the tidal channel or in the lagoon. The HFZs in MB2_1 are distributed throughout the whole area. Only production wells with large well spacing are deployed in this subzone, and no injection wells are deployed. The energy is supplemented by water injection in the lower MB2 and MC (Figure 12).

5. Discussion

Although the well pattern is well deployed, a reasonable injection schedule is also required, especially in the MB2 + MC unit. The lower parts of the MB2 and MC intervals have mainly medium and low permeability, containing locally high permeability, and the pores are mostly matrix-host micropores, moldic pores, and visceral foramen. The pore throat size is mainly between 0.5 μm and 2.5 μm and the pressure transmission is fairly slow. As a result, the water injection rate should not be too fast, and a moderate water injection schedule should be used to slowly and uniformly displace oil in diverse pores, preventing the injected water from rapidly advancing along the mega- or macro-pore throat, and improve the final recovery ratio [31]. In addition, because of the poor pressure transmission in medium and low permeability reservoirs, the injected water is not easy to flow diffusion in the formation, so it is easy to build the pressure at the bottom hole, and the formation is prone to hydraulic fracture, forming large amounts of fractures. The fractures can connect with normal reservoirs and HFZs. As a result, the injected water flows into the MB2_1 HFZs, and the water cut of the horizontal production well rapidly rises.

6. Conclusions and Implementation Effects

(1)
The Mishrif Formation is intensely heterogeneous and the HFZs are the main geological factors resulting in unbalanced production. Separate development would be a useful method to enhance the recovery ratio. Deploy reasonable injection—production well patterns according to the scale and distribution of reservoirs in different development units. Reasonable utilization and avoidance HFZs, deploy injection wells in tight or poor reservoirs to evenly displace oil through moderate water injection mode.
(2)
Reservoir numerical simulation shows that the new strategy has a longer plateau production period compared with the original development plan. The recovery ratio is nearly 30% within the specified period, and the water cut is 1.1% lower than the original plan. Under the same recovery ratio, nearly 400 fewer new wells can be drilled compared with the original plan, saving a lot of investment costs.
(3)
According to the new development strategy, a pilot area has been deployed in the northern part of the study area. At present, more than 40 wells have been completed and have been put into full production. The production shows that the simulation is in good agreement with the actual production, and the coincidence rate between the actual production and the predicted production is 91.7%, indicating that the new development strategy can guide the adjusted development of the Mishrif Formation.

Author Contributions

Conceptualization, F.L.; methodology, F.L.; software, L.L.; validation, L.L.; formal analysis, J.C.; investigation, J.C.; resources, J.C.; data curation, J.C.; writing—original draft preparation, F.L.; writing—review and editing, F.L.; visualization, L.L.; supervision, J.C.; project administration, J.C.; funding acquisition, L.L. All authors have read and agreed to the published version of the manuscript.

Funding

China national petroleum Co., Ltd. “14th five years” forward-looking basic major s&t projects, “Extra low permeability carbonate reservoir in the effective development of key technology research” No. 2021DJ3202.

Data Availability Statement

Not applicable.

Conflicts of Interest

The authors declare that they have no known competing financial interest or personal relationships that could have appeared to influence the work reported in this paper.

References

  1. Aqrawi, A.A.M.; Gof, J.C.; Horbury, A.D.; Sadooni, F. The Petroleum Geology of Iraq; Scientific Press: Bucks, UK, 2010. [Google Scholar]
  2. Li, B.; Najeh, H.; Lantz, J.; Rampurawala, M.A.; Gok, I.M.; Al-Khabbaz, M. Detecting Thief Zones in Carbonate Reservoirs by Integrating Borehole Images With Dynamic Measurements: Case Study from the Mauddud Reservoir, North Kuwait. SPE Reserv. Eval. Eng. 2010, 13, 193–202. [Google Scholar] [CrossRef]
  3. Li, F.; Song, X.; Guo, R.; Liu, L.; Song, S. Characteristics and genesis of interlayers of thick bioclastic limestone reservoirs: A case study of Cretaceous Mishrif Formation, M oilfield in the Middle East. Acta Pet. Sin. 2021, 42, 853–864. [Google Scholar]
  4. Han, H.; Tian, Z.; Xu, Z.; Yao, Z.; Yi, J.; Li, F. Genesis and distribution of high permeable streaks of the Cretaceous bioclastic limesrone reservoir in W Oilfield, Iraq. Mar. Orig. Petreoleum Geol. 2022, 27, 261–270. Available online: http://kns.cnki.net/kcms/de-tail/33.1328.P.20220402.1257.002.html (accessed on 6 April 2022).
  5. Shen, A.; Zheng, Z.; Chen, Y.; Ni, X. Characteristics, origin and distribution of dolomite reservoirs in Lower-Middle Cambrian, Tarim Basin, NW China. Pet. Explor. Dev. 2015, 42, 545–554. [Google Scholar] [CrossRef]
  6. Li, R.; Chen, Q.; Deng, H.; Fu, M.; Hu, L.; Xie, X.; Zhang, L.; Guo, X.; Fan, H.; Xiang, Z. Quantitative evaluation of the carbonate reservoir heterogeneity based on production dynamic data: A case study from Cretaceous Mishrif formation in Halfaya oilfield, Iraq. J. Pet. Sci. Eng. 2021, 206, 109007. [Google Scholar] [CrossRef]
  7. Chafeet, H.A.; Raheem, M.K.; Dahham, N.A. Diagenesis processes impact on the carbonate Mishrif quality in Ratawi oilfield, southern Iraq. Model. Earth Syst. Environ. 2020, 6, 2609–2622. [Google Scholar] [CrossRef]
  8. Chen, P.; Guo, L.; Li, C.; Tong, Y. Karstification characteristics of the Cenomanian-Turonian Mishrif Formation in the Missan Oil Fields, southeastern Iraq, and their effects on reservoirs. Front. Earth Sci. 2022, 16, 435–445. [Google Scholar] [CrossRef]
  9. Xu, J.; Deng, Y.; Fu, M.; Guo, R.; Chen, P.; Duan, G.; Ma, R. The Nonuniform Distribution of Stylolite in Bioclastic Limestones and Its Influence on Reservoir Petro-Physical Properties—A Case Study of the Mishrif Formation from the Ah Oilfield. Energies 2022, 15, 3032. [Google Scholar] [CrossRef]
  10. Mohammed, A.; Dhaidan, M.; Al-Hazaa, S.H.; Farouk, S.; Al-Kahtany, K. Reservoir characterization of the upper Turonian—Lower Coniacian Khasib formation, South Iraq: Implications from electrofacies analysis and a sequence stratigraphic framework. J. Afr. Earth Sci. 2022, 186, 104431. [Google Scholar] [CrossRef]
  11. Wang, H.; Shi, K.; Ma, Y.; Liu, B.; Song, X.; Ge, Y.; Liu, H.; Hoffmann, R.; Immenhauser, A. Control of depositional and diagenetic processes on the reservoir properties of the Mishrif Formation in the AD oilfield, Central Mesopotamian Basin, Iraq. Mar. Pet. Geol. 2021, 132, 105202. [Google Scholar] [CrossRef]
  12. Al-Musawi, F.A.; Idan, R.M.; Salih, A.L.M. Reservoir characterization, Facies distribution, and sequence stratigraphy of Mishrif Formation in a selected oilfield, South of Iraq. J. Phys. Conf. Ser. 2020, 1660, 012073. [Google Scholar] [CrossRef]
  13. Cantrell, D.; Shah, R.; Ou, J.; Xu, C.; Phillips, C.; Li, X.; Hu, T. Depositional and diagenetic controls on reservoir quality: Example from the upper Cretaceous Mishrif Formation of Iraq. Mar. Pet. Geol. 2020, 118, 104415. [Google Scholar] [CrossRef]
  14. Liu, H.; Tian, Z.; Liu, B.; Guo, R.; Yang, D.; Yu, Y.; Shi, K. Pore types, origins and control on reservoir heterogeneity of carbonate rocks in Middle Cretaceous Mishrif Formation of the West Qurna oilfield, Iraq. J. Pet. Sci. Eng. 2018, 171, 1338–1349. [Google Scholar] [CrossRef]
  15. Yao, Z.; Liu, H.; Tian, Z.; Guo, R.; Yang, D. Characteristics and Main Controlling Factors of Carbonate Reservoir of the Middle Cretaceous Mishrif Formation in the West Qurna Oilfield, Iraq. Mar. Orig. Pet. Geology. 2018, 23, 59–69. [Google Scholar]
  16. Sun, X.; Guo, R.; Tian, Z.; Deng, Y.; Han, H.; Yi, Y.; Xu, Z.; Chen, L.; Huang, T. Classification and main controlling factors of porous carbonate reservoir: A case study from Mishrif Formation, West Qurna Oilfield, Iraq. Geol. Sci. Technol. Inf. 2017, 36, 150–155. [Google Scholar]
  17. Wang, R.; Wang, Z.; Osumanu, A.; Zhang, G.; Li, B.; Lu, Y. Grid density overlapping hierarchical algorithm for clustering of carbonate reservoir rock types: A case from Mishrif Formation of West Qurna-1 oilfield, Iraq. J. Pet. Sci. Eng. 2019, 182, 106209. [Google Scholar] [CrossRef]
  18. Fang, X.; Feng, H.; Wu, H.; Wang, Y. Study on a quantitative rock type discrimination model for porous carbonate reservoirs: A case by the Late Cretaceous Mishrif Formation in the West Qurna oilfield, Iraq. Prog. Geophys. 2021, 37, 1013–2023. [Google Scholar]
  19. Al-Dujaili, A.N.; Shabani, M.; Al-Jawad, M.S. Characterization of flow units, rock and pore types for Mishrif Reservoir in West Qurna oilfield, Southern Iraq by using lithofacies data. J. Pet. Explor. Prod. Technol. 2021, 11, 4005–4018. [Google Scholar] [CrossRef]
  20. Liu, H.; Tian, Z.; Liu, B.; Guo, R.; Shi, K.; Ye, Y. Classification and prediction of giant thick strongly heterogeneous carbonate reservoirs in the Middle East area: A case study of Mid-Cretaceous Mishrif Formation in the W oilfield of Iraq. Acta Pet. Sin. 2019, 40, 677–691. [Google Scholar]
  21. Deng, Y.; Guo, R.; Tian, Z.; Tan, W.; Yi, Y.; Xu, Z.; Xiao, C.; Cao, X.; Chen, L. Geologic features and genesis of the barriers and intercalations in carbonates: A case study of the Cretaceous Mishrif Formation, West Qurna oil field, Iraq. Pet. Explor. Dev. 2016, 43, 149–157. [Google Scholar] [CrossRef]
  22. Hussain, S.A.; Al-Obaidi, M.; Khwedim, K.; Ahmad, K. Facies Architecture, Diagenesis and Paleoceanography of Mishrif (Late Cretaceous) in Selected Wells of West Qurna Oil Field, Southern Iraq. J. Phys. Conf. Ser. 2020, 1664, 012137. [Google Scholar] [CrossRef]
  23. Farouk, S.; Ahmad, F.; Powell, J.H. Cenomanian-Turonian stable isotope signatures and depositional sequences in northeast Egypt and central Jordan. J. Asian Earth Sci. 2017, 134, 207–230. [Google Scholar] [CrossRef]
  24. Mahdi, T.A.; Aqrawi, A.A.M. Sequence Stratigraphic Analysis of the Mid-Cretaceous Mishrif Formation, Southern Mesopotamian Basin, Iraq. J. Pet. Geol. 2014, 37, 287–312. [Google Scholar] [CrossRef]
  25. Mahdi, T.A.; Aqrawi, A.A.M. Role of facies diversity and cyclicity on the reservoir quality of the mid-Cretaceous Mishrif Formation in the southern Mesopotamian Basin, Iraq. Geol. Soc. Lond. Spéc. Publ. 2017, 435, 85–105. [Google Scholar] [CrossRef]
  26. Rafiei, Y.; Motie, M. Improved reservoir characterization by employing hydraulic flow unit classification in one of Iranian carbonate reservoirs. Adv. Geo-Energy Res. 2019, 3, 277–286. [Google Scholar] [CrossRef]
  27. Liu, H.; Kaibo, S.; Bo, L.; Song, X.; Deng, L.; Guo, R.; Tian, Z.; Li, Y.; Deng, Y.; Wang, G. The characteristics and origins of thief zones in the cretaceous limestone reservoirs of central and southern Mesopotamian Basin. J. Pet. Sci. Eng. 2021, 201, 108395. [Google Scholar] [CrossRef]
  28. Meyer, F.O.; Price, R.C.; Al-Raimi, S.M. Stratigraphic and Petrophysical Characteristics of Cored Arab-D Super-k Intervals, Hawiyah Area, Ghawar Field, Saudi Arabia. Geoarabia 2000, 5, 355–384. [Google Scholar] [CrossRef]
  29. Zhang, Q.; Li, Y.; Li, B.; Liu, Z.; Wei, C.; Zhou, J. Identification methods and development strategy study of thief zone in reef-bank carbonate reservoir: A case study of the Mishrif reservoir in Rumaila oilfield. Pet. Geol. Recover. Effic. 2016, 23, 29–34. [Google Scholar]
  30. Wang, S.; Han, X.; Dong, Y.; Shi, H. Mechanisms of reservoir pore/throat characteristics evolution during long-term water-flooding. Adv. Geo-Energy Res. 2017, 1, 148–157. [Google Scholar] [CrossRef]
  31. Song, X.; Li, Y. Optimum development options and strategies for water injection development of carbonate reservoirs in the Middle East. Pet. Explor. Dev. 2018, 45, 723–734. [Google Scholar] [CrossRef]
  32. Lu, X.; Wang, Y.; Yang, D.; Wang, X. Characterization of paleo-karst reservoir and faulted karst reservoir in Tahe Oilfield, Tarim Basin, China. Adv. Geo-Energy Res. 2020, 4, 339–348. [Google Scholar] [CrossRef]
Figure 1. Overview of study area. (a) Location of X Oilfield; (b) structure of the Mishrif Formation, the red dots represent coring well.
Energies 16 01451 g001
Figure 2. Sequence cycle and sedimentation evolution of the Mishrif Formation in X Oilfield. (a) Depositional environment during TST in SQ1; (b) depositional environment during the middle HST in SQ1; (c) depositional environment during TST in SQ2; (d) depositional environment during the middle HST in SQ2; (e) depositional environment during the late HST in SQ2; (f) depositional environment during TST in SQ3; (g) depositional environment during the middle HST in SQ3; (h) depositional environment during the late HST in SQ3; (i) depositional environment during TST in SQ4; (j) depositional environment during the late HST in SQ4.
Energies 16 01451 g002
Figure 3. Overview of top structure, interval, and cored well of Mishrif Formation in X Oilfield. (a) Strata of study area; (b) strata and coring interval in the Mishrif Formation.
Energies 16 01451 g003
Figure 4. Vertical heterogeneity in the Mishrif Formation in X Oilfield.
Energies 16 01451 g004
Figure 5. Geological parameters of HFZs in the Mishrif Formation in X Oilfield. (a) HFZs permeability range in the Mishrif Formation in X Oilfield; (b) permeability ratio of HFZs and surrounding rock in the Mishrif Formation in X Oilfield; (c) HFZs thickness range in the Mishrif Formation in X Oilfield; (d) thickness ratio of HFZs and surrounding rock in the Mishrif Formation in X Oilfield.
Energies 16 01451 g005
Figure 6. Microfacies type and characteristics of Mishrif Formation in X Oilfield. (a) MFT1, well W002, 2770.24 m; wackstone, geopetal structure, and birdseye structure; (b) MFT2, well W002, 2298.02 m, wackstone with small benthonic foraminifera; (c) MFT3, well W002, 2280.06 m, packstone with large amount of benthonic foraminifera; (d) MFT4, well W017, 2382.58 m, grainstone with small benthonic foraminifera; (e) MFT5, well W083, 2242.76 m, grainstone with mega bryozoan and small benthonic foraminifera; (f) MFT6, well W0186, 2350.24 m, grainstone with benthonic foraminifera, bivalvia and echinoderm, the particles sort well; (g) MFT7, well W017, 2500.31 m, grainstone with large amounts of small unrecognized particles, some mega rudist and benthonic foraminifera can be seen; (h) MFT8, well W017, 2501.13 m, grainstone with bivalvia, dissolution is intense; (i) MFT9, well W002, 2321.8 m, grainstone with benthonic foraminifera and rudist; (j) MFT10, well W002, 2353.04 m, packstone with green algae; (k) MFT11, well W002, 2371.05 m, packstone with large amounts of fine particles unrecognized; (l) MFT12, well W002, 2285.26 m, wackstone with few ostracoda.
Energies 16 01451 g006
Figure 7. Depositional model and HFZs types in Mishrif Formation in X Oilfield.
Energies 16 01451 g007
Figure 8. Microstructure characteristics of HFZs in the Mishrif reservoir in X Oilfield. (a) Well-240, 2448.7 m, HFZs in the platform marginal shoal; (b) Well-239, 2438.03 m, HFZs in the tidal channel; (c) Well-114, 2315.65 m, HFZs in the point shoal.
Energies 16 01451 g008
Figure 9. Distribution of different HFZs of the Mishrif Formation in X Oilfield. (a) Distribution of HFZs in the platform margin shoal; (b) distribution of HFZs in the tidal channel; (c) distribution of HFZs in the point shoal; (d) The distribution of the HFZs in the point shoal is controlled by faults.
Energies 16 01451 g009
Figure 10. Permeability model of the Mishrif Formation in X Oilfield.
Energies 16 01451 g010
Figure 11. Connectivity of injection-production well pattern in the Mishrif Formation in X Oilfield.
Energies 16 01451 g011
Figure 12. Balanced development model in the Mishrif Formation in X Oilfield.
Energies 16 01451 g012
Disclaimer/Publisher’s Note: The statements, opinions and data contained in all publications are solely those of the individual author(s) and contributor(s) and not of MDPI and/or the editor(s). MDPI and/or the editor(s) disclaim responsibility for any injury to people or property resulting from any ideas, methods, instructions or products referred to in the content.

