Structural Properties Evolution and Influencing Factors of Global Virtual Water Scarcity Risk Transfer Network
Abstract
1. Introduction
1.1. Background
1.2. Literature Review
1.3. Research Contribution
2. Data and Methodology
2.1. Data Sources
2.2. Quantification of the Water Scarcity Risk Embodied in International Trade
2.2.1. Local Water Scarcity Risk (LWSR)
2.2.2. Virtual Water Scarcity Risk (VWSR)
2.3. Construction of VWSR Transfer Network
2.3.1. Macro-Level Indicators
2.3.2. Micro-Level Indicators
2.4. Temporal Exponential Random Graph Model
2.4.1. Endogenous Mechanism Effect
2.4.2. Economic Attribute Effect
2.4.3. Relations Embedding Effect
2.4.4. Goodness of Fit Test
3. Results and Discussion
3.1. Evolution of Structural Features of VWSR Transfer Networks
3.1.1. Macro-Level Analysis
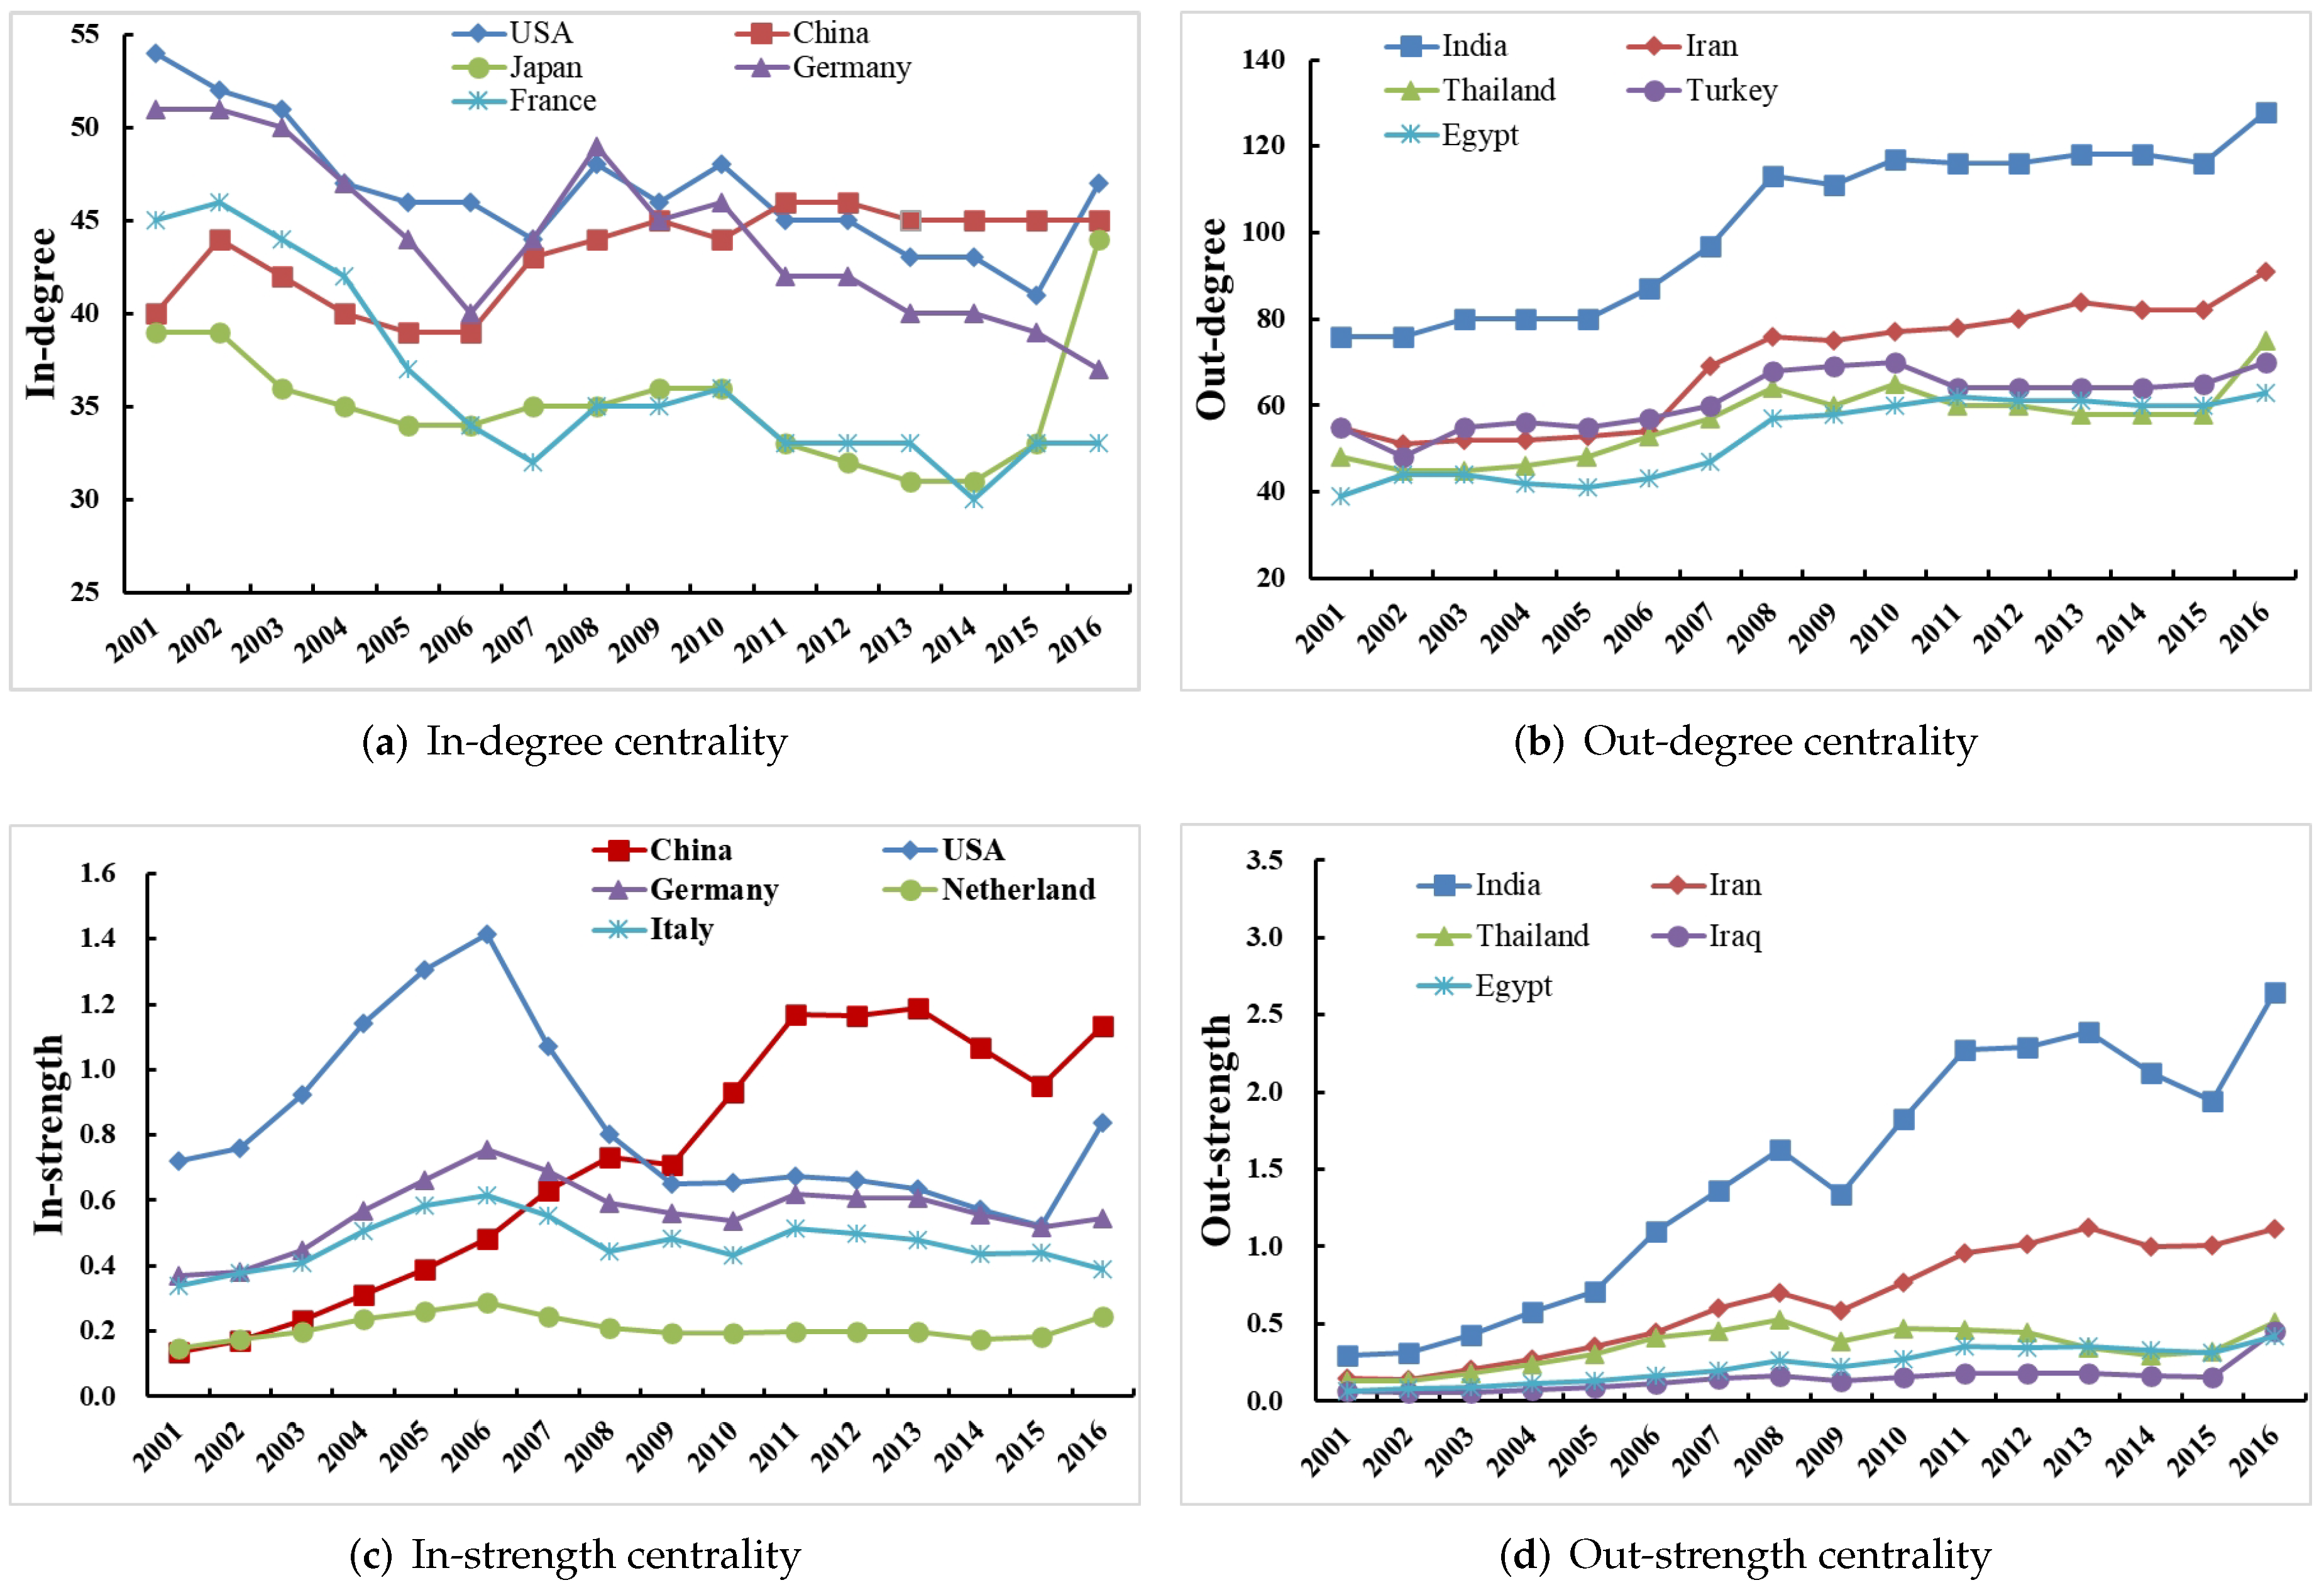
3.1.2. Micro-Level Analysis
3.2. Determinants of the VWSR Transfer Networks Evolution
3.2.1. Analysis of TERGM Results
3.2.2. Robustness Test
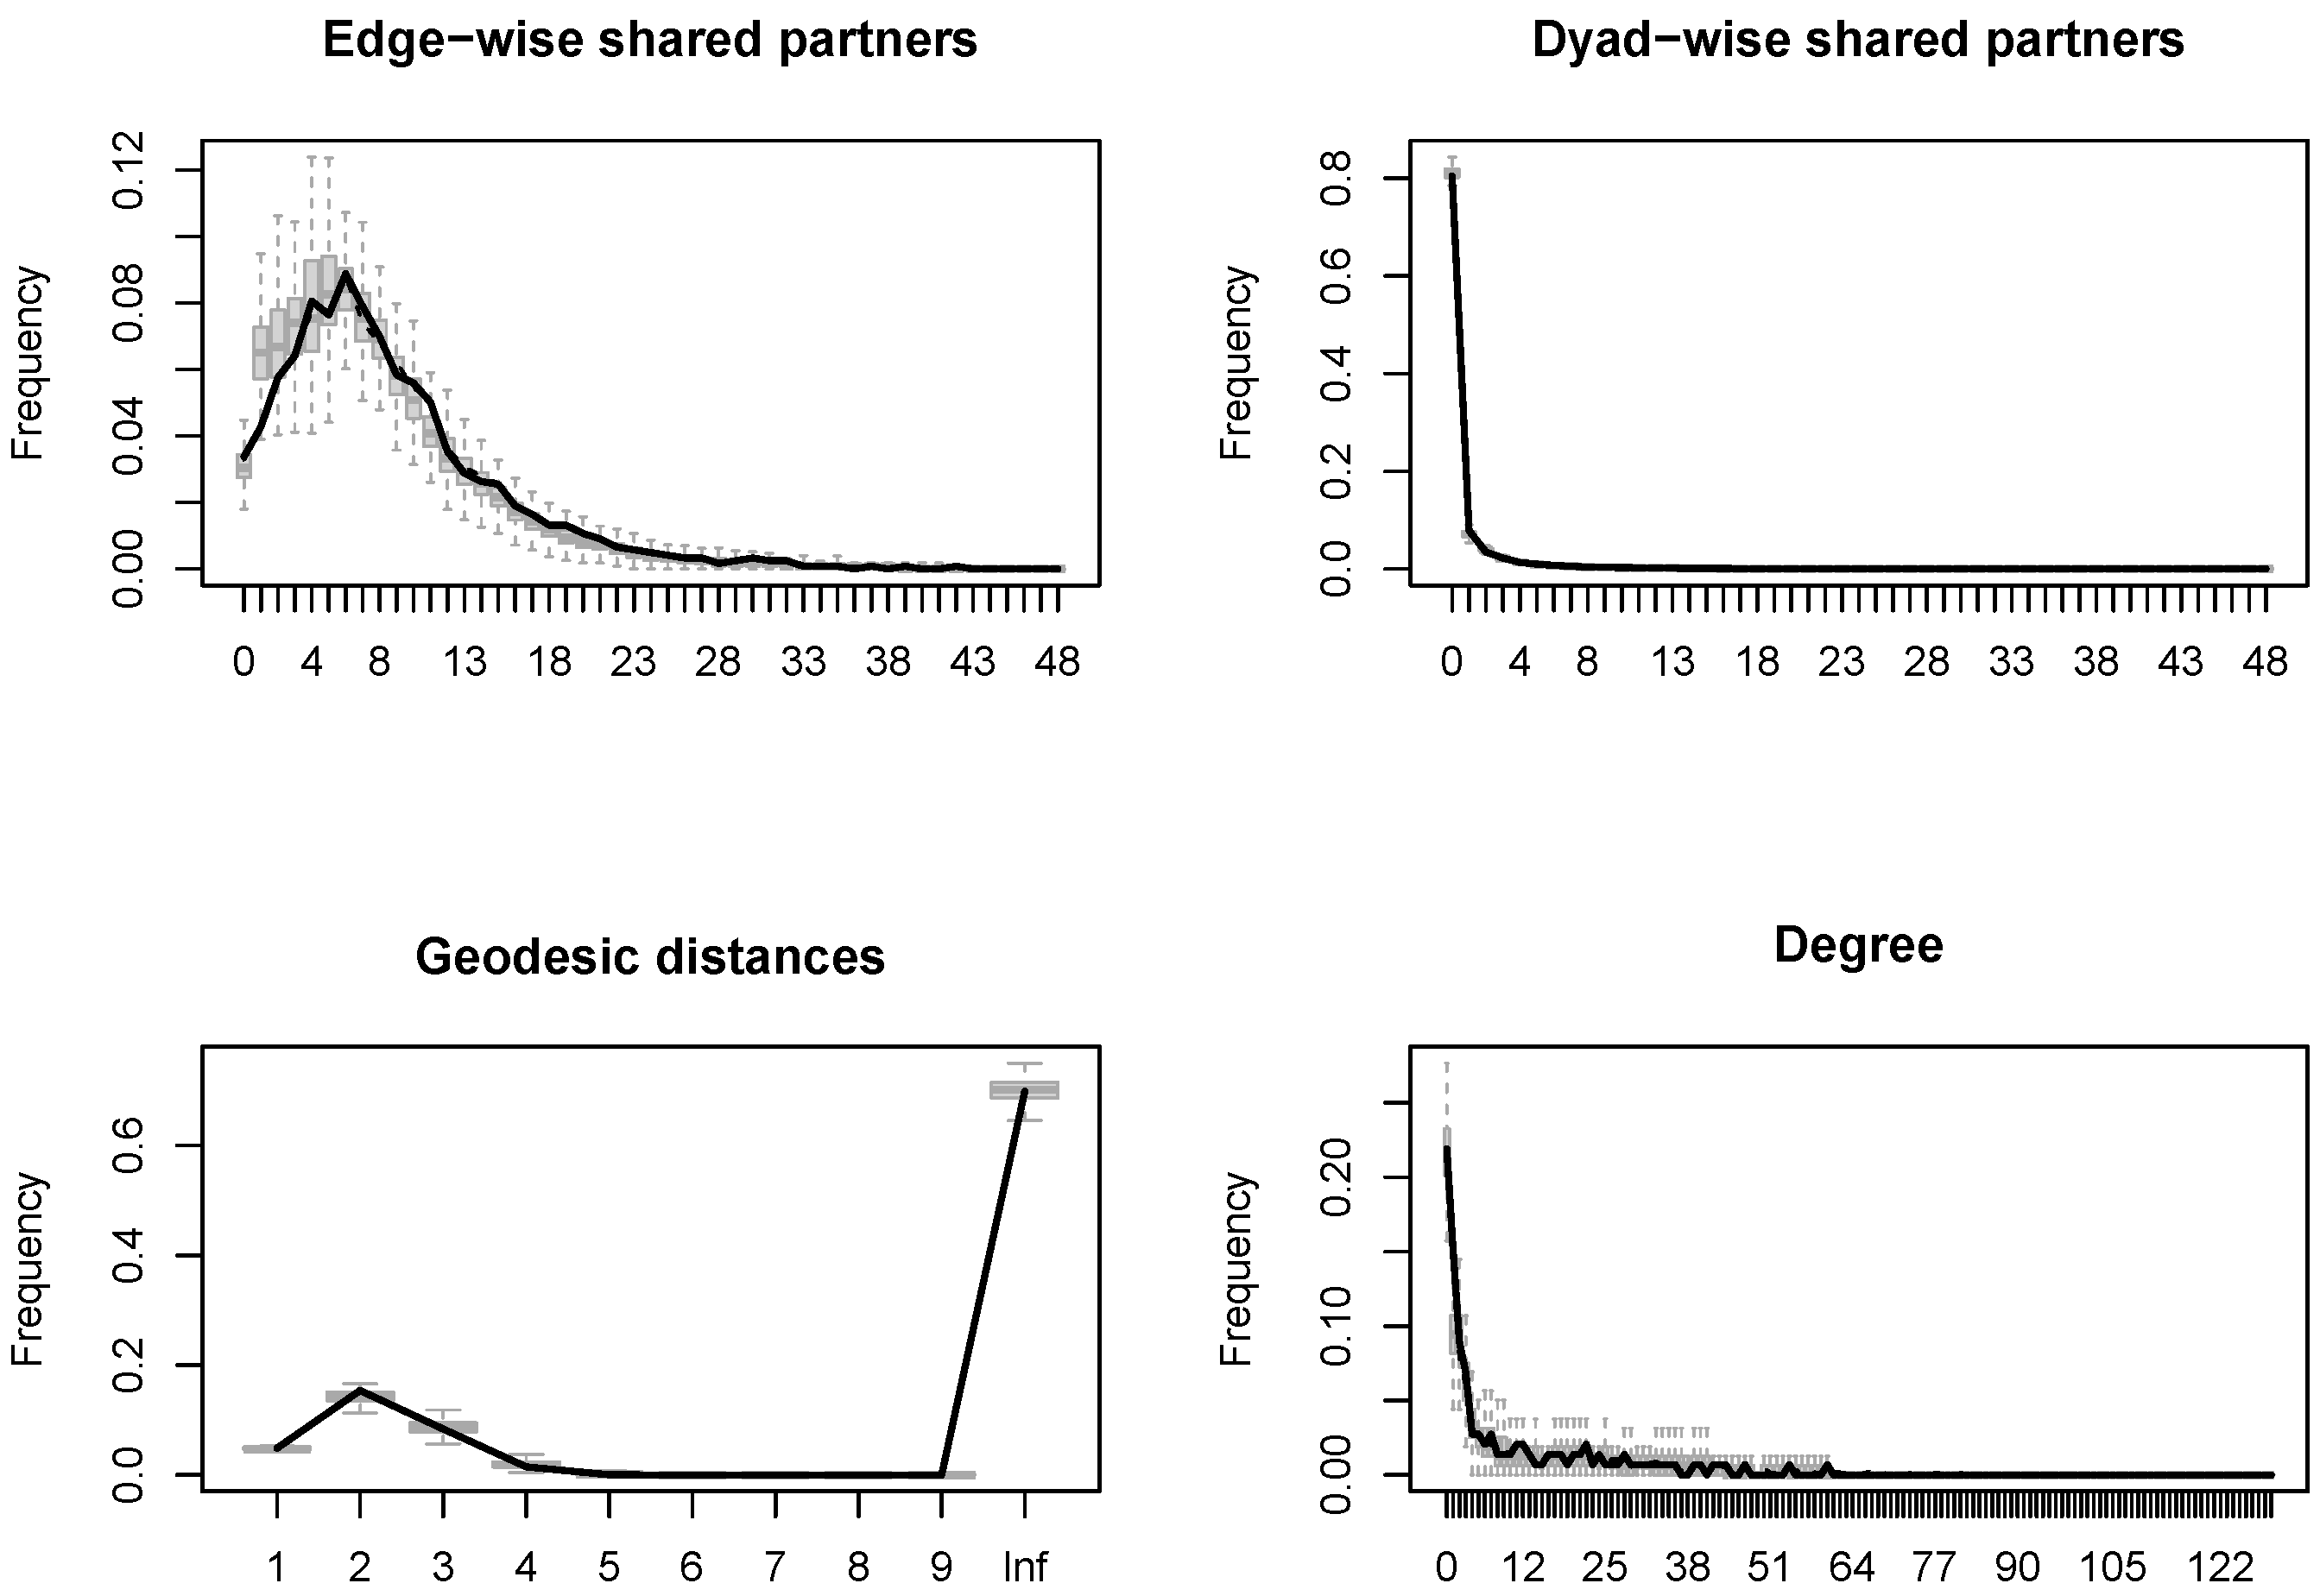
3.2.3. Goodness-of-Fit Test
4. Conclusions and Future Research
4.1. Conclusions
4.2. Future Research
Author Contributions
Funding
Institutional Review Board Statement
Informed Consent Statement
Data Availability Statement
Acknowledgments
Conflicts of Interest
Appendix A
| Code | Name | Code | Name | Code | Name |
|---|---|---|---|---|---|
| ALB | Albania | DZA | Algeria | AGO | Angola |
| ATG | Antigua and Barbuda | ARG | Argentina | ARM | Armenia |
| AUS | Australia | AUT | Austria | AZE | Azerbaijan |
| BHR | Bahrain | BGD | Bangladesh | BRB | Barbados |
| BRL | Belarus | BEL | Belgium | BLZ | Belize |
| BEN | Benin | BTN | Bhutan | BOL | Bolivia |
| BIH | Bosnia and Herzegovina | BWA | Botswana | BRA | Brazil |
| BRN | Brunei Darussalam | BGR | Bulgaria | BFA | Burkina Faso |
| BDI | Burundi | KHM | Cambodia | CMR | Cameroon |
| CAN | Canada | CPV | Cape Verde | CAF | Central African Republic |
| TCD | Chad | CHL | Chile | CHN | China |
| COL | Colombia | COG | Congo | CRC | Costa Rica |
| HRV | Croatia | CUB | Cuba | CYP | Cyprus |
| CZE | Czech Republic | CIV | Cote d’Ivoire | COD | Democratic Republic of the Congo |
| DNK | Denmark | DJI | The Republic of Djibouti | DOM | Dominican Republic |
| ECU | Ecuador | EGY | Egypt | SLV | El Salvador |
| ERI | Eritrea | EST | Estonia | ETH | Ethiopia |
| FJI | Fiji | FIN | Finland | FRA | France |
| GAB | Gabon | GMB | Gambia | GEO | Georgia |
| DEU | Germany | GHA | Ghana | GRC | Greece |
| GTM | Guatemala | GIN | Guinea | GUY | Guyana |
| HTI | Haiti | HND | Honduras | HUN | Hungary |
| ISL | Iceland | IND | India | IDN | Indonesia |
| IRN | Iran | IRQ | Iraq | IRL | Ireland |
| ISR | Israel | ITA | Italy | JAM | Jamaica |
| JPN | Japan | KAZ | Kazakhstan | JOR | Jordan |
| KEN | Kenya | KWT | Kuwait | KGZ | Kyrgyzstan |
| LAO | Lao People’s Democratic Republic | LVA | Latvia | LBN | Lebanon |
| LSO | Lesotho | LBR | Liberia | LBY | Libyan Arab Jamahiriya |
| LTU | Lithuania | LUX | Luxembourg | MDG | Madagascar |
| MWI | Malawi | MYS | Malaysia | MDV | Maldives |
| MLI | Mali | MLT | Malta | MRT | Mauritania |
| MUS | Mauritius | MEX | Mexico | MNG | Mongolia |
| MAR | Morocco | MOZ | Mozambique | MMR | Myanmar Burma |
| OMN | Oman | NAM | Namibia | NPL | Nepal |
| NLD | Netherlands | NZL | New Zealand | NIC | Nicaragua |
| NER | Niger | NGA | Nigeria | NOR | Norway |
| PAK | Pakistan | PAN | Panama | PNG | Papua New Guinea |
| PRY | Paraguay | PER | Peru | PHL | Philippines |
| POL | Poland | PRT | Portugal | QAT | Qatar |
| KOR | Republic of Korea | MDA | Republica Moldova | ROM | Romania |
| RUS | Russian Federation | RWA | Rwanda | SAU | Saudi Arabia |
| LKA | Sri Lanka | SEN | Senegal | SER | Serbia |
| SLE | Sierra Leone | SGP | Singapore | SVK | Slovakia |
| VNM | Viet Nam | SVN | Slovenia | ZAF | South Africa |
| ESP | Spain | SUR | Suriname | SWE | Sweden |
| CHE | Switzerland | SYR | Syrian Arab Republic | TJK | Tajikistan |
| THA | Thailand | TGO | Togo | TTO | Trinidad and Tobago |
| ARE | United Arab Emirates | TUN | Tunisia | TUR | Turkey |
| TKM | Turkmenistan | UGA | Uganda | UKR | Ukraine |
| GBR | United Kingdom | TZA | United Republic of Tanzania | UZB | Uzbekistan |
| URY | Uruguay | USA | United States of America | VEN | Venezuela |
| YEM | Yemen | ZMB | Zambia | ZWE | Zimbabwe |
| Abbreviation | Full Name | Definition in the Main Text |
|---|---|---|
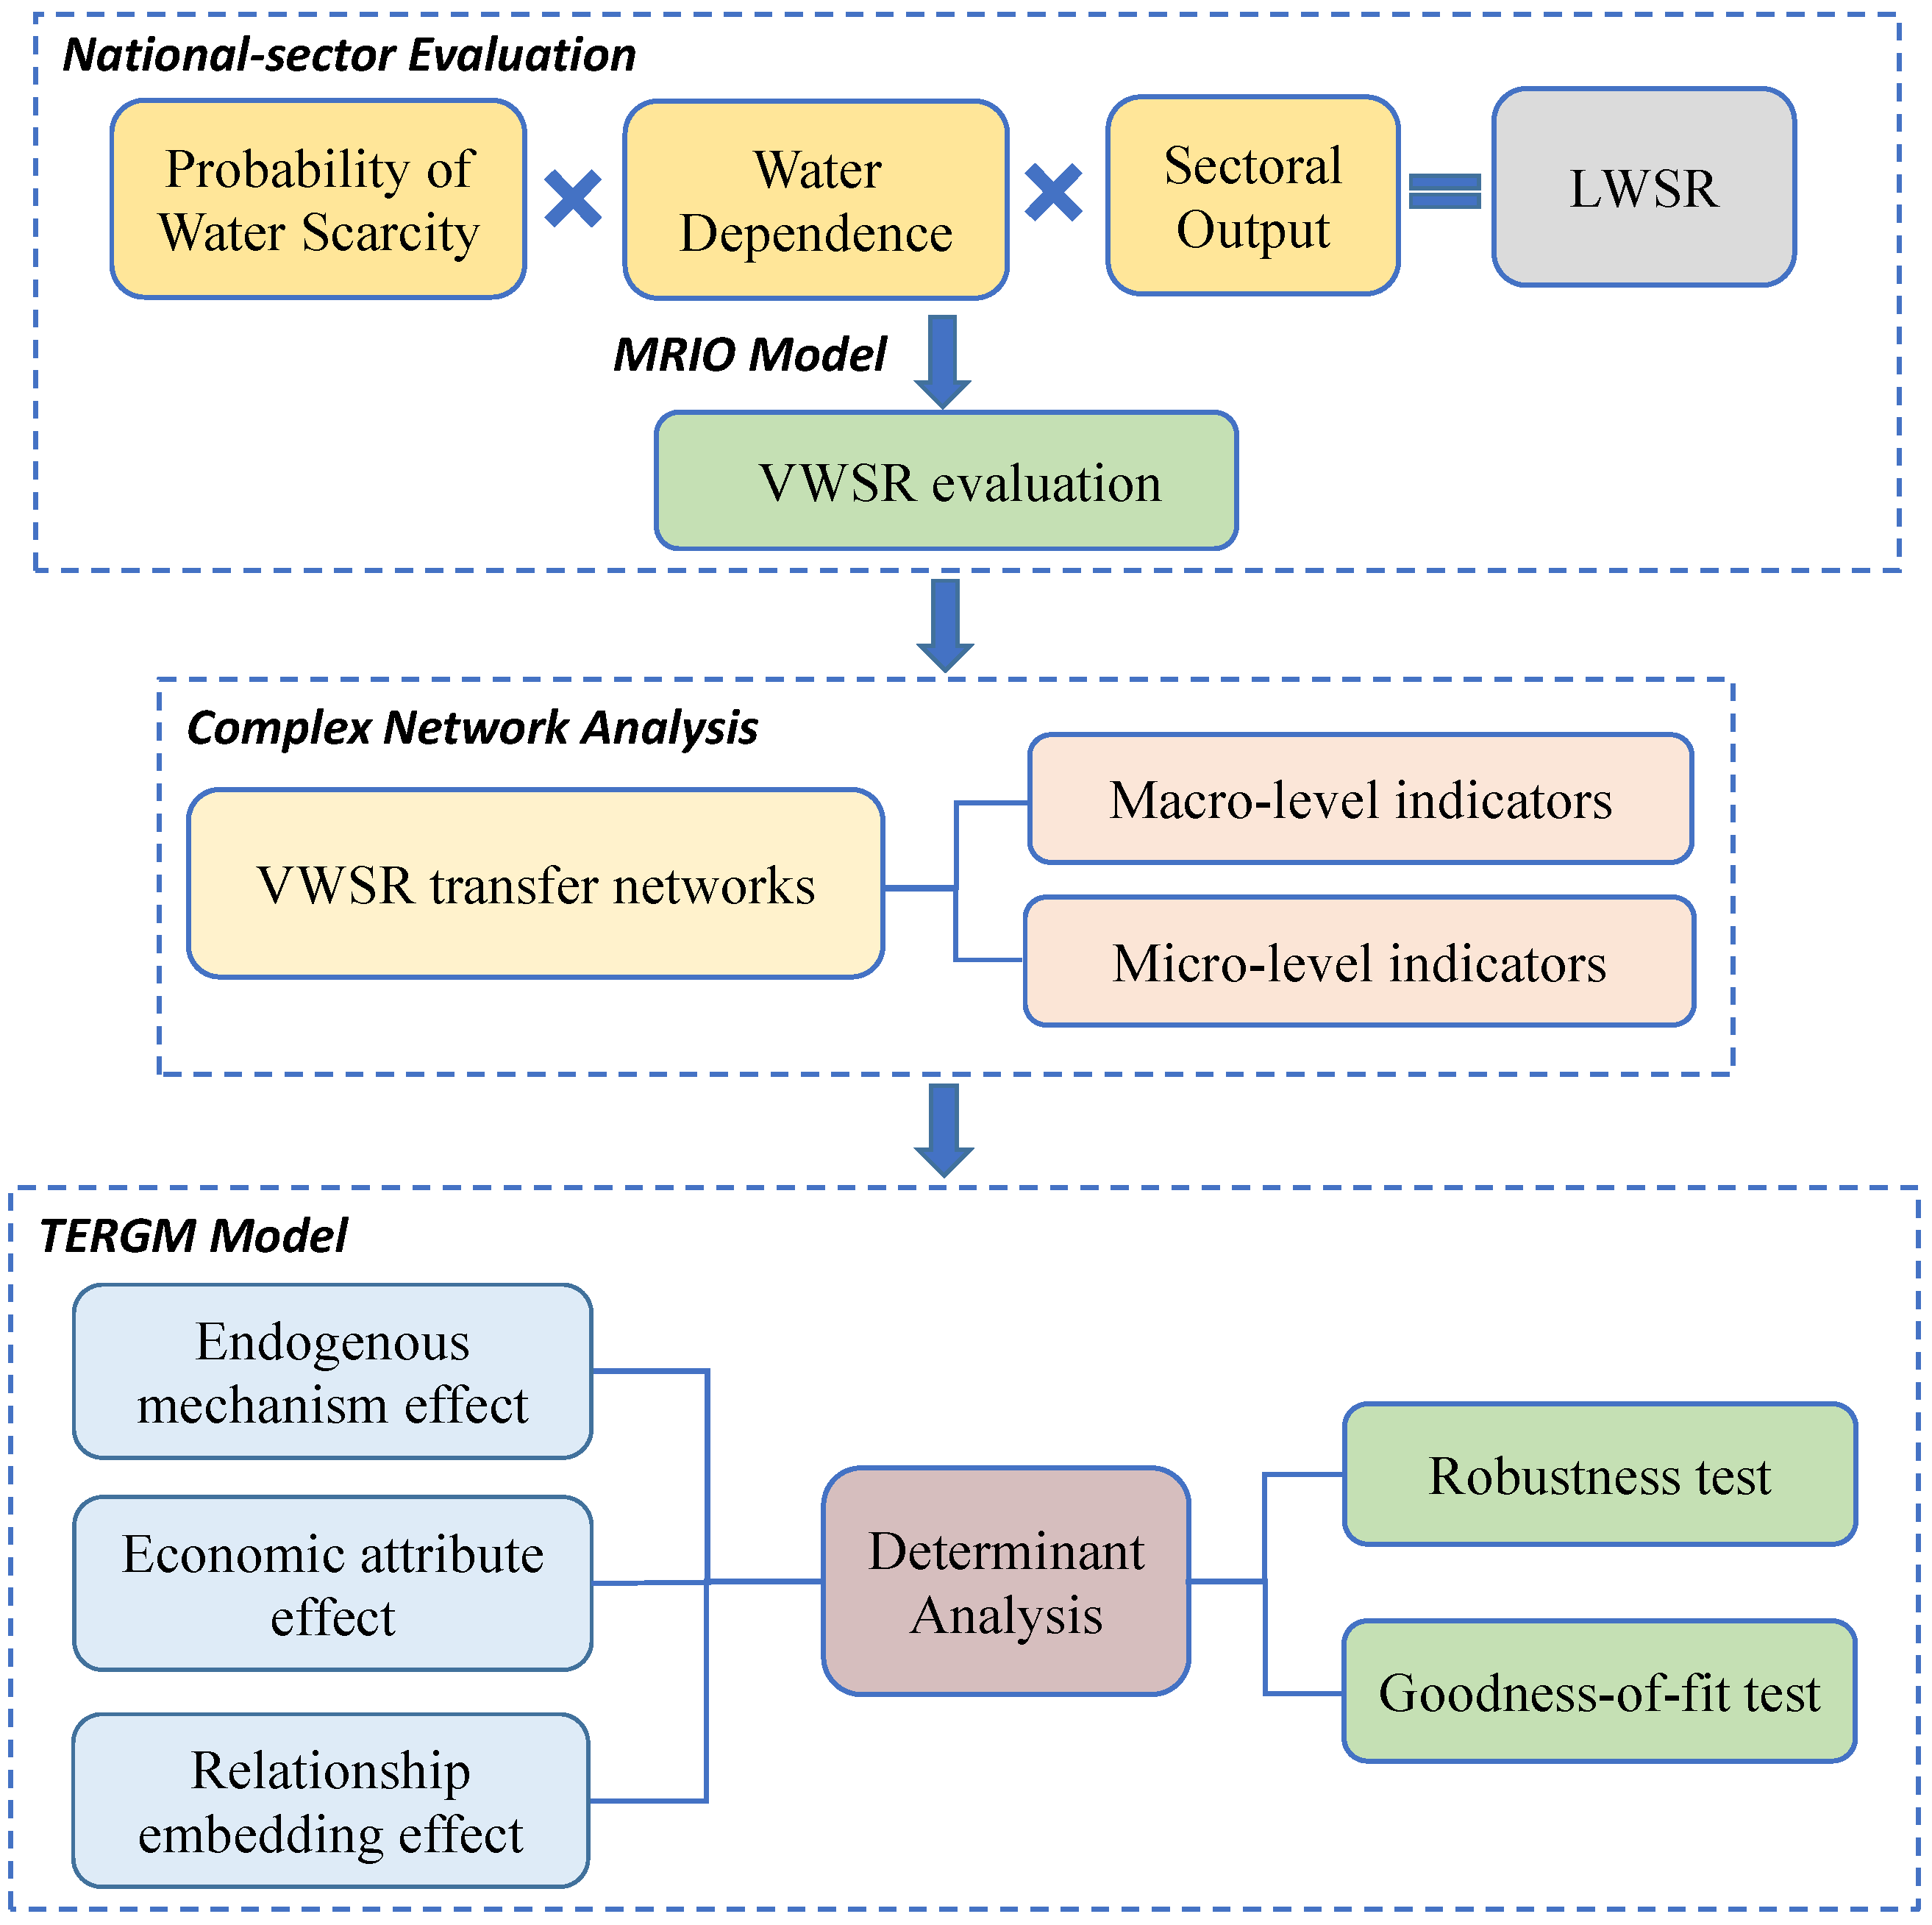
| LWSR | Local water scarcity risk | The potential economic loss of water-using sector due to local water scarcity. |
| VWSR | Virtual water scarcity risk | Production loss due to water shortages abroad, transferred through global supply chains. |
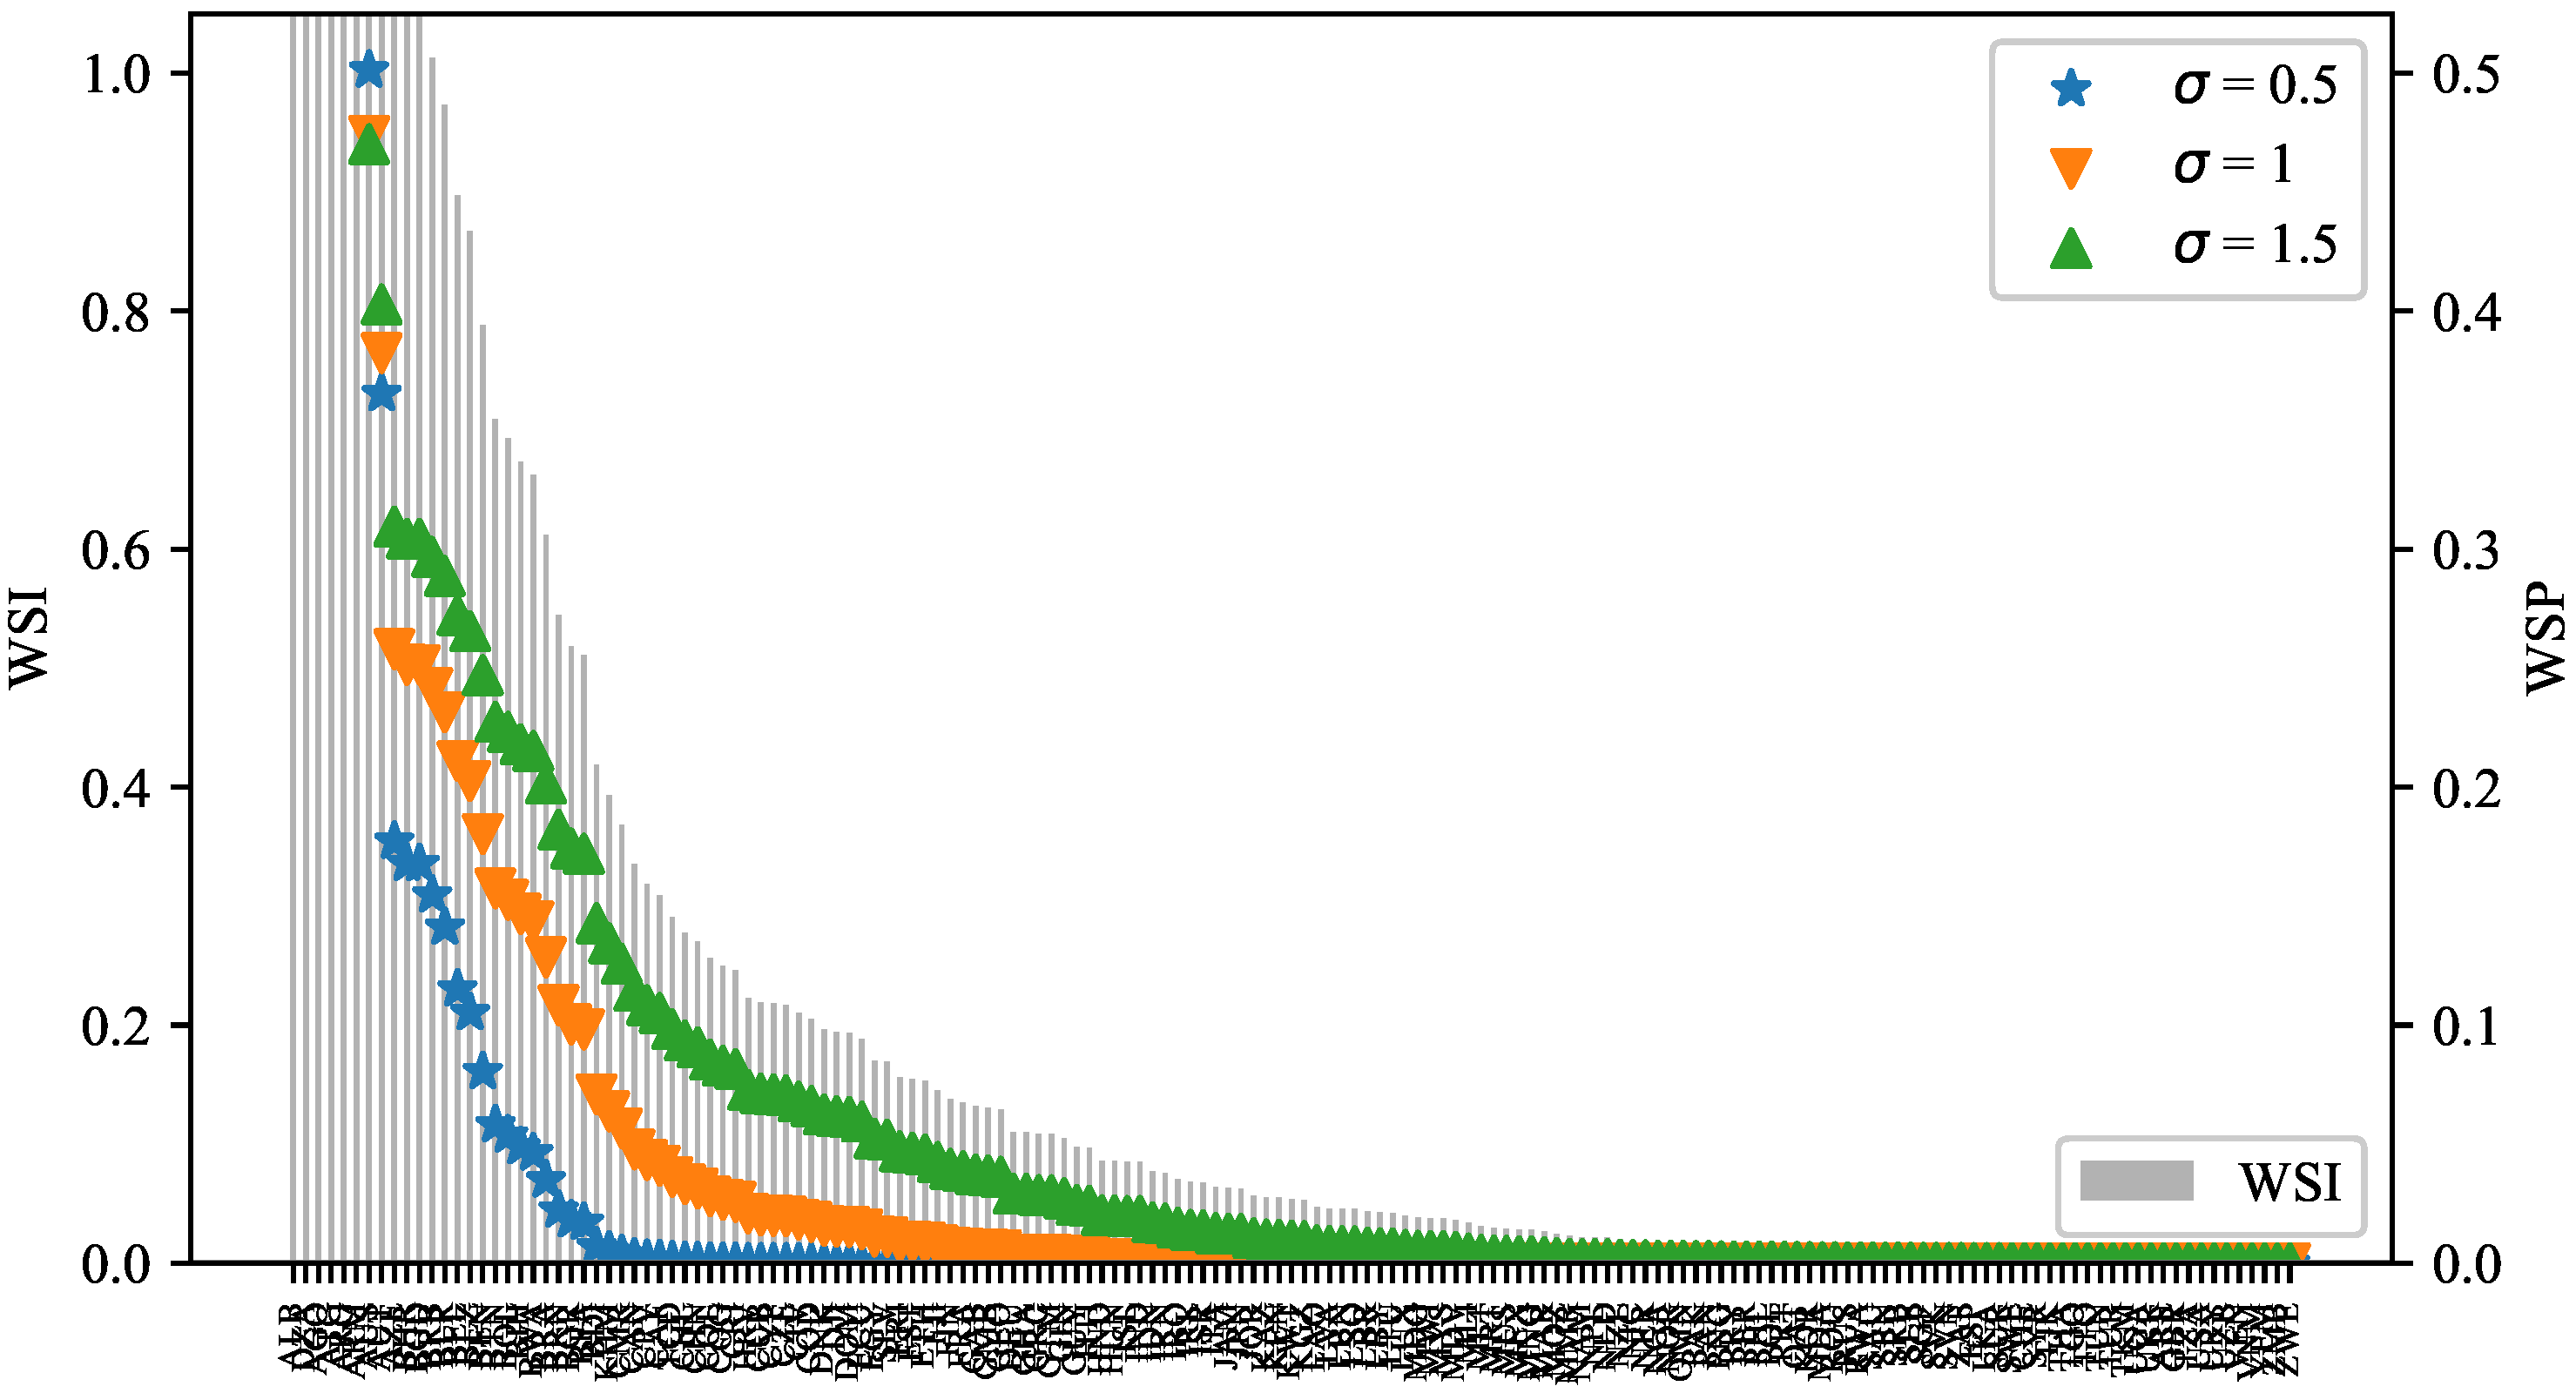
| WSP | Probability of water scarcity | The potential reduction in water use due to lack of water resources in a region. |
| WSI | Water stress index | The ratio of total freshwater withdrawal to total renewable water resources. |
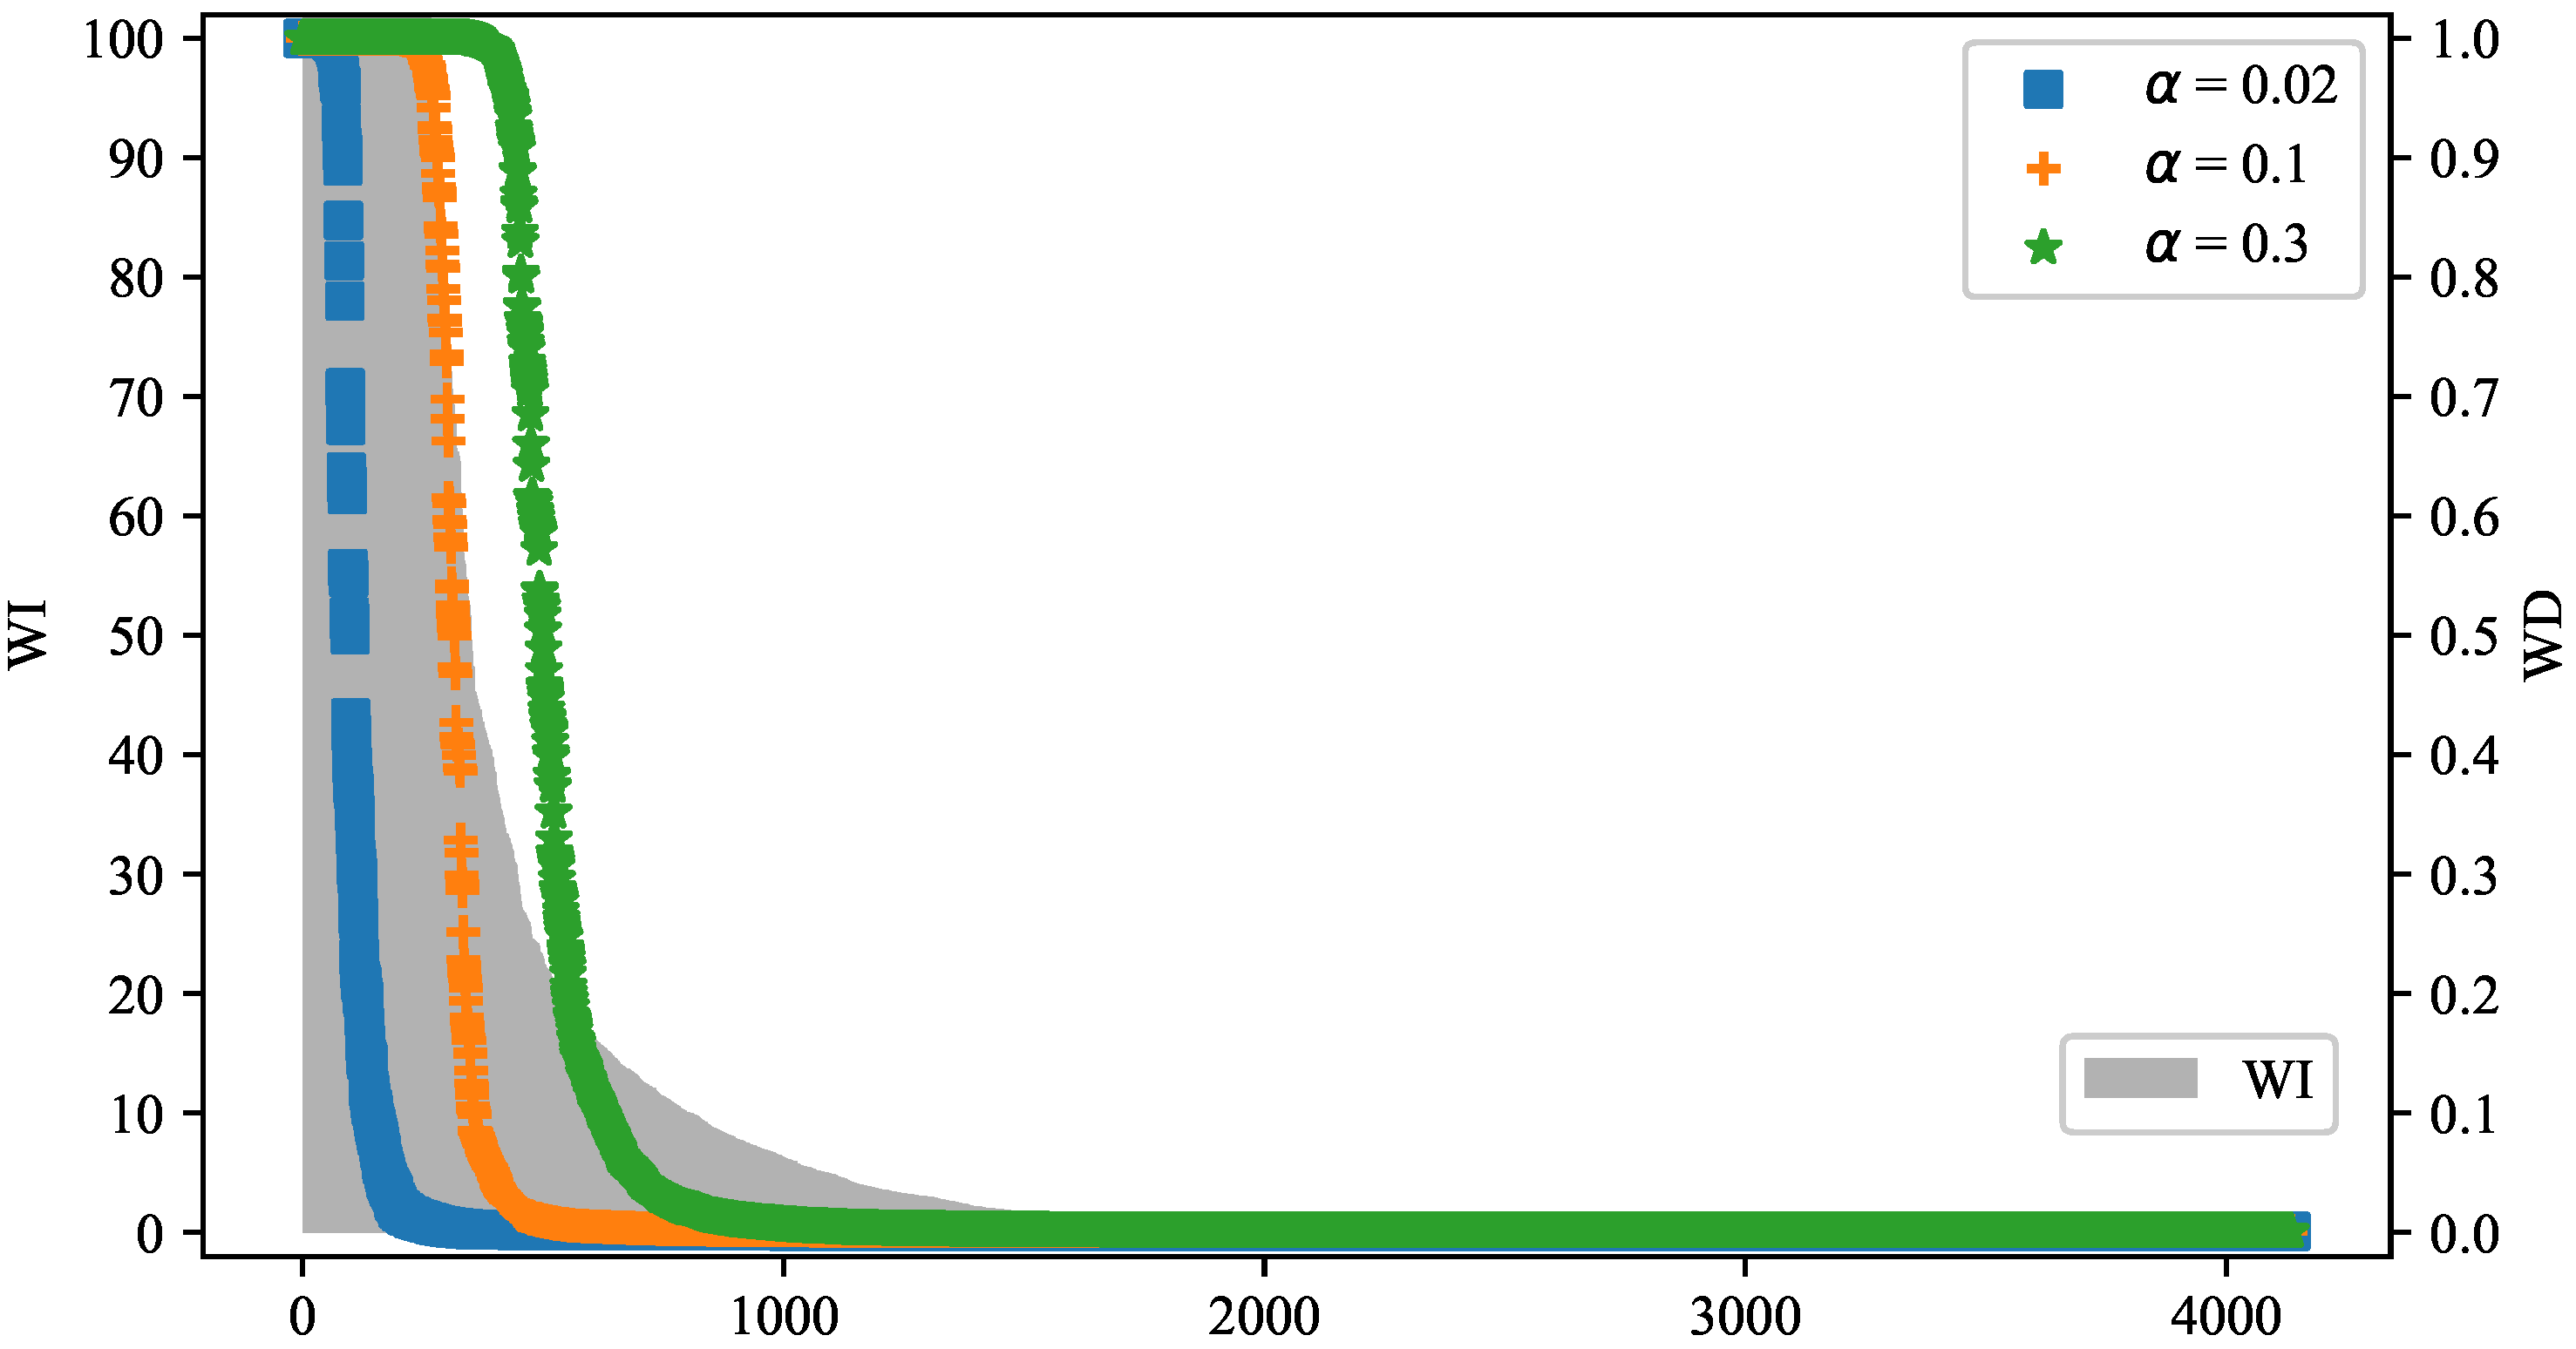
| WI | Water intensity | The ratio of a sector’s water consumption to its unitary economic output. |
| WD | Water dependence | The proportion of sectoral output reduced as a result of 1% reduction in water use. |
| MRIO | Multi-regional input-output | Methodology used to analyze economic interdependence between countries and sectors. |
| ERGM | Exponential random graph model | The model used to describe the network formation mechanism observed at a certain time point. |
| TERGM | Temporal exponential random graph model | An extension of the ERGM designed to accommodate inter-temporal dependence in longitudinally observed networks. |
References
- WMO: Water and Climate Alliance 2022 UN Climate Change Conference COP26. Available online: https://www.water-climate-coalition.org/ (accessed on 1 June 2022).
- Allan, J.A. Virtual water-the water, food, and trade nexus. Useful concept or misleading metaphor? Water Int. 2003, 28, 106–113. [Google Scholar] [CrossRef]
- Dalin, C.; Konar, M.; Hanasaki, N. Evolution of the global virtual water trade network. Proc. Natl. Acad. Sci. USA 2012, 109, 5989–5994. [Google Scholar] [CrossRef] [PubMed]
- Qu, S.; Liang, S.; Konar, M.; Zhu, Z.; Chiu, A.S.F.; Jia, X. Virtual water scarcity risk to the global trade system. Environ. Sci. Technol. 2018, 52, 673–683. [Google Scholar] [CrossRef] [PubMed]
- Hoekstra, A.Y. Water scarcity challenges to business. Nat. Clim. Chang. 2014, 4, 318–320. [Google Scholar] [CrossRef]
- Hewings, G.J.D.; Jensen, R.C. Regional, interregional and multiregional input-output analysis. In Handbook of Regional and Urban Economics; Elsevier: Amsterdam, The Netherlands, 1987; Volume 1, pp. 295–355. [Google Scholar]
- Zhang, C.; Anadon, L.D. A multi-regional input–output analysis of domestic virtual water trade and provincial water footprint in China. Ecol. Econ. 2014, 100, 159–172. [Google Scholar] [CrossRef]
- Zhang, C.; Zhong, L.; Liang, S.; Sanders, K.T.; Wang, J.; Xu, M. Virtual scarce water embodied in inter-provincial electricity transmission in China. Appl. Energy 2017, 187, 438–448. [Google Scholar] [CrossRef]
- Zhang, Y.; Zhang, J.-H.; Tian, Q.; Liu, Z.-H.; Zhang, H.-L. Virtual water trade of agricultural products: A new perspective to explore the Belt and Road. Sci. Total Environ. 2018, 622, 988–996. [Google Scholar] [CrossRef]
- Kan, S.; Chen, B.; Wu, X.; Chen, Z.; Chen, G. Natural gas overview for world economy: From primary supply to final demand via global supply chains. Energy Policy 2019, 124, 215–225. [Google Scholar] [CrossRef]
- Jiang, D. Sensitivity of Input-Output-Based Water Consumption Analysis to Uncertainty in Green Water Availability: A Case Study of Five Provinces in China. 2015. Available online: http://programme.exordo.com/isie2015/delegates/presentation/1386/ (accessed on 22 September 2022).
- Tian, Z.; Fang, D.; Chen, B. Three-scale input-output analysis for energy and water consumption in urban agglomeration. J. Clean. Prod. 2020, 268, 122148. [Google Scholar] [CrossRef]
- Wang, Y.B.; Wu, P.T.; Zhao, X.N.; Engel, B. Virtual water flows of grain within China and its impact on water resource and grain security in 2010. Ecol. Eng. 2014, 69, 255–264. [Google Scholar] [CrossRef]
- Wiedmann, T. A first empirical comparison of energy footprints embodied in trade: MRIO versus Plum. Ecol. Econ. 2009, 68, 1975–1990. [Google Scholar] [CrossRef]
- White, D.J.; Feng, K.; Sun, L.; Hubacek, K. A hydro-economic MRIO analysis of the Haihe River Basin’s water footprint and water stress. Ecol. Model. 2015, 318, 157–167. [Google Scholar] [CrossRef]
- Chen, B.; Li, J.; Wu, X.; Han, M.; Zeng, L.; Li, Z.; Chen, G. Global energy flows embodied in international trade: A combination of environmentally extended input–output analysis and complex network analysis. Appl. Energy 2018, 210, 98–107. [Google Scholar] [CrossRef]
- Sun, X.; An, H.; Gao, X.; Jia, X.; Liu, X. Indirect energy flow between industrial sectors in China: A complex network approach. Energy 2016, 94, 195–205. [Google Scholar] [CrossRef]
- Wang, X.; Yao, M.; Li, J.; Ge, J.; Wei, W.; Wu, B.; Zhang, M. Global embodied rare earths flows and the outflow paths of China’s embodied rare earths: Combining multi-regional input-output analysis with the complex network approach. J. Clean. Prod. 2019, 216, 435–445. [Google Scholar] [CrossRef]
- Du, R.; Dong, G.; Tian, L.; Wang, Y.; Zhao, L.; Zhang, X.; Vilela, A.L.; Stanley, H.E. Identifying the peak point of systemic risk in international crude oil importing trade. Energy 2019, 176, 281–291. [Google Scholar] [CrossRef]
- Du, R.; Wang, Y.; Dong, G.; Tian, L.; Liu, Y.; Wang, M.; Fang, G. A complex network perspective on interrelations and evolution features of international oil trade, 2002–2013. Appl. Energy 2017, 196, 142–151. [Google Scholar] [CrossRef]
- Angelidis, G.; Bratsas, C.; Makris, G.; Ioannidis, E.; Varsakelis, N.C.; Antoniou, I.E. Global Value Chains of COVID-19 Materials: A Weighted Directed Network Analysis. Mathematics 2021, 9, 3202. [Google Scholar] [CrossRef]
- Zhang, X.; Zhao, T.; Wang, J.; Wei, Y. The embodied CO2 transfer across sectors of cities in Jing-Jin-Ji region: Combining multi-regional input–output analysis with complex network analysis. Environ. Sci. Pollut. Res. 2021, 28, 44249–44263. [Google Scholar] [CrossRef]
- Feng, K.; Hubacek, K.; Pfister, S.; Yu, Y.; Sun, L. Virtual scarce water in China. Environ. Sci. Technol. 2014, 48, 7704–7713. [Google Scholar] [CrossRef]
- Wang, R.; Zimmerman, J. Hybrid analysis of blue water consumption and water scarcity implications at the global, national, and basin levels in an increasingly globalized world. Environ. Sci. Technol. 2016, 50, 5143–5153. [Google Scholar] [CrossRef] [PubMed]
- Tobor-Kapłon, M.A.; Holtkamp, R.; Scharler, U.M.; Doroszuk, A.; Kuenen, F.J.; Bloem, J.; de Ruiter, P.C. Evaluation of information indices as indicators of environmental stress in terrestrial soils. Ecol. Model. 2007, 208, 80–90. [Google Scholar] [CrossRef]
- Uri, N.D. A reconsideration of effect of energy scarcity on economic growth. Energy 1995, 36, 150. [Google Scholar] [CrossRef]
- Rushforth, R.R.; Ruddell, B.L. The vulnerability and resilience of a city’s water footprint: The case of Flagstaff, Arizona, USA. Water Resour. Res. 2016, 52, 2698–2714. [Google Scholar] [CrossRef]
- Liu, Y.; Chen, B. Water-energy scarcity nexus risk in the national trade system based on multiregional input-output and network environ analyses. Appl. Energy 2020, 268, 114974. [Google Scholar] [CrossRef]
- Zhao, H.; Qu, S.; Liu, Y.; Guo, S.; Zhao, H.; Chiu, A.C.; Liang, S.; Zou, J.P.; Xu, M. Virtual water scarcity risk in China. Resour. Conserv. Recycl. 2020, 160, 104886. [Google Scholar] [CrossRef]
- Yao, X.; Tang, X.; Farnoosh, A.; Feng, C. Quantifying virtual water scarcity risk transfers of energy system in China. Environ. Econ. Policy Stud. 2021, 23, 945–969. [Google Scholar] [CrossRef]
- Block, P.; Koskinen, J.; Hollway, J.; Steglich, C.; Stadtfeld, C. Change we can believe in: Comparing longitudinal network models on consistency, interpretability and predictive power. Soc. Netw. 2018, 52, 180–191. [Google Scholar] [CrossRef]
- Orman, G.K.; Labatut, V.; Naskali, A.T. Exploring the evolution of node neighborhoods in Dynamic Networks. Phys. A Stat. Mech. Its Appl. 2017, 482, 375–391. [Google Scholar] [CrossRef]
- Snijders, T.A.B. Models for longitudinal network data. Model. Methods Soc. Netw. Anal. 2005, 1, 215–247. [Google Scholar]
- Hanneke, S.; Fu, W.; Xing, E.P. Discrete temporal models of social networks. Electron. J. Stat. 2010, 4, 585–605. [Google Scholar] [CrossRef]
- Frank, O.; Strauss, D. Markov graphs. J. Am. Stat. Assoc. 1986, 81, 832–842. [Google Scholar] [CrossRef]
- Wasserman, S.; Pattison, P. Logit models and logistic regressions for social networks: I. An introduction to Markov graphs andp. Psychometrika 1996, 61, 401–425. [Google Scholar] [CrossRef]
- Xu, H.; Sun, T.Y.; Cheng, L.H. Trade patterns and influence factors of high-end manufacturing on one belt and one road: A study based on the exponential random graph models. Financ. Trade Econ. 2015, 12, 74–88. [Google Scholar]
- He, X.-J.; Dong, Y.-B.; Wu, Y.-Y.; Jiang, G.-R.; Zheng, Y. Factors affecting evolution of the interprovincial technology patent trade networks in China based on exponential random graph models. Phys. A Stat. Mech. Its Appl. 2019, 514, 443–457. [Google Scholar] [CrossRef]
- Eora26. The Eora Global Supply Chain Database. Available online: https://worldmrio.com/eora26/ (accessed on 1 May 2021).
- FAO; AQUASTAT. Food and Agriculture Organization of the United Nations. 2015. Available online: http://www.fao.org/nr/wa-ter/aquastat/main/index.stm (accessed on 1 May 2021).
- World Bank Open Data. Available online: https://data.worldbank.org.cn/ (accessed on 1 February 2022).
- CEPII. Available online: http://www.cepii.fr/CEPII/en/bdd-modele/bdd-modele-item.asp (accessed on 1 February 2022).
- WTO. Available online: https://data.wto.org/en (accessed on 1 February 2022).
- Du, R.; Wu, Q.; Nan, Z.; Dong, G.; Tian, L.; Wu, F. Natural Gas Scarcity Risk in the Belt and Road Economies Based on Complex Network and Multi-Regional Input-Output Analysis. Mathematics 2022, 10, 788. [Google Scholar] [CrossRef]
- Miller, R.E.; Blair, P.D. Input-Output Analysis: Foundations and Extensions; Cambridge University Press: Cambridge, UK, 2009. [Google Scholar]
- Dietzenbacher, E. In vindication of the Ghosh model: A reinterpretation as a price model. J. Reg. Sci. 1997, 37, 629–651. [Google Scholar]
- Du, R.; Zheng, X.; Tian, L.; Liu, K.; Qian, L.; Wu, Q.; Fang, G. A study on drivers of water consumption in China from a complex network perspective. Front. Phys. 2021, 9, 647. [Google Scholar] [CrossRef]
- Xu, H.; Feng, L.; Wu, G.; Zhang, Q. Evolution of structural properties and its determinants of global waste paper trade network based on temporal exponential random graph models. Renew. Sustain. Energy Rev. 2021, 149, 111402. [Google Scholar] [CrossRef]
- Garlaschelli, D.; Loffredo, M.I. Patterns of link reciprocity in directed networks. Phys. Rev. Lett. 2004, 93, 268701. [Google Scholar] [CrossRef]
- Newman, M.E.J. Assortative mixing in networks. Phys. Rev. Lett. 2002, 89, 208701. [Google Scholar] [CrossRef] [PubMed]
- Zhang, Q.; Zeng, Q. Analyzing the shipping network of the maritime silk road (MSR) based on a complex network. J. Coast. Res. 2019, 98, 344–349. [Google Scholar] [CrossRef]
- Wang, X.; Wei, W.; Ge, J.; Wu, B.; Bu, W.; Li, J.; Yao, M.; Guan, Q. Embodied rare earths flow between industrial sectors in China: A complex network approach. Resour. Conserv. Recycl. 2017, 125, 363–374. [Google Scholar] [CrossRef]
- Cai, H.; Wang, Z.; Zhu, Y. Understanding the structure and determinants of intercity carbon emissions association network in China. J. Clean. Prod. 2022, 352, 131535. [Google Scholar] [CrossRef]
- Lusher, D.; Koskinen, J.; Robins, G. Exponential Random Graph Models for Social Networks: Theory, Methods, and Applications; Cambridge University Press: Cambridge, UK, 2013. [Google Scholar]
- Xu, J.; Yang, X.; Razzaq, A. Understanding the Role of Humanistic Factors in Trade Network Evolution across the Belt and Road Initiative Countries Using the Exponential Random Graph Model. Complexity 2021, 2021, 1961061. [Google Scholar] [CrossRef]
- Eaton, J.; Kortum, S. Technology, geography, and trade. Econometrica 2002, 70, 1741–1779. [Google Scholar] [CrossRef]
- Anderson, J.E.; Van Wincoop, E. Gravity with gravitas: A solution to the border puzzle. Am. Econ. Rev. 2003, 93, 170–192. [Google Scholar] [CrossRef]
- Guiso, L.; Sapienza, P.; Zingales, L. Cultural biases in economic exchange? Q. J. Econ. 2009, 124, 1095–1131. [Google Scholar] [CrossRef]
- Boisso, D.; Ferrantino, M. Economic distance, cultural distance, and openness in international trade: Empirical puzzles. J. Econ. Integr. 1997, 456–484. [Google Scholar]
- Watts, D.J.; Strogatz, S.H. Collective dynamics of ‘small-world’ networks. Nature 1998, 393, 440–442. [Google Scholar] [CrossRef]
- Snijders, T.A.B.; Pattison, P.E.; Robins, G.L.; Handcock, M.S. New specifications for exponential random graph models. Sociol. Methodol. 2006, 36, 99–153. [Google Scholar] [CrossRef]
- Silk, M.J.; Fisher, D.N. Understanding animal social structure: Exponential random graph models in animal behaviour research. Anim. Behav. 2017, 132, 137–146. [Google Scholar] [CrossRef]
| Classification | Variable Name | Meaning | Statistic | Hypotheses |
|---|---|---|---|---|
| Constant Term | Edges | Network density | Constant | |
| Endogenous Mechanism Effect | Mutual | Reciprocity | Hypothesis 1 | |
| Gwesp | Transitivity effect | |||
| Gwdsp | Connectivity effect | |||
| Stability | Stability effect | Hypothesis 2 | ||
| Economic Attribute Effect | Homophily (Continent) | Continent homophily | Hypothesis 3 | |
| Receiver (MT) | MT receiver effect | Hypothesis 4 | ||
| Receiver (URB) | URB receiver effect | |||
| Receiver (GDP) | GDP receiver effect | |||
| Sender (MT) | MT sender effect | |||
| Sender (URB) | URB sender effect | |||
| Sender (GDP) | GDP sender effect | |||
| Relations Embedding Effect | Edgecov (CGB) | CGB embedding effect | Hypothesis 5 | |
| Edgecov (COL) | COL embedding effect | |||
| Edgecov (RTA) | RTA embedding effect |
| Year | L | C | R | A | ||||
|---|---|---|---|---|---|---|---|---|
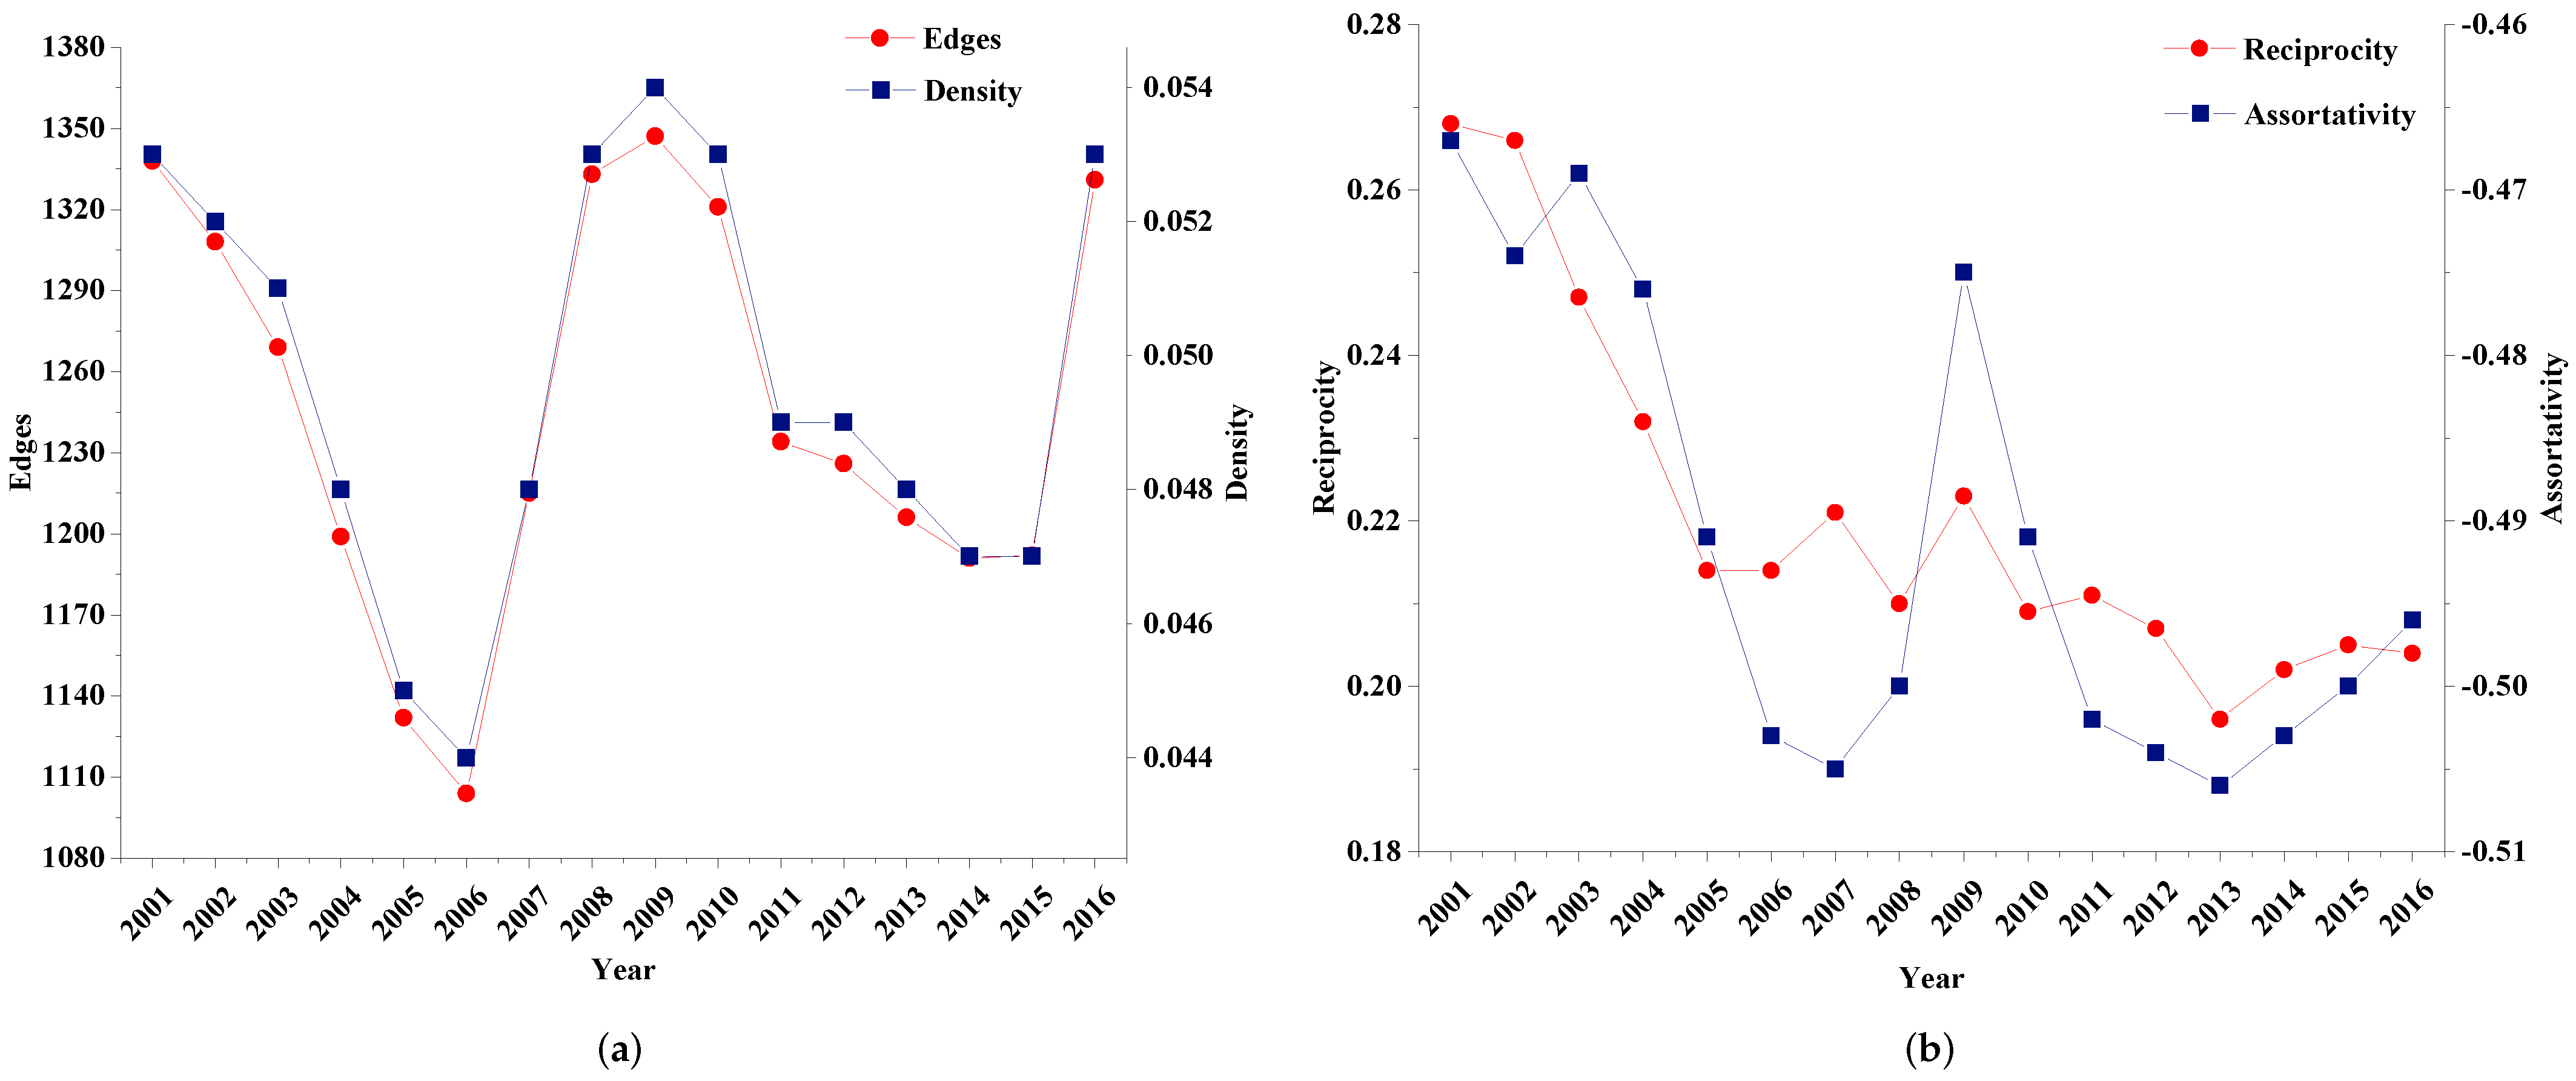
| 2001 | 118 | 1338 | 0.053 | 1.946 | 0.753 | 6.565 | 0.268 | −0.467 |
| 2002 | 121 | 1308 | 0.052 | 1.959 | 0.757 | 6.757 | 0.266 | −0.474 |
| 2003 | 124 | 1269 | 0.051 | 1.969 | 0.754 | 6.978 | 0.247 | −0.469 |
| 2004 | 123 | 1199 | 0.048 | 1.970 | 0.742 | 7.418 | 0.232 | −0.476 |
| 2005 | 125 | 1132 | 0.045 | 1.970 | 0.745 | 8.056 | 0.214 | −0.491 |
| 2006 | 127 | 1104 | 0.044 | 1.981 | 0.736 | 8.196 | 0.214 | −0.503 |
| 2007 | 127 | 1215 | 0.048 | 1.954 | 0.749 | 7.414 | 0.221 | −0.505 |
| 2008 | 127 | 1333 | 0.053 | 1.917 | 0.743 | 6.611 | 0.210 | −0.500 |
| 2009 | 126 | 1347 | 0.054 | 1.934 | 0.743 | 6.457 | 0.223 | −0.475 |
| 2010 | 128 | 1321 | 0.053 | 1.918 | 0.733 | 6.597 | 0.209 | −0.491 |
| 2011 | 128 | 1234 | 0.049 | 1.943 | 0.729 | 7.104 | 0.211 | −0.502 |
| 2012 | 127 | 1226 | 0.049 | 1.932 | 0.721 | 7.127 | 0.207 | −0.504 |
| 2013 | 129 | 1206 | 0.048 | 1.936 | 0.720 | 7.265 | 0.196 | −0.506 |
| 2014 | 129 | 1191 | 0.047 | 1.941 | 0.716 | 7.337 | 0.202 | −0.503 |
| 2015 | 127 | 1192 | 0.047 | 1.936 | 0.722 | 7.398 | 0.205 | −0.500 |
| 2016 | 137 | 1331 | 0.053 | 1.921 | 0.776 | 6.898 | 0.204 | −0.496 |
| Model 1 | Model 2 | Model 3 | |
|---|---|---|---|
| Endogenous Mechanism Effect | |||
| Edges | −3.19 (0.01) *** | −19.83 (0.52) *** | −17.00 (0.54) *** |
| Mutual | 0.20 (0.08) ** | ||
| Gwesp | 1.55 (0.05) *** | ||
| Gwdsp | −0.03 (0.00) *** | ||
| Stability | 3.64 (0.03) *** | ||
| Economic Attribute Effect | |||
| Homophily (Continent) | 0.40 (0.06) *** | 0.21 (0.06) *** | |
| Receiver (MT) | 0.62 (0.02) *** | 0.53 (0.06) *** | |
| Receiver (URB) | −0.12 (0.00) * | −0.31 (0.00) * | |
| Receiver (GDP) | 1.51 (0.01) *** | 0.77 (0.03) *** | |
| Sender (MT) | 0.25 (0.03) ** | 0.04 (0.07) * | |
| Sender (URB) | −3.54 (0.05) *** | −2.28 (0.13) *** | |
| Sender (GDP) | 1.64 (0.01) *** | 0.62 (0.03) *** | |
| Relations Embedding Effect | |||
| Edgecov (CGB) | 1.44 (0.03) *** | 1.36 (0.04) *** | 0.88 (0.10) *** |
| Edgecov (COL) | 0.14 (0.02) *** | 0.23 (0.02) ** | 0.06 (0.07) |
| Edgecov (RTA) | 0.74 (0.02) *** | −0.19 (0.06) *** | −0.14 (0.06) ** |
| AIC | 154,290.91 | 108,508.54 | 18,648.23 |
| BIC | 154,334.52 | 108,628.48 | 18,851.53 |
| Model 4 | Model 5 | Model 6 | Model 7 | Model 8 | Model 9 | |
|---|---|---|---|---|---|---|
| Endogenous Mechanism Effect | ||||||
| Edges | −18.71 (0.79) *** | −17.68 (0.90) *** | −15.41 (0.68) *** | −15.77 (0.62) *** | −15.81 (0.67) *** | −16.29 [−16.14;−18.10] * |
| Mutual | 0.05 (0.11) * | 0.24 (0.13) * | 0.20 (0.10) * | 0.12 (0.09) * | 0.07 (0.11) * | 0.42 [0.42;0.20] * |
| Gwesp | 1.57 (0.08) *** | 1.44 (0.08) *** | 1.66 (0.08) *** | 2.06 (0.08) *** | 2.25 (0.10) *** | 1.18 [1.17;1.08] * |
| Gwdsp | −0.03 (0.00) *** | −0.03 (0.00) *** | −0.03 (0.00) *** | −0.05 (0.00) *** | −0.06 (0.00) *** | −0.02 [−0.02;−0.03] * |
| Stability | 3.60 (0.04) *** | 3.73 (0.04) *** | 3.28 (0.03) *** | 2.70 (0.03) *** | 2.25 (0.03) *** | 3.70 [3.74;3.37] * |
| Economic Attribute Effect | ||||||
| Homophily (Continent) | 0.16 (0.08) ** | 0.31 (0.08) *** | 0.16 (0.07) ** | 0.21 (0.06) *** | 0.23 (0.07) *** | 0.26 [0.25;0.07] * |
| Receiver (MT) | 0.58 (0.08) *** | 0.55 (0.09) *** | 0.53 (0.07) *** | 0.54 (0.06) *** | 0.49 (0.07) *** | 0.64 [0.64;0.53] * |
| Receiver (URB) | −0.60 (0.20) ** | −0.10 (0.21) * | −0.54 (0.18) ** | −0.40 (0.16) * | −0.45 (0.18) ** | −0.41 [−0.42;−0.70] * |
| Receiver (GDP) | 0.88 (0.05) *** | 0.75 (0.06) *** | 0.74 (0.04) *** | 0.67 (0.04) *** | 0.64 (0.04) *** | 0.83 [0.83;0.69] * |
| Sender (MT) | 0.24 (0.10) * | 0.05 (0.11) * | 0.15 (0.09) * | 0.02 (0.08) * | 0.06 (0.08) * | 0.25 [0.27;0.60] * |
| Sender (URB) | −3.00 (0.19) *** | −2.17 (0.19) *** | −2.31 (0.15) *** | −2.27 (0.14) *** | −2.27 (0.15) *** | −2.40 [−2.40;−2.96] * |
| Sender (GDP) | 0.73 (0.05) *** | 0.68 (0.05) *** | 0.53 (0.04) *** | 0.58 (0.04) *** | 0.60 (0.04) *** | 0.57 [0.57;0.42] * |
| Relations Embedding Effect | ||||||
| Edgecov (CGB) | 1.15 (0.15) *** | 0.59 (0.17) *** | 0.97 (0.14) *** | 0.88 (0.13) *** | 0.89 (0.14) *** | 0.88 [0.88;0.61] * |
| Edgecov (COL) | 0.04 (0.10) | 0.02 (0.11) | 0.02 (0.08) | 0.04 (0.08) | 0.04 (0.08) | 0.04 [0.00;0.18] * |
| Edgecov (RTA) | −0.28 (0.08) *** | −0.16 (0.09) ** | −0.28 (0.07) *** | −0.20 (0.07) ** | −0.24 (0.07) ** | −0.15 [−0.16;−0.42] * |
| AIC | 8812.75 | 8256.84 | 11,021.53 | 11,362.30 | 8848.88 | |
| BIC | 8993.18 | 8437.27 | 11,201.96 | 11,532.64 | 9003.88 |
Disclaimer/Publisher’s Note: The statements, opinions and data contained in all publications are solely those of the individual author(s) and contributor(s) and not of MDPI and/or the editor(s). MDPI and/or the editor(s) disclaim responsibility for any injury to people or property resulting from any ideas, methods, instructions or products referred to in the content. |
© 2023 by the authors. Licensee MDPI, Basel, Switzerland. This article is an open access article distributed under the terms and conditions of the Creative Commons Attribution (CC BY) license (https://creativecommons.org/licenses/by/4.0/).
Share and Cite
Dong, G.; Zhang, J.; Tian, L.; Chen, Y.; Zhang, M.; Nan, Z. Structural Properties Evolution and Influencing Factors of Global Virtual Water Scarcity Risk Transfer Network. Energies 2023, 16, 1436. https://doi.org/10.3390/en16031436
Dong G, Zhang J, Tian L, Chen Y, Zhang M, Nan Z. Structural Properties Evolution and Influencing Factors of Global Virtual Water Scarcity Risk Transfer Network. Energies. 2023; 16(3):1436. https://doi.org/10.3390/en16031436
Chicago/Turabian StyleDong, Gaogao, Jing Zhang, Lixin Tian, Yang Chen, Mengxi Zhang, and Ziwei Nan. 2023. "Structural Properties Evolution and Influencing Factors of Global Virtual Water Scarcity Risk Transfer Network" Energies 16, no. 3: 1436. https://doi.org/10.3390/en16031436
APA StyleDong, G., Zhang, J., Tian, L., Chen, Y., Zhang, M., & Nan, Z. (2023). Structural Properties Evolution and Influencing Factors of Global Virtual Water Scarcity Risk Transfer Network. Energies, 16(3), 1436. https://doi.org/10.3390/en16031436


