Article

Optimal Scheduling of Integrated Community Energy Systems Based on Twin Data Considering Equipment Efficiency Correction Models

1
Hubei Collaborative Innovation Center for High-Efficiency Utilization of Solar Energy, Hubei University of Technology, Wuhan 430068, China
2
Guangxi Power Grid Corporation Wuzhou Power Supply Bureau, Wuzhou 543000, China
3
Wuhan Huayuan Electric Power Design Institute, Wuhan 430056, China
*
Author to whom correspondence should be addressed.
Energies 2023, 16(3), 1360; https://doi.org/10.3390/en16031360
Submission received: 15 November 2022 / Revised: 12 December 2022 / Accepted: 24 January 2023 / Published: 28 January 2023
(This article belongs to the Section A: Sustainable Energy)

Abstract

:
The economics of integrated community energy system (ICES) dispatch schemes are influenced by the accuracy of the parameters of the different energy-conversion-equipment models. Traditional equipment efficiency correction models only take into account the historical load factors and variations in the environmental factors, ignoring the fact that the input data do not come from the actual operating data of the equipment, which affects the accuracy of the equipment models and therefore reduces the economics of ICES dispatch solutions. Therefore, this paper proposes an optimal scheduling of a community-integrated energy system based on twin data, considering a device-correction model that combines an energy hub model and a twin data correction model. Firstly, a dynamic energy hub (DEH) model with a correctable conversion efficiency is developed based on the twin data; secondly, a physical model of the system and a digital twin are established, with the prediction data as the input of the digital twin and the twin data as the output. Polynomial regression (PR) and a back propagation neural network (BPNNS) are used to process the twin data to accurately extract the equipment conversion efficiency. Considering the lack of accuracy of traditional prediction methods, a prediction model combining a long- and short-term-memory neural network and digital-twin technology is constructed for renewable energy generation and load prediction. The simulation results show that using twin data to correct the equipment efficiency reduces the average absolute error and average relative error by 4.6706 and 1.18%, respectively, when compared with the use of historical data. Compared with the actual total cost of the dispatch, the total cost of the dispatch after the equipment efficiency correction was reduced by USD 850.19.

1. Introduction

As the penetration of renewable energy increases, the problems of energy waste and high dispatch costs due to uncertainty increase [1]. Integrated community energy systems (ICESs), consisting of electricity, gas, and heating systems, enable the coordination of heterogeneous energy flows and offer significant advantages in terms of energy efficiency, energy supply flexibility, emissions reduction, and improved economics [2]. ICESs can combine multiple energy sources in a certain area and are key to addressing energy losses and improving system performance [3]. Therefore, they have attracted increasing attention in recent years [4].
There are many different types of ICES equipment, and their operating conditions are variable. The efficiency of the equipment varies with different load rates and environmental factors (e.g., temperature and air pressure); therefore, an accurate and reasonable scheduling plan can help to achieve the coordinated operation of multiple equipment [4]. However, actual energy systems are dynamic and nonlinear [5]. Although the models developed can vary with changes in the load factor and environmental factors, such variations are obtained by analysing the historical data alone, and the data sources do not adequately reflect the actual operating conditions of the equipment. Significant challenges remain in terms of the accuracy, computational complexity, and economics of the dispatch models [6,7]. Many researchers have suggested the use of energy-hub (EH) models to manage energy in a unified manner [8]. Additionally, with the development of deep learning techniques, many researchers have worked to develop data-driven, ICES-based, real-time energy scheduling methods by exploiting the nonlinear representation capabilities of deep neural networks [9]. Artificial intelligence techniques, led by deep learning, are gradually being introduced into the field of power-system dispatching decisions. Such methods are typically data-driven, with a large amount of historical, real-world operational data that provide sufficient learning samples [10]. The data-driven dispatching method no longer studies the intrinsic mechanism of the mathematical model of the system components, and it does not consider how to design an efficient and stable optimisation solution method. This avoids the need for complex mathematical modelling and solution tools and offers significant advantages in terms of “de-modelling” technology for solving optimal scheduling problems [11]. As a result, advanced modelling and solutions are needed to meet demand while maximising the use of renewable energy [12]. For example, a data-driven, two-stage, risk-averse stochastic model is proposed in Ref. [12] for an energy-integration system consisting of renewable energy and pumped storage units. This system takes into account the characteristics of the exclusion zone and the dynamic rate of the climbing limits and minimises the total cost of the worst-case distribution in a data-based confidence set built for an unknown distribution. Although in hedging against uncertainty it performs better than the current conventional stochastic or robust planning models, the uncertainty is resolved by assuming that the distribution of the uncertainty source is known in advance, which may not hold if the uncertainty source has an unknown pattern and unknown distribution in the actual environment. The literature [13] proposes a two-stage dispatching method for integrated energy systems based on hybrid and data-driven models, combining a mechanism energy hub model with a data-driven efficiency correction model by first establishing a hybrid-driven dynamic energy hub (DEH) with a variable equipment efficiency, then using a data model combining polynomial regression (PR) and a back propagation neural network (BPNN) to accurately extract an equipment efficiency with nonlinear characteristics (such as the load factor, temperature and air pressure), and finally correcting for the energy conversion rates. Although the algorithm has a high accuracy and fast computational speed in solving a nonlinear equipment efficiency, the training data for the model come from historical data and do not accurately reflect the actual operation of energy-coupled equipment. In the literature [14], a multi-energy system model with a variable energy efficiency is proposed, based on an energy-hub modelling framework in which the variable energy efficiency is obtained using piecewise linearisation and the nonlinear energy conversion and storage relationships in the EH can be further modelled under a linear modelling framework using matrices. A case study showed that the proposed model can balance the nonlinear approximation accuracy and computational efficiency. Reference [15] presents a community-level integrated energy system planning approach that considers different coupling factors. First, a dynamic energy-hub model was developed in which an efficiency correction model was built to identify coupling factors that vary with the load factor and time. Based on this, a two-tier planning model was developed to determine the best planning and operating scenario for an integrated community energy system. Although the method proposed in the literature [14,15] is valid, it does not take into account the effect of environmental factors, such as temperature and air pressure, on the efficiency of the equipment. In general, the above studies only improve the system model from two perspectives: namely, the internal coupling characteristics of energy flows and the analysis of historical data, ignoring the fact that the data input to the system model are not reliable and fail to take into account the errors caused by untimely information updates during the information interaction process, which has certain limitations.
Michael Greaves, from the University of Michigan, introduced the term “digital twin” in 2002 [16]. The most important feature of digital-twin technology is that the virtual model created interacts with the physical entity and the external environment in real time to achieve a full life cycle simulation of the device. The connection process between the virtual model and the physical entity can be achieved through advanced communication technologies (e.g., the Internet of Things and 5G technology). Real-time information on the state and operation of the physical entity can be continuously collected by intelligent collectors and fed back to the virtual model, which receives the information to simulate, optimise, and predict the future state of the physical twin in digital space, while the optimisation information twin data and decision information of the device can be transmitted to the physical entity to control its operational state [17,18]. In the literature [19], in response to the poor coordination between the various energy converters in an IES and the problem of facing multivariate uncertainty, it was proposed to establish a multivector energy system in virtual space using digital-twin technology and deep learning, with the digital-twin technology ensuring real-time interaction information between the physical system and the multivector energy system and using deep learning to obtain real-time information for the learning and training, ultimately reducing the load as well as the historical prediction errors for renewable energy. However, the paper only analysed the economics of the CHP units, electric vehicles, and heat storage tanks, and did not discuss how the integrated energy system activates the energy-coupling devices for dispatch in scenarios where there is a shortage of electric, thermal, and hydrogen loads. In [20], a real-time optimised scheduling strategy for integrated energy systems based on digital twins and dynamic energy-efficiency models is proposed. Considering that the energy-efficiency coefficients of equipment are susceptible to perturbations due to the load rates and environmental factors, a dynamic energy-efficiency model of the equipment was established. A physical model of the system and a digital twin were then separately established to predict the output and load of the new energy units through various twin data such as environment and load. Finally, a test model of the park’s integrated energy system was established to verify the effectiveness of the proposed strategy. Although the dynamic energy-efficiency model can fully reflect the changing characteristics of the unit efficiency with its own load rate or environmental factors and provide a more accurate representation of the model, it is limited to the representation of the equipment model and cannot achieve self-correction of the equipment efficiency.
Therefore, this paper proposes an optimal scheduling strategy for community-integrated energy systems which is based on twin data and considers the equipment efficiency correction model. The advantages of this paper are as follows:
(1)
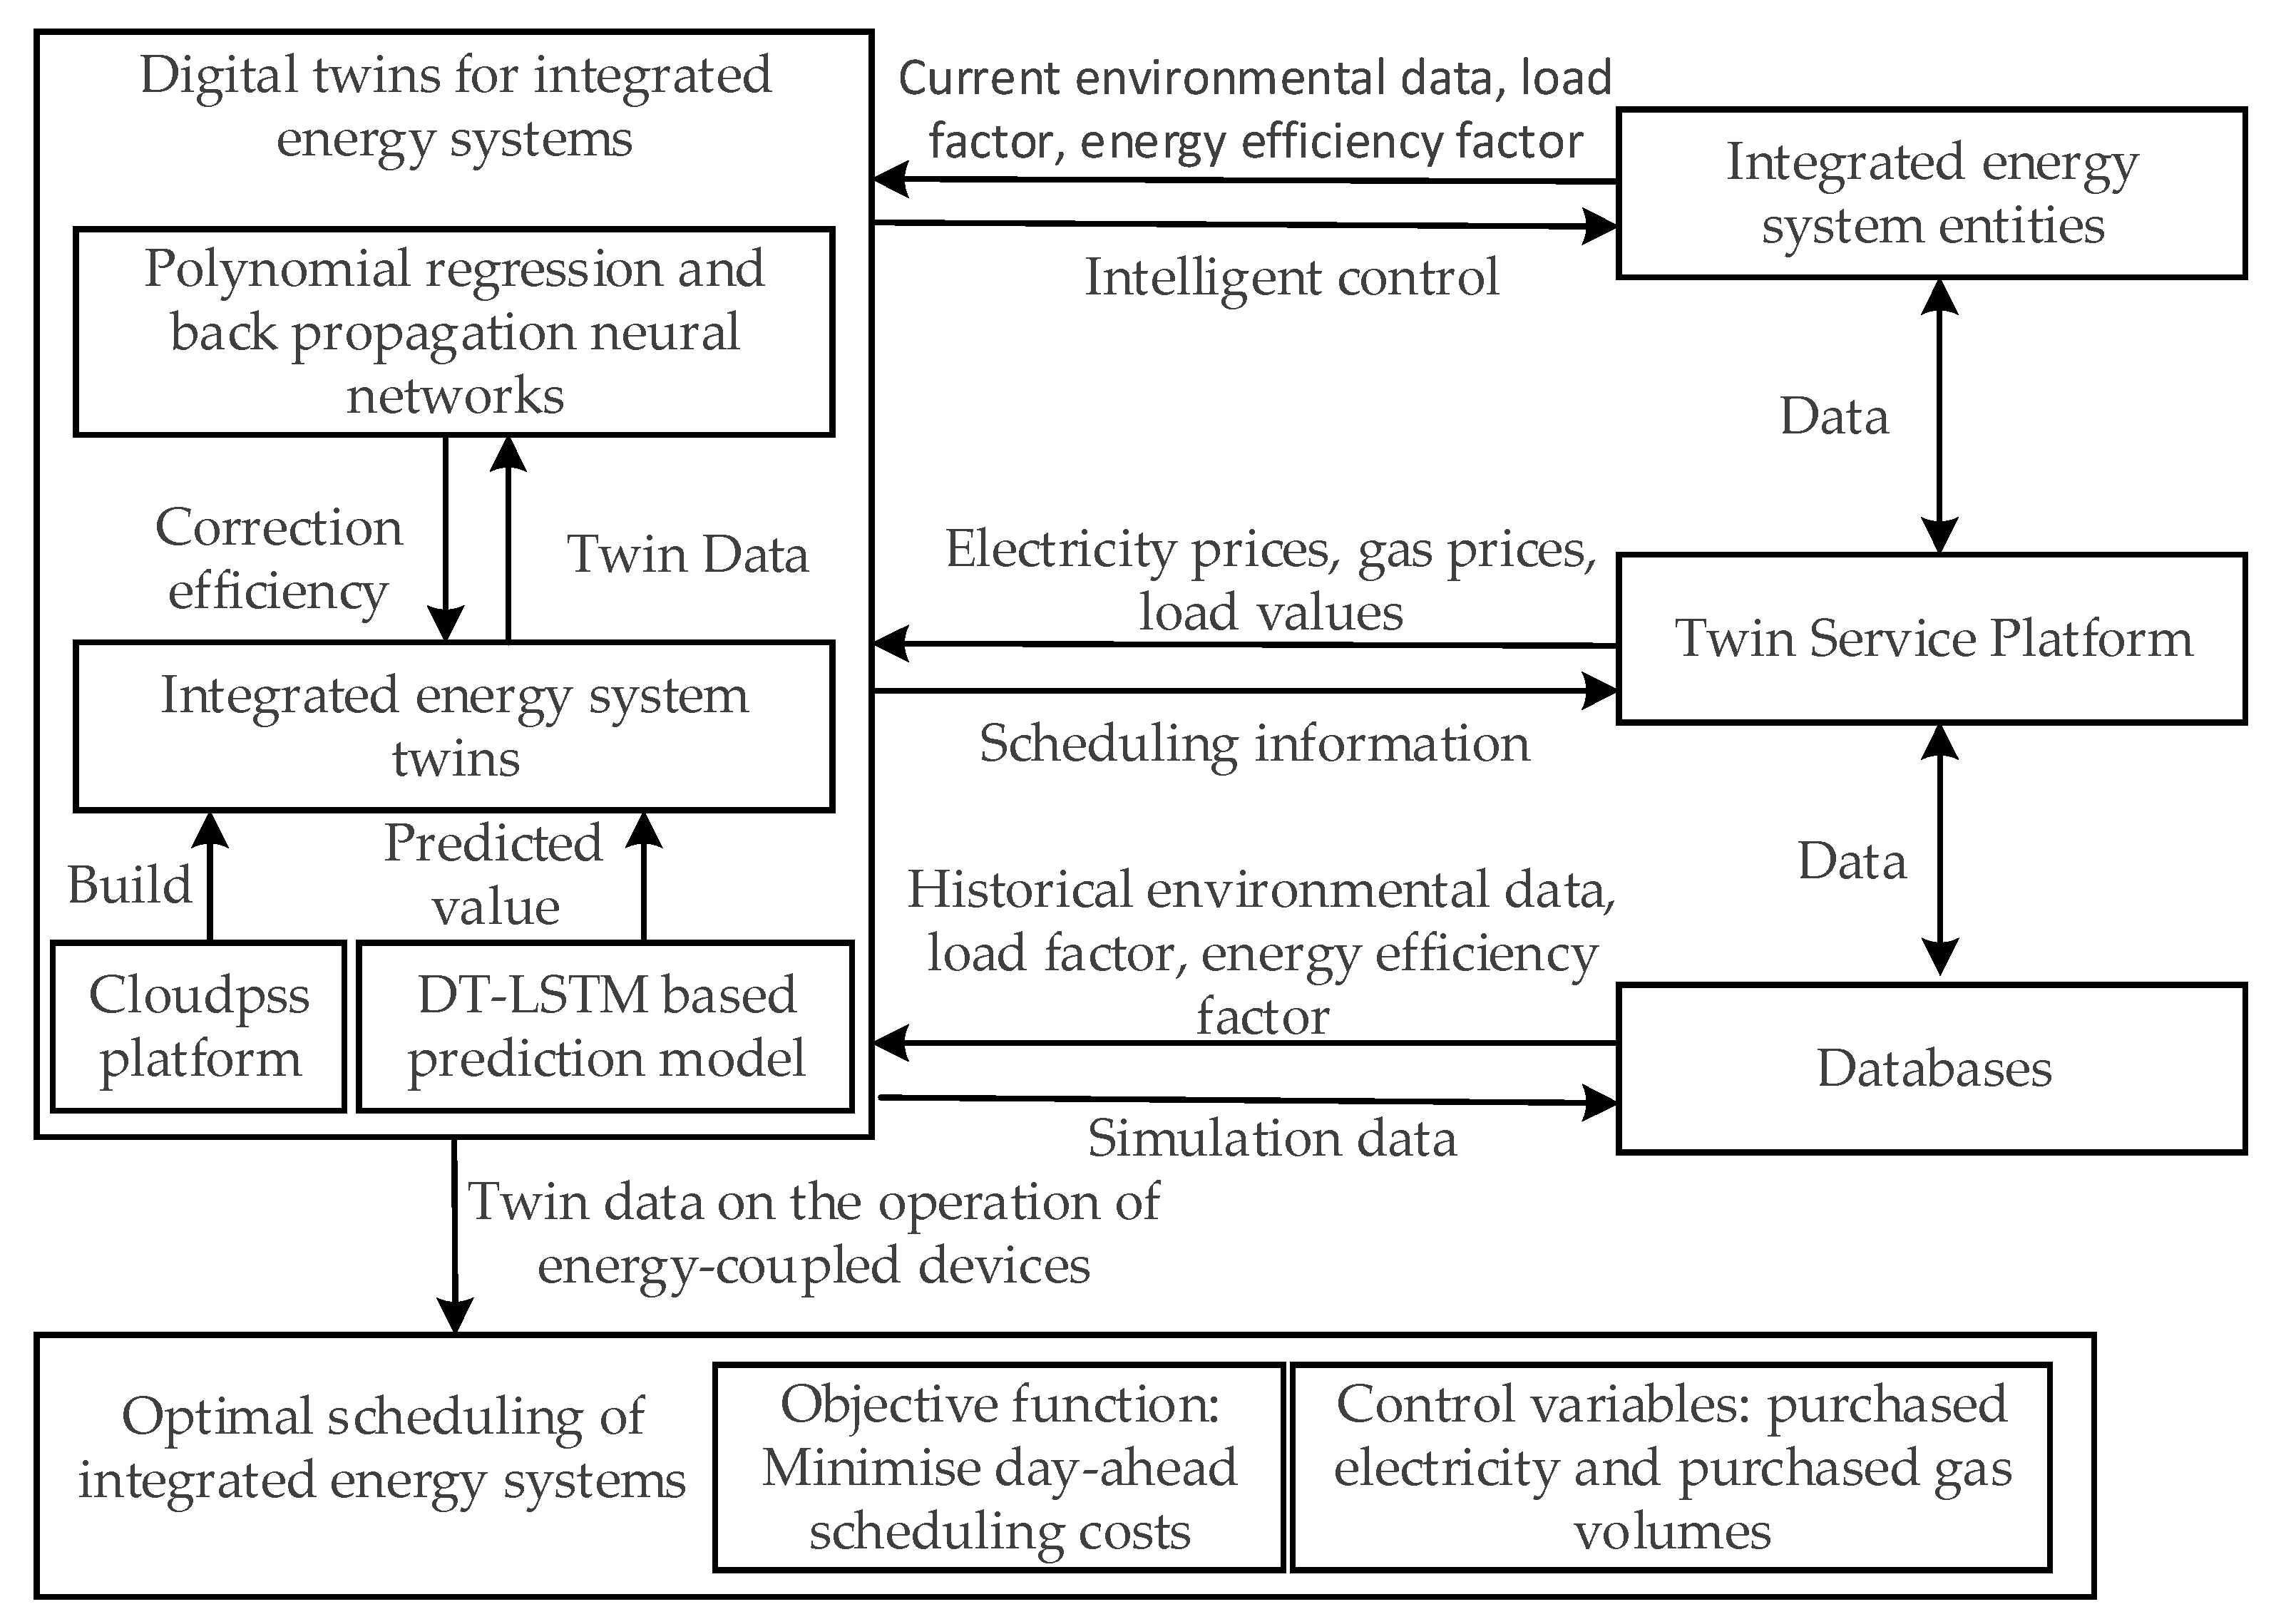
The built visual model, based on Cloudpss, combines a large amount of historical data and mathematical models and forms a digital twin that can simulate the optimal output of the units under different working conditions of the physical system. The twin data are fed back to the physical equipment in real time to adjust the output of each physical equipment. Second, the LSTM prediction model that is based on the digital twin can achieve the ultra-short-term accurate prediction of the output and load of the new energy units based on real-time data and historical data;
(2)
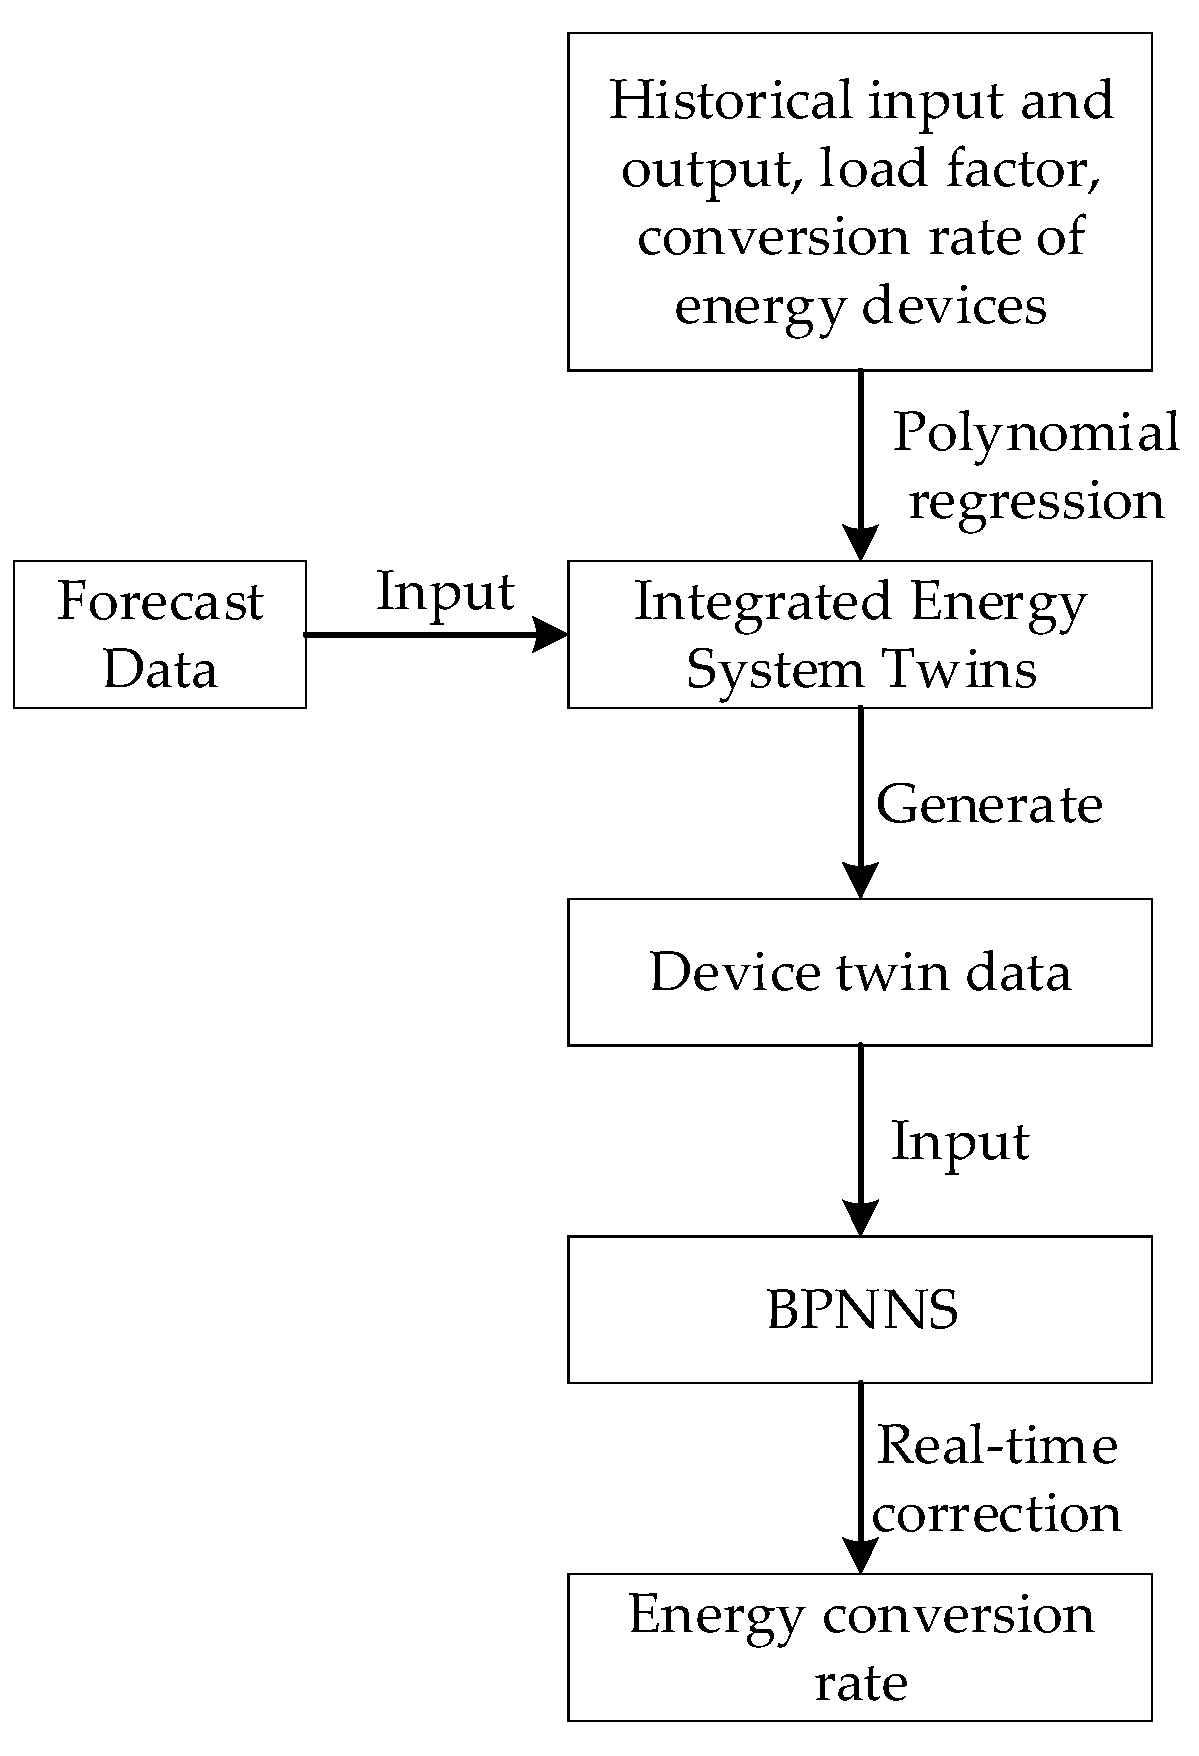
The twin data are processed using polynomial regression and back propagation neural networks to extract the characteristics of the equipment conversion efficiency in relation to the load factor and environmental factors and, finally, correct the equipment conversion rate to minimise the dispatching cost. The twin-based efficiency correction is more reflective of the actual operating conditions of ICESs than using historical equipment data to correct efficiency, and avoids the waste of electricity, heat, and hydrogen.

2. Digital-Twin Technology

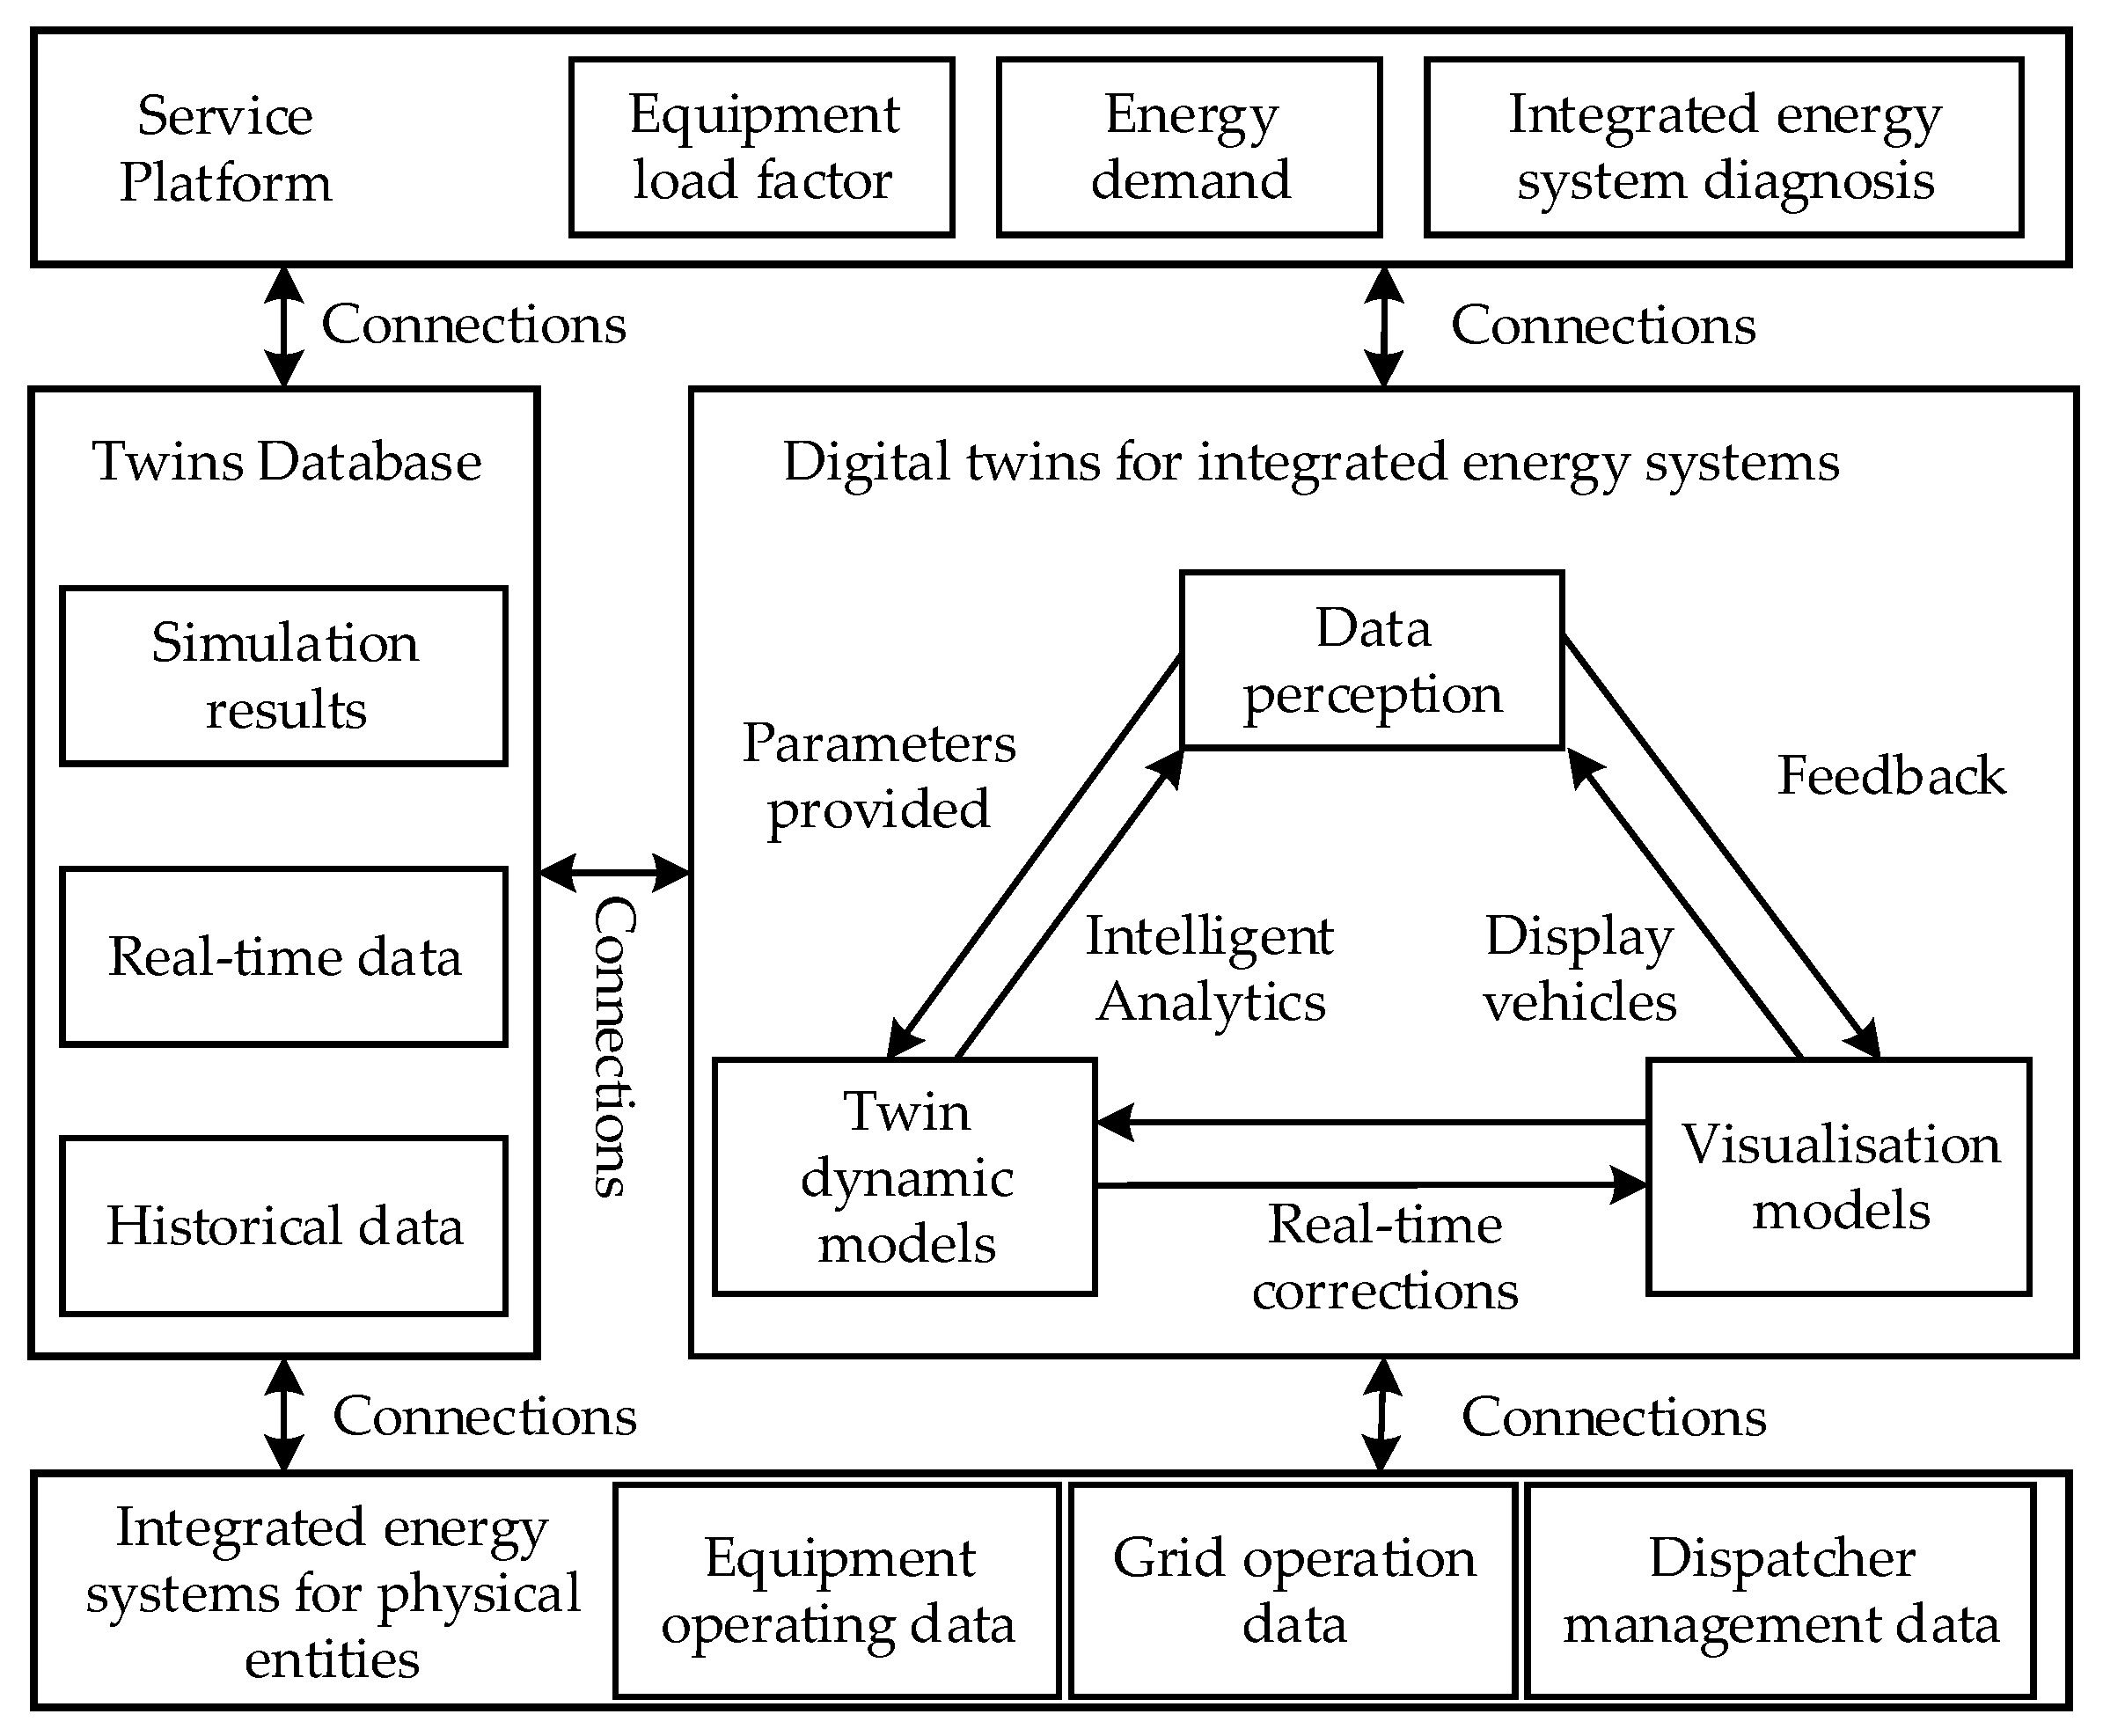
Digital-Twin Technology Framework

Digital-twin technology is the use of digital technology to virtualise the entity model, component state behaviour, and component interconnection relationship in the physical world as a whole. After transmitting information through digital communication, it creates a high-fidelity, visualised twin model, while the twin relies on real data from the physical entity to develop real-time parameters, boundary conditions, and future model evolution laws, providing a more representative response to the full life-cycle changes of the physical entity. As is shown in Figure 1, in the digital twin five-dimensional model, the digital twin system consists of a five-dimensional model of the physical entities, digital twins, digital twin databases, data connections, and services, U D T [21]:
U DT = ( PE , VM , DD , CN , SS )
where PE is the physical entity; VM is the digital twin; DD is the digital twin database; CN is the data connection; and SS is the service.
The roles of the five modules are described below:
(1)
The physical entity module mainly contains components such as the installed capacity of the integrated energy system devices, energy-coupling devices, energy storage devices, and load types, which is the information source for the simulated operation of the digital twin, provides real-time data for the digital twin, and can receive feedback information from the digital twin and the service modules [22];
(2)
The digital twin module is a real-time mapping of the physical entities and consists of a combination of a visualisation model and a dynamic twin model that constantly iterates on itself to correct the twin parameters based on real-time data from the physical entities. As a result, it more accurately reproduces the operation of the physical equipment in a real environment and provides a better scheduling solution for the energy system;
(3)
The digital twin database module is the key driver of the twin. A part of the data is generated by the virtual simulation, reflecting the simulation results; another part of the data is obtained from the service module for service invocation and execution; and the rest of the data are provided by experts in the field with professional standard data from the twin;
(4)
The data connection module is the data transmission layer, which uses switches and an ethernet as the core to build a wireless-network transmission system to realise the efficient transmission of meteorological data, equipment operation data, etc. A combination of distributed local storage and centralised cloud storage is used to store data comprehensively, which can realise the dynamic response and mutual call of data according to the system’s requirements. Through the IoT perception and the ubiquitous network, new elements, trends, and problems in the physical world are dynamically tracked by the virtual power grid, and the virtual-power-grid revision model keeps time and space consistent [23];
(5)
The service module includes the application services considering the load-side demand response and power system monitoring, transmission-line diagnosis, forecasting, and health management to ensure the safe operation of the integrated energy system.
In this paper, the Cloudpss platform, developed in China, was used as a tool in order to describe the geometry of the infrastructure of an integrated community energy system and to visualise the energy delivery. The specific framework is shown in Figure 2 as the architecture of the integrated community energy system based on the digital twin. First, a visualisation model based on the equipment model and the initialisation parameters of the integrated energy system was built on the platform, and 5G communication technology was used to connect the entity digital twin database and service platform to each other for data transmission. Then, the power and load of the renewable energy generation was calculated based on the DT-LSTM prediction model. Second, an energy coupling equipment twin was built, including CHP. The database transmitted to the twin different load rates, temperatures, and air pressures of the equipment at different times, simulated the operation of the ICES in a real environment, output the twin data (e.g., twin load rates, twin energy inputs, etc.) of the equipment, and combined polynomial regression with a back propagation neural network. Finally, with the objective of minimising the total cost of the system day-ahead dispatch and using the conditions to be met by each ICES unit and the energy network as constraints, the ICES day-ahead dispatch was optimised and the effectiveness of the proposed strategy was verified.

3. Equipment Efficiency Correction Modelling

The ICES requires real-time tracking of all basic energy-coupling devices, energy storage devices, and electric, thermal, and hydrogen loads to accommodate the intermittent power generation from renewable energy sources such as wind and solar. The integrated energy system twin consists of multisource data streams and energy flows. It uses 5G communication technology to interact with data in real time between the physical integrated energy system, the twin energy service platform, and the twin database in order to transmit real-time electric, thermal, and hydrogen load values and make real-time corrections to the conversion efficiency of the twin energy coupling equipment to reduce operating costs. As is shown in the framework of the integrated energy twin in Figure 3, the integrated energy system equipment includes transformers (TF), gas boilers (B), combined heat and power (CHP), steam methane reforming (SMR), and electrolysis tanks (WC). The energy storage includes batteries (ba), heat storage tanks (tes), and hydrogen storage tanks (hy). The load types include hydrogen loads, electrical loads, and thermal loads.

3.1. DEH Efficiency Correction Model Based on Twin Data

In the literature [24,25], a classical energy-hub model to construct the coupling relationship between the energy input port and output port power is proposed to establish the coupling matrix C to describe the variation in the relationship between the input and output of a multi-energy system, as is shown in the following equation:
[ P α o u t P β o u t   P ω o u t ] P o u t = [ c α α c β α c ω α c α β c β β c ω β c α ω c β ω c ω ω ] C [ P α i n P β i n   P ω i n ] p i n + [ s o α α s o β α s o ω α s o α β s o β β s o ω β s o α ω s o β ω s o ω ω ] S O [ m α m β   m ω ] M
where Pin and Pout represent the energy input and output power, respectively; the subscripts α , β , , ω are the elements in the energy form ensemble Θ , such as the electrical energy, thermal energy and hydrogen energy, respectively; SO is the attribution coefficient matrix of the energy storage in the energy storage device; and M is the actual energy charging and discharging vector of the energy storage device. The coupling factors cαα, cαβ, etc., in the coupling matrix C can be obtained from the following equation:
c α β = κ α β λ α β
where κ α β is the energy distribution coefficient, indicating the conversion ratio of equipment input energy α to output power β; λ α β is the energy conversion efficiency, characterizing the overall efficiency of equipment input energy α to output power β, which cannot be determined because it is affected by the rated capacity of the energy supply equipment and the operating conditions of different load rates.
s o α = ξ α γ
where ξ α is the charging and discharging efficiency of the energy storage device. When γ takes the value 1, the energy storage device is in the charging state, and when it takes the value −1, it is in the discharging state.
Traditional integrated energy models simplify the relationship between the input and output of energy-coupled equipment as a function of a linear model. In reality, however, the energy conversion factor changes as the load rate changes. Therefore, the twin energy service platform can be used to obtain historical data such as the electricity, heat, and hydrogen load history and the historical energy conversion efficiency of the CHP, gas boilers, electrolytic cells, and other equipment. The historical data are run in the integrated-energy-system visualisation model, and the operating parameters of the units at different times of operation are set to obtain the twin energy load factor, such as
λ α β = D t w i n ( d C H P l o a d , d G B l o a d , d E Z l o a d , d S M R l o a d )
where d C H P l , d B l , d W C l and d S M R l are the historical load factors of the CHP, gas boiler, electrolyser, and steam methane reforming coupling equipment, respectively, as input data to the integrated-energy-system visualisation model Dtwin, with the twin data as the output. The exact process of obtaining the equipment-correction conversion efficiency, λ, is explained in Section 3.2.
The twin dynamic equation is shown below. For different types of energy-coupled devices, the load factor and efficiency function relationship are mainly obtained by fitting the device twin polynomial for the energy-conversion-efficiency model of the device twin.
[ P α o u t P β o u t   P ω o u t ] P o u t = [ c α α ( D α α t w i n ) c β α ( D β α t w i n ) c ω α ( D ω α t w i n ) c α β ( D α β t w i n ) c β β ( D β β t w i n ) c ω β ( D ω β t w i n ) c α ω ( D α ω t w i n ) c β ω ( D β ω t w i n ) c ω ω ( D ω ω t w i n ) ] C [ P α i n P β i n   P ω i n ] p i n + [ s o α α s o β α s o ω α s o α β s o β β s o ω β s o α ω s o β ω s o ω ω ] S O [ m α m β   m ω ] M
1.
Cogeneration equipment twin
The compressed gas is mixed with natural gas in the combustion chamber to produce high-temperature, high-pressure flue gas, which drives the turbine to do work to generate electricity [26]. The efficiency of the power generation is mainly affected by the load factor and ambient temperature [27,28], and the efficiency of the heat supply is mainly affected by the load factor and the compression ratio of the gas turbine. The equations are shown below:
λ C H P e l e Q g a s C H P l C H 4 m = P t C e l e
P t C e l e λ 1 = P t C h o t
where λ C H P e l e is the conversion efficiency of gas to electricity; λ 1 is the thermoelectric ratio, taken as 3.134; Q g a s C H P is the amount of natural gas input to the device; l C H 4 is the low heating value of natural gas combustion, taken as 8.56 kW·h/m3; m is the conversion value of heat and power, taken as 3.13; and P t C e l e and P t C h o t are the power of the device to generate electricity and heat at time t, respectively.
The generation efficiency of the gas turbine is nonlinearly related to the electrical load efficiency [26], and the relationship between the efficiency and load factor is fitted through the cogeneration twin as follows:
λ C H P e l e = n = 0 5 ( μ C H P n d C H P l o a d )
λ 1 = n = 0 3 ( μ 1 n d C H P l o a d )
where n is the fitting order; μ C H P n is the fitting coefficient of the nth-order CHP twin; μ 1 n is the fitting coefficient of the CHP unit’s thermoelectric ratio; and d C H P l o a d is the electrical load factor of the CHP, which reflects the ratio of the CHP output electrical power to the current capacity.
2.
Gas boiler twin
It is generally recognised (e.g., CIBSE 2004) that the boiler performance shows a plateau of near-peak efficiency down to approximately 25% of part of the load and then decays rapidly as the load decreases further. This means that boilers operating for long periods at low loads may operate at poor efficiency [29]. The energy-conversion characteristics of gas boilers are
λ G B h o t Q g a s G B l C H 4 m = P t B h o t
where λ G B h o t is the boiler’s energy conversion efficiency; P t B h o t is the heat power of the gas boiler at time t; and Q g a s G B is the amount of natural gas input to the device.
λ G B h o t = n = 0 2 ( μ G B n d G B l o a d )
where μ G B n is the nth-order fitting coefficient of the gas boiler twin and d G B l o a d is the heat loading rate of the gas boiler.
3.
Electrolysis tank twin
The electrolysis tank purchases power from the grid to reach the hydrogen production demand with the following equation:
P t d h y = P e l e d λ E Z h y H h
where H h is the calorific value of hydrogen; P t d h y is the hydrogen production power of the electrolysis tank at time t; λ E Z h y is the hydrogen production efficiency; and P e l e d is the purchasing power from the grid.
λ E Z h y = n = 0 2 ( μ E Z n d E Z l o a d )
here, μ E Z n is the nth-order fitting coefficient of the electrolysis tank twin and d E Z l o a d is the hydrogen loading rate of the electrolysis tank.
4.
Steam methane reforming twins
The SMR process is a conventional and economical method of producing hydrogen by reacting steam and methane under high-temperature catalysis. The reforming reaction in the SMR process is a strong heat-absorption reaction, in which the details of hydrogen production are omitted and additional methane needs to be burned in the combustion chamber to heat it up. The combustion of methane not only results in significant heat loss but also leads to additional CO2 emissions [30]. The expressions are as follows:
λ S M R h y Q g a s S M R = P t S h y
where λ S M R h y is the hydrogen production efficiency of the SMR plant; Q g a s S M R is the amount of natural gas input to the plant; and P t S h y is the hydrogen production output of the SMR plant at time t;
λ S M R h y = n = 0 3 ( μ S M R n d S M R l o a d )
where μ S M R n is the nth-order fitting coefficient of the SMR twin and d S M R l o a d is the thermal loading rate of the SMR.
5.
Energy storage device twin
6.
Energy storage device twins are used in order to compensate for the intermittence and fluctuation of renewable energy units such as photovoltaic generation and wind turbines and to bring their advantage into play. Energy storage devices are devices in the system that undertake the task of peaking (storing energy when energy prices and loads are low and releasing energy when they are conversely high), relieving the pressure on the equipment supply and achieving operational flexibility of the system. In this paper, a generic model of energy storage was used to model the energy storage twin, as follows:
F i , t c n , s o c = F i , t 1 c n , s o c + ( P i , t c n , c h a r ξ c n S r a t e d c n P i , t c n , d i s ξ c n 1 S r a t e d c n ) M t c n Δ t
where F i , t c n , s o c F i , t 1 c n , s o c are the energy storage state of the ith energy storage twin at moments t and t−1, respectively; ξ c n γ is the charging and discharging efficiency; P i , t c n , c h a r and P i , t c n , d i s are the charging and discharging power of the ith twin at moment t, respectively; S r a t e d c n is the rated capacity of the energy storage twin; M t c n is the actual charging and discharging power of the twin after the loss of the charging and discharging efficiency at moment t; Δt is the scheduling time difference, with a step of 1 h; and cn is the type of energy storage equipment.

3.2. Energy Conversion Rate Correction Strategy Based on Twin Data

To address the uncertainty of the equipment efficiency and load rate, this paper proposed an energy-conversion-rate correction model based on twin data. Firstly, a large amount of equipment historical load rate and conversion rate data were pre-processed and input into the ICES twin to simulate the operation, using polynomial regression to initially obtain the relationship between the conversion rate and the load rate of the CHP units, electrolytic cells, SMRs, and gas boilers. Secondly, the predicted data for wind, photovoltaic, thermal, and hydrogen loads were fed into the integrated energy twin to obtain the twin data for the energy-coupled equipment, such as the natural gas input, thermal (electric) power output, and the gas-to-electric (thermal) efficiency for the CHP units. However, because the actual equipment operating conditions need to consider the influence of environmental factors, such as temperature and air pressure, on the equipment efficiency, this paper used a back propagation neural network to correct the energy-conversion-rate operation, as is shown in the following figure. The network consisted of three layers: an input layer, output layer, and hidden layer, in which the twin load rate of the equipment, D t w i n ( d t l o a d ) ; twin input energy data, D t w i n ( P t i n ) ; temperature, T e m p ; and air pressure, P r e s , were input, and the output was based on the twin data. The output was a modified energy-conversion rate based on the twin data, and the activation function was a tanh function. Since energy storage devices are subject to seasonal factors and have a small and negligible impact on the day-ahead dispatch of the ICES, the energy-efficiency changes in energy storage were not considered in this paper. Figure 4 is a flow chart of the device efficiency correction based on the twin data, and Figure 5 is a schematic diagram of a back propagation neural network.

4. ICES Day-Ahead Scheduling Model

Based on the twin dynamic model of energy-coupled devices established above, the energy conversion coefficients were updated using this model. For simplicity, this paper focused on the economic optimality of the day-ahead dispatch, with the objective function of minimizing the cost of purchased electricity, Costele, and the natural gas cost, Costgas, of the twin energy service platform within 24 h, as follows:
min   C o s t a l l = C o s t e l e + C o s t g a s = t T ( κ e l e , t P e l e , t ) Δ t + t T ( κ g a s , t Q g a s , t ) Δ t
where κ e l e , t and κ g a s , t are the unit price of the purchased electricity and the natural gas volume in time t, respectively; P e l e , t is the purchased electricity power in time t; Q g a s , t is the purchased natural gas volume in time t; T is the total dispatch time, taken as 24 h; and Δ t is the dispatch interval, taken as 1 h.

4.1. Binding Conditions

The integrated energy system twin should provide sufficient energy to the electric load, L o a d t e l e , at each dispatch time, as is shown by the following constraint:
v t C H P P t C e l e + i N w t T P i , t w + i N p v t T P i , t p v + i N b a t T P i , t B A , d i s = L o a d t e l e
where v t C H P is the scheduling factor of the cogeneration unit; P i , t w and P i , t p v are the power generation of the ith wind turbine and photovoltaic generator at time t, respectively; P i , t B A , d i s is the discharge power of the ith battery at time t; and N w , N p v , and N B A are the numbers of wind turbines, photovoltaic units, and batteries, respectively.
Similarly, the integrated energy system twin should provide sufficient energy to the thermal load, L o a d t h o t , at each dispatch time, as is shown by the following constraint:
v t C H P P t C h o t + v t B P t B h o t + i N t e s t T P i , t H S T , d i s = L o a d t h o t
where v t B is the scheduling factor of the gas boiler; P i , t H S T , d i s is the exothermic power of the ith heat storage tank at time t; and N H S T is the number of heat storage tanks.
The hydrogen loading twin constraint is
v t S M R P t S h y + v t W C P t d h y + i N h y t T P i , t H Y , d i s = L o a d t h y
where L o a d t h y is the hydrogen load; v t S M R and v t W C are the scheduling factors of the steam methane reforming unit and the electrolysis tank, respectively; P i , t H Y , d i s is the hydrogen release power of the ith tank at time t; and N H Y is the number of hydrogen storage tanks.
The twin coupling device constraints are
{ 0 Q t g a s Q g a s , max 0 P t w P t w , max 0 P t p v P t p v , max 0 P t C e l e P t C e l e , max 0 P t C h o t P t C h o t , max 0 P t B h o t P t B h o t , max 0 P t d h y P t d h y , max 0 P t S h y P t S h y max
where the scheduling process should satisfy the corresponding minimum and maximum energy constraints in each scheduling period; Q g a s , max , P i , t w , max , P i , t p v , max , P t C e l e , max , P t B h o t , max , P t d h y , max , and P t S h y , max are the maximum natural gas volumes, maximum output of the wind turbines and photovoltaic power sources, and the maximum operating power of cogeneration, gas-fired boilers, electrolytic cells, and steam methane reformers, respectively.
To ensure that the integrated energy system twin can flexibly regulate the energy conversion as well as the stable operation by adding electricity, hydrogen, and heat storage devices, the constraints of the generic energy-storage model are
{ 0 P i , t c n , d i s P i , t c n , d i s , max 0 P i , t c n , c h a r P i , t c n , c h a r , max F i , t c n , s o c , min F i , t c n , s o c F i , t c n , s o c , max
where F i , t c n , s o c , min and F i , t c n , s o c , max are the minimum and maximum charge states of the energy storage device, respectively; and P i , t c n , c h a r , max and P i , t c n , d i s , max are the maximum charge and discharge powers of the ith energy storage device at time t, respectively.

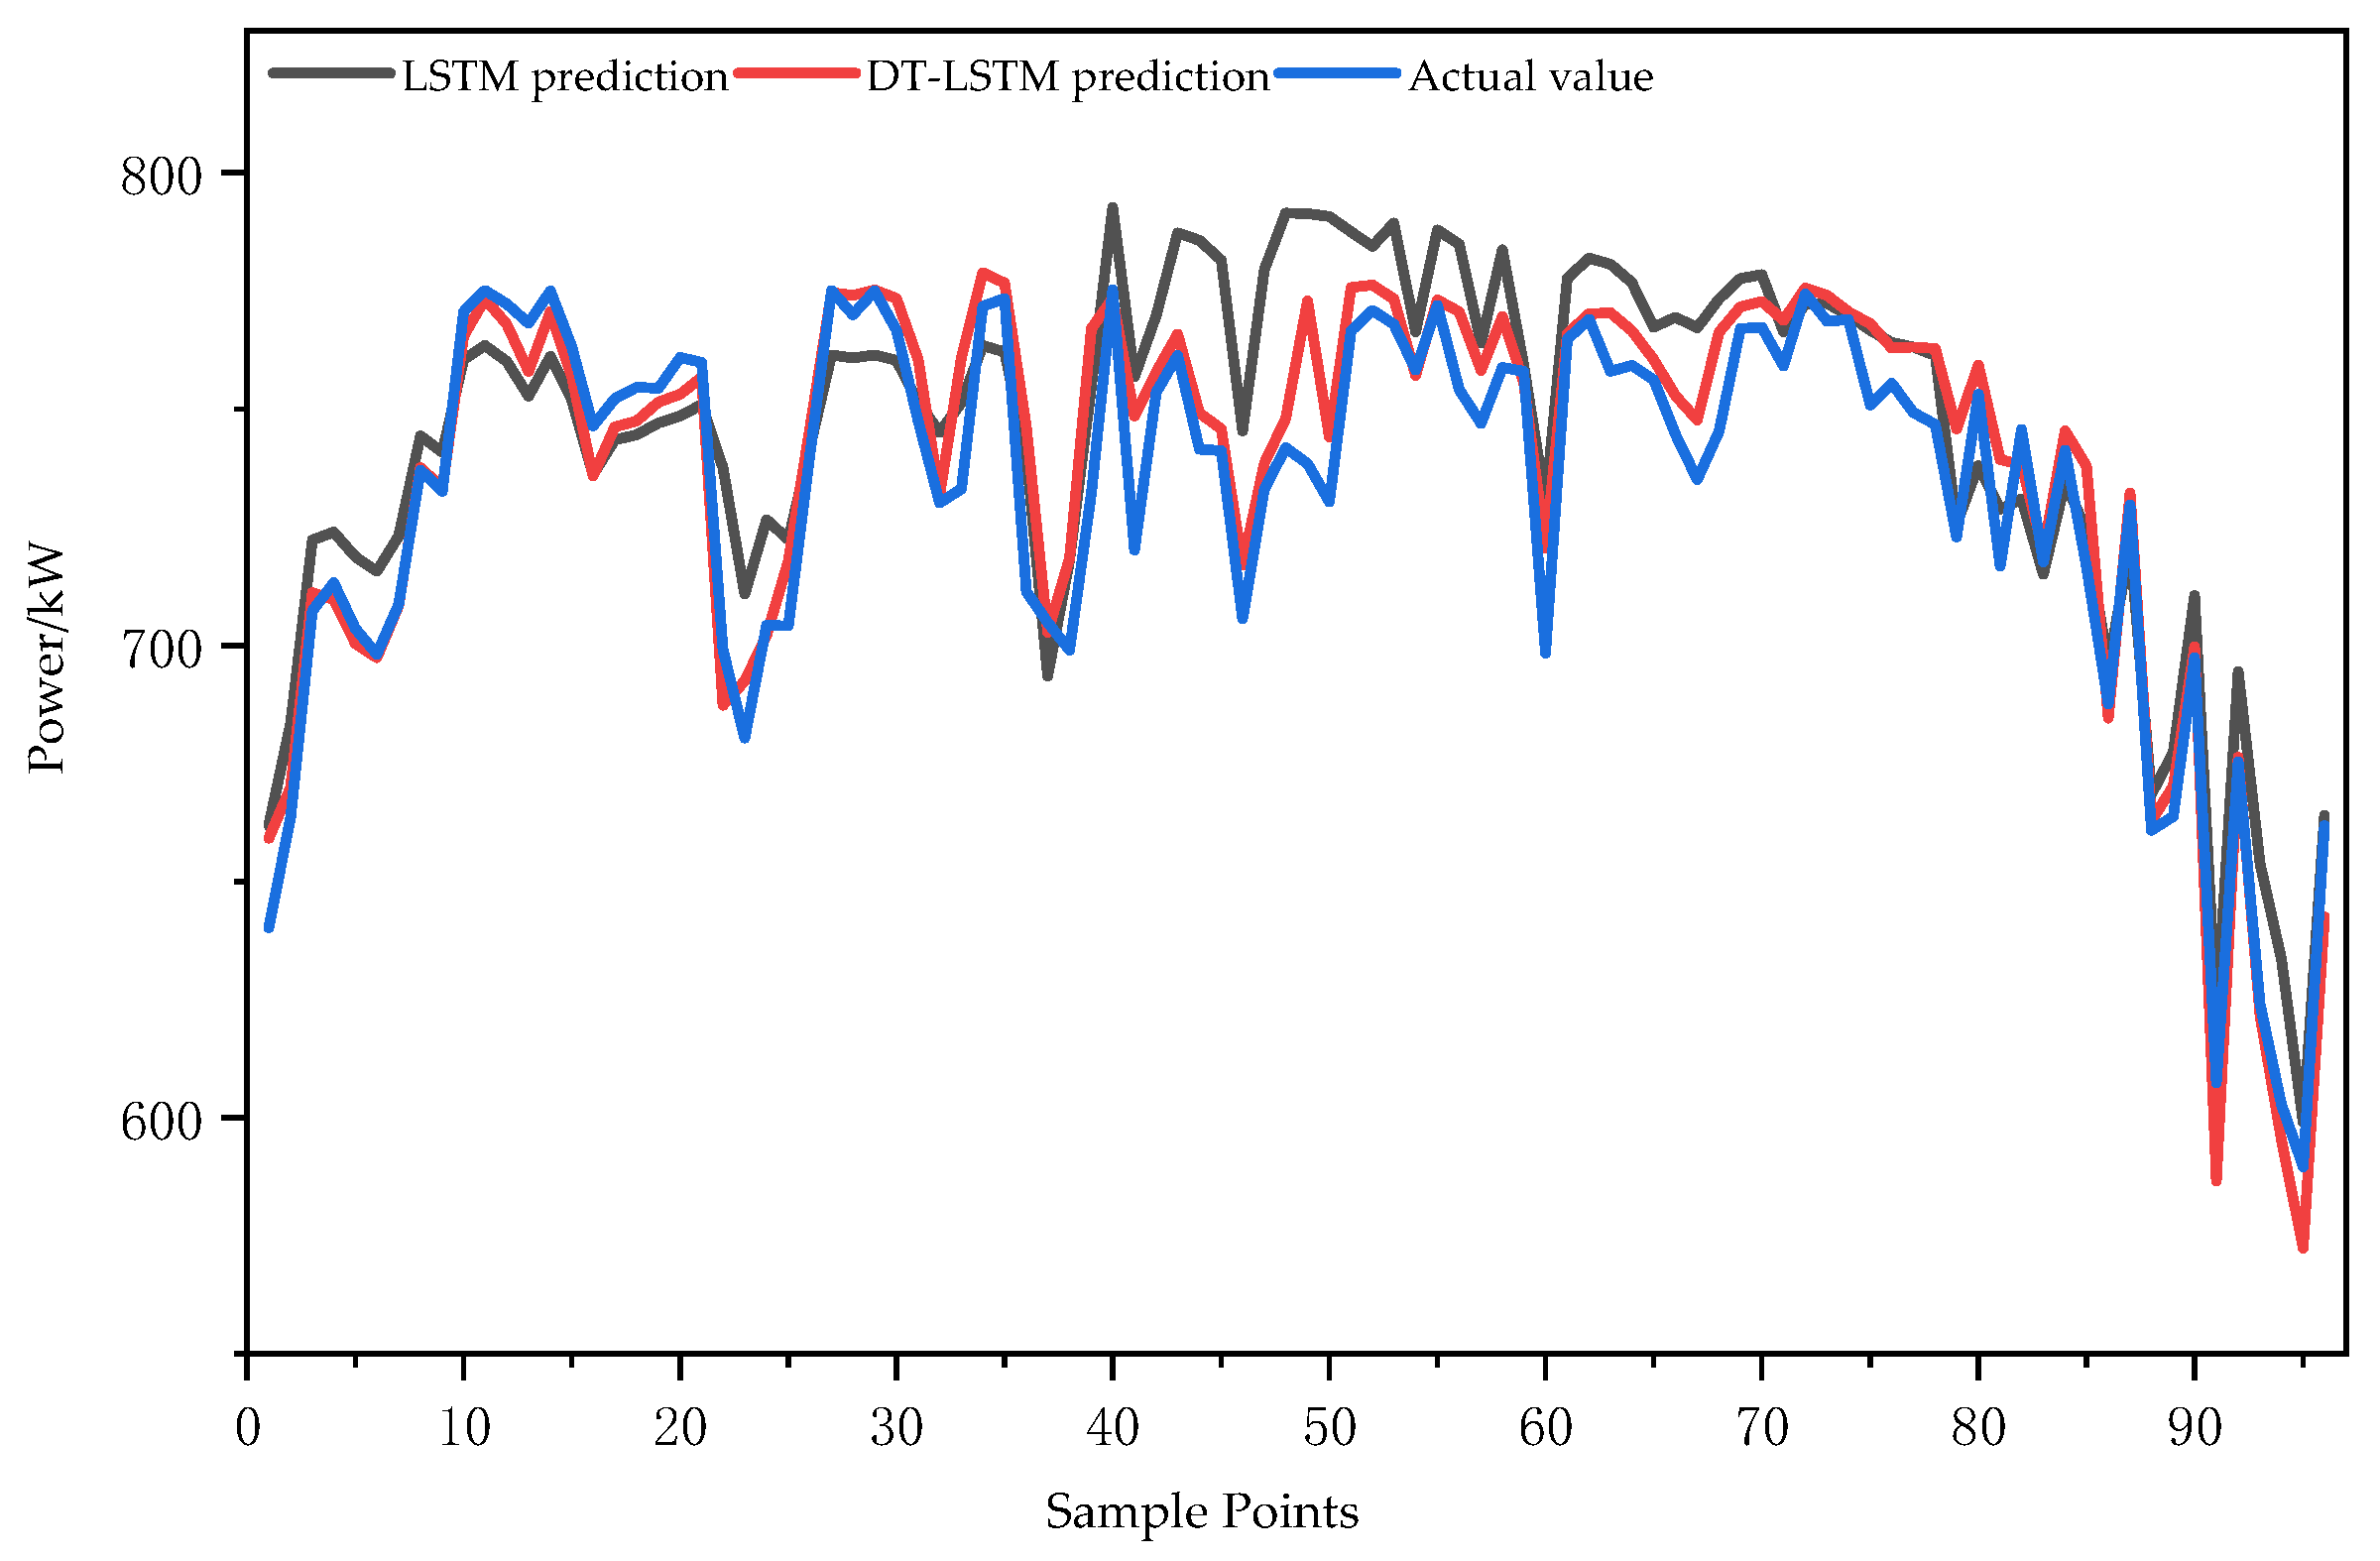
4.2. DT-LSTM-Based Ultra-Short-Term Prediction Model

In order to improve the reliability of the optimal scheduling, this paper used real-time, data-driven LSTM to achieve the ultra-short-term forecasting of the renewable energy generation and the electric, thermal, and hydrogen loads. Taking the wind turbine and photovoltaic power plant unit outputs as an example, firstly, the LSTM was used to initially predict the renewable energy output value, and the input layer was the historical data of the renewable energy unit output. The output layer was the ultra-short-term forecast value of the renewable energy units’ output on the scheduling day. The forgetting gate, input gate, and output gate of the LSTM are calculated as shown below:
{ f ( t ) = σ ( W f [ h ( t 1 ) , x ( t ) ] + b f ) i ( t ) = σ ( W i [ h ( t 1 ) , x ( t ) ] + b i ) o ( t ) = tanh ( W o [ h ( t 1 ) , x ( t ) ] + b o )
where σ and tanh are the sigmoid activation function and tanh activation function, respectively; f ( t ) represent the forgetting probabilities; h represent the hidden layer states; x represent the input matrices; and w and b are the gate weights and bias matrices, respectively.
The cell state change process is as follows:
C ( t ) = C ( t 1 ) f ( t ) + i ( t ) o ( t )
where C is the cell state and ⊙ is the Hadamard product.
Secondly, for the problem of a low LSTM prediction accuracy, this paper adopted the similar-day meteorological search algorithm to compensate the preliminary predicted values. The similarity between the meteorological data, such as the radiation angle, temperature, and windiness, collected by the dispatchers at time t, and the historical database data was calculated. The operating day with the greatest similarity to a similar day to a typical day was taken, and the similarity took the residual sum of the squares to calculate.
I = 1 n = 1 N ( y n y n ) 2 n = 1 N ( y n ) 2
here, y n and y are the values of the real-time data on a typical day and the historical data on a similar day, respectively; N is the set of samples; and I is the degree of similarity.
Finally, the twin dataset vector and objective function were established, and the final prediction value was obtained by taking the weighted prediction error for the correction according to the actual and predicted values of the renewable energy generation or load on similar days, with the weighting factor determined by the similarity. The process is shown as follows:
{ min R = { H , γ 1 , γ 2 , , γ i } = i = 1 n j = 1 n ( ϖ i d i j ) ϖ i = I i / u = 1 n I u P = R R ( P r e a P r ) + P p r e
where H is the meteorological dataset; { γ 1 , γ 2 , , γ i } is the twin dataset; ϖ i is the weighting factor; d i j is the Euclidean distance; R is the correction amount; P r e a and P r are the actual and predicted values of the scenery unit generation on similar days, respectively; an P and P p r e are the final predicted values based on the DT-LSTM and the predicted value before correction, respectively.

5. Results

5.1. Parameter Setting

This paper used digital twin long-term and short-term memory networks to forecast the ultra-short-term prediction of the new energy turbine output load. Taking the wind power prediction results as an example: in the wind power prediction, the initial wind power output of 96 sample points on the prediction day was obtained based on the LSTM, using the wind power output values at time t of 5000 historical scenarios. Meteorological data which affect the output on the prediction day, such as wind speed, temperature, wind direction and barometric pressure, were then input. Finally, the actual wind-turbine output on the similar day was used to compensate for the initial forecast value on the forecast day. As can be seen from the comparison of the predictions based on the digital twin in Figure 6, the two prediction model curves were generally consistent with the actual values. However, the error was reduced when the LSTM predictions were compensated for using the similar day weather search algorithm. Therefore, the LSTM prediction model using digital-twin technology can effectively improve the prediction accuracy and the accuracy of the data based on the real-time information collected by smart sensors.
This paper used the Cloudpss platform to build a visualisation module for the ICES twins and, following data analysis and fusion processing, to accurately simulate the operation of the physical devices in a real environment. The weather data and daily load data of a southern region were obtained through the twin data centre, and the power generated by the wind turbines and photovoltaic units as well as the electric, thermal, and hydrogen loads were collected every 15 min, as is shown in Figure 7 below. This demonstrates that the DT-based LSTM forecasts of the renewable energy and load were more closely matched to the actual values.
From Figure 5, it can be concluded that the main power output of the PV units was from 6:00 to 19:00, in which the range of PV power generation was 537.13–831.19 kW from 12:00 to 16:00. The wind turbine power output throughout the day reached a maximum power of 772.8 kW. The peak electric load was concentrated at 11:00–12:00 and 17:00–20:00, and the maximum power of the electrical load could reach 2143.98 kW. The peak period of hydrogen use was concentrated in the period of 13:00–15:00, with a maximum power of 2392.74 kW; the peak period of the heat load was 14:00–15:00, during which the maximum power of this load reached 2150.41 kW.
As is shown by the energy-coupling equipment twin parameters in Table 1, the CHP twin and the gas boiler twin each had a rated capacity of 220 kW, the electrolysis tank twin had a rated capacity of 170 kW, and the SMR twin had a rated capacity of 200 kW.
The visualisation model built by the Cloudpss platform was input according to the above equipment parameters and is shown in Figure 8 for the integrated-energy-system twin visualisation model.
The time-of-use electricity and gas prices were obtained from the twin energy services platform, as is shown in Table 2. According to the types of different energy-coupled devices, 600 historical energy conversion rate and load rate data for the CHP, SMR, WC, and GB were selected as the input for the ICES twin, and the preliminary conversion rate and load-rate correlations were obtained through polynomial regression fitting. Secondly, the above DT-LSTM prediction data were input into the digital twin to simulate the operating conditions of the devices in a real environment and to illustrate the effectiveness of the twin data for real-time energy-conversion-rate correction. The CHP unit is used as an example here, assuming that the twin data were not considered in Case 1, and the conversion rate was corrected by relying only on the historical load factor and energy input data as input to the BPNN, while twin data were considered in Case 2. Comparing the two conversion-rate correction methods with the actual conversion rate of the unit, the average absolute and average relative errors for Case 2 were less than those for Case 1 for the real-time correction comparison table, shown below in Table 3.
Figure 9 shows a plot of the energy efficiency factor–load factor relationship based on the twin data. As can be seen, the CHP generated less power at low load rates, and its thermoelectric ratio decreased as the load rate increased, increasing when the load rate was greater than 70%. The conversion efficiency of the gas boiler was the highest when the load factor reached approximately 75%. The conversion efficiency of the electrolyser increased at a faster rate during low load levels. The rate decreased as the load factor increased, and the SMR increased as the load factor increased.
To verify the effectiveness of the optimal scheduling of community-integrated energy systems that consider the digital-twin technology proposed in this paper, the following scenarios were constructed for comparison: Scenario 1—optimal scheduling, considering the twin data for equipment efficiency correction; Scenario 2—an ideal scheduling scenario, assuming that the conversion efficiency of the energy coupling equipment was a fixed optimal efficiency to obtain the ideal scheduling cost; and Scenario 3—an actual scheduling scenario, in which the electricity load shortage was purchased from the grid, the heat load shortage was supplemented by the CHP units, gas boilers, and thermal storage tanks, and the hydrogen load shortage was supplemented by steam methane reforming.
The analysis of the results of the optimised dispatch is shown in Table 4.
As is shown in Table 4 above, there was a significant difference in the cost between the scheduling scenario that considered the twin data correction for the equipment efficiency and the ideal scheduling scenario. The total actual operating costs for Scenario 1 based on the twin data and Scenario 3 were USD 20,870.23 and USD 21,720.42, respectively. The refined modelling of the energy conversion model using the digital-twin technology in Scenario 1 resulted in a 4.14% reduction in the system operating costs, and a comparison of the cost of the electricity purchase with the cost of the gas purchase shows that the cost of the gas purchase in Scenario 1 was 11.14% lower than the actual cost of the gas purchase in Scenario 3. However, the cost of the purchased electricity increased by 2.98%, which shows an increase in the purchased electricity in Scenario 1. In order to analyse the optimal dispatch of the electricity, heat, and gas for the integrated community energy system in more detail, the following is a comparative analysis of the optimal dispatch scenario considering the twin data in Scenario 1 and the ideal dispatch scenario in Scenario 2. The ideal dispatch scenario assumed a CHP unit with a power and heat production efficiency of 0.92 and 0.60, respectively; a gas boiler efficiency of 0.88; an electrolyser efficiency of 0.74; and an SMR efficiency of 0.78.

5.2. Optimal Analysis of Day-Ahead Scheduling with a Modified Model of Equipment Efficiency Considering Twin Data

The power scheduling is shown in Figure 10 above, with (a) the power-supply scheduling that considered the twin data and (b) the ideal power-supply scheduling with the fixed optimal energy conversion coefficients. Due to the fact that the load rates of the energy-coupling equipment were different at different times, Scenario 1 used the digital-twin technology to update the model to obtain efficient energy conversion rates at different electrical-load rate periods, enabling a more rational allocation of the electricity, heat, and hydrogen. As is shown in Figure 10a, for the power-supply scheduling that considered the twin data, the grid purchased the most electricity during the whole day and, during the low-electricity-price periods, the CHP purchased gas to generate electricity with low economic efficiency. Therefore, in addition to purchasing electricity from the grid to meet the electrical load demand, the system also needed to charge the battery during the periods of 23:00–3:00, 7:00, and 16:00. The peak periods of 12:00–14:00 and 19:00–22:00 were when it was more costly to purchase electricity from the grid; therefore, the gas turbine was started up centrally to supply part of the electric load. However, due to the thermal load limitation, all the power produced by the CHP could not be supplied to the electric load, and most of it still needed to be purchased from the grid.
In Scenario 2, the battery charging and discharging periods were mainly influenced by the time-sharing tariff and were therefore essentially the same as in Scenario 1. As the energy-coupling device does not take into account the model’s self-renewal, the gas turbine was at optimal conversion efficiency each time, even though the electrical and thermal loads were at their peak at the same time. However, the CHP had a very high energy utilisation rate and was therefore the main supply device in addition to the electricity purchased from the grid. An analysis of Scenarios 1 and 2 shows that the energy system operated very differently when the model parameters were adjusted using digital-twin technology, as the CHP unit operated optimally by default and the cost of the purchased electricity was therefore minimal; however, the cost of the purchased gas increased accordingly.
The heat power scheduling is shown above in Figure 11 for the heat-supply scheduling that considered the twin data and the ideal heat-supply scheduling with a fixed optimal energy conversion factor. It can be concluded that there was a significant difference in the heat-power scheduling between the two scenarios. In Scenario 1, the gas boilers were mainly used to supply heat. However, in Scenario 2, the gas turbines were the main heating equipment and the gas boilers were only involved in supplying energy during the peak heat-load periods.
Scenario 1 considered the update of the conversion efficiency of the gas boiler and gas turbine using digital-twin technology. Due to the fixed price of natural gas, the cost of the heat dispatch solution was not only related to the energy conversion efficiency but also to the current load factor of the equipment. When the heat load was at a low level, the conversion efficiency of both the gas turbine and the gas boiler was at a low level due to the low load factor, but part of the gas turbine output power was used for the power supply. The CHP economy was better, and the operating economy of the system could be improved during the fixed hours; thus, the heat load demand could be met by the gas turbine alone at 9:00 and 13:00. When the heat load gradually increased, the load level gradually reached the rated capacity of the gas boilers. Switching off the CHP to only run the gas boiler equipment increased its load factor, and the energy conversion efficiency of the gas boilers increased. The heat supply deficit situation started the storage, and the heat tank provided the power. When the heat load reached its peak (14:00–15:00), the load level exceeded the rated capacity of the gas boiler, at which time the gas turbine with the heat storage tank was activated to provide energy to the heat load. If the peak of the electricity price is reached due to the high cost of purchasing electricity, the CHP and gas turbine should be started at the same time to supply energy to the electric and thermal loads in order to achieve the economic optimum of energy purchasing.
In Scenario 2, the gas boiler and gas turbine conversion efficiencies were considered optimal. When the heat load level was low, the CHP units all operated in the optimal efficiency range and their CHP economics were better. Therefore, they were mainly used as heat-supply units and, if the CHP was undersupplied, then the gas boiler and storage tank were activated to provide the undersupplied energy. When the electricity price reached a low period (23:00–4:00), when the cost of purchasing electricity from the grid was lower than the cost of supplying CHP, the output of the CHP units was reduced, and the storage tanks compensated for the shortfall in the heat load.
The hydrogen power scheduling is shown in Figure 12 for the hydrogen-supply scheduling that considered the twin data and the ideal hydrogen-supply scheduling with a fixed optimal energy conversion factor. In Scenario 1, when the hydrogen load was at a low level (23:00–9:00) and the electricity prices were at a low level, the electrolyser was started and the SMR plant was stopped to purchase electricity from the grid to meet the hydrogen load and to provide hydrogen energy to the hydrogen storage tank. When the hydrogen load gradually increased (10:00–15:00) and the hydrogen load factor became too high, the conversion efficiency of the electrolyser decreased, and the hydrogen supply capacity was insufficient. Therefore, the hydrogen storage tank was activated to provide for the shortfall. When the electricity price rose, some natural gas was purchased to start the SMR equipment to supply the hydrogen because the electrolyser was about to reach the optimal conversion rate at this time. Thus, the amount of hydrogen produced by the SMR was much less than the amount of hydrogen produced by the electrolyser. When the electricity price was at peak hours (13:00–14:00 and 20:00), the cost of hydrogen production by purchasing electricity from the electrolyser alone was too high; therefore, the SMR and the hydrogen storage tank were started to provide hydrogen energy to the hydrogen load. When the electricity price gradually decreased (14:00–15:00), the thermal load was at its maximum. When the energy conversion rate of the electrolyser was smaller than that of the SMR, the proportion of hydrogen produced by the SMR gradually increased.
In Scenario 2, the hydrogen storage tank was filled with hydrogen in a similar way to Scenario 1, with the electrolyser producing hydrogen for the supply and filling the storage tank during periods with low electricity prices. As the price of electricity increased (12:00–14:00), it was less economical to continue to buy electricity from the grid; therefore, the proportion of hydrogen produced by the electrolyser decreased and the proportion of hydrogen produced by the SMR increased.
However, the electrical, thermal, and hydrogen loads were at low levels at some times. The CHP, gas boilers, electrolysers, and steam methane reformers were also at low load factors, and the actual operating efficiency was not high. For this reason, the ideal scheduling solution was not justified, and there was a significant difference between the ideal and actual operating costs.

6. Discussion

Analysing the total ideal dispatch cost of Scenario 2 and the total actual dispatch cost of Scenario 3, the ideal total cost of Scenario 2 was USD 20,397.8, while the actual total cost was USD 21,720.42. The cost prediction error of Scenario 2 in this calculation case reached 6.36%. The reason for this was that the optimal fixed value was taken for the energy conversion efficiency and the impact of the load factor on the energy conversion status was not considered, resulting in an increase of 9.11% in the actual dispatch of the electricity purchase cost when compared to the ideal dispatch of the electricity purchase cost and an increase of 3.6% in the actual gas purchase cost when compared to the ideal gas purchase cost.
In conclusion, if the optimal conversion efficiency is taken in the energy conversion model, the actual energy conversion efficiency of the equipment is low, because the equipment is often in a low load rate state, which makes the comprehensive energy-dispatching scheme deviate from the actual operating situation; accordingly, the dispatching cost has a huge error, which is not conducive to the economic and efficient dispatching of the system. With the use of digital-twin technology, as the load rate changes, the energy conversion efficiency also changes; therefore, the energy-coupling equipment with the right capacity is selected as the power-generation equipment through the load level at each time of the day to ensure a high level of conversion efficiency at different load periods.

7. Conclusions

In the future, we will explore the optimal dispatching of integrated energy systems based on digital-twin technology for economy while also considering the safety and reliability of the equipment to further improve the optimal dispatching scheme of the system.

Author Contributions

Conceptualization, W.H. and J.H. (Jinfeng Huang); methodology, J.H. (Jun He); software, Z.Y.; validation, Z.Y., C.L. and Y.F.; formal analysis, Z.Y. All authors have read and agreed to the published version of the manuscript.

Funding

This research received no external funding.

Institutional Review Board Statement

Not applicable.

Informed Consent Statement

Informed consent was obtained from all subjects involved in the study.

Data Availability Statement

Not applicable.

Conflicts of Interest

The authors declare no conflict of interest.

References

  1. Hou, H.; Liu, P.; Xiao, Z.; Deng, X.; Huang, L.; Zhang, R.; Xie, C. Capacity configuration optimization of standalone multi-energy hub considering electricity, heat and hydrogen uncertainty. Energy Convers. Econ. 2021, 2, 122–132. [Google Scholar] [CrossRef]
  2. Lin, W.; Jin, H.; Jia, H.; Mu, Y.; Xu, T.; Xu, X.; Yu, X. Decentralized optimal scheduling for integrated community energy system via consensus-based alternating direction method of multipliers. Appl. Energy. 2021, 302, 117448. [Google Scholar] [CrossRef]
  3. Liu, X.; Xie, S.; Geng, C.; Yin, J.; Xiao, G.; Cao, H. Optimal evolutionary dispatch for integrated community energy systems considering uncertainties of renewable energy sources and internal loads. Energies 2021, 14, 3644. [Google Scholar] [CrossRef]
  4. Xu, Y.; Mu, Y.; Cao, Y.; Jia, H.; Wu, G.; Wang, X. Deep neural network-based low-carbon economic dispatch of integrated energy systems under variable operating conditions. High Volt. Technol. 2022, 48, 11. [Google Scholar] [CrossRef]
  5. Liu, F.; Mo, Q.; Yang, Y.; Li, P.; Wang, S.; Xu, Y. A nonlinear model-based dynamic optimal scheduling of a grid-connected integrated energy system. Energy 2022, 243, 123115. [Google Scholar] [CrossRef]
  6. Saletti, C.; Morini, M.; Gambarotta, A. Smart management of integrated energy systems through co-optimization with long and short horizons. Energy 2022, 250, 123748. [Google Scholar] [CrossRef]
  7. Lv, C.; Yu, H.; Li, P.; Wang, C.; Xu, X.; Li, S.; Wu, J. Model predictive control based robust scheduling of community integrated energy system with operational flexibility. Appl. Energy 2019, 243, 250–265. [Google Scholar] [CrossRef]
  8. Zhang, G.; Ge, Y.; Ye, Z.; Al-Bahrani, M. Multi-objective planning of energy hub on economic aspects and resources with heat and power sources, energizable, electric vehicle and hydrogen storage system due to uncertainties and demand response. J. Energy Storage 2023, 57, 106160. [Google Scholar] [CrossRef]
  9. Ji, Y.; Wang, J.; Xu, J.; Li, D. Data-driven online energy scheduling of a microgrid based on deep reinforcement learning. Energies 2021, 14, 2120. [Google Scholar] [CrossRef]
  10. Liu, Y.; Zhang, N.; Kang, C. A review on data-driven analysis and optimization of power grid. Autom. Electr. Power Syst. 2018, 42, 157–167. [Google Scholar]
  11. Fan, S.; Li, L.; Wang, S.; Liu, X.; Yu, Y.; Hao, B. Application analysis and exploration of artificial intelligence technology in power grid dispatch and control. Power Syst. Technol. 2020, 44, 401–411. (In Chinese) [Google Scholar]
  12. Yang, H.; Jin, Z.; Wang, J.; Zhao, Y.; Wang, H.; Xiao, W. Data-driven stochastic scheduling for energy integrated systems. Energies 2019, 12, 2317. [Google Scholar] [CrossRef]
  13. Mu, Y.; Xu, Y.; Cao, Y.; Chen, W.; Yu, X.; Jin, X. A two-stage scheduling method for integrated community energy system based on a hybrid mechanism and data-driven model. Appl. Energy 2022, 323, 119683. [Google Scholar] [CrossRef]
  14. Huang, W.; Zhang, N.; Wang, Y.; Capuder, T.; Kuzle, I.; Kang, C. Matrix modeling of energy hub with variable energy efficiencies. Int. J. Electr. Power Energy Syst. 2019, 119, 105876. [Google Scholar] [CrossRef] [Green Version]
  15. Mu, Y.; Chen, W.; Yu, X.; Jia, H.; Hou, K.; Wang, C.; Meng, X. A double-layer planning method for integrated community energy systems with varying energy conversion efficiencies. Appl. Energy 2020, 279, 115700. [Google Scholar] [CrossRef]
  16. Park, H.; Byeon, G.; Son, W.; Jo, H.; Kim, J.; Kim, S. Digital twin for operation of microgrid: Optimal scheduling in virtual space of digital twin. Energies 2020, 13, 5504. [Google Scholar] [CrossRef]
  17. Wang, L.; Hou, C.; Ye, N.; Wang, H.; Yin, C.; Cong, H. Optimal operation analysis of integrated community energy system considering the uncertainty of demand response. IEEE Trans. Power Syst. 2021, 36, 3681–3691. [Google Scholar] [CrossRef]
  18. de Costa, R.L.C. Convolutional-LSTM networks and generalization in forecasting of household photovoltaic generation. Eng. Appl. Artif. Intell. 2022, 116, 105458. [Google Scholar] [CrossRef]
  19. You, M.; Wang, Q.; Sun, H.; Castro, I.; Jiang, J. Digital twins based day-ahead integrated energy system scheduling under load and renewable energy uncertainties. Appl. Energy 2022, 305, 117899. [Google Scholar] [CrossRef]
  20. Lu, J.; Yan, L.; La, Z.; Liu, X.; Ren, H. Real-time optimal dispatching strategy for integrated energy systems based on digital twin and dynamic energy efficiency model. Power Grid Technol. 2022, 2033-2437, 1–17. [Google Scholar] [CrossRef]
  21. Qi, Q.; Tao, F.; Hu, T.; Anwer, N.; Liu, A.; Wei, Y.; Wang, L.; Nee, A. Enabling technologies and tools for digital twin. J. Manuf. Syst. 2021, 58, 3–21. [Google Scholar] [CrossRef]
  22. Zhu, Q.; Huang, S.; Wang, G.; Moghaddam, S.K.; Lu, Y.; Yan, Y. Dynamic reconfiguration optimization of intelligent manufacturing system with human-robot collaboration based on digital twin. J. Manuf. Syst. 2022, 65, 330–338. [Google Scholar] [CrossRef]
  23. Bai, H.; Wang, Y. Digital power grid based on digital twin: Definition, structure and key technologies. Energy Rep. 2022, 8 (Suppl. 16), 390–397. [Google Scholar] [CrossRef]
  24. Li, C.; Yang, Y.; Wang, Z.; Wang, N.; Wang, L.; Yang, Z. Energy hub-based optimal planning for integrated energy systems considering part-load characteristics and synergistic effect of equipment. Glob. Energy Interconnect. 2021, 4, 169–183. [Google Scholar] [CrossRef]
  25. Wang, Y.; Hou, K.; Jia, H.; Mu, Y.; Zhu, L.; Li, H.; Rao, Q. Decoupled optimization of integrated energy system considering CHP plant based on energy hub model. Energy Procedia 2017, 142, 2683–2688. [Google Scholar] [CrossRef]
  26. Deng, S.; Wu, Q.; Jing, Z.; Wu, L.; Wei, F.; Zhou, X. Optimal capacity configuration for energy hubs considering part-load characteristics of generation units. Energies 2017, 10, 1966. [Google Scholar] [CrossRef] [Green Version]
  27. Yuan, Z.; Jing, Z.; Hu, R.; Wu, Q. Operation optimization of CCHP-type microgrid considering units’ part-load characteristics. In Proceedings of the 2015 IEEE Innovative Smart Grid Technologies—Asia (ISGT ASIA), Bangkok, Thailand, 3–6 November 2015. [Google Scholar] [CrossRef]
  28. Meybodi, M.; Behnia, M. A study on the optimum arrangement of prime movers in small scale microturbine-based CHP systems. Appl. Therm. Eng. 2012, 48, 122–135. [Google Scholar] [CrossRef]
  29. Kenna, E.; Bannister, P. Simple, fully featured boiler loop modelling. In Proceedings of the Eleventh International IBPSA Conference, Glasgow, Scotland, 27–30 July 2009. [Google Scholar]
  30. Song, H.; Liu, Y.; Bian, H.; Shen, M.; Lin, X. Energy, environment, and economic analyses on a novel hydrogen production method by electrified steam methane reforming with renewable energy accommodation. Energy Convers. Manag. 2022, 258, 115513. [Google Scholar] [CrossRef]
Figure 1. Digital twin five-dimensional model.
Energies 16 01360 g001
Figure 2. Digital-twin-based architecture for integrated community energy systems.
Energies 16 01360 g002
Figure 3. Framework for an integrated community energy twin.
Energies 16 01360 g003
Figure 4. Flow chart of the equipment efficiency correction based on twin data.
Energies 16 01360 g004
Figure 5. A schematic diagram of the back propagation neural network.
Energies 16 01360 g005
Figure 6. Comparison of predictions based on digital twins.
Energies 16 01360 g006
Figure 7. DT-LSTM-based map for renewable energy and load forecasting.
Energies 16 01360 g007
Figure 8. Visualisation model diagram of a community-integrated energy system twin.
Energies 16 01360 g008
Figure 9. Based on the twin energy efficiency factor–load factor relationship.
Energies 16 01360 g009
Figure 10. Power-supply dispatch map (a) considering twin data and (b) fixed optimal energy conversion factor.
Energies 16 01360 g010
Figure 11. Heat-supply scheduling diagram: (a) considering digital-twin technology; (b) fixed optimal energy conversion factor.
Energies 16 01360 g011
Figure 12. Hydrogen-supply scheduling diagram: (a) considering digital-twin technology and (b) with the fixed optimal energy conversion factor.
Energies 16 01360 g012
Table 1. Energy-coupling device twin parameters.
Energy-Coupling EquipmentType of ParameterNumerical Value
CHPRated capacity/kW220
Rated gas-to-electricity efficiency0.47
Electrical heat ratio1.94
CHP twin fitting factor0.76
Gas boilersRated capacity/kW220
Rated gas-to-heat efficiency0.93
Gas boiler twin fit coefficients0.86
Electrolysis tankRated capacity/kW170
Rated electric-to-hydrogen efficiency0.75
Electrolyser twin fitting factor0.68
SMRRated capacity/kW200
Rated gas-to-hydrogen efficiency0.46
SMR twin fitting factor0.56
BatteryRated capacity/kW·h300
Maximum charging/discharging power/kW90
Charging/discharging efficiency0.85
Heat storage tanksRated capacity/kW·h300
Maximum charging/discharging power/kW15
Charge/discharge thermal efficiency0.9
Hydrogen storage tanksRated capacity/kW·h200
Maximum hydrogen charging/discharging power/kW60
Hydrogen charging/discharging efficiency0.8
Table 2. Electricity and gas tariffs.
ParameterTimePrice
κ g a s , t 0:00–23:003.12 USD/m3
κ e l e , t 0:00–7:00USD 0.42
8:00–9:00, 14:00–16:00, 21:00–22:00USD 0.63
10:00–13:00, 17:00–20:00USD 0.76
Table 3. Real-time correction comparison table.
CaseMean Absolute ErrorAverage Relative Error
17.15672.07%
22.48610.89%
Table 4. Analysis of the day-ahead scheduling costs.
SceneCost of Electricity Purchase/USDGas Purchase Cost/USDTotal Cost/USD
Scene 111,076.69793.6320,870.23
Scene 27775.810,62218,397.8
Scene 310,722.7410,997.6821,720.42
Disclaimer/Publisher’s Note: The statements, opinions and data contained in all publications are solely those of the individual author(s) and contributor(s) and not of MDPI and/or the editor(s). MDPI and/or the editor(s) disclaim responsibility for any injury to people or property resulting from any ideas, methods, instructions or products referred to in the content.

