Article

Development of a Thermal-Hydraulic Model for the EU-DEMO Tokamak Building and LOCA Simulation

by
Matteo D’Onorio
1,
Tommaso Glingler
1,
Maria Teresa Porfiri
2,
Danilo Nicola Dongiovanni
2,
Sergio Ciattaglia
3,
Curt Gliss
3,
Joëlle Elbez-Uzan
3,
Pierre Cortes
3 and
Gianfranco Caruso
1,*
1
Department of Astronautical Electrical and Energy Engineering (DIAEE), Sapienza University of Rome, C.so Vittorio Emanuele II 244, 00186 Rome, Italy
2
ENEA CR. Frascati, UTFUS-TECN, Via Enrico Fermi, 45, 00044 Frascati, Italy
3
EUROfusion Consortium, Boltzmannstr. 2, 85748 Garching, Germany
*
Author to whom correspondence should be addressed.
Energies 2023, 16(3), 1149; https://doi.org/10.3390/en16031149
Submission received: 22 December 2022 / Revised: 9 January 2023 / Accepted: 16 January 2023 / Published: 20 January 2023

Abstract

:
The EU-DEMO must demonstrate the possibility of generating electricity through nuclear fusion reactions. Moreover, it must denote the necessary technologies to control a powerful plasma with adequate availability and to meet the safety requirements for plant licensing. However, the extensive radioactive materials inventory, the complexity of the plant, and the presence of massive energy sources require a rigorous safety approach to fully realize fusion power’s environmental advantages. The Tokamak building barrier design must address two main issues: radioactive mass transport hazards and energy-related or pressure/vacuum hazards. Safety studies are performed in the frame of the EUROfusion Safety And Environment (SAE) work package to support design improvement and evaluate the thermal-hydraulic behavior of confinement building environments during accident conditions in addition to source term mobilization. This paper focuses on developing a thermal-hydraulic model of the EU-DEMO Tokamak building. A preliminary model of the heat ventilation and air conditioning system and vent detritiation system is developed. A loss-of-coolant accident is studied by investigating the Tokamak building pressurization, source term mobilization, and release. Different nodalizations were compared, highlighting their effects on source term estimation. Results suggest that the building design should be improved to maintain the pressure below safety limits; some mitigative systems are preliminarily investigated for this purpose.

1. Introduction

Research and technological development are key ingredients to demonstrate that power production in nuclear fusion plants is possible. The short-term goal of the ongoing fusion R&D activities is to create and control a burning plasma, an essential requirement for net fusion power generation. For this purpose, the International Thermonuclear Experimental Reactor (ITER) project aims to build a tokamak research facility capable of generating the world’s first sustained burning plasma (300–450 s range, self-heating). Parallel to the ITER exploitation in the 2030s [1], a demonstration power plant (DEMO) needs to be designed.
EU-DEMO must demonstrate the possibility of generating electricity through nuclear fusion reactions. Moreover, it must denote the necessary technologies to control a powerful plasma and safely generate electricity [2,3]. Tokamak safety requirements aim to protect the public and the workers against the environmental release of radioactivity from the facility during both normal operation and accidental conditions. At the same time, safety systems shall be used to mitigate the impact of accident scenarios leading to the release of radioactive materials from the facility.
In pursuing the mentioned safety requirement, well-established principles such as the ALARA, passive safety systems, and defense-in-depth are adopted [4,5]. In particular, the defense-in-depth approach is based on posing several successive barriers to prevent the release of radioactive material into the environment [6,7]. This principle is applied to the safety design of EU-DEMO and tokamaks in general to prevent or reduce accident consequences resulting from system and equipment failures, human errors, and internal or external hazards. The Tokamak building barriers must address two main issues: radioactive mass transport hazards and energy-related or pressure/vacuum hazards. In the tokamak design, double or triple confinement systems are implemented for in-vessel radioactive inventories as well as for other radioactive inventories, such as those in the coolants or the fuel cycle. In the preliminary conceptual design of the EU-DEMO plant, two confinement systems involving multiple static associated barriers were defined. The first confinement system aims at protecting the workers. It includes several barriers such as the vacuum vessel (VV) and extensions, the blanket, divertor, and VV primary heat transfer system (PHTS) cooling loops, fueling lines, and tritium systems. In accident situations, some other components will also constitute elements of the first confinement system, such as the VVPSS, the drain tank, the secondary side of the PHTS heat exchangers, glove boxes, the coolant purification system (CPS), the tritium extraction system, and the emergency cooling system. The second confinement system, aiming at protecting other workers and the members of the public, is the ultimate line of defense against radiological releases. It comprises internal rooms and the tokamak and tritium buildings; moreover, it is equipped with active systems for the purification and detritiation of the building environments [8].
Safety studies are performed in the frame of the EUROfusion Safety and Environment (SAE) work package to support design improvement and evaluate the thermal-hydraulic behavior of confinement building environments during accident conditions in addition to source term mobilization. A functional failure modes and effects analysis (FFMEA) [9] classified both in-vessel and ex-vessel LOCA among the most representative events in terms of challenging conditions for plant safety since they could cause substantial damage to structures and principal components. In particular, the large enthalpy stored in the breeding blanket (BB) coolant water could threaten confinement barriers’ structural integrity, causing the release of radioactive substances into the environment.
This paper focuses on ex-vessel LOCA exploratory analyses for the water-cooled lithium lead (WCLL) BB concept of the EU-DEMO plant, investigating pressurization of the Tokamak building and radiological releases.
Preliminary studies to investigate galleries pressurization were performed with the CONSEN code [10,11] in the case of cryogenic He release from toroidal field coils cooling loop and of VV coolant release [12]. Similar studies performed for the helium-cooled pebble bed (HCPB) BB concept are reported in [13]. For the HCPB EU-DEMO concept, the BB PHTS is divided into six loops for outboard (OB) blankets and three loops for inboard (IB) blankets [14], while for the WCLL concept, the pre-conceptual design provides single cooling loops for the BZ and FW, respectively [15]. Consequently, a large amount of coolant could be released in the containment after a LOCA event. Preliminary analyses in [16,17,18] highlighted that ex-vessel LOCA from water PHTS could pose a safety concern because of the high enthalpy released in the building. For this reason, mitigation systems (e.g., suppression pools, containment spray system) shall be foreseen in the containment to avoid long-term releases of tritiated water (HTO) and activated corrosion products (ACP) toward the environment.
In the current study, different nodalization schemes of the main tokamak rooms are developed by gradually increasing the complexity of the model. A simplified model takes less computational time and less effort to develop the input deck model. The results of a LOCA from WCLL FW-PHTS are compared for different nodalization schemes to understand the deviation of a simplified model with a more complex nodalization scheme. Sensitivity studies on building components are performed together with the simulation of exploratory solutions to minimize building pressurization.
The selected postulated initiating event (PIE) is a double-ended guillotine break (DEGB) in a cold FW-PHTS distributor ring. The accident is simulated assuming that the fusion power termination system will actuate on a signal from a pressure sensor in the Tokamak building, which terminates plasma burn in three seconds.
The fusion version of the MELCOR code (ver. 1.8.6) [19,20] was used to evaluate accident consequences for the selected scenario. MELCOR was chosen because of its capability to consistently simulate coolant thermal-hydraulic behavior and radionuclide and aerosol transport in nuclear facilities and reactor cooling systems during severe accident scenarios, even though it is not officially qualified. MELCOR can also predict structural temperatures (e.g., FW, blanket, divertor, and vacuum vessel) resulting from energy produced by radioactive decay heat and oxidation reactions to demonstrate that safety margins are respected during the accident sequences.

2. Materials and Methods

2.1. Overview of the Reference EU-DEMO WCLL Reactor Design

The EU-DEMO reference design adopted for this exploratory study was designed for a fusion power of about 2 GWth. A technical overview of the DEMO plant used as a baseline for this study is reported in [21].
The tokamak assembly consists of three main systems: the VV, the magnet, and the cryostat. Each of these systems provides support to other components. The VV is a pressure vessel shaped as a torus that supports the primary vacuum (~10−5 Pa) and shields the magnets from the neutrons generated during plasma pulses. The tokamak structure supports other systems (e.g., BB, divertor, diagnostics, auxiliary heating system). The magnet system consists of an assembly of planar superconducting coils. The coils generate a magnetic field that can configure and define the plasma’s poloidal structure. The coils are cooled by liquid helium at ~4K; the current and the cooling provided to the coils is supplied by ex-tokamak systems. The coil assembly consists of a toroidal field, a poloidal field, and a central solenoid assembly. The cryostat is a large, passively cooled vessel that provides the vacuum necessary to operate the magnet system in cryogenic conditions. The vessel supports the tokamak and is composed of many openings to allow the penetration of cooling pipes and magnet feeders [21].
Concerning the blanket component, the WCLL concept is one of the candidate options for the future EU-DEMO [22]. The whole WCLL blanket system covers the VV all over the toroidal direction. It is divided into 16 sectors. One DEMO sector is composed of two inboard segments and three outboard segments. Thus, there is a total of 36 IB and 54 OB segments, respectively. The single segment is constituted of about 100 breeding cells distributed along the poloidal direction, following a single module segment (SMS) approach. The reference breeding cell adopted for modeling purposes is the WCLL 2018 V0.6 Central OB equatorial cell, described in detail in [23].
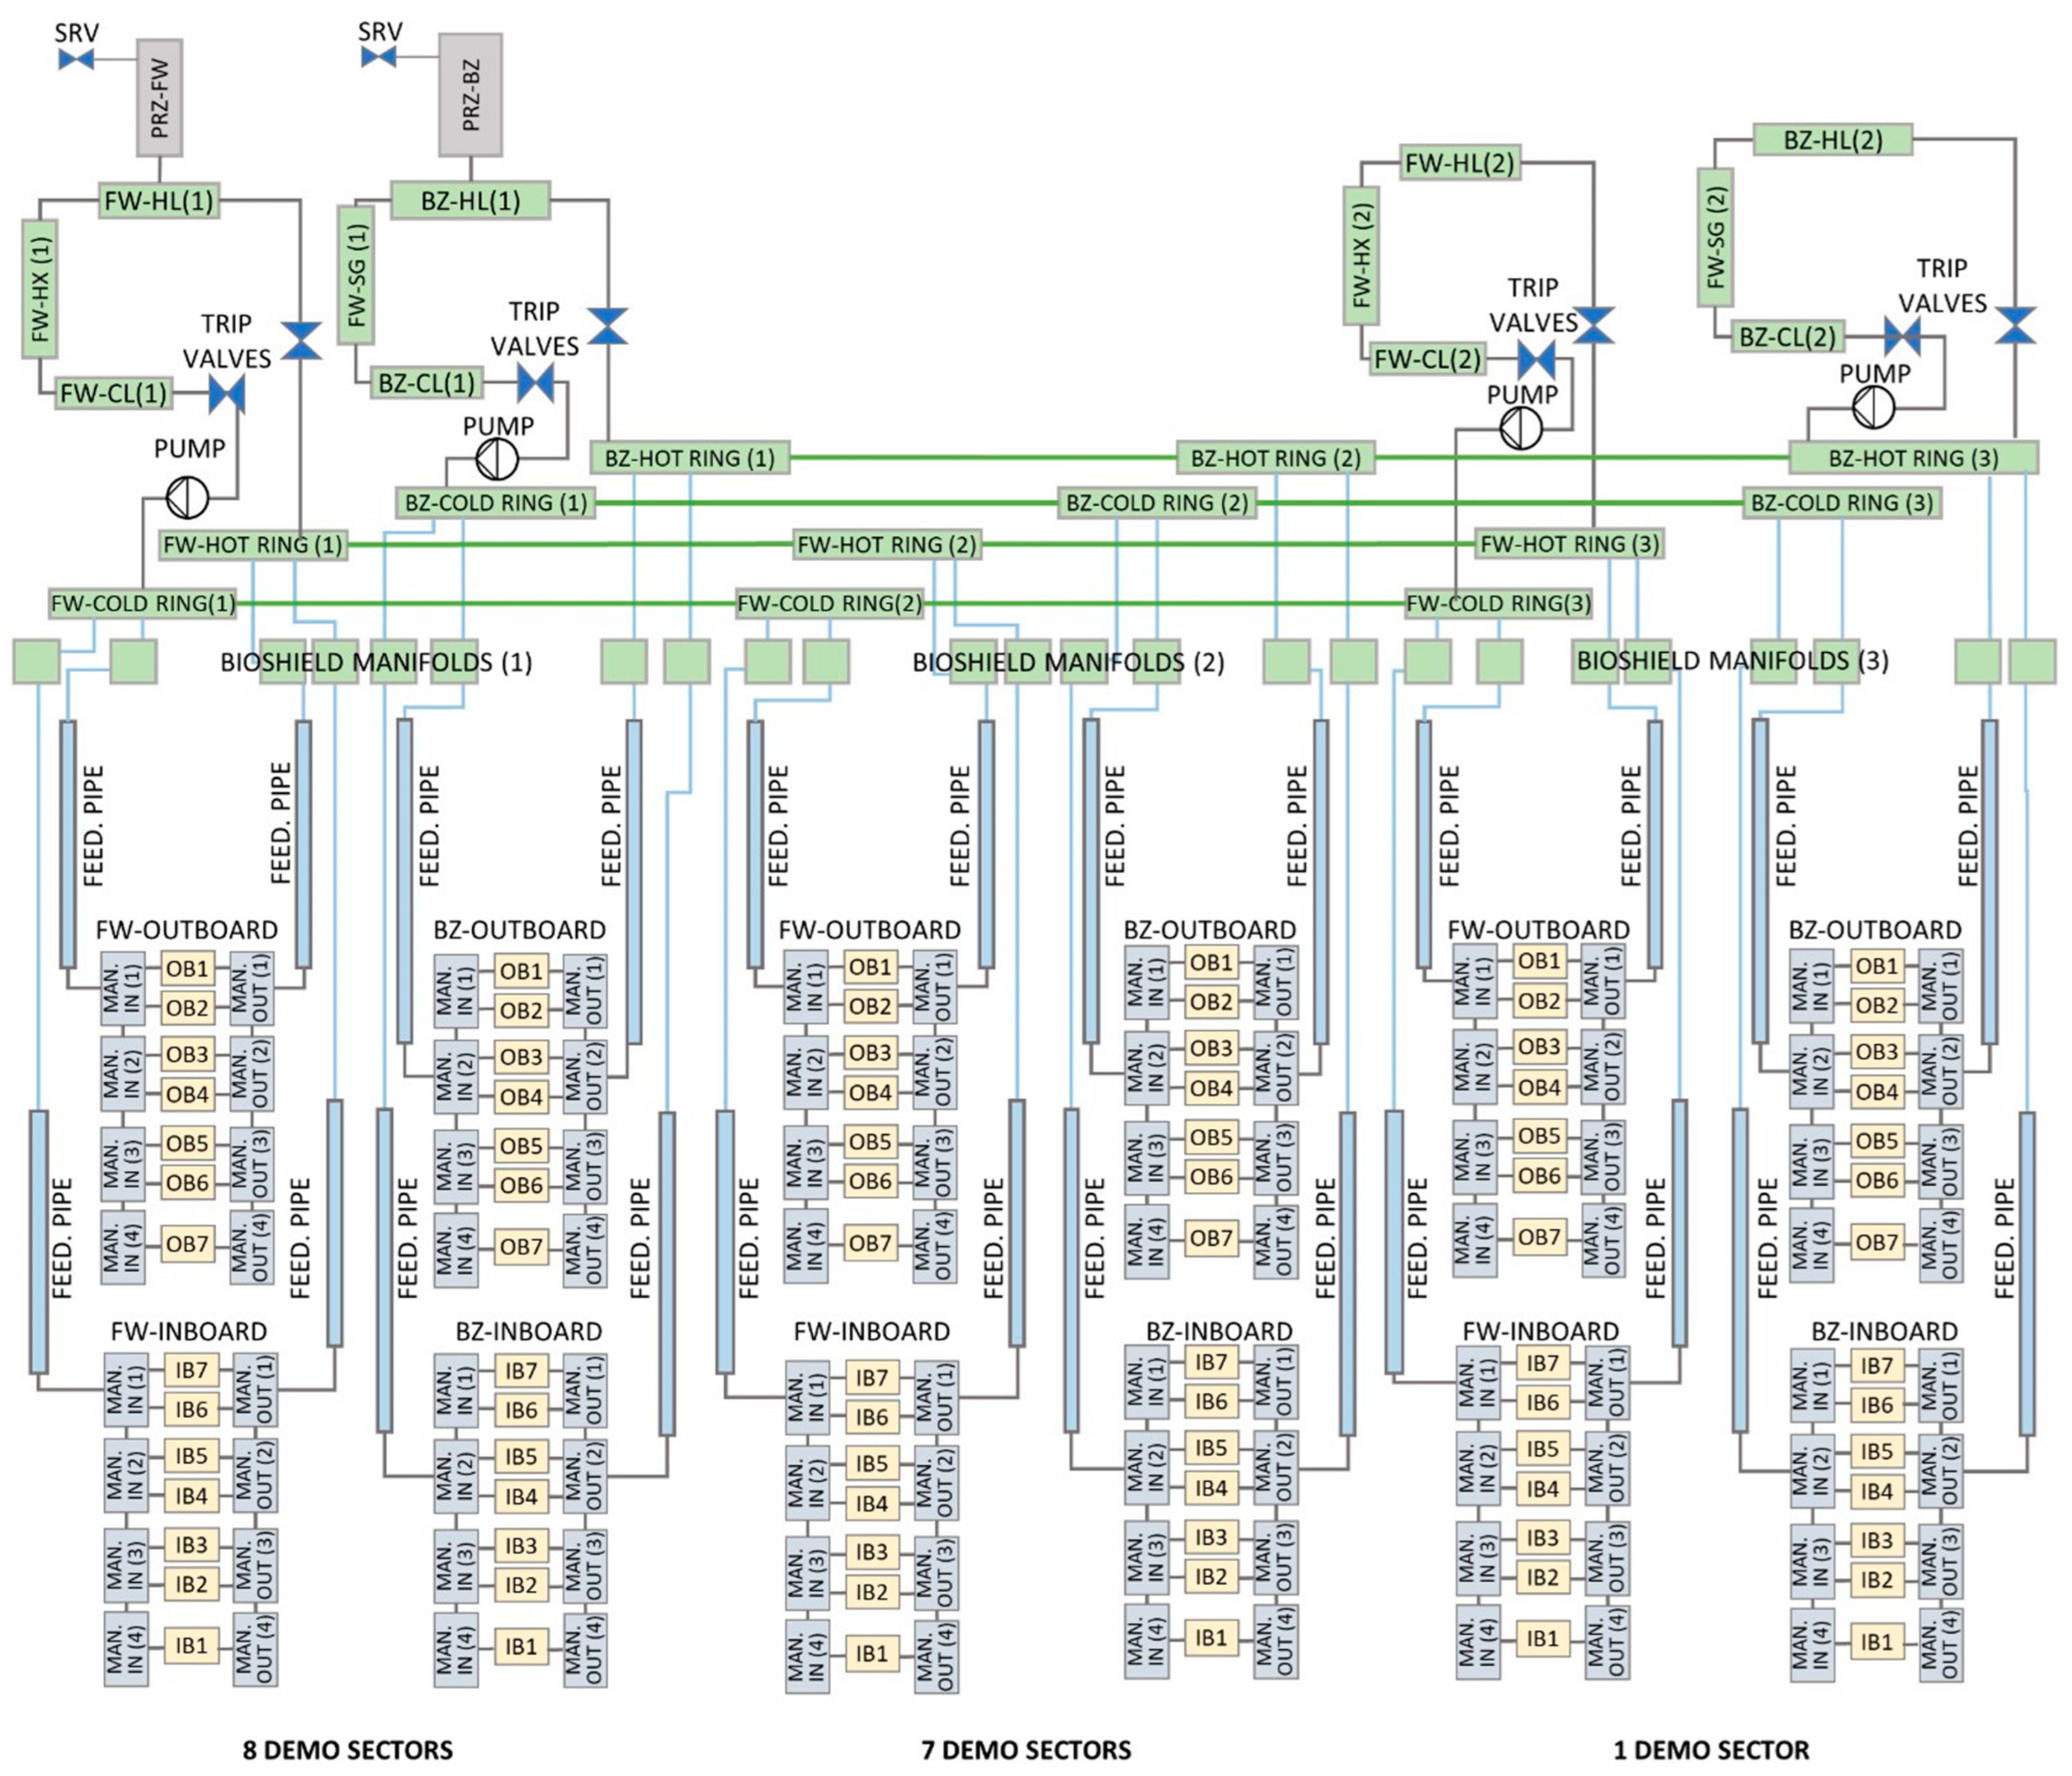
Two different cooling loops remove heat from the BZ and FW. The BZ coolant pipe system consists of radial-toroidal double walled tubes (DWTs) designed to minimize the risk of pipe rupture with consequent water ingress into the breeding zone and violent chemical reactions occurring with the breeder [24]. The main PHTS components placed outside the VV are the hot and cold distributor rings, the sector manifolds, pumps, pressurizers, the BZ once-through steam generators (OTSGs), and the FW heat exchangers (HEXs). All these components are shown in Figure 1. A more comprehensive description of the PHTS design is provided in [25,26], including the description of out-of-vessel components. Thermo-dynamic conditions of cooling water are 295–328 °C and 15.5 MPa. PHTS in-vessel and ex-vessel components are placed inside the Tokamak building, representing the ultimate nuclear confinement barrier against radioactive material releases. The main PHTS ex-vessel components are located on two opposite sides of the Tokamak building PHTS area. The coolant pumps are located nearby the heat exchanger exit. A short pipe connects the pumps to the heat exchanger; downstream, the coolant pump is connected to the cold leg [27].
The Tokamak building houses the tokamak itself and the numerous plant systems that interface with the necessary systems to produce and control the plasma [28]. For this reason, the building requires a large space because of the number and the size of the components to be housed, such as: the cryostat (which encloses the tokamak machine and its auxiliary systems); the various PHTS piping and components; the vacuum vessel pressure suppression system (VVPSS); the heating, ventilation, and air conditioning system; the cryo-distribution system; and the electrical power supplies. In addition, safety-classified protection and mitigation systems such as the decay heat removal system, the detritiation systems, and the toroidal field coil quench detection system should be located in the Tokamak building [29]. The presence of these and other systems in the building might generate challenging environmental conditions, mainly because of the huge magnetic energy of the magnets housed in the buildings and the significant enthalpy of coolant fluids at high temperatures. If these fluids are released, they can cause the mobilization of radioactive inventories such as tritium, activated corrosion products, and activated dust, challenging the confinement safety function. From the early design stage, it is essential to quantify radioactive inventories inside the Tokamak building and maintain them through design solutions as low as reasonably achievable.
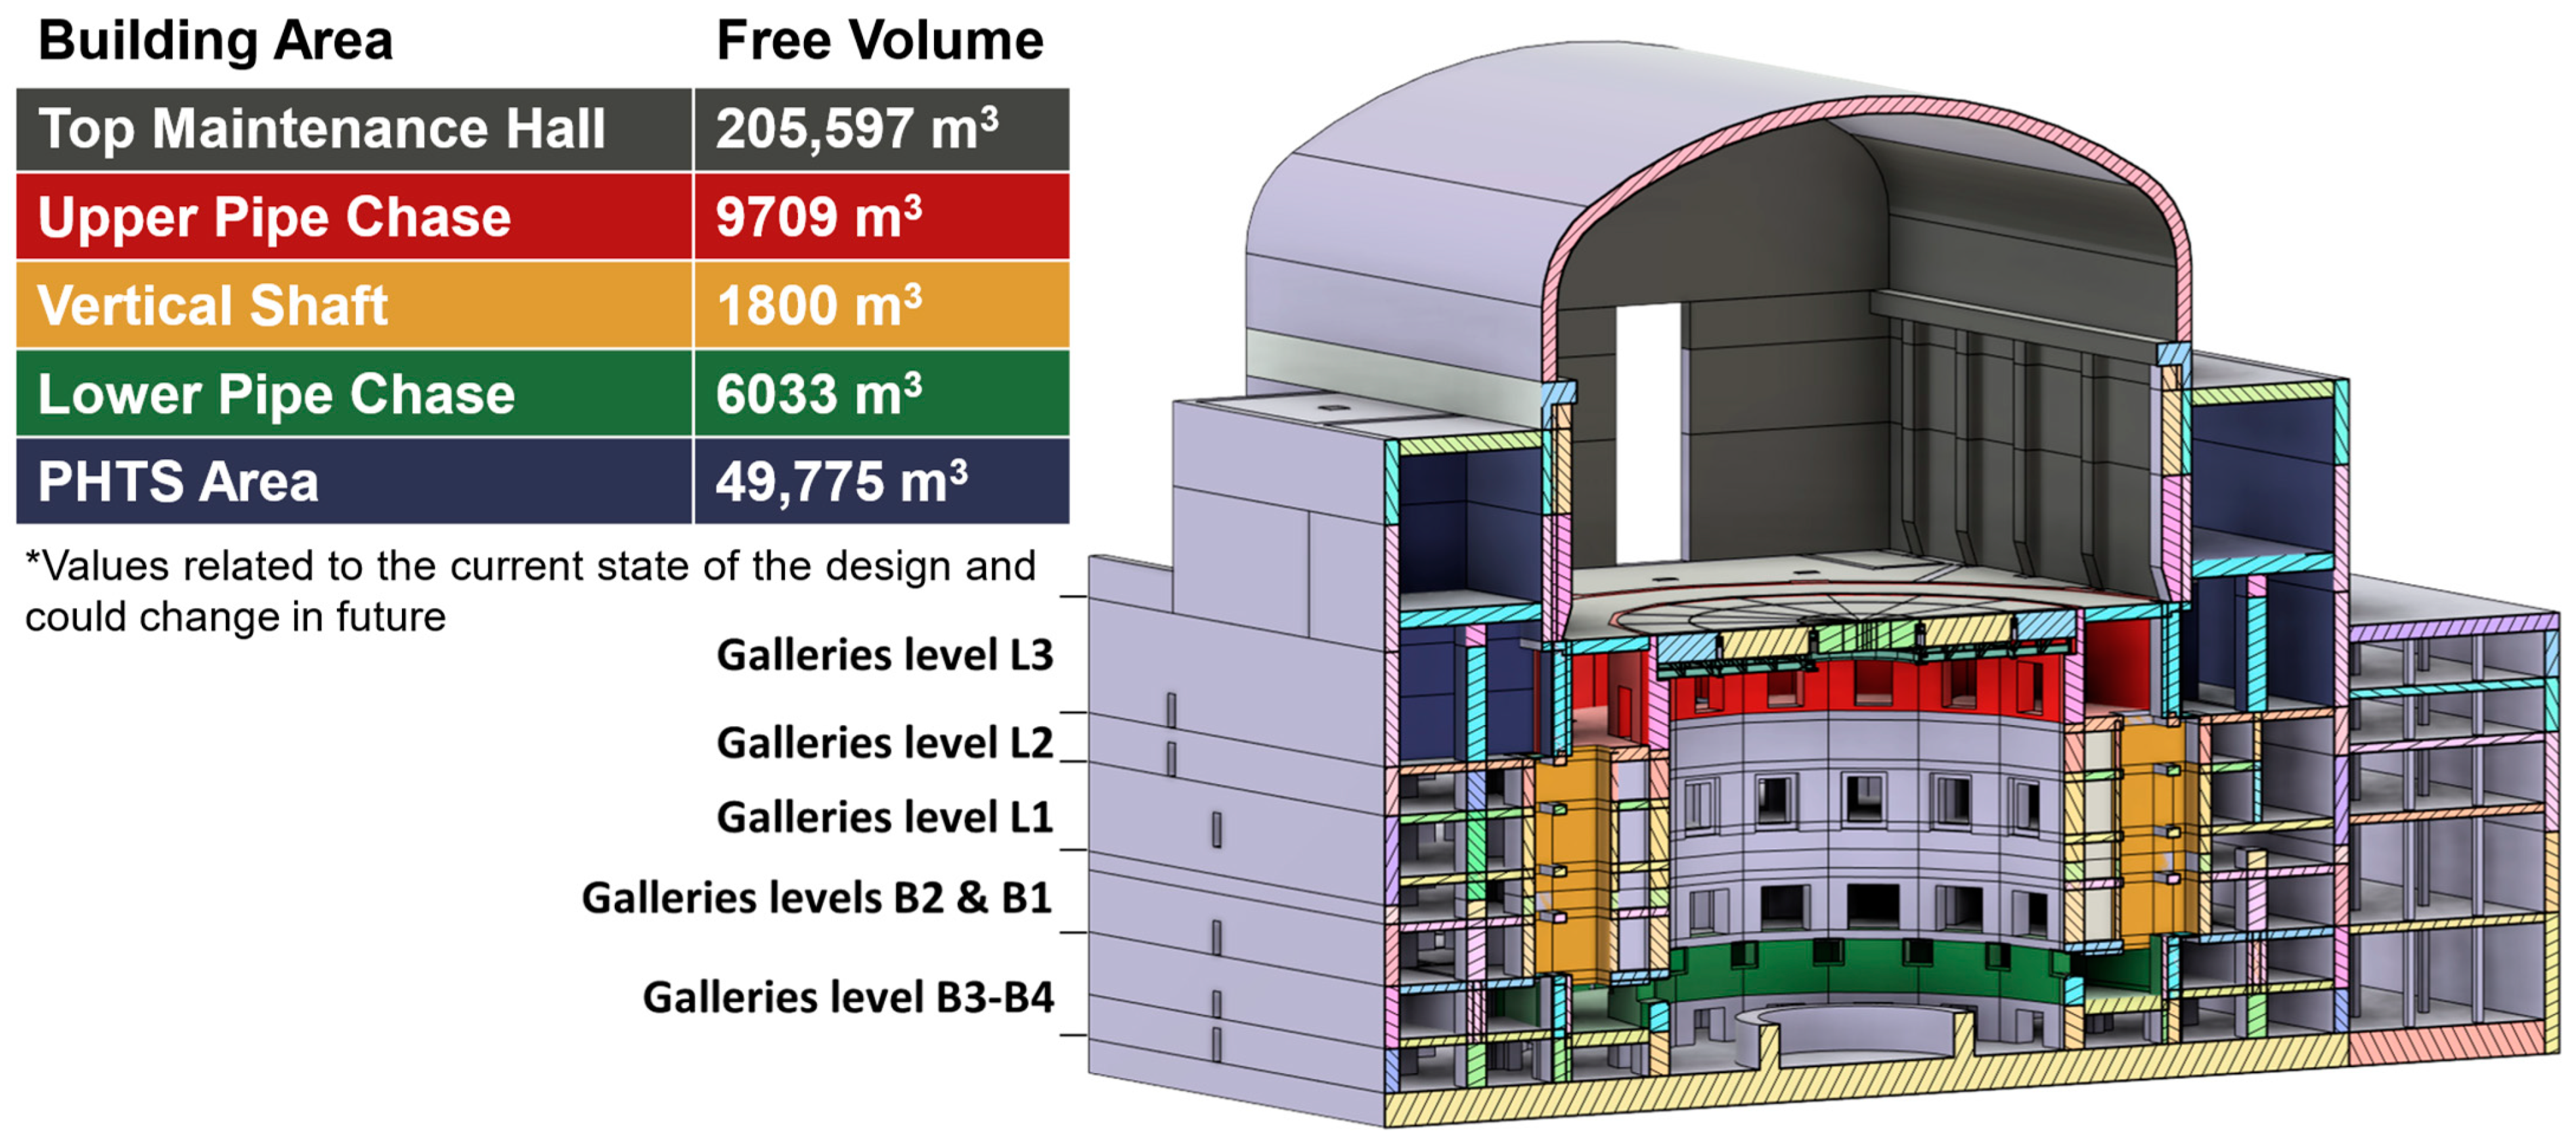
The Tokamak building has several levels corresponding to the cryostat penetrations and additional levels above and below the machine used for auxiliary equipment. The radioactive confinement safety function could be challenged by an over-pressurization of the building beyond its design pressure (under re-assessment and assumed in this study at 2 bar absolute). Enough volume inside the building must be made available to avoid this over-pressurization in accidental scenarios. If this accessible volume is unavailable for design reasons, the building should be equipped with pressure suppression systems. Some rooms of the Tokamak building are assigned as expansion volumes to limit the pressure in leak accident cases [29,30]. In Figure 2, the design of the EU-DEMO Tokamak building is shown together with free volumes available for steam expansion in the case of a LOCA [31,32].
In this pre-conceptual design phase of the EU DEMO Tokamak building, open connections are provided between three main compartments of the entire building:
  • The upper pipe chase (UPC) (red in Figure 3a), which extends at L3 level as an annulus, and in which hot and cold distributor rings are located;
  • The lower pipe chase (LPC) (Figure 3c), which extends at B3 level as an annulus where all the pipework incoming and outgoing from the lower port are routed, including the LiPb loop equipment;
  • The seven vertical shafts (VS) (Figure 3b), extending from level B2 to level L2, which connect UPC and LPC and host several pipeworks.
The PHTS area (red in Figure 3a) is connected with the upper pipe chase through relief panels. Moreover, relief panels are also provided to connect the PHTS area and the top maintenance hall (TMH). Preliminary pressure setpoints and release panel flow areas are provided in the EU-DEMO SDL; for this reason, exploratory parametric studies were performed on these parameters.

2.2. MELCOR 1.8.6 for Fusion EU-DEMO Thermal-Hydraulic Model

MELCOR is a fully integrated severe accident code that simulates the thermal-hydraulic phenomena in steady and transient conditions and the main severe accident phenomena characterizing the RPV, the reactor cavity, the containment, and the confinement buildings typical of LWR. The MELCOR code also allows a source term estimation. was developed at Sandia Laboratories for the U.S. Nuclear Regulatory Commission to evaluate second-generation plants’ PRA (probabilistic risk assessment). MELCOR has a modular structure based on a control volume (CV) approach. Each MELCOR package simulates a different part of the transient phenomenology. In particular, the CVH and FL packages simulate the mass and energy transfer between control volumes, while the HS package simulates the thermal response of the heat structure.
The MELCOR code was developed at Sandia National Laboratories (SNL) for the US Nuclear Regulatory Commission (U.S.NRC). The Idaho National Laboratory (INL), in the frame of the Fusion Safety Program (FSP), made fusion-specific modifications to the MELCOR code, including models for water freezing; carbon, beryllium, and tungsten oxidation in steam and air environments; air condensation; and radiative heat transfer in enclosures [20]. These modifications allowed MELCOR to assess the thermal-hydraulic response of DEMO fusion reactor cooling systems and the transport of radionuclides as aerosols during accidents.
A description of the MELCOR nodalization is summarized below, focusing on the PHTS and TCR components, which are relevant for this study. Nodalization details on other systems, such as the VV or the VVPSS, are reported in [33,34].

2.2.1. PHTS Nodalization

A schematic diagram of the MELCOR model used for this accident simulation is illustrated in Figure 4. Pressurized water’s mass and enthalpy in the BZ and FW primary cooling loop were nodalized with 260 different control volumes using the MELCOR CVH package. These volumes were connected by means of flow paths using the MELCOR FL package.
The whole EU-DEMO BB was modeled with the division in three different regions simulating 1 sector, a group of 7 sectors (from sector 2 to sector 8), and a group of 8 sectors (from sector 9 to sector 16), respectively. All the PHTS main components were modeled using one-dimensional components. Each sector was modeled to investigate both inboard and outboard segment behavior during the accident sequence.
As specified in the WCLL design description document [35], water manifolds have a length of 14.0 m and 12.0 m for the BZ and FW systems, respectively. For this reason, to consider hydrostatic pressure gradients, the manifold was nodalized with four vertical control volumes linked by vertical flow paths. Each manifold feeds control volumes simulating a group of breeding units. The poloidal nodalization of both inboard and outboard segments was carried out to correctly model the poloidal distribution of plasma nuclear heating and decay heat distribution.
Inlet and outlet BB manifolds are connected to ex-vessel components located in the upper pipe chase through control volumes simulating EU DEMO feeding pipes. Inlet and outlet pipes are placed at the center of the manifolds and the top of the manifolds for outboard segments and inboard segments, respectively.
The water inventory for the in-vessel components is estimated by summing up the water inventory of feeding pipes, in-vessel manifolds, and breeding modules. The total inventory was estimated to be around 194.0 m3 and 46.4 m3 for the BZ and FW in-vessel components, respectively.
Concerning the nodalization scheme of ex-vessel PHTS components, both cold and hot ring distributors were modeled, resulting in 4 control volumes for each of the three regions. The BZ loop is connected to a pressurizer, operating at a nominal pressure of 15.5 MPa, with a total volume of 106 m3, half filled with liquid water. The FW-PHTS pressurizer has a total volume of 50 m3 and contains 25 m3 of liquid water. The pressurizers were equipped with safety relief valves discharging in a suitable suppression tank to avoid overpressure in the BZ channels. The total water inventory for the modeled ex-vessel components is around 352 m3 for the BZ loop and 155 m3 for the FW loop.

2.2.2. Tokamak Building Nodalization

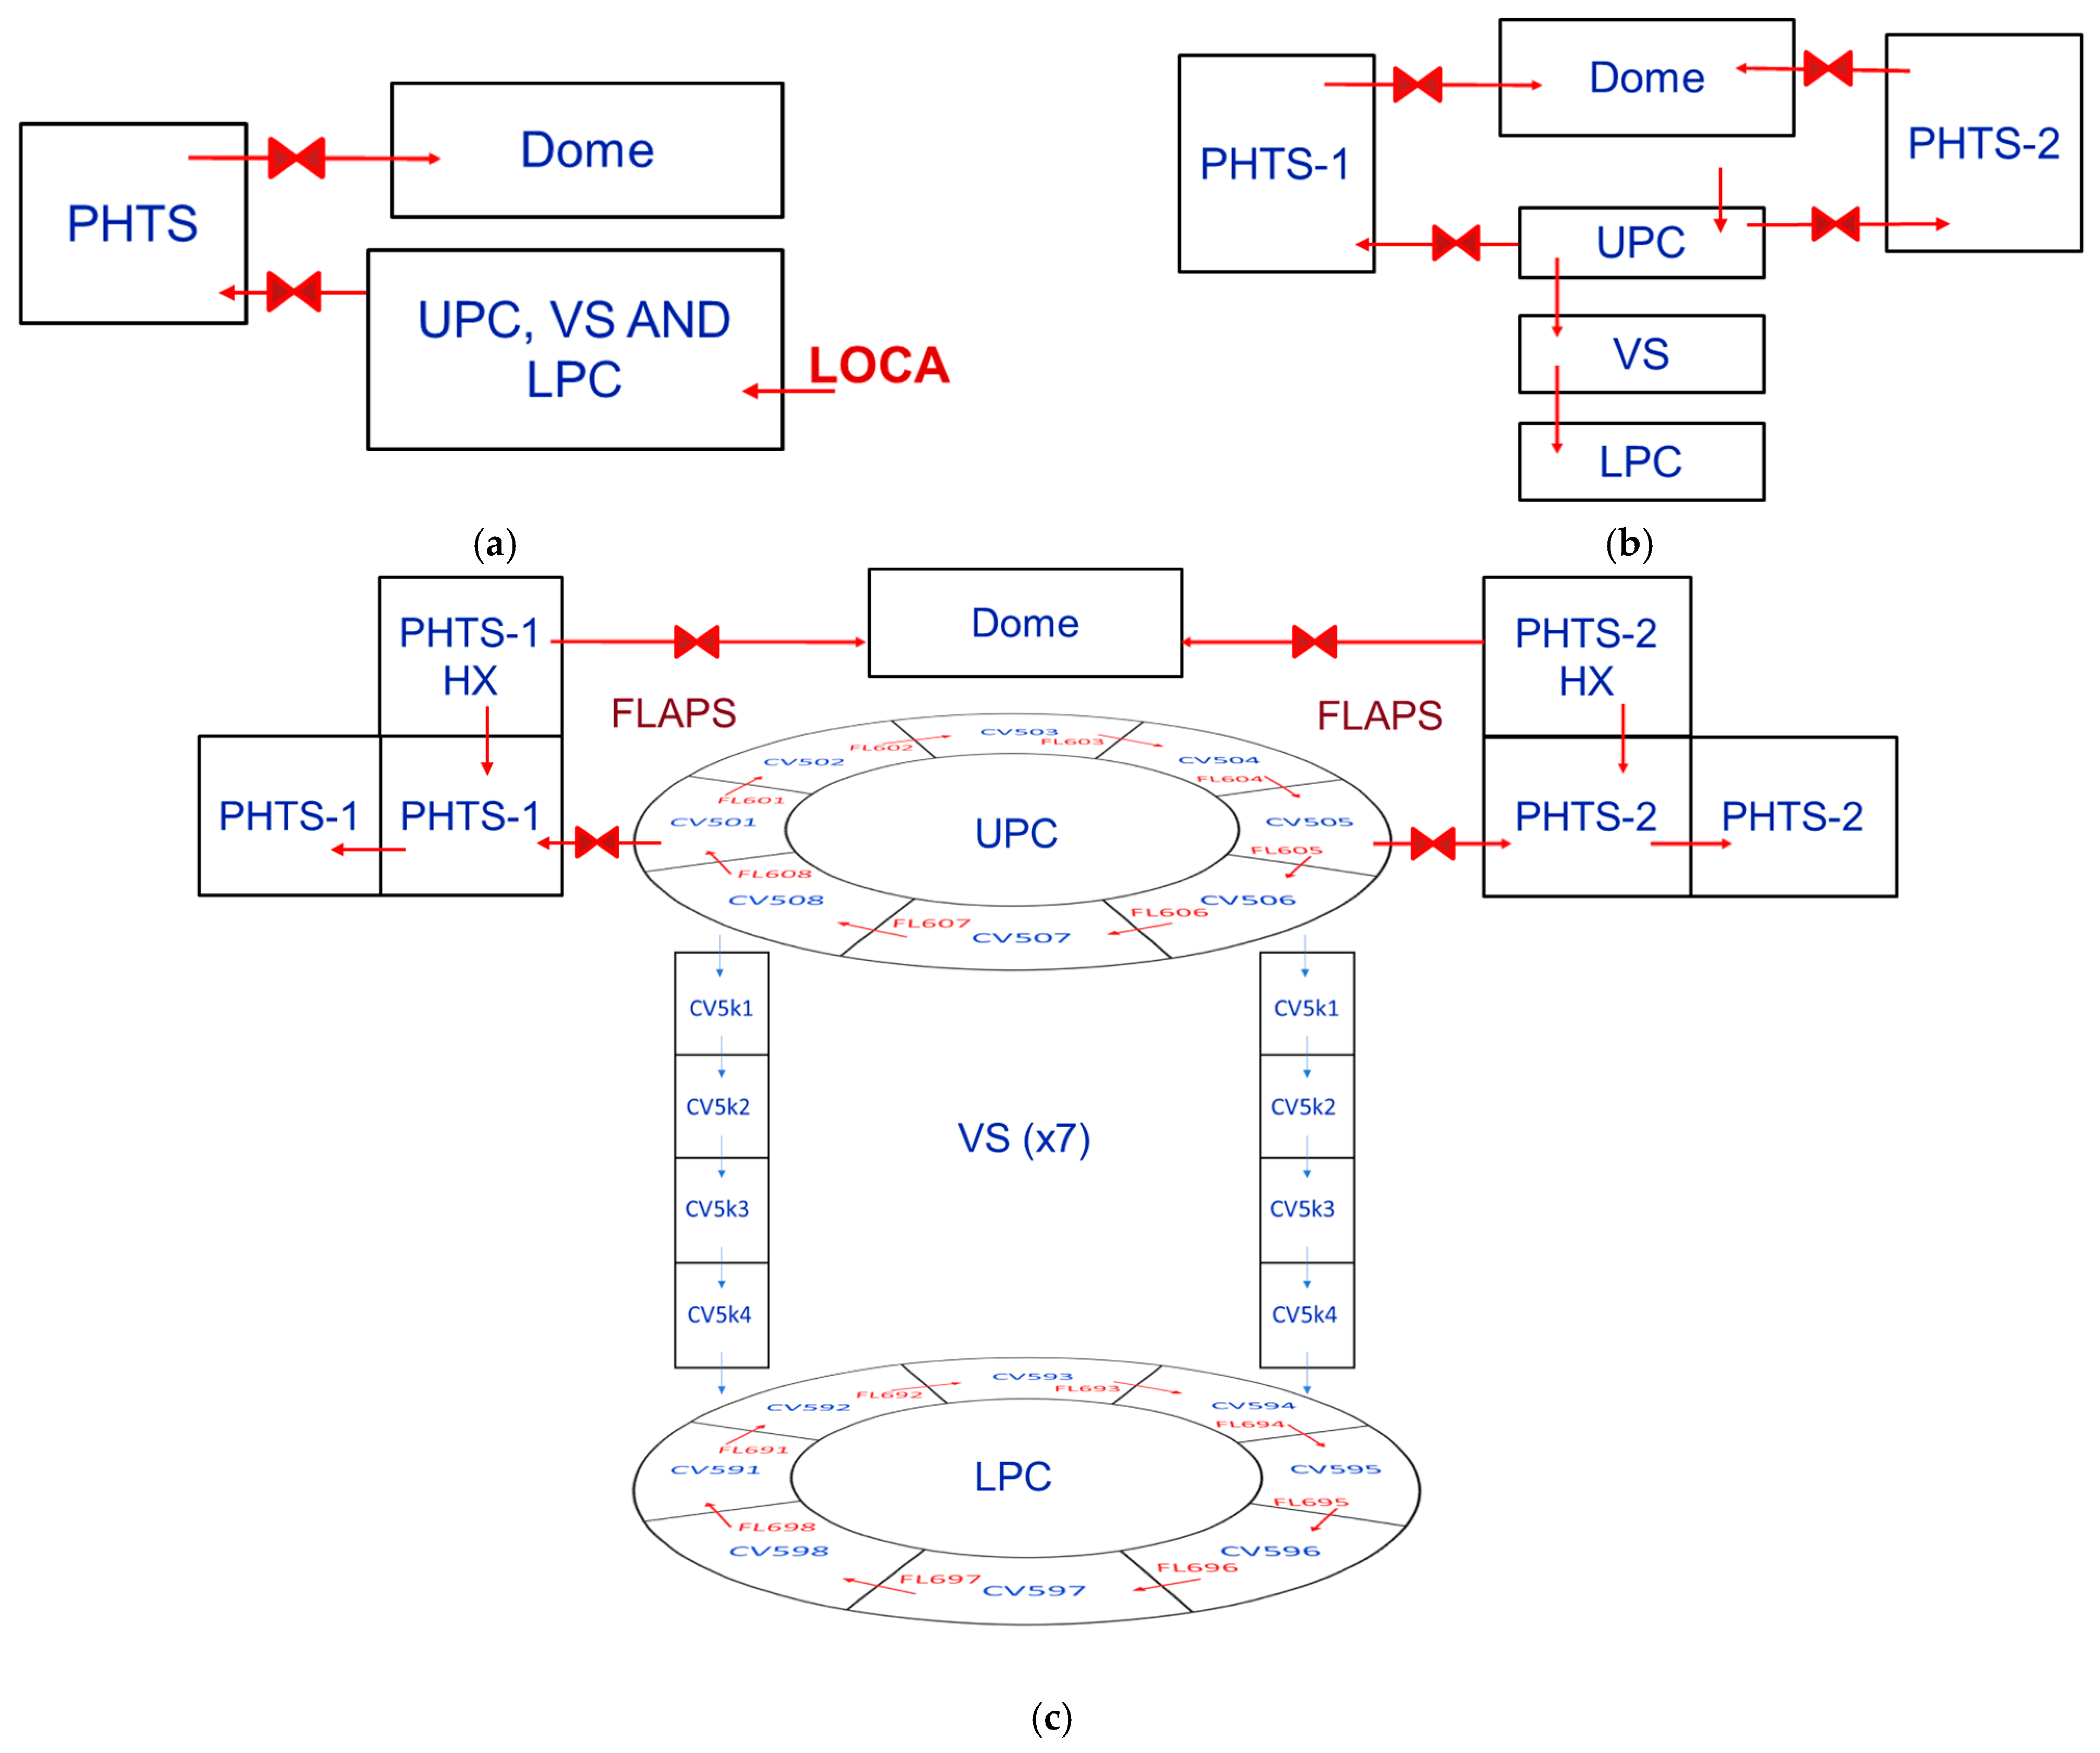
Three different MELCOR nodalizations were investigated for this accident analysis. By gradually increasing the complexity of the nodalization scheme, ex-vessel LOCA results were compared for three different MELCOR models. The different nodalization approaches are illustrated in Figure 5.
PHTS volume is made available by opening a relief panel with the UPC. The TMH is also made available by opening a connection with the PHTS area. The LOCA is assumed to occur in the upper pipe chase in all the different cases.
Only UPC, VS, and LPC are connected in the current design phase, forming a total free volume available for steam expansion of 17,542 m3 [32]. The connection between the UPC and LPC is realized by seven vertical shafts having an opening flow area of around 12.0 m2 [31]. Since the volume of the equipment hosted in shafts is not entirely defined, it was assumed that around 50% of the total flow area is obstructed [36]. Thus, a single VS flow area was assumed to be around 6.0 m2.
In Case 1, the upper and lower pipe chases and vertical shafts were modeled using a lumped volume node of 17,542 m3. The same approach was adopted for the PHTS vault area and the top maintenance hall, which were modeled with single volumes of 49,775 m3 and 205,597 m3.
In Case 2 the upper and lower pipe chases and vertical shafts were modeled with three different control volumes, the dimensions of which are illustrated in Figure 2. The PHTS area, housing cooling pipes, heat exchangers, and pressurizers of the power conversion system (highlighted in blue in Figure 2 and Figure 3a) were assumed to be divided two separate compartments by separating walls. For this reason, the PHTS area was modeled with two different CVs of 24,887.5 m3.
For Case 3, a detailed model was developed. The annular regions of both UPC and LPC were modeled with 8 different control volumes and associated flow paths. Seven UPC control volumes are connected with a CV simulating the Vertical Shaft (CV5k1). Each VS was modeled with 4 CVs, connected by vertical flow paths, having a cross-sectional area of 20.24 m2, for a total of 28 CVs. The bottom VS volume (CV5k4) is then connected with the associated CV simulating the lower pipe chase (CV591 to CV598). Also in this case, the PHTS area were assumed to be divided into two separate compartments. Each of these two compartments was modeled by 3 CVs, for a total of 6 CVs. The TMH and dome were modeled with a single control volume. In particular, the EU DEMO WCLL containment was modeled in detail with 51 control volumes and associated junctions.
The structure of the Tokamak building can absorb heat from gases and steam released during accidents and therefore affect the pressure within the affected areas and the consequential releases. Moreover, they can offer surfaces for aerosols and radioactive contaminants deposition. The heat structures of equipment placed in the TCR have not been included in the model.
The heat structure modeled are the walls, ceiling, and floors of all the main rooms (UPC, LPC PHTS vault, and TMH) and the walls of the vertical shafts. In case 3, each control volume is associated with the corresponding wall, ceiling, and floor. Those HS were lumped in Case 1 and Case 2, conserving the total heat transfer surface and HS volume. The data needed to model the HS were computed using the Tokamak building CAD model [31].

2.2.3. Modelling Ventilation Flows, Leakage Flows, and Pressure Relief Paths

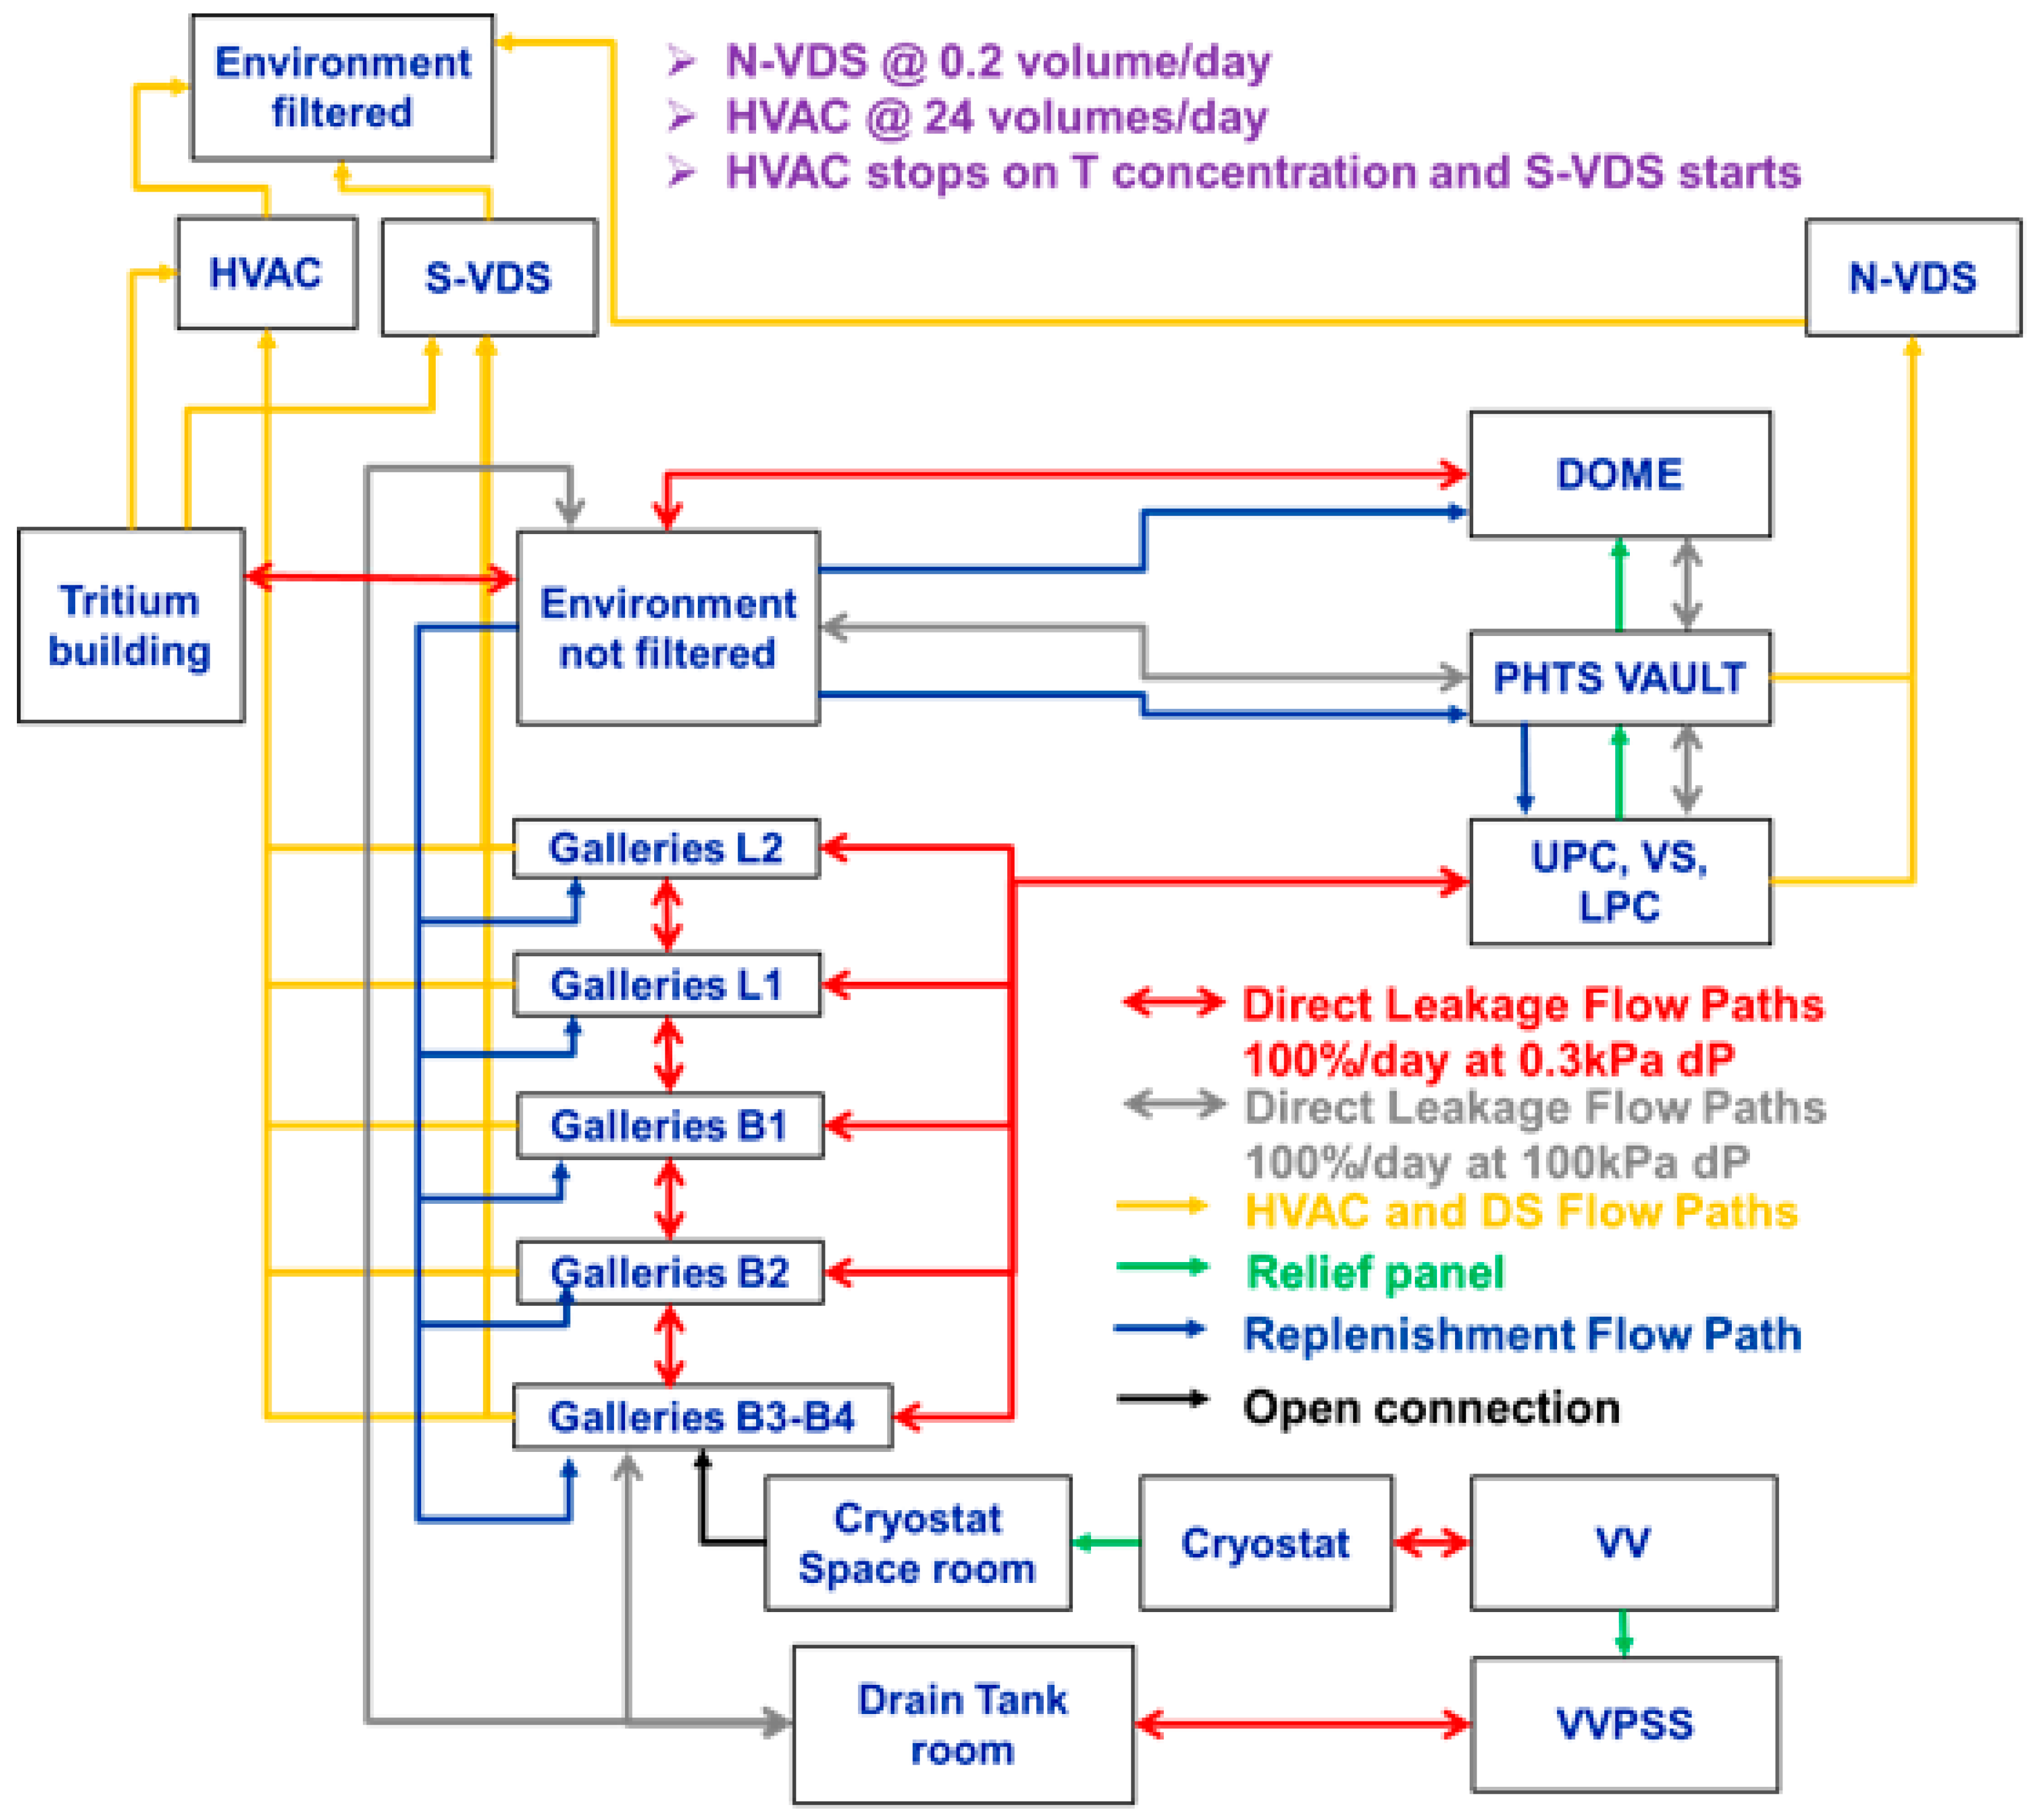
The MELCOR model also includes several flow paths and control functions (CF) to simulate dynamic confinement systems and leakages. A scheme of the model is illustrated in Figure 6.
Heat ventilation and air conditioning (HVAC) is assumed to extract flow from the galleries at a rate of 1 air change per hour. The HVAC is isolated within 30.0 s and is replaced by the stand-by venting detritiation system (S-VDS), which is assumed to be triggered 5 min after the isolation of HVAC [36]. The model includes control functions to simulate the isolation logic of the HVAC flow due to a loss of site power or to a high level of contamination in the galleries.
It was assumed that the normal venting detritiation system (N-VDS) extracts flow from the PHTS vault and UPC at 0.2 air change per day, as specified in [36]. The model includes control logic to represent the availability of the N-VD system, considering LOOP, restoration of Class III power, and pressure and temperature limits. HVAC and detritiation system flows are depicted in yellow in Figure 6.
Four different control volumes are used to represent the external environment. These volumes are modeled so that unfiltered leakages, HVAC releases, and detritiation systems releases can be monitored individually within the model results. The HVAC filtering efficiency of dust and ACP was assumed to be 99.9%, while the efficiency for tritium was assumed to be 99% [36].
Several flow paths (blue lines in Figure 6) were modeled to replenish the air the HVAC and S-VD systems removed with clean air from the environment.
Five different control volumes were used to model the different gallery levels. Galleries are served by HVAC and S-VD. Five different FL placed at different axial levels evaluate leakages from VS to galleries. Direct leakages can also occur between different gallery levels (see Figure 6).
Unfiltered leakage flow into the environment can occur from the PHTS area, TMH, and galleries. The leak rates were modeled as specified in the EU-DEMO SDL [36], with a leak rate law having a square root dependence on the pressure. Gallery volumes and heat structures data were taken from the SDL [36].
The entire MELCOR model of the Tokamak building, including the nodalization of Case 3 and the dynamic confinement model, consists of 61 control volumes, 124 flow paths, 113 heat structures, and more than 550 control functions.

2.2.4. Vacuum Vessel model

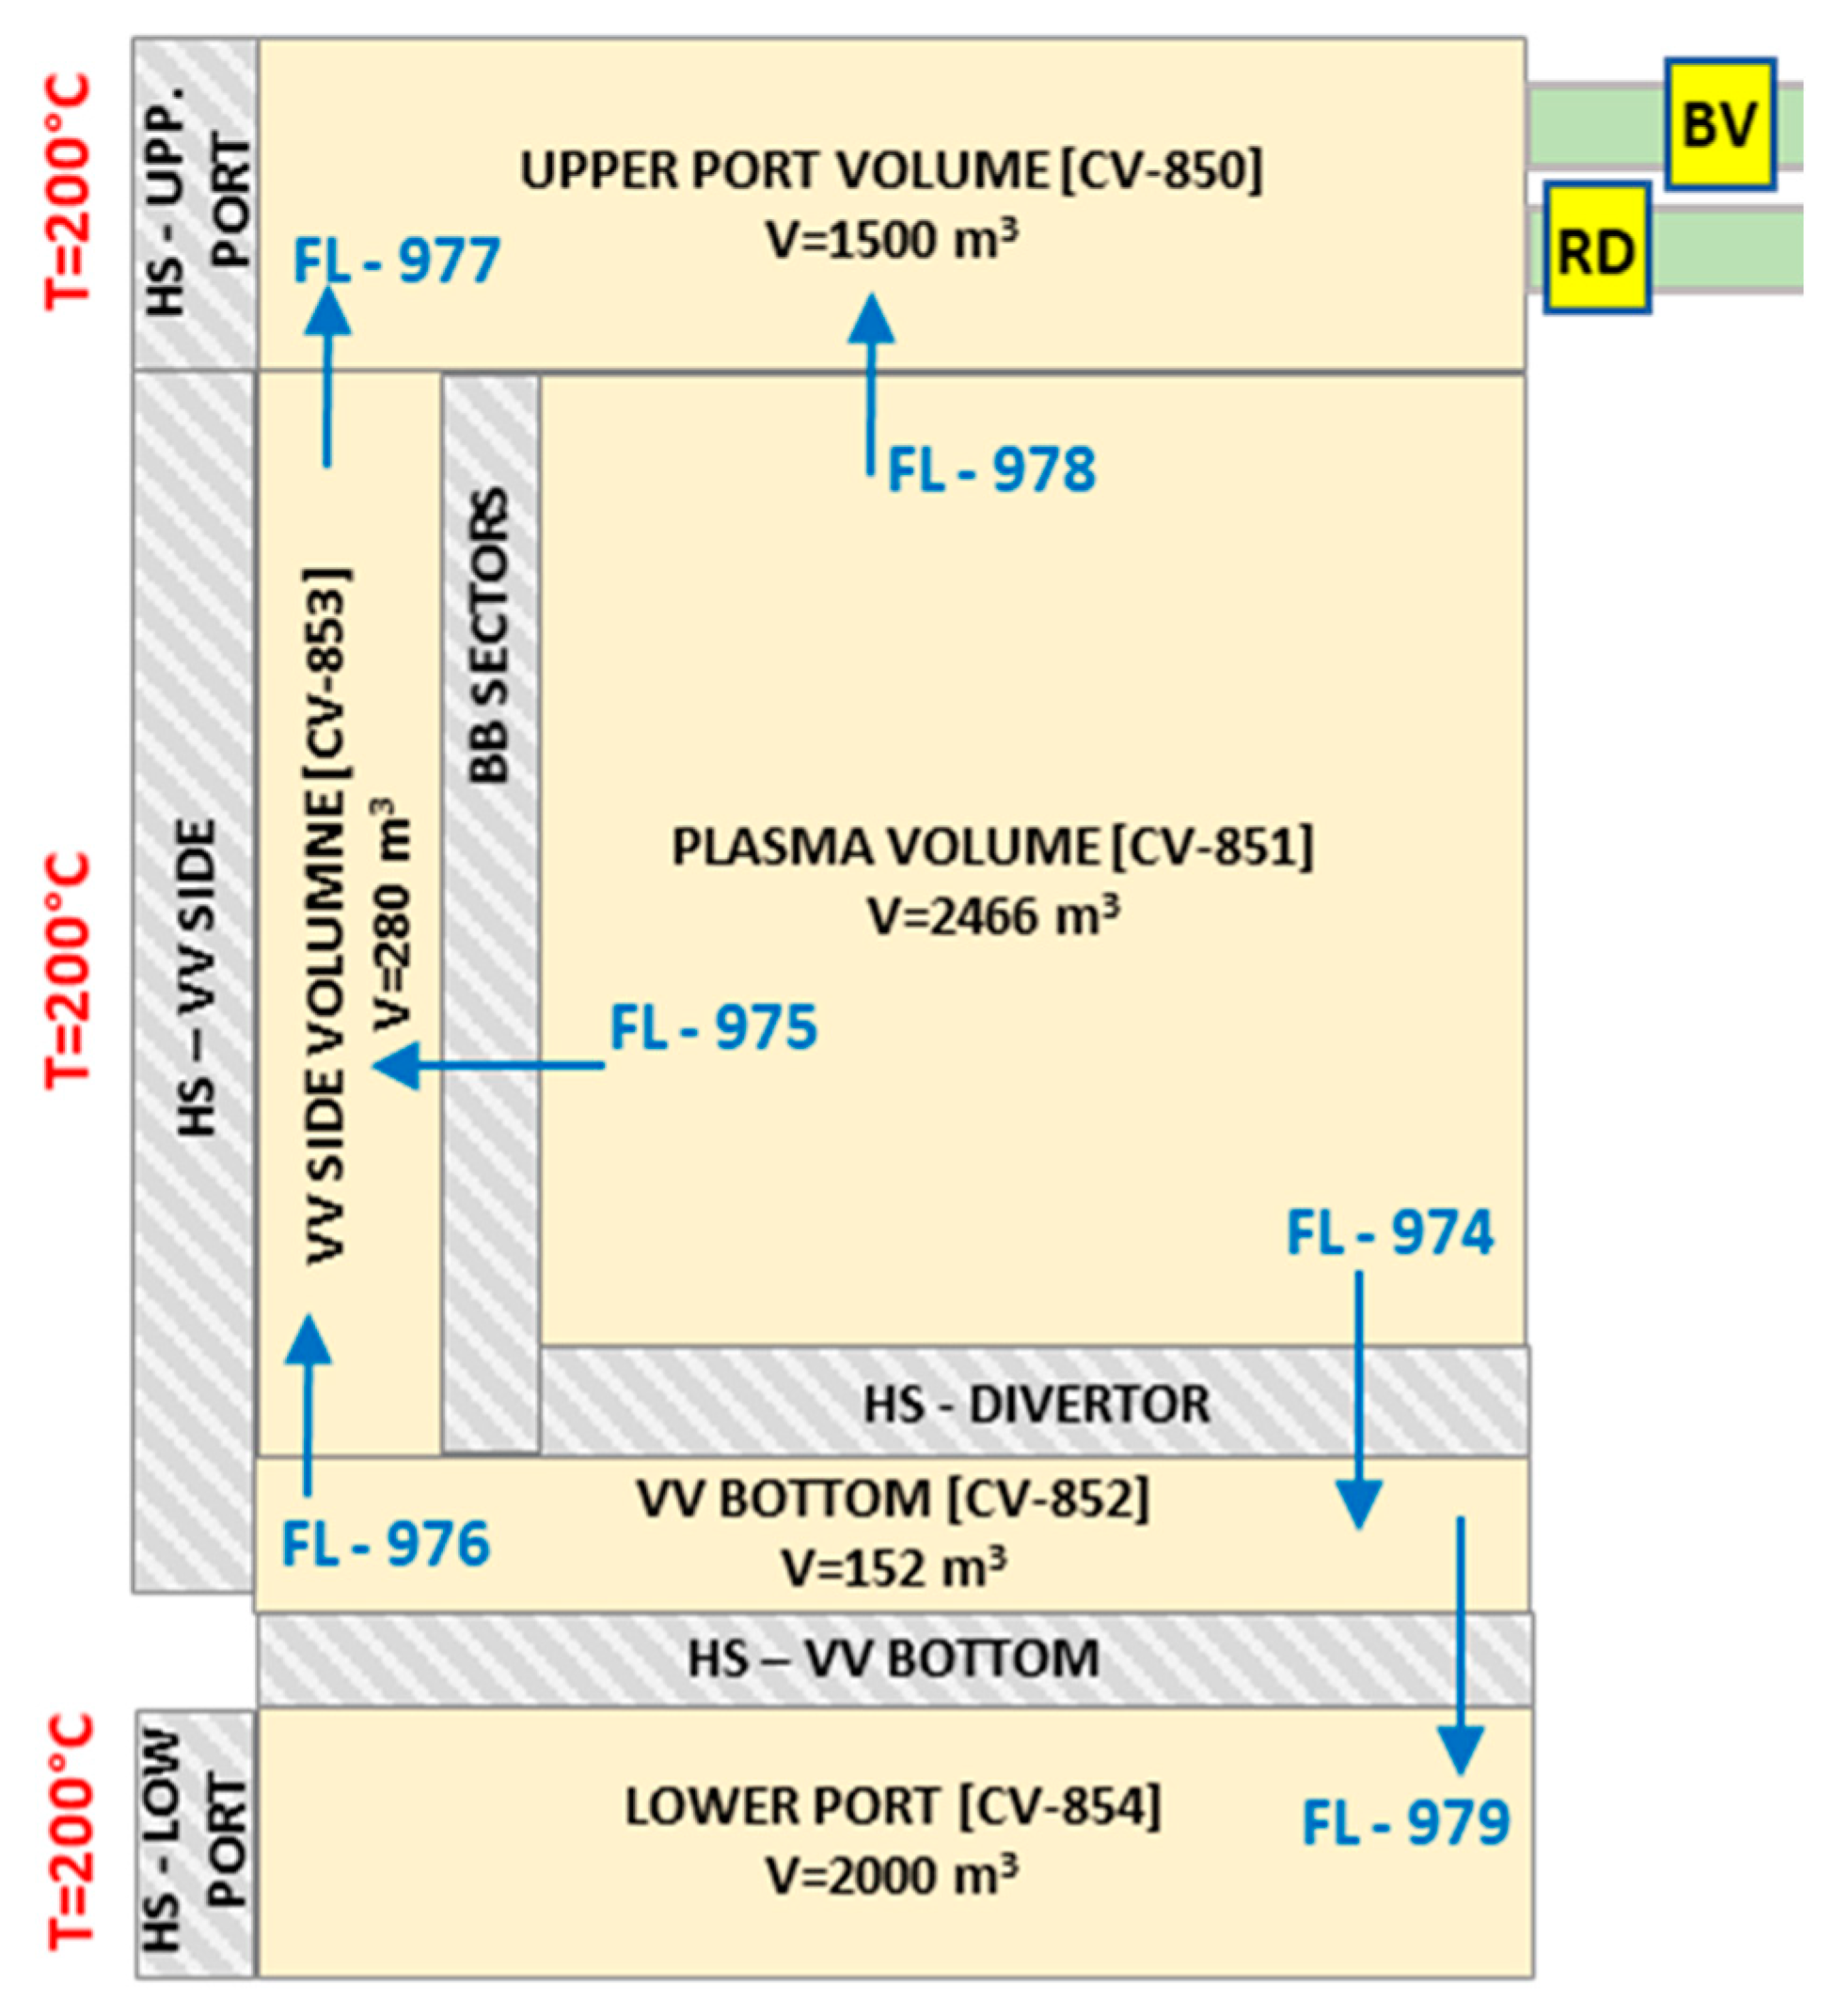
As shown in Figure 7, the EU-DEMO vacuum vessel free volume was modeled with four CV simulating:
  • Plasma chamber (vol. 2466 m3);
  • Upper port (vol. 1500 m3);
  • The volume between the divertor and the VV structure (vol. 30 m3);
  • the volume between the back of BB modules and VV structure (vol. 2400 m3).
Data related to volumes were taken from [32]. Connections paths and flow areas between these volumes were estimated from the CAD model in [31]. Plasma volume (CV851) is connected to CV852 and CV853 through divertor cassettes holes and breeding blanket interspaces (20 mm).

2.3. Main Assumption and Accident Description

Based on the last EU DEMO WCLL design concept, the ex-vessel PHTS systems are located outside the bioshield wall, inside the UPC and PHTS vault area of the Tokamak building [29]. In the case of an ex-vessel LOCA, high-enthalpy fluids are released into the building. The pressure peak after ex-vessel pipe breaks is required to be below 2 bar to demonstrate that this is acceptable from a safety standpoint [36].
The PIE analyzed is a double guillotine break of a FW-PHTS distributor ring in the UPC for a total break area of around 0.14 m2. The main goal was to estimate the ultimate pressurization of the Tokamak building compartments and quantify the plant’s potential radioactive releases.
The fundamental difference between in-vessel and ex-vessel loss of coolant is that the mobilized radioactive inventory does not include the large in-vessel tritium and dust source terms during ex-vessel LOCA scenarios as long as the in-vessel components stay intact. However, during an ex-vessel event, the plasma burn is not inherently terminated at the state of the event. For this reason, a shutdown system is required to trigger off the plasma, avoiding further failures of plasma-facing components. In the current analysis, the fusion power termination system acts on a signal from a pressure sensor in the vault or primary cooling system and terminates plasma burn in three seconds.
The loss of site power has not been assumed, and the VV-DHRS is in operation for the entire transient to focus the analysis on the building. As a result, no tritium and tungsten dust will be released inside the building; however, HTO and ACP inside the PHTS are released in the building after the initiating event. The total inventory of ACP and HTO in the FW-PHTS is taken from the EU-DEMO SDL [36].

3. Discussion and Results

3.1. Normal Operating State during Plasma Pulse

A 2000.0 s stationary period run was simulated to reproduce loop parameters before the postulated initiating event (PIE) occurrence. In Table 1, the comparison of MELCOR estimated values with the design data is reported. The loop mass flow rate is well controlled, with a maximum deviation of only 0.98%. Heat power removal in the steam generator controls the water temperature at the blanket inlet. Pressure at the pressurizer is at 15.5 MPa. The pressure drops of the blanket components are adjusted by the friction coefficient and roughness in the FL to achieve the defined blanket pressure drop of 9.535 bar for BZ PHTS and 8.434 bar for FW-PHTS. The pump head was imposed in MELCOR using the quick-CF pump model.
Regarding the initial boundary conditions of the Tokamak building, the HS initial temperatures are set to 310 K. The Tokamak building pressure is not a set boundary condition. However, it is regulated by the active ventilation and detritiation systems which keep the building below the atmospheric pressure.

3.2. Loss-of-Coolant Accident from FW-PHTS: Nodalization Sensitivity

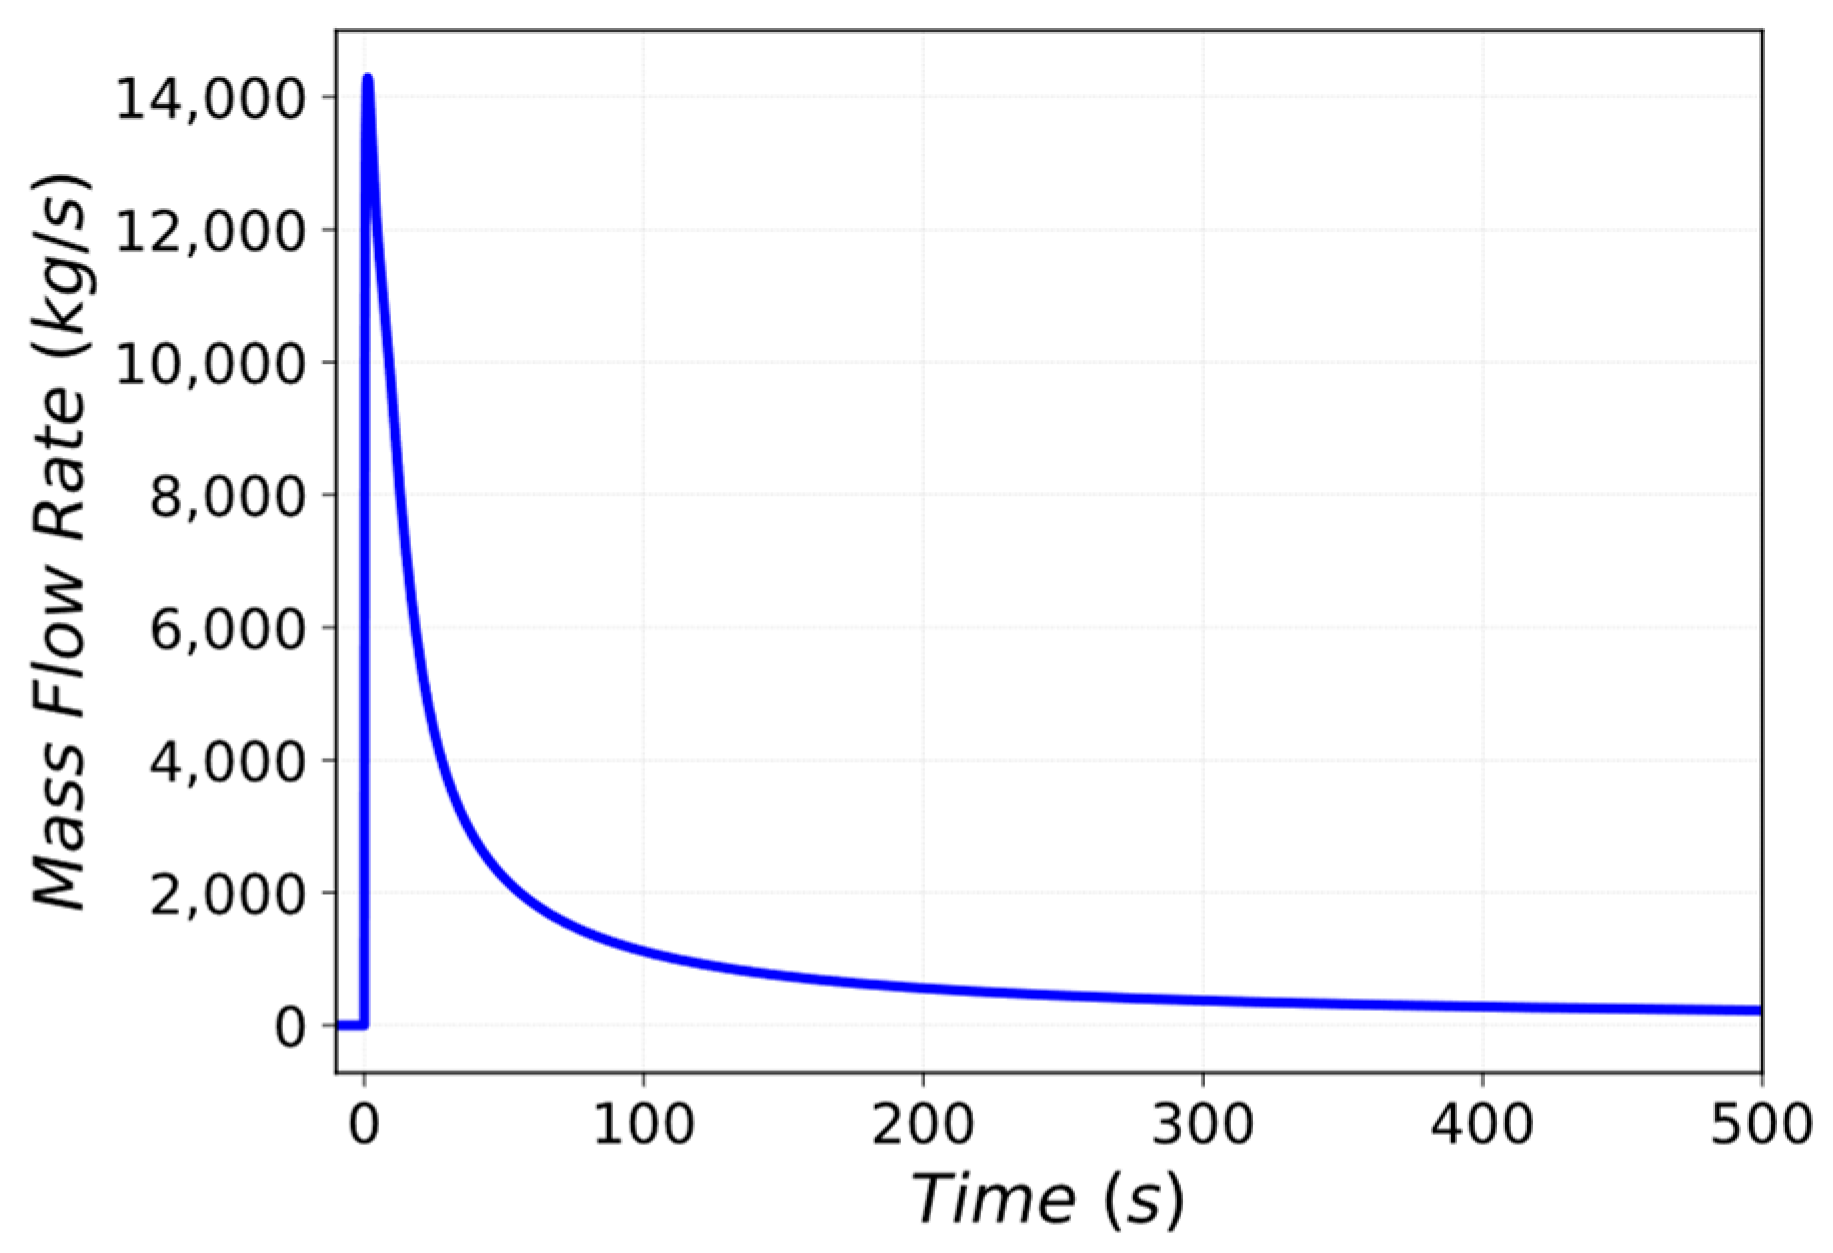
At the onset of the accident (time of 0.0 s), a double-ended guillotine break is assumed to occur by opening a flow connection of around 0.14 m2 between the FW-PHTS and the UPC. Coolant is discharged at a large rate into the UPC (maximum flow rate of 14,000.0 kg/s) and then gradually decreases due to the PHTS blowdown. Figure 8 illustrates the mass flow rate variations at the break as a function of accident time. As highlighted in Figure 9, more than 110 tons of water are released inside the UPC.
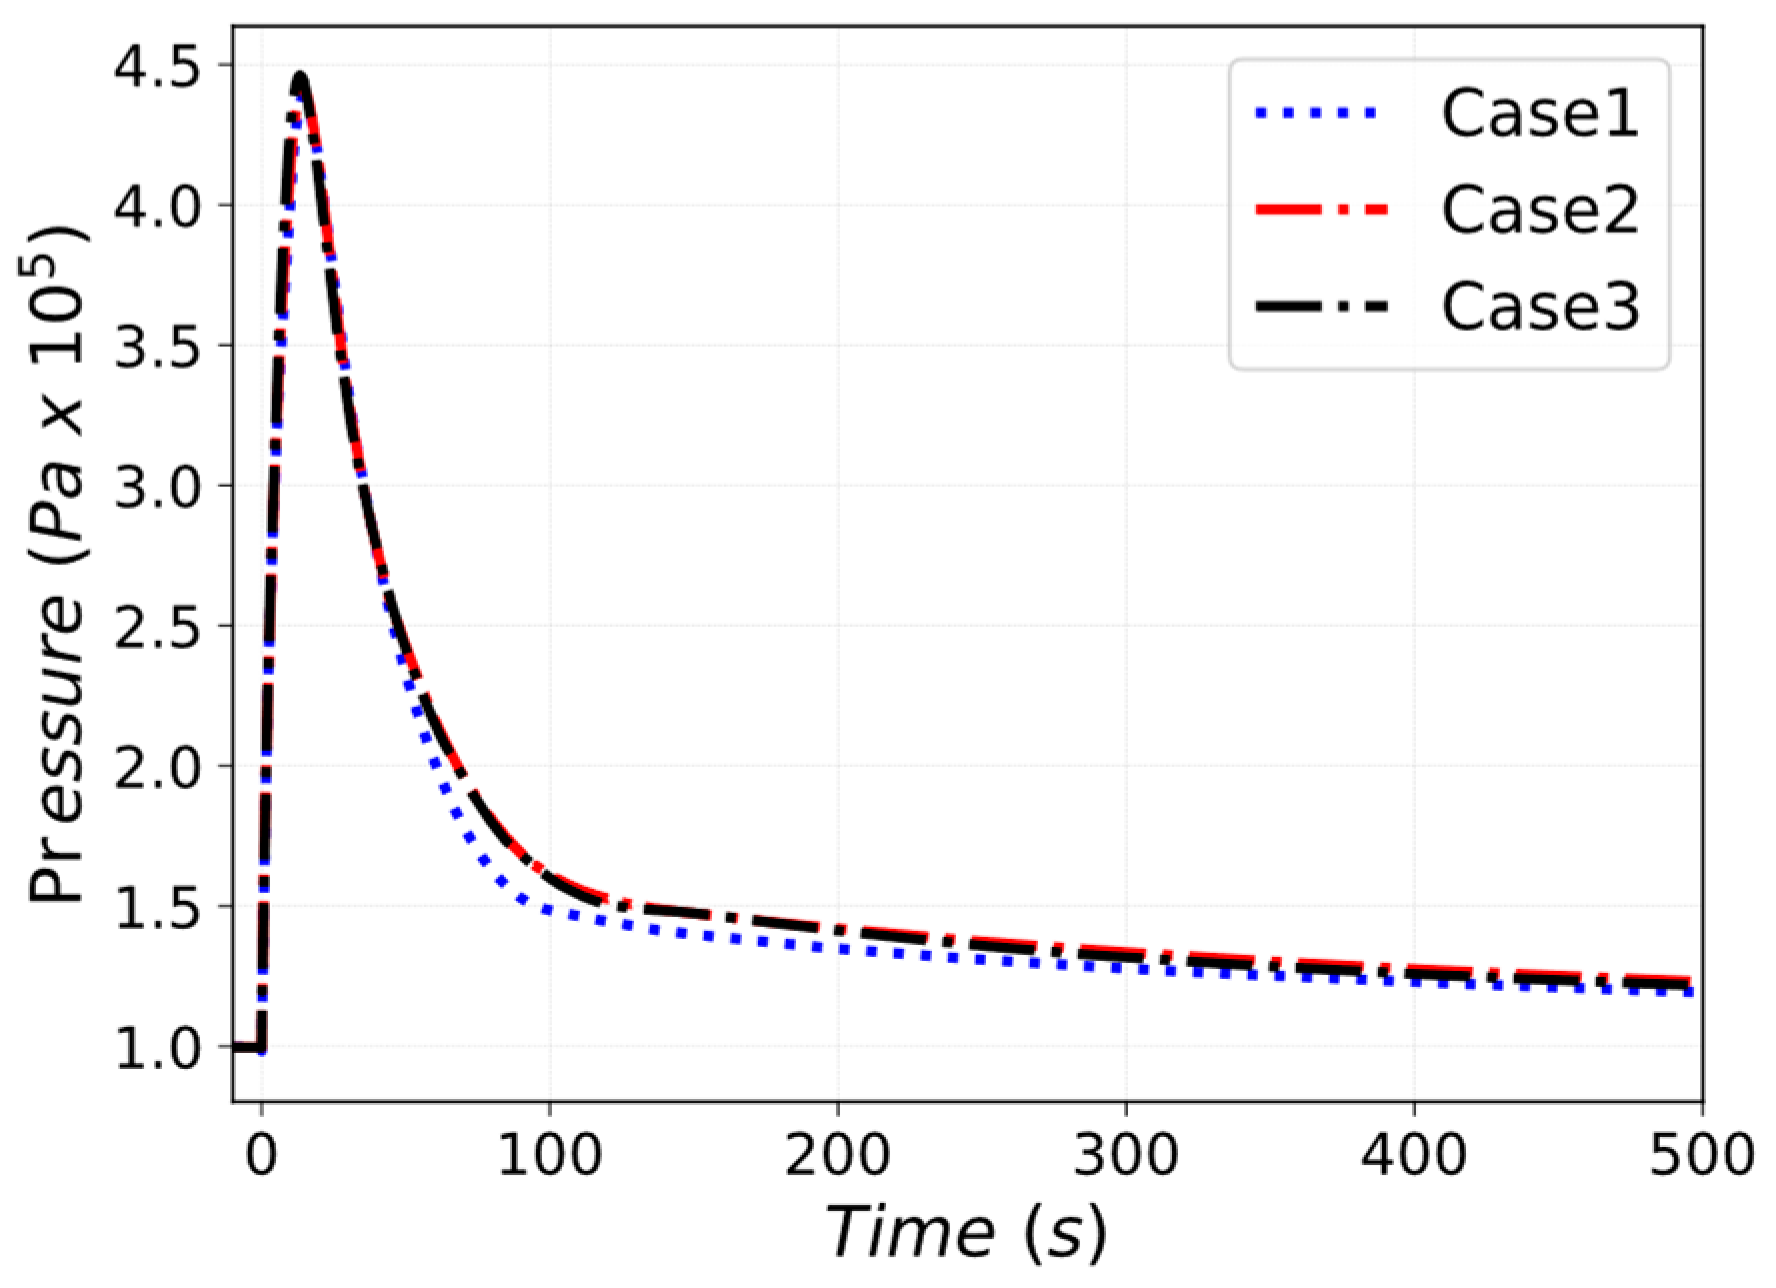
In Figure 10, the pressure waveform in the UPC volume is depicted for the three different cases. The maximum absolute pressure is around 4.4 bar. The nodalization detail of CVs slightly affects the depressurization trend. In Case 1, in which UPC, VS, and LPC heat structures are modeled with three lumped HSs (wall, floor, and ceiling), the depressurization trend calculated by MELCOR is lower than in the two other cases. This is mainly due to the interaction between the control volumes and the associated heat structures. Case 3, which has a complete and detailed nodalization of the UPC, VS and LPC, simulates the highest-pressure trend similar to the pressure trend of Case 2.
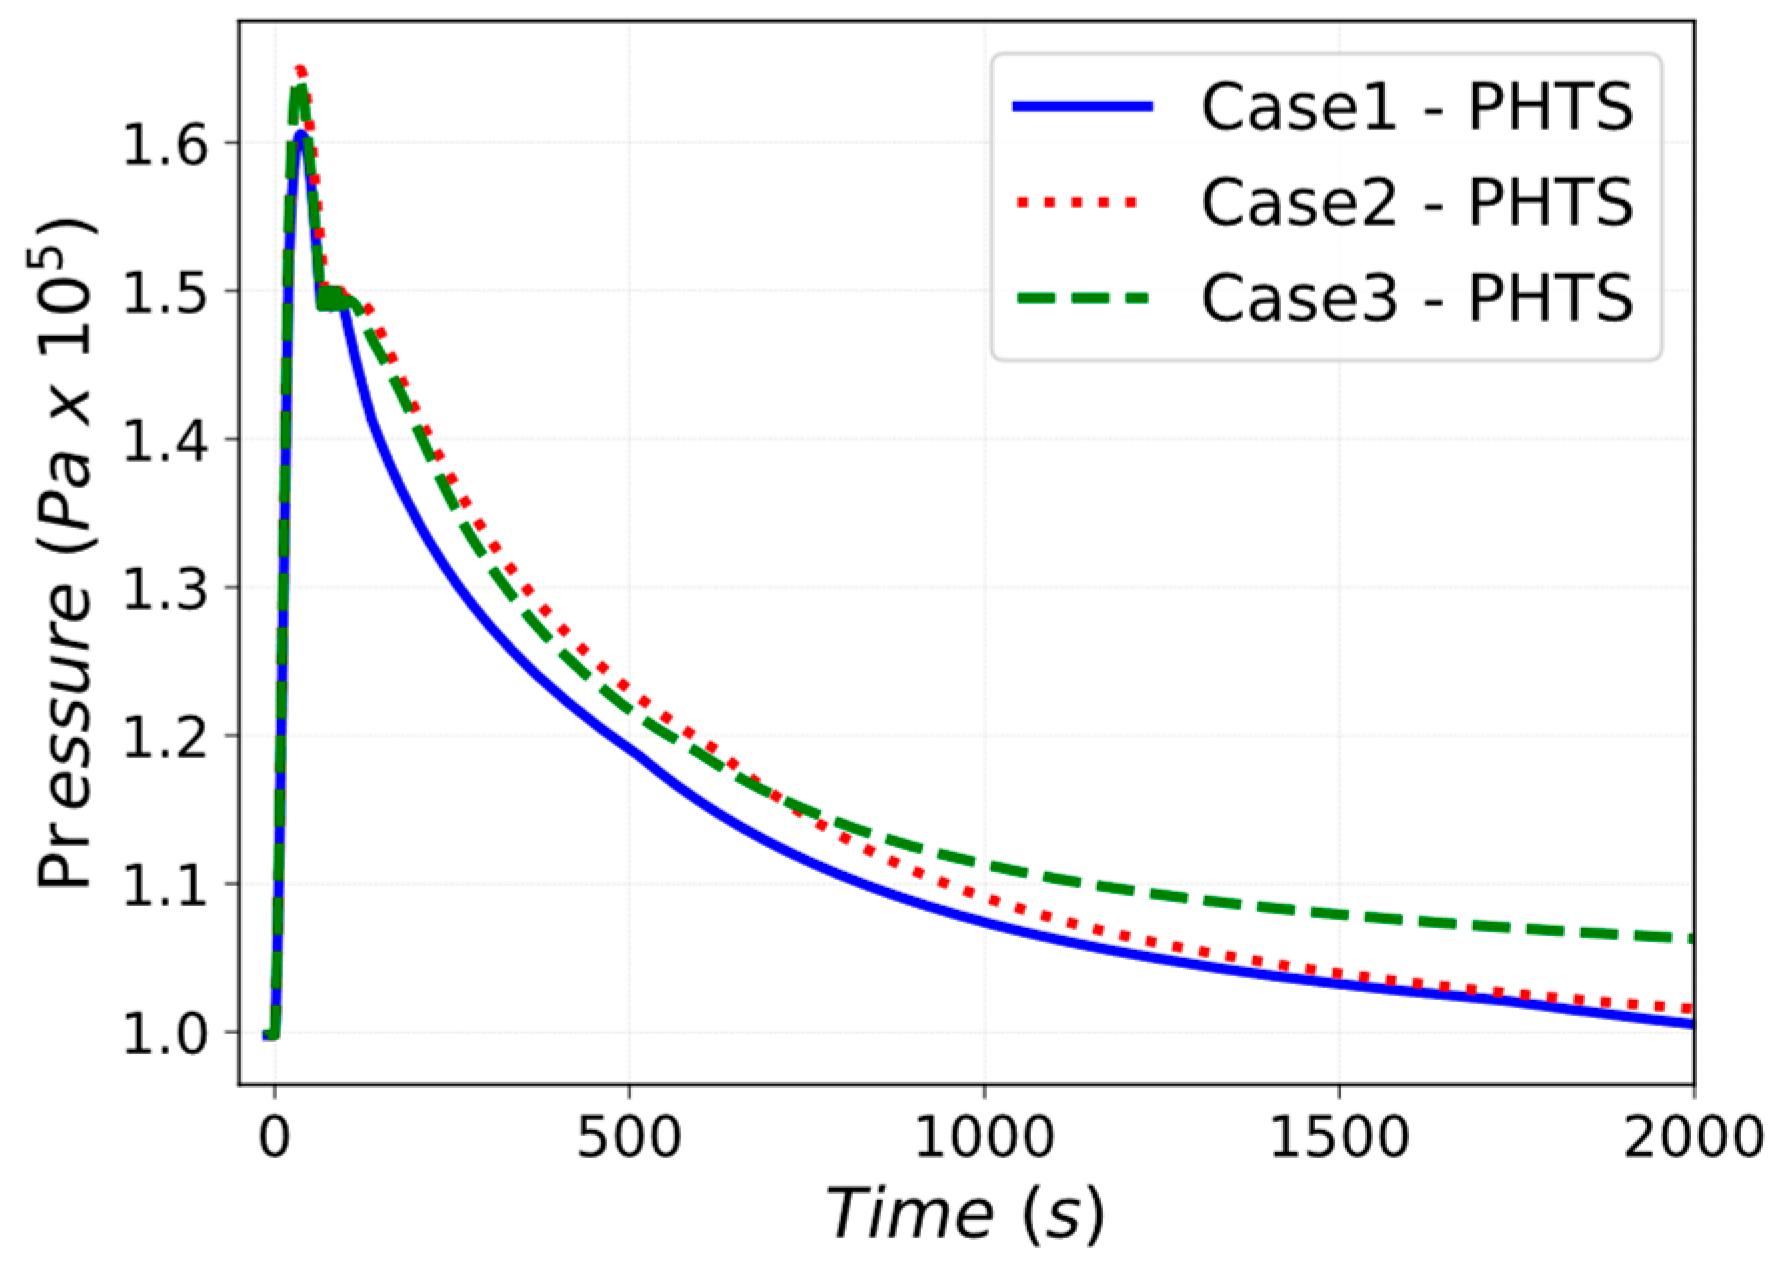
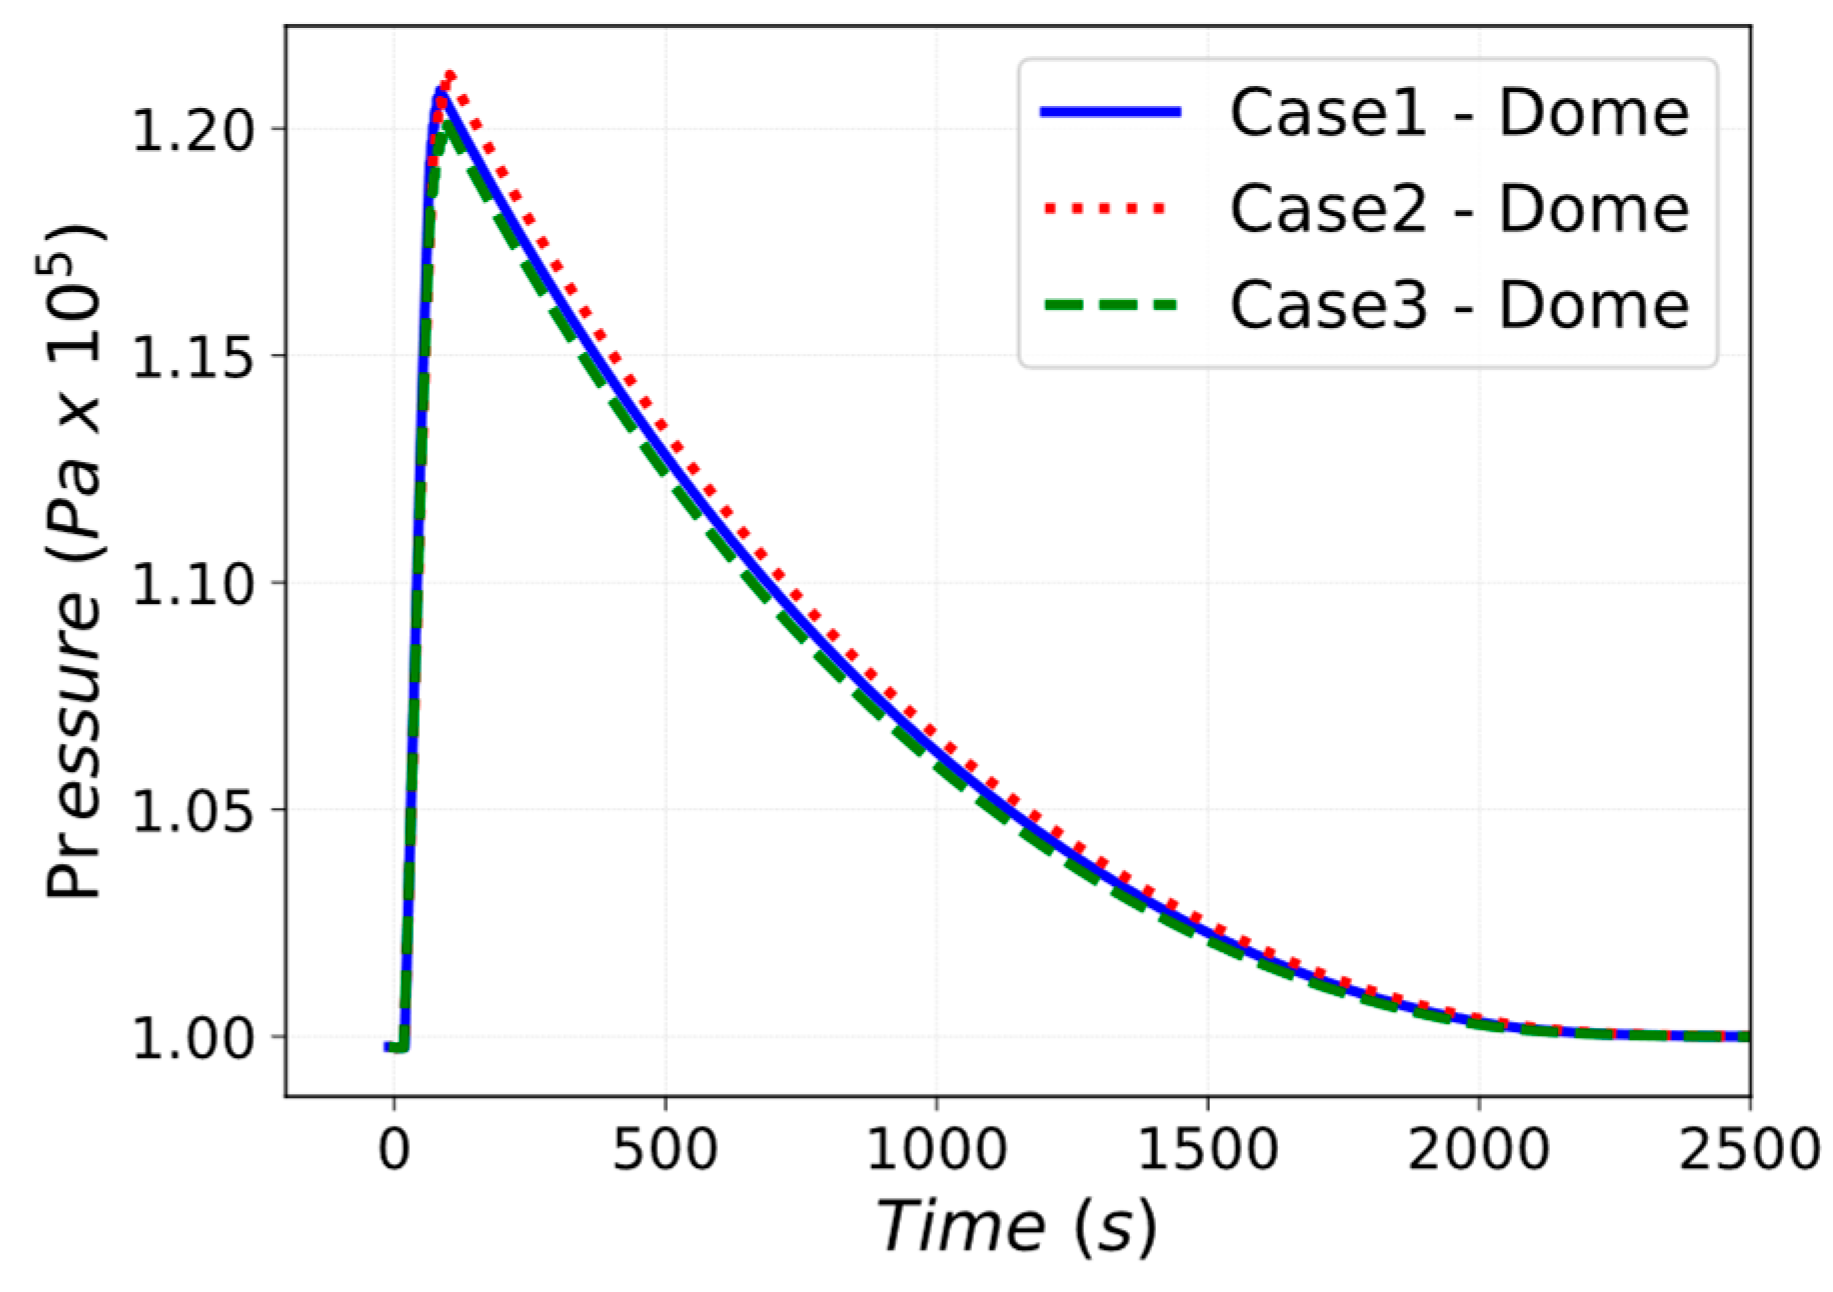
As described in Section 2, the UPC is connected with the PHTS area through relief panels. In the current baseline design, two relief panels of 0.5 m2 are opened if the pressure in the UPC is higher than 120 kPa. If the pressure in the PHTS vault is higher than 150 kPa, four relief panels of 0.5 m2 open toward the TMH. The pressure value of 120 kPa in the UPC is reached in around 10 s for all three cases, and a total amount of 25 tons of steam are released in the PHTS vault. As the two relief panels open, the PHTS vault begins to pressurize, allowing unfiltered releases toward the environment. Pressure in the PHTS vaults reaches the 150 kPa setpoint opening of the relief panels at around 18 s, allowing the TMH to be available for steam expansion. Pressure waveforms of the PHTS vault and TMH are illustrated in Figure 11 and Figure 12, the main values are reported in Table 2.
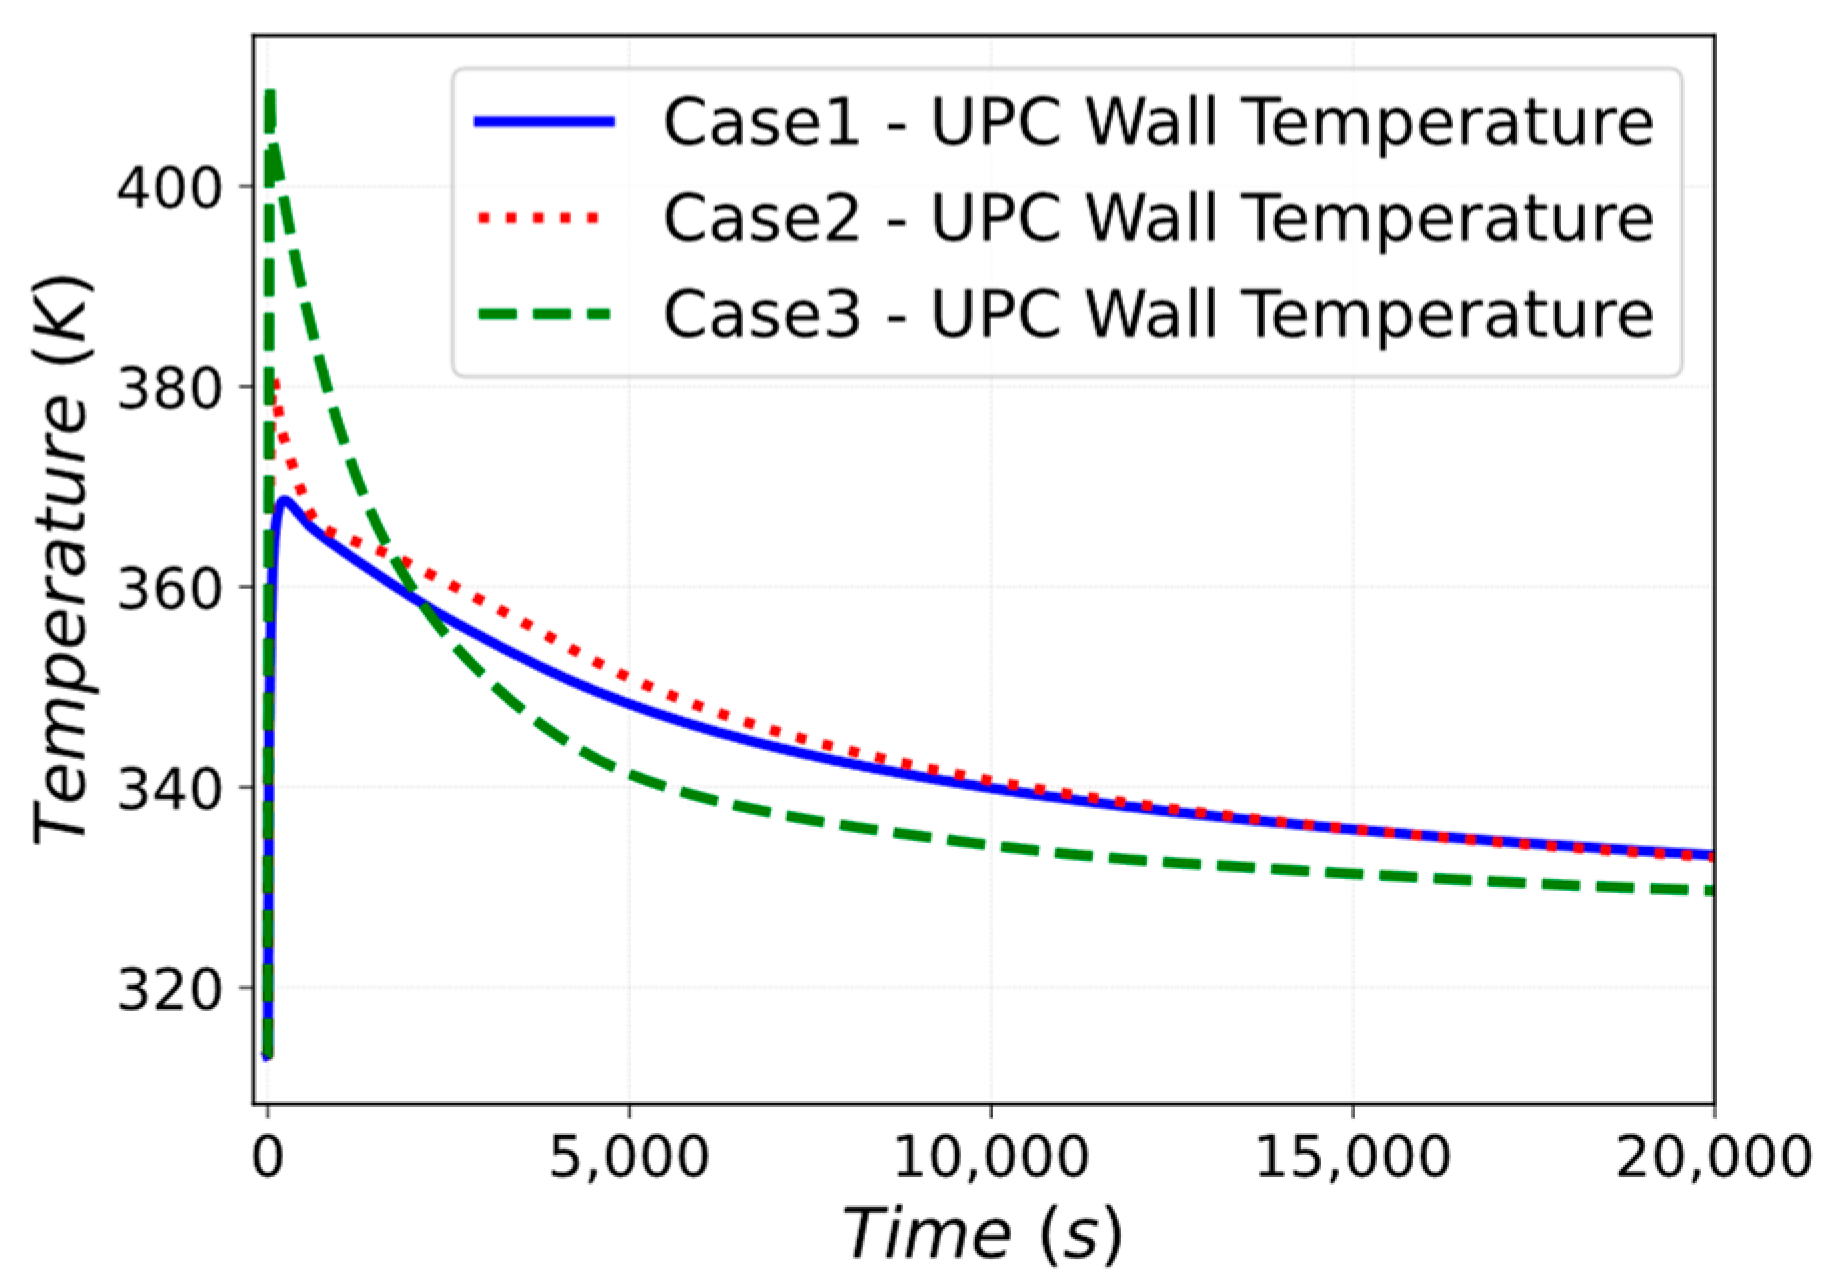
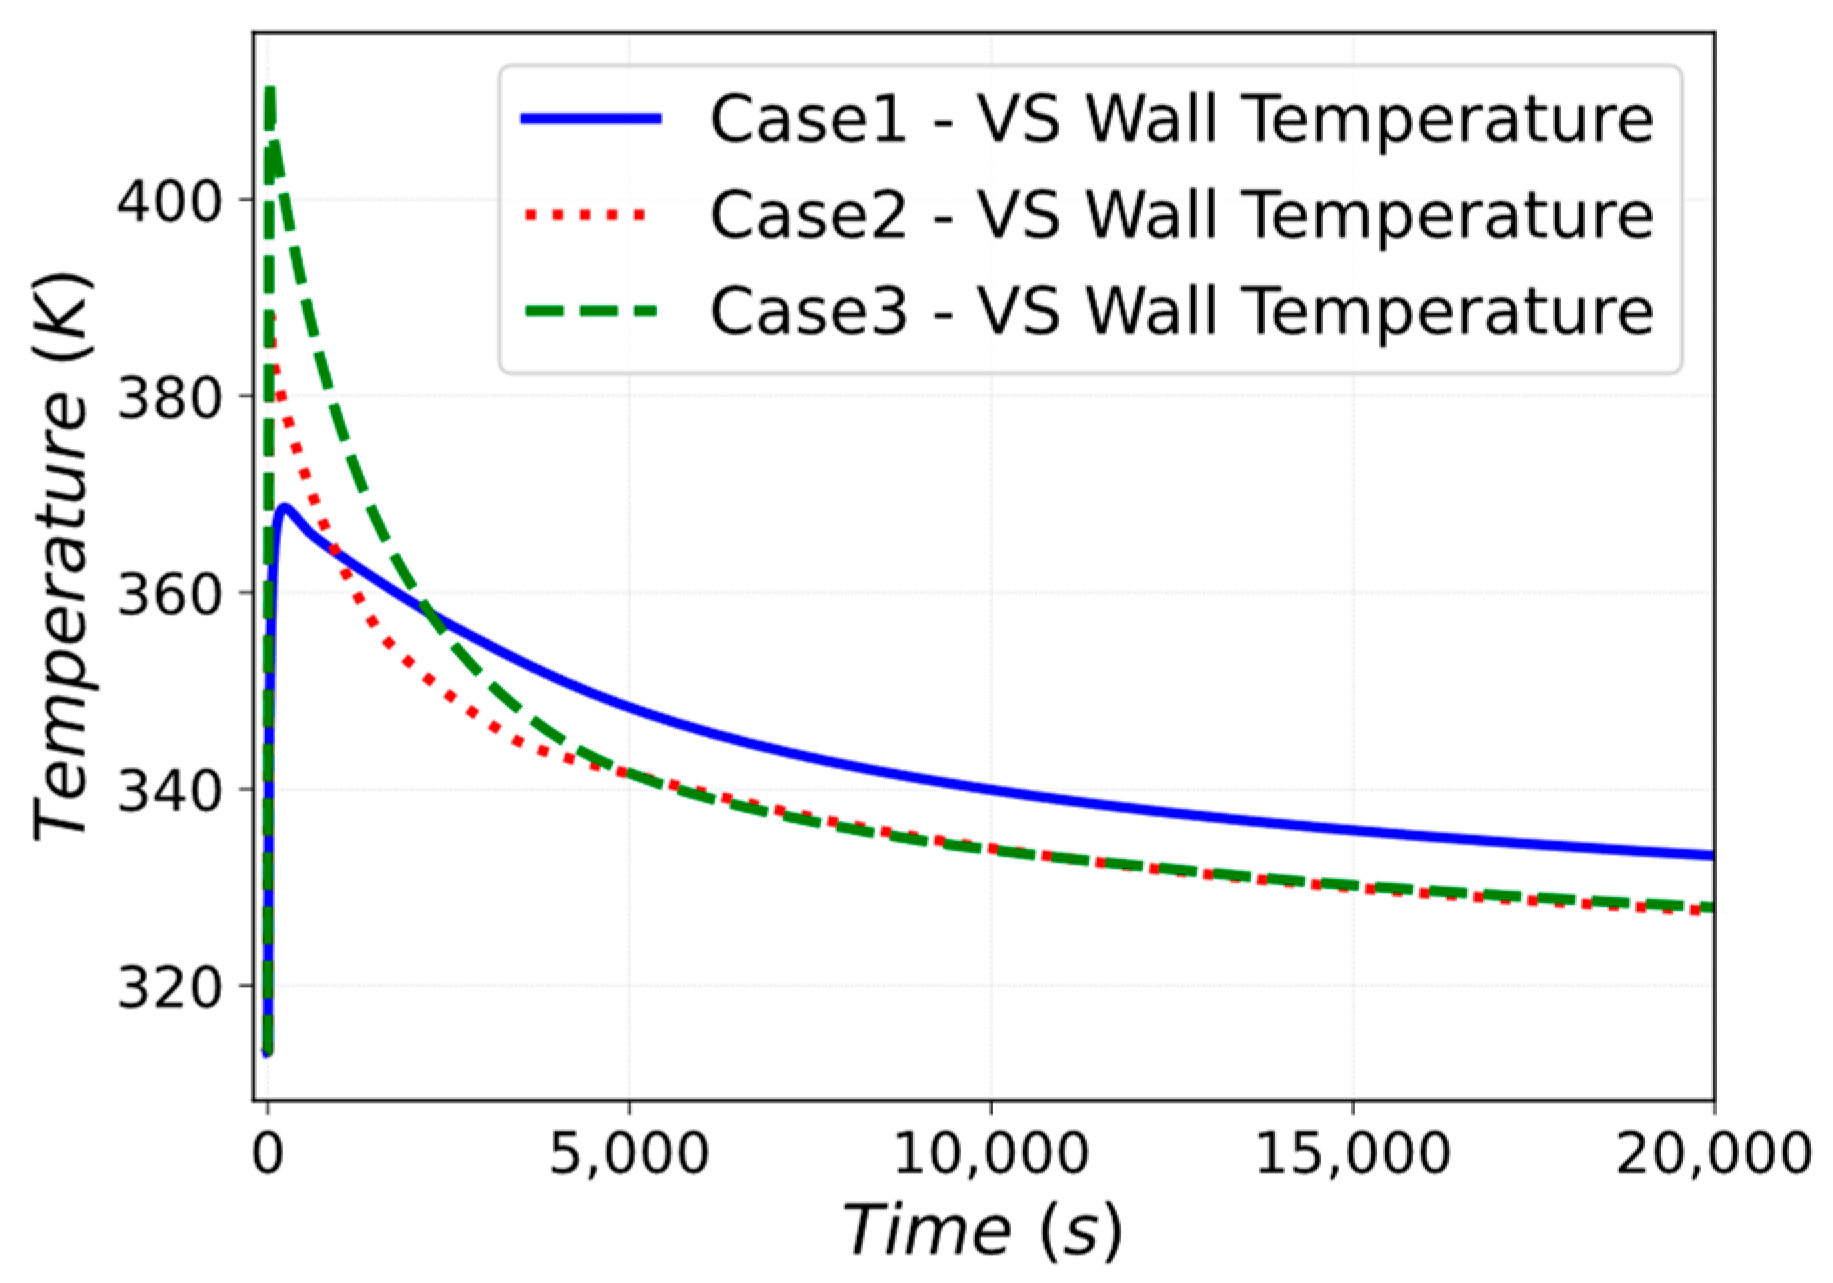
The lumped HSs and CVs approach decreases the MELCOR computational time of the accident scenario, although it overestimates the heat transfer towards the boundary HS of the CV. Even if the heat exchange area between the HS and the CV and the mass of the HS is kept constant between the different cases, the specific heat capacity of each HS differs due to a different temperature trend of the nodes modelling the HS. Specifically, the heat structures of Case 2 and Case 3 reach a higher temperature trend during the first stages of the transient. In the long term, the heat structures of Case 2 and Case 3 cool down faster than the heat structures of Case 1 due to their smaller mass. Figure 13 and Figure 14 show the temperature trend of the wall heat structure of the UPC and VS.
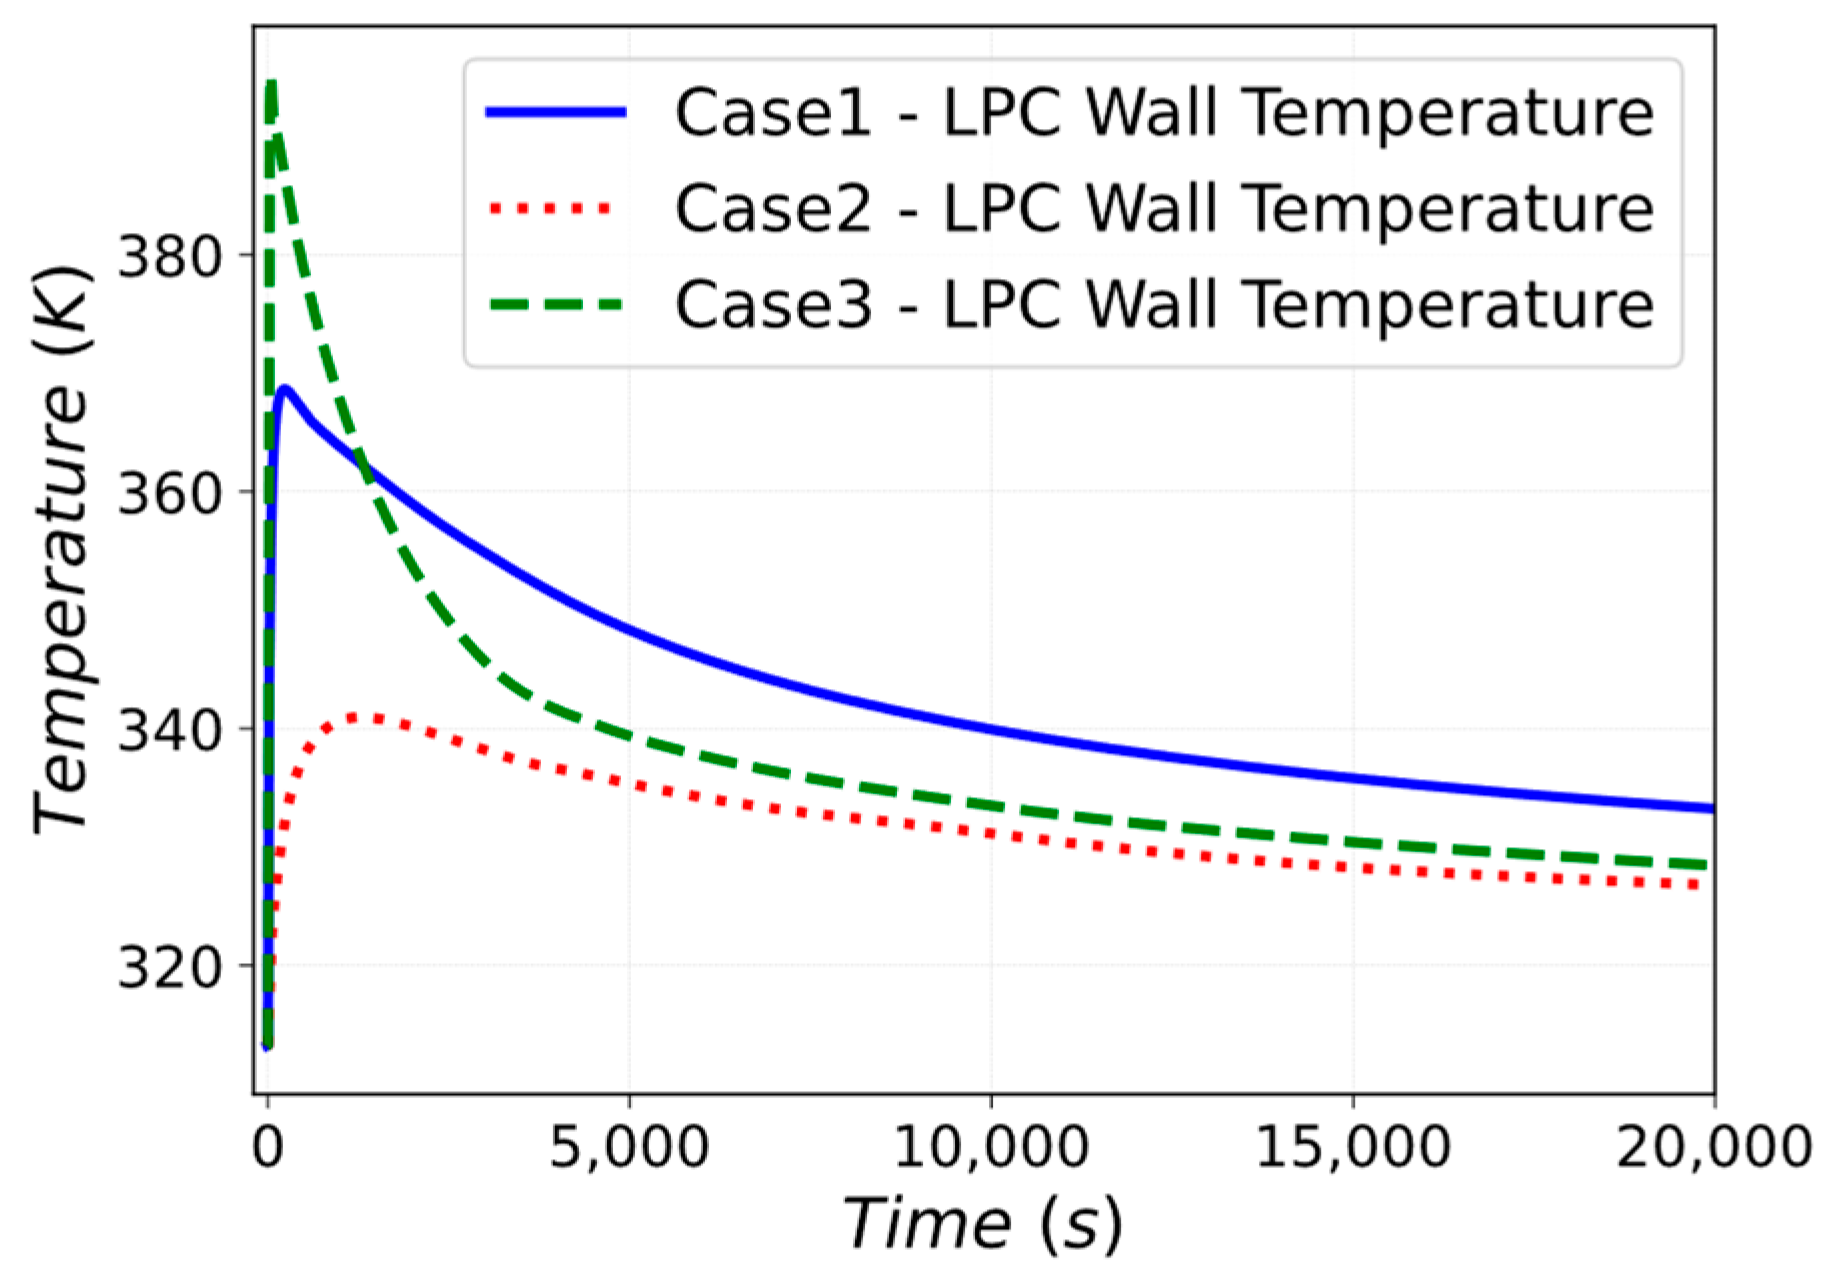
Another approximation of Case 1 concerns the different local interactions along the wall and floor heat structures. In the Case 1 model, a single HS simulates the walls of the UPC, LPC, and VS. The heat exchange simulated represents only an average of the phenomena occurring along this structure. Case 2 and Case 3 HS modeling locally depicts the interaction between the steam and gases with the boundary heat structures. The condensed steam collects in the lower part of the environment, and therefore interacts exclusively with the LPC HS. Case 1 does not correctly evaluate this interaction due to the lumped HS model. Figure 15 shows the temperature transient of the LPC wall heat structure, highlighting how the presence of the pool influences the heat exchange with the wall.
A preliminary analysis to quantify the leak of tritiated water from the building was performed by activating the HTO transport model developed for MELCOR for fusion applications. The leaks of HTO mainly come from the TMH and in a smaller quantity from the PHTS area. HTO moves toward different Tokamak building compartments because of leakages, relief panels opening, and ventilation systems. The difference in the unfiltered HTO released to the environment relates to the pressure trend of each run.
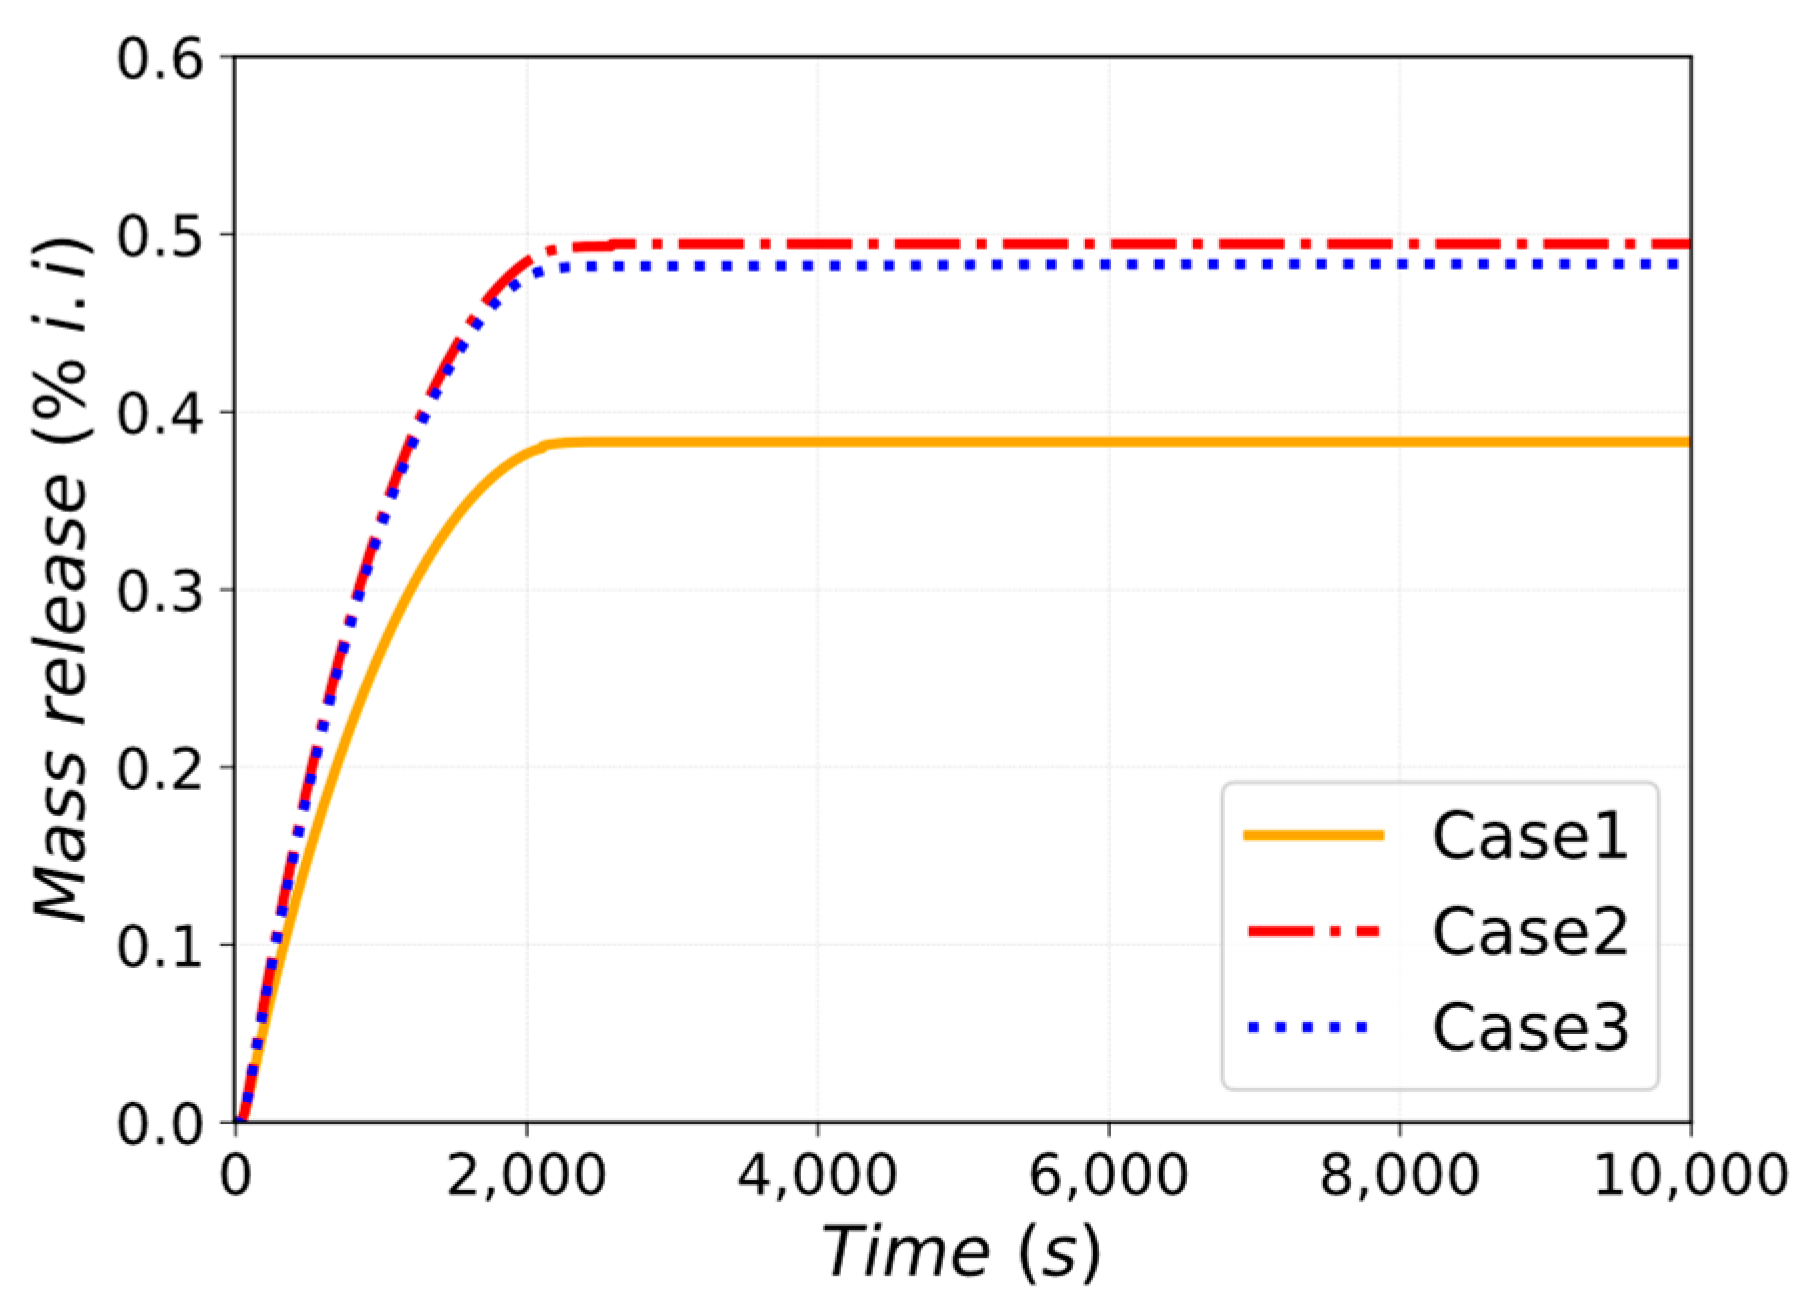
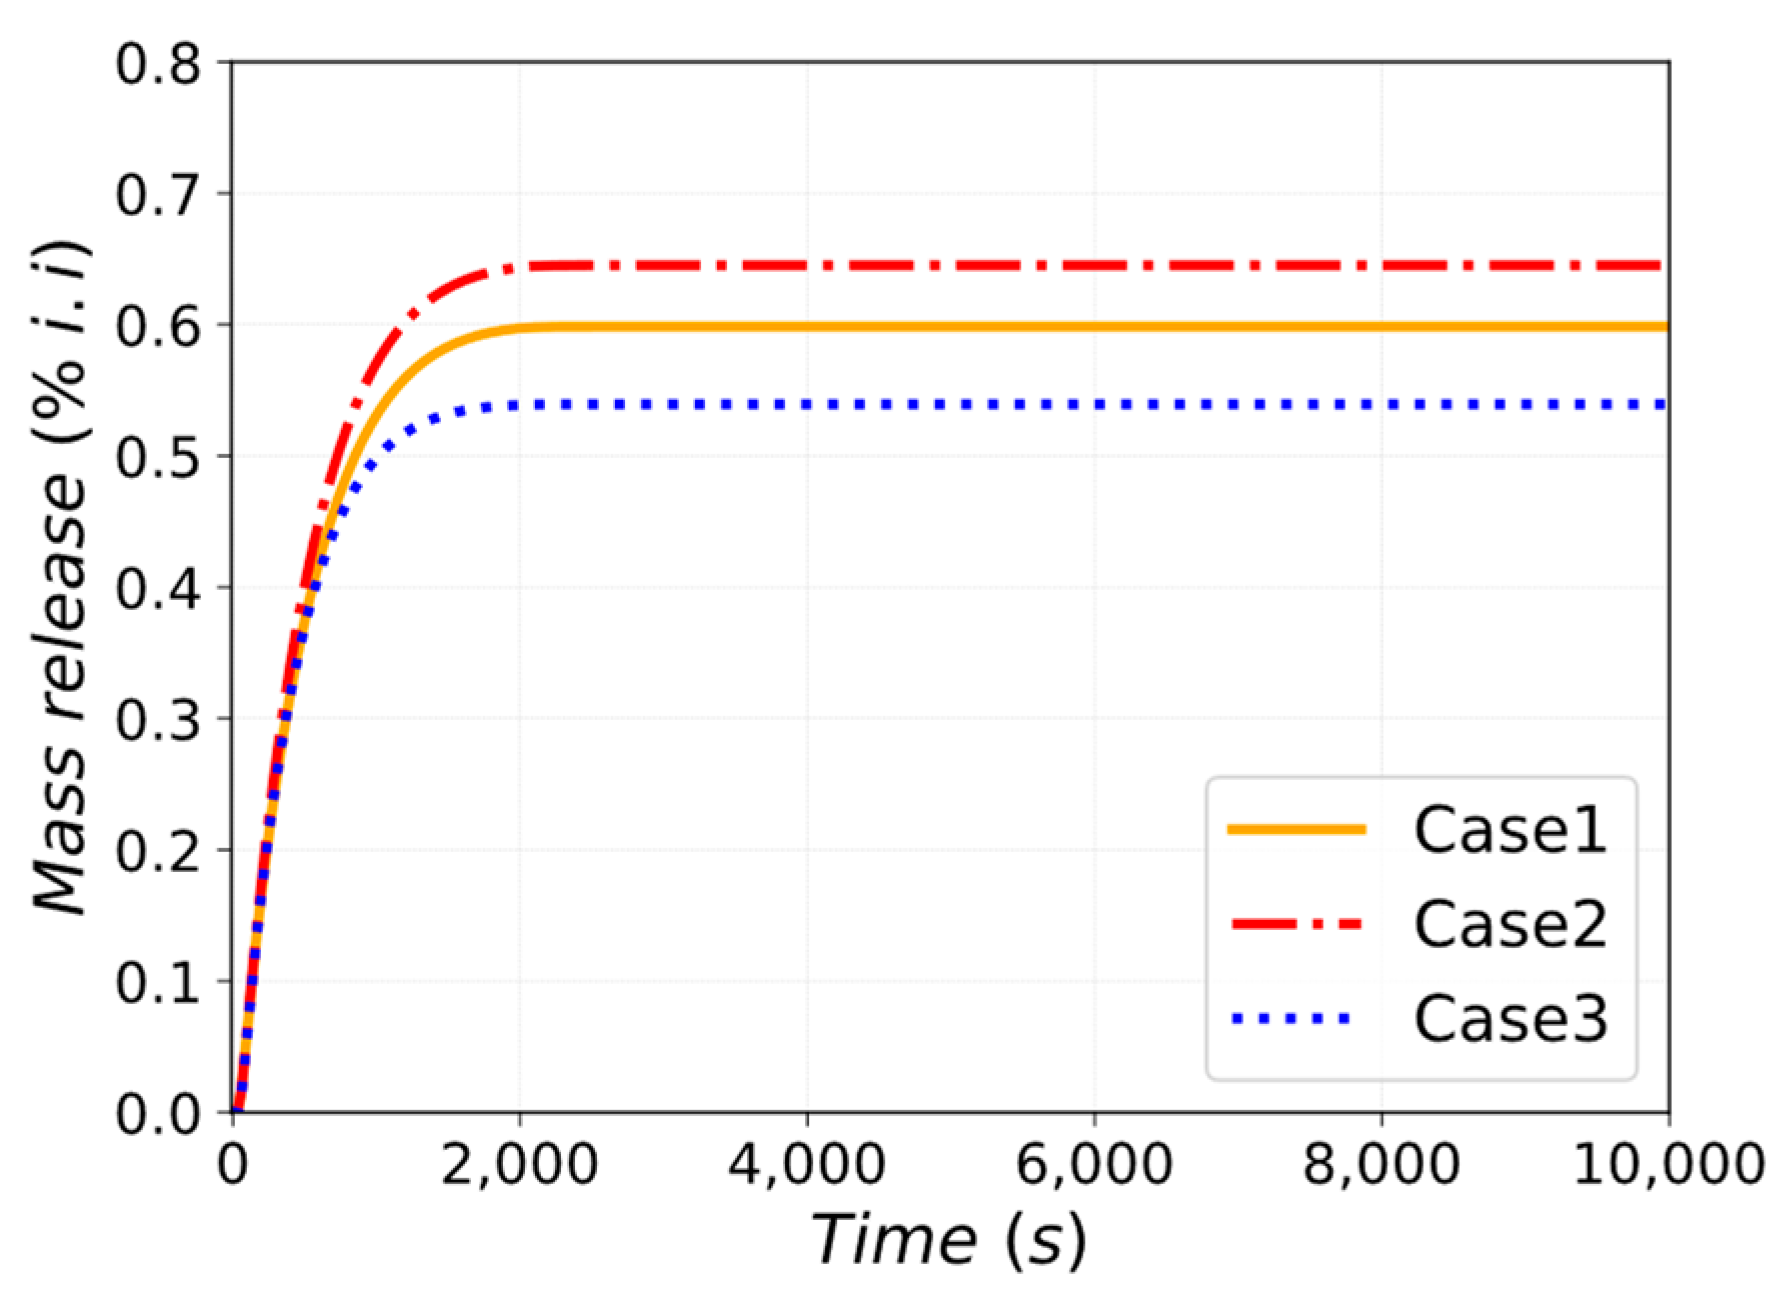
The condition for the isolation of the N-VDS (assumed to be 150 kPa or 343 K) is reached soon after the PIE (~1 s). The re-activation timing of the N-VDS can be affected by the nodalization scheme since heat structures play a fundamental role in the depressurization transient. Case 3 reactivates the N-VDS for the UPC area at 5000 s before the other two cases, which reactivate the system at ~9000 s. Some quantities of HTO are released at different gallery levels, served by the HVAC system venting towards its stack. However, leakages in galleries do not cause the HVAC to stop. The lower pressure transient inside the PHTS area and dome of Case 1 causes a minor unfiltered release towards the environment, underestimating the source term compared to Case 2 and Case 3. Results of unfiltered releases as a fraction of the HTO initial inventory are depicted in Figure 16.
Concerning the activated corrosion products (ACP) contained in the WCS, Figure 17 shows the mass fraction of ACP released toward the environment. Since ACPs remain trapped in liquid water, negligible amounts of ACP move from the vault area to the other connected environments. Because the pressure inside the PHTS remains higher than the atmospheric pressure, all the coolant spilled onto the TCR presents an unfiltered environmental release. However, the environmental releases would be limited due to the small radioactive inventory in the FW-PHTS loop, causing no severe radiological consequences.

3.3. Loss-of-Coolant Accident from FW-PHTS: Sensitivity on Relief Panels

As described in Section 2.2.1 and Section 2.2.3, the UPC is connected with the PHTS area through relief panels, while the PHTS area is connected to the TMH through other relief panels. Preliminary values of pressure setpoints and release panel flow areas are provided in the EU-DEMO SDL [36]. An exploratory parametric study was performed on the number of relief panels to give a demonstration of the solution adopted. The parameters selected are:
  • X: N° of relief panels (0.5 m2 each) from UPC to PHTS if PUPC > 120 kPa (abs);
  • Y: N° of relief panels (0.5 m2 each) from PHTS to dome if PPHTS > 150 kPa (abs).
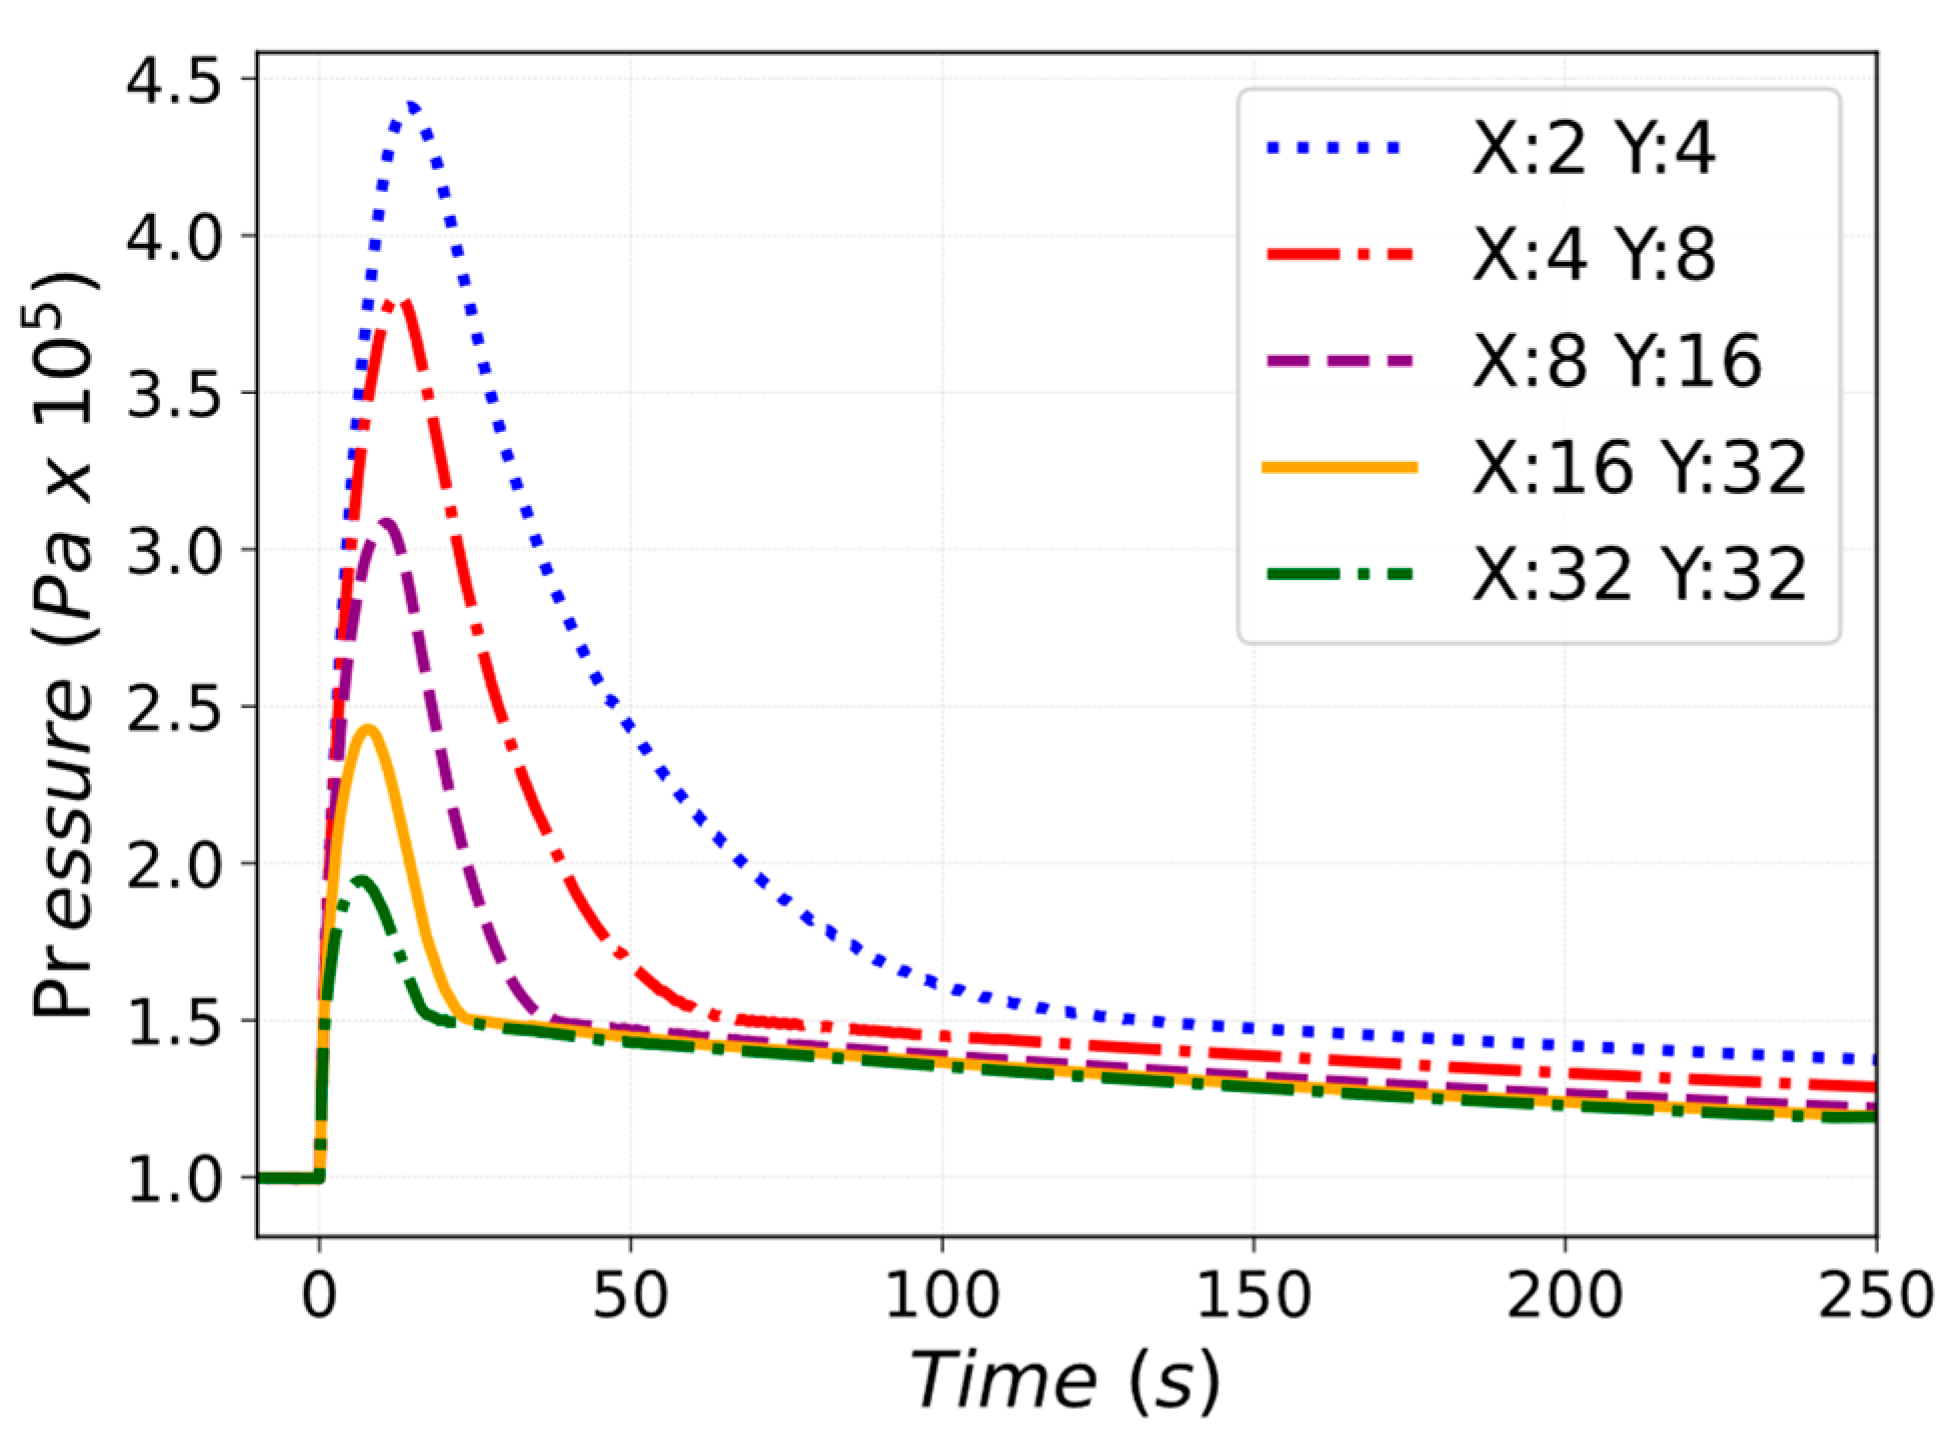
The pressure trend in the UPC is shown in Figure 18. As the number of relief panels towards the PHTS area increases, the pressure peak decreases but a higher mass of steam is discharged outside the UPC.
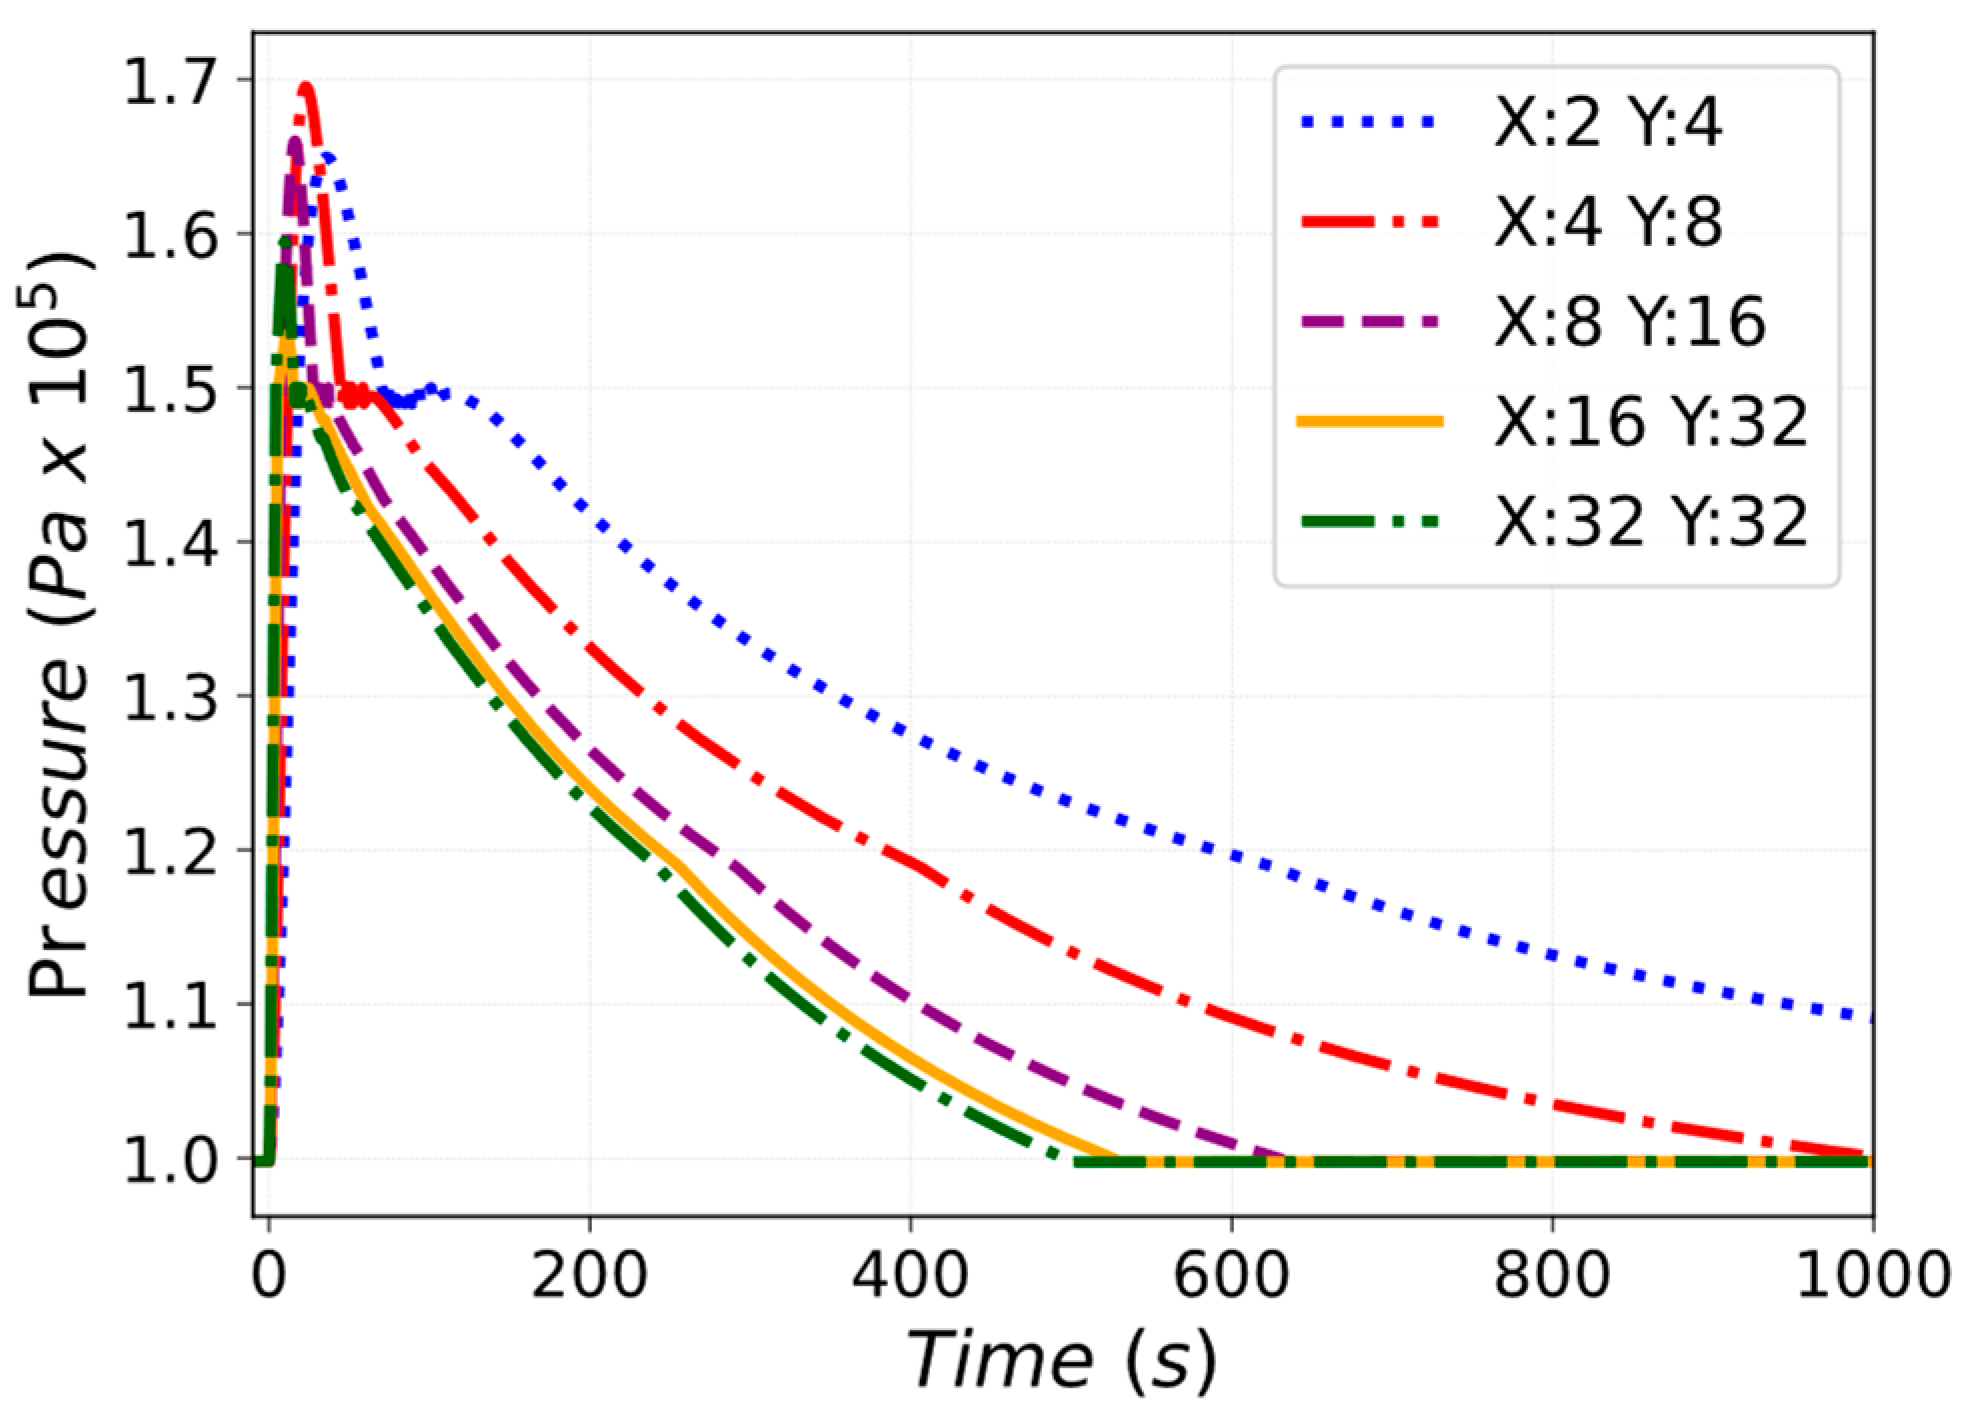
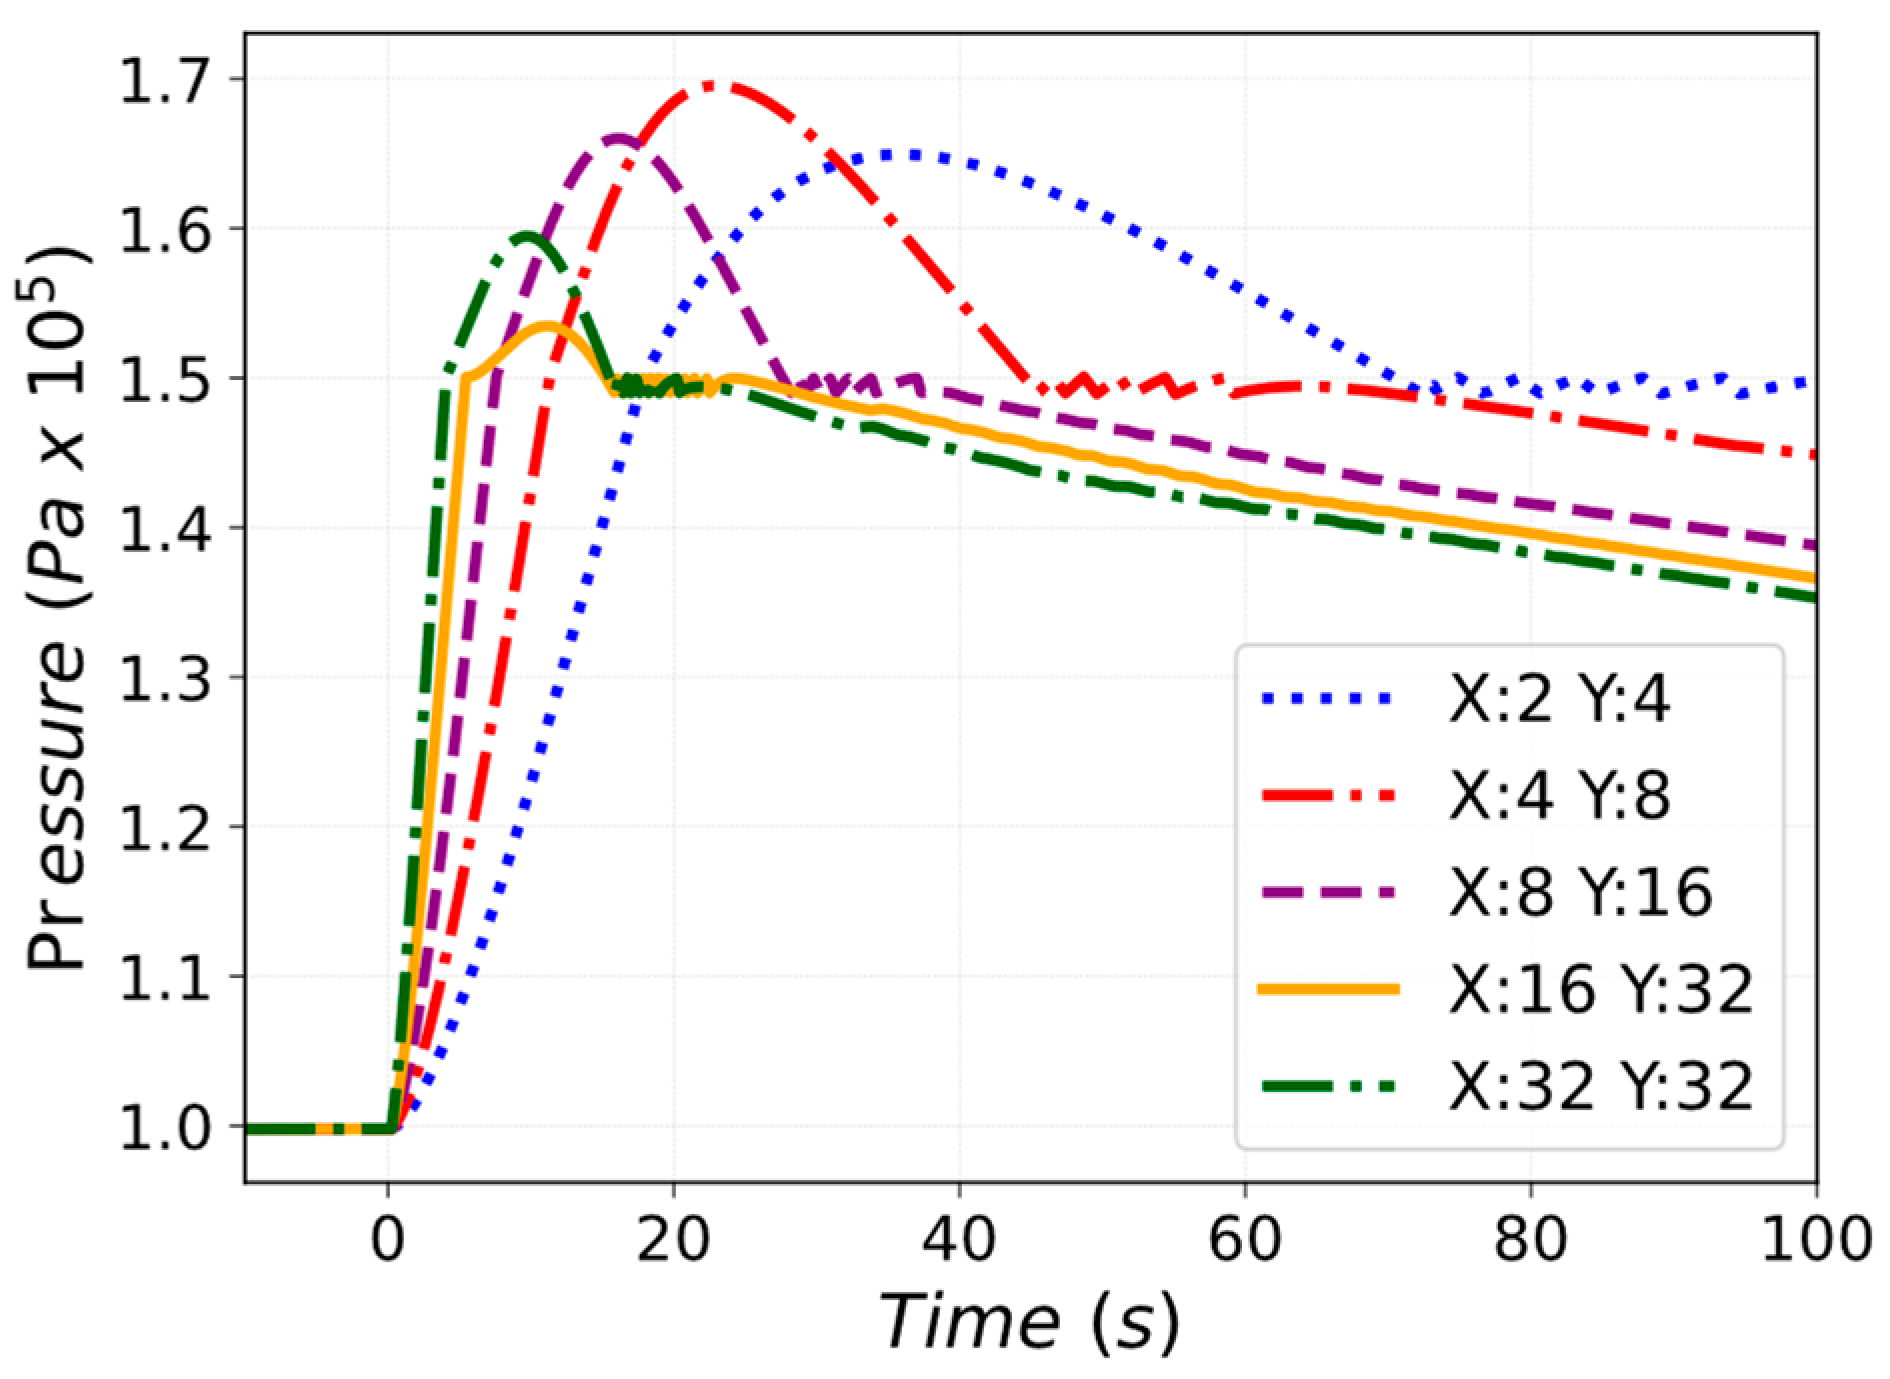
A different result is visible for the pressure trend of the PHTS area, represented in Figure 19 and Figure 20. The PHTS area has two openings: the flaps connected to the UPC, and the flaps connected to the TMH. During the transient, the PHTS area has an overall lower pressure trend than the UPC, while it has a higher pressure trend than the TMH. Therefore, steam enters the PHTS area only from the connection with the UPC, but at the same time, when the pressure reaches 150 kPa, steam is discharged towards the TMH. The flaps connected to the TMH are double size of the flaps connected to the UPC.
Soon after the PIE, the flaps connecting the UPC and the PHTS area open. When the pressure of the PHTS area reaches 150 kPa, the flaps connected to the TMH open. Figure 21 shows the net mass flow rate entering and going out of the PHTS area. The mass discharged towards the PHTS area from the UPC increases with the number of flaps X. At the same time, by increasing the number of flaps installed (Y), more mass is discharged towards the TMH. In terms of pressure transient, as the number of flaps X and Y increases, the pressure peak in the CVs decreases. The discrepancy between the time instant of the pressure peak and the time instant of the peak net mass balance entering the volume highlights the decreasing pressure trend as the number of flaps is increased. The outlier with X:32 and Y:32 represents a different case than the others because the same number of flaps for the UPC and TMH connection are installed. Compared to case X:16 and Y:32, the outlier has the same number of outsource openings (Y:32) but an increased number of insource openings (X:32). This causes a higher pressure trend of the PHTS area for the outlier compared to the previous case (X:16 and Y:32).
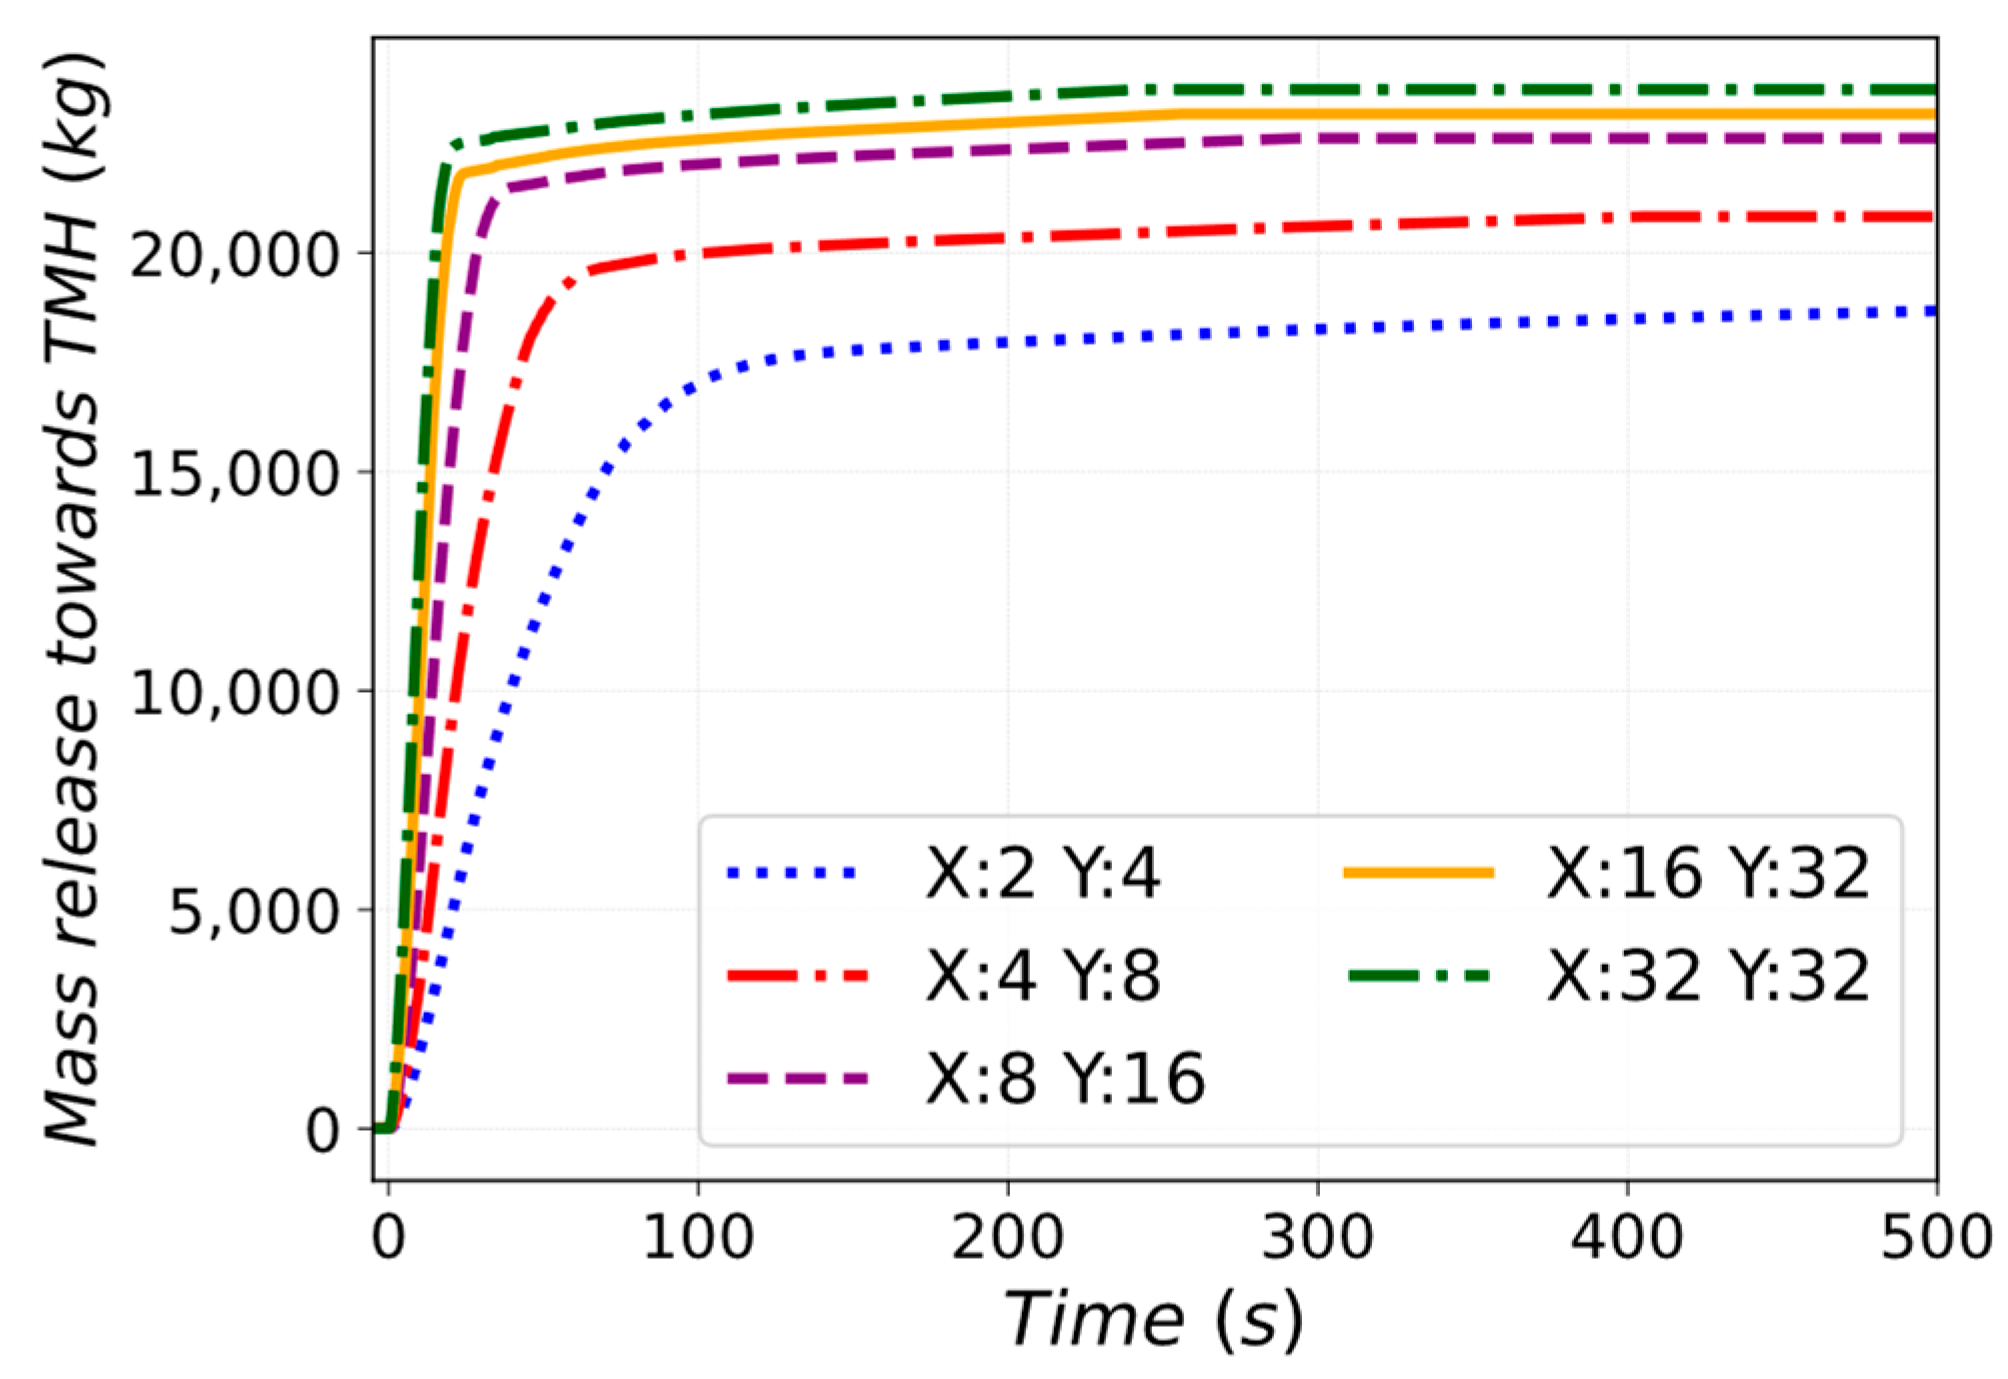
Due to the only mass insource present, as the number of flaps is increased, the pressure trend of the TMH increases, as shown in Figure 22. Figure 23 illustrates the total amount of steam discharged toward the TMH.
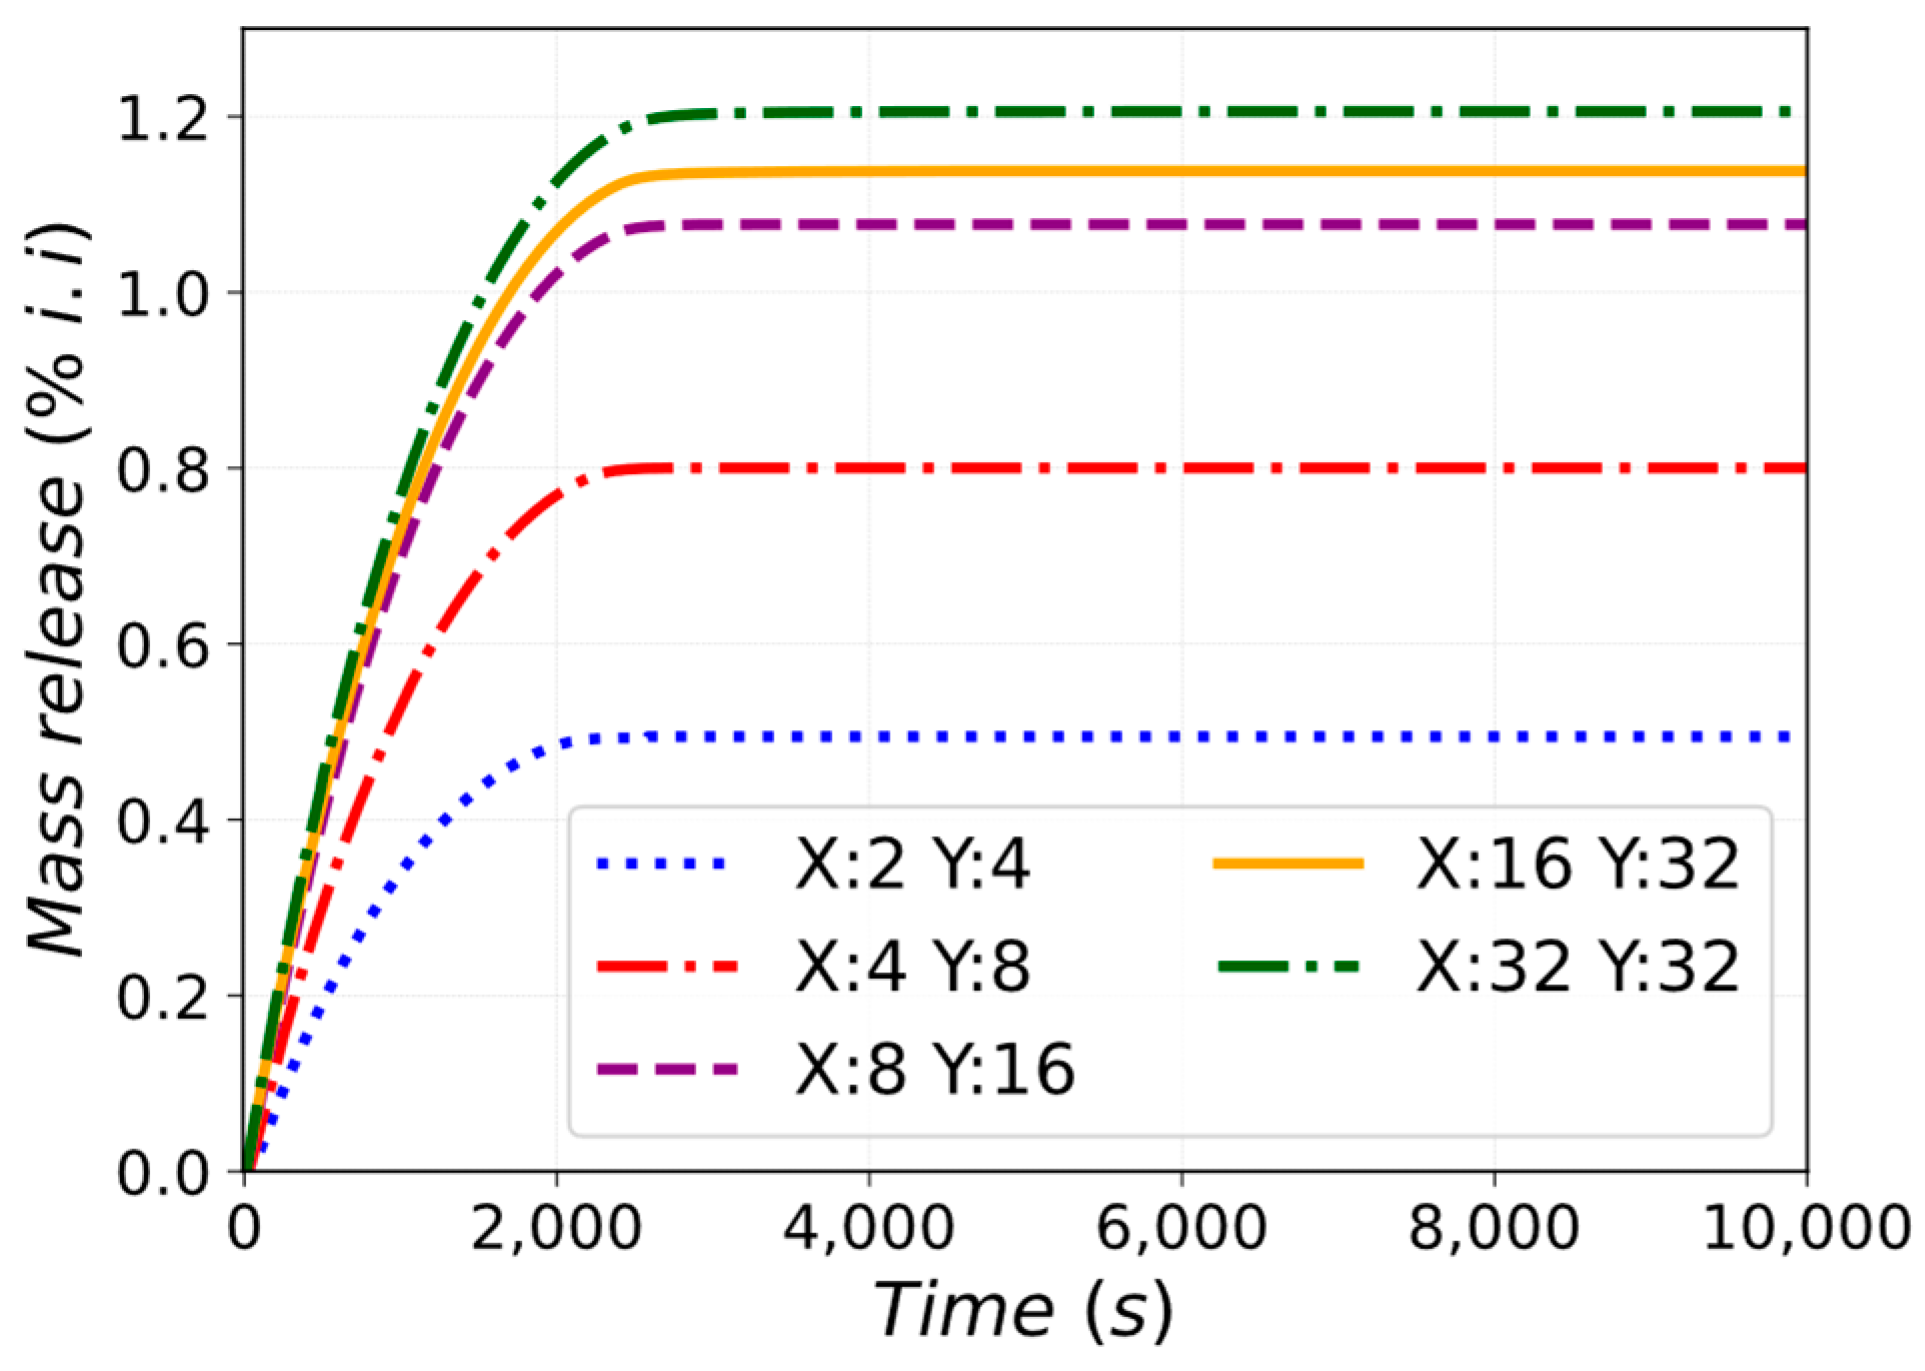
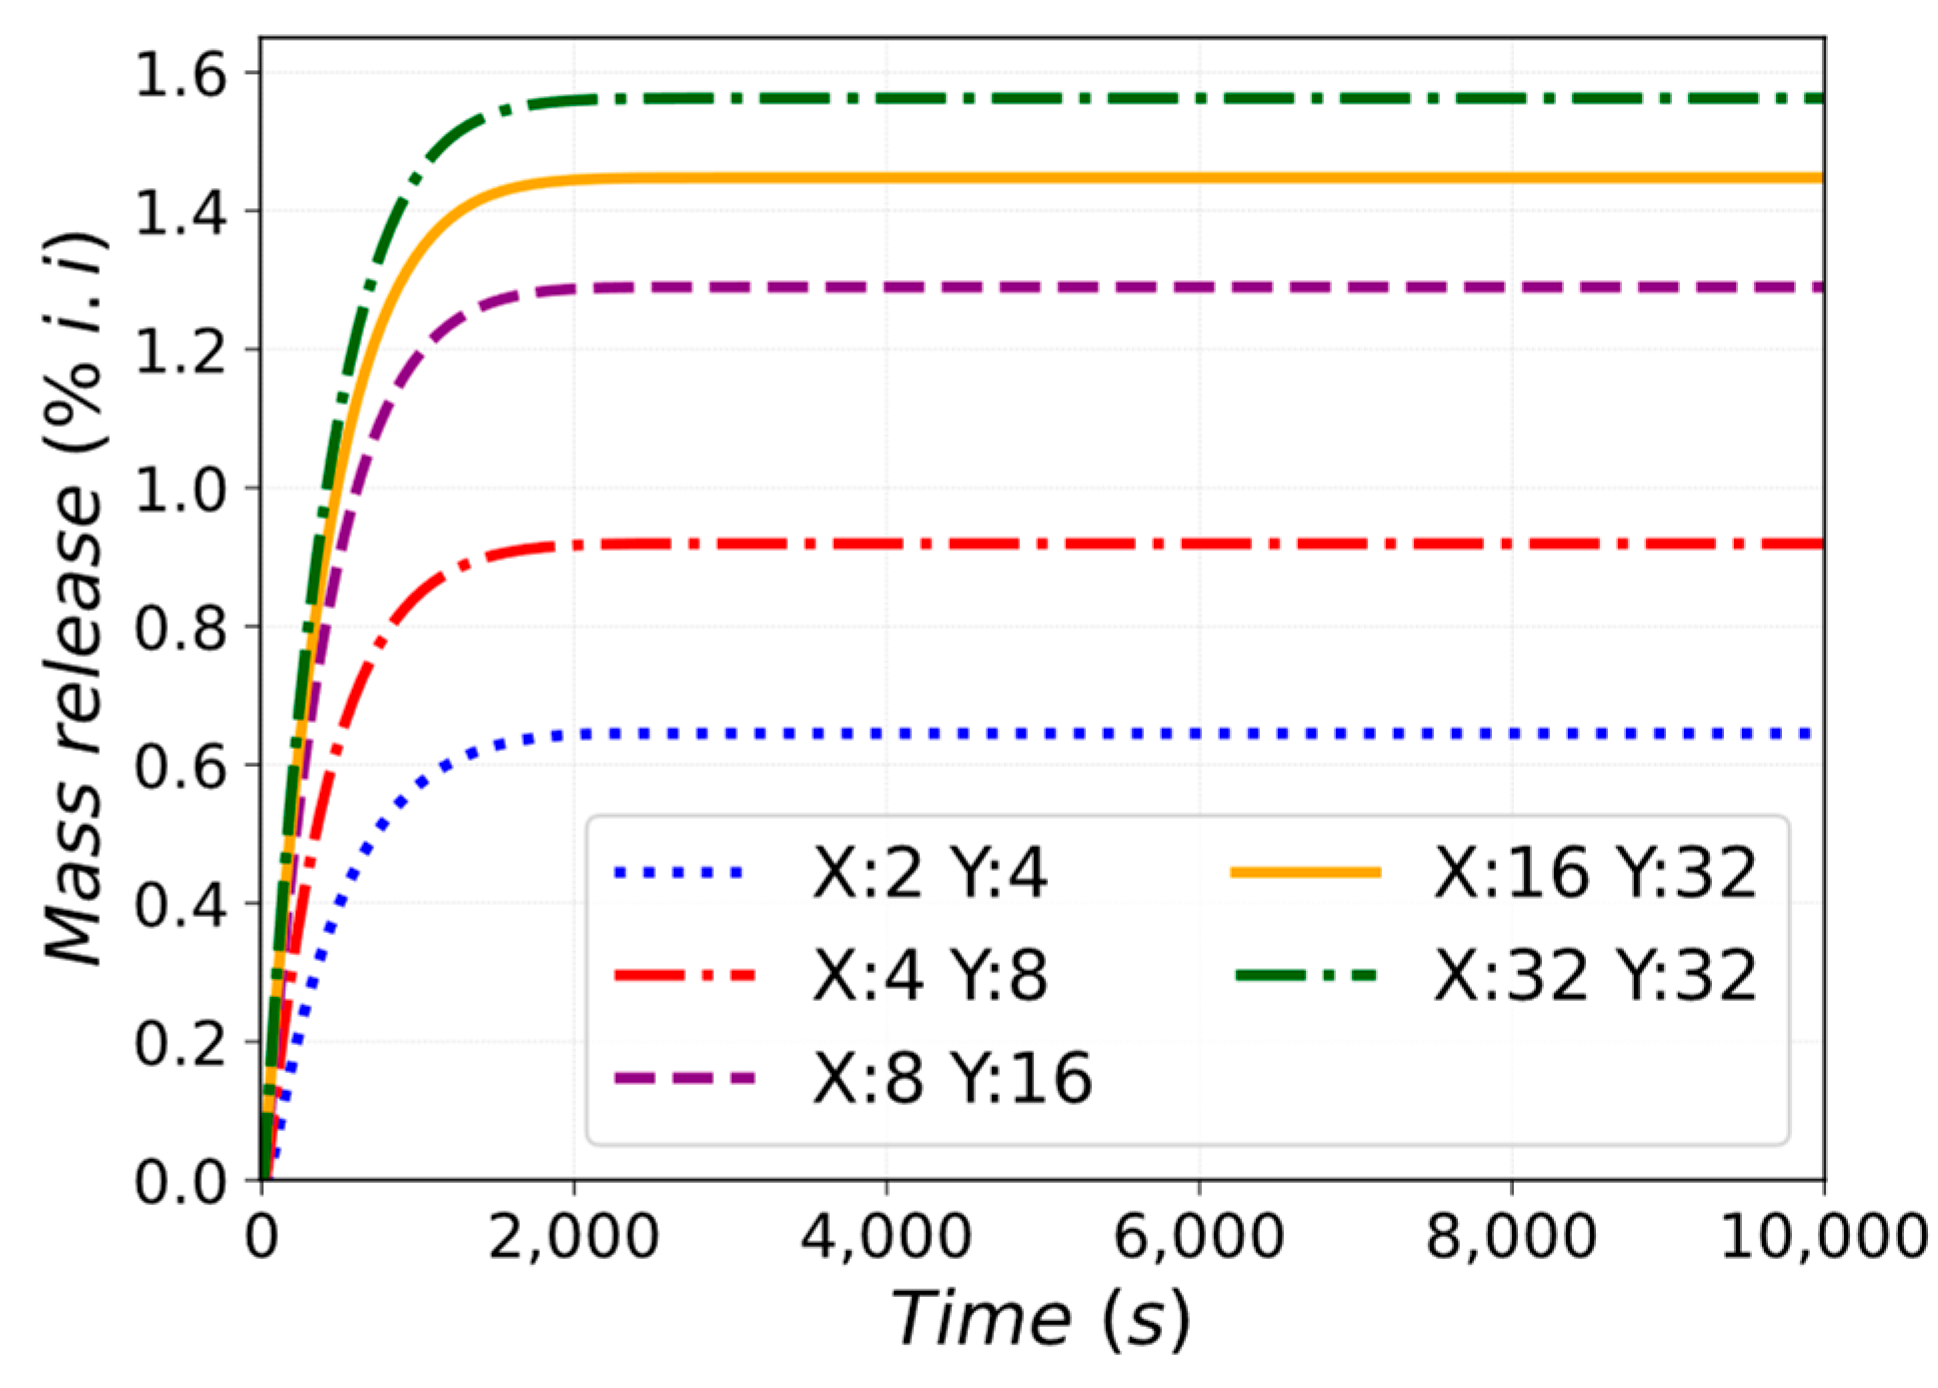
Regarding unfiltered releases, the main contributor to environmental leaks comes from the TMH. The amount of steam released to the TMH, and therefore the pressure trend, increases with the higher number of flaps installed. This is also reflected in the unfiltered HTO and ACP releases, illustrated in Figure 24 and Figure 25. The amount of leak is directly proportional to the pressure difference between the TMH and the environment. The cases with the higher pressure trend increase the amount of unfiltered release to the environment. Table 3 displays the abs. pressure values in the UPC, PHTS area, and TMH for the different cases analyzed.

3.4. Exploratory Solutions to Mitigate Building Pressurization

The preliminary ex-vessel LOCA studies described in Section 3.1 and Section 3.2 highlighted that without any overpressure mitigation system, the absolute pressure limit of 2 bar proposed for some Tokamak building compartments might be exceeded. At this stage of the EU-DEMO design phase, exploratory analyses are performed to support the implementation of overpressure mitigation systems.
Two pressure mitigation systems were studied to keep the pressure below the safety threshold and to collect part of the source term, reducing long-term releases of tritiated water and activated products toward the environment. The first system investigated consists of a spray system to serve the UPC. The second solution studied deals with a suppression pool connected with the LPC.

3.4.1. Spray System in the UPC

To reduce simulation time, the Case 2 input deck was taken as a reference to explore the effects of a spray system installed in the building in mitigating ex-vessel LOCA. The flaps connecting the UPC to the PHTS area were removed as the pressure mitigation is served by a spray system. Thus UPC, VS, and LPC are the only volumes for steam expansion.
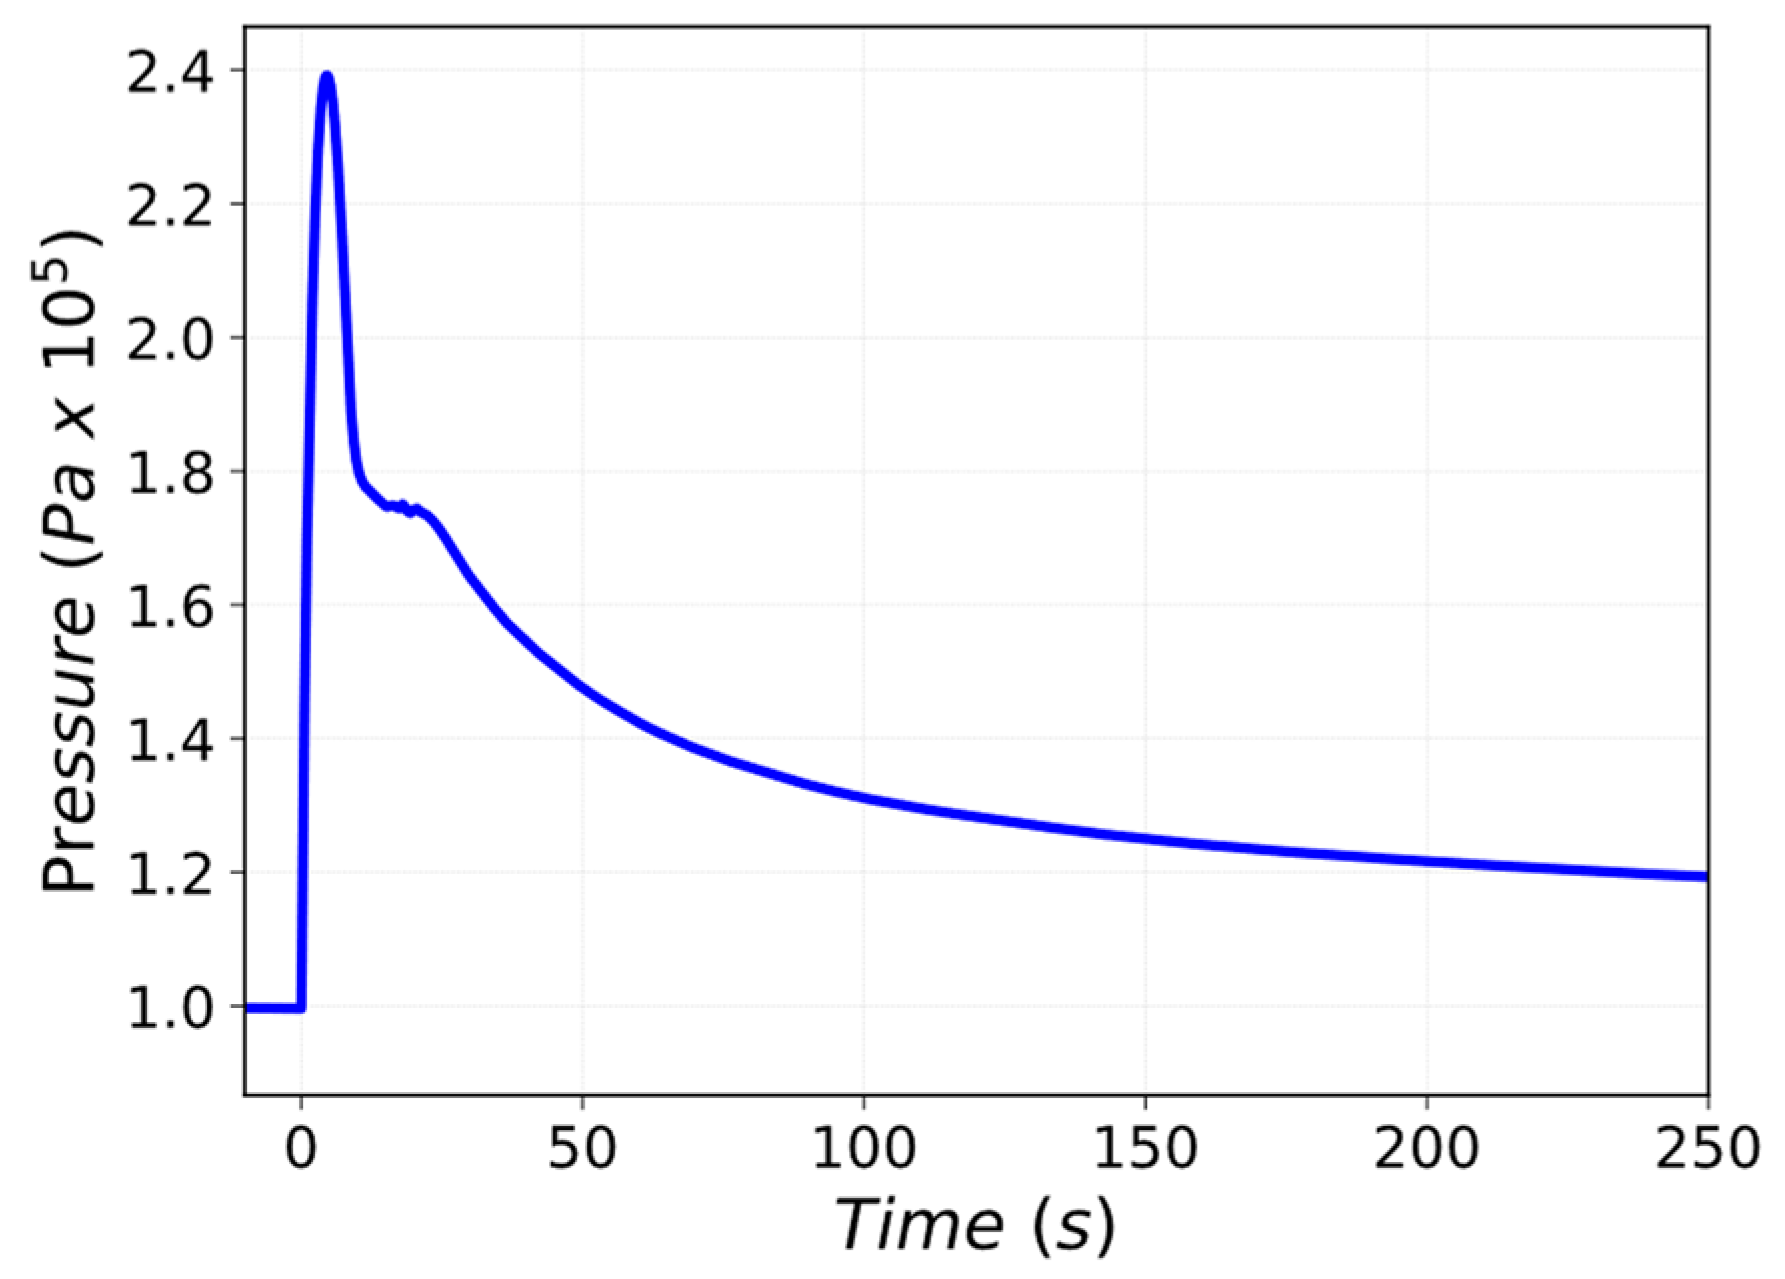
The spray system is triggered when the pressure in the UPC is equal to 120 kPa. MELCOR results highlighted that a spray flow rate of 15 m3/s at 20 °C is required to maintain maximum pressure below 2 bar (abs), as shown in Figure 26. The equilibrium pressure reached in the UPC equals 98 kPa and a final temperature of 310 K.
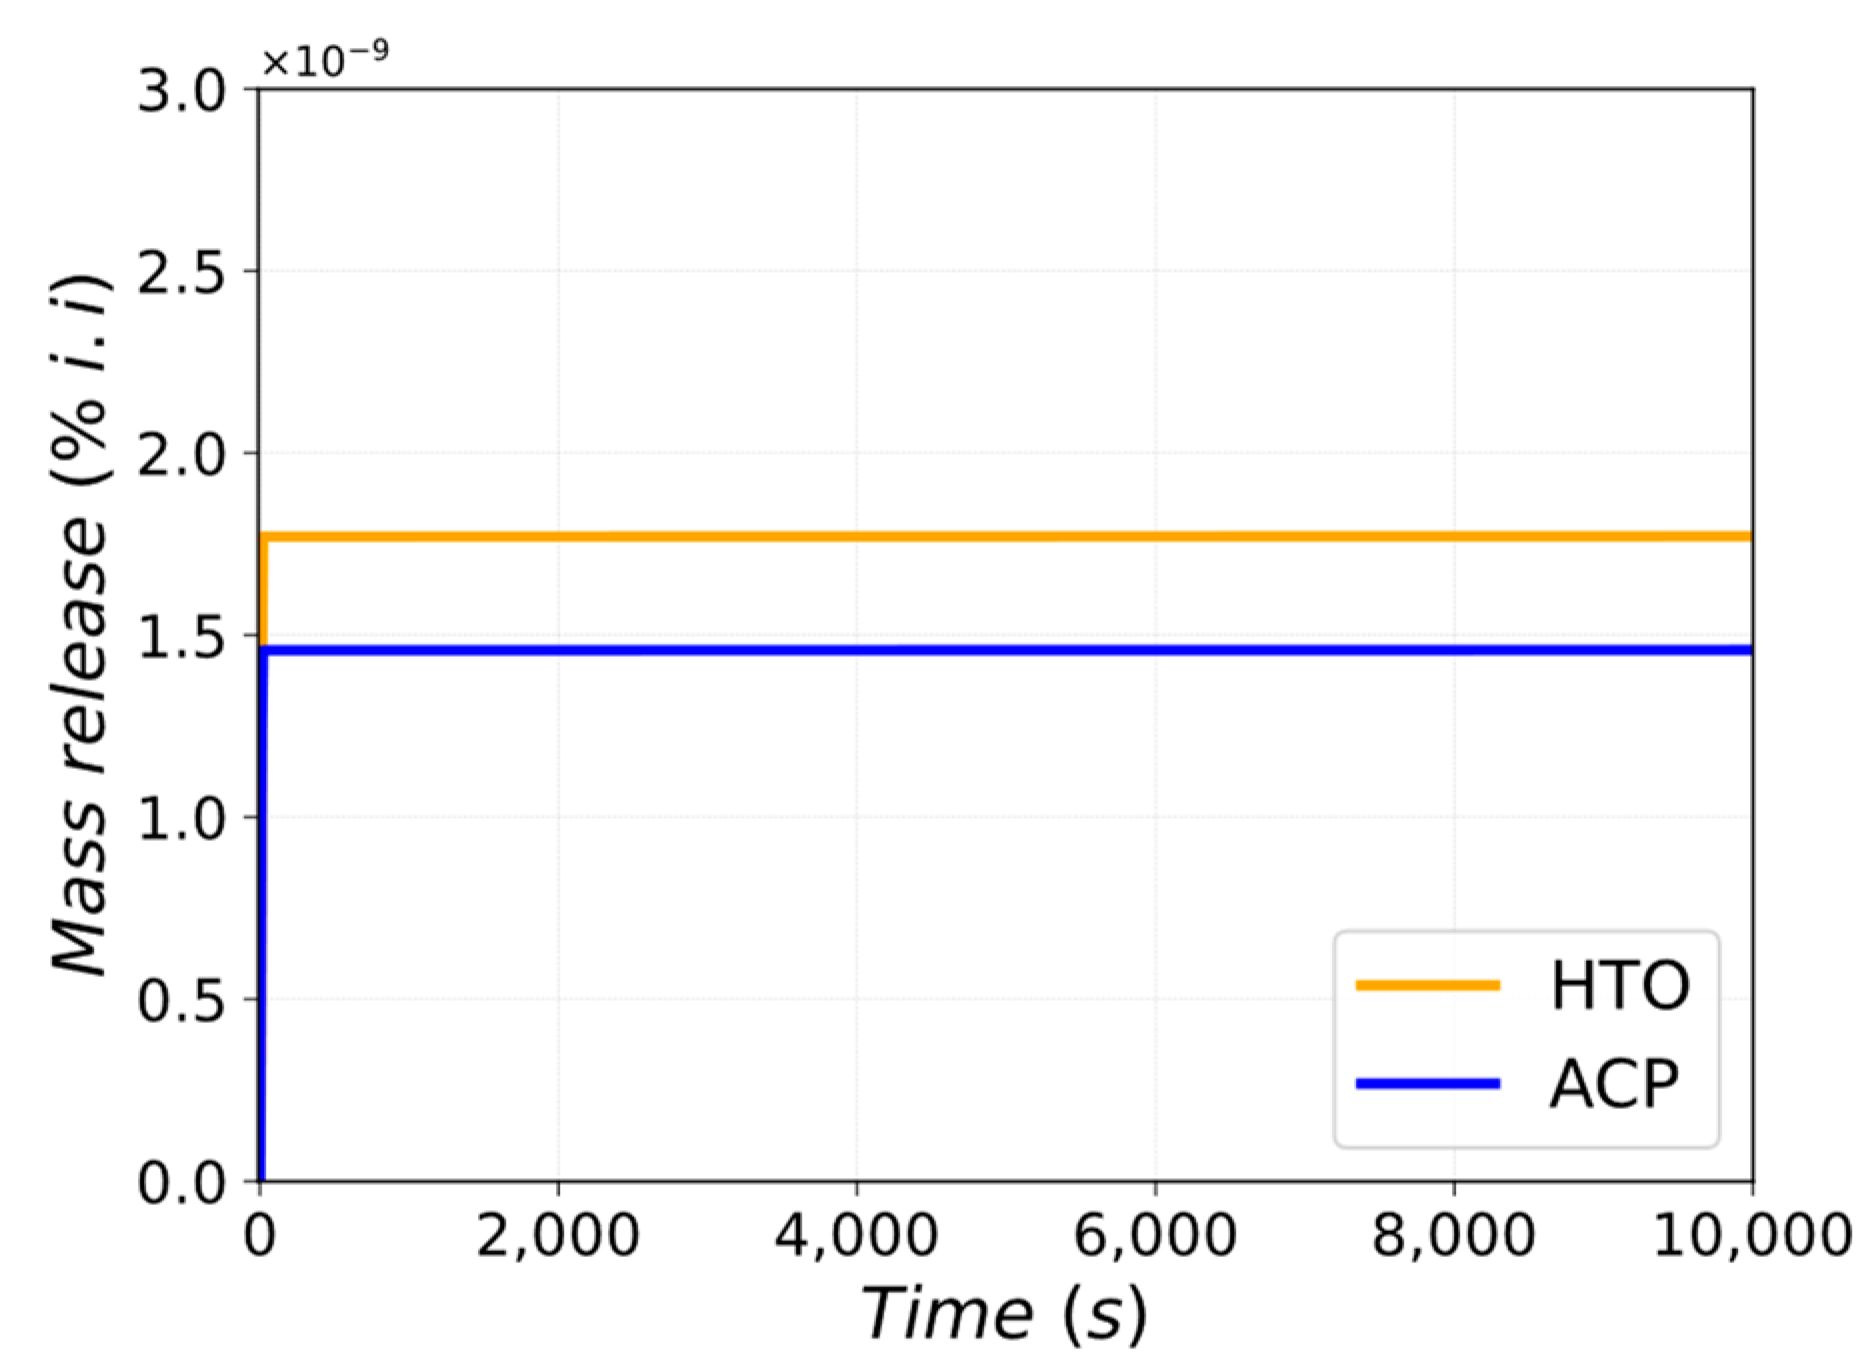
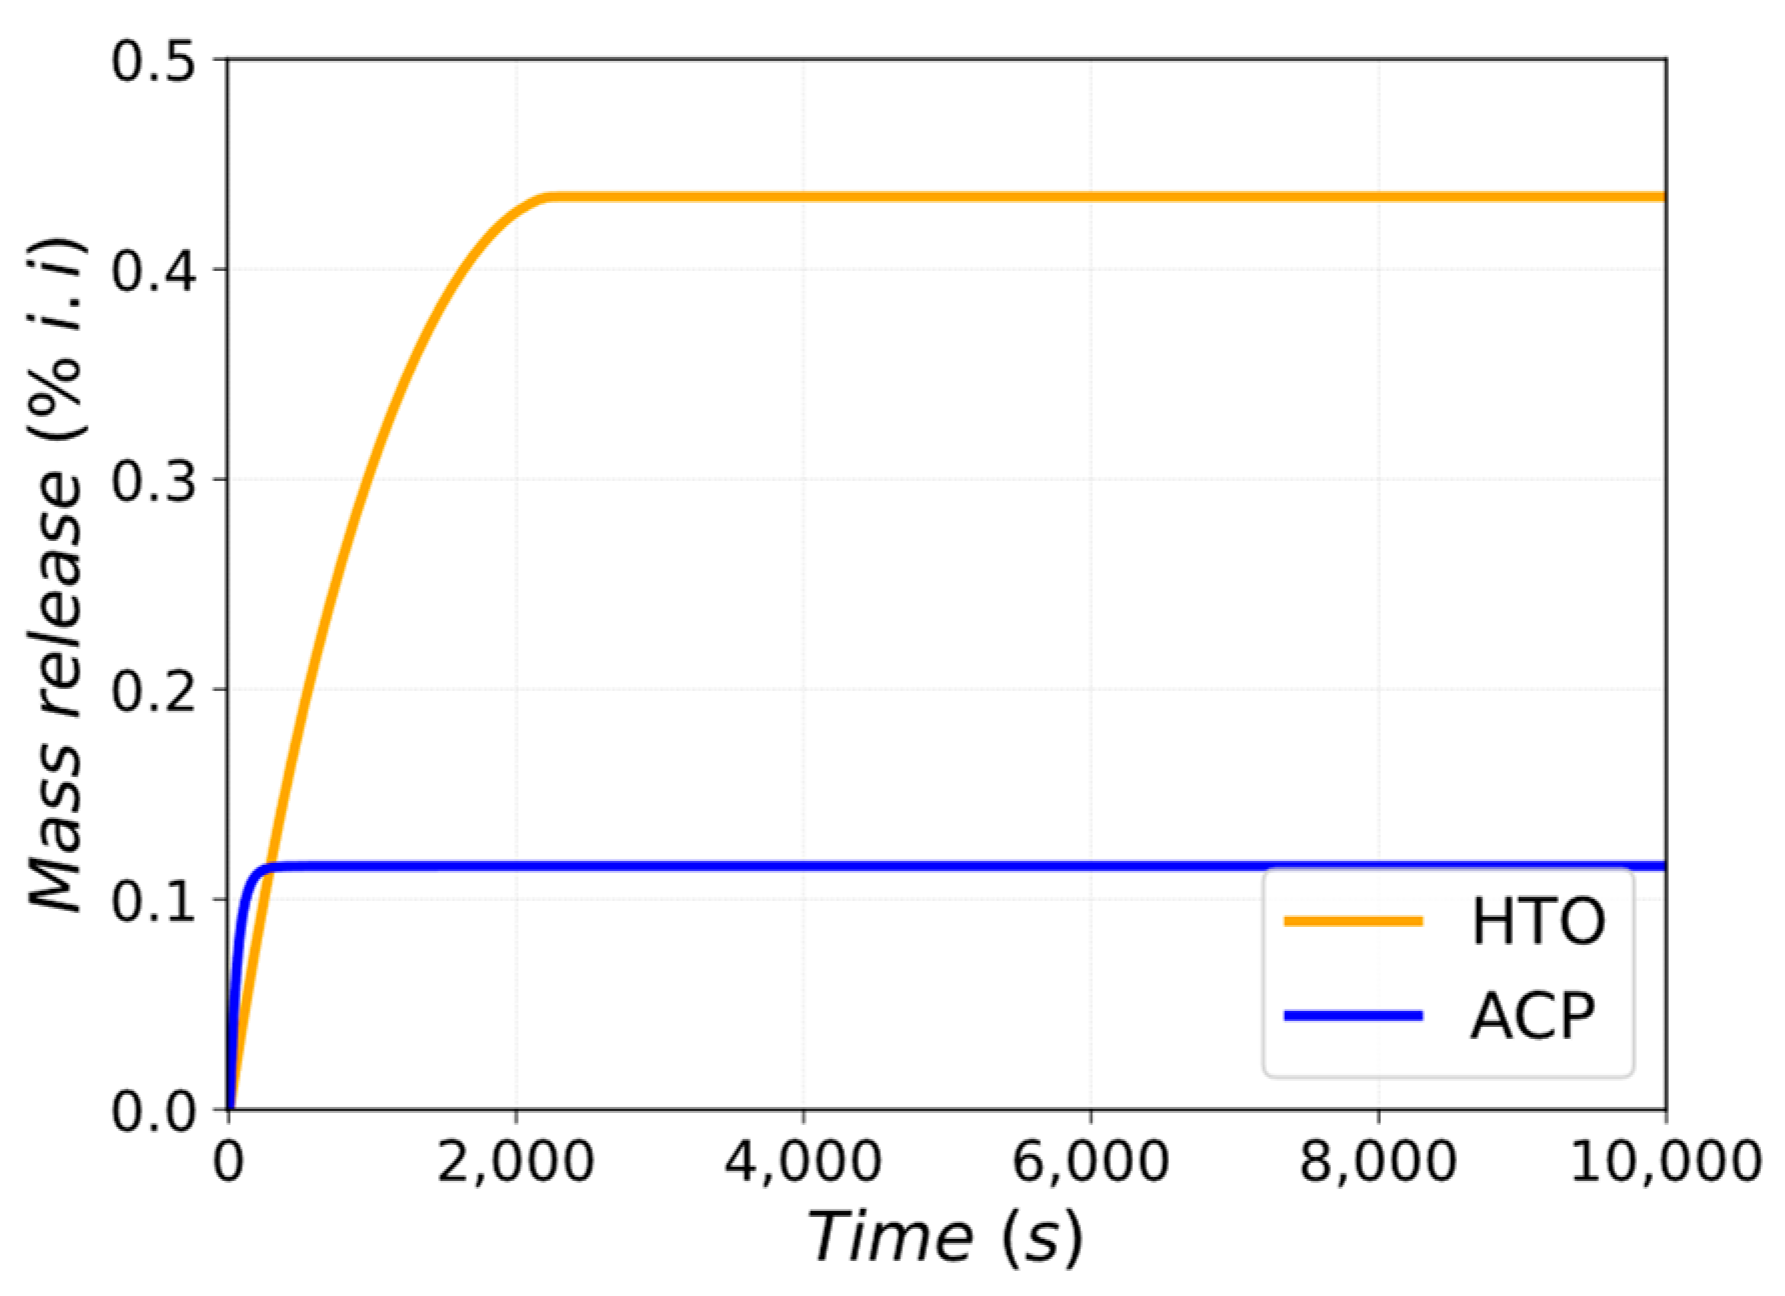
In terms of unfiltered releases, the spray pressure mitigation system drastically reduces the source term compared to the base case analyzed in Section 3.1 and in Section 3.2. As shown in Figure 27, a negligible mass fraction of HTO and ACP are released to the environment. This is mainly due to the containment of most of the HTO in the UPC area where the leaks are not directly to the environment but only towards the PHTS area and the galleries, which are under ventilation systems and are not affected by any pressurization. Regarding the ACP, the water from the spray system collects most of the ACP released during the LOCA.

3.4.2. Suppression Pool Connected with LPC

The proposed system consists of a connection between the LPC, and a suppression pool (SP) that might be installed in the galleries at level B3. The Case 2 input deck was used for this scoping analysis, and the flaps installed between the UPC and the PHTS were removed. The connection between the LPC and the SP has a flow area equal to 20.0 m2. A rupture disk is installed on the connection between the LPC and the SP. The rupture disk is supposed to open when the absolute pressure in the LPC reaches 120 kPa. To deal with the large amounts of non-condensable gases in the containment, the atmosphere of the suppression pool is connected with the neighboring building environments (Gallery B2).
The peak pressure experienced in the UPC is equal to 2.4 bar abs, as shown in Figure 28, which is higher than the potential design pressure of 2 bar abs. This lower limit cannot be further decreased by increasing the discharge area between the LPC and the suppression pool because the flow area of the vertical shafts limits the flow toward the suppression pool. The HVAC operates in normal conditions in the building environment hosting the ST until the HTO concentration reaches the HVAC limit value for operating. The HVAC switches off soon (31.6 s) after the PIE; after a 30 s delay, the ventilation system is switched to the S-VDS, working actively for the remainder of the transient.
Adopting an SP moderately lowers the HTO source term compared to the base case, while reducing the ACP source term more. The pool volume and height are the key parameters that influence the retention of the ACP source term in the SP. Figure 29 shows the mass fraction of HTO and ACP released toward the environment due to unfiltered leaks.

4. Discussion and Conclusions

The effects of an ex-vessel LOCA for the EU-DEMO WCLL reactor were investigated in MELCOR with three different nodalization approaches, gradually increasing the complexity of the building model. The model allows the computation of unfiltered releases and mass of contaminants filtered by HVAC, S-VDS, and N-VDS. The study’s objective was to identify the thermal-hydraulic transient differences between the different nodalization approaches and their effects on radiological releases.
In this exploratory study, the maximum absolute pressure in the Tokamak building, around 4.46 bar, occurs in the upper pipe chase and is slightly affected by the nodalization scheme. The TH nodalization detail between the three cases slightly affects the maximum pressure and the depressurization trend. The minor differences of the pressure transients between the three nodalization approaches lead to differences regarding the mass of leakages. The source term generates from the leaks in the PHTS and TMH, influenced mainly by the pressure difference between the corresponding building and the environment. Case 1 is the outlier in terms of HTO unfiltered releases, differing in the range of 10% less when compared to the more complex cases. This difference highlights the negative aspects of an approximate MELCOR model. More specifically, Case 1 overestimates the heat transfer between the CV and its corresponding HS, due to the different specific heat capacity of the HS. Another approximation of Case 1 is related to the local interactions along the walls and floors of the UPC, VS, and LPC. After the LOCA, liquid water condenses in the LPC. Therefore, only the HS of the LPC interacts with liquid water, while the other HSs interact only with steam. Instead, Case 1 models only one HS for the Tokamak building that also interacts with liquid water, influencing its temperature transient. The broad MELCOR model of Case 1 does not accurately evaluate the heat and mass transfer between the CV and the corresponding HS, which corresponds to a lower estimated amount of unfiltered release compared to Case 2 and Case 3.
The preliminary study on relief panel sizing highlighted that for the studied accident scenario, a minimum flow area of around 16 m2 is needed between the UPC and the PHTS to maintain pressure in the UPC below 2 bar (abs). This flow area will increase considering a LOCA from the BZ-PHTS or more severe accident scenarios not analyzed in this study. However, a higher flow discharge towards the building vaults causes an increase in unfiltered releases.
Two additional possible solutions to minimize building pressurization were preliminarily investigated. The first pressure mitigation solution studied is based on a system of spray installed in the UPC. The second pressure mitigation solution is based on a suppression pool connected with the LPC. The spray system successfully mitigates the pressure of the Tokamak building, maintaining the peak value under 2 bar (abs). For this purpose, a spray of 15 m3/s at 20 °C is required. Furthermore, the unfiltered releases are drastically reduced compared to the base case study that adopts flap connections with adjacent buildings. The pressure mitigation system based on a suppression pool installed in the gallery at level B3 does not maintain the peak under 2 bar (abs). The HTO and ACP unfiltered releases slightly decreases compared to the base case.
The results of this exploratory work are preliminary and could provide insights helping to adapt or update model parameters in agreement with advancements in the EU-DEMO design.

Author Contributions

Conceptualization, M.D., T.G. and G.C.; methodology, M.D., T.G., M.T.P., D.N.D., S.C., C.G., J.E.-U., P.C. and G.C.; software, M.D.; validation, M.D. and T.G., writing—original draft preparation, M.D., T.G. and G.C.; writing—review and editing, M.D., T.G., M.T.P., D.N.D., S.C., C.G., J.E.-U., P.C. and G.C. All authors have read and agreed to the published version of the manuscript.

Funding

This work was carried out within the framework of the EUROfusion Consortium, funded by the European Union via the Euratom Research and Training Program (Grant Agreement No 101052200—EUROfusion). Views and opinions expressed are, however, those of the author(s) only and do not necessarily reflect those of the European Union or the European Commission. Neither the European Union nor the European Commission can be held responsible for them.

Data Availability Statement

Data are available only for institutions involved in the EUROfusion project. For that organizations the data presented in this study are available on request from the corresponding author.

Conflicts of Interest

The authors declare no conflict of interest. The funders had no role in the design of the study; in the collection, analyses, or interpretation of data; in the writing of the manuscript, or in the decision to publish the results.

Abbreviations

BBBreeding Blanket
BUBreeder Units
BZBreeder Zone
CCWSComponent Cooling Water System
CFControl Functions
CVControl Volumes
DWTsDouble Wall Tubes
EPPEnd of Plasma Pulse
F4EFusion for Energy
FLFlow paths
FMEAFailure Mode and Effect Analysis
FTPSFast Termination Plasma System
FWFirst Wall
HCLLHelium Cooled Lithium Lead
HCPBHelium Cooled Pebble Bed
HSHeat Structures
ITERInternational Thermonuclear Experimental Reactor
LOCALoss-Of-Coolant Accident
LOFALoss-Of-Flow Accident
LPCLower Pipe Chase
PCPort Cell
PHTSPrimary Heat Transfer System
PIEPostulated Initiating Events
PPPort Plug
RAFMReduced Activation Ferritic Martensitic
SAESafety And Environment
SCSide Caps
SDLSafety Data List
SGStiffening Grid
SPStiffening Plates
SWSide Walls
TBMTest Blanket Module
TMHTop Maintenance Hall
TWCSTokamak Water Cooling System
UPCUpper Pipe Chase
VDSVentilation and Detritiation System
VSVertical Shaft
WCLLWater Cooled Lithium Lead
WCSWater Coolant System

References

  1. Romanelli, F.; Federici, L.; Neu, R.; Stork, D. Fusion Electricity—A Roadmap to the Realization of Fusion Energy; EFDA Report: Garching, Germany, 2012; ISBN 978-3-00-040720-8. [Google Scholar]
  2. Donné, A.J.H. The European roadmap towards fusion electricity. Phil. Trans. R. Soc. A 2019, 377, 20170432. [Google Scholar] [CrossRef] [PubMed] [Green Version]
  3. Federici, G.; Bachmann, C.; Biel, W.; Boccaccini, L.; Cismondi, F.; Ciattaglia, S.; Coleman, M.; Day, C.; Diegele, E.; Franke, T.; et al. Overview of the design approach and prioritization of R&D activities towards an EU DEMO. Fusion Eng. Des. 2016, 1464–1474. [Google Scholar] [CrossRef]
  4. Taylor, N.P. Key issues for the safety and licensing of fusion. Fus. Sci. and Tech. 2005, 47, 959–966. [Google Scholar] [CrossRef]
  5. Caruso, G.; Ciattaglia, S.; Colling, B.; Di Pace, L.; Dongiovanni, D.; D’Onorio, M.; Garcia, M.; Jin, X.; Johnston, J.; Leichtle, D.; et al. DEMO—The main achievements of the Pre-Concept phase of the safety and environmental work package and the development of the GSSR. Fusion Eng. Des. 2022, 176, 113025. [Google Scholar] [CrossRef]
  6. International Nuclear Safety Advisory Group. Basic Safety Principles for Nuclear Power Plants 75-INSAG-3, Rev.1; (INSAG-12); International Atomic Energy Agency—IAEA: Vienna, Austria, 1999. [Google Scholar]
  7. International Nuclear Safety Advisory Group. Defence in Depth in Nuclear Safety; INSAG-10; International Atomic Energy Agency—IAEA: Vienna, Austria, 1996. [Google Scholar]
  8. Jin, X.; Carloni, D.; Stieglitz, R.; Ciattaglia, S.; Johnston, J.; Taylor, N. Proposal of the confinement strategy of radioactive and hazardous materials for the European DEMO. Nuc. Fus. 2017, 57, 046016. [Google Scholar] [CrossRef]
  9. Pinna, T.; Carloni, D.; Carpignano, A.; Ciattaglia, S.; Johnston, J.; Porfiri, M.; Savoldi, L.; Taylor, N.; Sobrero, G.; Uggenti, A.; et al. Identification of accident sequences for the DEMO plant. Fusion Eng. Des. 2017, 124, 1277–1280. [Google Scholar] [CrossRef]
  10. Caruso, G. CONSEN Version 4.0—User’s Guide, Installation and Input Files; SRS-ENEA-FUS: Roma, Italy, 1997. [Google Scholar]
  11. Caruso, G.; Porfiri, M.T. Ice layer growth on a cryogenic surface in a fusion reactor during a loss of water event. Prog. Nucl. Energy 2015, 78, 173–181. [Google Scholar] [CrossRef]
  12. Dongiovanni, D.N.; Ciattaglia, S.; Porfiri, M.T. Parametric explorative study of DEMO galleries pressurization in case of ex-vessel LOCA. Fusion Eng. Des. 2017, 124, 1223–1227. [Google Scholar] [CrossRef]
  13. Jin, X.Z. Preliminary Accident Analysis of Ex-Vessel LOCA for the European DEMO HCPB Blanket Concept. Fusion Sci. Technol. 2021, 77, 391–402. [Google Scholar] [CrossRef]
  14. Moscato, I.; Barucca, L.; Ciattaglia, S.; D’Aleo, F.; Di Maio, P.; Federici, G.; Tarallo, A. Progress in the design development of EU DEMO helium-cooled pebble bed primary heat transfer system. Fusion Eng. Des. 2019, 146, 2416–2420. [Google Scholar] [CrossRef]
  15. Moscato, I.; Barucca, L.; Bubelis, E.; Caruso, G.; Ciattaglia, S.; Ciurluini, C.; Del Nevo, A.; Di Maio, P.; Giannetti, F.; Hering, W.; et al. Tokamak cooling systems and power conversion system options. Fusion Eng. Des. 2022, 178, 113093. [Google Scholar] [CrossRef]
  16. D’Onorio, M. Safety Analyses with uncertainty quantification for fusion and fission nuclear power plants. Applications to EU DEMO fusion reactor and BWRs. Ph.D. Thesis, Sapienza University of Rome, Rome, Italy, 2020. [Google Scholar]
  17. Dongiovanni, D.N.; D’Onorio, M.; Caruso, G.; Pinna, T.; Porfiri, M.T. DEMO Divertor Cassette and Plasma facing Unit in Vessel Loss-of-Coolant Accident. Energies 2022, 15, 8879. [Google Scholar] [CrossRef]
  18. D’Onorio, M.; Dongiovanni, D.; Ricapito, I.; Vallory, J.; Porfiri, M.; Pinna, T.; Caruso, G. Supporting analysis for WCLL test blanket system safety. Fusion Eng. Des. 2021, 173, 112902. [Google Scholar] [CrossRef]
  19. Gauntt, R.O.; Cole, R.; Erickson, C.; Gasser, R.; Rodriguez, S.; Young, M. MELCOR Computer Code Manuals Vol. 1: Primer and Users’ Guide Version 1.8.6; NUREG/CR-6119, Rev. 3; Sandia National Laboratory: Albuquerque, NM, USA, 2005; Volume 1.
  20. Merrill, B.J.; Humrickhouse, P.; Moore, R.L. A recent version of MELCOR for fusion safety applications. Fusion Eng. Des. 2010, 85, 1479–1483. [Google Scholar] [CrossRef]
  21. Bachmann, C. Plant Description Document, v1.9 IDM ref. 2KVWQZ; Project Internal Document for Plant Description; EUROfusion Report: Garching, Germany, 2022. [Google Scholar]
  22. Federici, G.; Boccaccini, L.; Cismondi, F.; Gasparotto, M.; Poitevin, Y.; Ricapito, I. An overview of the EU breeding blanket design strategy as an integral part of the DEMO design effort. Fusion Eng. Des. 2019, 141, 30–42. [Google Scholar] [CrossRef]
  23. Del Nevo, A.; Arena, P.; Caruso, G.; Chiovaro, P.; Di Maio, P.; Eboli, M.; Edemetti, F.; Forgione, N.; Forte, R.; Froio, A.; et al. Recent progress in developing a feasible and integrated conceptual design of the WCLL BB in EUROfusion project. Fusion Eng. Des. 2019, 146, 1805–1809. [Google Scholar] [CrossRef] [Green Version]
  24. D’Onorio, M.; Giannetti, F.; Caruso, G.; Porfiri, M.T. In-box LOCA accident analysis for the European DEMO water-cooled reactor. Fusion Eng. Des. 2019, 146, 732–735. [Google Scholar] [CrossRef] [Green Version]
  25. Martelli, E.; Giannetti, F.; Caruso, G.; Tarallo, A.; Polidori, M.; Barucca, L.; Del Nevo, A. A study of EU DEMO WCLL breeding blanket and primary heat transfer system integration. Fusion Eng. Des. 2018, 136, 828–833. [Google Scholar] [CrossRef]
  26. Barucca, L.; Ciattaglia, S.; Chantant, M.; Del Nevo, A.; Hering, W.; Martelli, E.; Moscato, I. Status of EU DEMO heat transport and power conversion systems. Fusion Eng. Des. 2018, 136, 1557–1566. [Google Scholar] [CrossRef]
  27. Spagnuolo, G.; Arredondo, R.; Boccaccini, L.; Chiovaro, P.; Ciattaglia, S.; Cismondi, F.; Coleman, M.; Cristescu, I.; D’Amico, S.; Day, C.; et al. Integrated design of breeding blanket and ancillary systems related to the use of helium or water as a coolant and impact on the overall plant design. Fusion Eng. Des. 2021, 173, 112933. [Google Scholar] [CrossRef]
  28. Gliss, C.; Bachmann, C.; Ciattaglia, S.; Drumm, B.; Camacho, M.G.; Moscato, I.; Mull, T.; Palermo, I. Integrated design of tokamak building concepts including ex-vessel maintenance. Fusion Eng. Des. 2022, 113068. [Google Scholar] [CrossRef]
  29. Gliss, C.; Bachmann, C.; Ciattaglia, S.; García, M.; Federici, G.; Koerber, M.; Moscato, I.; Riedl, F.; Palermo, I.; Utili, M. Integration of DEMO hazard piping into the tokamak building. Fusion Eng. Des. 2021, 168, 112415. [Google Scholar] [CrossRef]
  30. Gliss, C.; Ciattaglia, S.; Korn, W.; Moscato, I. Initial layout of DEMO buildings and configuration of the main plant systems. Fusion Eng. Des. 2018, 136, 534–5390. [Google Scholar] [CrossRef]
  31. Gliss, C. CAD MODEL of Baseline_Integration of Plant Systems & Tokamak Complex Building BLDG 11-14-74 (WCLL), CAD Model, IDM ref. 2PLBZM; Project Internal Document for CAD Model; EUROfusion Report: Garching, Germany, 2022. [Google Scholar]
  32. Gliss, C. Volume of Tokamak Building Excel Table, v1.9 IDM ref. 2PC2SF; Project Internal Document for Tokamak Building Data; EUROfusion Report: Garching, Germany, 2022. [Google Scholar]
  33. D’Onorio, M.; Caruso, G. Pressure suppression system influence on vacuum vessel thermal-hydraulics and on source term mobilization during a multiple first Wall–Blanket pipe break. Fusion Eng. Des. 2021, 164, 112224. [Google Scholar] [CrossRef]
  34. Mazzini, G.; D’Onorio, M.; Caruso, G. Hydrogen explosion mitigation in DEMO vacuum vessel pressure suppression system using passive recombiners. Fusion Eng. Des. 2021, 171, 112713. [Google Scholar] [CrossRef]
  35. Arena, P.; Del Nevo, A.; Martelli, E. DDD for the Consolidated Design of WCLL—2018, IDM EuroFusion Report, EFDA_D_2N6PT9; Project Internal Document; EUROfusion Report: Garching, Germany, 2019. [Google Scholar]
  36. Povilaitis, M. EU-DEMO Safety Data List, v1.1 IDM ref. 2NUYCH; Project Internal Document for Safety Analysis; EUROfusion Report: Garching, Germany, 2022. [Google Scholar]
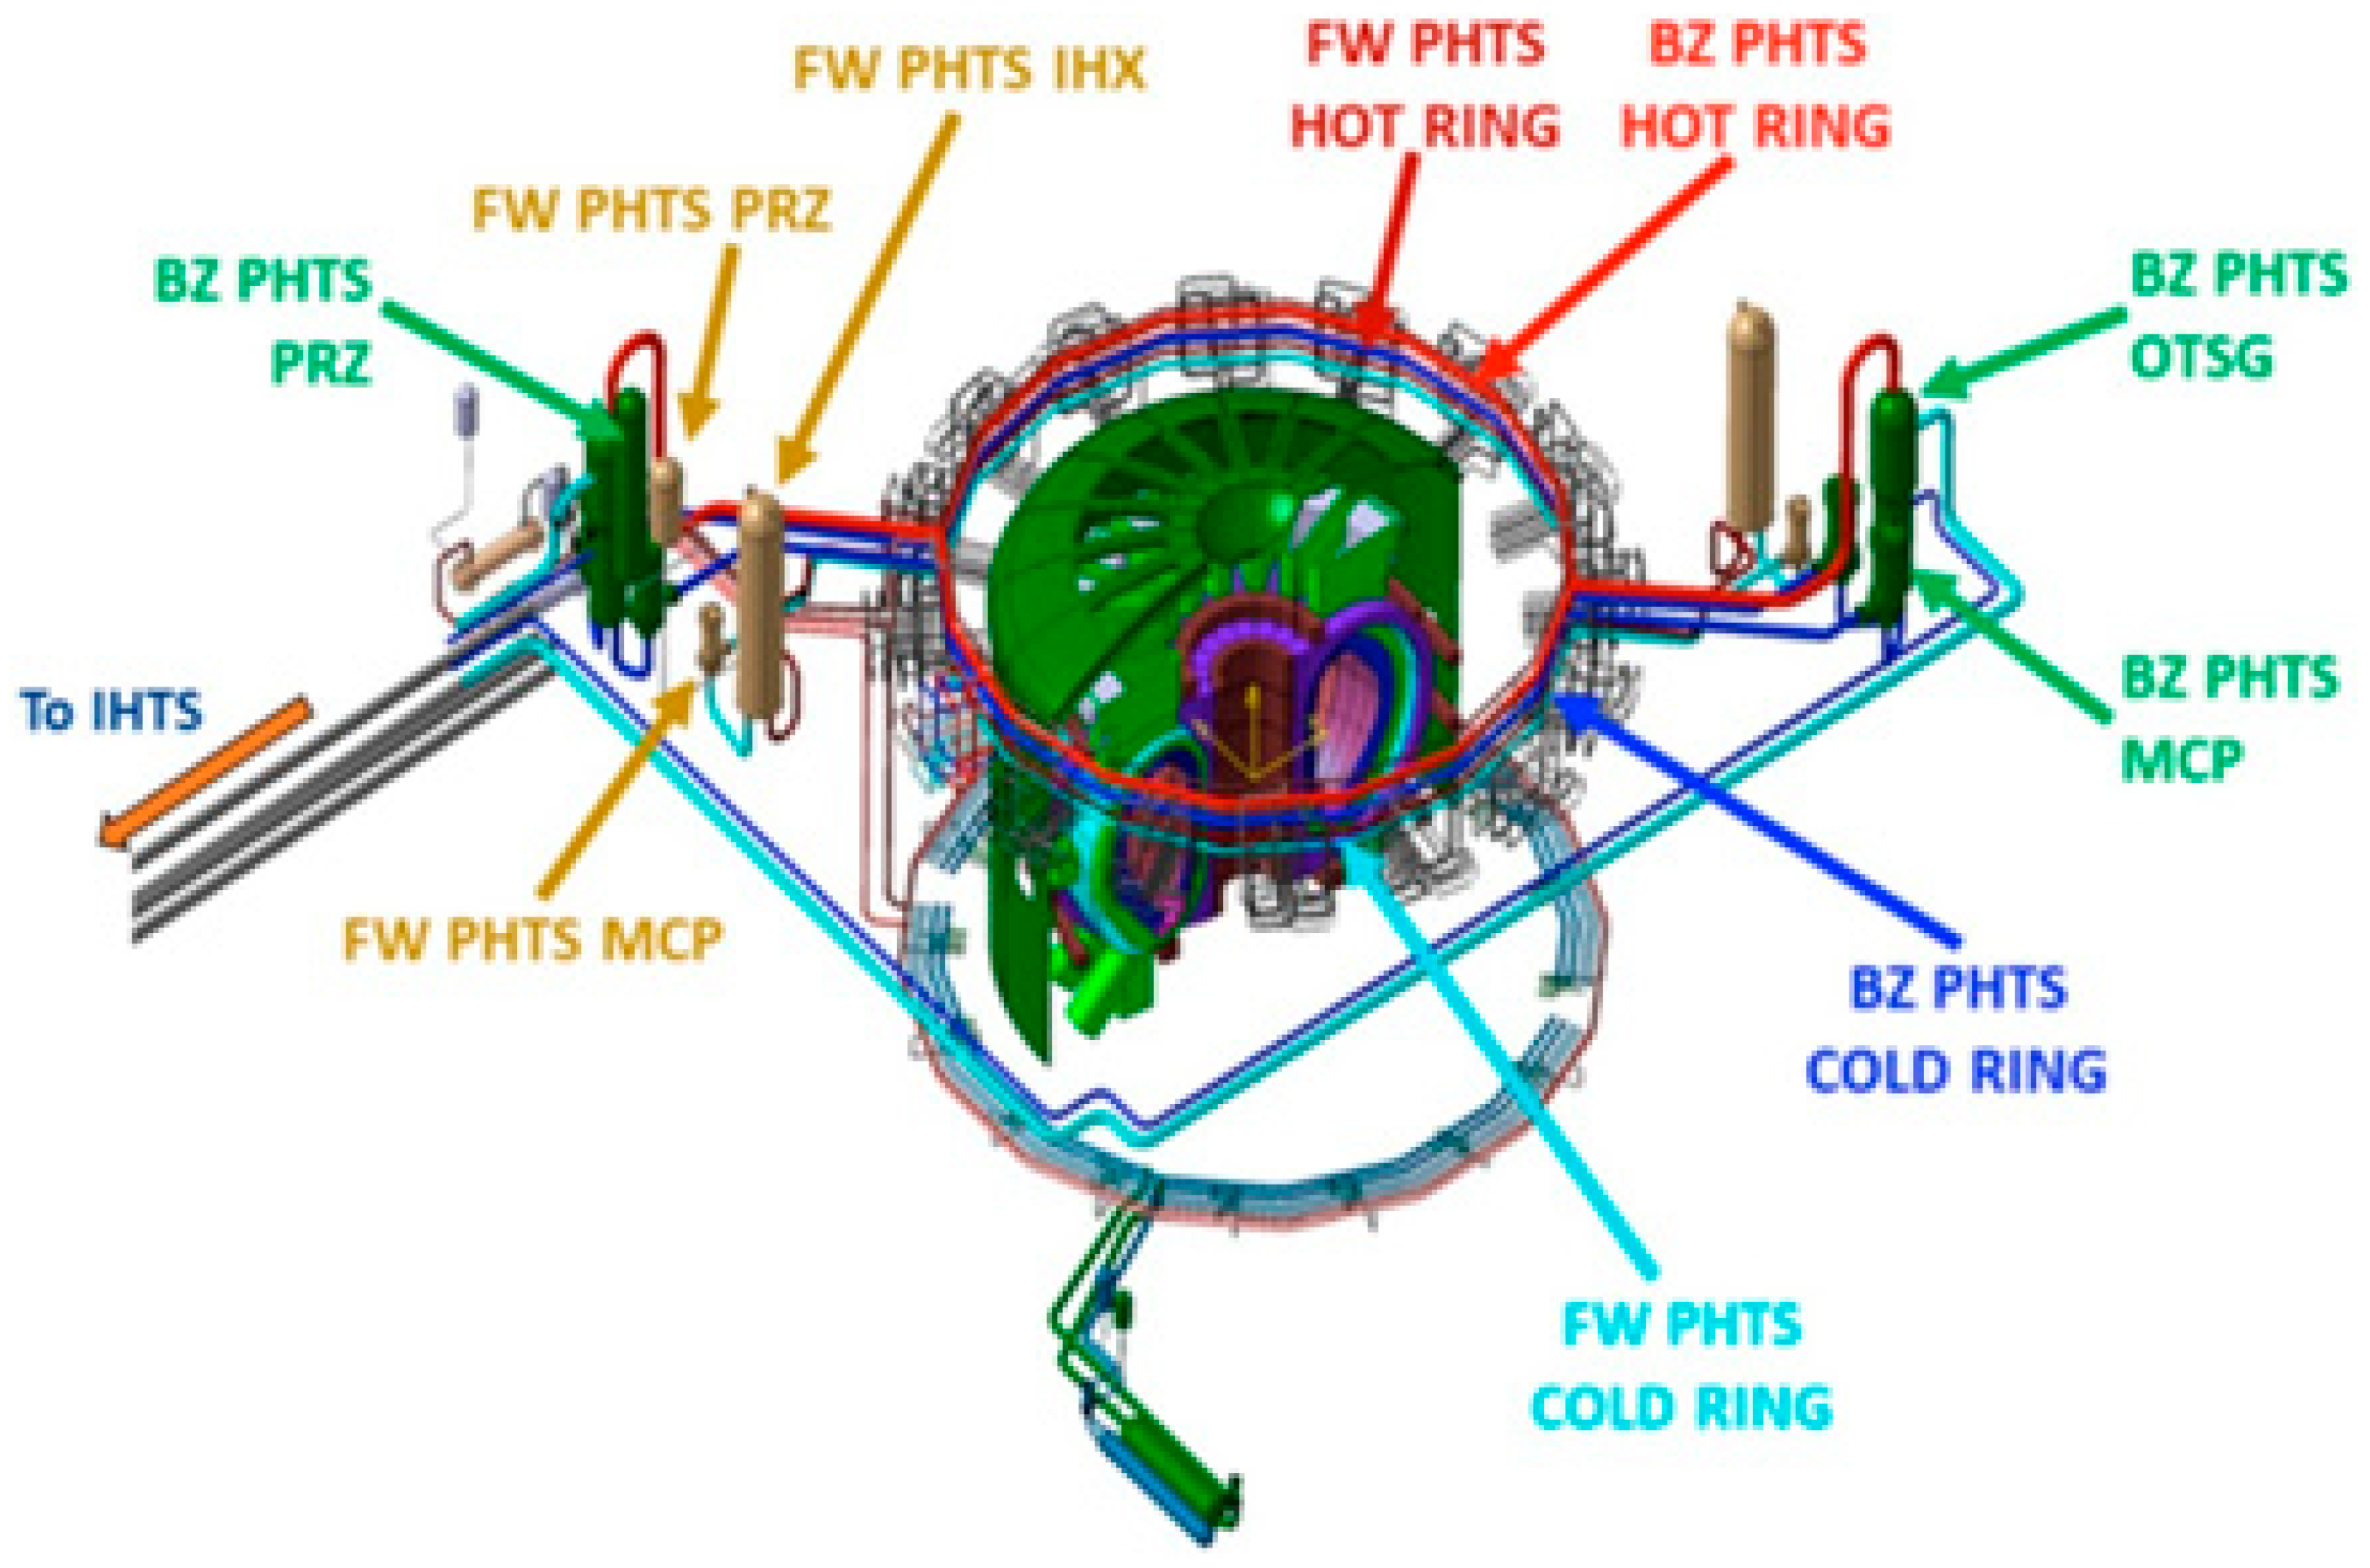
Figure 1. EU DEMO PHTS.
Energies 16 01149 g001
Figure 2. EU DEMO Tokamak Building cross section highlighting free volumes available for steam expansion and building galleries levels.
Energies 16 01149 g002
Figure 3. (a) Upper pipe chase (UPC) area in red and PHTS area in blue; (b) vertical shaft in yellow; (c). lower pipe chase in green.
Energies 16 01149 g003
Figure 4. MELCOR PHTS nodalization scheme.
Energies 16 01149 g004
Figure 5. Different MELCOR nodalization schemes for UPC, VS, LPC, PHTS area, and dome: (a) Case 1: Single Volume Approach; (b) Case 2: Simplified Model; (c) Detailed model.
Energies 16 01149 g005
Figure 6. Dynamic Confinement MELCOR model.
Energies 16 01149 g006
Figure 7. MELCOR Vacuum Vessel nodalization scheme.
Energies 16 01149 g007
Figure 8. Mass flow rate from ring HX cold leg.
Energies 16 01149 g008
Figure 9. Mass of water discharged into the PHTS area.
Energies 16 01149 g009
Figure 10. Maximum pressure in UPC, VS and PHTS area.
Energies 16 01149 g010
Figure 11. Pressure in the PHTS area.
Energies 16 01149 g011
Figure 12. Pressure in the TMH.
Energies 16 01149 g012
Figure 13. Temperature trend of the UPC wall.
Energies 16 01149 g013
Figure 14. Temperature trend of the VS wall.
Energies 16 01149 g014
Figure 15. Temperature trend of the LPC wall.
Energies 16 01149 g015
Figure 16. Direct unfiltered release of HTO (%i.i).
Energies 16 01149 g016
Figure 17. Direct unfiltered release of ACP (%i.i).
Energies 16 01149 g017
Figure 18. Pressure in the UPC for different numbers of relief panels.
Energies 16 01149 g018
Figure 19. Pressure in the PHTS vault for different numbers of relief panels.
Energies 16 01149 g019
Figure 20. Pressure in the PHTS for different numbers of relief panels.
Energies 16 01149 g020
Figure 21. Mass flow rate net balance of PHTS area.
Energies 16 01149 g021
Figure 22. Pressure in the TMH for different numbers of relief panels.
Energies 16 01149 g022
Figure 23. Mass discharge toward the TMH area.
Energies 16 01149 g023
Figure 24. Direct unfiltered release of HTO (%i.i).
Energies 16 01149 g024
Figure 25. Direct unfiltered release of ACP (%i.i).
Energies 16 01149 g025
Figure 26. Pressure in the UPC.
Energies 16 01149 g026
Figure 27. Direct unfiltered release of HTO and ACP (%i.i).
Energies 16 01149 g027
Figure 28. Pressure in the UPC.
Energies 16 01149 g028
Figure 29. Direct unfiltered release of HTO and ACP (%i.i.).
Energies 16 01149 g029
Table 1. FW and BZ parameters at steady-state.
ParameterUnitMELCORReferenceError
MFR OB-BZkg/s385.559 382.5−0.8%
MFR OB-FWkg/s106.2381106.50.24%
MFR IB-BZkg/s96.919596.4−0.53%
MFR IB-FWkg/s35.9499135.6−0.98%
Temp. BZ Hot leg °C327.628328.00.11%
Temp. BZ Cold leg °C295.289295.0−0.098%
Temp. FW Hot leg °C327.690328.00.095%
Temp. FW Cold leg °C294.6627295.00.114%
Pressure BZ-PRZPa1.55 × 1071.55 × 107<0.0001%
Pressure FW-PRZPa1.55 × 1071.55 × 107<0.0001%
BZ MCP HeadPa9.535 × 1059.535 × 105<0.0001%
FW MCP HeadPa8.434 × 1058.434 × 105<0.0001%
Table 2. Maximum pressure in the UPC, PHTS area and TMH.
UPC
Abs. Pressure [bar]
PHTS Area
Abs. Pressure [bar]
TMH
Abs. Pressure [bar]
Case 14.391.611.21
Case 24.411.641.21
Case 34.461.641.20
Table 3. Maximum pressure in the UPC.
UPC
Abs. Pressure [bar]
PHTS Area
Abs. Pressure [bar]
TMH
Abs. Pressure [bar]
X:2 Y:44.411.651.22
X:4 Y:83.811.691.27
X:8 Y:163.081.661.31
X:16 Y:322.451.531.32
X:32 Y:321.941.591.33
Disclaimer/Publisher’s Note: The statements, opinions and data contained in all publications are solely those of the individual author(s) and contributor(s) and not of MDPI and/or the editor(s). MDPI and/or the editor(s) disclaim responsibility for any injury to people or property resulting from any ideas, methods, instructions or products referred to in the content.