Article

Mitigation of Insulator Lightning-Induced Voltages by Installing Parallel Low-Voltage Surge Arresters

by
André M. de Morais
*,
Rodrigo M. S. de Oliveira
and
Marcus V. A. Nunes
Institute of Technology, Federal University of Pará, Belém 66075-110, Brazil
*
Author to whom correspondence should be addressed.
Energies 2023, 16(3), 1111; https://doi.org/10.3390/en16031111
Submission received: 18 December 2022 / Revised: 12 January 2023 / Accepted: 15 January 2023 / Published: 19 January 2023
(This article belongs to the Special Issue EMC Simulation and Modeling in Electrical Power Systems)

Abstract

:
In this paper, we propose a mitigation method for reducing lightning-induced insulator voltages based on the installation of low-voltage surge arresters aligned parallelly to the insulator. The three-dimensional finite-difference time-domain (FDTD) method is applied to numerically model a real surge arrester residual voltage evaluation system. The application of a transient current pulse, typical of lightning discharges, is considered in our numerical model. We considered cases with one or two surge arresters installed per phase, in three different geometric and parametric configurations for installing distribution surge arresters. In addition to the Kirchhoff current division, which reduces both the absorbed energy and the thermal stress, the results associated with the installation of two surge arresters parallelly aligned to the insulator show that the interaction of magnetic fields generated by the surge arresters’ currents can produce an additional strong reduction in lightning-induced voltage over the insulator, as presented in this paper. Conditions for maximum voltage reduction are also identified. A brief cost-effectiveness analysis is also provided.

1. Introduction

Lightning discharges produce strong transient electromagnetic fields associated with fast high-current flows (tens of kiloamperes during a few microseconds, in general). In Brazil alone, the occurrence of 50 to 100 million lightning events is estimated per year [1,2], which is the main cause of service interruptions linked to electric power distribution overhead system issues [3,4,5]. In some Brazilian regions, for instance, 30% to 40% of unavailability events of such distribution systems are caused by lightning occurrences [6,7] and approximately 47% of power transformers are damaged by atmospheric discharges [8], leading to high financial losses to power companies and various damage to society due to electric damage to equipment and interruption in electric power supply.
The proposal of efficient remedial measures applied to power distribution networks is not a simple issue due to the associated complex physics. Therefore, the use of adequate numerical methods and computational tools for modelling the physics of such networks is necessary. The Electromagnetic Transient Program (EMTP) [9], which is based on circuit and transmission line theories for calculating overvoltages and overcurrents in electric power distribution networks, has been frequently employed [10,11,12,13]. However, over the past few years, the use of full-wave numerical approaches for calculating and analyzing transient electromagnetic fields over distribution networks has produced physically complete solutions and, consequently, comprehensive conclusions and new possibilities to solve engineering problems. Among the methods for numerically solving Maxwell’s equations, the finite-difference time-domain (FDTD) method [14,15] has been widely adopted for analyzing transient fields over distribution networks, since it enables modelling complex three-dimensional structures, such as grounding structures [16,17,18,19], power substations [20] and distribution networks [21,22], among others. It naturally considers wave phenomena, such as electromagnetic coupling and induction, reflections and diffractions, allowing one, for example, to perform analyses involving lightning-induced voltages in geometrically and parametrically complex distribution networks [23,24,25,26].
The literature reports the use of two zinc oxide (ZnO) surge arresters (SAs) per phase and set up parallelly to each other as one of the corrective measures for mitigating the undesirable effects of electromagnetic transients in electric power distribution networks. Sugimoto et al. [27] conducted tests in an experimental electric power distribution network by installing two SAs per phase. He showed the effectiveness of that configuration regarding energy absorption by the arresters since they are of the same voltage class and similar voltage-current characteristics. He et al. [28] performed laboratory experiments, statistic and numerical analysis in order to examine the nonuniformity among electrical parameters of ZnO varistors (commercial low-voltage) as a useful tool to select and coordinate the ZnO varistors in parallel operation and improve the protection capability of a surge-protection device (SPD).
Haddat et al. [29] conducted laboratory tests for investigating the disparity in currents of the same voltage class SAs and coincident characteristics, which were set up parallelly, regarding three aspects: (1) the use of ballast resistors, minimizing unbalances and improving the energy absorption rates, (2) study of influence of the arrangement on the current parity and (3) verification of the temperature influence on the residual voltage of the SAs. Tuczec et al. [30] also evaluated the connection of SAs in parallel towards the implications on the surge current division in laboratory tests by analyzing the safety of replacing defective SAs of an arrester bank developed for protecting series compensation capacitors. The experimental results achieved by Sabiha et al. in [31] and their numerical analysis with EMTP indicate that the installation of a spark gap in parallel with the surge arrester reduced the thermal stress on the device and, hence, the risks of failures in SAs. Leal and Oliveira et al. [1] computed electric field distribution in a small riverboat due to lightning strikes using the FDTD method and showed that the electric field produced inside the boat is large enough to cause air breakdown. For this reason, they proposed a cost-effective method (using more than one rod, arranged vertically, parallel to each other) to improve lightning safety for people that use small boats in the Amazon region.
In this work, a theoretical review and FDTD-based numerical analyses are conducted in order to extend the comprehension of SA operation when set up parallel to the insulator, with three geometric and parametric configurations for installing SAs, operating under fast electromagnetic transient lightning fields. For the first time, the three-dimensional analysis region was inspired in a real-world residual voltage test environment for surge arresters. Results showed that the main effect of the magnetic field interactions generated by parts of lightning current flowing through SAs is the significant reduction in the induced electric field over the insulator, being highlighted as a scientific contribution in this paper. Conditions when the insulator is subjected to maximum voltage reduction are also identified and described and a brief cost-effectiveness analysis is provided.
The paper is organized as follows: Section 2 provides a theoretical review regarding quasi-static magnetic fields, on the full-wave FDTD method, and on the typical lightning current mathematical representation; in Section 3, the main research proposal of this paper (installation of SAs parallel to insulators) is presented and technically discussed; details regarding the conceived FDTD model are provided in Section 4; the obtained numerical results are shown and discussed in Section 5; and, finally, conclusions are drawn in Section 6.

2. Theoretical Review

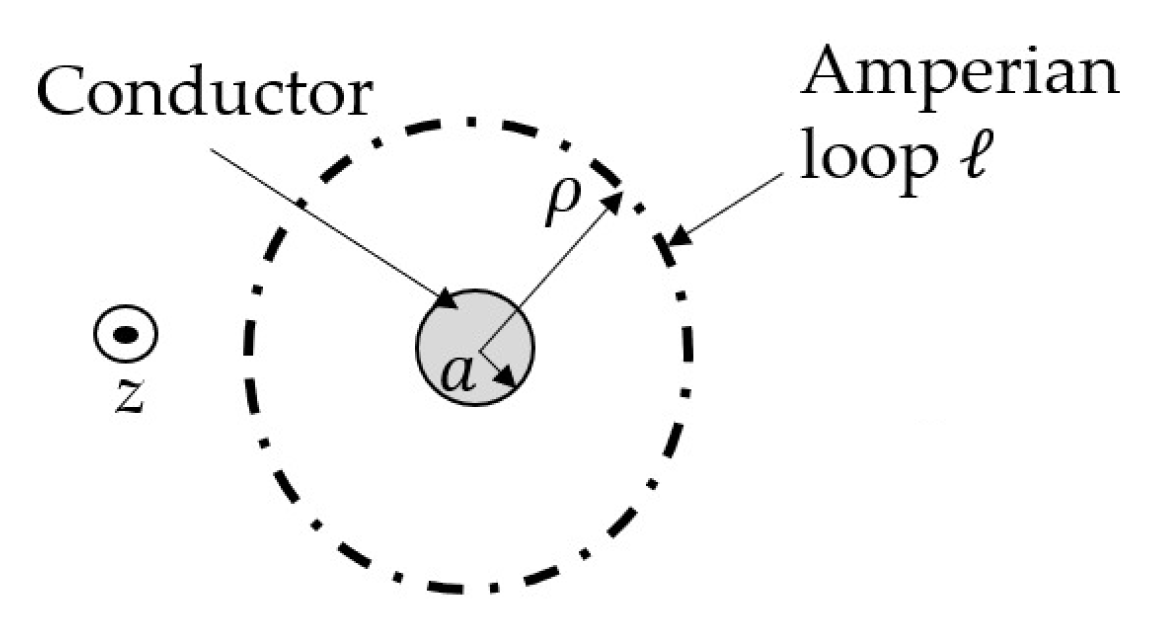
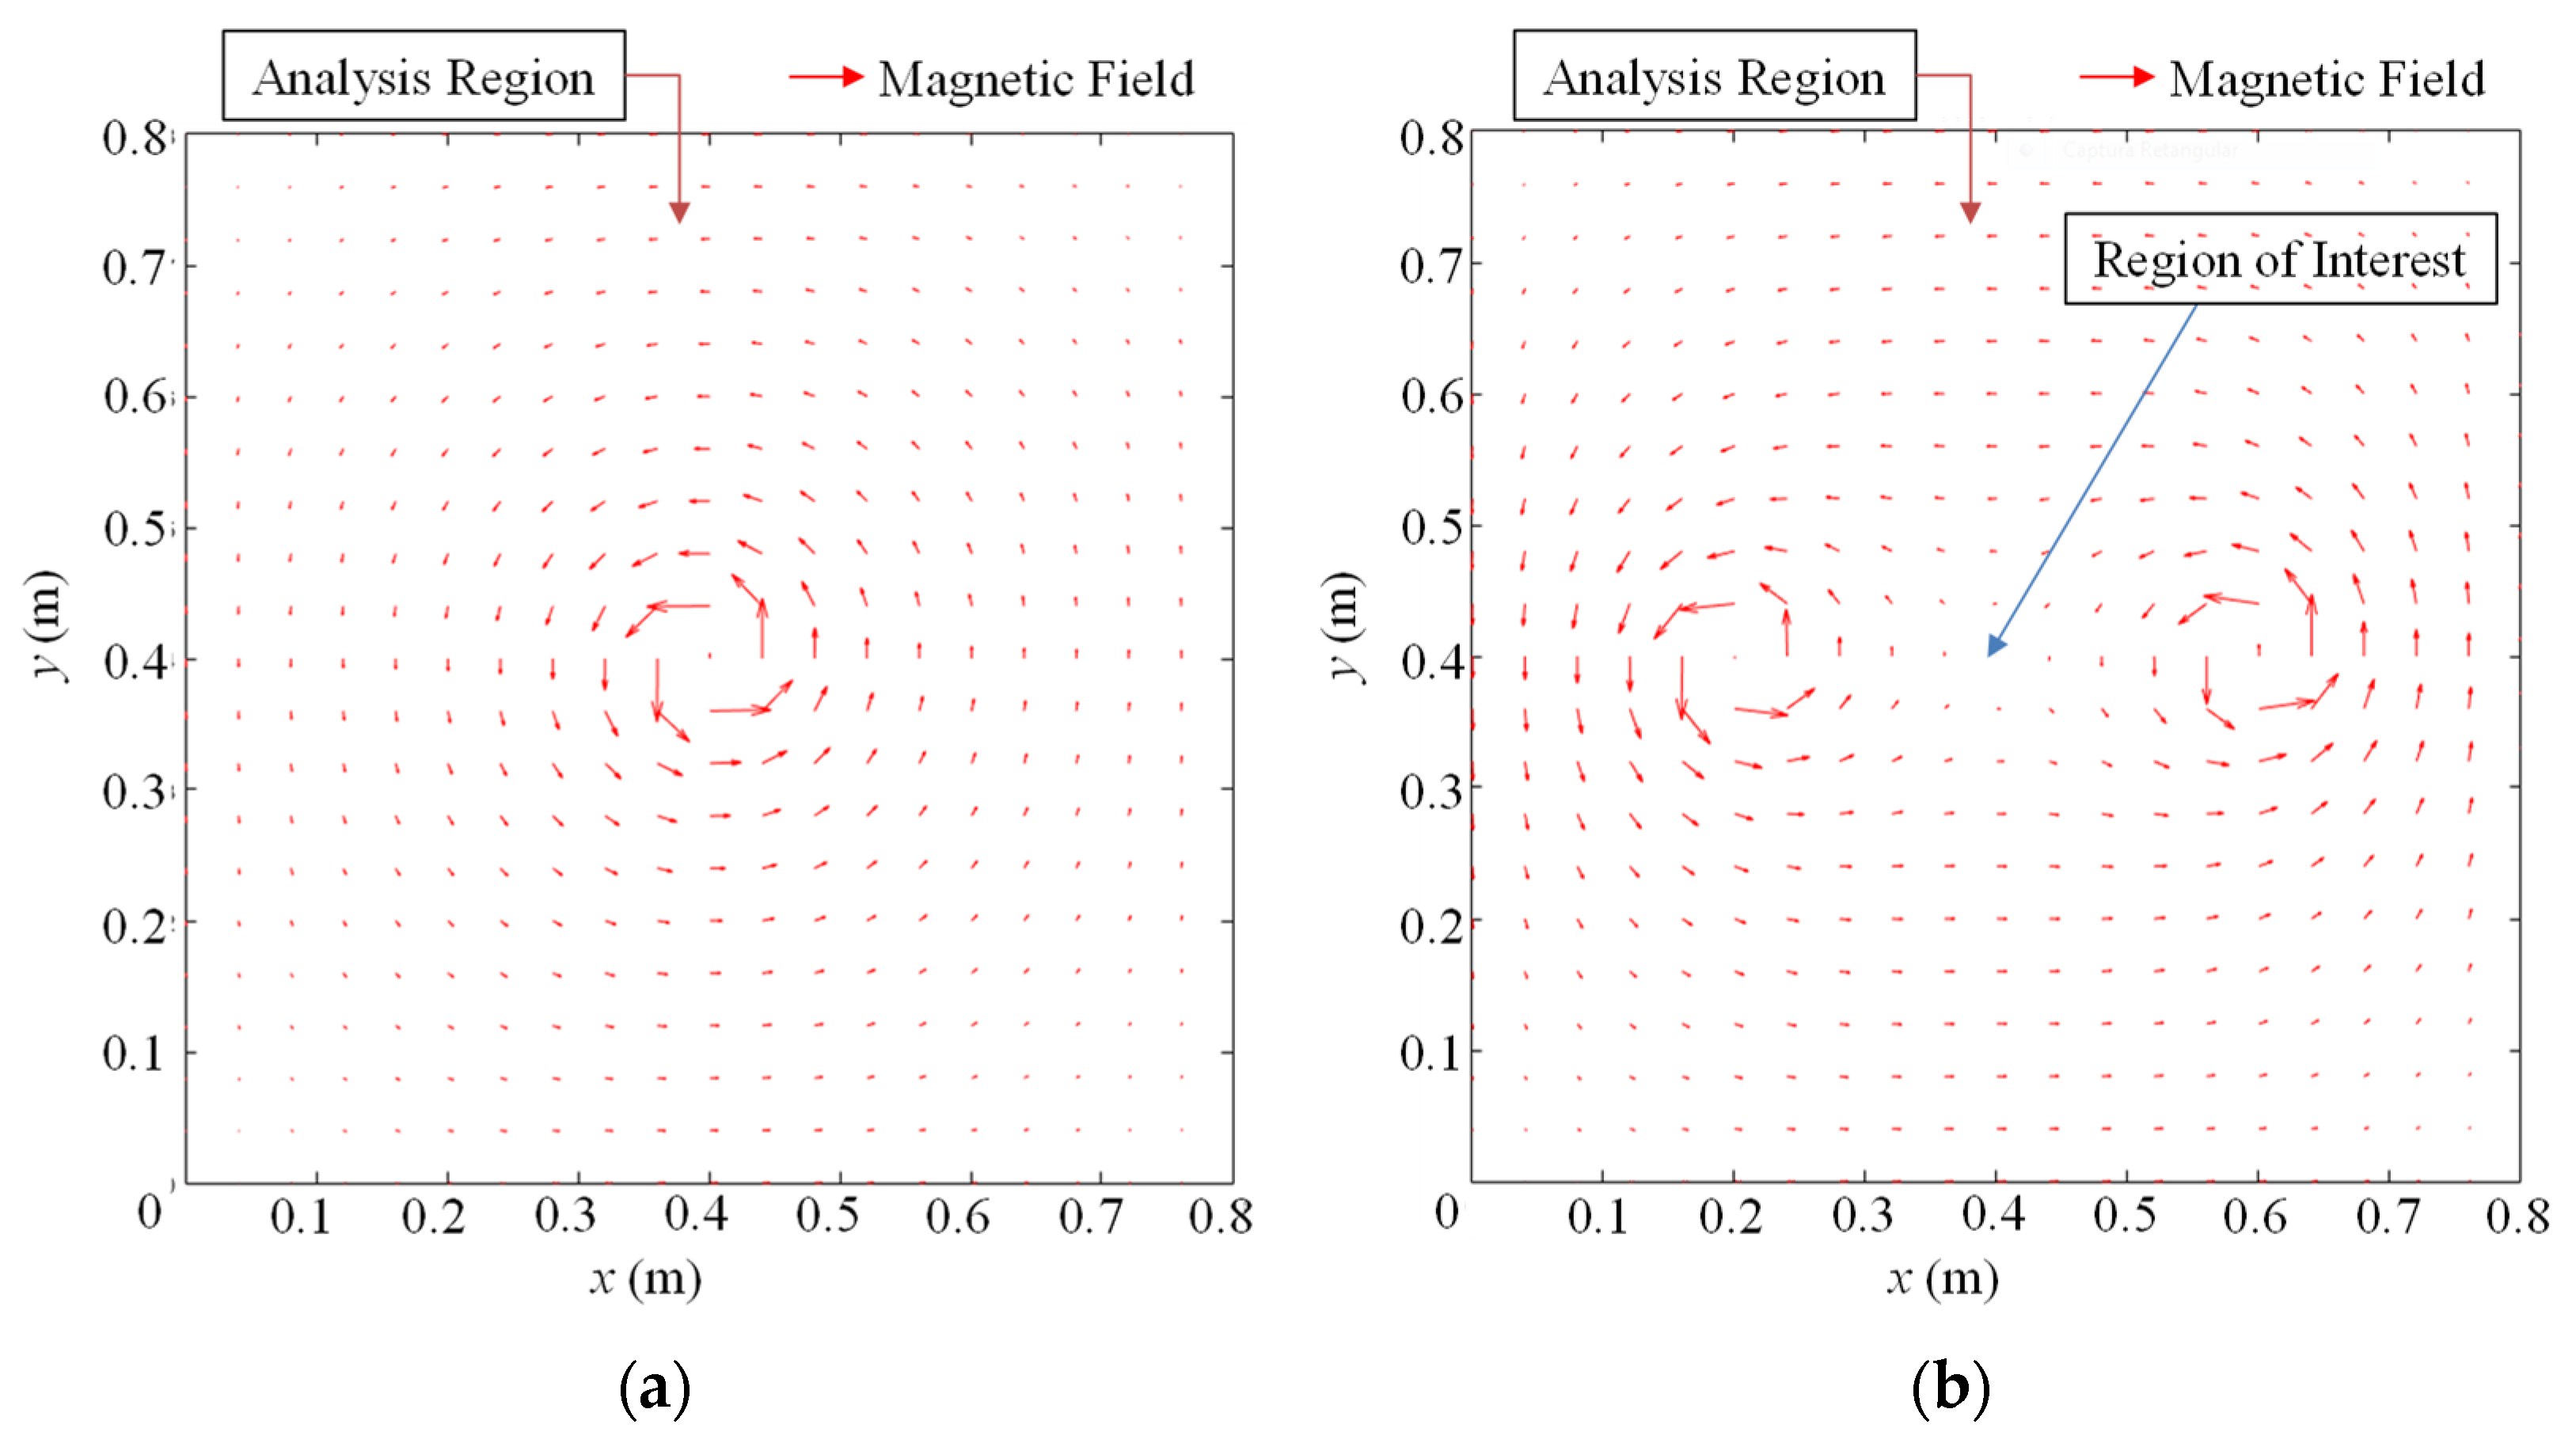
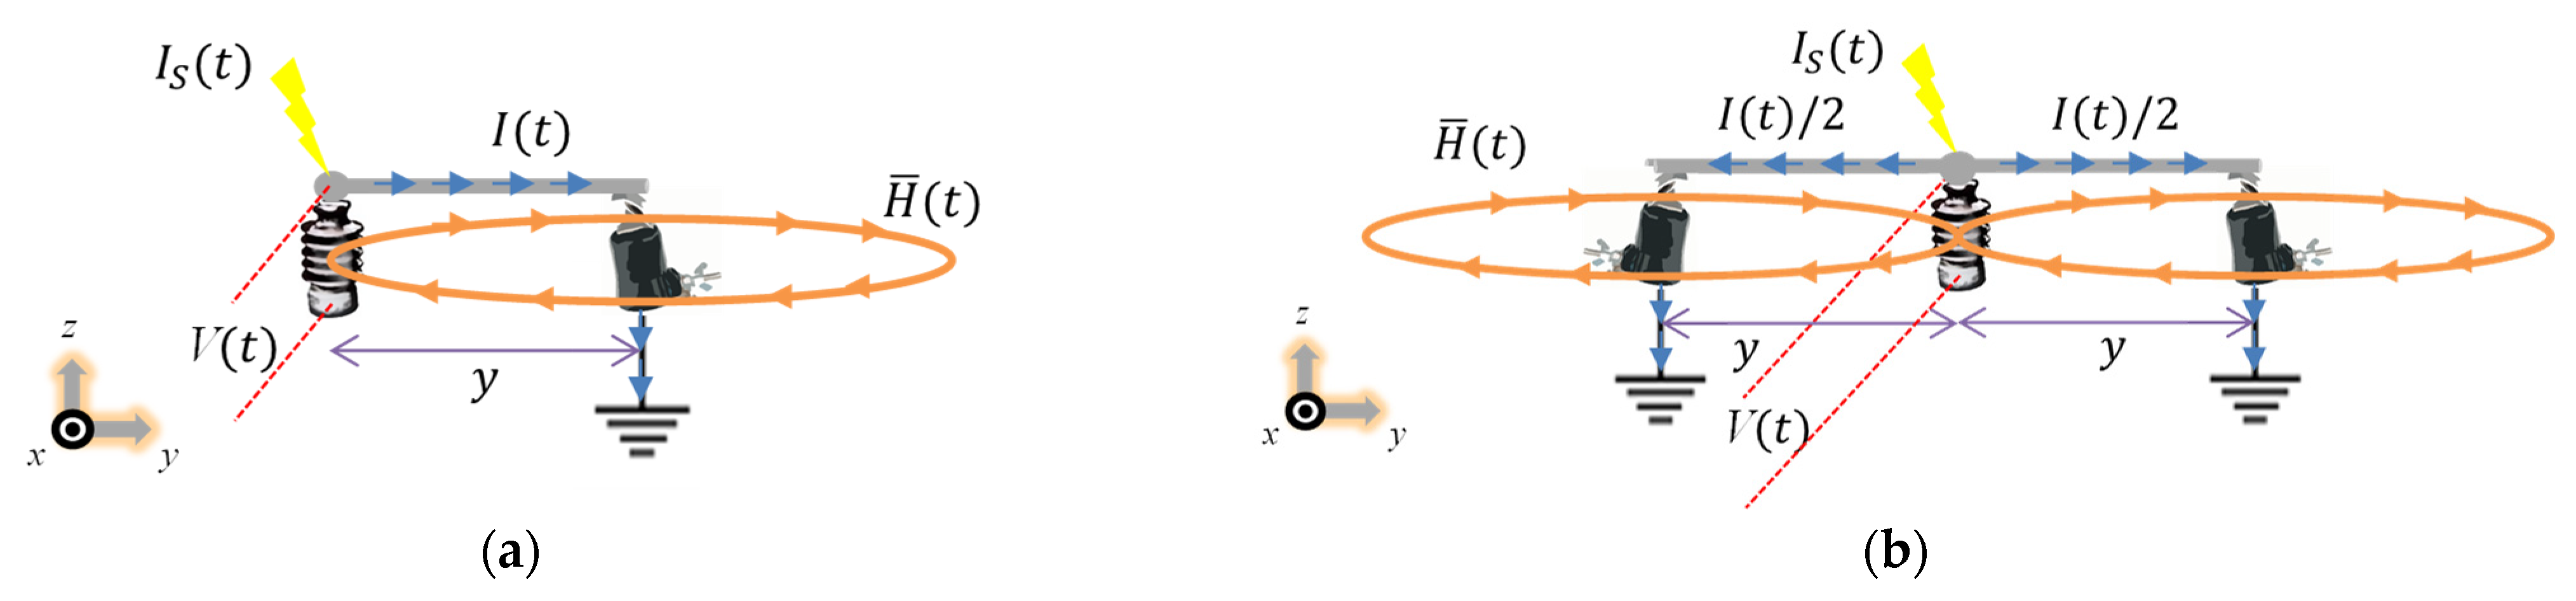
2.1. Interaction of Quasi-Magnetostatic Fields

To develop an effective method for reducing induced voltages over the insulator, Ampère’s law must be revisited. Maxwell’s equation for quasi-magnetostatic fields [32] can be approximated to
× H ¯ J ¯ .
Considering current density J ¯ in the conductor of radius a as in Figure 1 implies the circulation of the quasi-magnetostatic field H ¯ , so we may integrate (1) on a surface S limited by the amperian contour , providing
S × H ¯ · d S ¯ S J ¯ · d S ¯ .
We may assume that
J ¯ = I π a 2 a ¯ z   and   d S ¯ = ρ d ϕ d ρ a ¯ z .
Since ρ, ϕ and z are the coordinates of the cylindrical system and I is the current flowing through the conductor, by applying Stokes’ theorem to the left-hand side of (2), we may write
I = S J ¯ · d S ¯ H ¯ · d l ¯ .
The right-hand side of (4) can be calculated by
H ¯ · d l ¯ = H ϕ 2 π ρ .
Since H ¯ = H ϕ a ¯ ϕ , where H ϕ is the scalar ϕ component of the magnetic field H ¯ , using (4) and (5), we see that, around the cylindrical conductor at distance ρ > a from its center, one has
H ¯ I 2 π ρ a ¯ ϕ .
For illustrative purposes, we numerically solved (6) for two cases: (1) the first problem is illustrated by Figure 2a, which contains a section of a cylindrical conductor with radius measuring 0.02   m (transverse section S 1 ) in a 0.8   m × 0.8   m vacuum analysis region. We established a z-component current density J Z 1 = 1000   A / m ² ; (2) Figure 2b illustrates the second problem, which consists of two parallel conductors immersed in vacuum, of which transverse sections S 1 and S 2 are represented (transverse sections S 1 and S 2 have identical areas and J Z 2 = J Z 1 = 1000   A / m ² ).
Figure 3 shows solutions for both cases. Magnetic field H ¯ in Figure 3a was obtained as expected: it obeys the right-hand rule and the field magnitude decreases with ρ. In Figure 3b, because the vector current densities J Z 1 a ^ z and J Z 2 a ^ z are identical, H ¯ intensity is reduced in the region between the parallel conductors, as predicted by the superposition principle [32] and by directions of magnetic fields produced by the currents, as predicted by (1) and (6).
Let us consider the case in which the insulator is parallelly placed between the z-aligned conductors, in the region of interest in Figure 3b. Voltage between its terminals is produced by the associated electric field E ¯ , which is governed by
E ¯ t = 1 ε × H ¯ .
where ε is the medium electric permittivity and t is time. Therefore, if circulation of quasi-magnetostatic H ¯ is reduced between conductors, temporal derivative of the electric field E ¯ is also reduced, limiting its evolution over time. Consequently, since voltage V A B induced between insulator terminals A and B is related to the electric field line integral
V A B = A B E ¯ · d l ¯ = A B E z d z ,
the induced voltage is also reduced across the insulator. Notice that (8) is calculated along the z-axis, i.e., d l ¯ = d z   a ^ z .
Although (1) can be used as an approximation, full-wave electromagnetic methods are the most rigorous approaches for modelling and analyzing transient fields associated with overhead lines [21,22] and grounding systems [16,17,18,19] since Maxwell’s equations are directly solved numerically. Among the most adopted methodologies, we have the finite element method (FEM) [33], the method of moments (MoM) [34] and the finite-difference time-domain method (FDTD) [14,15]. The methodology adopted in this work is the FDTD approach.

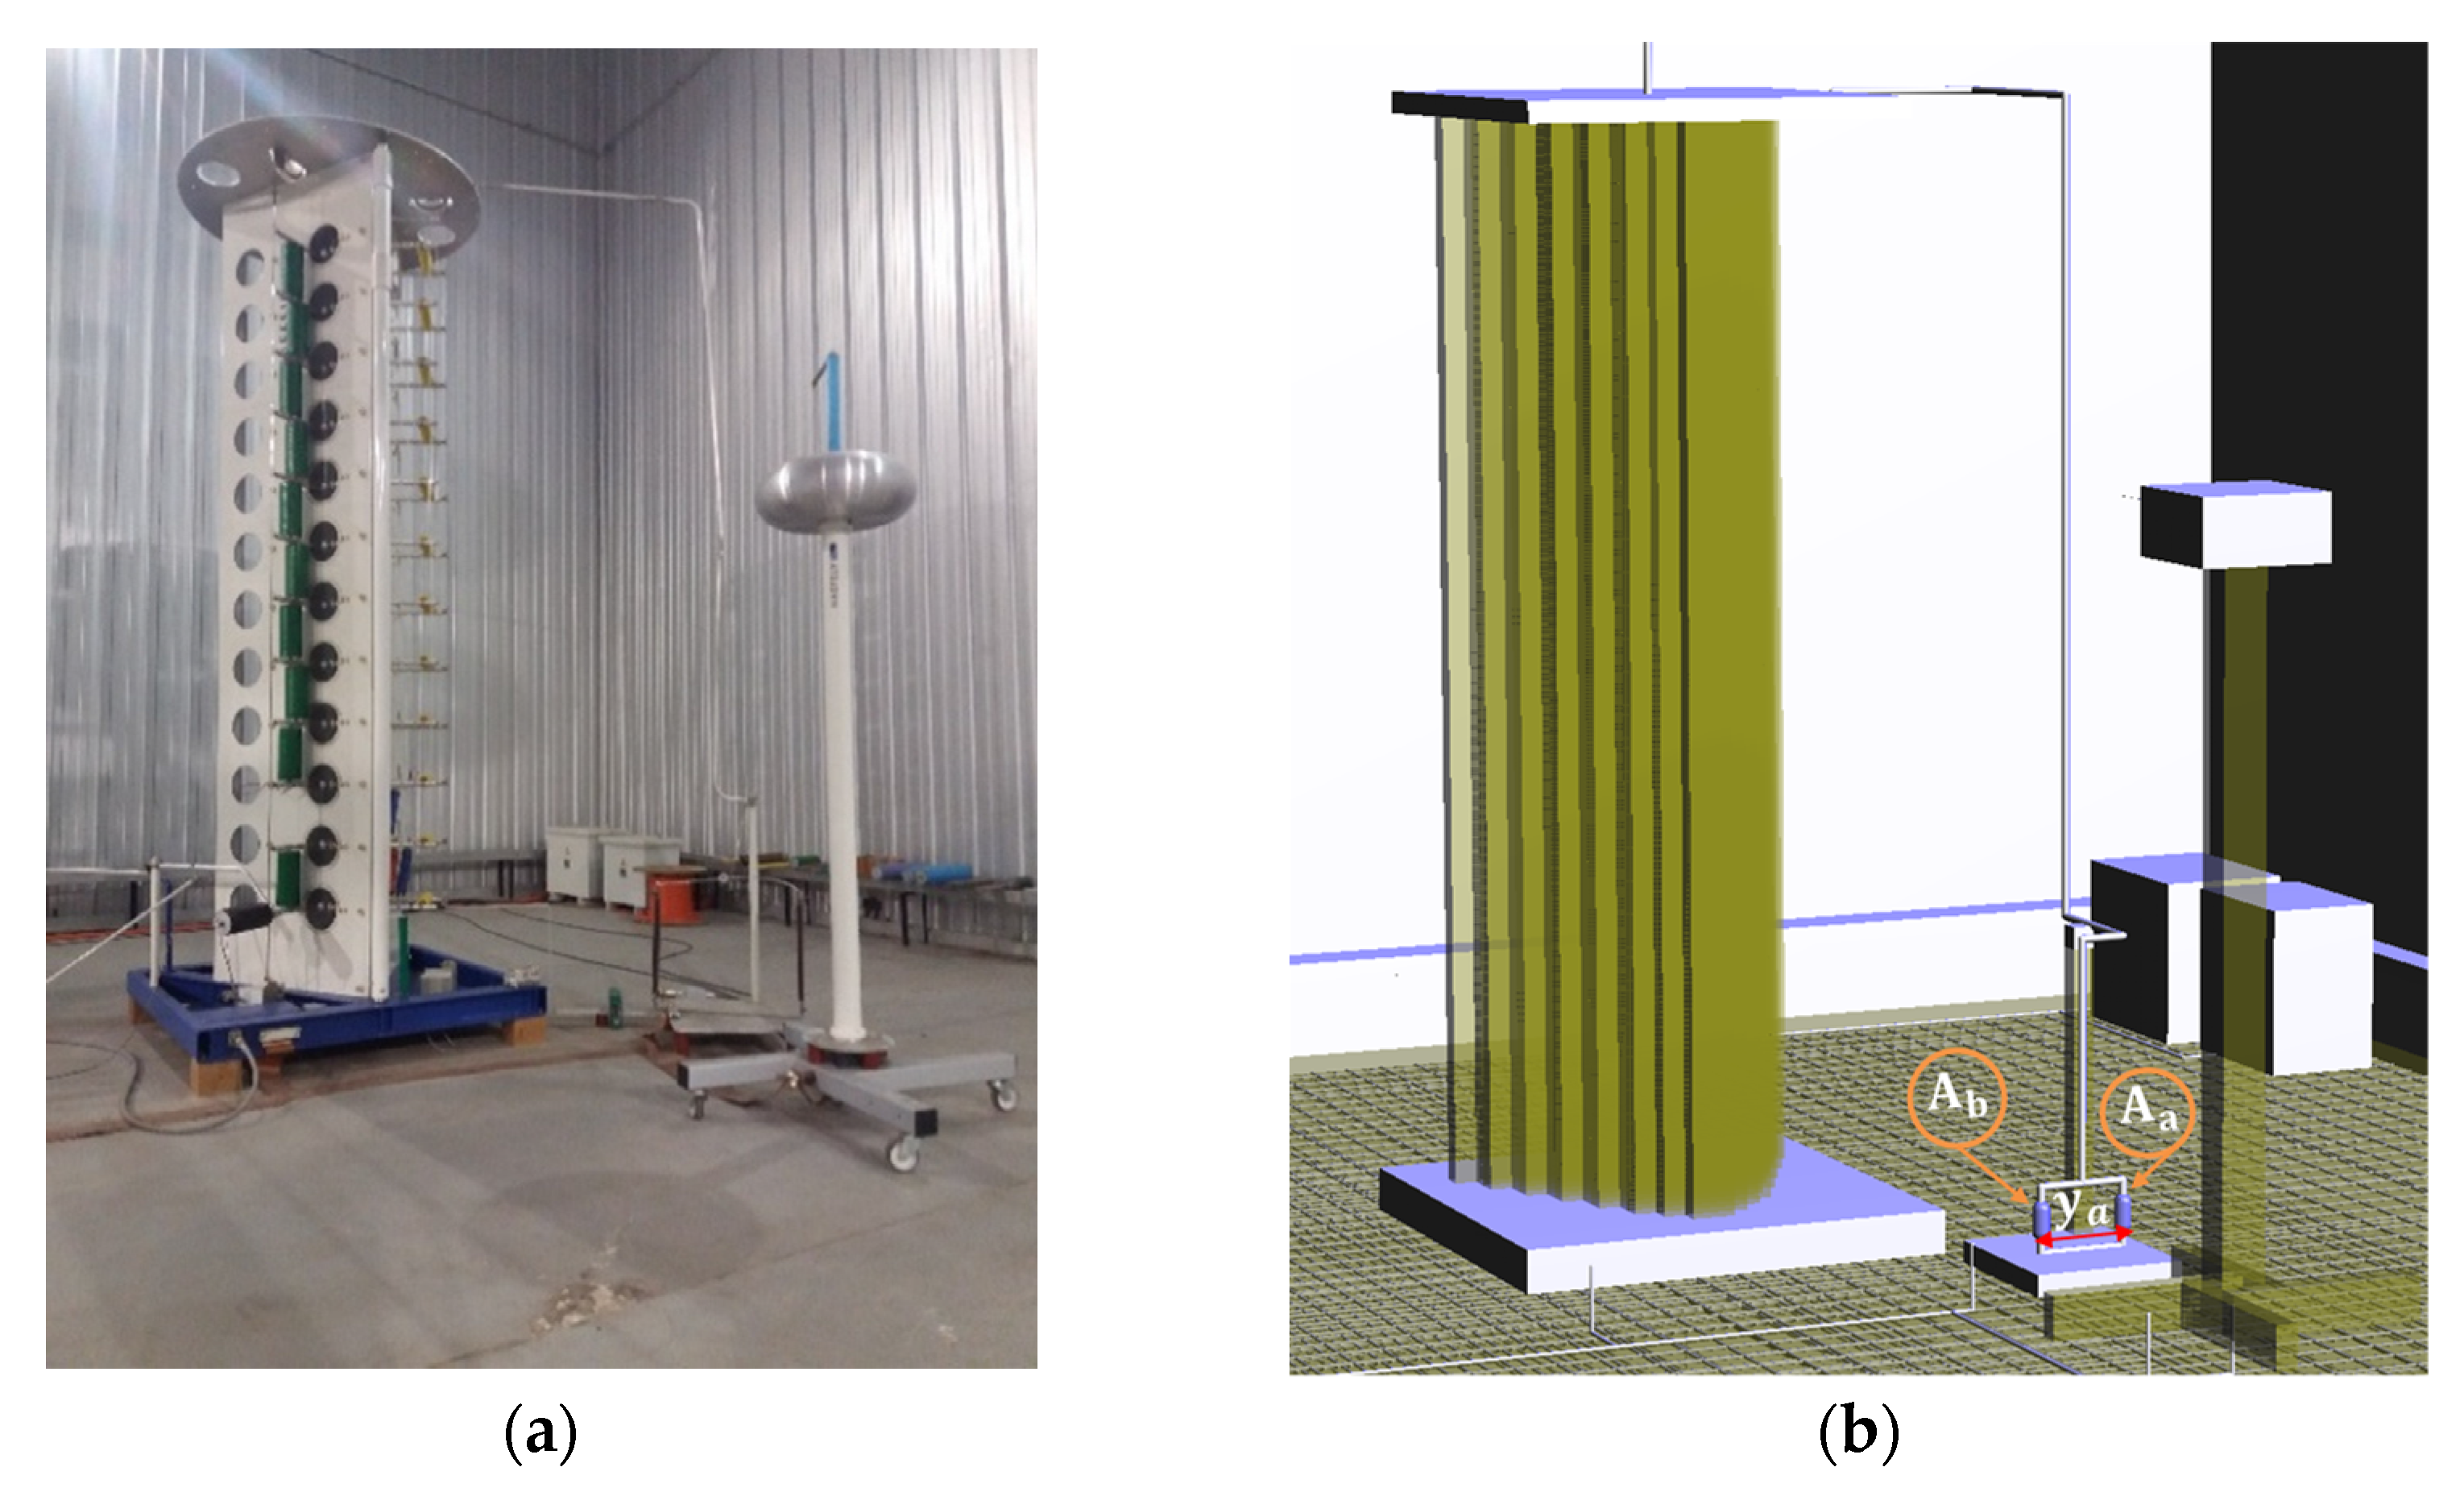
2.2. The FDTD Method and Computational Modelling of Residual Voltage Test Environment

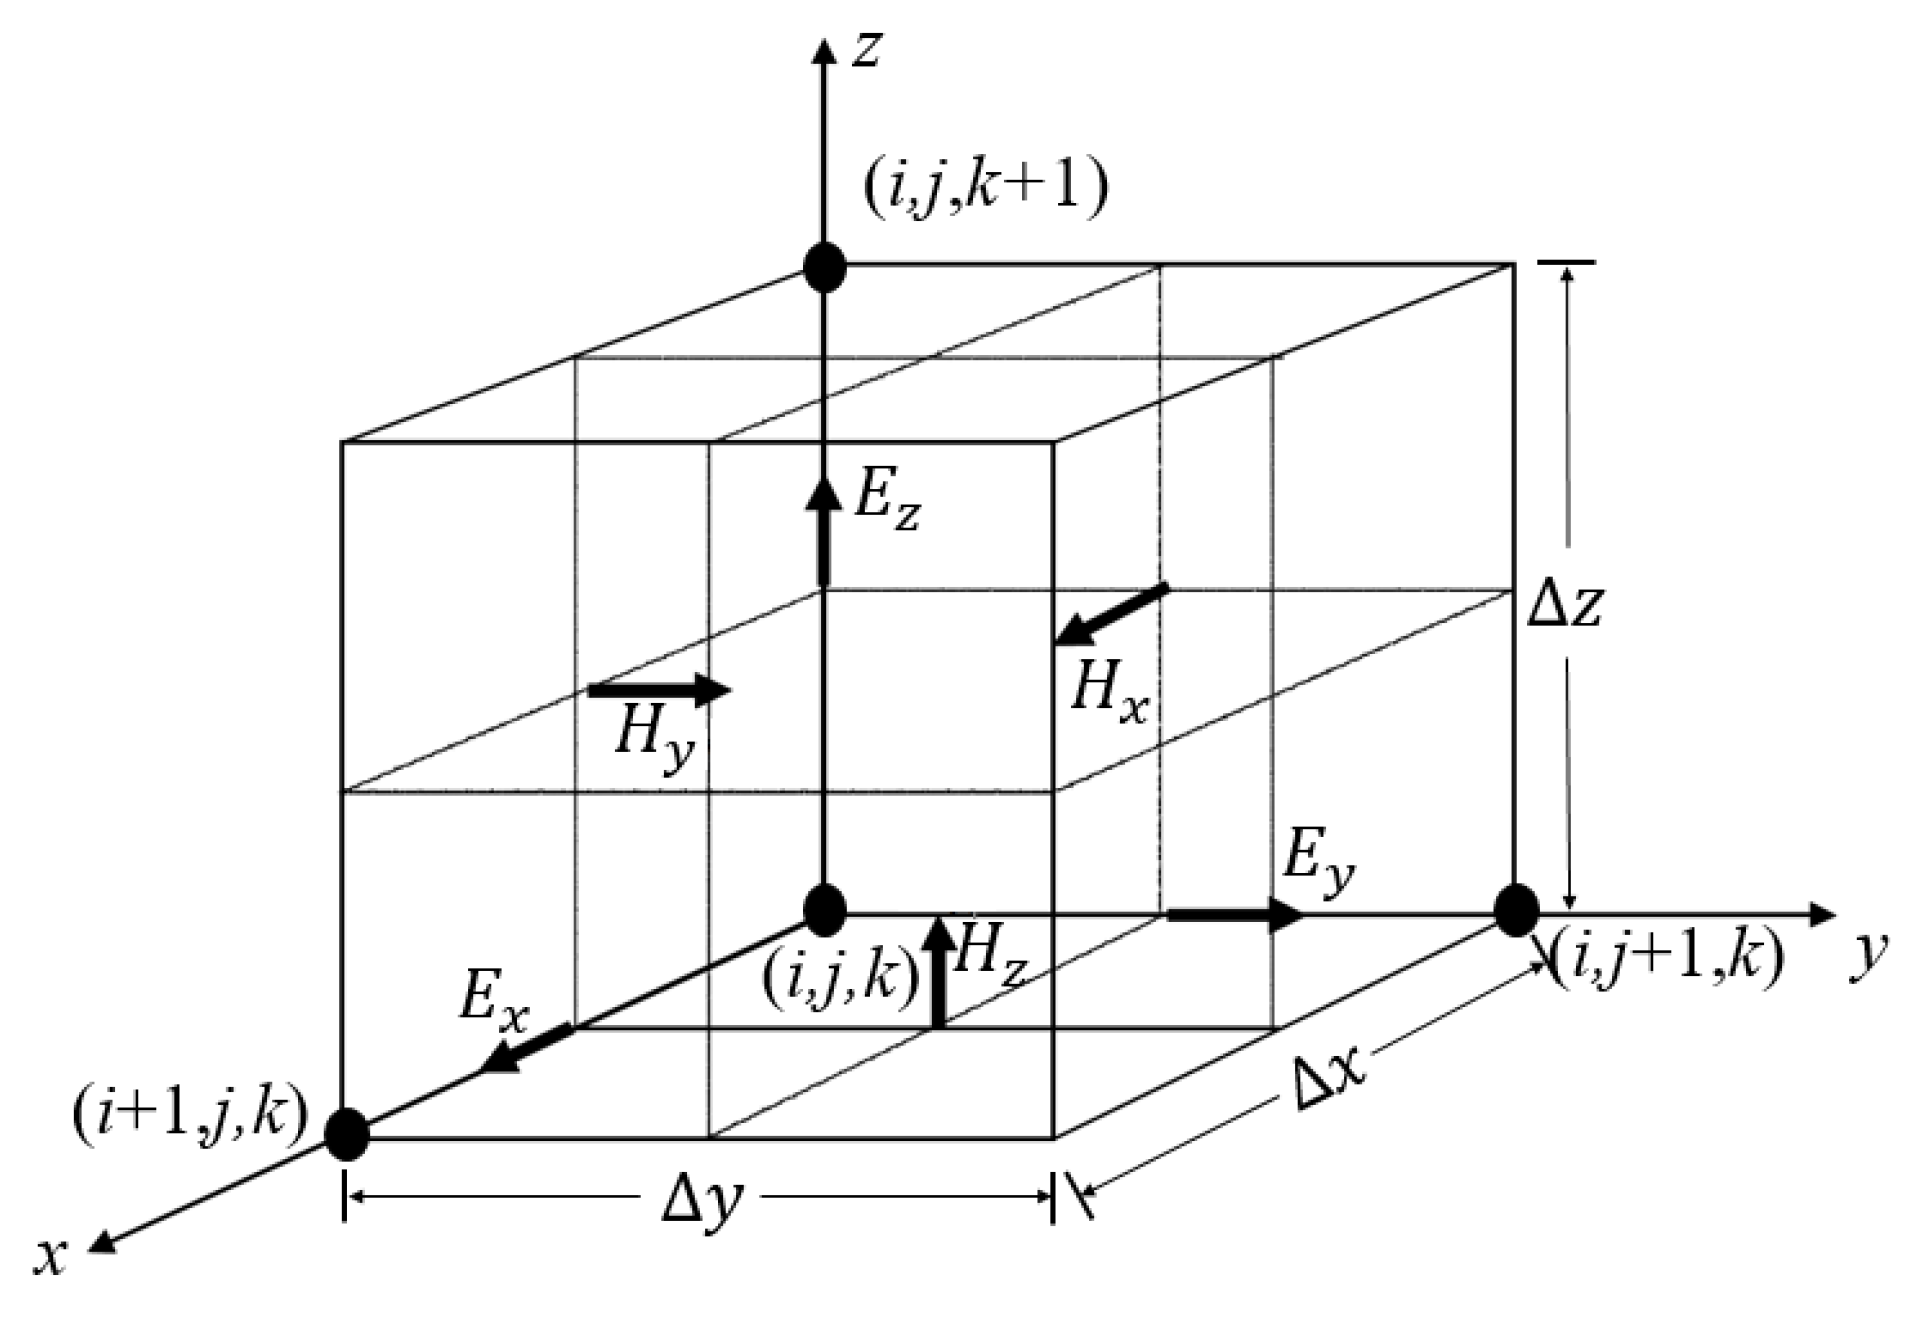
2.2.1. Review of the FDTD Method

FDTD is a technique developed by Kane Yee in 1966 [14] for numerically solving Maxwell’s equations in the time domain. It is based on the following two main aspects: (1) space discretization using cells with discrete spatial distribution of electric and magnetic field components, satisfying Faraday’s and Ampère’s laws in differential and integral forms, and (2) approximation of partial derivatives with respect to time and space in Maxwell’s equations by using second-order central finite differences. This way, approximate explicit equations are obtained for the scalar components of E ¯ and H ¯ [15].
A computational mesh based on Yee cell (Figure 4) is defined for representing space in the analysis region. Considering a general three-dimensional region, the dimensions of cell edges are Δ x , Δ y and Δ z , as shown in Figure 4. The cell spatial positions in the computational domain are defined in terms of array integer indexes i , j and k defined for each cell. The physical coordinates of the corner of the cell ( i , j , k ) are given by x = i Δ x , y = j Δ y and z = k Δ z .
Temporal coordinates are provided by index n and time increment Δ t , such that the physical instants at which electric and magnetic fields are calculated are, respectively, given by t = n Δ t and t = ( n + 0.5 ) Δ t for a given value of n [15]. Thus, a scalar function f , depending on x , y , z and t , is denoted, in its approximate discrete form, by
f ( x , y , z , t ) f d n ( i , j , k ) .
Maxwell’s equations, for Faraday’s and Ampère’s laws, are, respectively, given by
× E ¯ = M ¯ i B ¯ t ,
and
× H ¯ = J ¯ i + J ¯ c + D ¯ t .
Since no magnetic current density M ¯ i is present in our analysis and the media parameters do not depend on frequency (i.e., B ¯ = μ H ¯ , D ¯ = ε E ¯ and J ¯ c = σ E ¯ ) , Equation (10) for the three-dimensional Cartesian space provides the scalar equations
H x t = 1 μ ( E y z E z y ) ,
H y t = 1 μ ( E z x E x z ) ,
and
H z t = 1 μ ( E x y E y x ) .
When electric current density is not imposed, J ¯ i = 0 and (11) produces
E x t = 1 ε ( H z y H y z σ E x ) ,
E y t = 1 ε ( H x z H z x σ E y ) ,
and
E z t = 1 ε ( H y x H x y σ E z ) .
The concept of central finite differences can be applied, for instance, to (12a), (12b) and (13c), respectively, producing the FDTD field equations
H x ( i , j + 1 2 , k + 1 2 ) n + 1 2 = H x ( i , j + 1 2 , k + 1 2 ) n 1 2 + Δ t μ [ E y ( i , j + 1 2 , k + 1 ) n E y ( i , j + 1 2 , k ) n Δ z E z ( i , j + 1 , k + 1 2 ) n E z ( i , j , k + 1 2 ) n Δ y ] ,
H y ( i + 1 2 , j , k + 1 2 ) n + 1 2 = H y ( i + 1 2 , j , k + 1 2 ) n 1 2 + Δ t μ [ E z ( i + 1 , j , k + 1 2 ) n E z ( i , j , k + 1 2 ) n Δ x E x ( i + 1 2 , j , k + 1 ) n E x ( i + 1 2 , j , k ) n Δ z ] ,
and
E z ( i , j , k + 1 2 ) n + 1 = E z ( i , j , k + 1 2 ) n ( 1 σ Δ t 2 ε 1 + σ Δ t 2 ε ) + Δ t ε ( 1 + σ Δ t 2 ε ) [ H y ( i + 1 2 , j , k + 1 2 ) n + 1 2 H y ( i 1 2 , j , k + 1 2 ) n + 1 2 Δ x H x ( i , j + 1 2 , k + 1 2 ) n + 1 2 H x ( i , j 1 2 , k + 1 2 ) n + 1 2 Δ y ] .

2.2.2. Accuracy and Stability

Since numerical methods are defined from approximations, numerical errors are present, which are cumulative and must be minimized so that the iterative processes converge to an exact solution. In FDTD, errors are dependent on spatial increments Δ x , Δ y and Δ z and also on time step Δ t . A numerical phenomenon produced by errors from FDTD discretization schema is numerical dispersion (phase velocities of wave depending on frequency and discretization parameters) [20]. The space discretization criterion
Δ x , y , z λ m i n 10 ,
is adopted for minimizing numerical dispersion [15] (minimum wavelength must be represented by at least ten cells). On the other hand, for guaranteeing stability for the FDTD temporal marching, Δ t is limited by the Courant’s condition [15], given by
Δ t 1 v m a x ( 1 Δ x ) 2 + ( 1 Δ y ) 2 + ( 1 Δ z ) 2   .
If Yee cells are cubic with edges measuring Δ, (18) is reduced to
Δ t Δ v m a x 3   .
In this work, cubic Yee cells are used, with edges measuring Δ = 0.1 m.

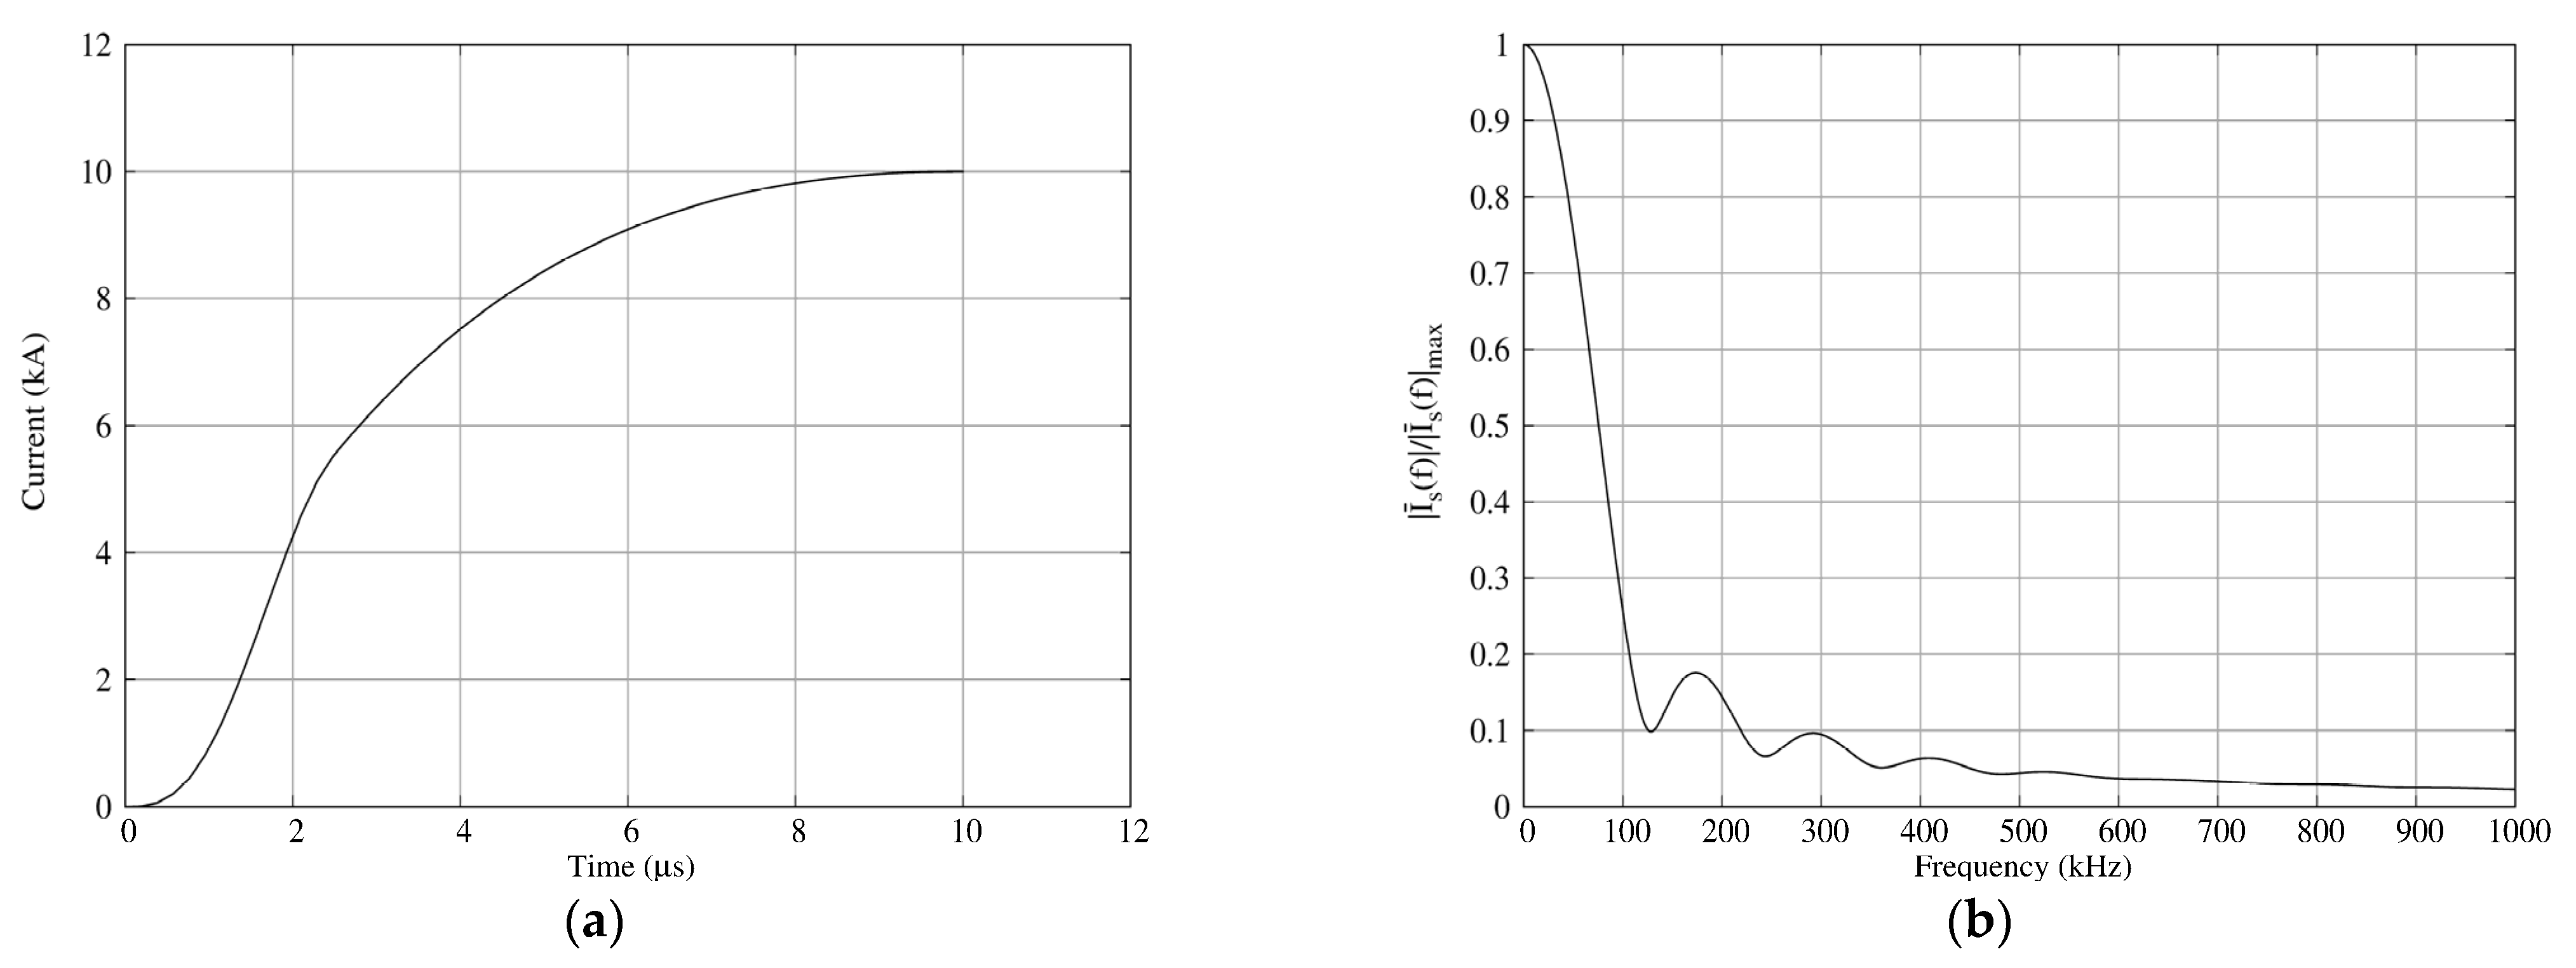
2.2.3. The Excitation Source: Lightning Current

The lightning current I s ( t ) exciting our numerical model is described by (20) [16], given in amperes by
I s ( t ) = { ( I max A 0 ) ( e a 1 n Δ t e a 2 n Δ t ) sin 2 ( ω 0 n Δ t ) ,                       if       n Δ t 1.5 T f ( I max A 0 ) ( e a 1 n Δ t e a 2 n Δ t ) ,                                                                     if     n Δ t > 1.5 T f ,
where T f = 1.66   μ s is the front time, T t = 13   μ s is the tail time, A 0 = e a 1 T 0 e a 2 T 0 , a 1 = 0.08147180 / T f , a 2 = 2.358427881 / T t , T 0 = ln [ ( a 1 / a 2 ) / ( a 1 a 2 ) ] , ω 0 = π / 3 T f and I max = 10   kA is the current peak in (20). The function I s ( t ) , given by (20) and its parametric values produce the waveform illustrated by Figure 5a (truncated at 10 μ s ), which is used for calculating the Fourier transform I ¯ s ( f ) , shown in Figure 5b in its absolute normalized form | I ¯ s ( f ) | / | I ¯ s ( f ) | max . The frequency domain lightning current has appreciable energy up to approximately f = 1 MHz, which implies that λ m i n 106   m and Δ x , y , z 10.6   m , in such a way that the cubic Yee cell edge dimension Δ = 0.1 m used in this work satisfies the condition (17). Finally, in this work, time step Δ t is calculated by Δ t = 0.99 Δ / ( v m a x 3 ) , where v m a x is the light speed in a vacuum.

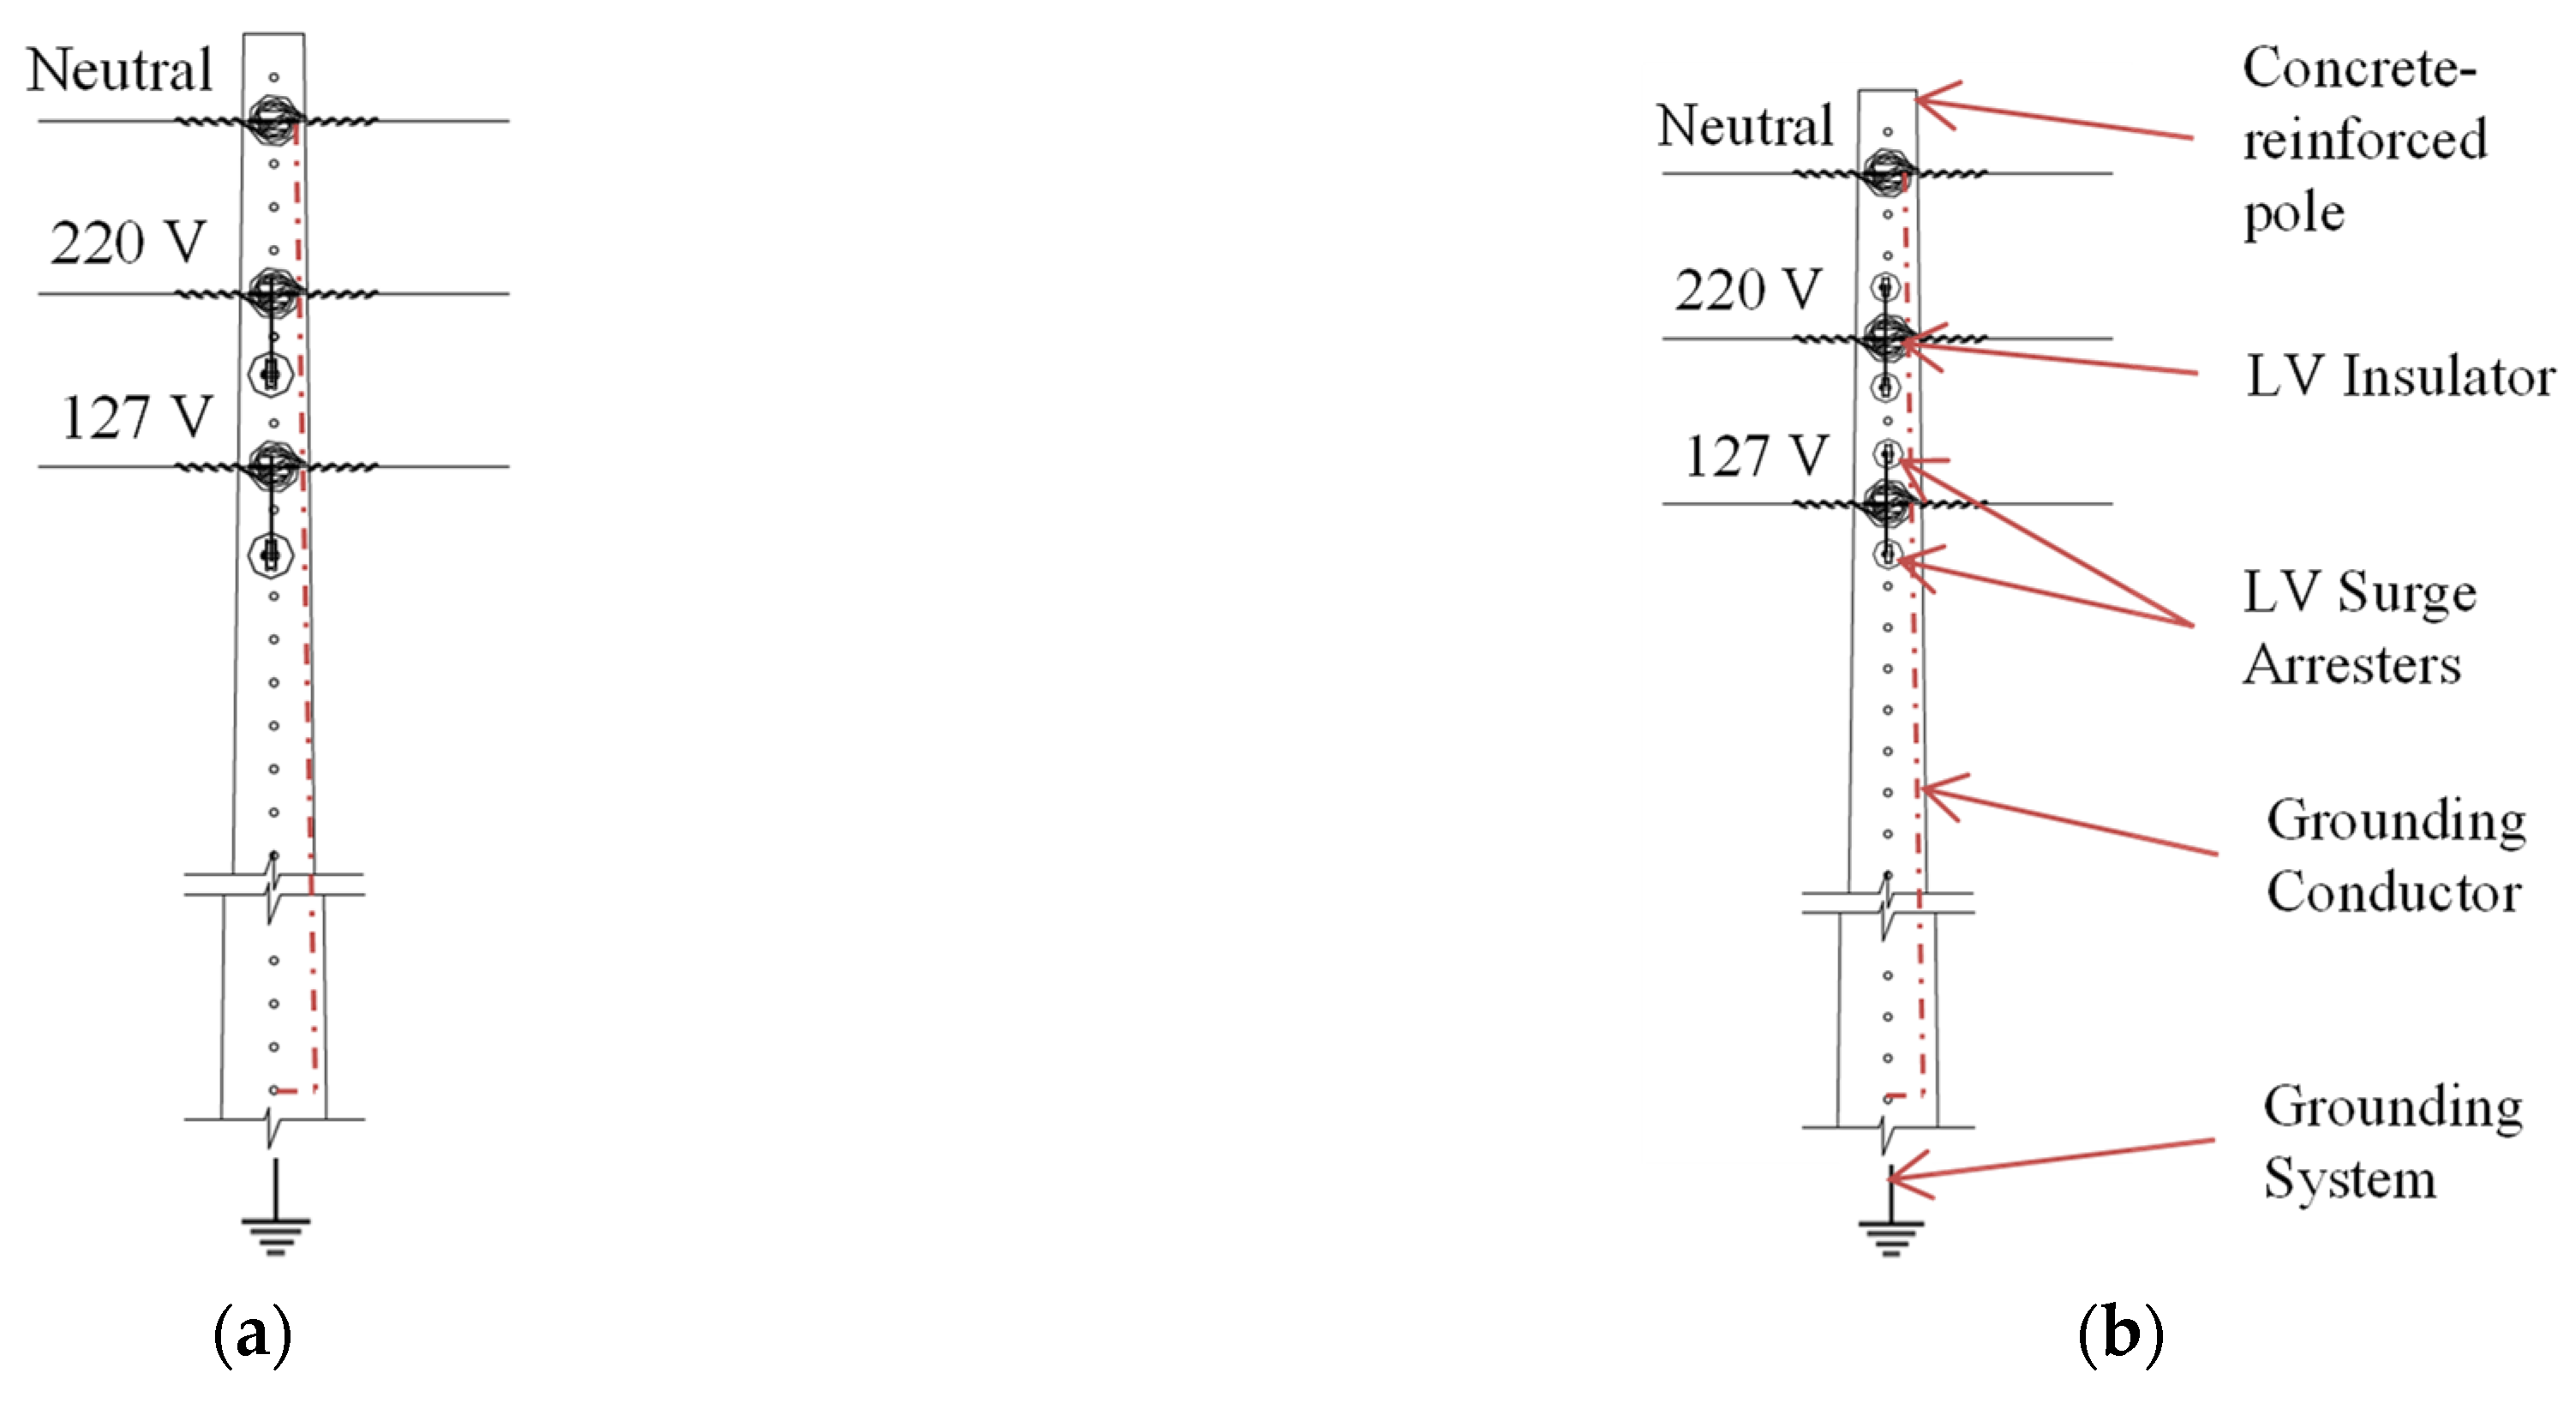
3. Research Proposal: Geometric and Parametric Configurations for Installing Distribution Surge Arresters and Insulators

By observing Figure 3b and Ampère’s law, as given by (7) or (13c), we see that it is possible to diminish insulator-induced voltage V A B , given by (8), by installing the insulation device in the region of interest in Figure 3b. Observe from (7), (13c) and (9) that reducing circulation of H ¯ on planes parallel to the xy-plane, in the region of interest in Figure 3b, implies reducing E z , consequently decreasing V A B if the insulator is installed in the region of interest. This effect can be achieved by allowing magnetic fields, which are generated by same-direction parallel electric currents, to superpose in the region of interest. During a lightning event, the currents should flow through two (or more) lightning arresters placed equidistantly and parallelly to the insulator (see Sub-item 2.1). Although surge arresters have been installed parallel to insulators before [27,28,29,30], full-wave electromagnetic analysis has not been performed. This way, based on full-wave FDTD modeling and analysis, we propose three geometrical configurations for positioning the insulator and electric power distribution class SAs at the low-voltage (LV) level, aiming at minimizing V A B .
Figure 6a shows a typical Single-Phase Earth Return (SPER) system, often adopted for powering rural houses [35]. Those networks are frequently exposed to incidence of lightning discharges due to low shielding factor [4,10]. In SPER systems, each voltage line is supported by an insulator and it is protected by a single SA. If a line is hit by lightning current, electrons flow through the connected surge arrester to ground, producing magnetic fields similar to those illustrated by Figure 3a around the SA (see Figure 7a), which penetrate the insulator. Figure 6b shows one of the proposed configurations, in which each voltage line is protected by two SAs placed equidistantly and parallel to the corresponding line insulator. Once a lightning current hits a voltage line protected by two SAs, part of the surge current flows across each SA and, consequently, a magnetic field distribution similar to that in Figure 3b is produced, in such a way that the total magnetic field penetrating the insulator (which is mainly a result of superposed magnetic fields produced by currents flowing across SAs) is minimized (see also Figure 7b), thus, reducing the induced voltage across the insulator. The surge arresters’ impedances should ideally be equal and SA current phases should ideally be the same. Notice that, as previously addressed in [27,28,29], a strong decline in arrester current (such as the approximately 50% of proposed cases) decreases the dissipated energy and thermal stress in each device, mitigating occurrences of arrester failures. Additionally, reducing voltage V A B induced across insulator terminals has the effect of increasing the level of availability in the electric power system.

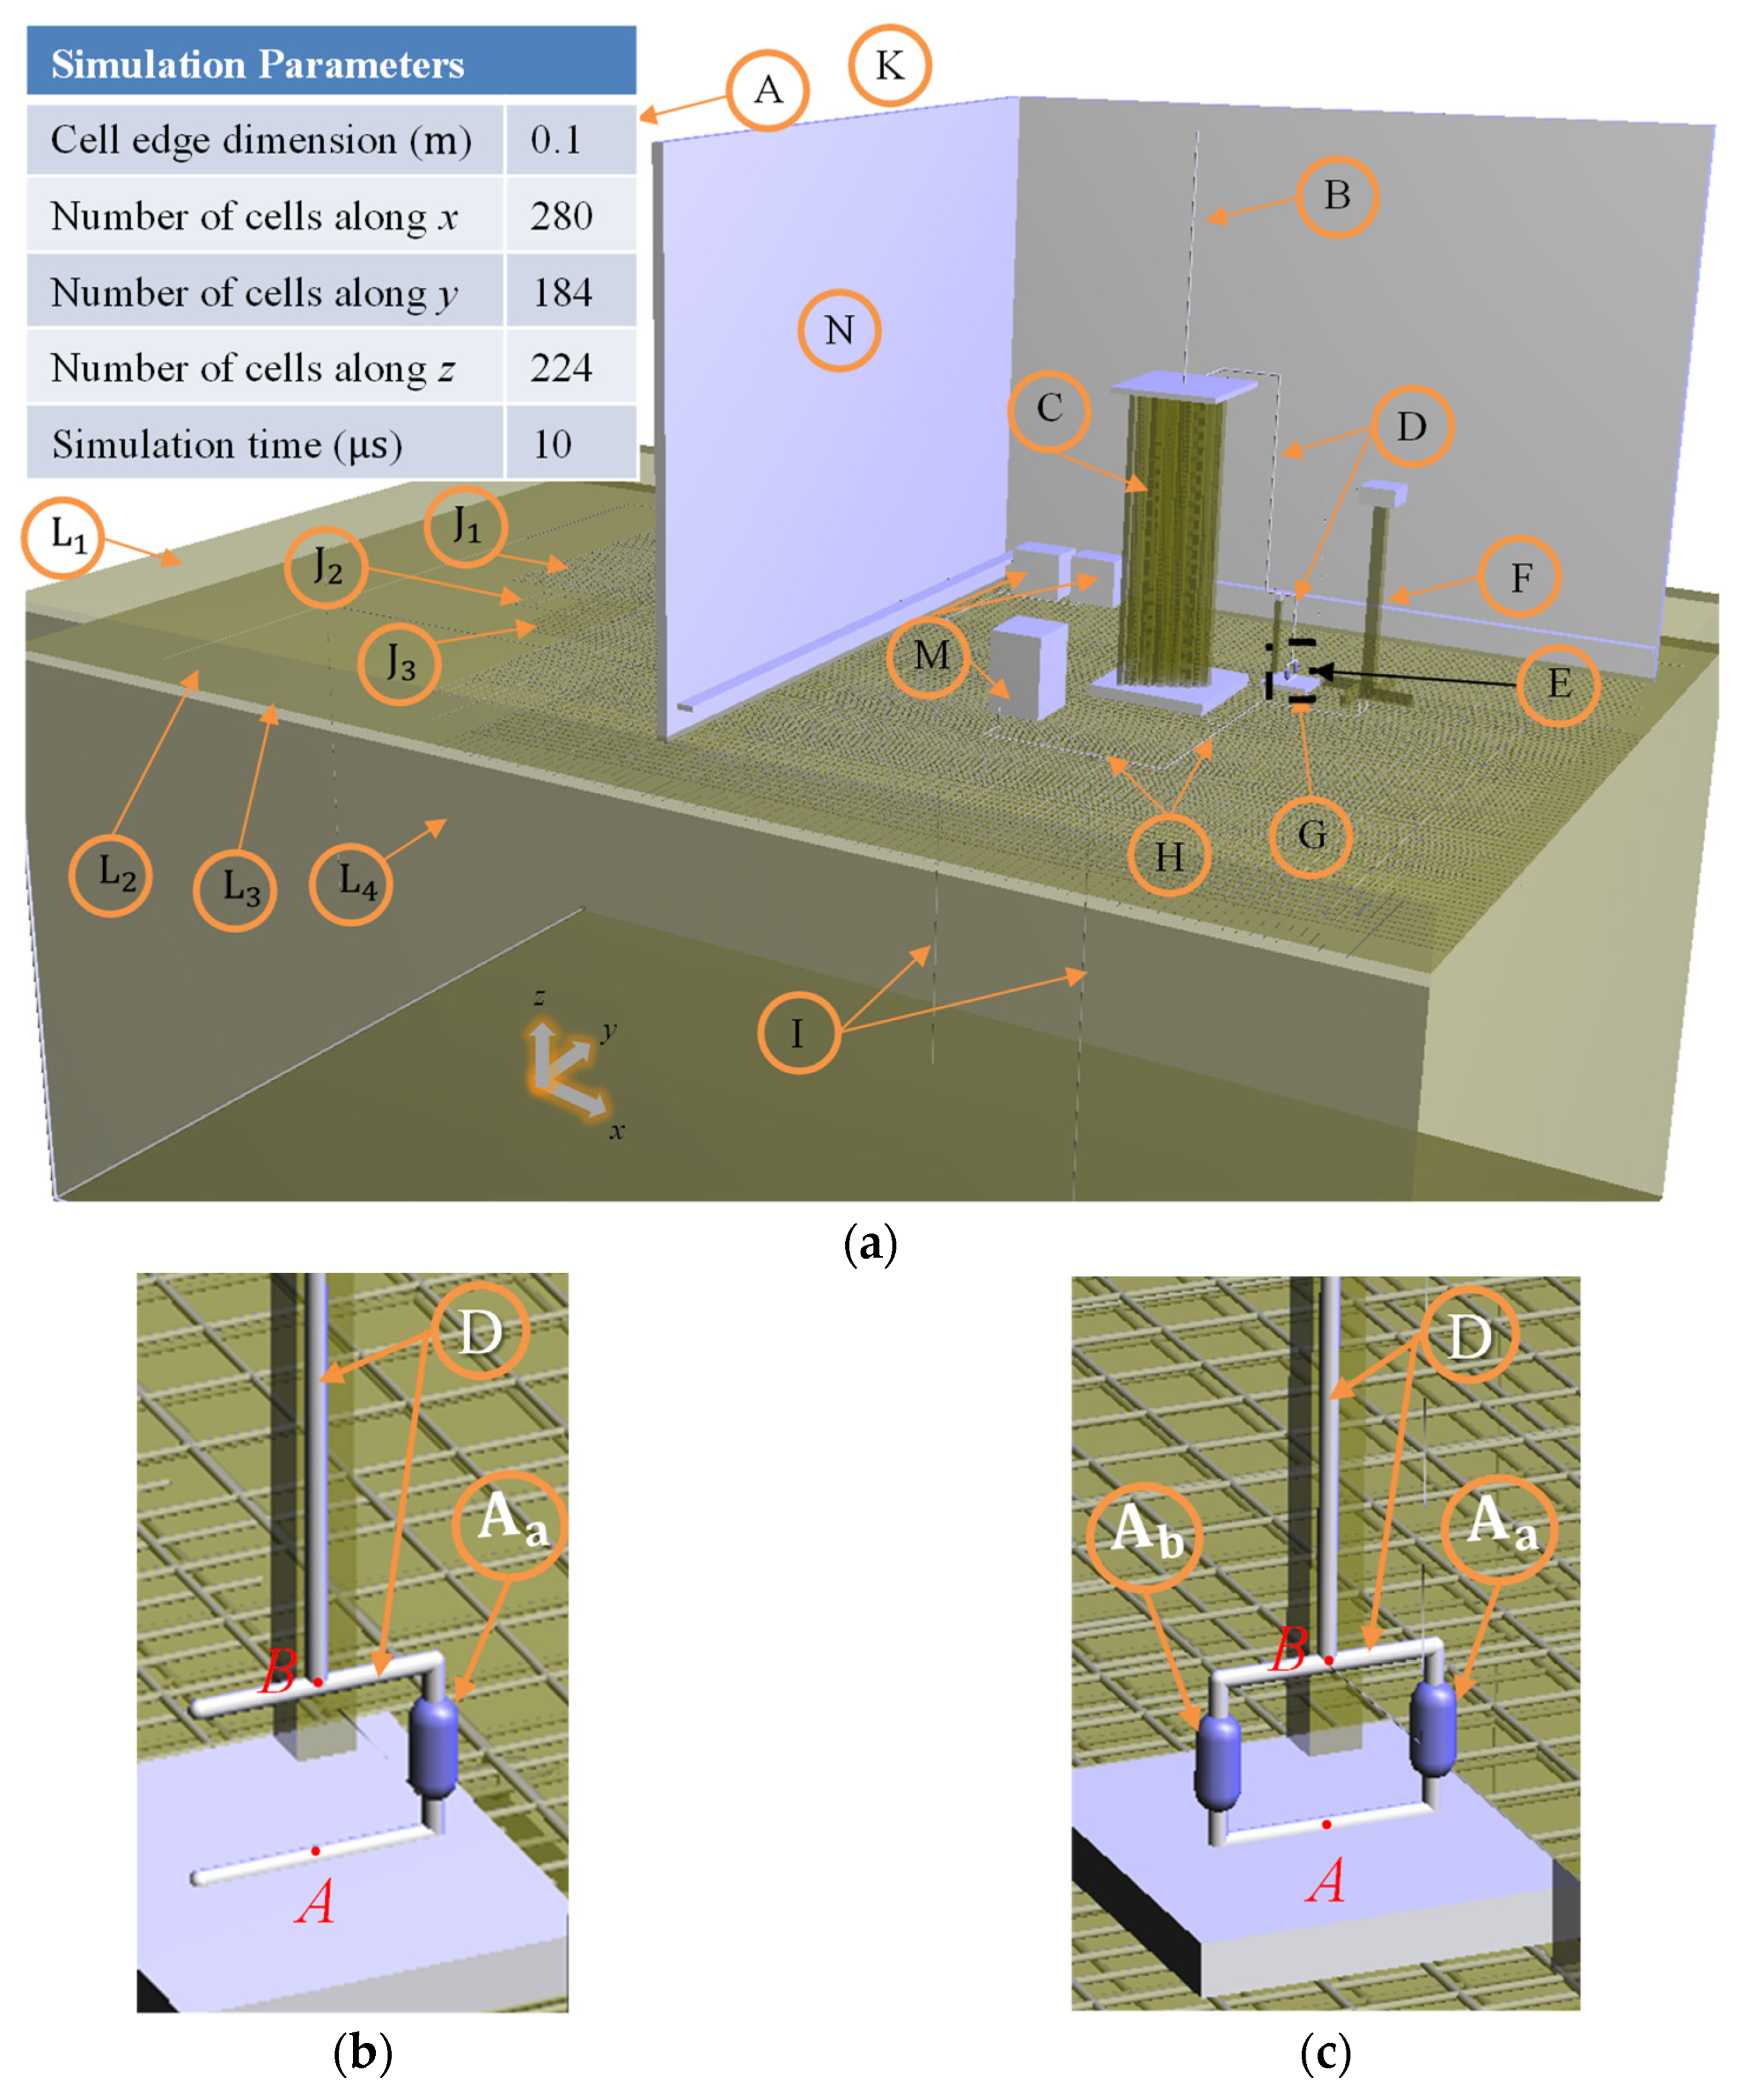
4. FDTD Computational Modelling

The computational modelling of a typical electric experimental setup for determining residual voltages in surge arresters is the starting point for the investigation of our proposal. The geometries represented in the FDTD-3D analysis region were inspired by the surge arrester residual voltage facility of the High- and Extra-High-Voltage Laboratory (LEAT) at the Federal University of Pará (UFPA). Figure 8a shows a photograph of the referred laboratory facility and Figure 8b illustrates the representation of the corresponding three-dimensional FDTD model produced using the software Synthesis and Analysis of Grounding Systems (SAGSs) [20]. In Figure 8b, the region where the SAs are modelled is detailed, in which y a is the distance between SAs (as indicated by red arrows). In this work, y a assumes the values 0.8 m, 0.6 m and 0.4 m.

Parameters of the Conceived FDTD Model

The experimental setup illustrated in Figure 8a is represented by conceiving a 28   m   × 18.4   m   × 22.4   m analysis region using SAGS [20], which employs FDTD for performing realistic full-wave modeling. The Yee cell dimensions were set to Δ x = Δ y = Δ x = 0.1   m , respecting (18) and dimensions and distances among the objects, in such a way to properly represent objects, electromagnetic waves and the associated wave phenomena (couplings and inductions, reflections, diffractions and refractions). Modeled elements and their respective identifications are shown in Figure 9a. Figure 9b,c depict the region of interest for typical and proposed arrangements, respectively. Table 1 provides the electromagnetic properties of the modeled materials [32,36,37,38].
The analysis region was limited by using the Uniaxial Perfectly Matched Layer (UPML) technique [15]. The thin-wire technique developed in [17] was employed for performing sub-cellular representations of cylindrical conductors with transverse section areas much smaller than faces of Yee cells.
The free space among the horizontal SAs’ interconnection conductors and the fixation metallic base (between the SAs in Figure 9c) is where the insulator should be installed. Voltage is evaluated by a line-integrating vertical component in the electric field from the metallic base to the higher horizontal SA interconnection conductor, working as insulator terminals (see terminals A and B in Figure 9a,b, indicated using red color). Thus, the aim of the research is the evaluation of overvoltages between the insulator terminals caused by the direct incidence of atmospheric discharge on a phase line. The evaluation of the insulator performance during lightning hit is not on the scope of this paper.
The zinc oxide surge arresters were represented in our FDTD model as resistive elements. SA resistances were calculated from their V × I curve points (for 5   kA and 10   kA ), available in technical documentation of a commercialized device [39]. Such modelling is sufficient for performing investigations on induced overvoltages across insulators excited by magnetics fields produced by discharge currents flowing through surge arresters. When subjected to currents above 10   kA , such SA behaves nearly as a resistor due to its fundamentally linear relation between voltage and current, as addressed in [40]. The representation of the grounding system in the model aimed at fidelity to the grounding project of LEAT-UFPA, encompassing the three grounding grids ( J 1 , J 2 and J 3 ) with distinct depths. Notice that the deep rods I interconnect the grounding grids and conduct reinforced concrete grid currents to soil.

5. Numerical Results and Discussion

Eight FDTD simulations were defined and executed, as detailed in Table 2. A typical line protection arrangement using a single SA connected parallelly to the insulator (see Figure 9b), subjected to lightning current peaks I max set to 5   kA and 10   kA , was modeled and referred to as reference cases RC1 and RC2. Furthermore, the proposal of using two SAs connected parallelly to the insulator (as Figure 9c illustrates) was also analyzed for lightning current peaks of 5   kA and 10   kA , with y a set to 0.4   m , 0.6   m and 0.8   m . The cases associated with the proposed configuration are referred to as proposed cases PC1 to PC6 (see Table 2). For all cases, lightning current I s ( t ) given by (20) was used as an FDTD excitation source. Since the time derivative of lightning current I s ( t ) is more relevant during its few initial microseconds (see Figure 5), a total simulation time of 10   μ s was set for executing the FDTD simulations.
Figure 10a,b show the calculated transient surge arrester currents obtained for I max = 5   kA and I max = 10   kA , respectively. Figure 10 shows that cases 1 and 5 (Figure 10a) and 2 and 6 (Figure 10b) are in accordance with Kirchhoff’s current law. As one would expect, the difference between current levels of reference and proposed cases is approximately 50% for all time (since resistances of SAs A a and A b are equal for the proposed cases). This also agrees with the results verified in [27,28,29]. Notice that as y a is reduced, arrester current is slightly lessened since electromagnetic coupling between SAs increases.
Figure 11 shows the calculated voltage curves obtained in the region of interest, across insulator terminals A and B, as indicated in Figure 9b,c. At the initial instants of the transient voltages (from 0 to 2.5 μs), the reference case displays peak values of approximately 2.5 kV (Figure 11a) and 4.5 kV (Figure 11b). In contrast, the implementation of the proposed strategy provides reductions in maximum residual voltages to 770 V and 1.3 kV, respectively, corresponding to decreases of 68.96% and 70.92%, as depicted in Figure 12. Those strong voltage attenuations contribute to minimizing electric stresses across the insulator. As previously pointed out, the obtained voltage reductions are due to the fact that the discharge currents conducted by the SAs installed parallelly to the insulator create opposite-direction magnetic fields that superpose in the region of interest, thus, resulting in a reduced voltage across insulator terminals. Additionally, this phenomenon is more noticeable at the initial instants of the transient phenomena.
Furthermore, by analyzing Figure 11, we see that the configurations with y a = 0.4   m (PC5 and PC6) show, approximately, a 27.3% reduction in residual voltages with respect to those in which y a = 0.8   m (PC1 and PC2). Such a result agrees with the theoretically expected increase in the level of electromagnetic coupling associated with reducing distances between SAs. The calculated voltage reductions remain above 50% in all proposed cases with respect to reference cases, suggesting that not only the Ohmic law is responsible for the decreases, but also the interactions between the transient magnetic fields reduce the induced voltage on the insulator, as illustrated in Figure 12.
For the sake of analysis clarity regarding the phenomena under consideration, the spatial distributions of | H ¯ | and | E ¯ | on planes xy and yz, respectively, obtained with the FDTD method at 3.33 µs, are shown in Figure 13. Figure 13a shows that, in fact, | H ¯ | is reduced in the region between surge arresters A a and A b , minimizing | E ¯ | in the same region, as clearly revealed by Figure 13b. The above agrees, qualitatively, with the results seen in [1], since it is a different application of this proposal.
The promising benefits of the proposed SA arrangement, presented so far from a technical point of view, give rise to a brief cost-effectiveness analysis. Assuming the high exposure of rural networks to the incidence of lightning strikes [4] and the impacts/damage of these transients on the power system [3,4,5], mainly in tropical areas (as is the case in Brazil) [1], by themselves, already suggest the implementation of some remedial measures. In this sense, the total cost of adding two more LV SAs per pole (see Figure 6b) was estimated to be between USD 80 and 90 as of January 2023. However, considering the lightning density in the Brazilian Amazon region [1] and the measured parameters of lightning currents in Brazil [41], for example, 50% of lightning currents can reach 45 kA, this surpasses the maximum current withstand threshold of LV SAs [39]. In this context, balancing the currents in the SAs of the proposed arrangement mitigates: (1) the lightning-induced voltages across network insulators (or across bushings on the LV side of medium-voltage transformers, for instance); (2) the possibility of SA failures due to thermal avalanche and also, if one of the devices fails, the network would still be protected by a surge arrester, such as in the reference single-SA case; (3) the costs involved with customer claims for damages caused by power supply interruptions, which reached approximately USD 703,000.00 to a single power distribution company in Brazil in 2019 [42]; and (4) priceless losses, such as disservice of life support in hospitals, in addition to damage to the public image of power companies.

6. Conclusions

In this work, it is demonstrated that reductions in induced voltages across the terminals of overhead electric power line insulators can be achieved with the use of surge arresters (SAs) installed parallelly to the insulator. Once a lightning current hits the line, SAs provide the division of the surge electric current, producing interaction of opposite-direction transient magnetic fields in the region in which an insulator is to be installed. As observed, mainly during the initial instants of a lightning current, voltage induced across an insulator can be substantially reduced, as demonstrated by the results in this study. This analysis has not been addressed in previous research.
The numerical evaluation of the induced voltages at the insulator terminals between a reference configuration and a proposed configuration with two surge arresters (SAs) per phase installed parallelly to the insulator and equidistant from the insulating device showed reductions of up to 71%, the highest reduction being obtained when the SAs were placed 0.4 m apart. This reduction can be attributed to the influence of high electromagnetic coupling between the SAs at the considered distance. More specifically, the obtained spatial distributions of magnitudes of electric field E ¯ and magnetic field H ¯ , at a given time instant immediately after the occurrence of the peak of the fast electromagnetic transient current, show that horizontal components in H ¯ are reduced at the insulator installation location, resulting in a corresponding decrease in vertical components of E ¯ in the same region, producing, as a result, a reduction in induced voltage across insulator terminals.
Lessening the voltages developed across insulator terminals has the effect of increasing the level of availability of electric power supply systems, mitigating damage caused by atmospheric transient currents to devices of power companies and customers, being a remedial measure with the capability to be highly cost-effective. Although installation of SAs with very different V × I characteristics is possible, premature aging and/or failure of one of the SAs in the array and installation mistakes are some risks in the proposed arrangement under real-world installation conditions (which can lead to unbalanced SA discharge currents), and such circumstances still tend to produce responses with advantages over the single-SA configuration, as long as horizontal components in the magnetic field are reduced in insulators.
Future studies involving the evaluation of the proposed arrangement at medium-, high- and extra-high-voltage levels (including in DC systems) and the numerical analysis in standardized bus test feeders (or based on real-world networks) can be carried out. Regardless of the advances achieved in this paper, studies involving laboratorial experiments and refined numerical modelling of three or more SAs are also proposed and are presently in progress.

Author Contributions

Conceptualization, R.M.S.d.O.; Methodology, R.M.S.d.O.; Software, R.M.S.d.O.; Validation, A.M.d.M., R.M.S.d.O. and M.V.A.N.; Formal analysis, A.M.d.M., R.M.S.d.O. and A.M.d.M.; Investigation, A.M.d.M.; Resources, M.V.A.N.; Data curation, A.M.d.M.; Writing—original draft, A.M.d.M.; Writing—review and editing, A.M.d.M., R.M.S.d.O. and M.V.A.N.; Visualization, A.M.d.M. and R.M.S.d.O. All authors have read and agreed to the published version of the manuscript.

Funding

This research was funded by the Pro-Rectory of Research and Post-Graduate Studies 432 PROPESP/UFPA.

Data Availability Statement

Not applicable.

Conflicts of Interest

The authors declare they have no conflict of interest.

References

  1. Leal, A.F.R.; de Oliveira, R.M.S.; Lopes, N.M.; de Lima, T.S.; Ferreira, E.R.; Rodrigues, N.R.N.M. Lightning Protection Design for Small Riverboats Using the FDTD Method. J. Microw. Optoelectron. Electromagn. Appl. 2021, 20, 307–319. [Google Scholar] [CrossRef]
  2. Schumacher, V.; Setzer, A.; Saba, M.M.F.; Naccarato, K.P.; Mattos, E.; Justino, F. Characteristics of lightning-caused wildfires in central Brazil in relation to cloud-ground and dry lightning. Agric. For. Meteorol. 2022, 312, 108723. [Google Scholar] [CrossRef]
  3. Cummins, K.L.; Krider, E.P.; Malone, M.D. The US National Lightning Detection NetworkTM and applications of cloud-to-ground lightning data by electric power utilities. IEEE Trans. Electromagn. Compat. 1998, 40, 465–480. [Google Scholar] [CrossRef] [Green Version]
  4. Neto, E.T.W.; Martinez, M.L.B.; Diniz, A.M.M.; dos Santos, G.J.G.; Campos, B.N. 10 kA Distribution Arresters: The Adequate Choice for Medium Voltage Networks. In Proceedings of the 2012 International Conference on Lightning Protection (ICLP), Vienna, Austria, 2–7 September 2012; pp. 1–5. [Google Scholar] [CrossRef]
  5. Brignone, M.; Delfino, F.; Procopio, R.; Rossi, M.; Rachidi, F. Evaluation of Power System Lightning Performance—Part II: Application to an Overhead Distribution Network. IEEE Trans. Electromagn. Compat. 2017, 59, 146–153. [Google Scholar] [CrossRef]
  6. Souza, R.P.; Lopes, I.J.S.; Paulino, J.O.S. Influence of the Return Stroke Velocity and the Statistical Method used in Distribution Lines Indirect Lightning Performance Estimation Considering the Ground Resistivity. In Proceedings of the 2011 International Symposium on Lightning Protection, Fortaleza, Brazil, 3–7 October 2011; pp. 200–204. [Google Scholar] [CrossRef]
  7. Paulino, J.O.S.; Barbosa, C.F.; Lopes, I.J.S.; Boaventura, W.C.; Cardoso, E.N.; Ávila, A.F.; Guimarães, M.F. Improving the lightning performance of distribution lines using high CFO structures. Electr. Power Syst. Res. 2021, 194, 107063. [Google Scholar] [CrossRef]
  8. Piantini, A.; Janiszewski, J.M.; de Carvalho, T.O.; Obase, P.F.; dos Santos, G.J.G. Lightning-caused Transformer Failures in Distribution Systems. In Proceedings of the 2014 International Conference on Lightning Protection (ICLP), Shanghai, China, 11–18 October 2014; pp. 955–960. [Google Scholar] [CrossRef]
  9. CIGRE–CIRED JWG C4.4.02. Protection of MV and LV Networks Against Lightning. Part I: Common Topics. CIGRE Technical Brochure 2006. Available online: https://e-cigre.org/publication/287-protection-of-mv-and-lv-networks-against-lightning--part-1-common-topics (accessed on 12 December 2022).
  10. McDermott, T.E.; Short, T.A.; Anderson, J.G. Lightning Protection of Distribution Lines. IEEE Trans. Power Deliv. 1994, 9, 138–152. [Google Scholar] [CrossRef]
  11. Nakada, K.; Yokota, T.; Yokoyama, S.; Asakawa, A.; Nakamura, M.; Taniguchi, H.; Hashimoto, A. Energy Absorption of Surge Arresters on Power Distribution Lines due to Direct Lightning Strokes—Effects of an Overhead Ground Wire and Installation Position of Surge Arresters. IEEE Trans. Power Deliv. 1997, 12, 1779–1785. [Google Scholar] [CrossRef]
  12. Bassi, W.; Janiszewisk, J.M. Evaluation of Currents and Charges in Low-Voltage Surge Arresters Due to Lightning Strikes. IEEE Trans. Power Deliv. 2003, 18, 90–94. [Google Scholar] [CrossRef]
  13. Rocha, G.V.S.; Barradas, R.P.S.; Muniz, J.R.S.; Bezerra, U.H.; Araújo, I.M.; Costa, D.S.A.; Silva, A.C.; Nunes, M.V.A.; Silva, J.S. Optimized Surge Arrester Allocation Based on Genetic Algorithm and ATP Simulation in Electric Distribution Systems. Energies 2019, 12, 4110. [Google Scholar] [CrossRef] [Green Version]
  14. Yee, K. Numerical solution of initial boundary value problems involving Maxwell’s equations in isotropic media. IEEE Trans. Antennas Propag. 1966, 14, 302–307. [Google Scholar] [CrossRef] [Green Version]
  15. Taflove, A.; Hagness, S.C. Computational Electrodynamics: The Finite-Difference Time-Domain Method, 3rd ed.; Artech House Inc.: London, UK, 2005. [Google Scholar]
  16. Tanabe, K. Novel Method for Analyzing the Transient Behavior of Grounding Systems Based on the Finite-Difference Time-Domain Method. Power Eng. Rev. 2001, 21, 1128–1132. [Google Scholar] [CrossRef]
  17. Baba, Y.; Nagaoka, N.; Ametani, A. Modeling of Thin Wires in a Lossy Medium for FDTD Simulations. IEEE Trans. Electromagn. Compat. 2005, 47, 54–60. [Google Scholar] [CrossRef]
  18. Tuma, E.T.; de Oliveira, R.M.S.; Sobrinho, C. New Model of Current Impulse Injection and Potential Measurement in Transient Analysis of Grounding Systems in Homogeneous and Stratified Soils Using the FDTD Method. In Proceedings of the 2005 International Symposium on Lightning Protection, São Paulo, Brazil, 21–25 November 2005; pp. 200–204. [Google Scholar]
  19. Xiong, R.; Chen, B.; Mao, Y.; Deng, W.; Wu, Q.; Qiu, Y. FDTD Modeling of the Earthing Conductor in the Transient Grounding Resistance Analysis. IEEE Antennas Wirel. Propag. Lett. 2012, 11, 957–960. [Google Scholar] [CrossRef] [Green Version]
  20. de Oliveira, R.M.S.; Sobrinho, C. Computational Environment for Simulating Lightning Strokes in a Power Substation by Finite-Difference Time-Domain Method. IEEE Trans. Electromagn. Compat. 2009, 51, 995–1000. [Google Scholar] [CrossRef]
  21. Natsui, M.; Ametani, A.; Mahseredjian, J.; Sekioka, S.; Yamamoto, K. FDTD Analysis of Nearby Lightning Surges Flowing into a Distribution Line via Groundings. IEEE Trans. Electromagn. Compat. 2020, 62, 144–154. [Google Scholar] [CrossRef]
  22. Tatematsu, A.; Noda, T. Three-Dimensional FDTD Calculation of Lightning-Induced Voltages on a Multiphase Distribution Line with the Lightning Arresters and an Overhead Shielding Wire. IEEE Trans. Electromagn. Compat. 2014, 56, 159–167. [Google Scholar] [CrossRef]
  23. Namdari, M.; Khosravi-Farsani, M.; Moini, R.; Sadeghi, S.H.H. An Efficient Parallel 3-D FDTD Method for Calculating Lightning-induced Disturbances on Overhead Lines in the Presence of Surge Arresters. IEEE Trans. Electromagn. Compat. 2015, 57, 1593–1600. [Google Scholar] [CrossRef]
  24. Thang, T.H.; Baba, Y.; Rakov, V.A.; Piantini, A. FDTD computation of lightning-induced voltages on multi-conductor lines with surge arresters and pole transformers. IEEE Trans. Electromagn. Compat. 2015, 57, 442–447. [Google Scholar] [CrossRef]
  25. Thang, T.H.; Baba, Y.; Piantini, A.; Rakov, V.A. Lightning-Induced Voltages in the Presence of Nearby Buildings: FDTD Simulation Versus Small-Scale Experiment. IEEE Trans. Electromagn. Compat. 2015, 57, 1601–1607. [Google Scholar] [CrossRef]
  26. Chen, H.; Du, Y.; Yuan, M.; Liu, Q.H. Lightning-Induced Voltages on a Distribution Line with Surge Arresters Using a Hybrid FDTD–SPICE Method. IEEE Trans. Power Deliv. 2018, 33, 2354–2363. [Google Scholar] [CrossRef]
  27. Sugimoto, H.; Asakawa, A.; Yokoyama, S.; Nakada, K. Effectiveness of Installing Two Pairs of Distribution Surge Arresters in Parallel. In Proceedings of the 1999 Eleventh International Symposium on High Voltage Engineering, London, UK, 23–27 August 1999; Volume 2, pp. 246–249. [Google Scholar] [CrossRef]
  28. He, J.; Chen, S.; Zeng, R.; Liang, X.; Guan, Z.; Han, S.; Cho, H. Electrical Parameter Statistic Analysis and Parallel Coordination of ZnO Varistors in Low-voltage Protection Devices. IEEE Trans. Power Deliv. 2005, 20, 131–137. [Google Scholar] [CrossRef]
  29. Haddad, A.; Waters, R.T.; German, D.M.; Abdul-Malek, Z. Current Disparity in Multi-column Surge Arresters. IEE Proc.-Gener. Transm. Distrib. 2005, 152, 945–951. [Google Scholar] [CrossRef]
  30. Tuczek, M.N.; Bröker, M.; Hinrichsen, V.; Göhler, R. Effects of Continuous Operating Voltage Stress and AC Energy Injection on Current Sharing Among Parallel-Connected Metal–Oxide Resistor Columns in Arrester Banks. IEEE Trans. Power Deliv. 2015, 30, 1331–1337. [Google Scholar] [CrossRef]
  31. Sabiha, N.A.; Mahmood, F.; Abd-Elhady, A.M. Failure Risk Assessment of Surge Arrester Using Paralleled Spark Gap. IEEE Access 2020, 8, 217098–217107. [Google Scholar] [CrossRef]
  32. Sadiku, M.N.O. Elements of Electromagnetics, 5th ed.; Oxford University Press: New York, NY, USA, 2010. [Google Scholar]
  33. Jin, J.M. The Finite Element Method in Electromagnetics, 3rd ed.; Wiley-IEEE Press: Piscataway, NJ, USA, 2014. [Google Scholar]
  34. Gibson, W.C. The Method of Moments in Electromagnetics, 3rd ed.; CRC Press: Boca Raton, FL, USA, 2022. [Google Scholar]
  35. Chapman, N. When One Wire is Enough. Transm. Distrib. World 2001, 53, 56. [Google Scholar]
  36. Xu, X.; Zhang, B.; Liu, K.; Xing, L.; Liu, D.; Bai, M. Measurements and Analysis of the Dielectric Properties of Aramid/Epoxy Composites Based on Free Space Method under Stress Conditions. Polym. Test. 2018, 72, 55–62. [Google Scholar] [CrossRef]
  37. de Oliveira, R.M.S.; Fujiyoshi, D.M.; Araújo, R.C.F.; Nascimento, J.A.S.; Carvalho, L.F.P. Finite-difference Modeling of Dispersive Soils Validated via Experimental Evaluation of Transient Grounding Signals. J. Electrost. 2017, 87, 263–275. [Google Scholar] [CrossRef]
  38. Madhavi, T.C.; Annamalai, S. Electric Conductivity of Concrete. ARPN J. Eng. Appl. Sci. 2016, 11, 5979–5982. [Google Scholar]
  39. Eaton’s Cooper Power Systems Division, Secondary Arresters and Protective Gaps Catalog. 2022. Available online: https://www.eaton.com/content/dam/eaton/products/medium-voltage-power-distribution-control-systems/line-installation-and-protective-equipment/secondary-arresters-and-protective-gaps-catalog-ca235001en.pdf (accessed on 4 April 2022).
  40. Hileman, A.R. Insulation Coordination for Power Systems; CRC Press Taylor and Fracis Group: Boca Raton, FL, USA, 1999. [Google Scholar]
  41. Visacro, S.; Soares, A.; Aurélio, M.; Schroeder, O.; Cherchiglia, L.C.L.; De Sousa, V.J. Statistical Analysis of Lightning Current Parameters: Measurements at Morro do Cachimbo Station. J. Geophys. Res. 2004, 109, D01105. [Google Scholar] [CrossRef]
  42. Pergentino, L.A. Impact Assessment of Lightning Strikes on Distribution Systems from Field Measurements. Master’s Dissertation, Engineer School of São Carlos, University of São Paulo, São Paulo, Brazil, 2019. [Google Scholar] [CrossRef]
Figure 1. Cross-section of the conductor and the associated amperian loop.
Energies 16 01111 g001
Figure 2. The illustrative quasi-magnetostatic problems: (a) single conductor; (b) two parallel conductors.
Energies 16 01111 g002
Figure 3. Total magnetostatic fields: (a) for a single conductor; (b) for two parallel conductors.
Energies 16 01111 g003
Figure 4. Representation of Yee cell in three-dimensional space.
Energies 16 01111 g004
Figure 5. Lightning current excitation source: (a) I s ( t ) (time domain) truncated at 10 μ s and (b) normalized Fourier transform of I s ( t ) ,   calculated between 0 and 1 MHz.
Energies 16 01111 g005
Figure 6. LV SPER systems: (a) typical configuration and (b) an example of multiple parallel SAs per voltage line configuration (proposed in this work).
Energies 16 01111 g006
Figure 7. Illustrative representations of insulator and arrester(s) connected to voltage line and respective SA-produced magnetic fields: (a) typical case and (b) the proposed arrangement based on two parallel SAs.
Energies 16 01111 g007
Figure 8. Laboratorial setup for performing residual voltage measurements on 440 V voltage-class surge arresters: (a) real-world setup and (b) depiction of part of the corresponding SAGS FDTD-3D model.
Energies 16 01111 g008
Figure 9. The conceived FDTD model: (a) simulation parameters and overview—A: table with simulation parameters, B: discharge current channel, C: lightning current generator, D: interconnection conductor, E: region of interest, F: voltage divider, G: metallic base for fixation of surge arrester, H: conductors for interconnecting parts to the grounding system, I: deep grounding rods, J 1 , J 2 and J 3 : grounding grids, K: air, L 1 : reinforced concrete in which J 1 is contained, L 2 : compacted soil containing grid J 2 , L 3 : reinforced concrete containing grounding grid J 3 , L 4 : soil, M: metallic blocks representing transformers in the test area, N: metallic wall; (b) detail of the region of interest of the typical configuration— A a : representation of the surge arrester; (c) region of interest for the proposed configuration— A a and A b : representation of two parallelly installed SAs. Notice that insulator voltage V A B is obtained by line-integrating electric field between terminals A and B (indicated using red color).
Energies 16 01111 g009
Figure 10. The calculated surge arresters’ currents for (a) I max = 5   kA and (b) I max = 10   kA .
Energies 16 01111 g010
Figure 11. Residual voltages calculated in the region of insulator installation considering: (a) I s = 5   kA and (b) I s = 10   kA .
Energies 16 01111 g011
Figure 12. Percentage reductions in peak voltages calculated across the terminals of insulators: comparisons between reference and proposed cases.
Energies 16 01111 g012
Figure 13. Spatial distributions of | H ¯ | and | E ¯ | calculated using the FDTD method for PC6: (a) | H ¯ | ( z = 13.85   m ,   t = 3.33   μ s ) and (b) | E ¯ | ( x = 23.10   m ,   t = 3.33   μ s ) .
Energies 16 01111 g013
Table 1. Electromagnetic parameters of materials represented in FDTD model.
Identification (Figure 9a)Material ε r σ   ( S / m ) μ r
C and FEpoxy resin40.00051
L 1   and   L 3 Concrete8 10 6 1
L 2   and   L 4 Soil40.0221
KAir101
Table 2. Reference and proposed cases, which are numerically analyzed.
Identification I max   ( kA ) Resistance   of   SAs   ( m Ω ) y a   ( m )
Reference Case 1 (RC1)5280-
Reference Case 2 (RC2)10170-
Proposed Case 1 (PC1)52800.8
Proposed Case 2 (PC2)101700.8
Proposed Case 3 (PC3)52800.6
Proposed Case 4 (PC4)101700.6
Proposed Case 5 (PC5)52800.4
Proposed Case 6 (PC6)101700.4
Disclaimer/Publisher’s Note: The statements, opinions and data contained in all publications are solely those of the individual author(s) and contributor(s) and not of MDPI and/or the editor(s). MDPI and/or the editor(s) disclaim responsibility for any injury to people or property resulting from any ideas, methods, instructions or products referred to in the content.

