Driving Urban Energy Sustainability: A Techno-Economic Perspective on Nanogrid Solutions


Abstract
:1. Introduction
- In the context of NGs, to carry out the feasibility study of a rooftop PV–GRID and PV–WT–GRID system using HOMER Grid 1.11.1 version software to achieve optimal solutions;
- To assess whether the proposed system has substantial environmental offsets and a fair payback period by comparing the system performance of on-grid NG combinations with a minimum net present cost and cost of energy value;
- First study in the Türkiye market that assesses building-type nanogrids;
- Sensitivity analysis according to levelized cost of energy (LCOE) was applied;
- Unlock the NG potential of a building type with an on-grid rooftop solar system;
- Determination of an optimal NG system using an electric vehicle charging station (EVCS) for different configurations.
2. Proposed System and Existing HRES Studies
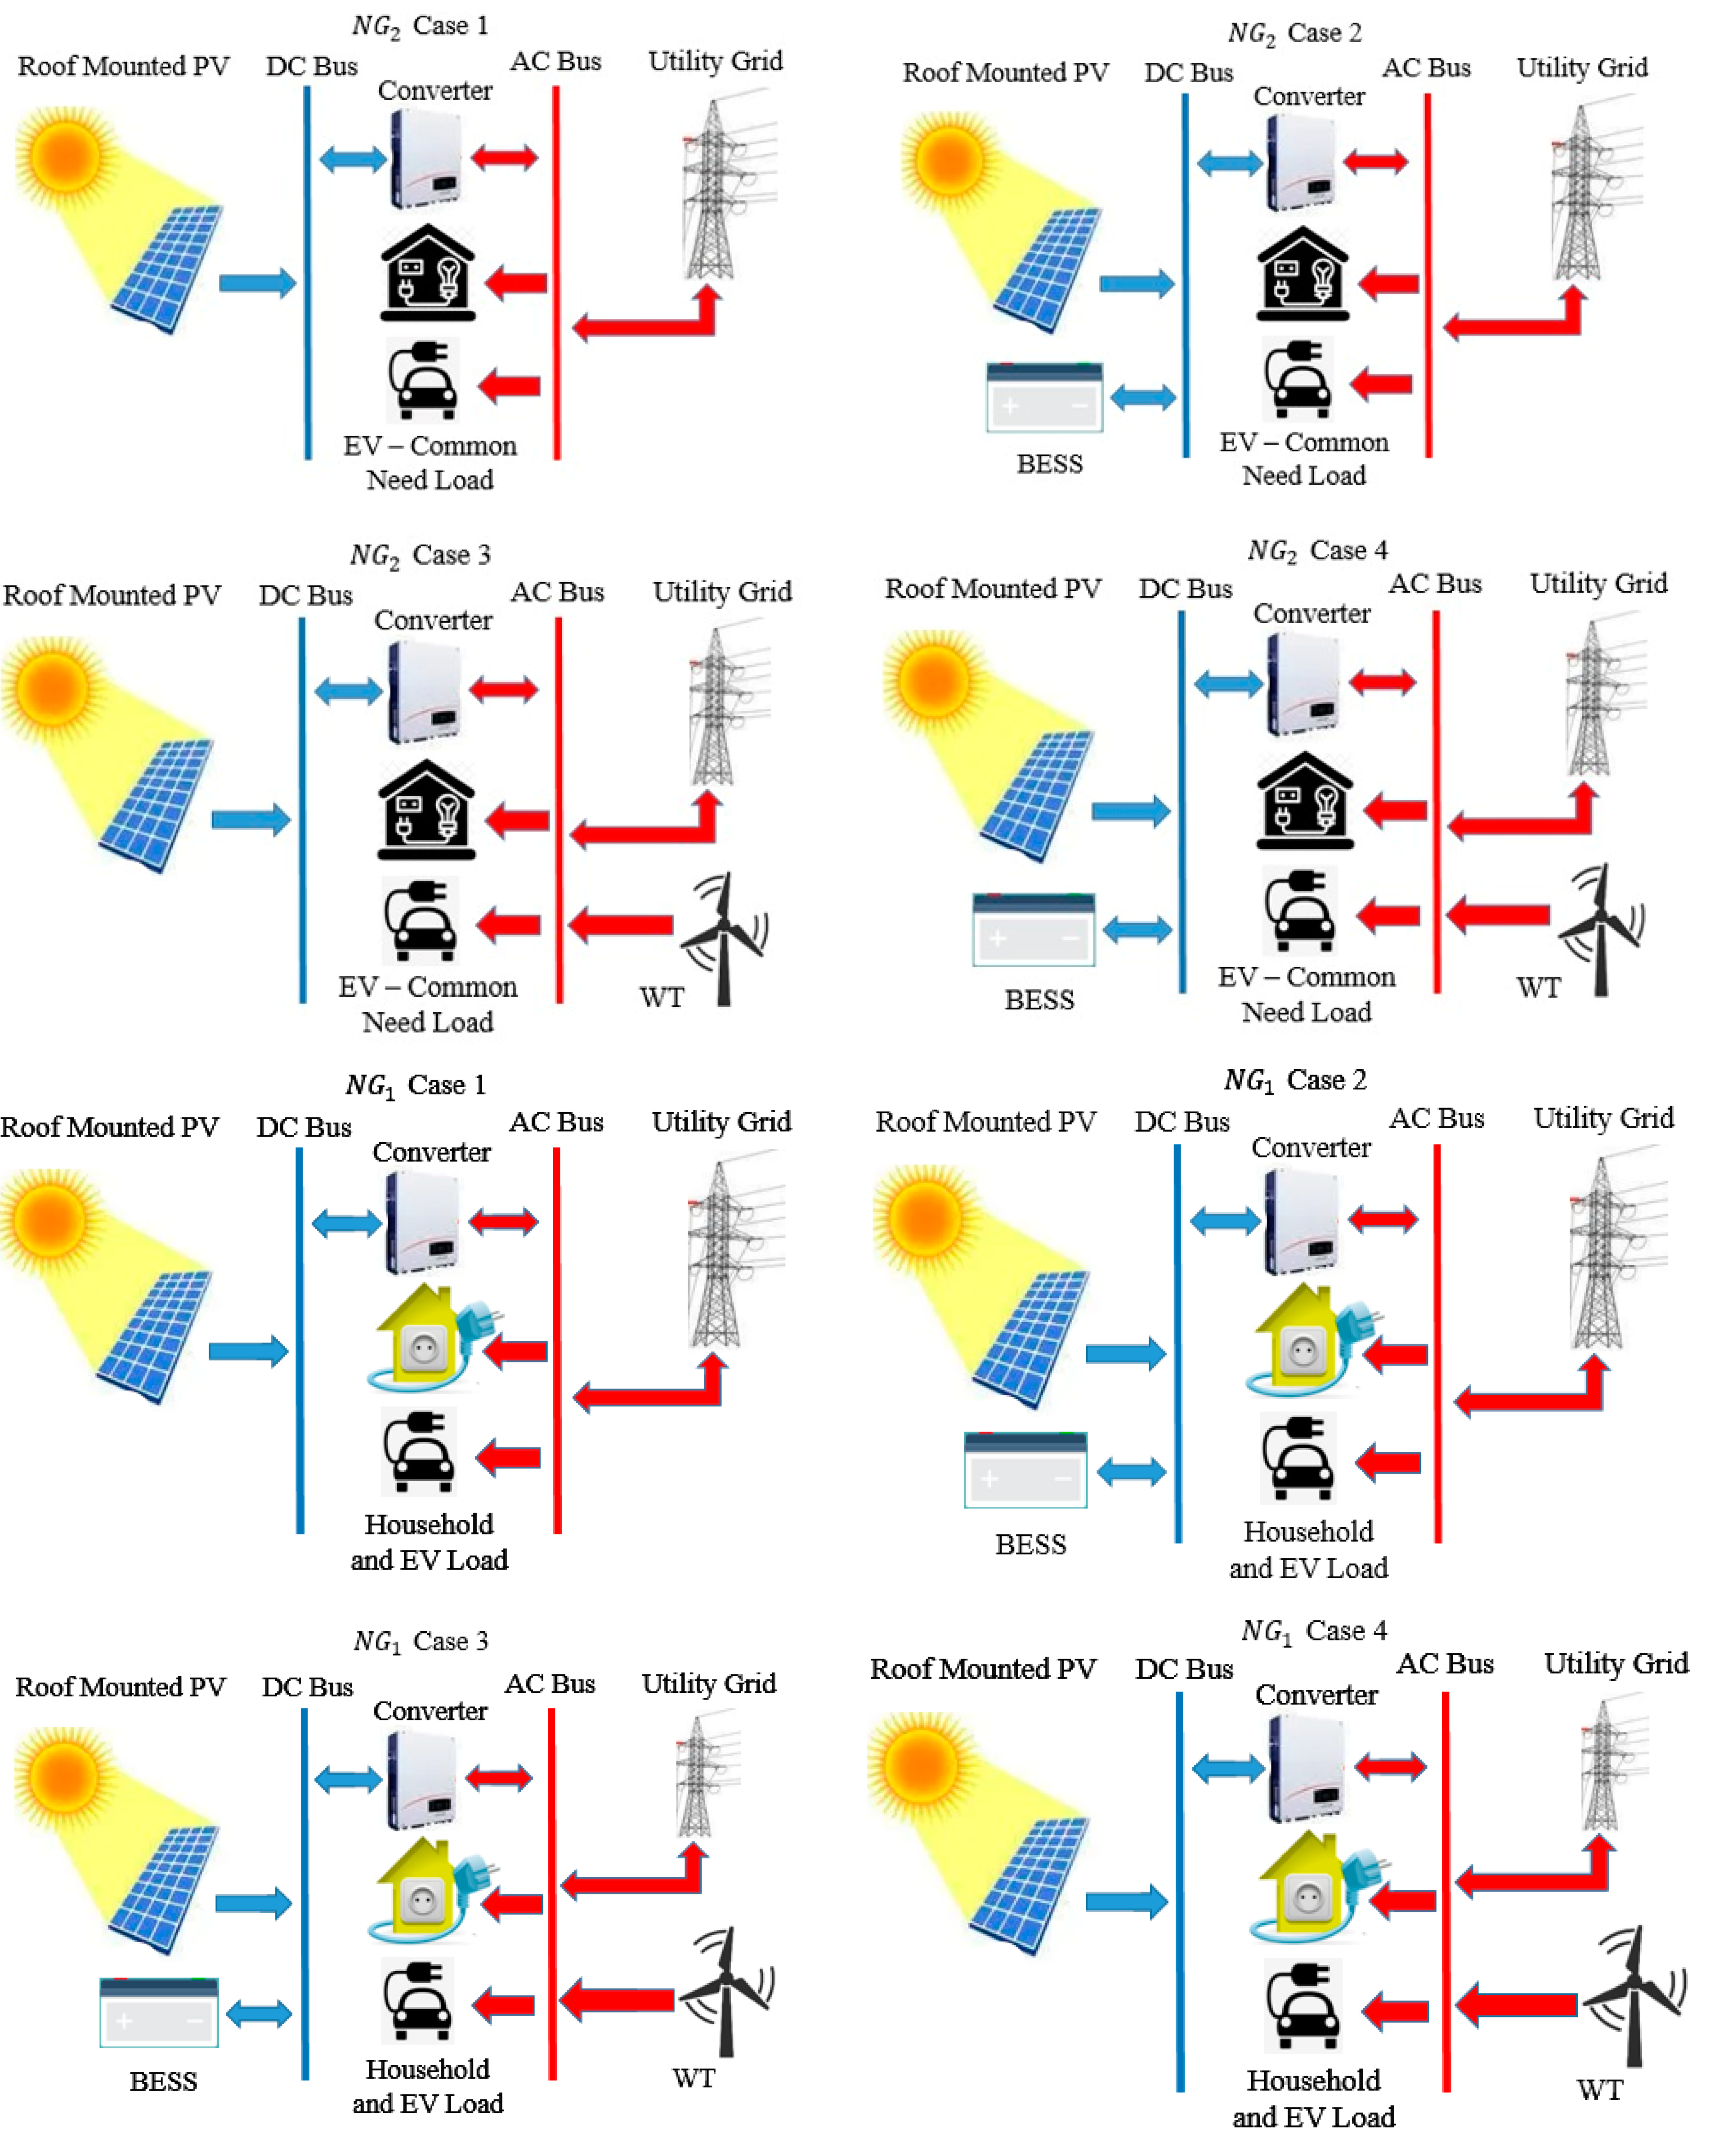
2.1. Proposed System
2.2. Existing HRES Studies
3. Homer Parameters and Background of the System
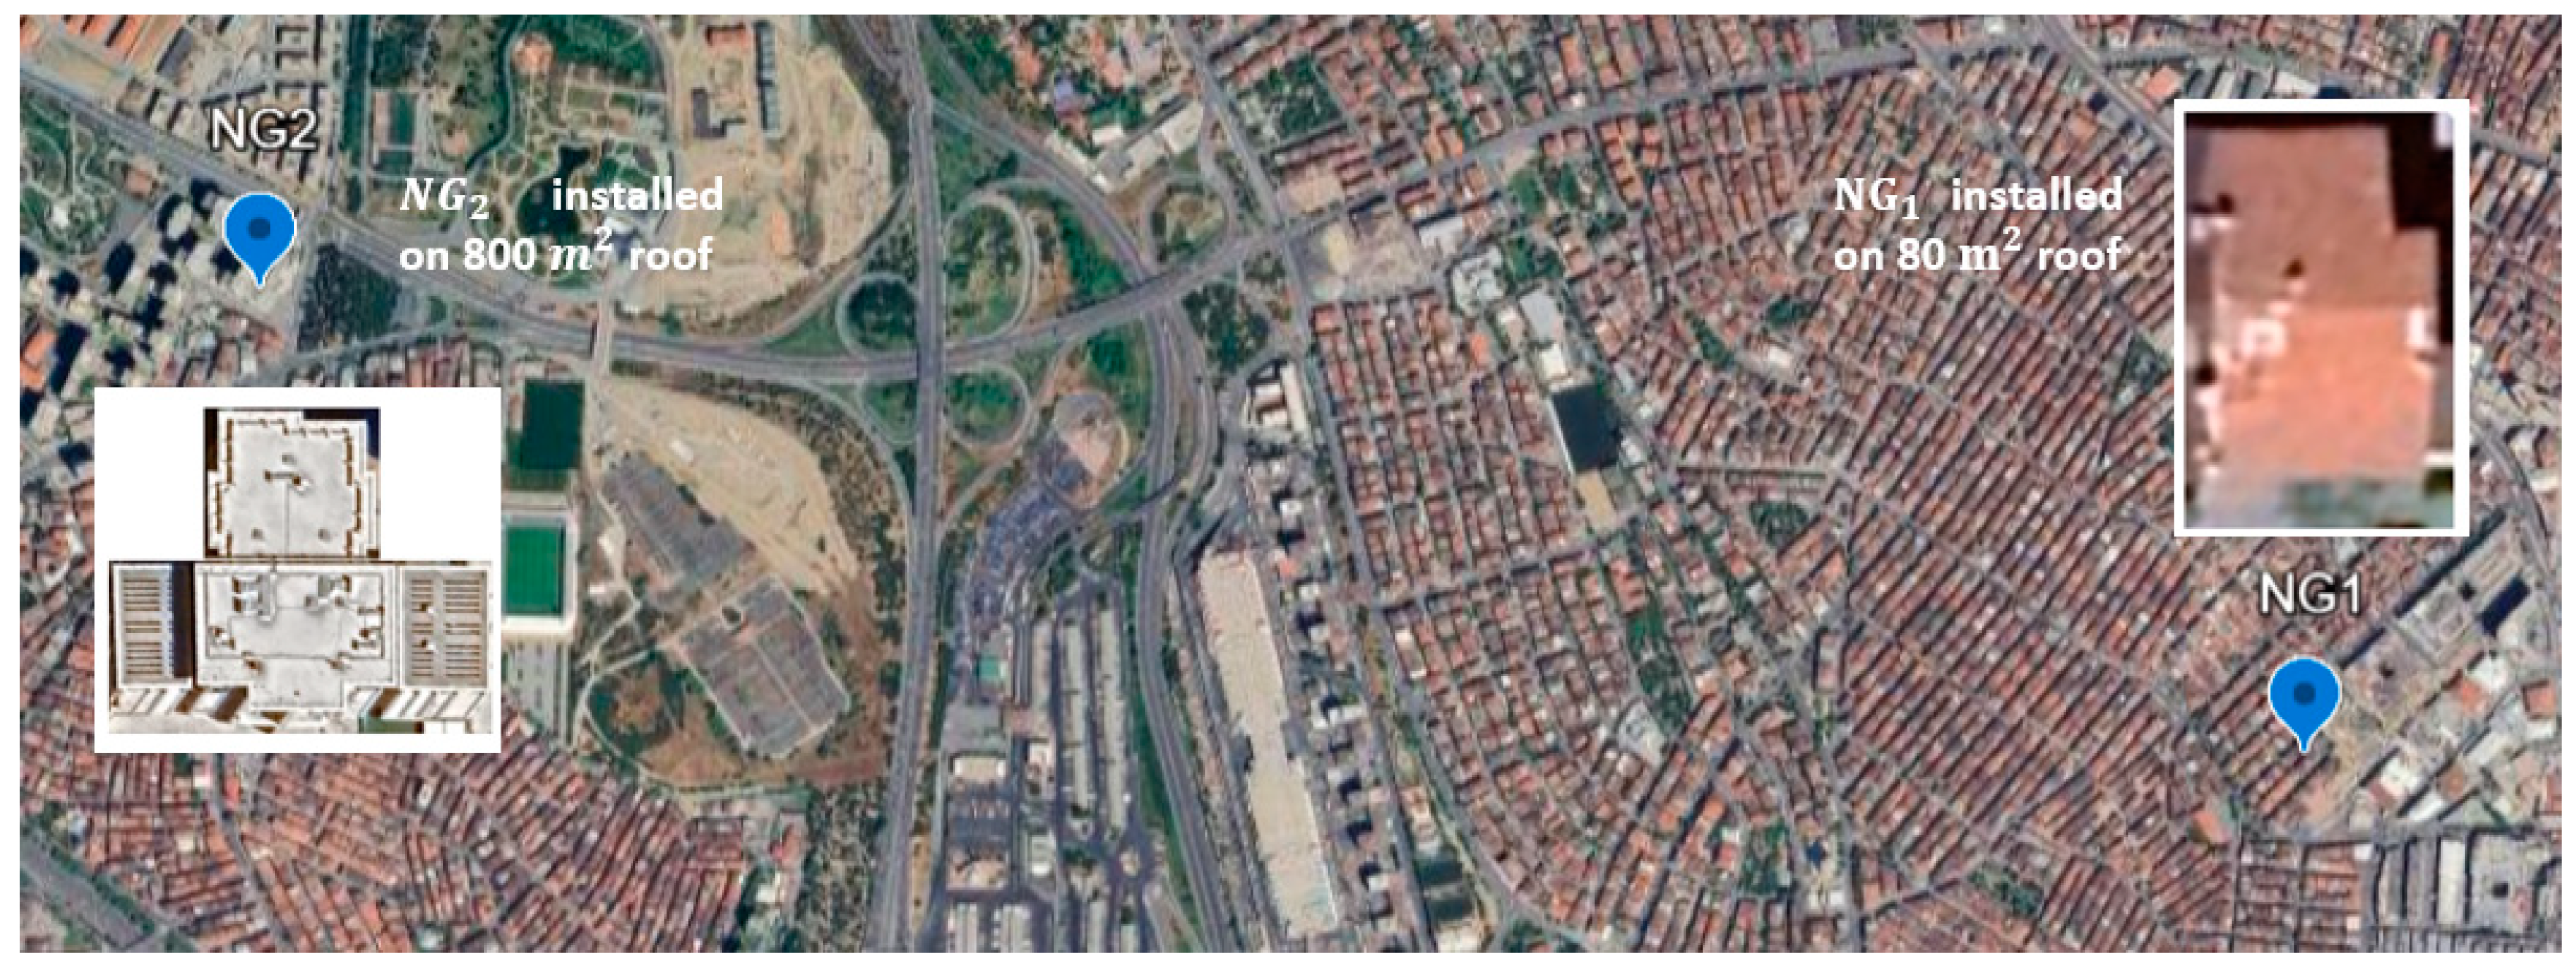
3.1. General Description
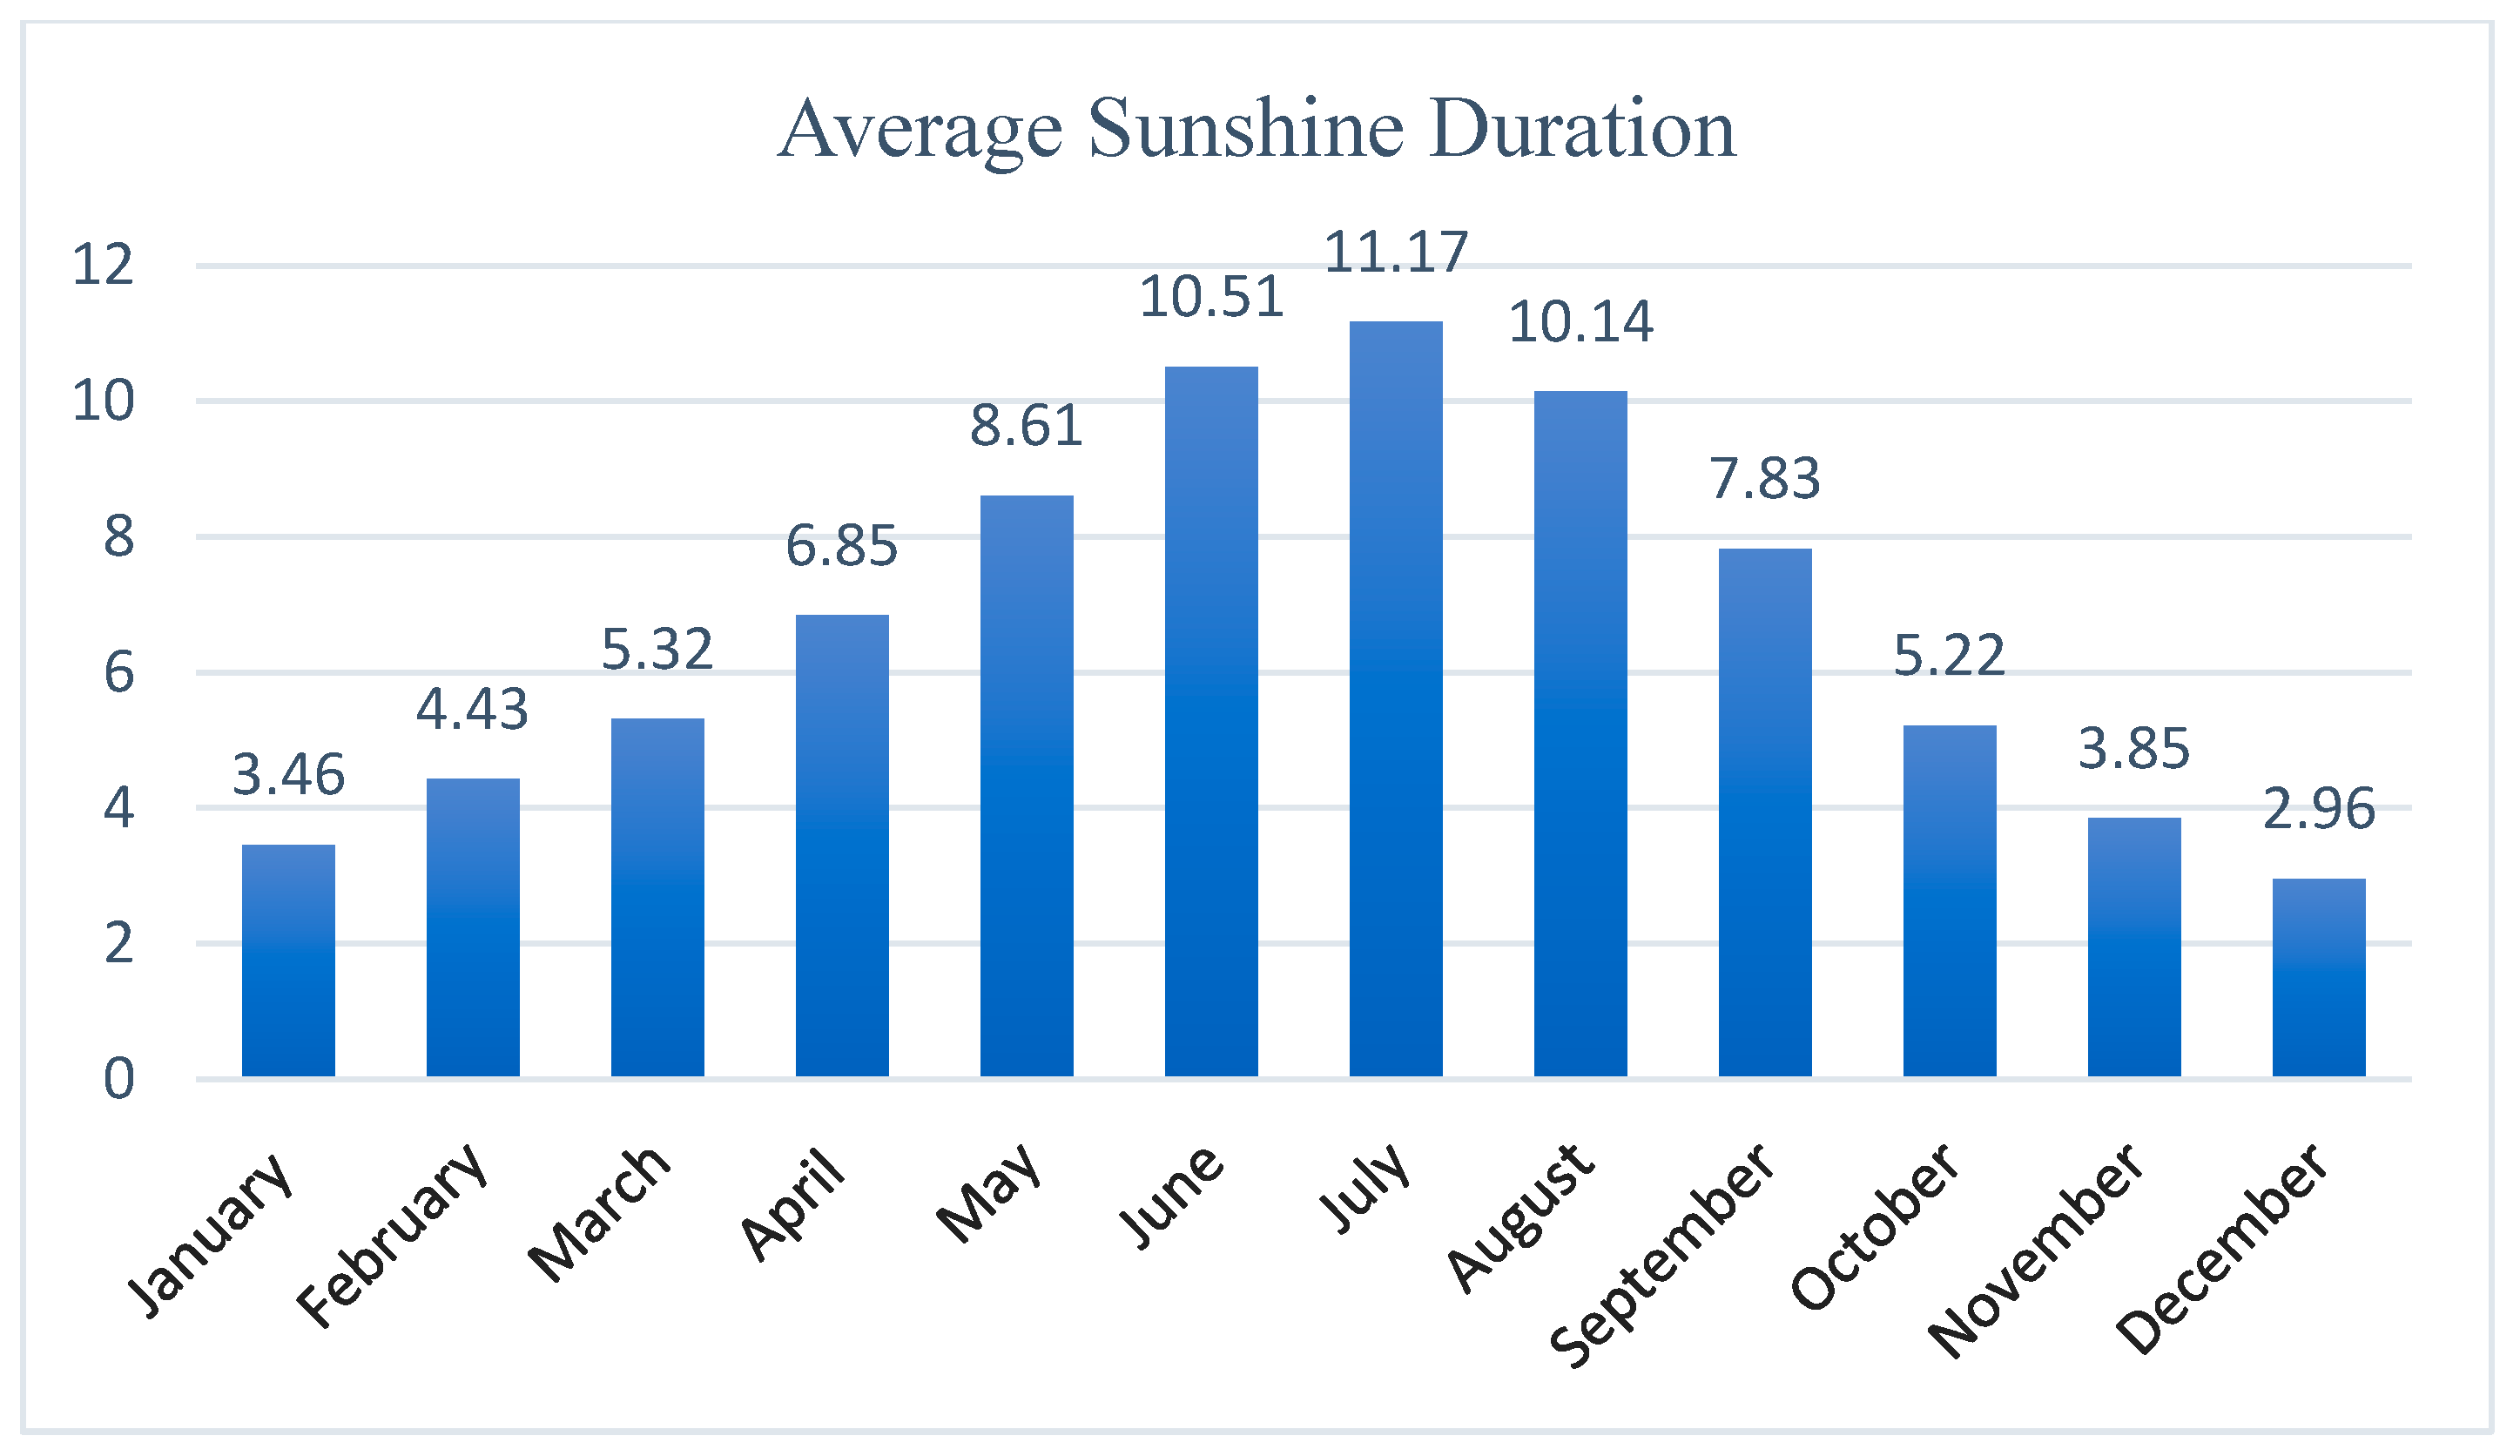
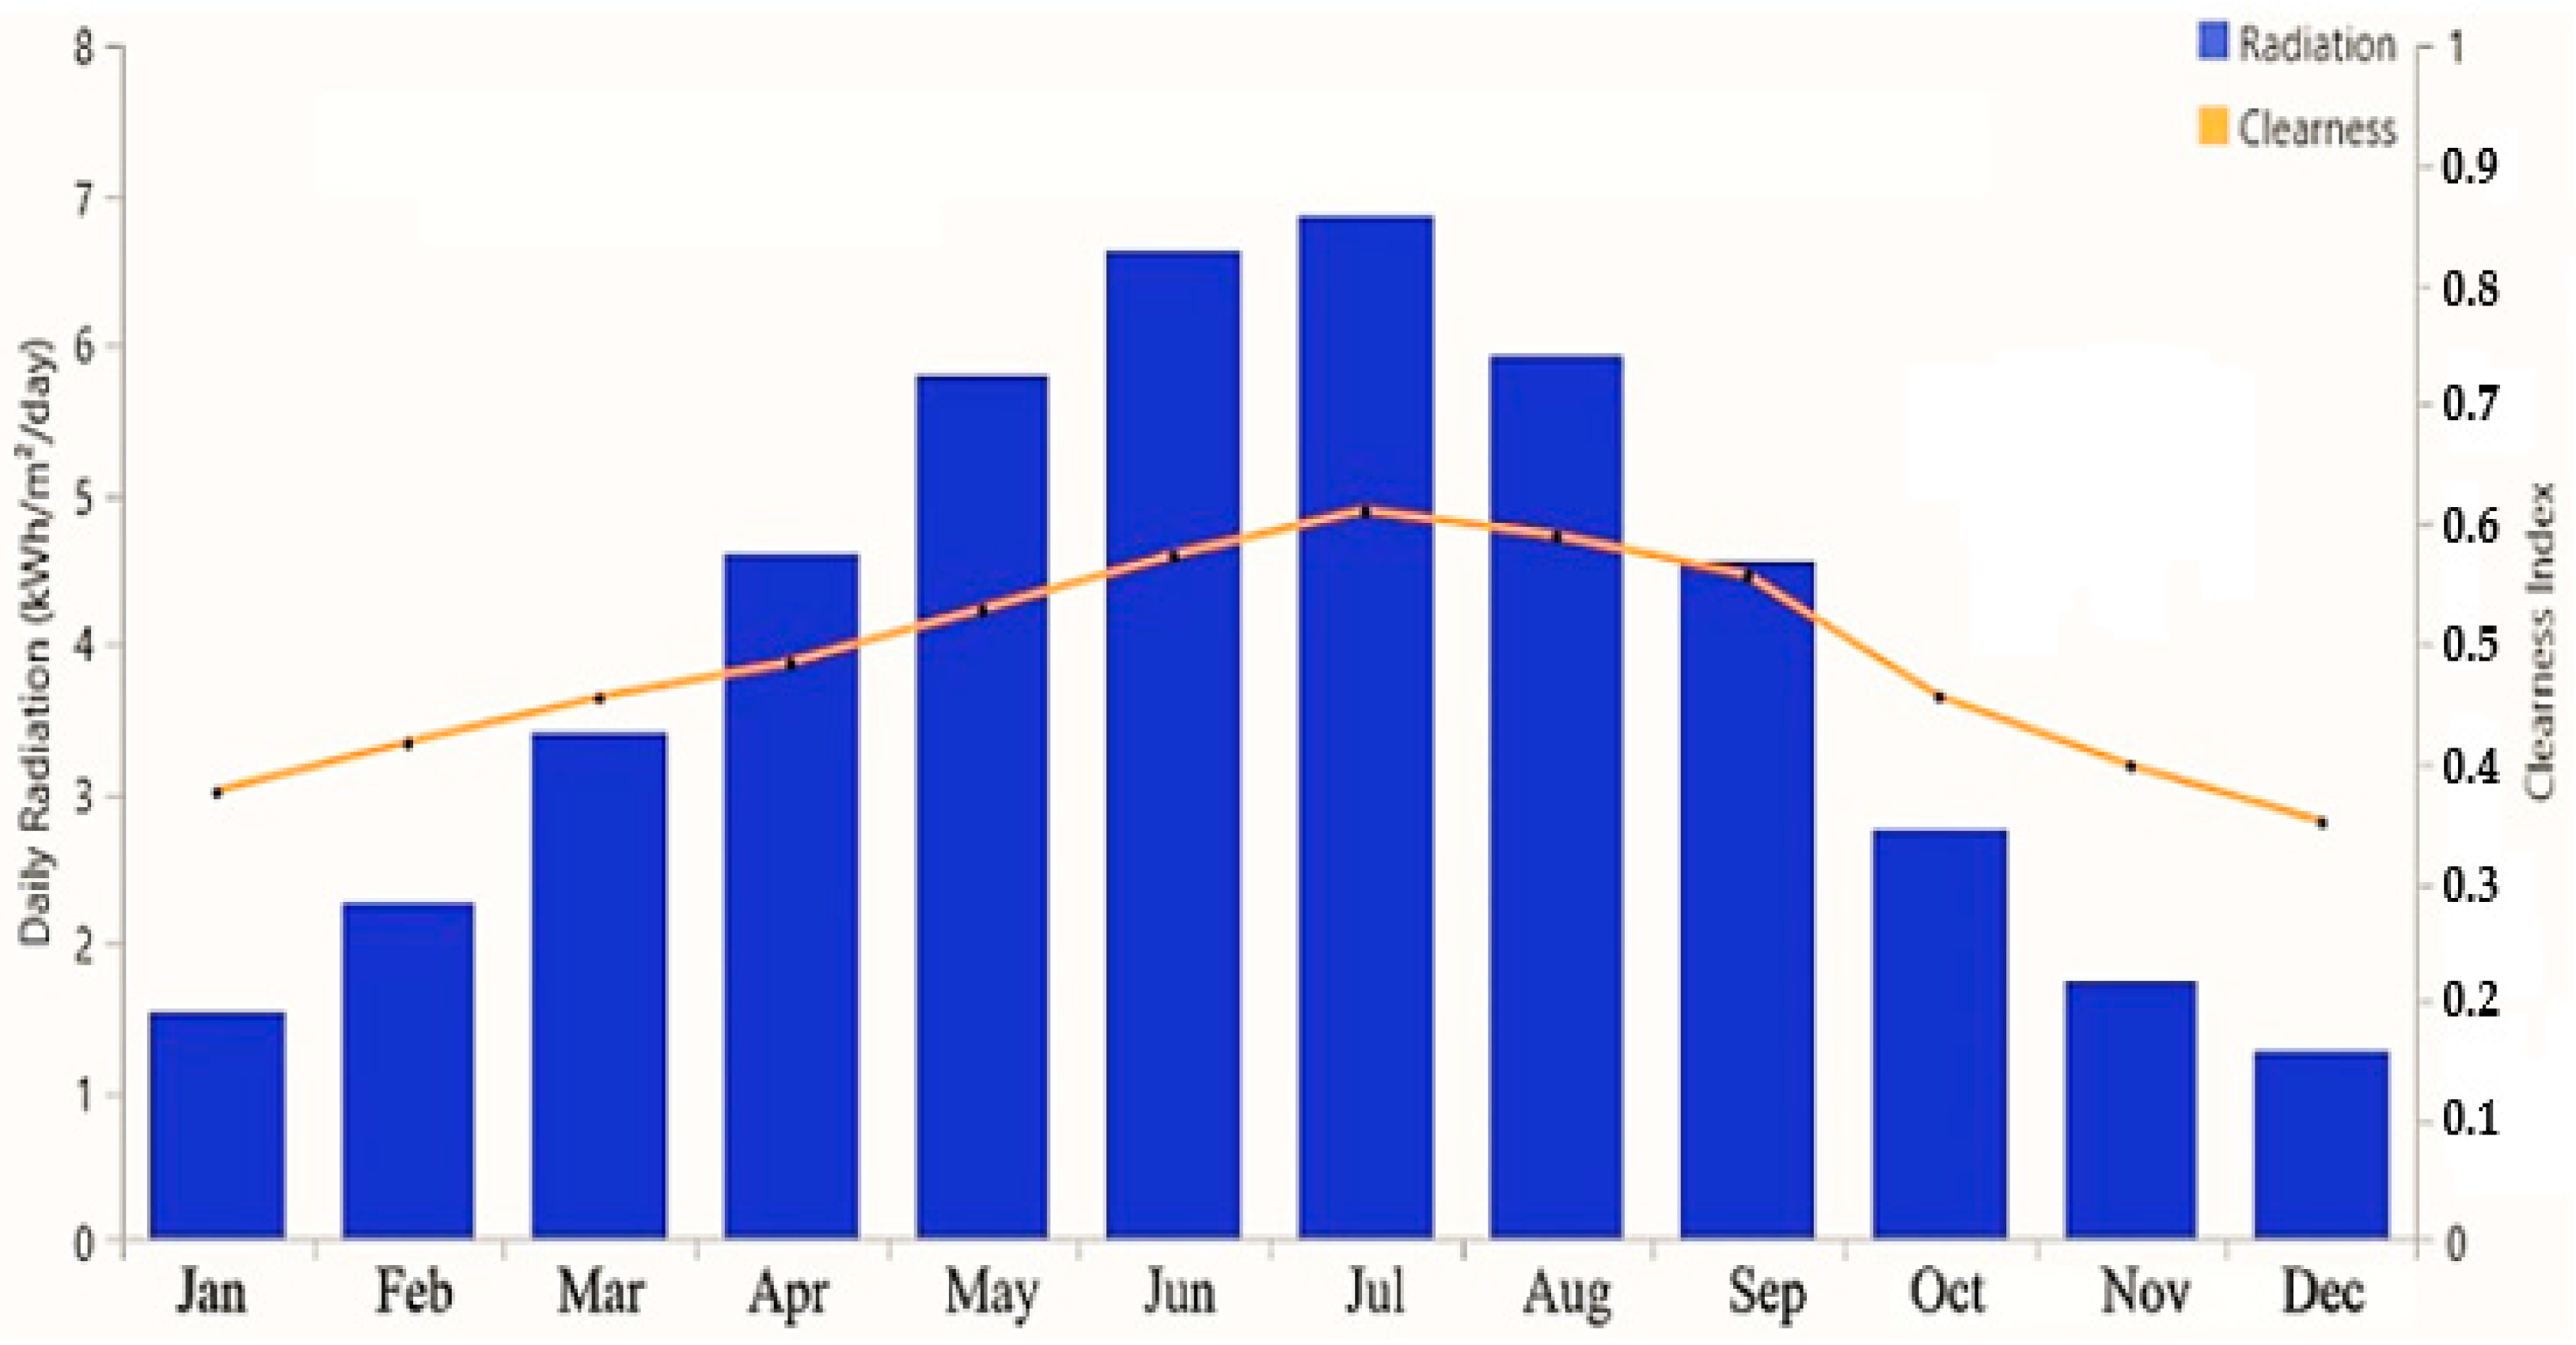
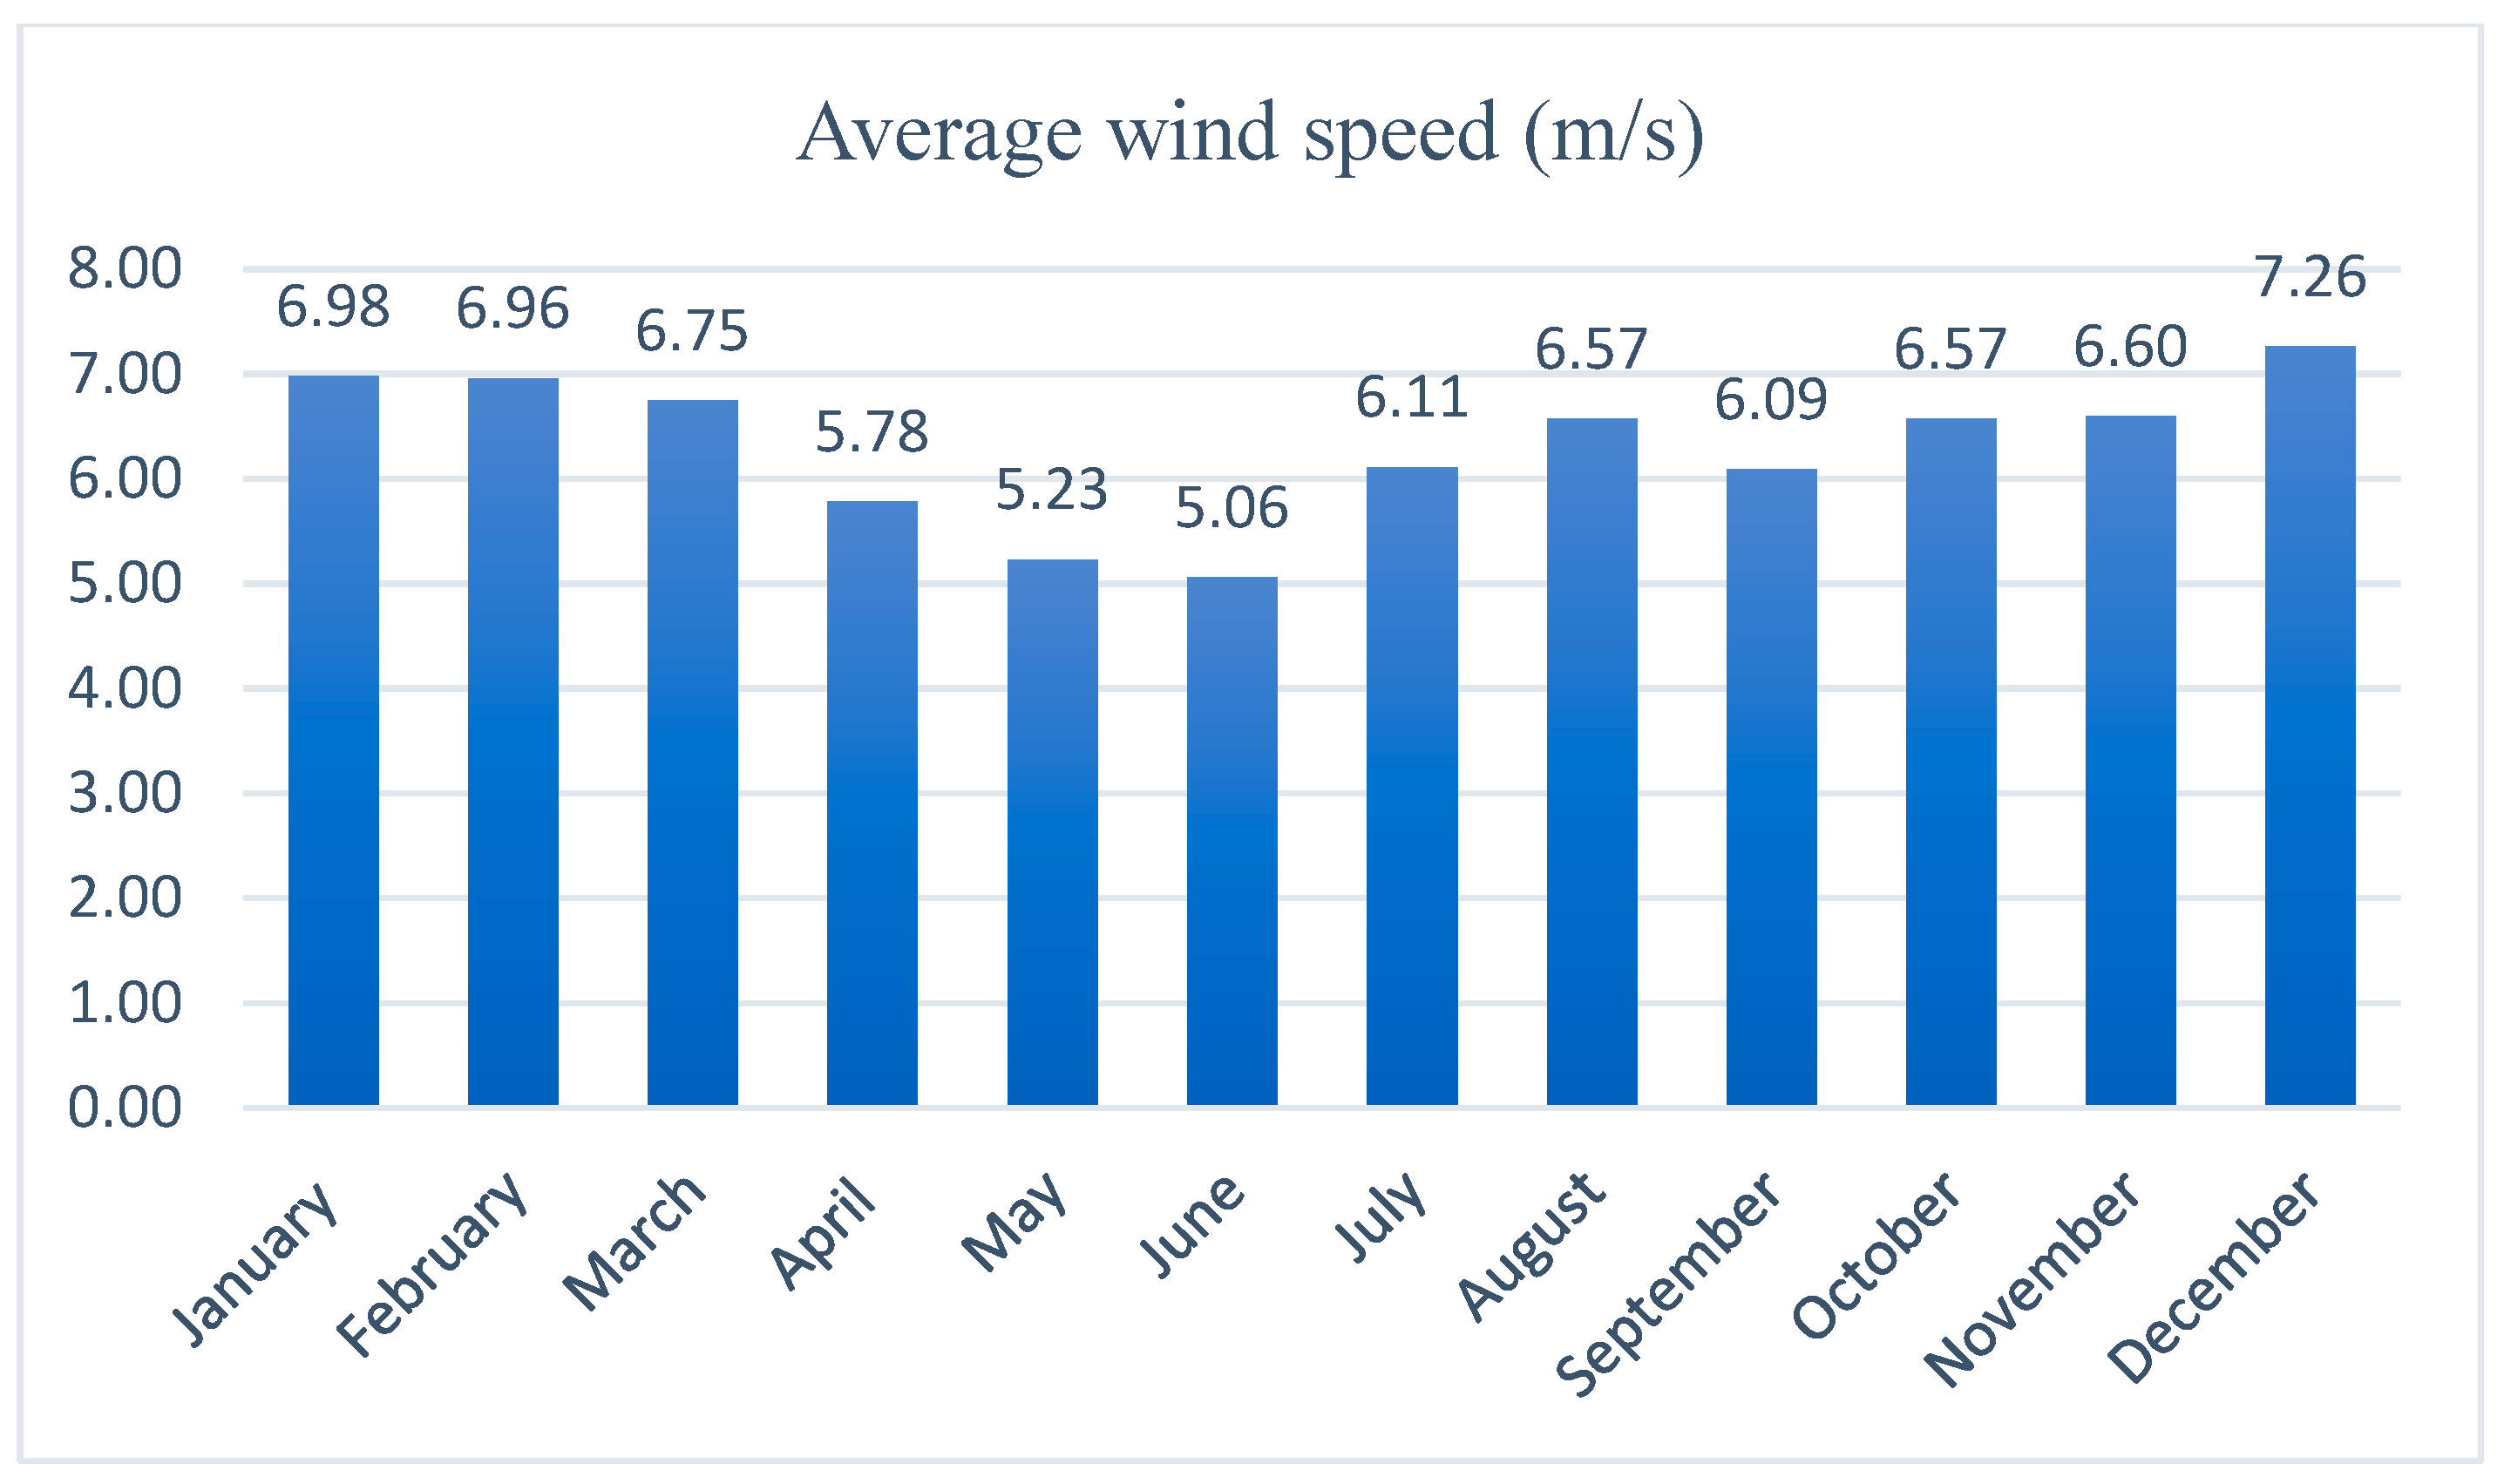
3.2. Temperature, Wind, and Irradiation Data
4. Mathematical Background and Optimization Methodology
4.1. Modeling of NG
4.2. Solar Panels
4.3. Wind Turbine
4.4. Battery Energy-Storage Systems
4.5. Converters
4.6. Utility Grid
4.7. Economic Indices
4.8. Other Economic-Input Variables
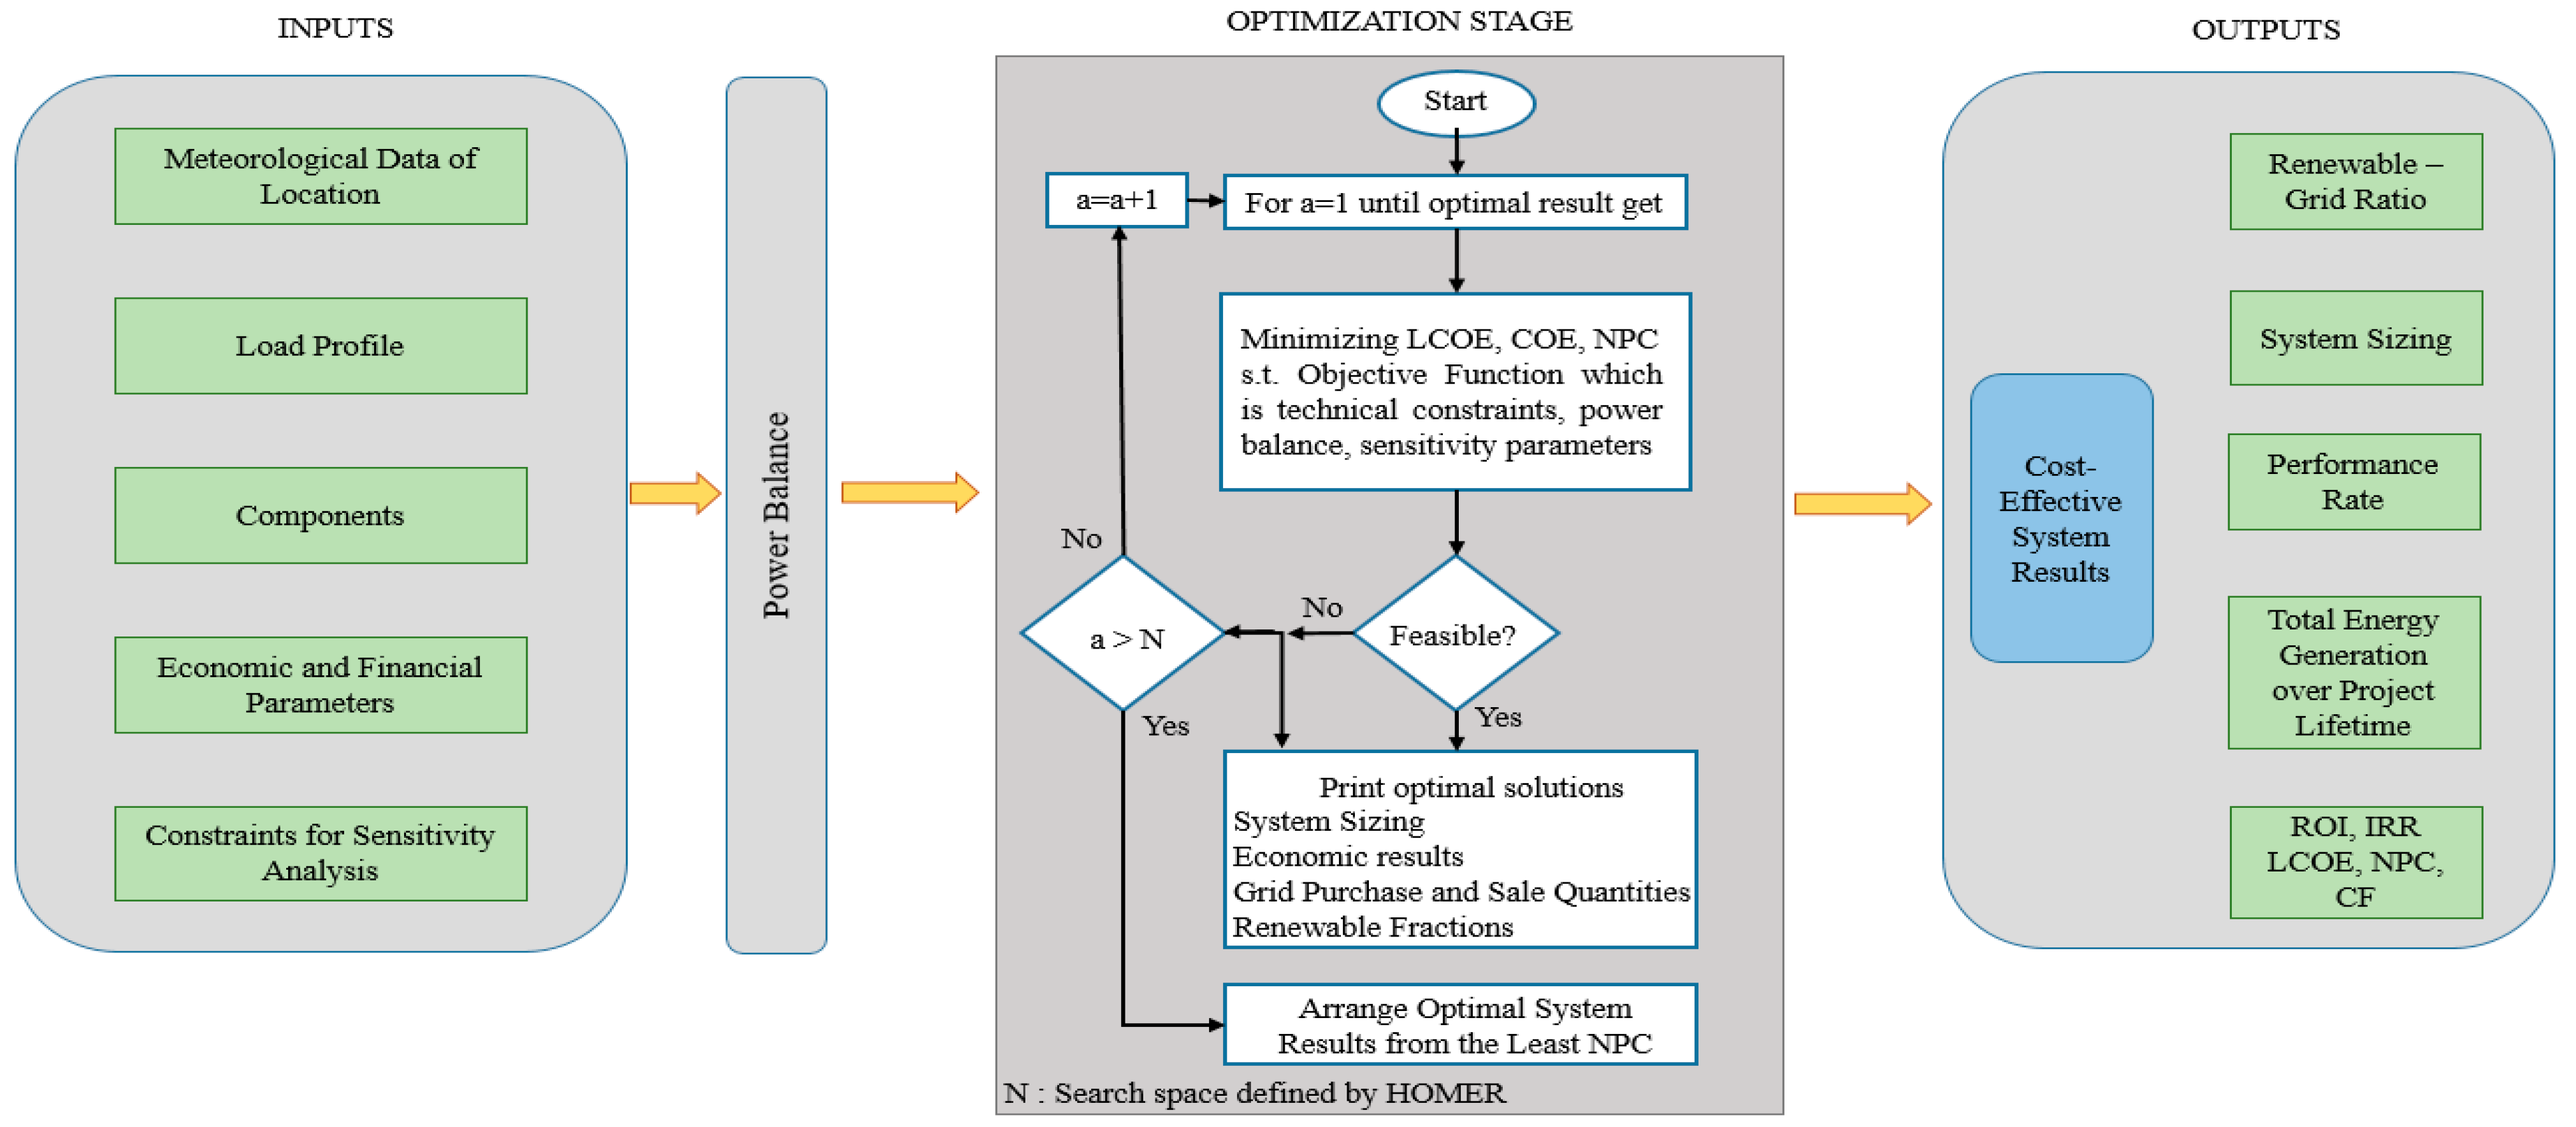
4.9. Optimization Methodology
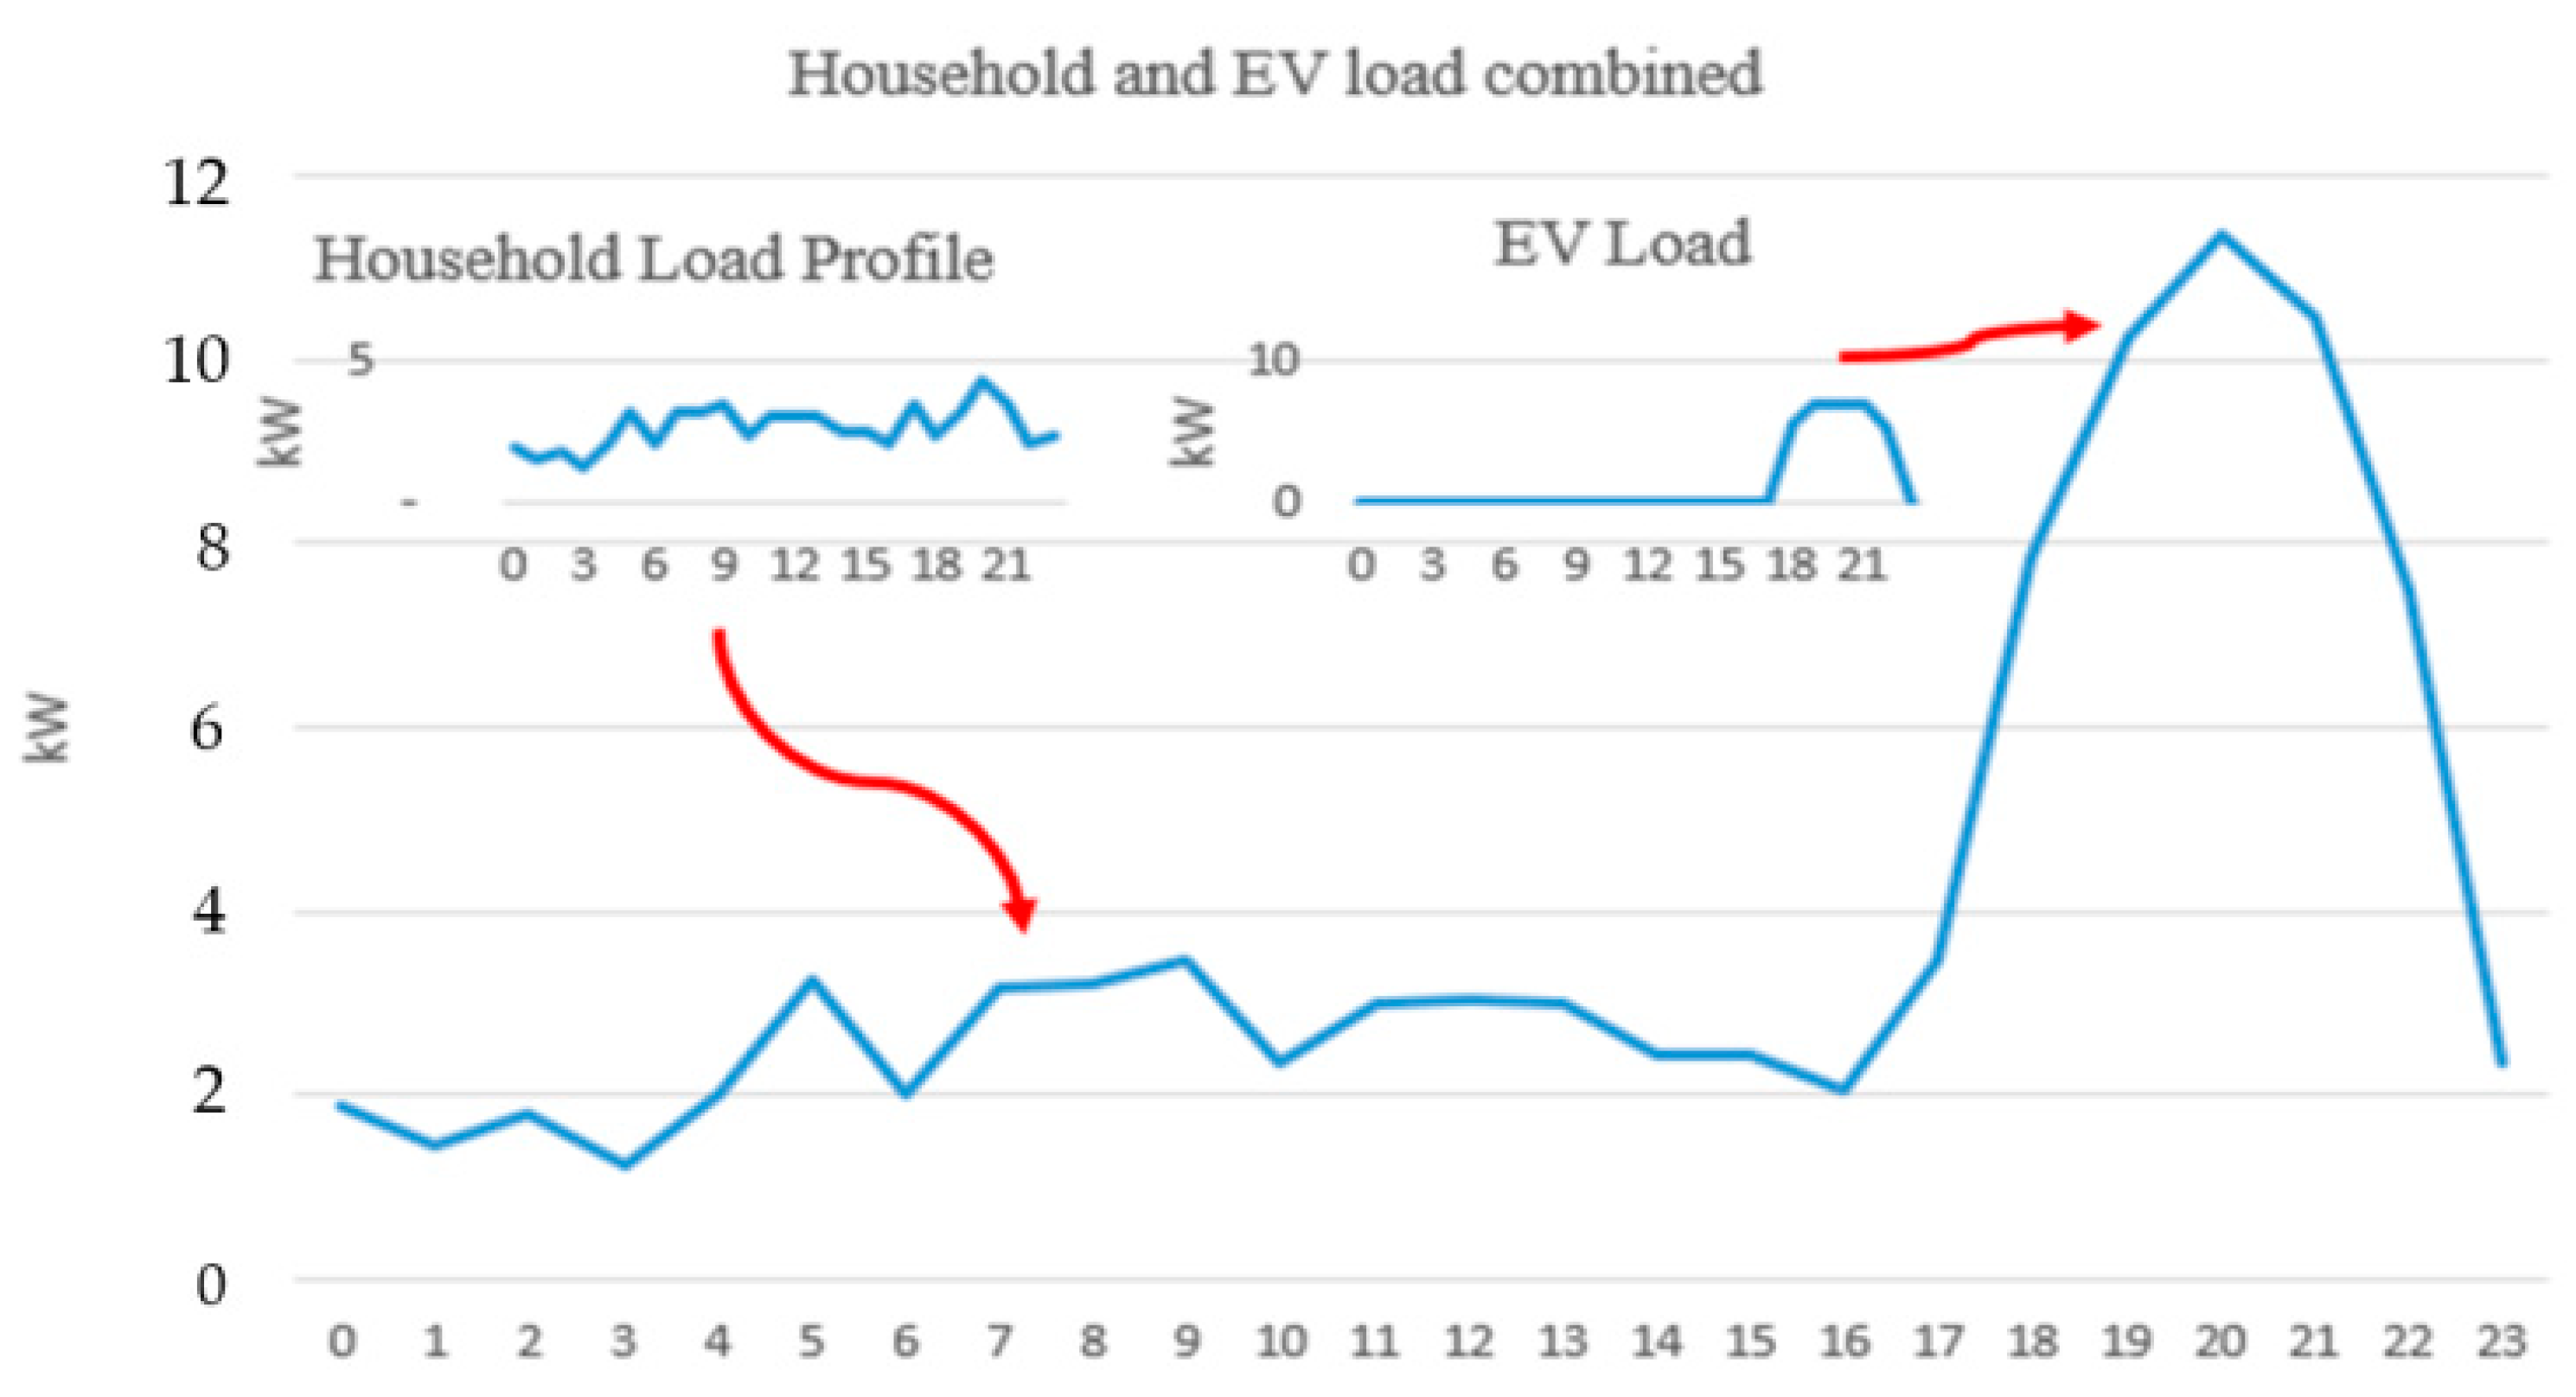
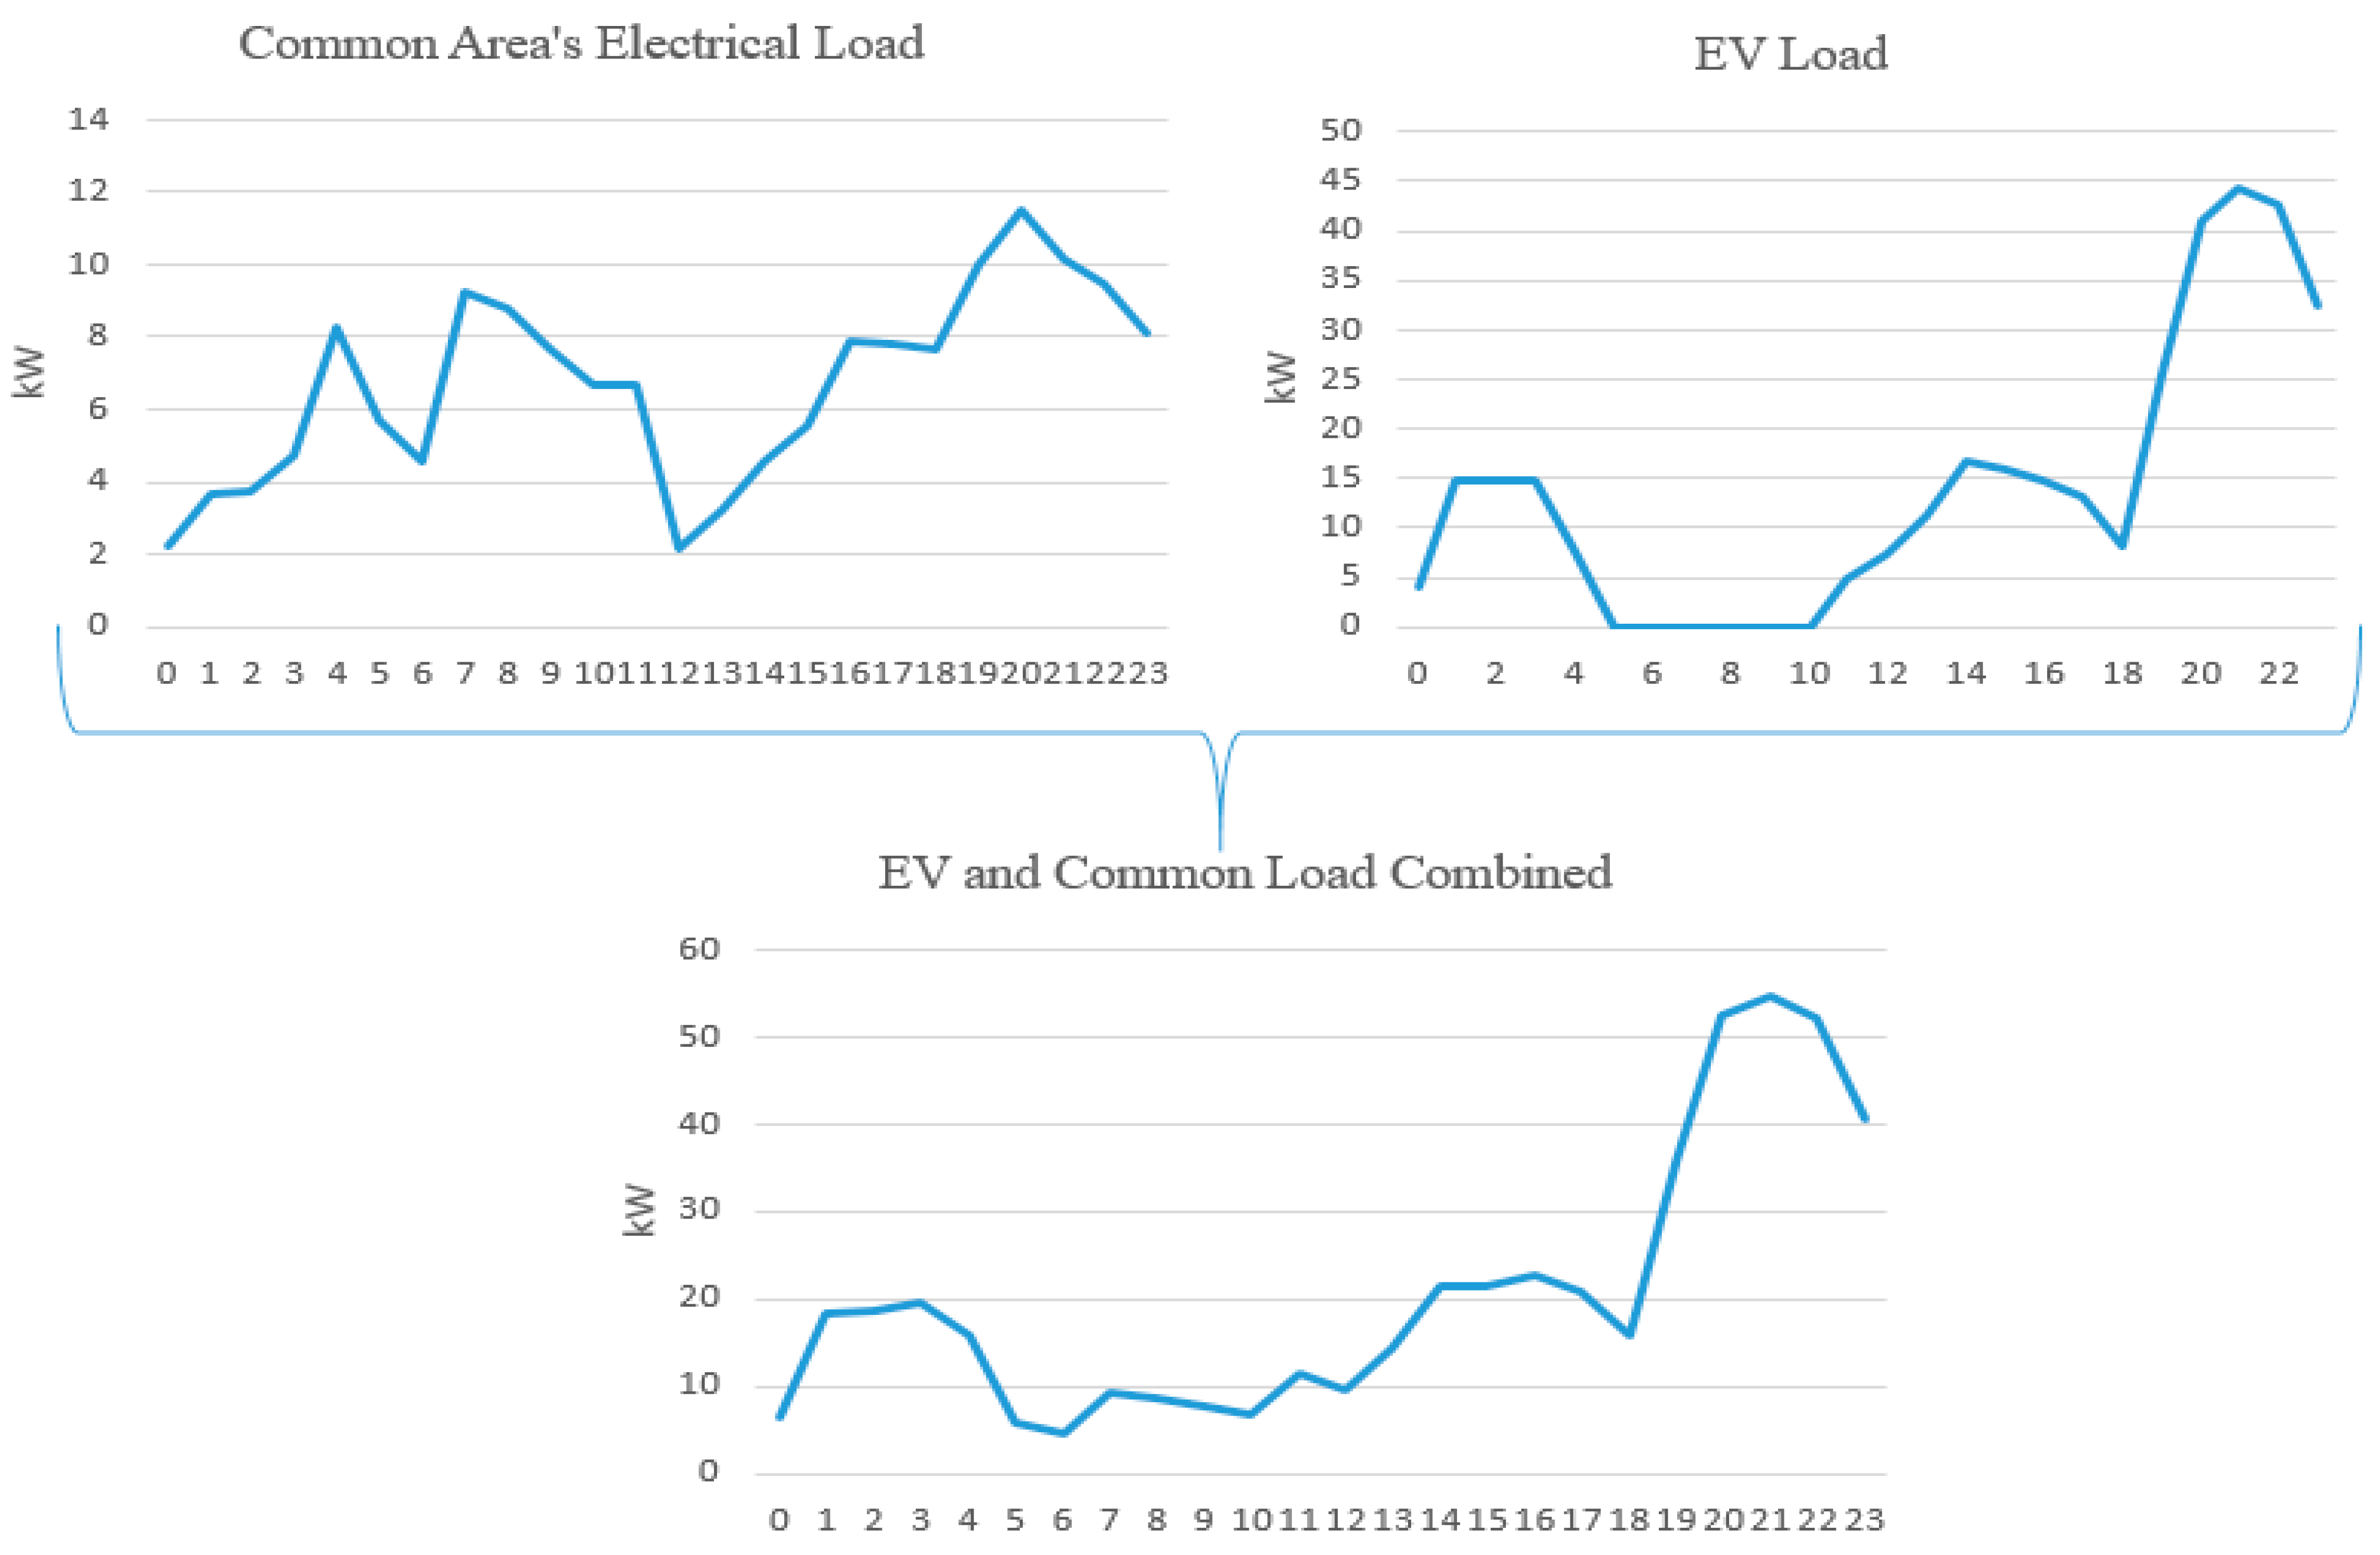
4.10. Load Profile
5. Results and Discussion
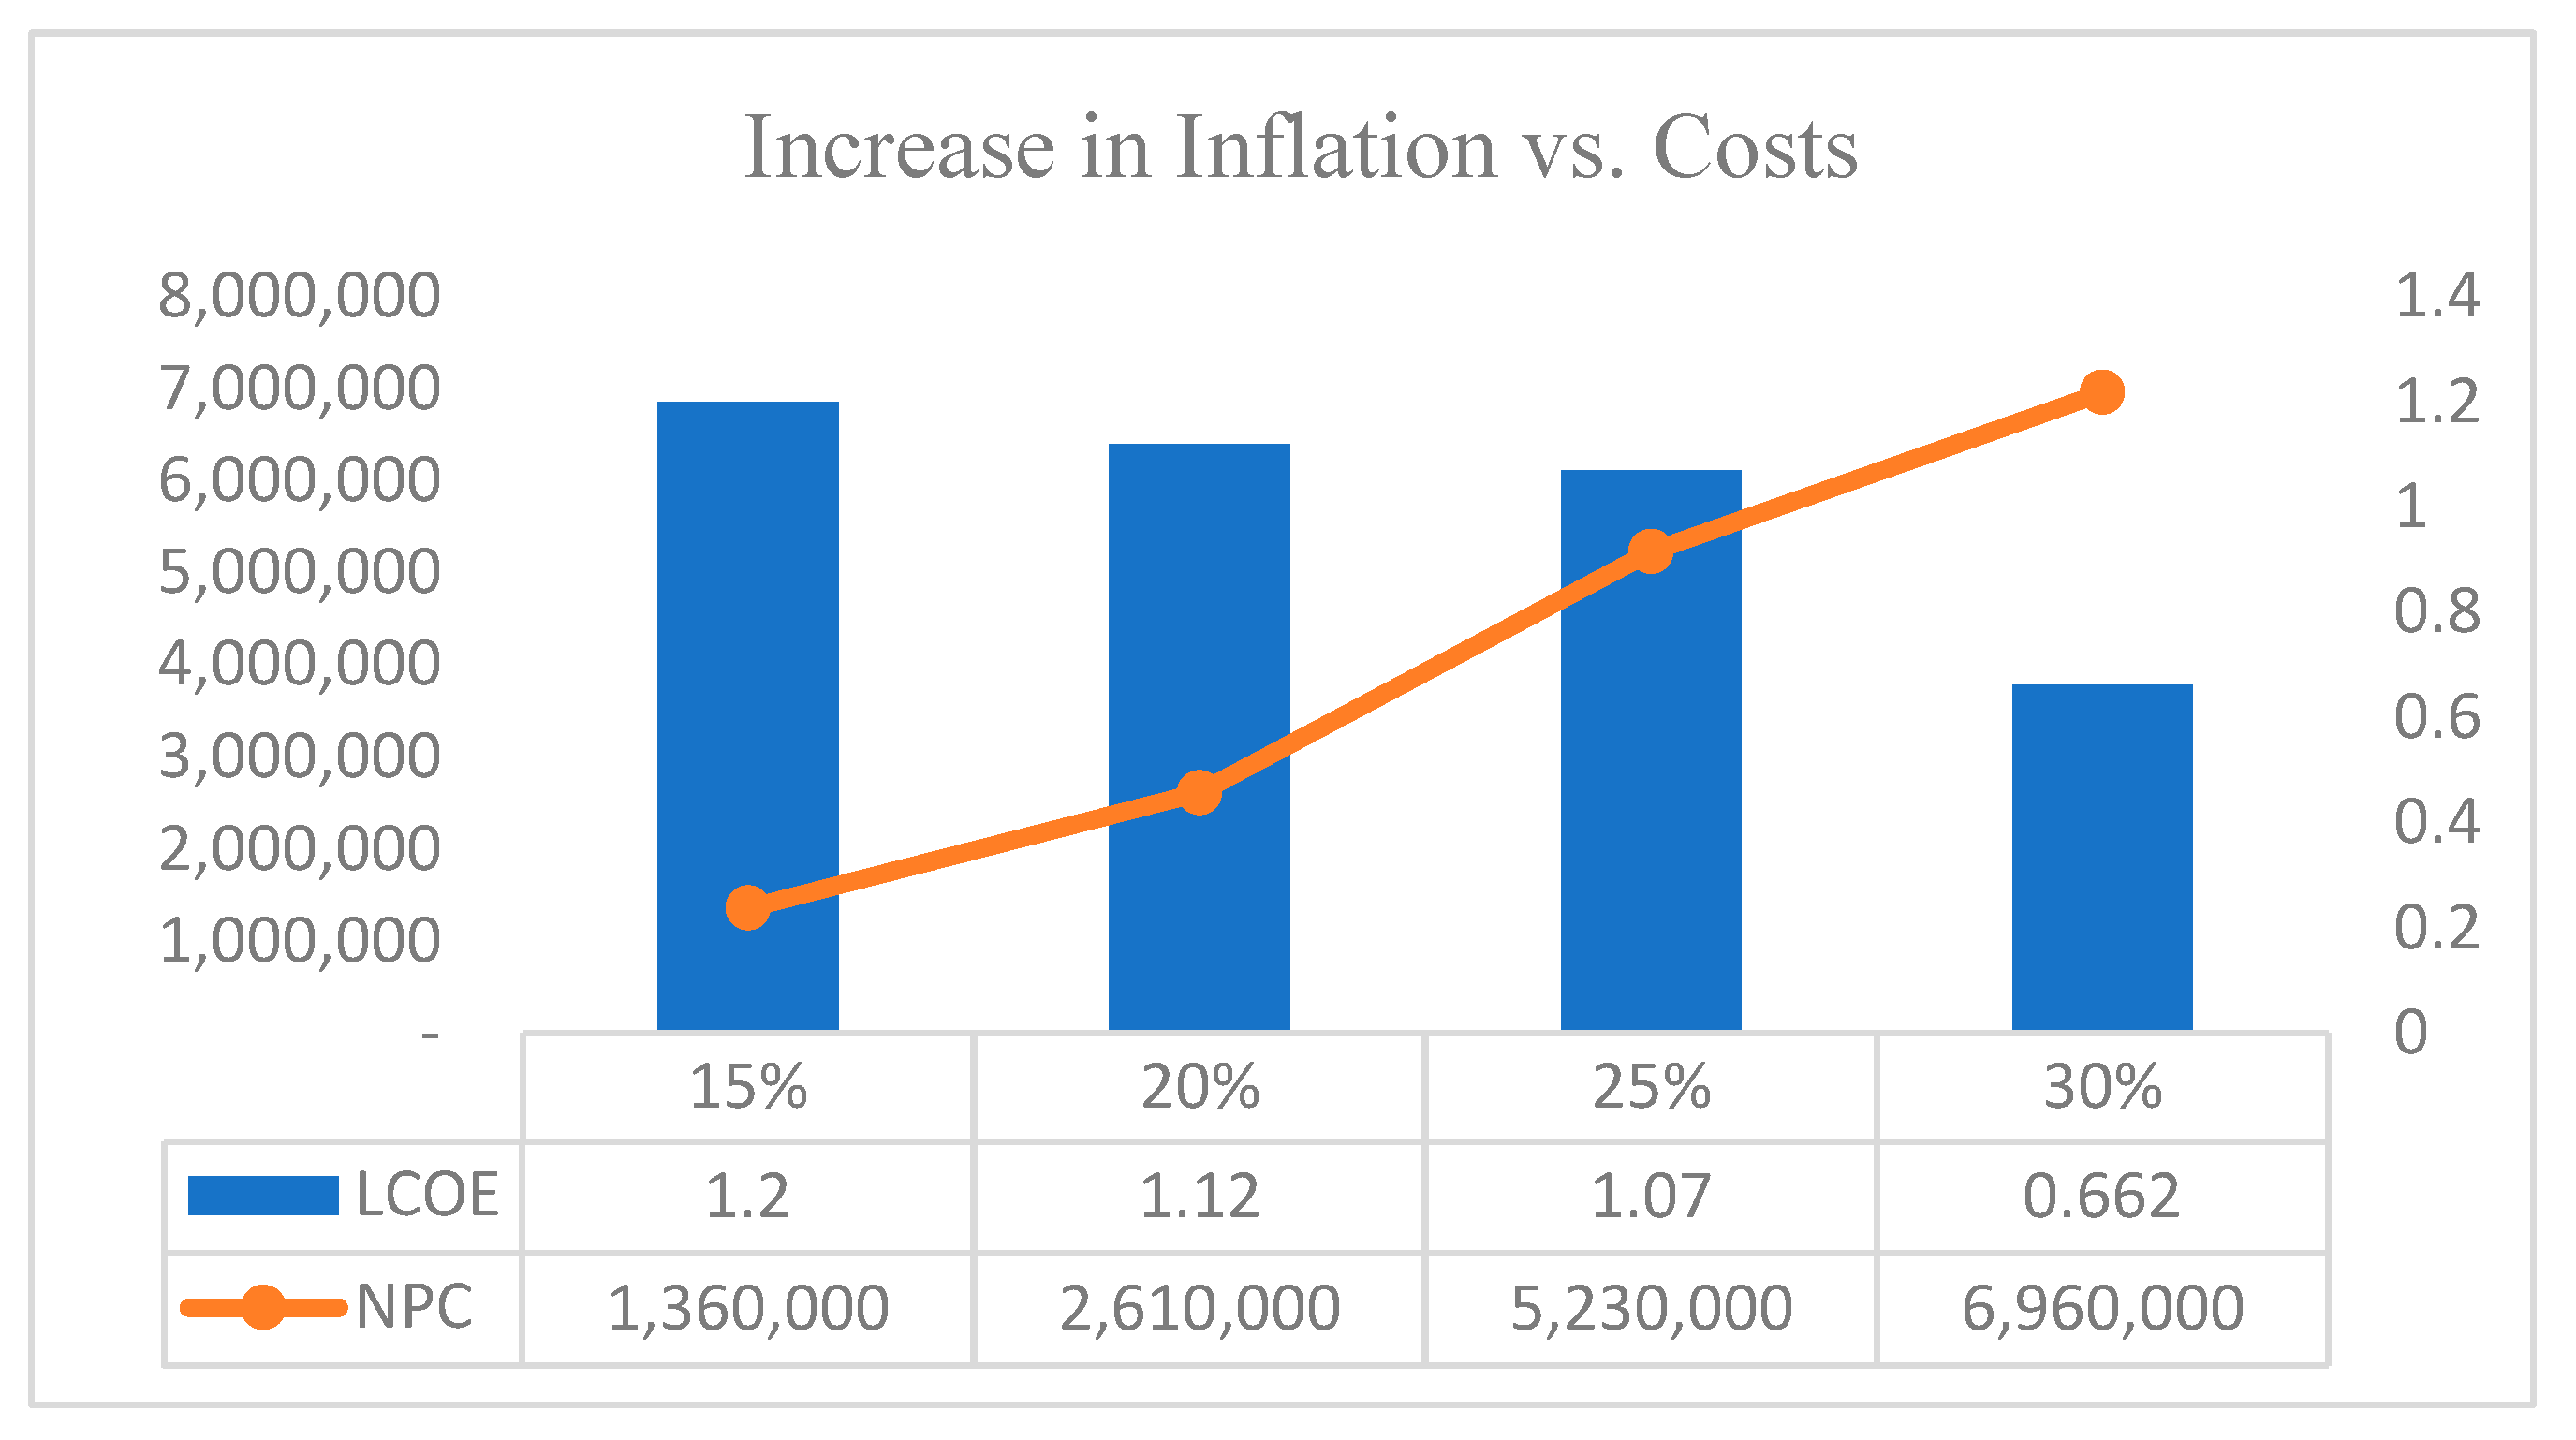
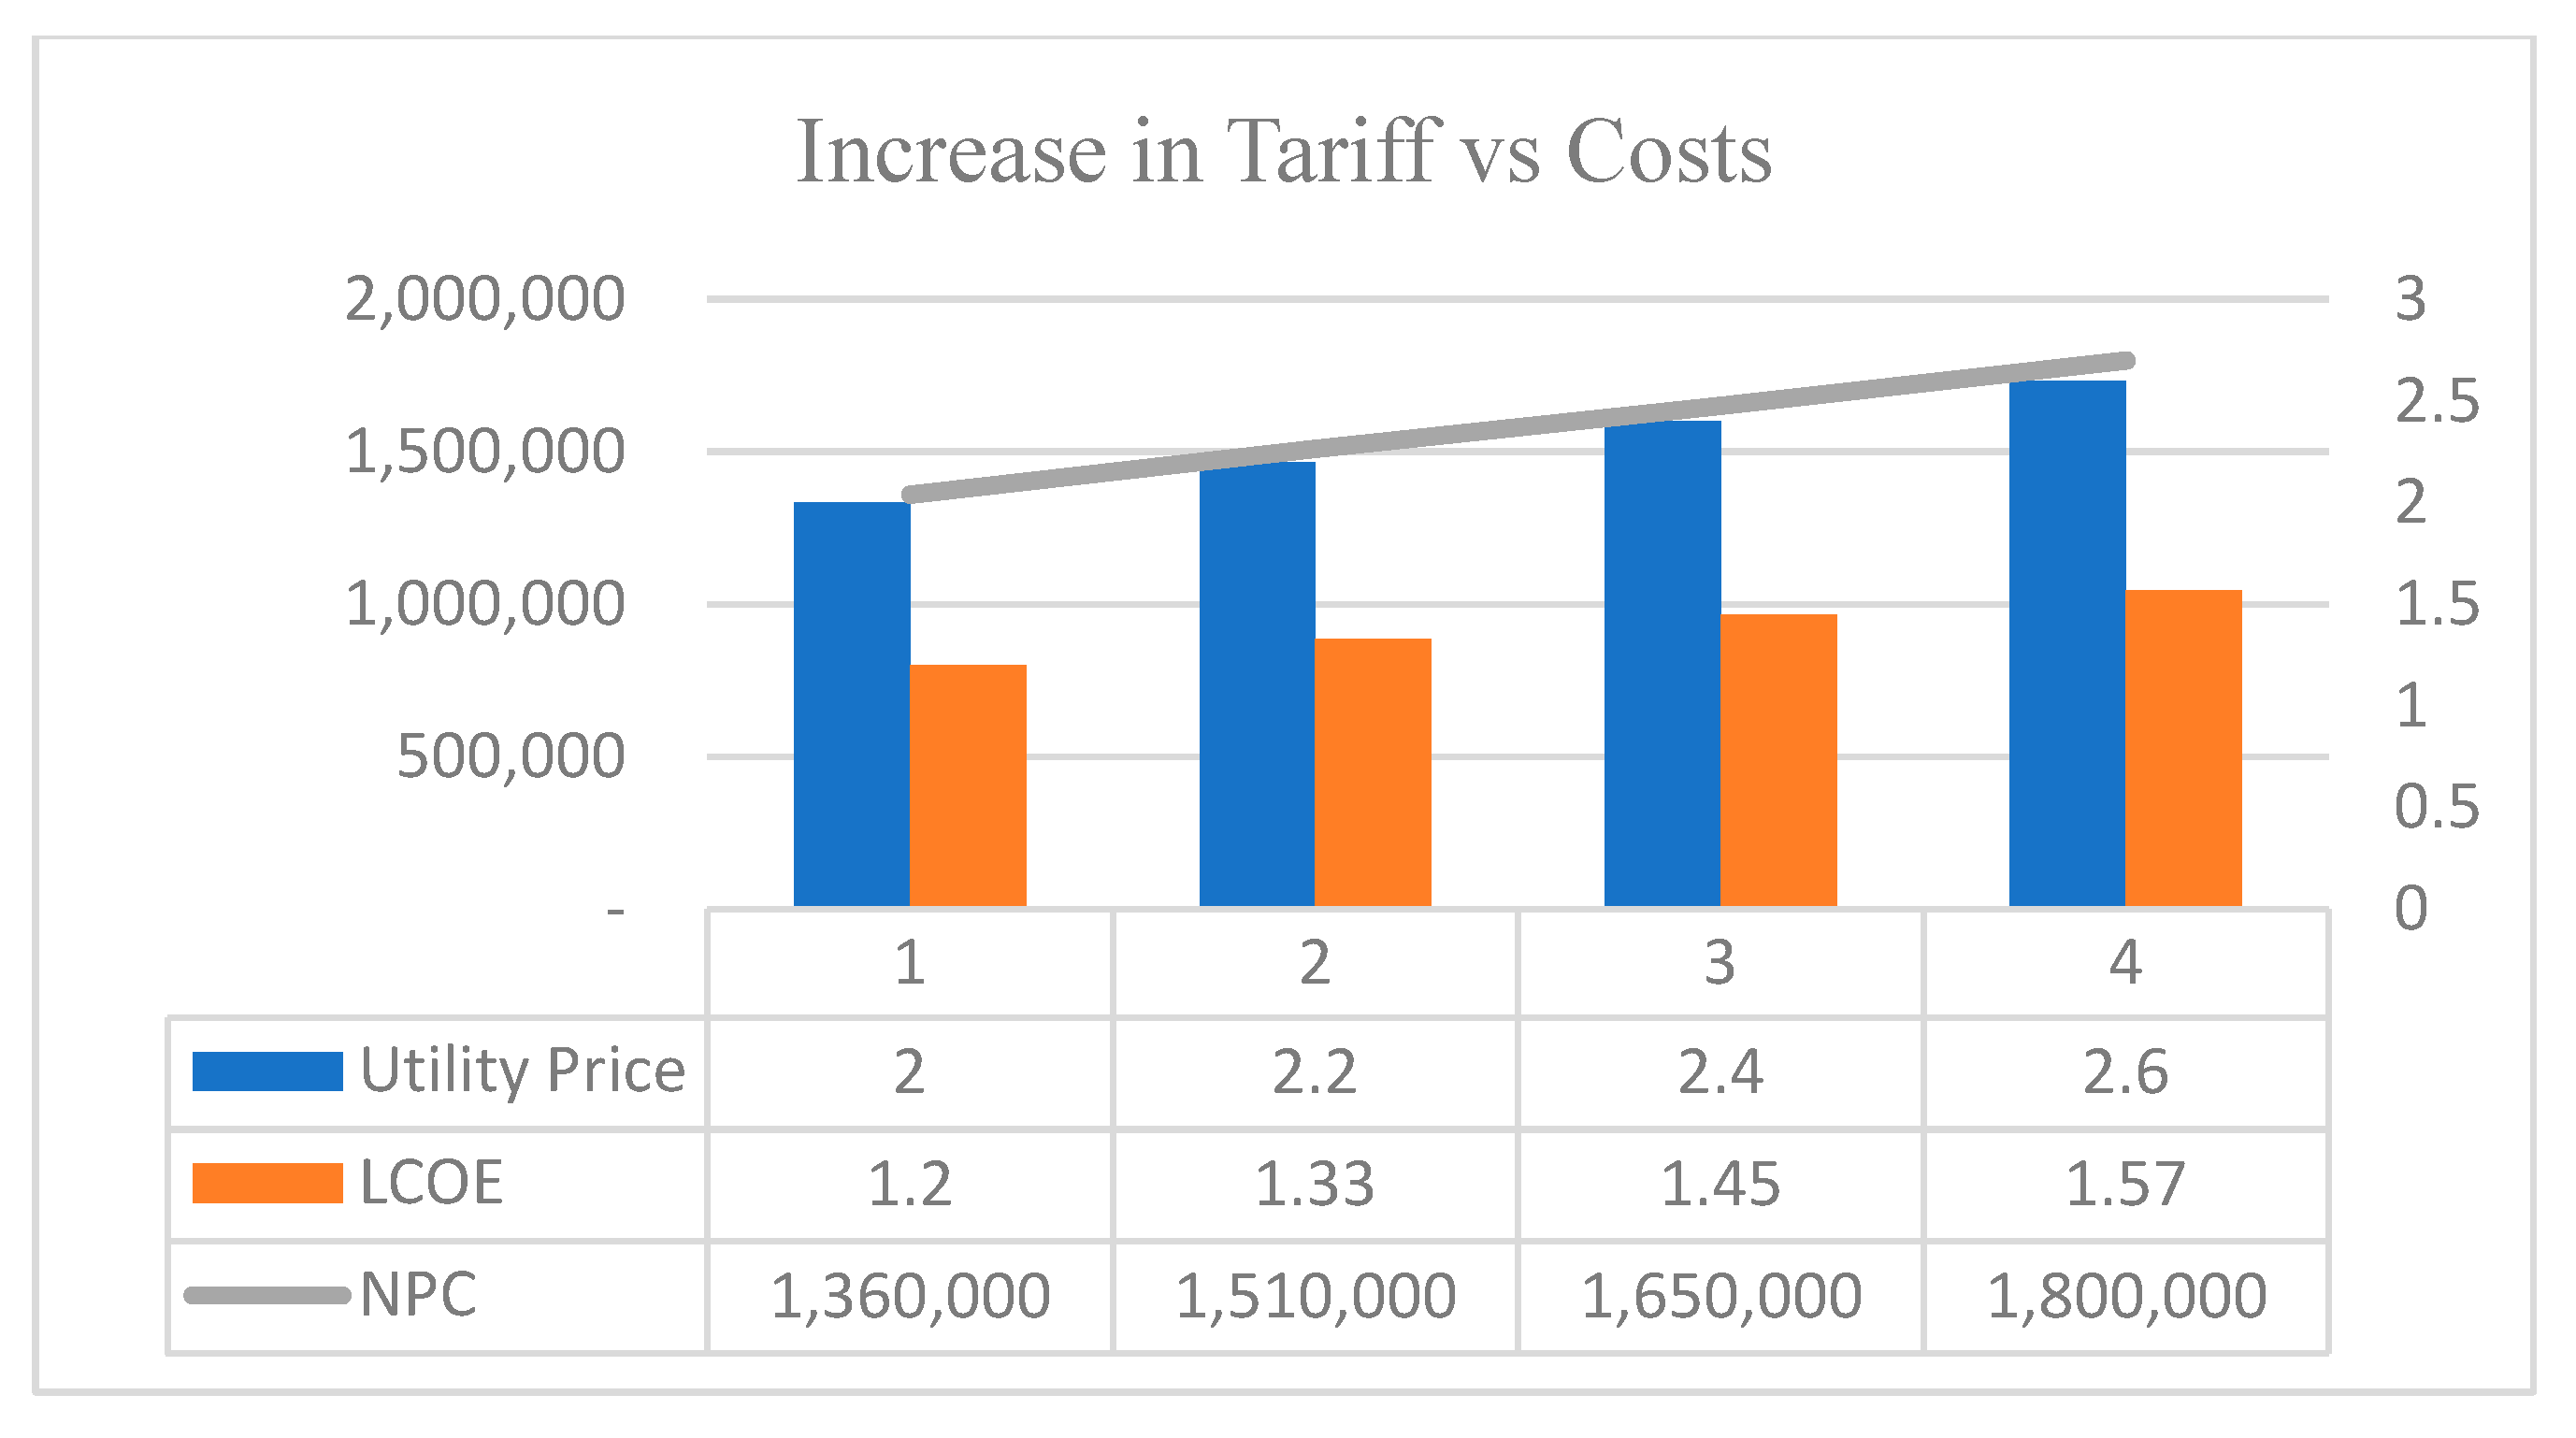
5.1. Sensitivity Analysis for Case1
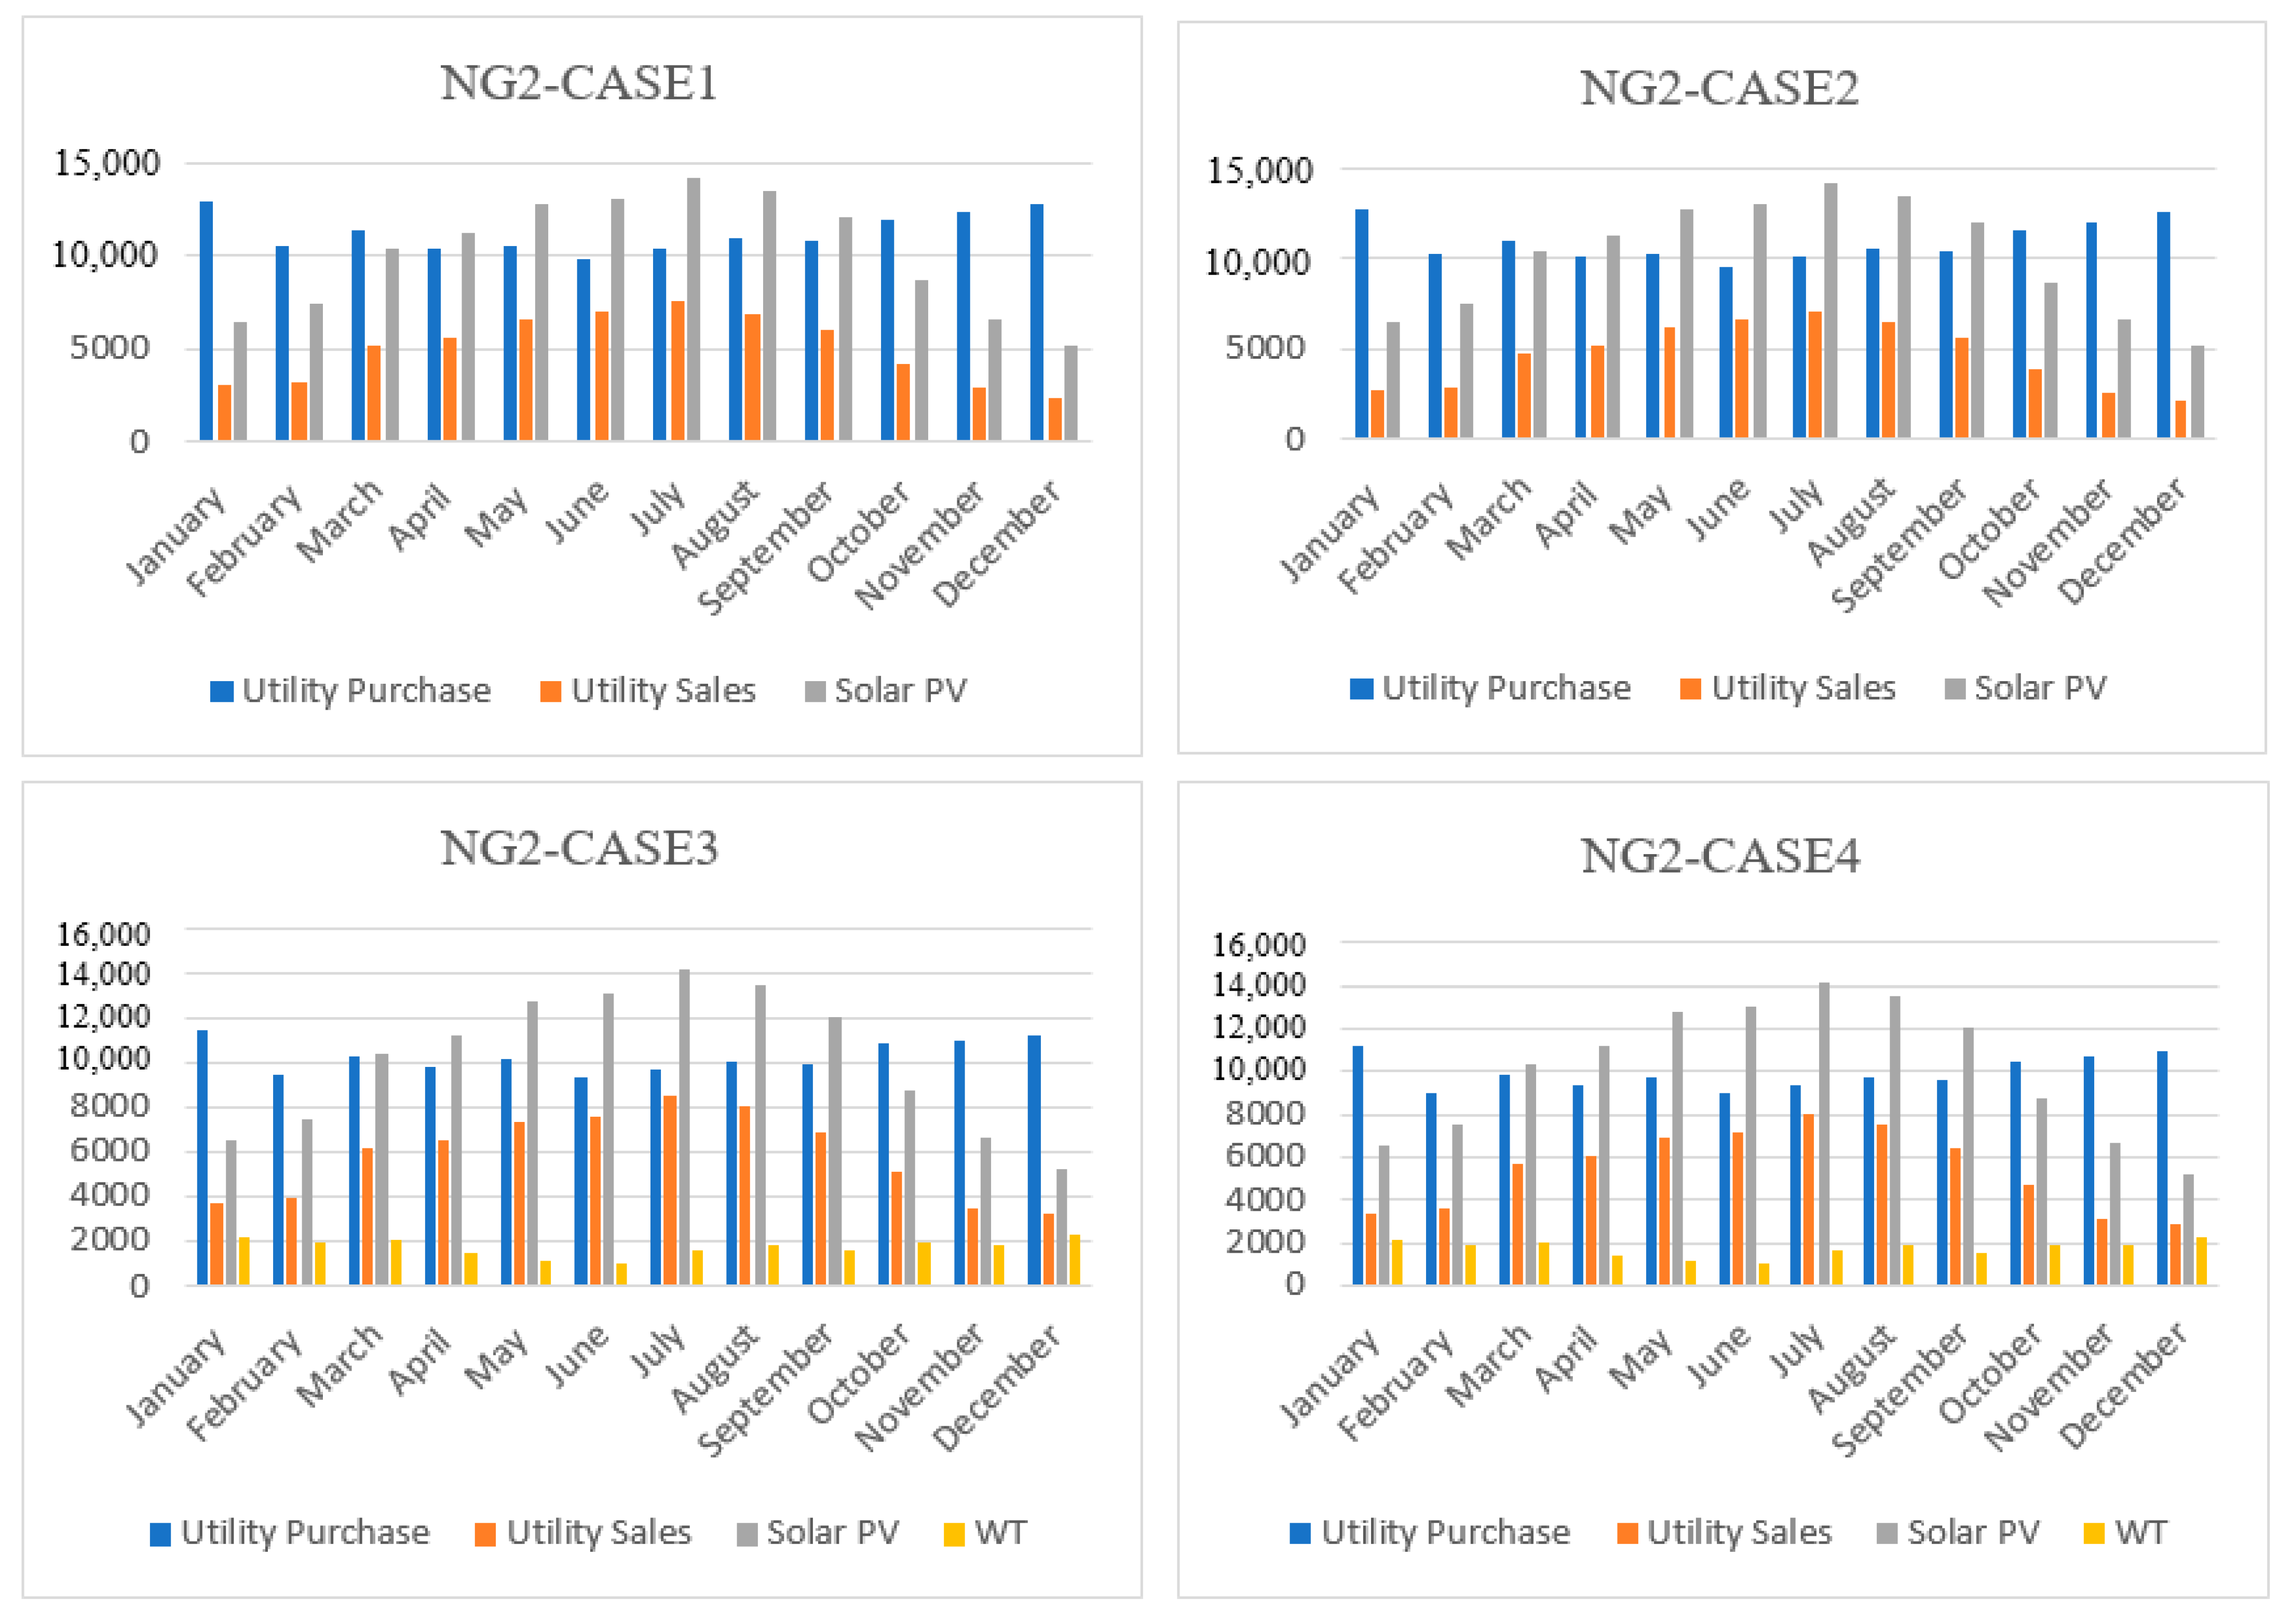
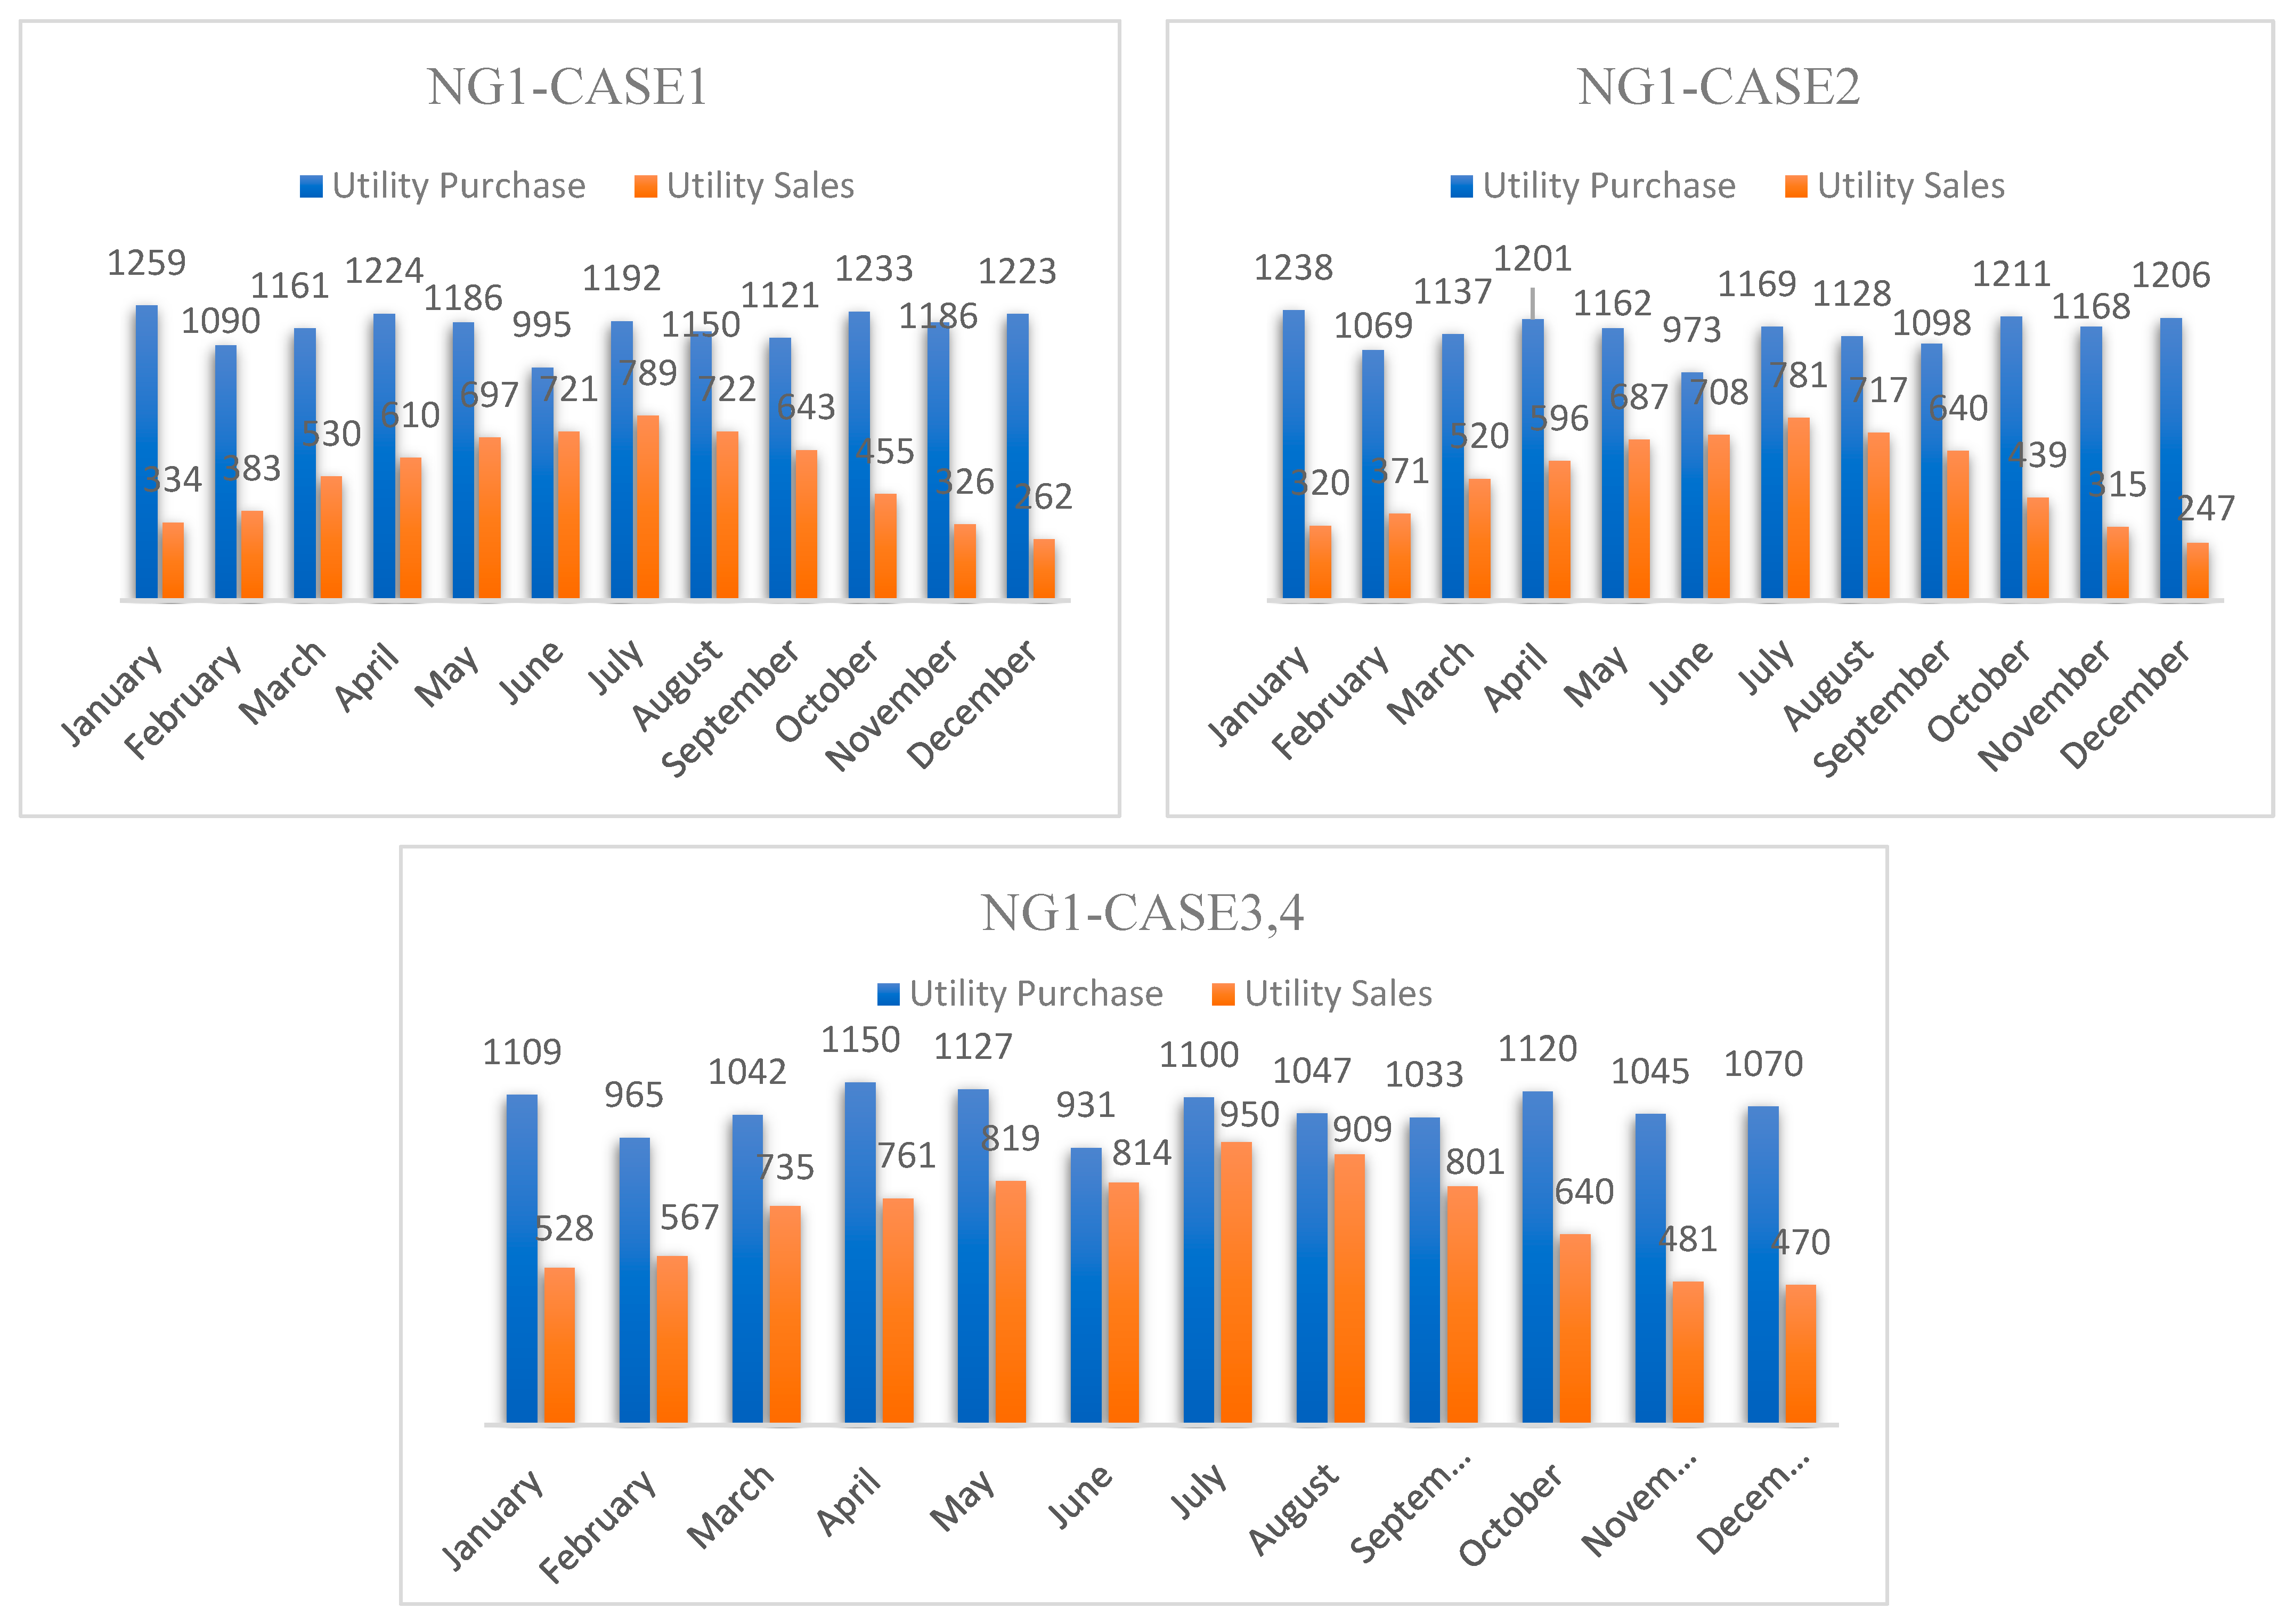
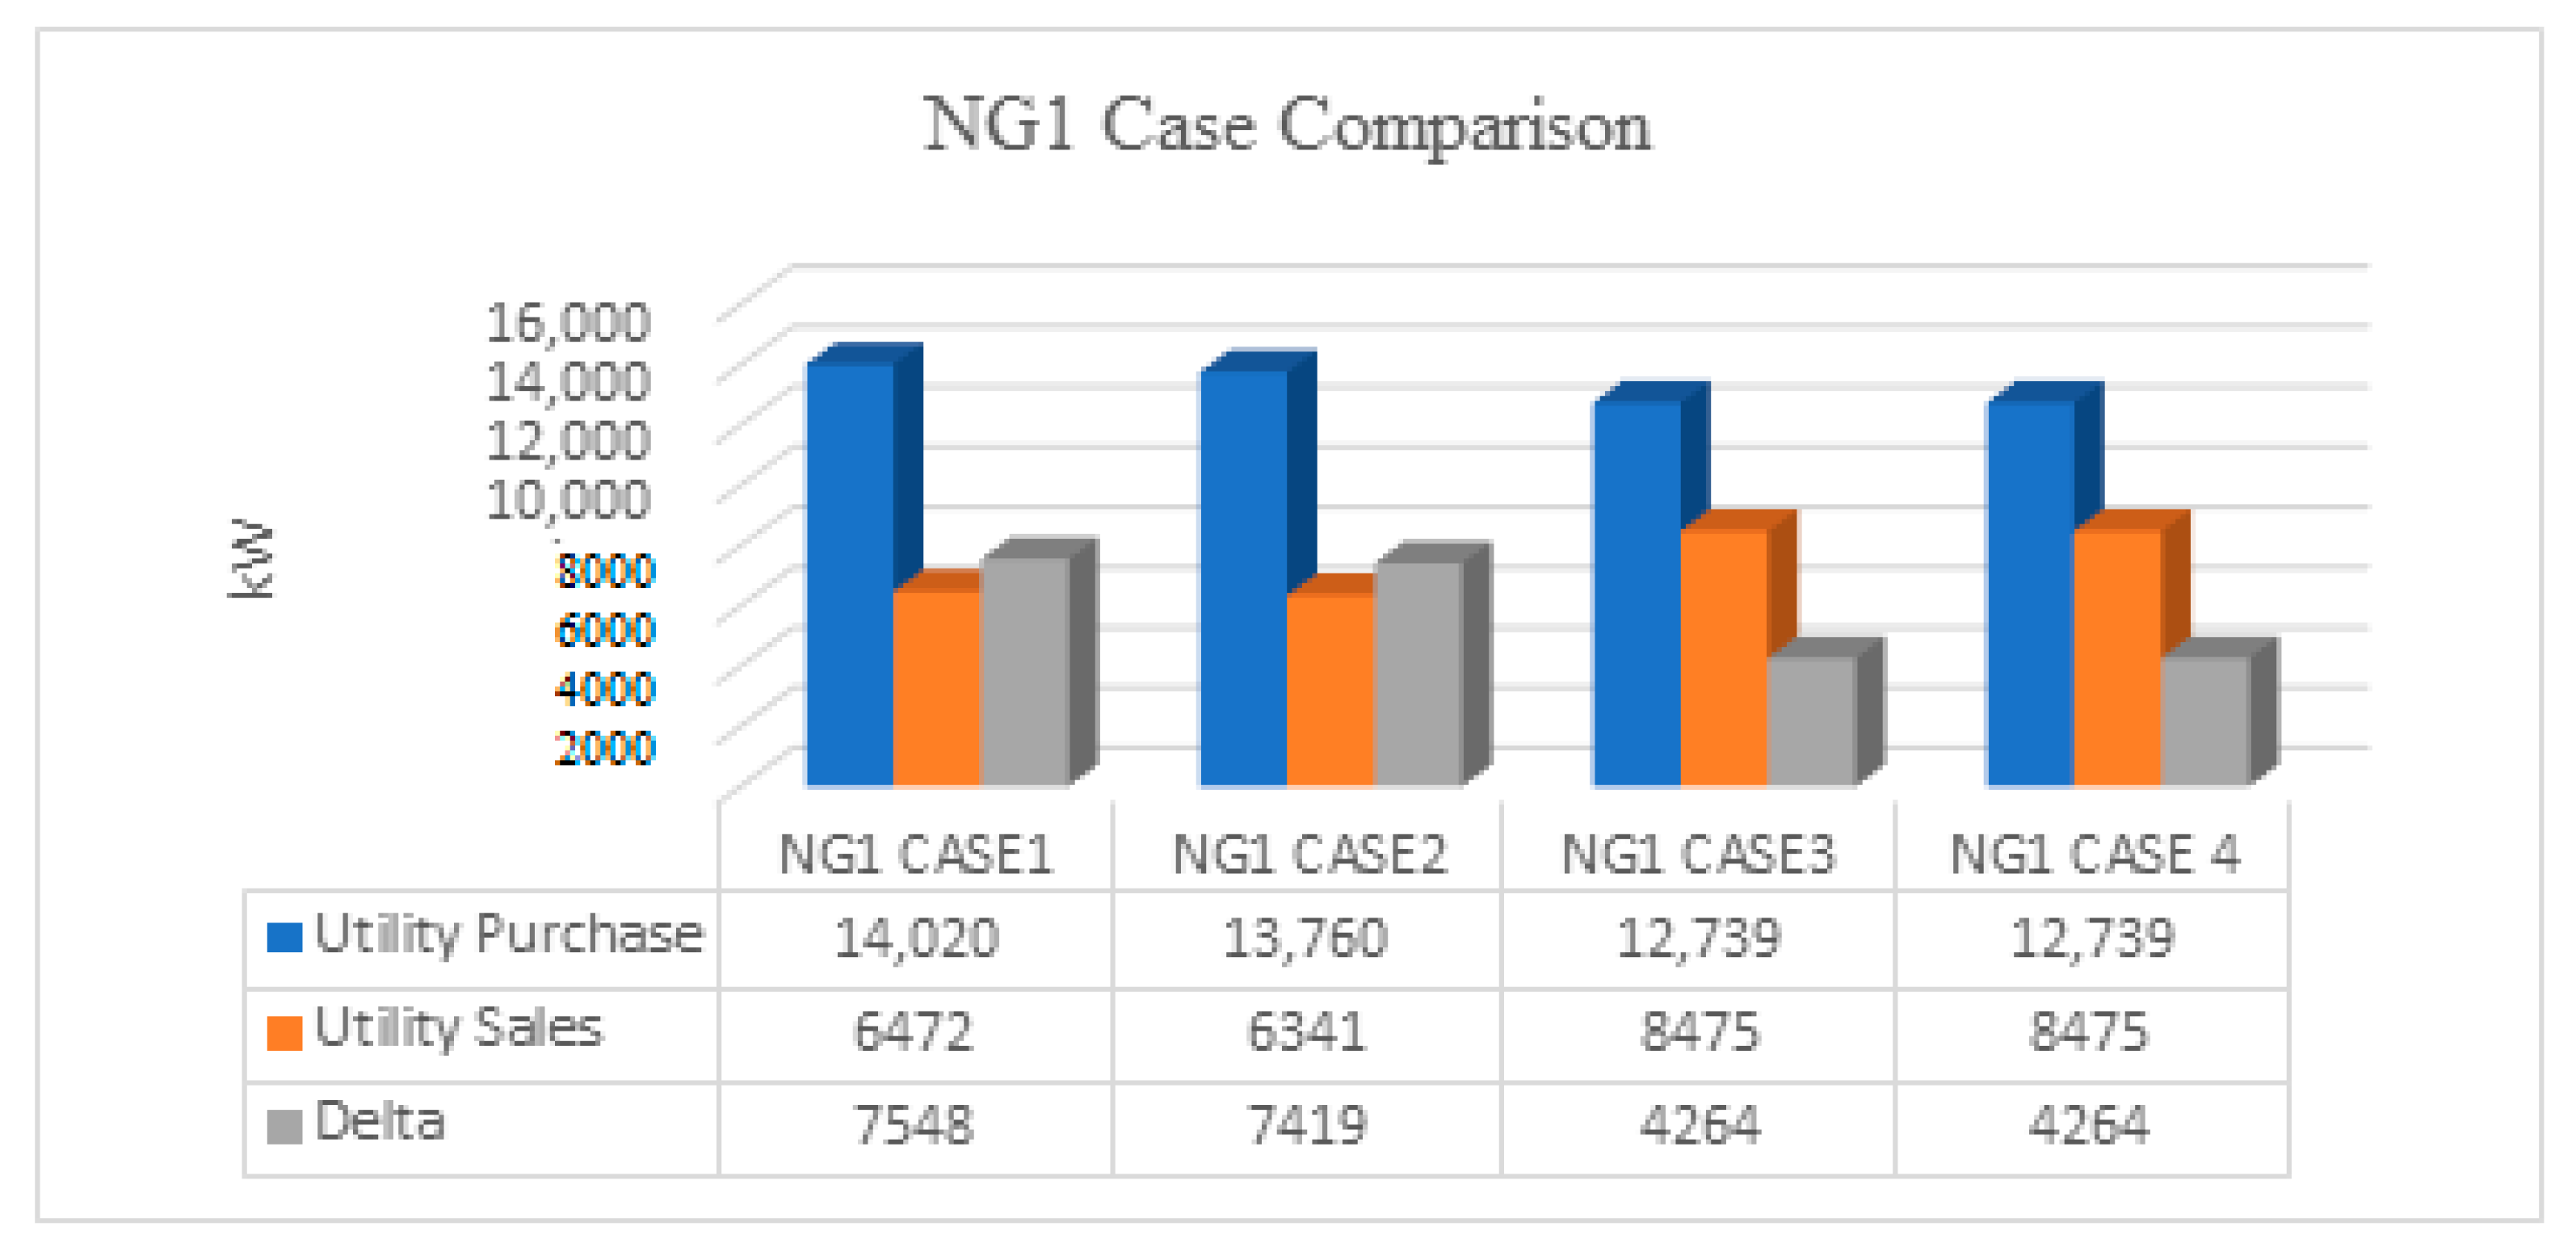
5.2. Analysis for Cases
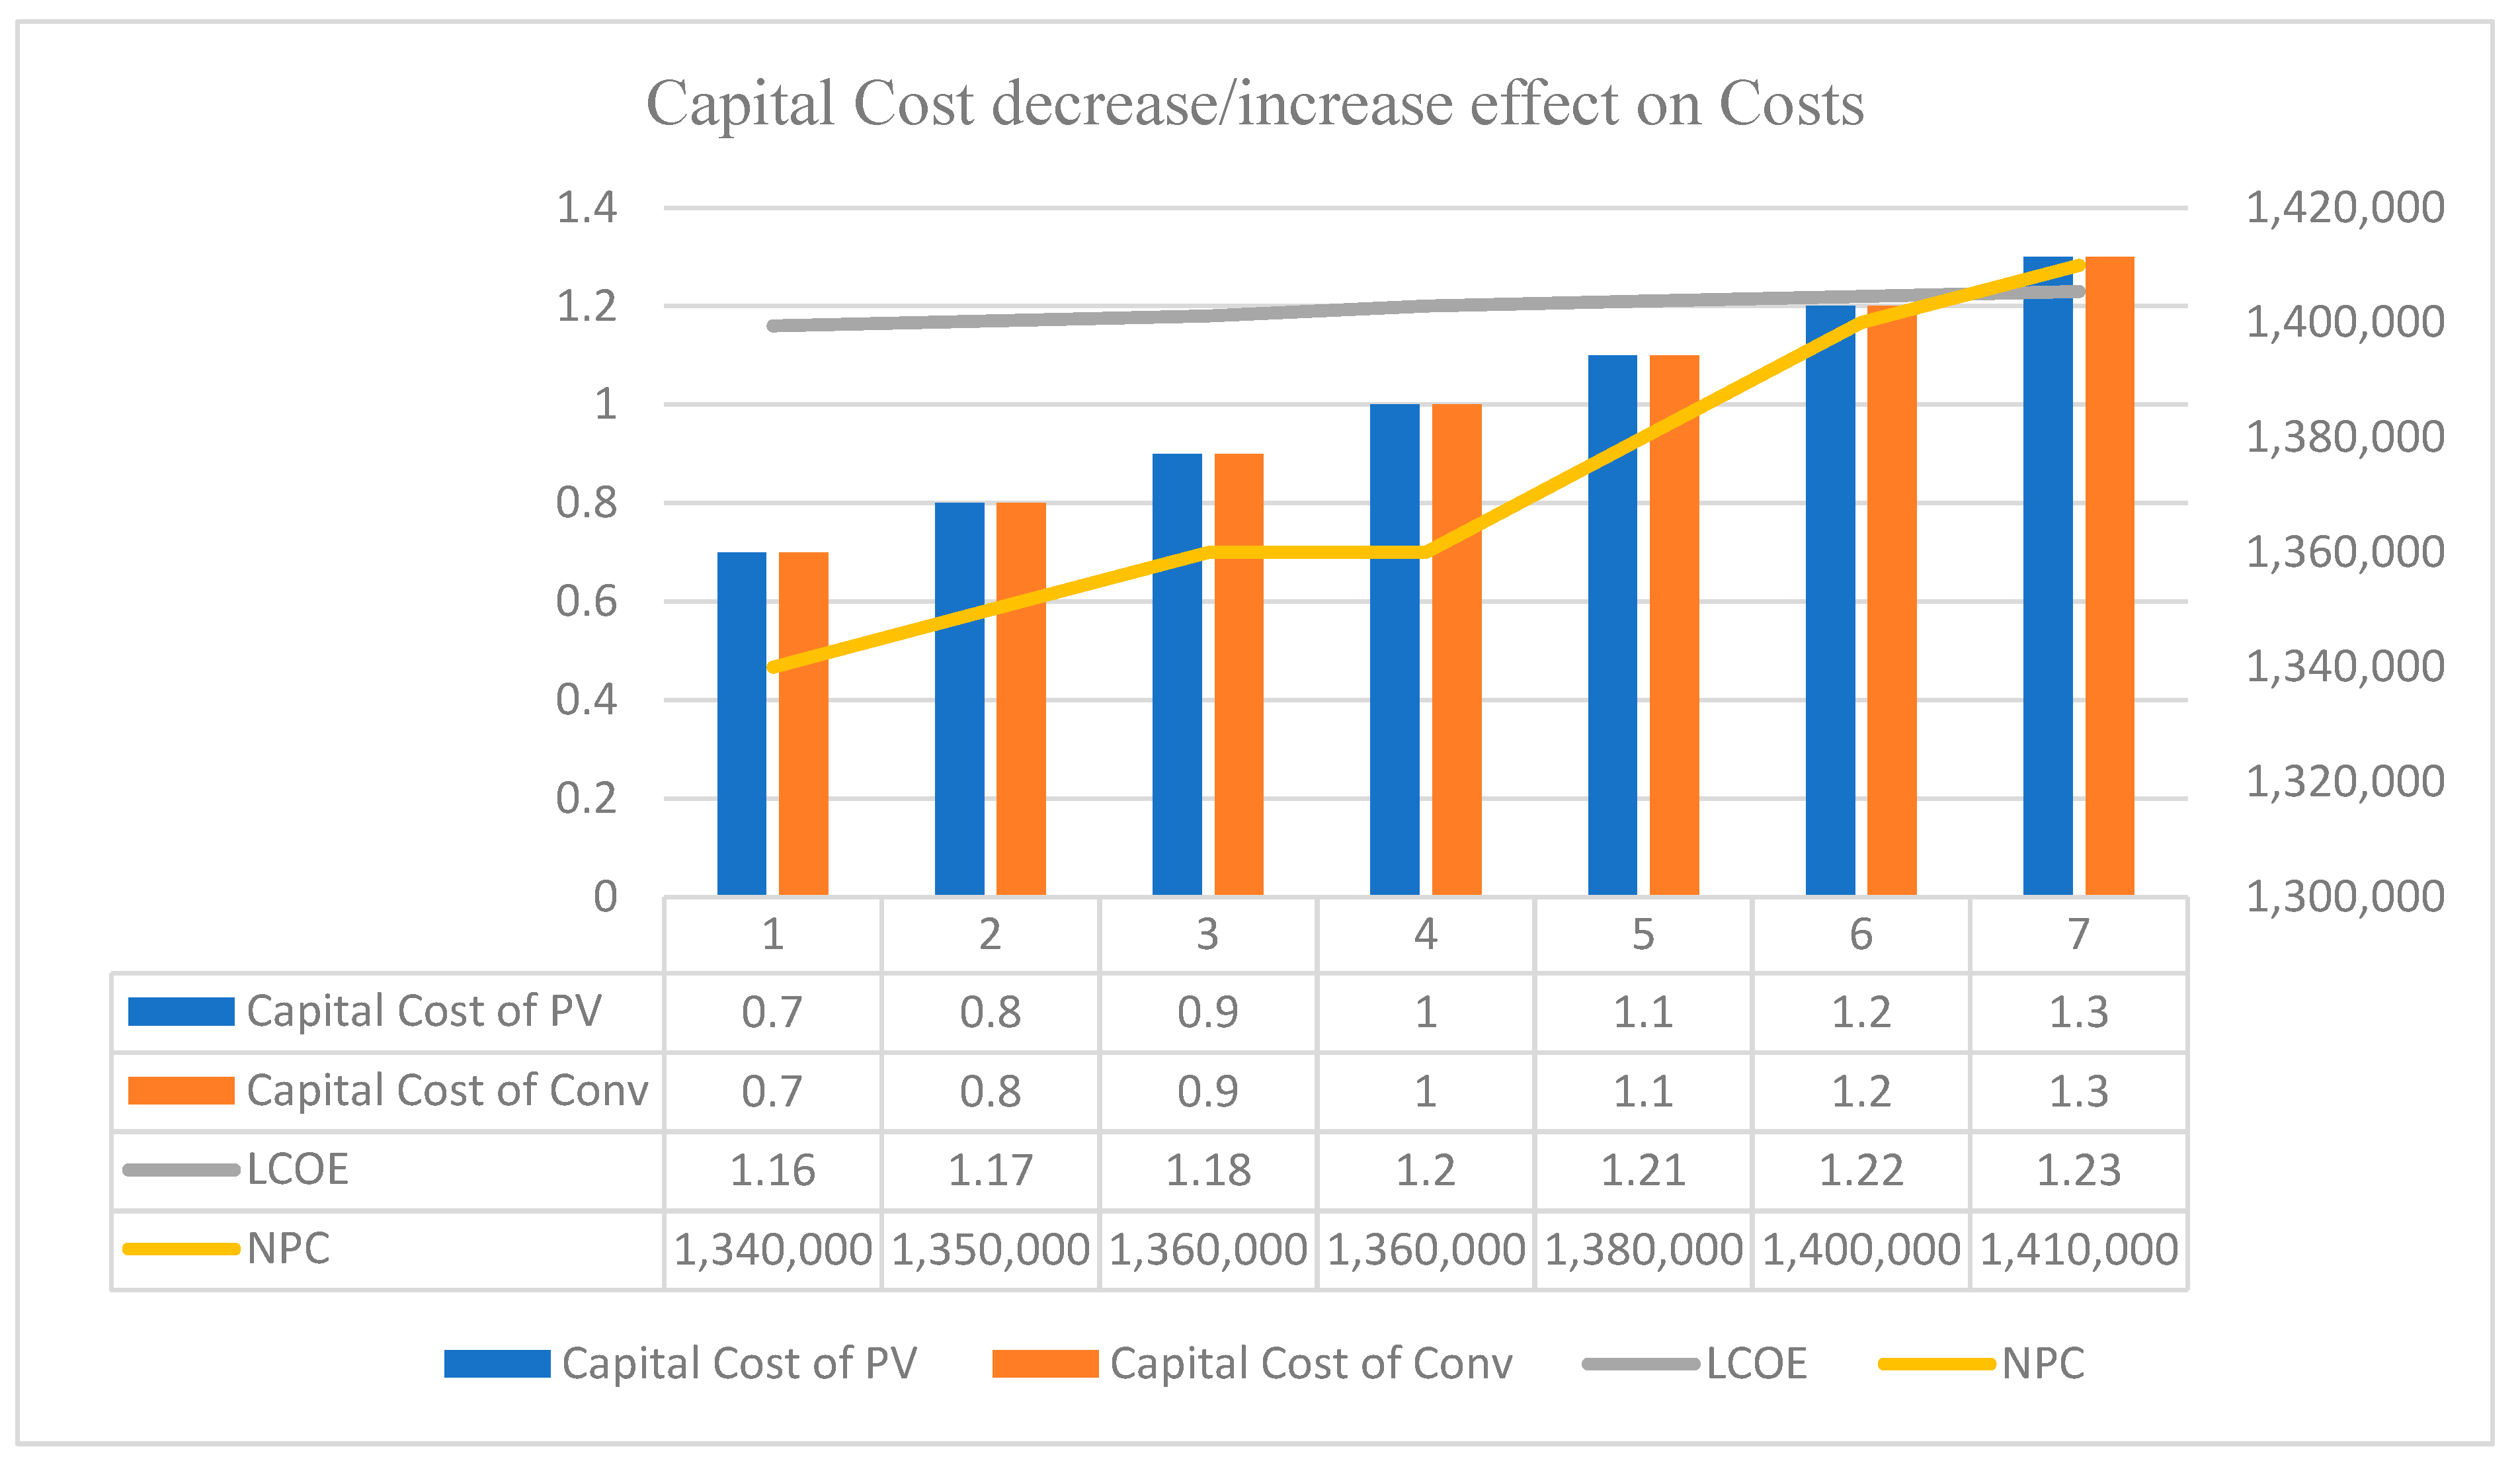
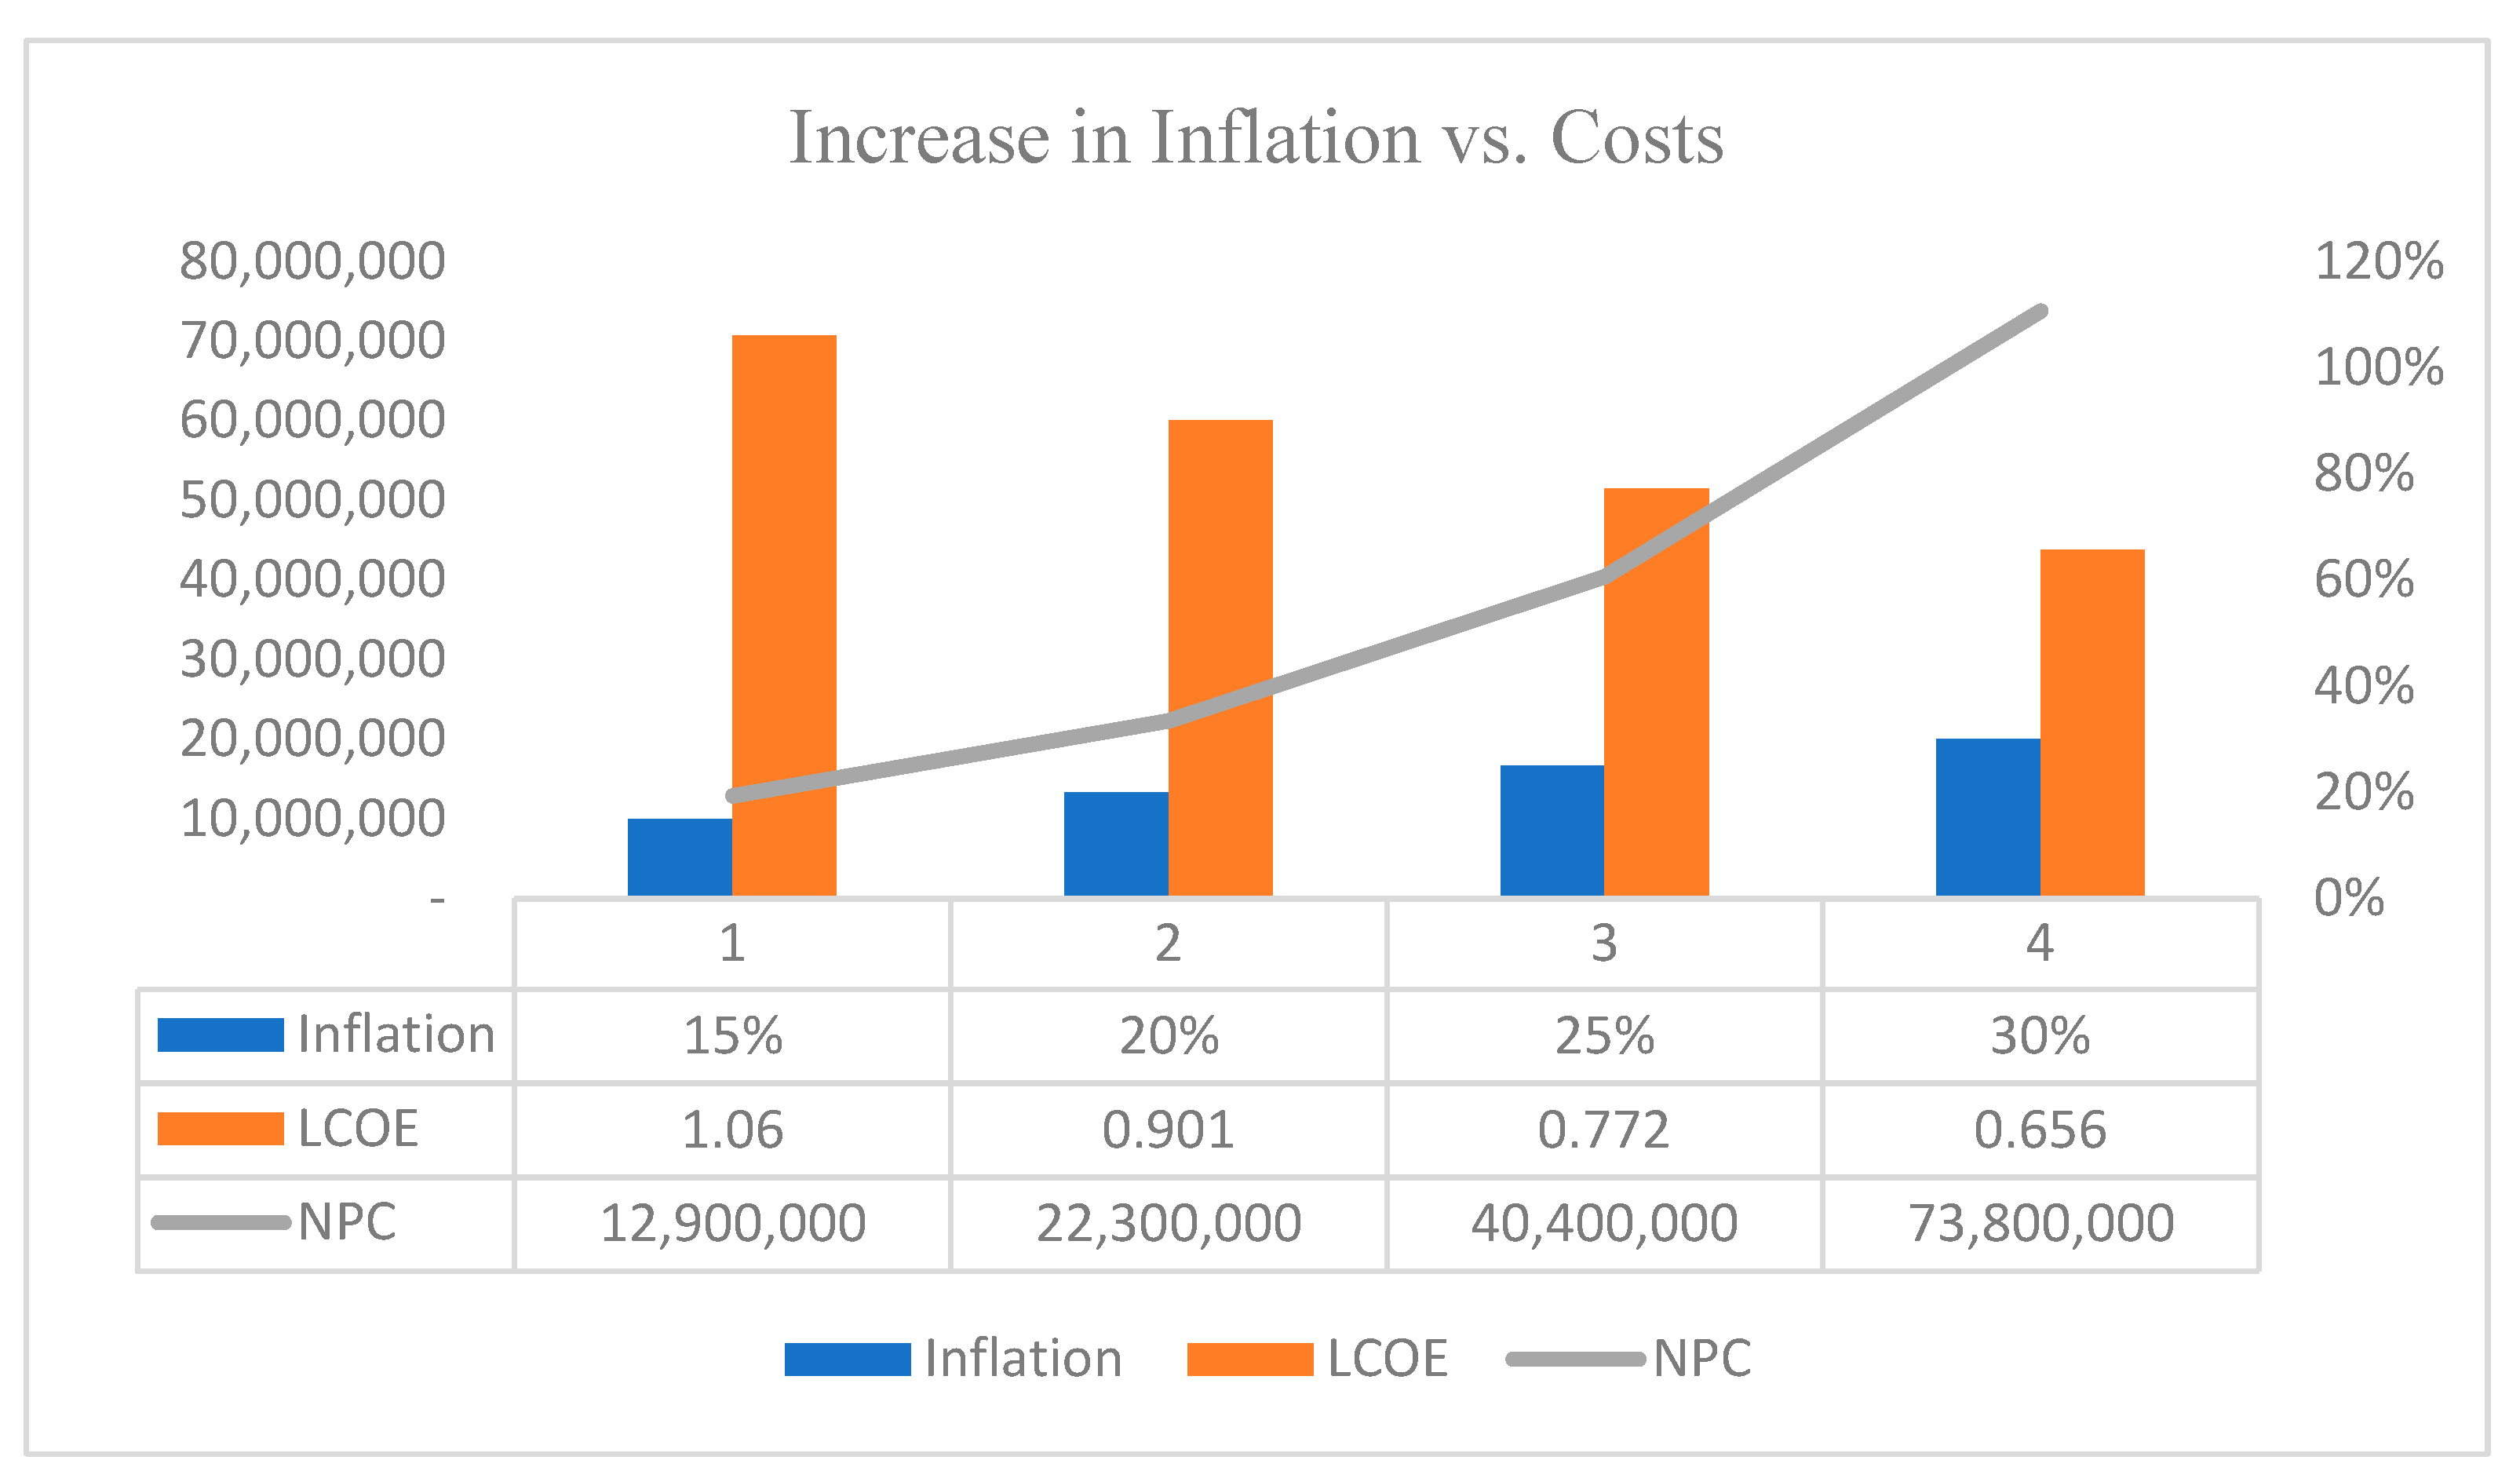
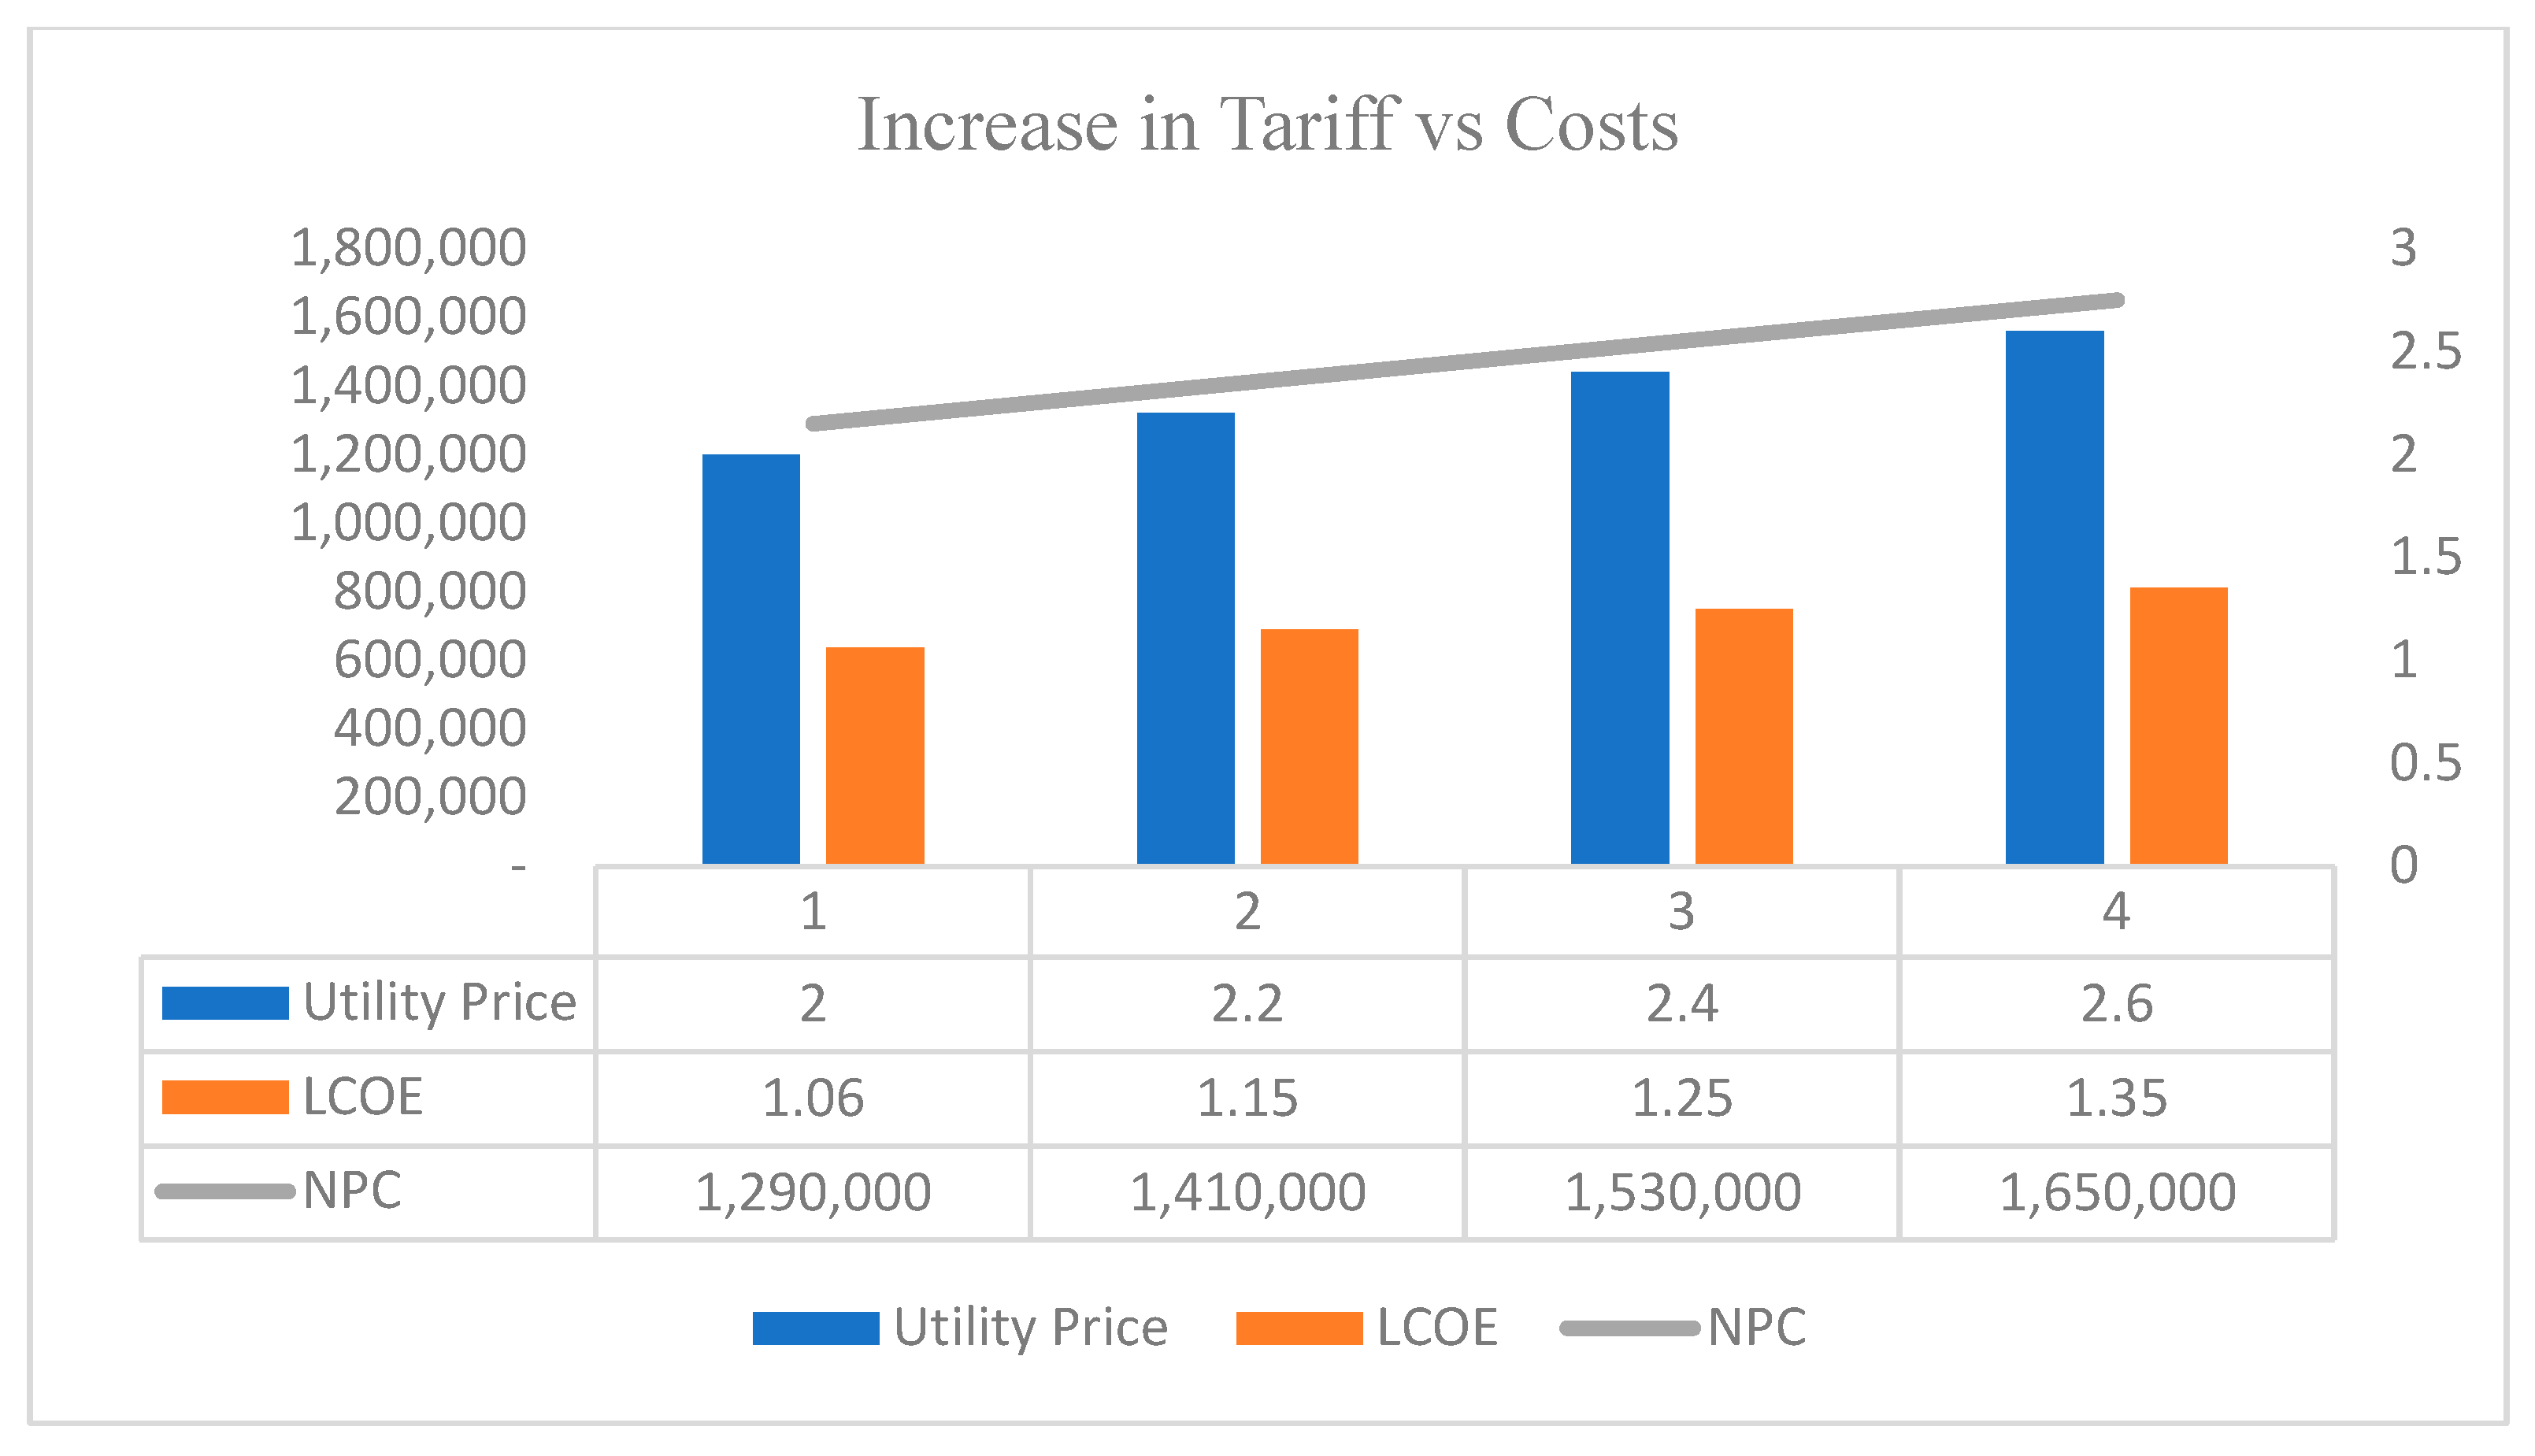
5.3. Sensitivity Analysis for Case3
6. Conclusions
Author Contributions
Funding
Data Availability Statement
Conflicts of Interest
References
- Lü, X.; Lu, T.; Karirinne, S.; Mäkiranta, A.; Clements-Croome, D. Renewable energy resources and multi-energy hybrid systems for urban buildings in Nordic climate. Energy Build. 2023, 282, 112789. [Google Scholar] [CrossRef]
- Colgan, J.D.; Hinthorn, M. International Energy Politics in an Age of Climate Change. Annu. Rev. Political Sci. 2023, 26, 79–96. [Google Scholar] [CrossRef]
- The Energy Institute (IN). Statistical Review of World Energy; Energy Institute: London, UK, 2023. [Google Scholar]
- National Energy Plan of Turkiye. 2022. Available online: https://enerji.gov.tr/Media/Dizin/EIGM/tr/Raporlar/TUEP/T%C3%BCrkiye_National_Energy_Plan.pdf (accessed on 11 November 2023).
- Turkish Statistical Institute. Motored Land Vehicle Statistics; Turkish Statistical Institute: Ankara, Türkiye, 2023. [Google Scholar]
- International Energy Agency (IEA). Turkey 2021; International Energy Agency (IEA): Paris, France, 2021; Available online: https://www.iea.org/reports/turkey-2021 (accessed on 11 November 2023).
- Ayan, O.; Turkay, B.E. Techno-Economic Comparative Analysis of Grid-connected and Islanded Hybrid Renewable Energy Systems in 7 Climate Regions, Turkey. IEEE Access 2023, 11, 48797–48825. [Google Scholar] [CrossRef]
- Qazi, A.; Hussain, F.; Rahim, N.A.; Hardaker, G.; Alghazzawi, D.; Shaban, K.; Haruna, K. Towards sustainable energy: A systematic review of renewable energy sources, technologies, and public opinions. IEEE Access 2019, 7, 63837–63851. [Google Scholar] [CrossRef]
- Huang, M.T.; Zhai, P.M. Achieving Paris Agreement temperature goals requires carbon neutrality by middle century with far-reaching transitions in the whole society. Adv. Clim. Change Res. 2021, 12, 281–286. [Google Scholar] [CrossRef]
- Calikoglu, U.; Koksal, M.A. A pathway to achieve the net zero emissions target for the public electricity and heat production sector: A case study for Türkiye. Energy Policy 2023, 179, 113653. [Google Scholar] [CrossRef]
- Turkish Statistical Institute. Survey on Building and Dwelling Characteristics; Turkish Statistical Institute: Ankara, Türkiye, 2021. [Google Scholar]
- Bihari, S.P.; Sadhu, P.K.; Sarita, K.; Khan, B.; Arya, L.D.; Saket, R.K.; Kothari, D.P. A comprehensive review of microgrid control mechanism and impact assessment for hybrid renewable energy integration. IEEE Access 2021, 9, 88942–88958. [Google Scholar] [CrossRef]
- Saib, S.; Gherbi, A. Simulation and control of hybrid renewable energy system connected to the grid. In Proceedings of the 2015 5th International Youth Conference on Energy (IYCE), Pisa, Italy, 27–30 May 2015; pp. 1–6. [Google Scholar]
- Gajewski, P.; Pieńkowski, K. Control of the hybrid renewable energy system with wind turbine, photovoltaic panels and battery energy storage. Energies 2021, 14, 1595. [Google Scholar] [CrossRef]
- Abdullah, M.A.; Agalgaonkar, A.P.; Muttaqi, K.M. Assessment of energy supply and continuity of service in distribution network with renewable distributed generation. Appl. Energy 2014, 113, 1015–1026. [Google Scholar] [CrossRef]
- Kumar, R.; Channi, H.K. A PV-Biomass off-grid hybrid renewable energy system (HRES) for rural electrification: Design, optimization and techno-economic-environmental analysis. J. Clean. Prod. 2022, 349, 131347. [Google Scholar] [CrossRef]
- Güğül, G.N. Optimum hybrid renewable energy system design for on and off grid buildings: Hotel, education and animal hospital building case. Sol. Energy 2023, 253, 414–427. [Google Scholar]
- Türkiye’s Official Gazette, 5 July 2022, Issue Number 31887.
- Kılıç, U.; Kekezoğlu, B. A review of solar photovoltaic incentives and Policy: Selected countries and Turkey. Ain Shams Eng. J. 2022, 13, 101669. [Google Scholar] [CrossRef]
- Türkiye’s Official Gazette, March 12, 2022, Issue Number 31776.
- Burmester, D.; Rayudu, R.; Seah, W.; Akinyele, D. A review of nanogrid topologies and technologies. Renew. Sustain. Energy Rev. 2017, 67, 760–775. [Google Scholar] [CrossRef]
- Ağbulut, Ü.; Yıldız, G.; Bakır, H.; Polat, F.; Biçen, Y.; Ergün, A.; Gürel, A.E. Current practices, potentials, challenges, future opportunities, environmental and economic assumptions for Türkiye’s clean and sustainable energy policy: A comprehensive assessment. Sustain. Energy Technol. Assess. 2023, 56, 103019. [Google Scholar] [CrossRef]
- Cai, C.; Yang, Y.; Jia, Y.; Wu, G.; Zhang, H.; Yuan, F.; Qian, Q. Aerodynamic load evaluation of leading edge and trailing edge windward states of large-scale wind turbine blade under parked condition. Appl. Energy 2023, 350, 121744. [Google Scholar] [CrossRef]
- International Renewable Energy Agency. Capacity and Generation—Technologies. 2023. Available online: https://www.irena.org/Data/View-data-by-topic/Capacity-and-Generation/Technologies (accessed on 20 September 2023).
- Esposito, L.; Romagnoli, G. Overview of policy and market dynamics for the deployment of renewable energy sources in Italy: Current status and future prospects. Heliyon 2023, 9, e17406. [Google Scholar] [CrossRef]
- Chai, S.; Liu, Q.; Yang, J. Renewable power generation policies in China: Policy instrument choices and influencing factors from the central and local government perspectives. Renew. Sustain. Energy Rev. 2023, 174, 113126. [Google Scholar] [CrossRef]
- IEA. An Energy Sector Roadmap to Carbon Neutrality in China; OECD Publishing: Paris, France, 2021. [Google Scholar] [CrossRef]
- Du, H.; Han, Q.; de Vries, B.; Sun, J. Community solar PV adoption in residential apartment buildings: A case study on influencing factors and incentive measures in Wuhan. Appl. Energy 2024, 354, 122163. [Google Scholar] [CrossRef]
- Yang, D.X.; Jing, Y.Q.; Wang, C.; Nie, P.Y.; Sun, P. Analysis of renewable energy subsidy in China under uncertainty: Feed-in tariff vs. renewable portfolio standard. Energy Strategy Rev. 2021, 34, 100628. [Google Scholar] [CrossRef]
- Li, H.X.; Moore, T.; Huang, J.; Zhang, P.; Costin, G. Towards zero carbon housing in Victoria, Australia: A policy and incentive framework. Energy Strategy Rev. 2022, 40, 100802. [Google Scholar] [CrossRef]
- Clean Energy Australia Report. 2023. Available online: https://assets.cleanenergycouncil.org.au/documents (accessed on 23 November 2023).
- Lemay, A.C.; Wagner, S.; Rand, B.P. Current status and future potential of rooftop solar adoption in the United States. Energy Policy 2023, 177, 113571. [Google Scholar] [CrossRef]
- Moradi, S.; Vahidinasab, V.; Zizzo, G. Optimal nanogrid planning at building level. Int. J. Electr. Power Energy Syst. 2023, 153, 109409. [Google Scholar] [CrossRef]
- Nordman, B.; Christensen, K. Local power distribution with nanogrids. In Proceedings of the 2013 International Green Computing Conference Proceedings, Arlington, VA, USA, 27–29 June 2013; pp. 1–8. [Google Scholar]
- Kiliç, M.Y.; Adali, S. Bir Apartmanın Yenilenebilir Enerji Sistem Maliyetinin HOMER Pro Kullanılarak Belirlenmesi. Bitlis Eren Üniversitesi Fen Bilim. Derg. 2022, 11, 13–20. [Google Scholar] [CrossRef]
- Yılmaz, G.; Şahin, M.; Akyazı, Ö.; Öztürk, B. Şebeke Bağlantılı Hibrit Yenilenebilir Enerji Sisteminin Homer ile Ekonomik ve Çevresel Analizi: İzmir Endüstriyel Bölgesi Örneği. Karadeniz Fen Bilim. Derg. 2023, 13, 1090–1106. [Google Scholar] [CrossRef]
- Öztürk, Z.; Tosun, S.; Öztürk, A. Örnek Bir Hibrit Yenilebilir Enerji Sisteminin HOMER ile Modellenmesi, Ekonomik ve Teknik Yönden Analizleri. Bayburt Üniversitesi Fen Bilim. Derg. 2019, 1, 286–299. [Google Scholar]
- Güven, A.F.; Poyraz, E. Feasibility Study and Techno-Economic Analysis of Stand-Alone Hybrid Energy System for Muğla Province Köyceğiz. Karadeniz Fen Bilim. Derg. 2021, 11, 70–85. [Google Scholar] [CrossRef]
- Türkdoğan, S.; Mercan, M.T.; Çatal, T. Şebekeden bağımsız hibrit enerji sistemleri kullanılarak 40 hanelik bir topluluğun elektrik ve termal yük ihtiyacının karşılanması: Teknik ve ekonomik analizleri. Avrupa Bilim Teknol. Derg. 2020, 18, 476–485. [Google Scholar]
- Kiliç, M.Y.; Adali, S.; Aydin, M. Elektrik İhtiyacinin Sağlanmasinda Hibrit Yenilenebilir Enerji Sistem Tasarimi: Bursa Tekstil Fabrikasi Örneği. Uludağ Üniversitesi Mühendislik Fakültesi Derg. 2022, 27, 897–910. [Google Scholar]
- Mustafa, E.K.E.N.; Çelik, İ. An investigation of optimal power system designs for a net zero energy house: A case study of Kahramanmaras. Bitlis Eren Üniversitesi Fen Bilim. Derg. 2022, 11, 971–982. [Google Scholar]
- Adali, S.; Kiliç, M.Y. Evsel elektrik ihtiyacının hibrit yenilenebilir enerji sistemleriyle karşılanması: Bursa örneği. Niğde Ömer Halisdemir Üniversitesi Mühendislik Bilim. Derg. 2021, 10, 520–526. [Google Scholar] [CrossRef]
- Tabak, A. Konya İlinde Bir Fabrikanın Enerji Talebinin Karşılanması için Hibrit Enerji Üretim Sisteminin Analiz ve Tasarımı. Int. J. Eng. Res. Dev. 2021, 13, 220–230. [Google Scholar]
- Adan, H.K.; Filik, Ü.B. Technical and economic evaluation of a standalone and on grid hybrid renewable energy: A case study at Eskïşehïr Technical University. Sigma J. Eng. Nat. Sci. 2021, 39, 184–194. [Google Scholar] [CrossRef]
- Mamur, H.; Yakar, M.C.; Zerafet, A. Bir Kamu Binası İçin Hibrit Enerji Sistemi Fizibilitesi. Uluslararası Teknol. Bilim. Derg. 2019, 11, 51–58. [Google Scholar]
- Akan, A.E.; Akan, A.P. Meeting of Energy Demand for Irrigation of Off-Grid Agricultural Land by Solar-Wind Energy System with Battery Storage. Avrupa Bilim Teknol. Derg. 2021, 28, 806–810. [Google Scholar] [CrossRef]
- Channi, H.K. Optimal designing of PV-diesel generator-based system using HOMER software. Mater. Today Proc. 2023. [Google Scholar] [CrossRef]
- Nallolla, C.A.; Perumal, V. Optimal Design of a Hybrid Off-Grid Renewable Energy System Using Techno-Economic and Sensitivity Analysis for a Rural Remote Location. Sustainability 2022, 14, 15393. [Google Scholar] [CrossRef]
- Li, C. Technical and economic potential evaluation of an off-grid hybrid wind-fuel cell-battery energy system in Xining, China. Int. J. Green Energy 2021, 18, 258–270. [Google Scholar] [CrossRef]
- Hassan, Q.; Jaszczur, M.; Hafedh, S.A.; Abbas, M.K.; Abdulateef, A.M.; Hasan, A.; Abdulateef, J.; Mohamad, A. Optimizing a microgrid photovoltaic-fuel cell energy system at the highest renewable fraction. Int. J. Hydrog. Energy 2022, 47, 13710–13731. [Google Scholar] [CrossRef]
- Miao, C.; Teng, K.; Wang, Y.; Jiang, L. Technoeconomic analysis on a hybrid power system for the UK household using renewable energy: A case study. Energies 2020, 13, 3231. [Google Scholar] [CrossRef]
- Alluraiah, N.C.; Vijayapriya, P. Optimization, design and feasibility analysis of a grid-integrated hybrid AC/DC microgrid system for rural electrification. IEEE Access 2023, 11, 67013–67029. [Google Scholar] [CrossRef]
- Zegueur, A.; Sebbagh, T.; Metatla, A. A Techno-Economic Study of a Hybrid PV–Wind–Diesel Standalone Power System for a Rural Telecommunication Station in Northeast Algeria. Eng. Proc. 2023, 56, 25. [Google Scholar]
- Guelleh, H.O.; Patel, D.R.; Kara-Zaitri, C.; Mujtaba, I.M. Grid connected hybrid renewable energy systems for urban households in Djibouti: An economic evaluation. South Afr. J. Chem. Eng. 2023, 43, 215–231. [Google Scholar] [CrossRef]
- Al-Badi, A.; Al Wahaibi, A.; Ahshan, R.; Malik, A. Techno-economic feasibility of a solar-wind-fuel cell energy system in Duqm, Oman. Energies 2022, 15, 5379. [Google Scholar] [CrossRef]
- Khosravani, A.; Safaei, E.; Reynolds, M.; Kelly, K.E.; Powell, K.M. Challenges of reaching high renewable fractions in hybrid renewable energy systems. Energy Rep. 2023, 9, 1000–1017. [Google Scholar] [CrossRef]
- Pamuk, N. Techno-economic feasibility analysis of grid configuration sizing for hybrid renewable energy system in Turkey using different optimization techniques. Ain Shams Eng. J. 2023, 15, 102474. [Google Scholar] [CrossRef]
- Niringiyimana, E.; Wanquan, S.; Dushimimana, G.; baptiste Niyigena, J. Hybrid Renewable Energy System Design and Optimization for Developing Countries Using HOMER Pro: Case of Rwanda. In Proceedings of the 2023 7th International Conference on Green Energy and Applications (ICGEA), Singapore, 10–12 March 2023; pp. 72–76. [Google Scholar]
- Alhawsawi, E.Y.; Habbi, H.M.D.; Hawsawi, M.; Zohdy, M.A. Optimal Design and Operation of Hybrid Renewable Energy Systems for Oakland University. Energies 2023, 16, 5830. [Google Scholar] [CrossRef]
- Baruah, A.; Basu, M. Modelling of an off-grid roof-top residential photovoltaic nano grid system for an urban locality in India. Energy Sustain. Dev. 2023, 74, 471–498. [Google Scholar] [CrossRef]
- Pürlü, M.; Özkan, U. Economic and Environmental Analysis of Grid-Connected Rooftop Photovoltaic System Using HOMER. Turk. J. Electr. Power Energy Syst. 2023, 3, 39–46. [Google Scholar]
- Alqahtani, N.; Balta-Ozkan, N. Assessment of rooftop solar power generation to meet residential loads in the city of neom, Saudi Arabia. Energies 2021, 14, 3805. [Google Scholar] [CrossRef]
- Abdelhady, S. Techno-economic study and the optimal hybrid renewable energy system design for a hotel building with net zero energy and net zero carbon emissions. Energy Convers. Manag. 2023, 289, 117195. [Google Scholar] [CrossRef]
- Riayatsyah, T.M.I.; Geumpana, T.A.; Fattah, I.R.; Rizal, S.; Mahlia, T.I. Techno-Economic Analysis and Optimisation of Campus Grid-Connected Hybrid Renewable Energy System Using HOMER Grid. Sustainability 2022, 14, 7735. [Google Scholar] [CrossRef]
- Jin, H.; Lee, S.; Nengroo, S.H.; Ahn, G.; Chang, Y.J.; Har, D. P2P Power Trading of Nanogrids for Power Management in Consideration of Battery Lifetime of ESS. Energy Build. 2023, 297, 113290. [Google Scholar] [CrossRef]
- Yoomak, S.; Ngaopitakkul, A. Development of sustainable nanogrid road lighting systems. IEEE Trans. Intell. Transp. Syst. 2020, 22, 6682–6699. [Google Scholar] [CrossRef]
- Dawoud, S.M. Techno-economic and sensitivity analysis of hybrid electric sources on off-shore oil facilities. Energy 2021, 227, 120391. [Google Scholar] [CrossRef]
- Kushwaha, P.K.; Bhattacharjee, C. Integrated techno-economic-enviro-socio design of the hybrid renewable energy system with suitable dispatch strategy for domestic and telecommunication load across India. J. Energy Storage 2022, 55, 105340. [Google Scholar] [CrossRef]
- He, B.; Ismail, N.; Leng, K.K.K.; Chen, G. Techno-economic analysis of an HRES with fuel cells, solar panels, and wind turbines using an improved Al-Biruni algorithm. Heliyon 2023, 9, e22828. [Google Scholar] [CrossRef]
- Bahramara, S.; Moghaddam, M.P.; Haghifam, M.R. Optimal planning of hybrid renewable energy systems using HOMER: A review. Renew. Sustain. Energy Rev. 2016, 62, 609–620. [Google Scholar] [CrossRef]
- Rice, I.K.; Zhu, H.; Zhang, C.; Tapa, A.R. A Hybrid Photovoltaic/Diesel System for Off-Grid Applications in Lubumbashi, DR Congo: A HOMER Pro Modeling and Optimization Study. Sustainability 2023, 15, 8162. [Google Scholar] [CrossRef]
- Shirzadi, N.; Nasiri, F.; Eicker, U. Optimal configuration and sizing of an integrated renewable energy system for isolated and grid-connected microgrids: The case of an Urban University Campus. Energies 2020, 13, 3527. [Google Scholar] [CrossRef]
- Deshmukh, M.K.; Singh, A.B. Modeling of energy performance of stand-alone SPV system using HOMER pro. Energy Procedia 2019, 156, 90–94. [Google Scholar] [CrossRef]
- Murty, V.V.; Kumar, A. Optimal energy management and techno-economic analysis in microgrid with hybrid renewable energy sources. J. Mod. Power Syst. Clean Energy 2020, 8, 929–940. [Google Scholar] [CrossRef]
- Akgul, B.A.; Ozyazici, M.S.; Hasoglu, M.F. Estimation of optimal tilt angles and solar radiation collected by fixed and tracking solar panels for the Mediterranean region, Turkey. Indian J. Phys. 2023, 1–14. [Google Scholar] [CrossRef]
- Available online: https://gepa.enerji.gov.tr/MyCalculator/pages/34.aspx (accessed on 20 September 2023).
- El Hammoumi, A.; Chtita, S.; Motahhir, S.; El Ghzizal, A. Solar PV energy: From material to use, and the most commonly used techniques to maximize the power output of PV systems: A focus on solar trackers and floating solar panels. Energy Rep. 2022, 8, 11992–12010. [Google Scholar] [CrossRef]
- Turkdogan, S. Design and optimization of a solely renewable based hybrid energy system for residential electrical load and fuel cell electric vehicle. Eng. Sci. Technol. Int. J. 2021, 24, 397–404. [Google Scholar] [CrossRef]
- IEA. Renewable Energy Market Update—June 2023; IEA: Paris, France, 2023; Available online: https://www.iea.org/reports/renewable-energy-market-update-june-2023 (accessed on 11 November 2023).
- Habib, H.U.R.; Wang, S.; Elkadeem, M.R.; Elmorshedy, M.F. Design optimization and model predictive control of a standalone hybrid renewable energy system: A case study on a small residential load in Pakistan. IEEE Access 2019, 7, 117369–117390. [Google Scholar] [CrossRef]
- Singh, R.; Bansal, R.C. Optimization of an autonomous hybrid renewable energy system using reformed electric system cascade analysis. IEEE Trans. Ind. Inform. 2018, 15, 399–409. [Google Scholar] [CrossRef]
- Hossain, M.S.; Jahid, A.; Islam, K.Z.; Alsharif, M.H.; Rahman, K.M.; Rahman, M.F.; Hossain, M.F. Towards energy efficient load balancing for sustainable green wireless networks under optimal power supply. IEEE Access 2020, 8, 200635–200654. [Google Scholar] [CrossRef]
- Available online: https://www.homerenergy.com/products/pro/docs/3.11/net_present_cost.html (accessed on 11 November 2023).
- Zhang, Y.; Yan, S.; Yin, W.; Wu, C.; Ye, J.; Wu, Y.; Liu, L. HOMER-Based Multi-Scenario Collaborative Planning for Grid-Connected PV-Storage Microgrids with Electric Vehicles. Processes 2023, 11, 2408. [Google Scholar] [CrossRef]
- Oladigbolu, J.O.; Ramli, M.A.; Al-Turki, Y.A. Feasibility study and comparative analysis of hybrid renewable power system for off-grid rural electrification in a typical remote village located in Nigeria. IEEE Access 2020, 8, 171643–171663. [Google Scholar] [CrossRef]
- Iqbal, S.; Jan, M.U.; Rehman, A.U.; Shafiq, A.; Rehman, H.U.; Aurangzeb, M. Feasibility study and deployment of solar photovoltaic system to enhance energy economics of King Abdullah Campus, University of Azad Jammu and Kashmir Muzaffarabad, AJK Pakistan. IEEE Access 2022, 10, 5440–5455. [Google Scholar] [CrossRef]
- Available online: https://www.energy.gov/sites/prod/files/2015/08/f25/ (accessed on 20 September 2023).
- Available online: https://www.tcmb.gov.tr/wps/wcm/connect/EN/TCMB+EN/Main+Menu/Statistics/Inflation+Data/Consumer+Prices (accessed on 20 September 2023).
- Available online: https://support.ul-renewables.com/homer-manual-grid/optimization_settings.html (accessed on 20 September 2023).
- Li, C.; Zhou, D.; Zheng, Y. Techno-economic comparative study of grid-connected PV power systems in five climate zones, China. Energy 2018, 165, 1352–1369. [Google Scholar] [CrossRef]
- Vishnupriyan, J.; Manoharan, P.S. Prospects of hybrid photovoltaic–diesel standalone system for six different climate locations in Indian state of Tamil Nadu. J. Clean. Prod. 2018, 185, 309–321. [Google Scholar] [CrossRef]
- Choi, H.J.; Han, G.D.; Min, J.Y.; Bae, K.; Shim, J.H. Economic feasibility of a PV system for grid-connected semiconductor facilities in South Korea. Int. J. Precis. Eng. Manuf. 2013, 14, 2033–2041. [Google Scholar] [CrossRef]
- Al-Karaghouli, A.; Kazmerski, L.L. Optimization and life-cycle cost of health clinic PV system for a rural area in southern Iraq using HOMER software. Sol. Energy 2010, 84, 710–714. [Google Scholar] [CrossRef]


| References | Year | Mode | Composition | Load | Load Demand (kWh/Year) | NPC (USD) | COE (USD/kWh) | Sensitivity Analysis |
|---|---|---|---|---|---|---|---|---|
| [35] | 2022 | On grid | PV–GRID | Apartment Building | 6546 | 5974 | 0.034 | No |
| [36] | 2023 | On grid | PV–WT–BESS–GRID | Industry Area | 8,760,000 | 9.46 M | 0.073 | No |
| [37] | 2019 | On grid | PV–WT–DG–BESS–GRID | Industry Area | 8,773,505 | 135 M | 0.119 | No |
| [38] | 2021 | Off grid | PV–WT–BESS | Household District | 54,750,000 | 176 M | 0.182 | Yes |
| [39] | 2020 | Off grid | PV–WT–DG–BESS | Household District | 116,800 (electric) | 598,958 | 0.164 | Yes |
| 52,001 (thermal) | ||||||||
| [40] | 2022 | Off grid | PV–BESS | A Textile Factory | 25,721,412 | 151.654 M | 0.012 | No |
| [41] | 2022 | Off grid | PV–WT–DG–BESS | A Vineyard | 3832.5 | 12,458 | 0.264 | No |
| [42] | 2021 | On grid | PV–GRID | Family House | 1,514,591 | 1367 | 0.058 | No |
| Off grid | PV–DG–BESS | 9159 | 0.438 | |||||
| [43] | 2021 | On grid | PV–DG–BESS–GRID | A Factory | 365,000 | 7.81 M | 0.0457 | Yes |
| [44] | 2021 | On grid | PV–GRID | A University Building | 730,000 | 1.68 M | 0.176 | Yes |
| Off grid | PV–WT–DG–BESS | 4.29 M | 0.455 | |||||
| [45] | 2019 | On grid | PV–WT–BESS–GRID | A High School | 44,453 | 42,837 | - | No |
| [46] | 2021 | Off grid | PV–WT–BESS | Irrigation | 27,466 | 99,768 | 0.172 | No |
| [47] | 2023 | Off grid | PV–DG | Rural House | 2920 | 16,157 | 0.4280 | No |
| [48] | 2022 | Off grid | PV–HFC–BESS | Rural Communities | 257,284.85 | 7.01 M | 0.244 | Yes |
| [49] | 2020 | Off grid | WT–FC–BESS | Residential House | 3650 | 59,611 | 1.278 | No |
| [50] | 2022 | On grid | PV–FC–GRID | Family House | 3759.5 | 10,166 | 0.23 | No |
| [51] | 2020 | On grid | WT–BG–BESS | Family House | 1679 | 14,507 | 0.588 | No |
| [52] | 2023 | On grid | PV–WT–GRID | Rural Load | 253,440 | 6.92 M | 0.0715 | No |
| [53] | 2023 | Off grid | PV–WT–DG–BESS | Telecom Station | 31,025 | 85,673 | 0.214 | No |
| [54] | 2023 | On grid | PV–WT–GRID | Urban House | 15,695 | 36,457 | 0.153 | No |
| [55] | 2022 | Off grid | PV–WT–FC PV–WT–BESS PV–WT–FC–BESS | A port Town | 301,876 (GWh) | 2.1 B 1.3 B 1.5 B | 0.436 0.273 0.322 | No |
| Component | Device Piece | Power Consumption (W) | Used Time (h) | Daily Average Usage for a Single House (W/s) | Daily Total Usage for Building (kW/Day) |
|---|---|---|---|---|---|
| Lightning Fixture | 5 | 15 | 1.5 | 112.5 | 0.5625 |
| Lightning Fixture | 2 | 20 | 2 | 80 | 0.4 |
| TV | 1 | 160 | 3 | 480 | 2.4 |
| Owen | 1 | 2200 | 0.5 | 1100 | 5.5 |
| Air Conditioner | 1 | 1400 | 1.2 | 1680 | 8.4 |
| Washing Machine | 1 | 840 | 1.5 | 1260 | 6.3 |
| Dryer | 1 | 1800 | 1 | 1800 | 9 |
| Vacuum Cleaner | 1 | 600 | 0.5 | 300 | 1.5 |
| Refrigerator | 1 | 150 | 24 | 3600 | 18 |
| Cattle | 1 | 1600 | 0.5 | 800 | 4 |
| Dishwasher | 1 | 1200 | 1 | 1200 | 6 |
| Small powered devices | 2 | 30 | 3 | 180 | 0.9 |
| EV Charging Socket | 1 | 7000 | 4 | 1 | 28 |
| Component | Piece | Power Consumption (W) | Used Time (h) | Daily Average Usage for Single House (W/s) | Daily Total Usage for Housing Estate (kW/day) |
|---|---|---|---|---|---|
| Environmental Lighting | 50 | 20 | 8 | 8000 | 8 |
| Cameras | 25 | 15 | 24 | 9000 | 9 |
| Elevators | 3 | 6200 | 4 | 74,400 | 74.4 |
| Irrigation | 8 | 600 | 1 | 4800 | 4.8 |
| Car-Park Lighting | 180 | 20 | 4 | 14,400 | 14.4 |
| General Dwelling Floor | 1 | 780 | 8 | 6240 | 6.24 |
| Sports Center General | 1 | 3000 | 12 | 36,000 | 36 |
| Swimming Pool | 1 | 1100 | 6 | 6600 | 6.6 |
| EV Charging Area | 8 | 7000 | 6 | 336,000 | 336 |
| Barriers | 3 | 120 | 1 | 360 | 0.36 |
| Scenario | Architecture | Costs | Systems | Payback | Emission | |||||||
|---|---|---|---|---|---|---|---|---|---|---|---|---|
| PV | BESS | WT | CONV | NPC M | LCOE TL | OC year TL | Ren. Fr. % | IRR % | ROI % | Discounted Payback Year | CO2 Kg/Year | |
| Base Case | - | - | - | - | 1.73 | 2 | 32,424 | 0 | - | - | - | 10,246 |
| NG1-CASE1 | 7 | - | - | 4.5 | 1.36 | 1.2 | 24,656 | 38.6 | 3.8 | 2.3 | 10.71 | 8863 |
| NG1-CASE2 | 7 | 1 | - | 4.88 | 1.38 | 1.22 | 24,772 | 39 | 4.2 | 2.5 | 11.55 | 8700 |
| NG1-CASE3 | 7 | 1 | 1 | 4.57 | 1.54 | 1.25 | 25,453 | 49 | 2.3 | 1.2 | 12.02 | 8055 |
| NG1-CASE4 | 7 | - | 1 | 4.5 | 1.49 | 1.2 | 24,907 | 48.4 | 2.3 | 1.3 | 12.09 | 8055 |
| Scenario | Architecture | Costs | Systems | Payback | Emission | |||||||
|---|---|---|---|---|---|---|---|---|---|---|---|---|
| PV | BESS | WT | CONV | NPC M | LCOE TL | OC Year TL | Ren. Fr.% | IRR % | ROI % | Year | CO2 Kg/Year | |
| Base Case | - | - | - | - | 17.6 | 2 | 362,048 | 0 | - | - | - | 114,407 |
| NG2-CASE1 | 90 | - | - | 51.8 | 13.5 | 1.15 | 248,678 | 44.2 | 5.6 | 3.5 | 8.94 | 85,308 |
| NG2-CASE2 | 90 | 16 | - | 51.8 | 14.1 | 1.22 | 255,780 | 44.8 | 5.6 | 3.5 | 8.65 | 82,818 |
| NG2-CASE3 | 90 | - | 6 | 52.6 | 12.9 | 1.06 | 220,972 | 51 | 3.5 | 2.1 | 12.17 | 77,878 |
| NG2-CASE4 | 90 | 16 | 6 | 52.1 | 13.6 | 1.14 | 230,596 | 51.7 | 3.4 | 2 | 13.11 | 75,180 |
Disclaimer/Publisher’s Note: The statements, opinions and data contained in all publications are solely those of the individual author(s) and contributor(s) and not of MDPI and/or the editor(s). MDPI and/or the editor(s) disclaim responsibility for any injury to people or property resulting from any ideas, methods, instructions or products referred to in the content. |
© 2023 by the authors. Licensee MDPI, Basel, Switzerland. This article is an open access article distributed under the terms and conditions of the Creative Commons Attribution (CC BY) license (https://creativecommons.org/licenses/by/4.0/).
Share and Cite
Turan, O.; Durusu, A.; Yumurtaci, R. Driving Urban Energy Sustainability: A Techno-Economic Perspective on Nanogrid Solutions. Energies 2023, 16, 8084. https://doi.org/10.3390/en16248084
Turan O, Durusu A, Yumurtaci R. Driving Urban Energy Sustainability: A Techno-Economic Perspective on Nanogrid Solutions. Energies. 2023; 16(24):8084. https://doi.org/10.3390/en16248084
Chicago/Turabian StyleTuran, Onur, Ali Durusu, and Recep Yumurtaci. 2023. "Driving Urban Energy Sustainability: A Techno-Economic Perspective on Nanogrid Solutions" Energies 16, no. 24: 8084. https://doi.org/10.3390/en16248084
APA StyleTuran, O., Durusu, A., & Yumurtaci, R. (2023). Driving Urban Energy Sustainability: A Techno-Economic Perspective on Nanogrid Solutions. Energies, 16(24), 8084. https://doi.org/10.3390/en16248084