2.1. Measurement of DC Content in Transmission Lines
In this study, direct current component testing was conducted on selected grid integration points in the 10 kV distribution network system in Shenzhen area of the China Southern Power Grid, including industrial parks, residential areas, and dedicated transformer users. A total of 408 data samples was collected. The distribution of DC content at the testing points is shown in
Table 1. Some of the testing points with a high DC content are presented in
Table 2.
In the table, DC content was calculated by the ratio of the effective values of the DC component to the effective values of the AC component.
Both indicators are used to illustrate the distribution of DC bias content in the 10 kV distribution system in the South China Grid region. “Number” represents the number of sampling points that meet the corresponding DC bias content, and “Percentage/%” represents the proportion of the DC bias content among all sampling points.
It was observed that approximately 85.05% of the lines have a DC content exceeding 1%, and around 17.16% have a DC content exceeding 3%. This highlights the importance of addressing DC content in modern power systems.
2.2. Analysis of Transmission Characteristics of Current Transformers
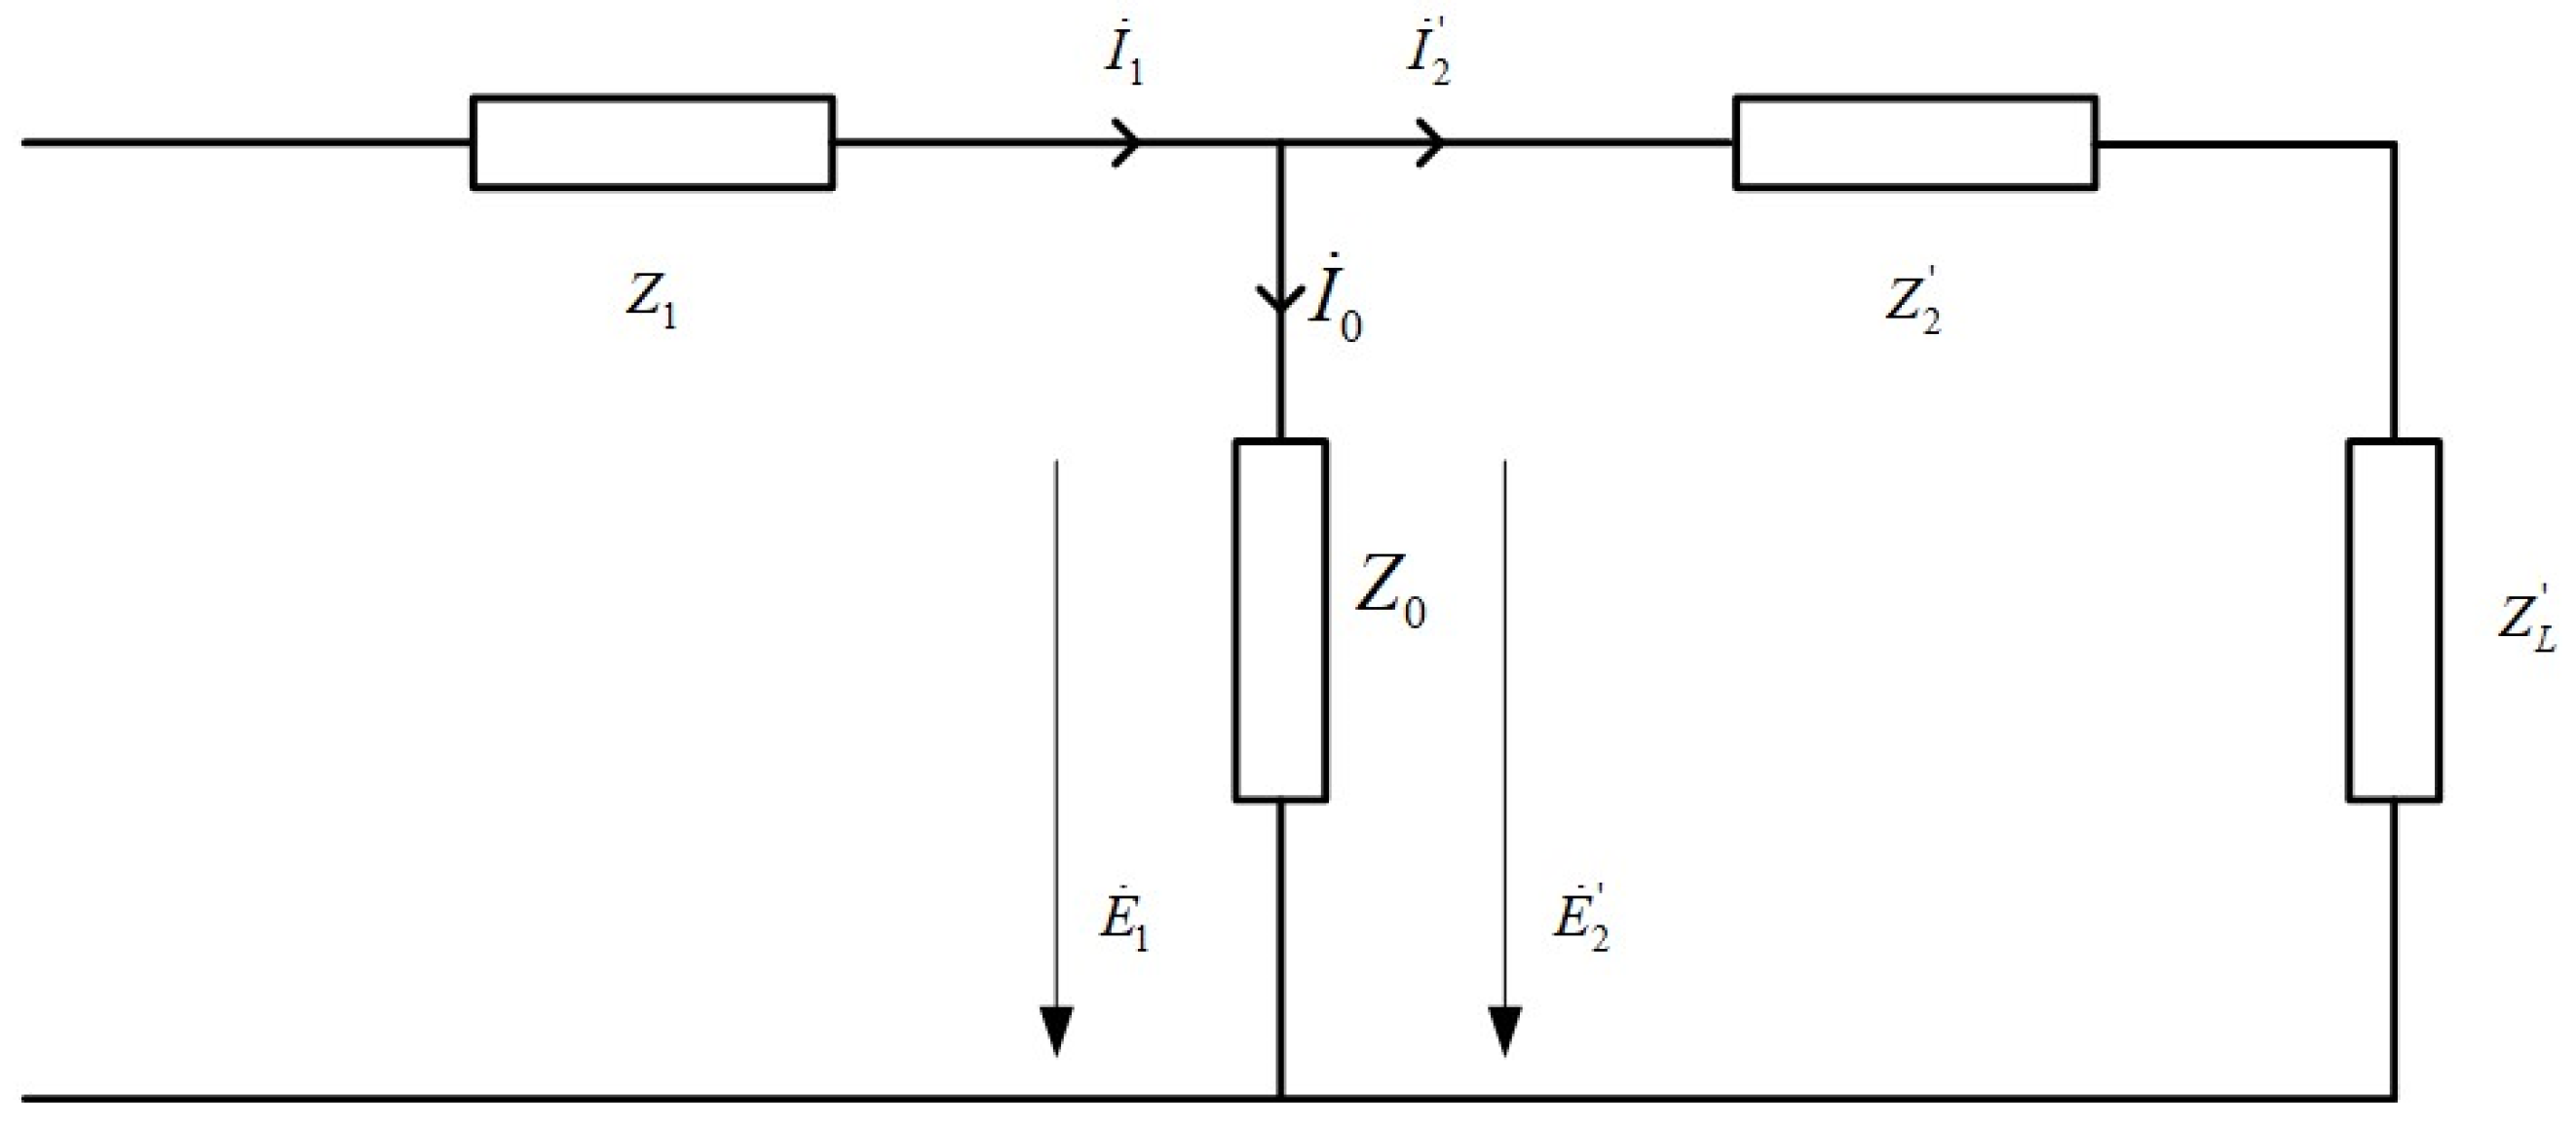
The equivalent circuit of a conventional single-core CT is illustrated in
Figure 1.
In the diagram, , , and represent the primary impedance, excitation impedance, leakage impedance converted to the primary side, and the load impedance of the secondary side, respectively. represents the primary current, represents the excitation current, and represents the current on the secondary side converted to the primary side. represents the induced electromotive force on the primary side, and represents the induced electromotive force on the secondary side converted to the primary side.
According to the equivalent circuit structure of the current transformer in
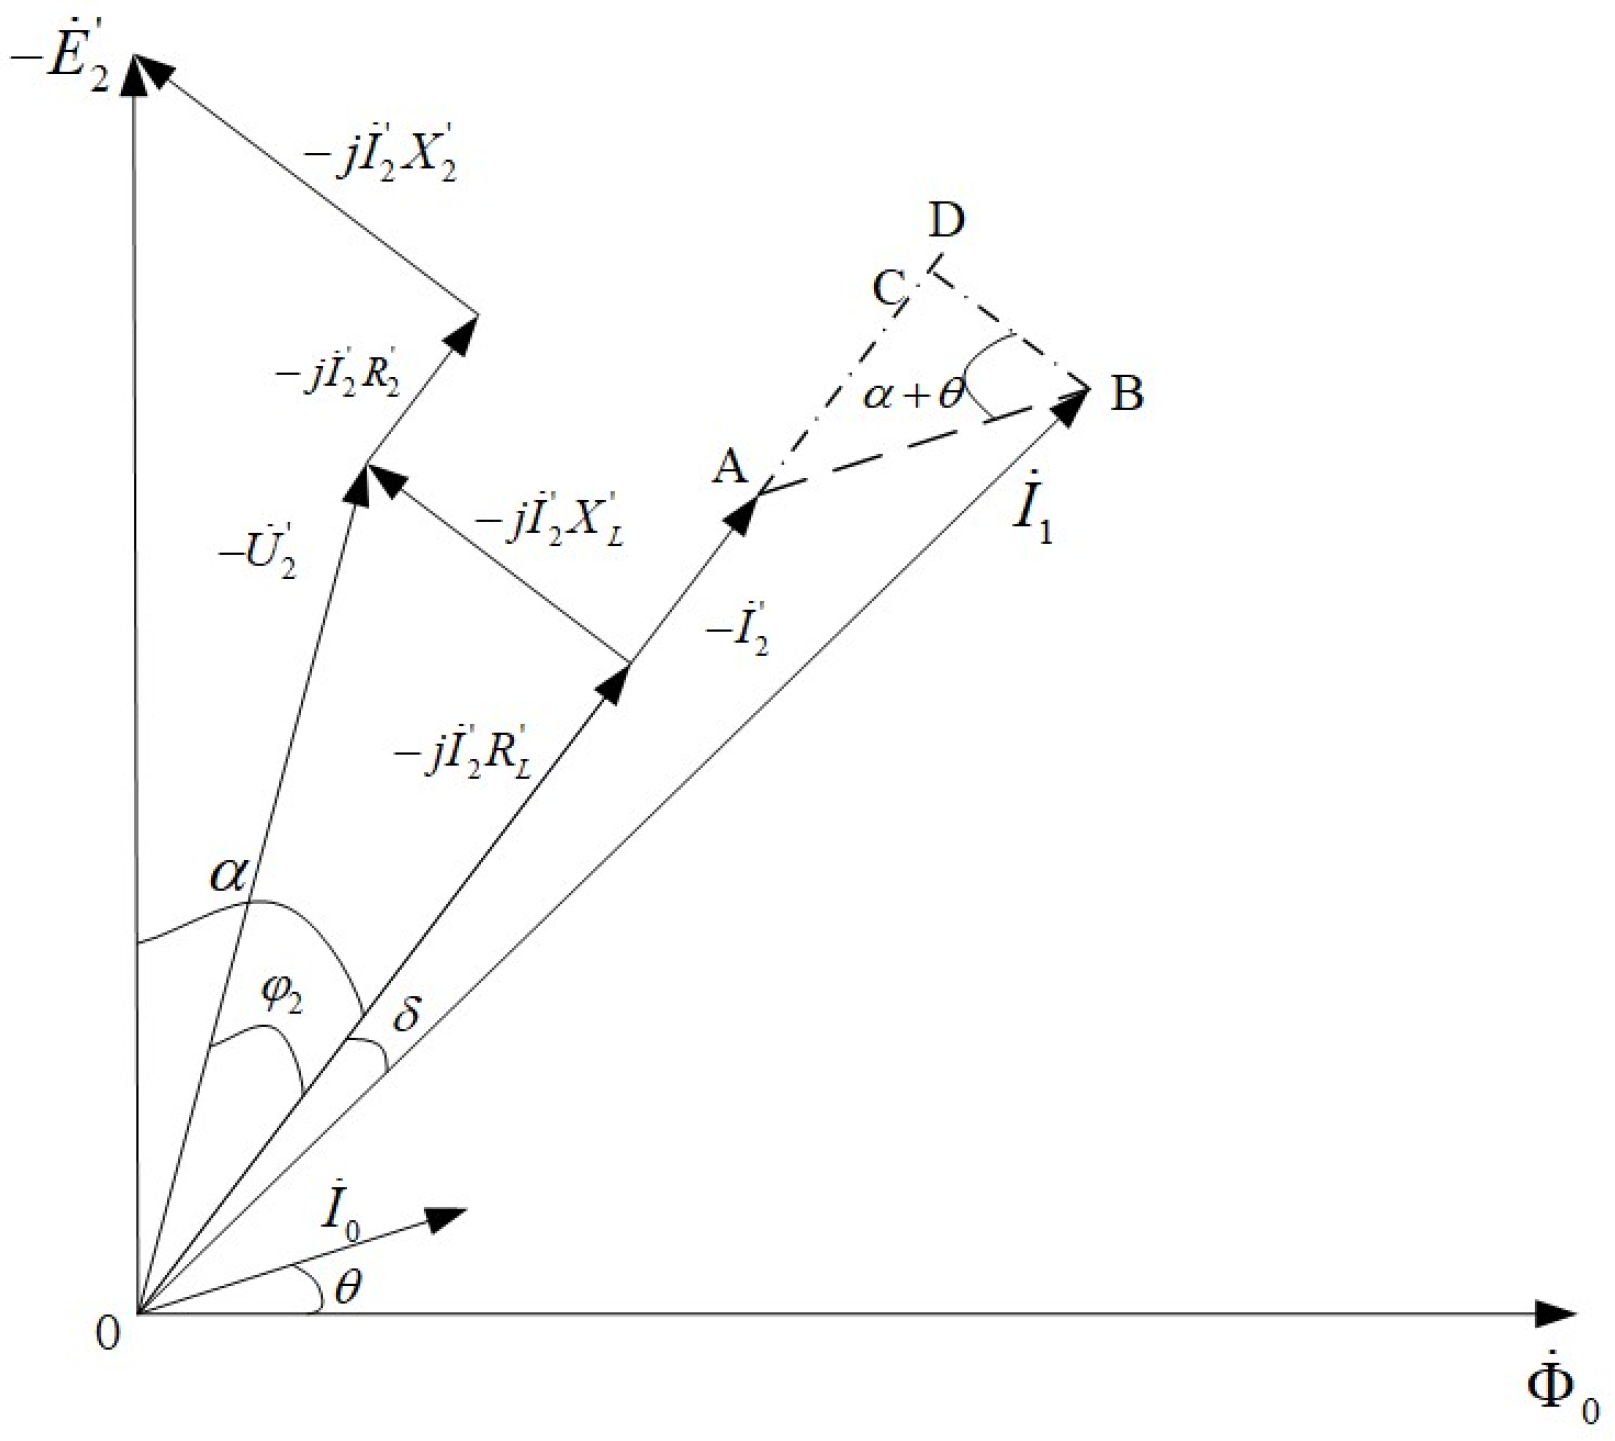
Figure 1, the phasor diagram of the current transformer can be drawn, as shown in
Figure 2.
In the diagram, a is the impedance angle of the second order. is the angle at which the secondary current leads the primary current, indicating the angular difference. is the angle at which the excitation current I0 leads the magnetic flux , representing the loss angle. It can be derived from the corresponding magnetization curve of the iron core.
When the CT core operates in the linear region, its excitation magnetic flux has the following relationship with the secondary induced electromotive force:
In the equation, , represents the modulus of secondary side load. N2 represents the number of turns in the secondary winding, and f represents the frequency of the AC current.
Combining Ampere’s loop law with Equation (1), we can obtain Equation (2):
In the equation, lc represents the effective magnetic path length of the CT core, and N1 represents the number of turns in the primary winding.
When
is very small, combined with the phasor diagram, the geometric expression for CT ratio difference is
, the expression for angle difference is
, and the mathematical expressions for ratio difference and angle difference are expressed as:
To further analyze the transmission performance of current transformers under harmonic conditions and DC bias, this article sets up CT simulation operating conditions in PSCAD based on the regulations on harmonic content in the power grid in IEC-61000-2 and the on-site measurement data of DC components in
Table 1. The parameters of CT are shown in
Table 3.
IEC-61000-2 considers the requirement for long-term stable operation of the power grid, and stipulates that the total harmonic distortion should be less than 8%. In the simulation software Matlab 2022, the effective value of harmonics is fixed at 8% of the rated effective value on the primary side, with an initial phase of 0°, which is the same as the fundamental current. The results regarding the impact of harmonic frequency changes from 100 to 500 Hz on the CT fundamental error at a rated current are shown in
Figure 3a.
Under the rated current, we adjust the DC component size from 1 to 5%
IN to obtain the ratio difference and angle difference changes of CT, as shown in
Figure 3b.
Under harmonic conditions, the ratio difference and phase difference of the current transformer with respect to the fundamental wave remain within a narrow range, without significantly impacting the transmission performance of the current transformer. However, due to the inability to couple the DC component to the secondary side through the iron core, the magnetic flux generated will be superimposed with the same polarity AC magnetic flux, seriously altering the working performance of the iron core. Although Equations (3) and (4) do not directly include the DC component, the magnetic permeability of the iron core under DC bias
μ can be regarded as a function of
IDC. When only considering the presence of
IDC in the primary winding, the magnetic induction intensity
B generated by the DC component can be obtained as:
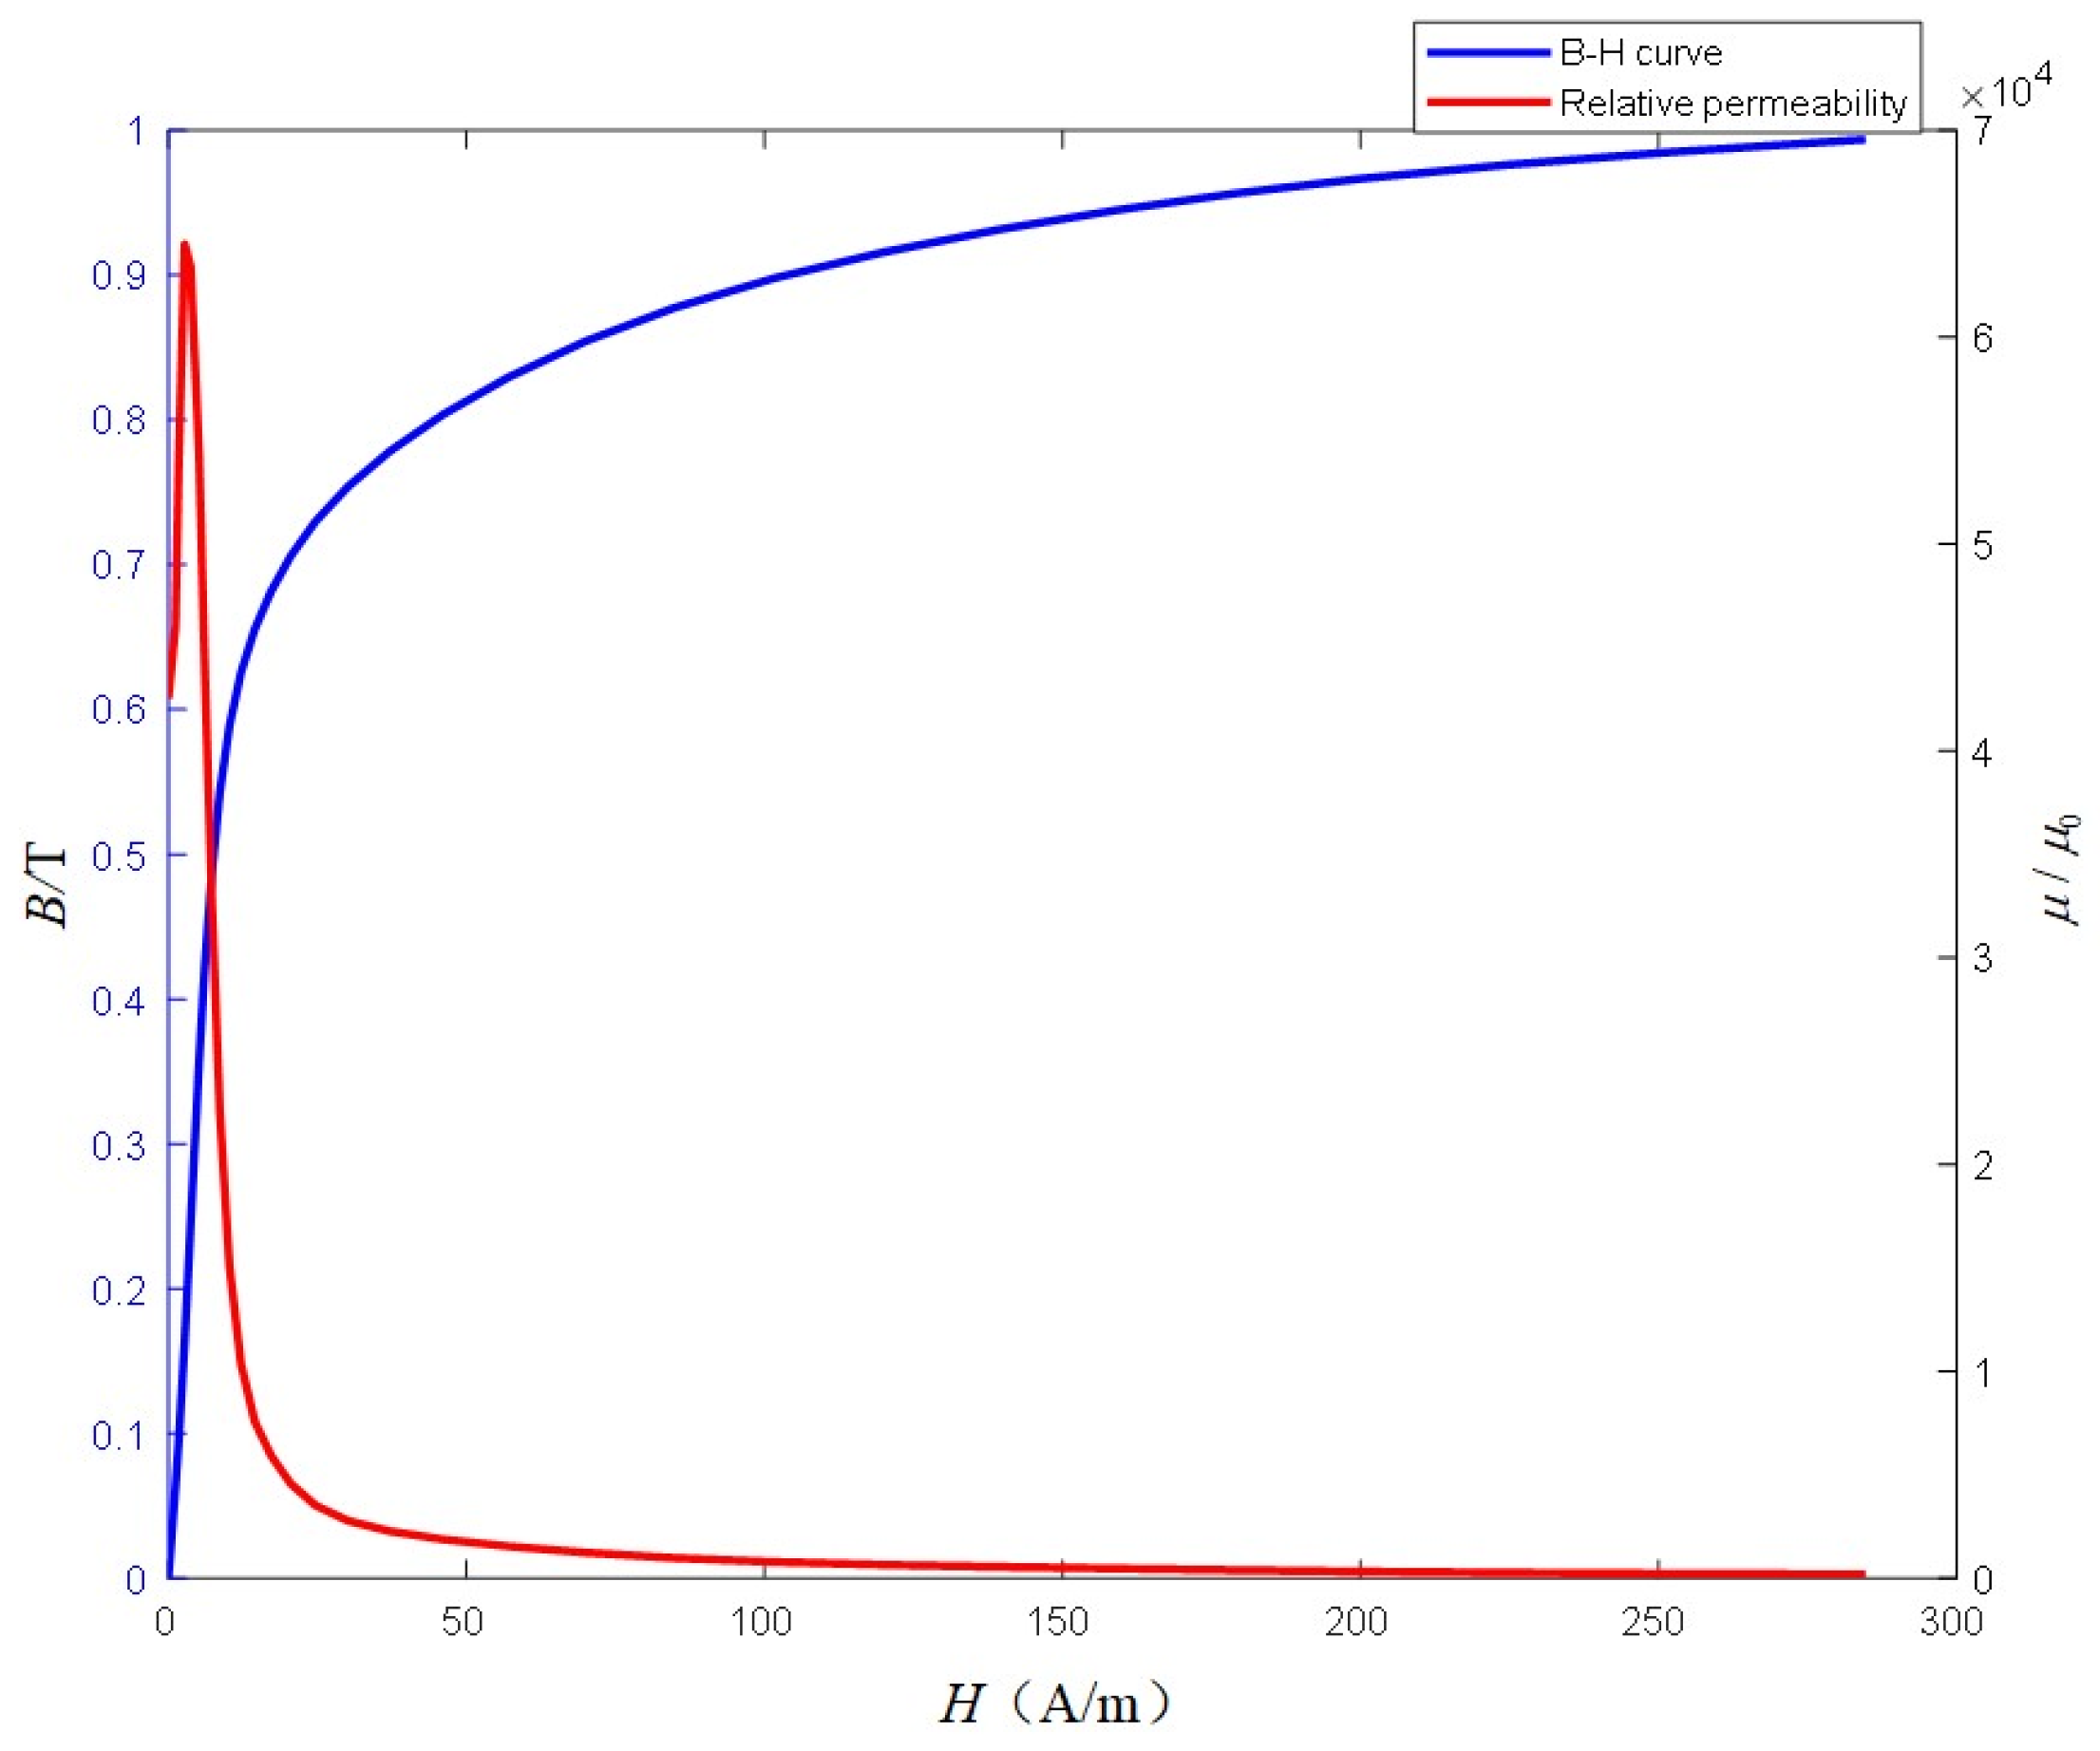
Figure 4 shows the
B–
H curve and the
μ–
H curve. When there is no direct current component in the primary coil,
H is close to zero. In this situation, the permeability has a high value. According to Equations (3) and (4), the error of the current transformer is small. However, as indicated by Equation (5), the magnetic field intensity value
H is directly proportional to the
IDC. With an increase in
H, the permeability
μ rapidly decreases, resulting in a sharp increase in the measurement error of the current transformer.
To quantitatively analyze the impact of DC bias on the measurement error of the CT, an experimental circuit was constructed, as shown in
Figure 5. The experimental circuit independently winds the DC circuit around the tested CT. The standard sampling resistor has a resistance value of 0.1 Ω and a temperature drift of 1 ppm. Assuming a maximum temperature variation of 50 °C, the error caused by the temperature drift in the sampling resistor is at most ±1 ppm/°C × 50 °C = ±0.005%. The digital comparator uses a spectrum analysis algorithm, which provides high accuracy. Even under conditions of frequency offset and non-synchronous sampling, the errors encountered in extracting amplitude and phase from the frequency can reach the order of 10
−3. The standard current transformer in the diagram possesses a measurement accuracy of 0.01S, which exceeds that of the tested CT by two accuracy classes. This results in a ratio error of no more than 0.01% and a phase error less than 0.2’. In all the tests, the errors of the acquisition system were at most 1/10 of those of the CT under test; therefore, they can be considered negligible [
21].
The ratio error and phase error of the LMZ2D metering current transformer under different DC and AC components were measured and are presented in
Table 4.
In
Table 4, it can be observed that when the AC component in the primary circuit is small, the influence of the DC component on the error of the CT is minimal. However, when the AC component in the primary circuit is at the rated current, an increase in the DC component causes the ratio error of the CT to shift in the negative direction and the phase error to shift in the positive direction. A DC component of 3%
IN in the primary circuit can cause the ratio error of the CT to exceed the measurement accuracy requirement of a 0.2S CT.
