
The Influence of Hydrogen on Structural and Magnetic Transformations in RMn2Hx Hydrides with Laves Phase C15 and C14 Structures—A Review


Abstract
:1. Introduction
1.1. Laves Phases
- Phases with a dense filling of space (Laves phases), which are classified according to the size of atoms/ions;
- Electronic phases, which are classified according to the electron concentration, i.e., the ratio of the number of valence electrons to the number of atoms in the unit cell;
- Phases with mixed, metallic-ionic and metallic-covalent bonds.
- They are metal alloys with the general stoichiometric formula AB2;
- The main factor influencing their formation is the ratio of the radii of the component atoms, and rA/rB is equal, theoretically, to 1.225. In fact, this ratio for the Laves phases is within the range of 1.05–1.68 Å. Here, Å refers to larger atoms (e.g., rare earths), and B refers to smaller atoms (e.g., Cu, Zn, Fe, Mn, Cr, etc.);
- They do not create secondary solutions;
- They exhibit an almost purely metallic type of bonding;
- They are phases with the densest space filling;
- They crystallize in one of three homothetic types, C14, C15 and C36, as determined by the value of the electron concentration [4].
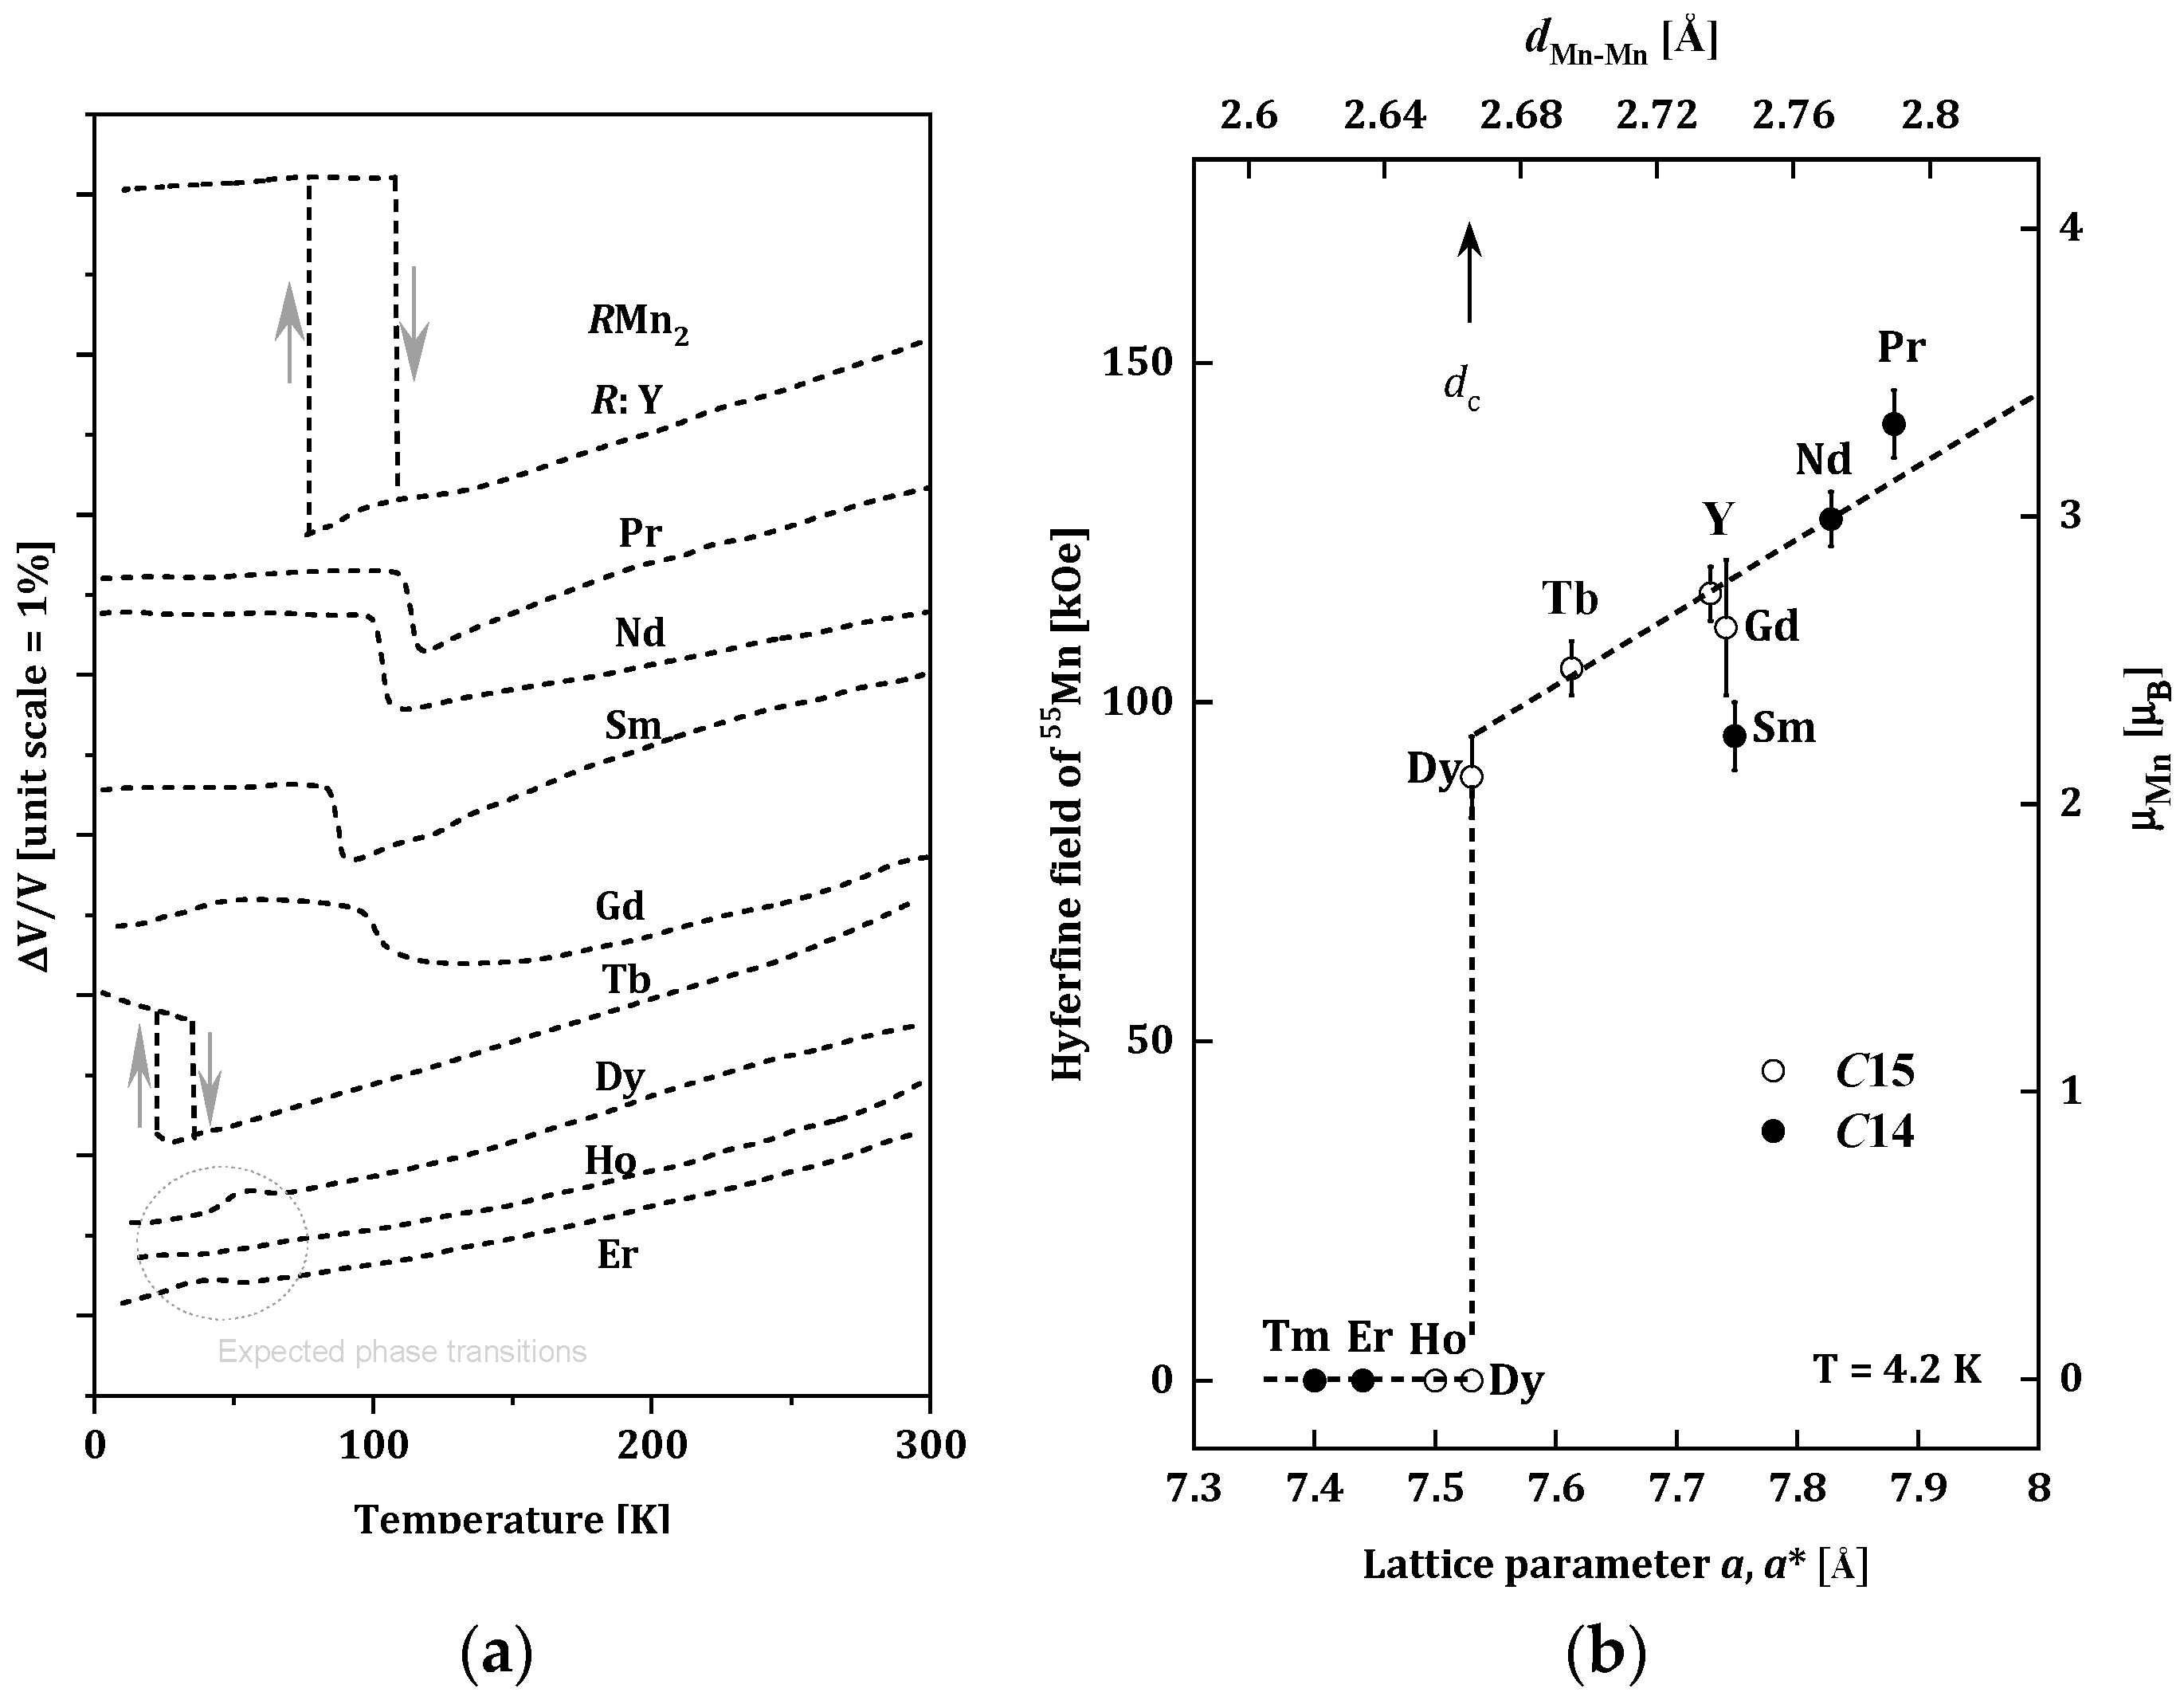
1.2. Structural and Magnetic Properties of RMn2 Compounds
- dMn-Mn < dc, (LuMn2, ErMn2, TmMn2), where the Mn subnet is non-magnetic, and the Er and Tm sublattices are ferromagnetic [24];
- dMn-Mn > dc, (NdMn2, PrMn2), where the dominant Mn magnetic sublattice is stable and enforces antiferromagnetic ordering in the sublattice of R-atoms with the R-Mn type interaction [25];
- dMn-Mn ~ dc, (GdMn2, TbMn2, DyMn2, HoMn2, YMn2), where the Mn sublattice is on the verge of stability. Generally, non-collinear magnetic structures are observed in this group of compounds. In some cases (TbMn2, DyMn2, HoMn2), only a part of the Mn atoms carries a magnetic moment [20,26,27,28,29,30,31,32,33,34].
- Between 3d–3d magnetic moments (Mn–Mn),
- Between 3d–4f moments (Mn–R),
- Between localized 4f–4f moments (R–R).
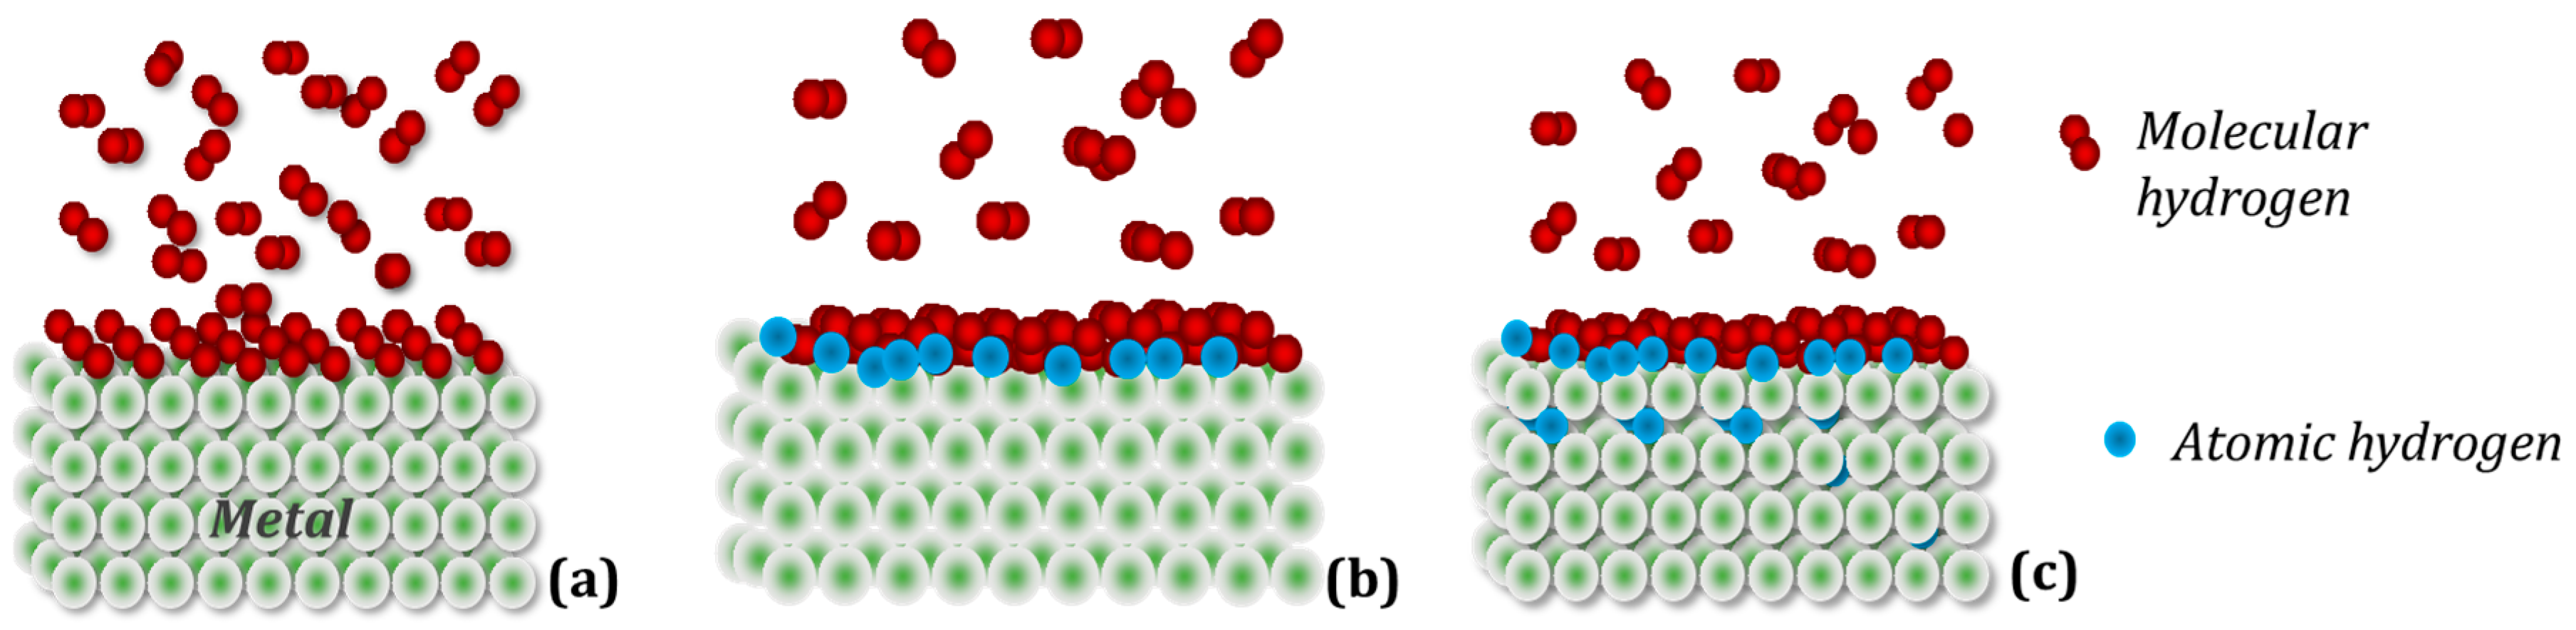
1.3. Hydrogen in Metals
2. RMn2Hx Hydrides
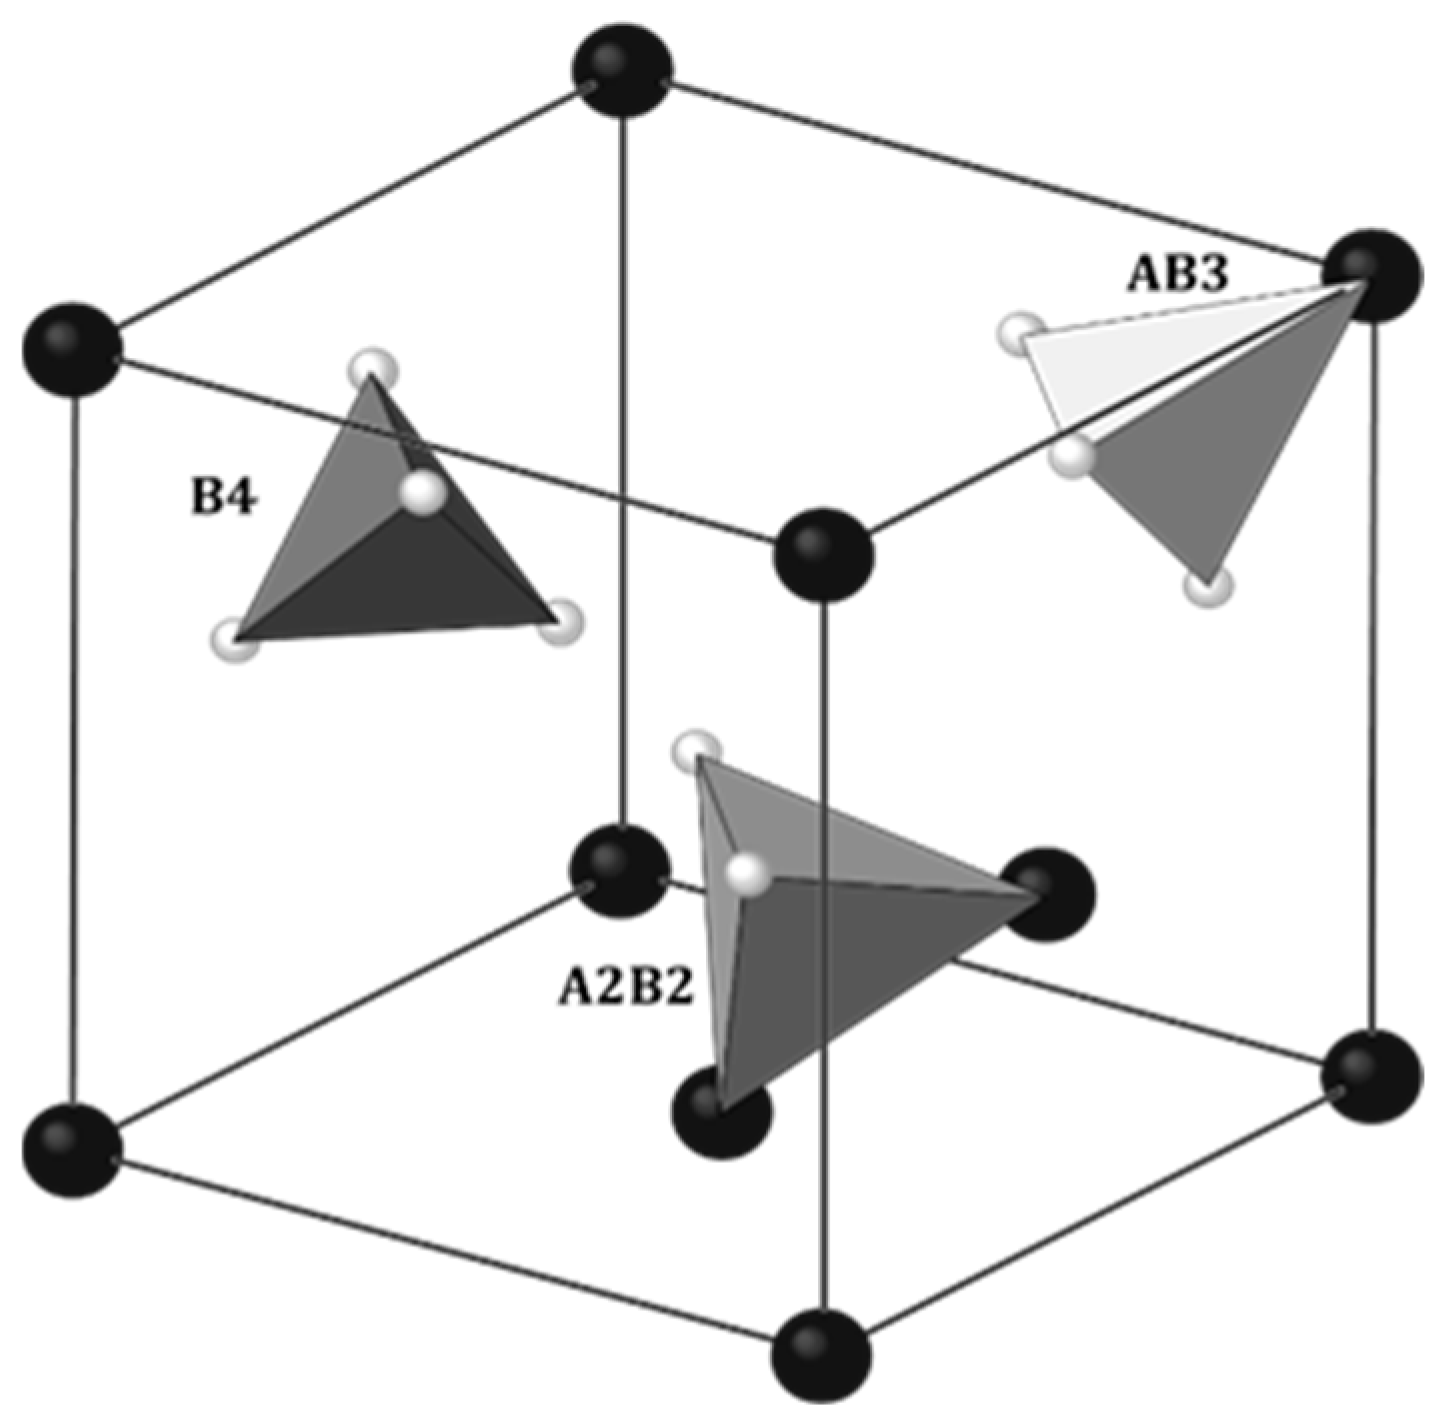
2.1. Localization of Hydrogen
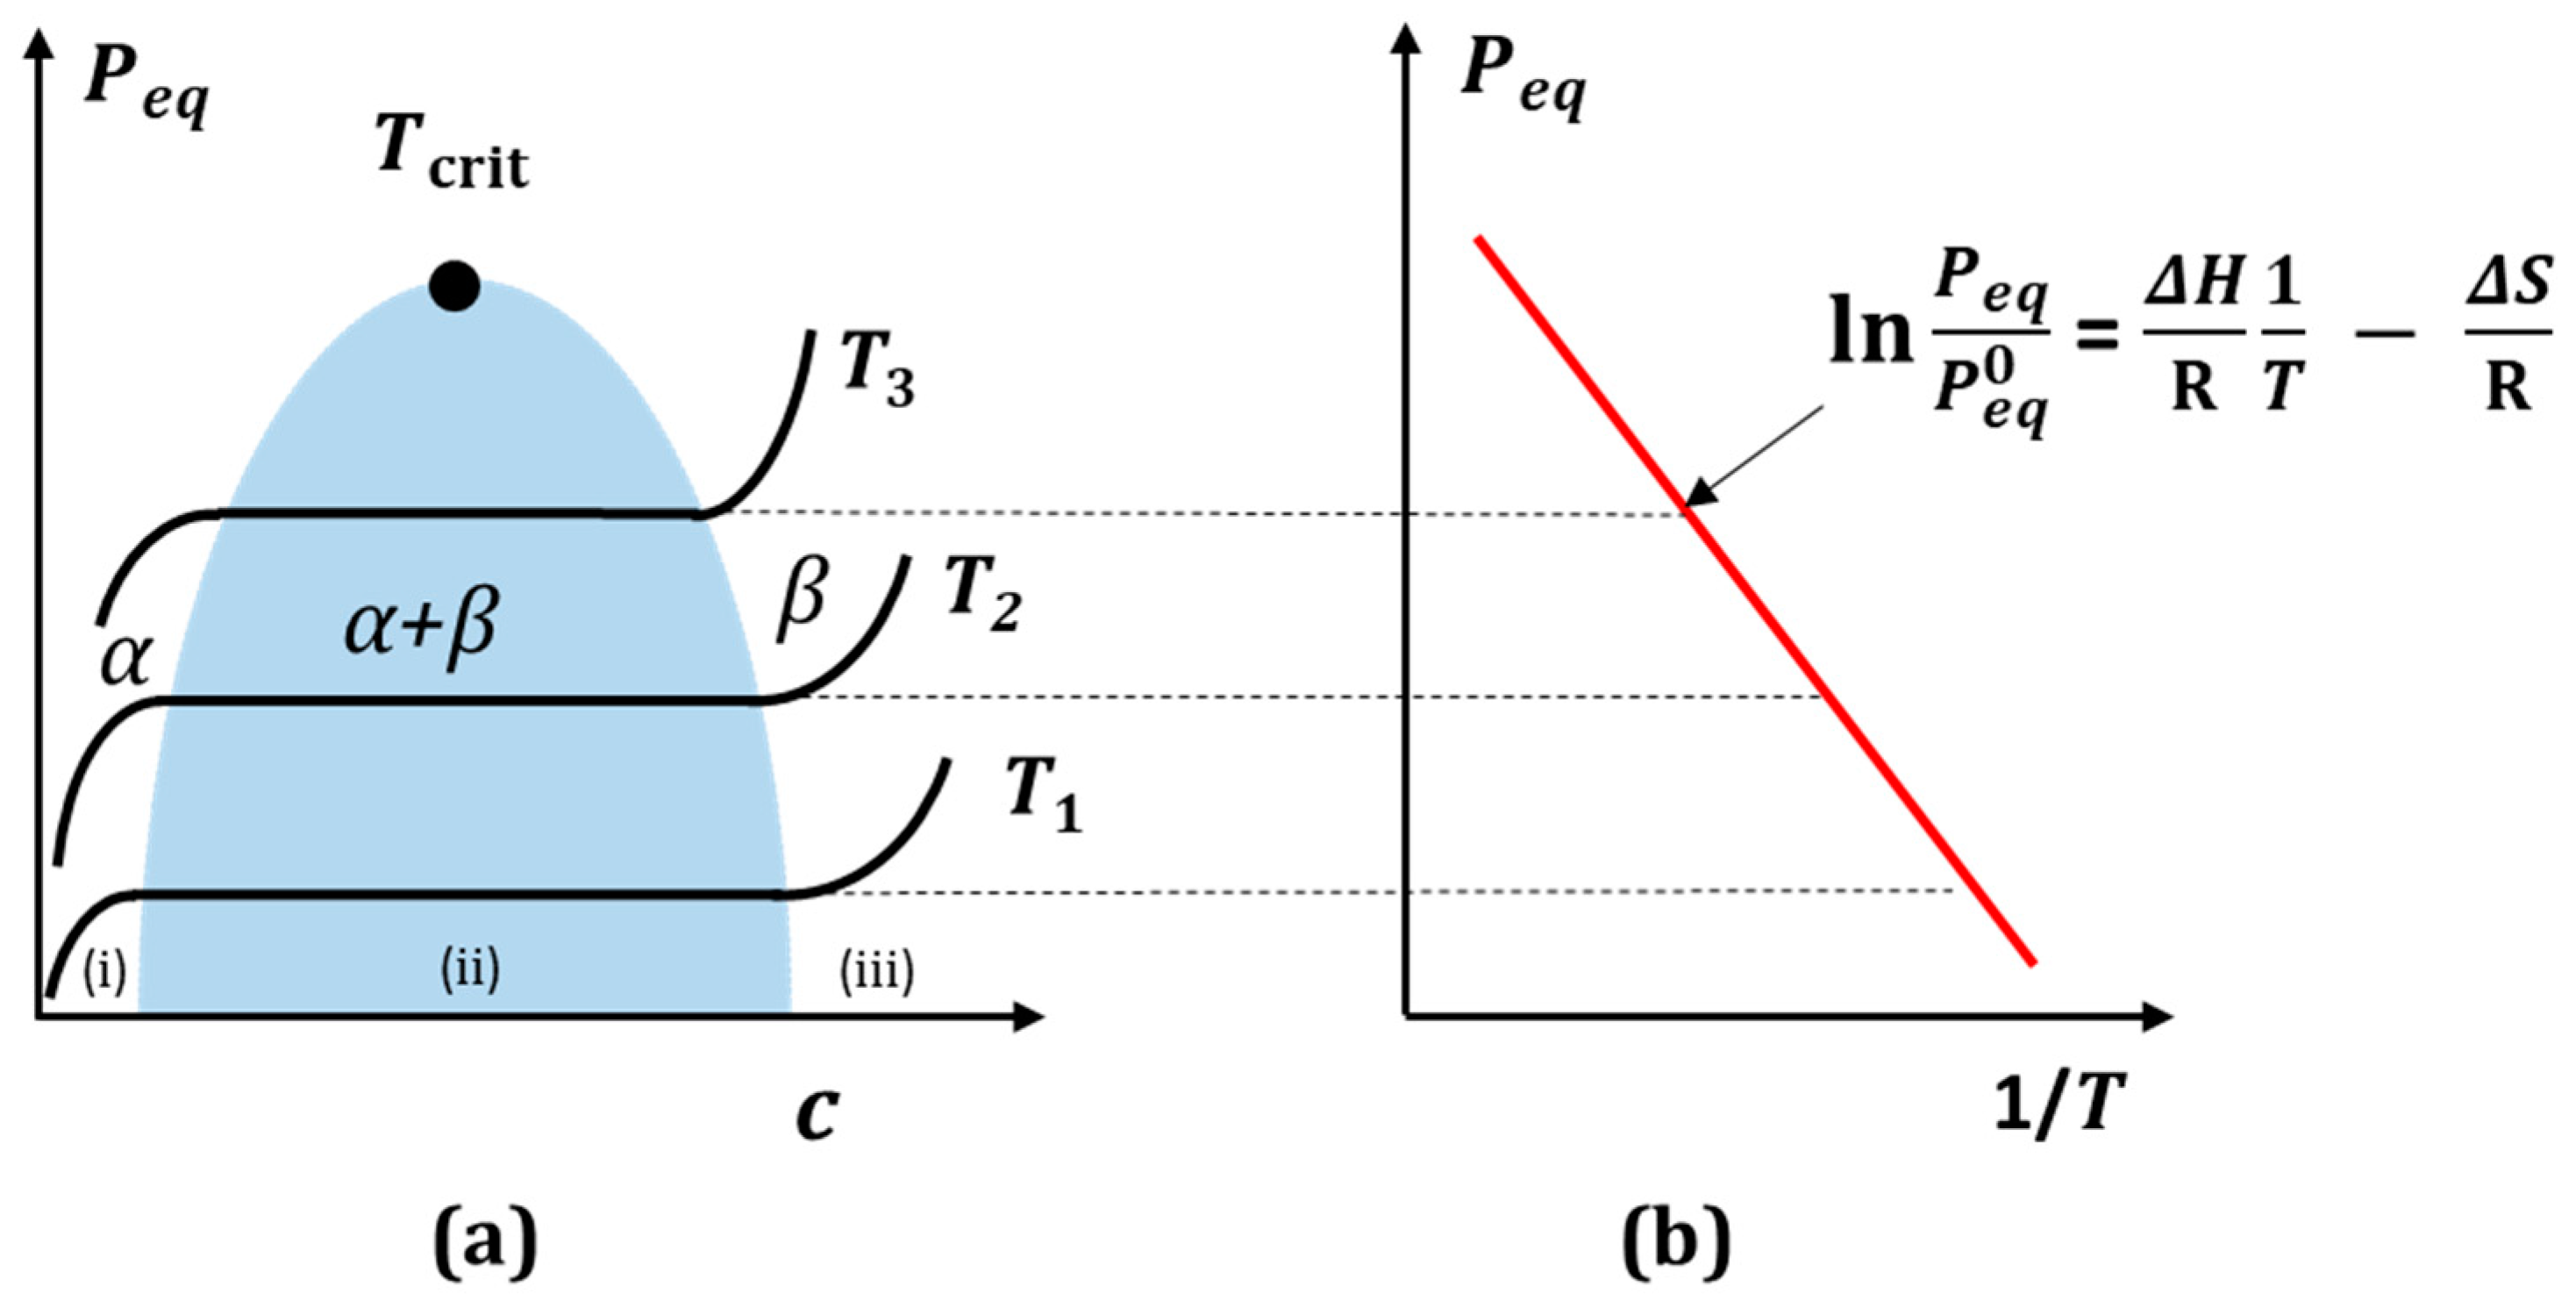
2.2. Sample Preparation and Dependence of ΔV/V versus Hydrogen Content
2.3. Examples of Structural and Magnetic Transformations in RMn2Hx
2.3.1. YMn2Hx
- Range 1: x ≲1.2 H/f.u.
- Range 2: 1.15 ≲ x ≲ 3.5
- Range 3: 3.5 ≲ x ≲ 4.5
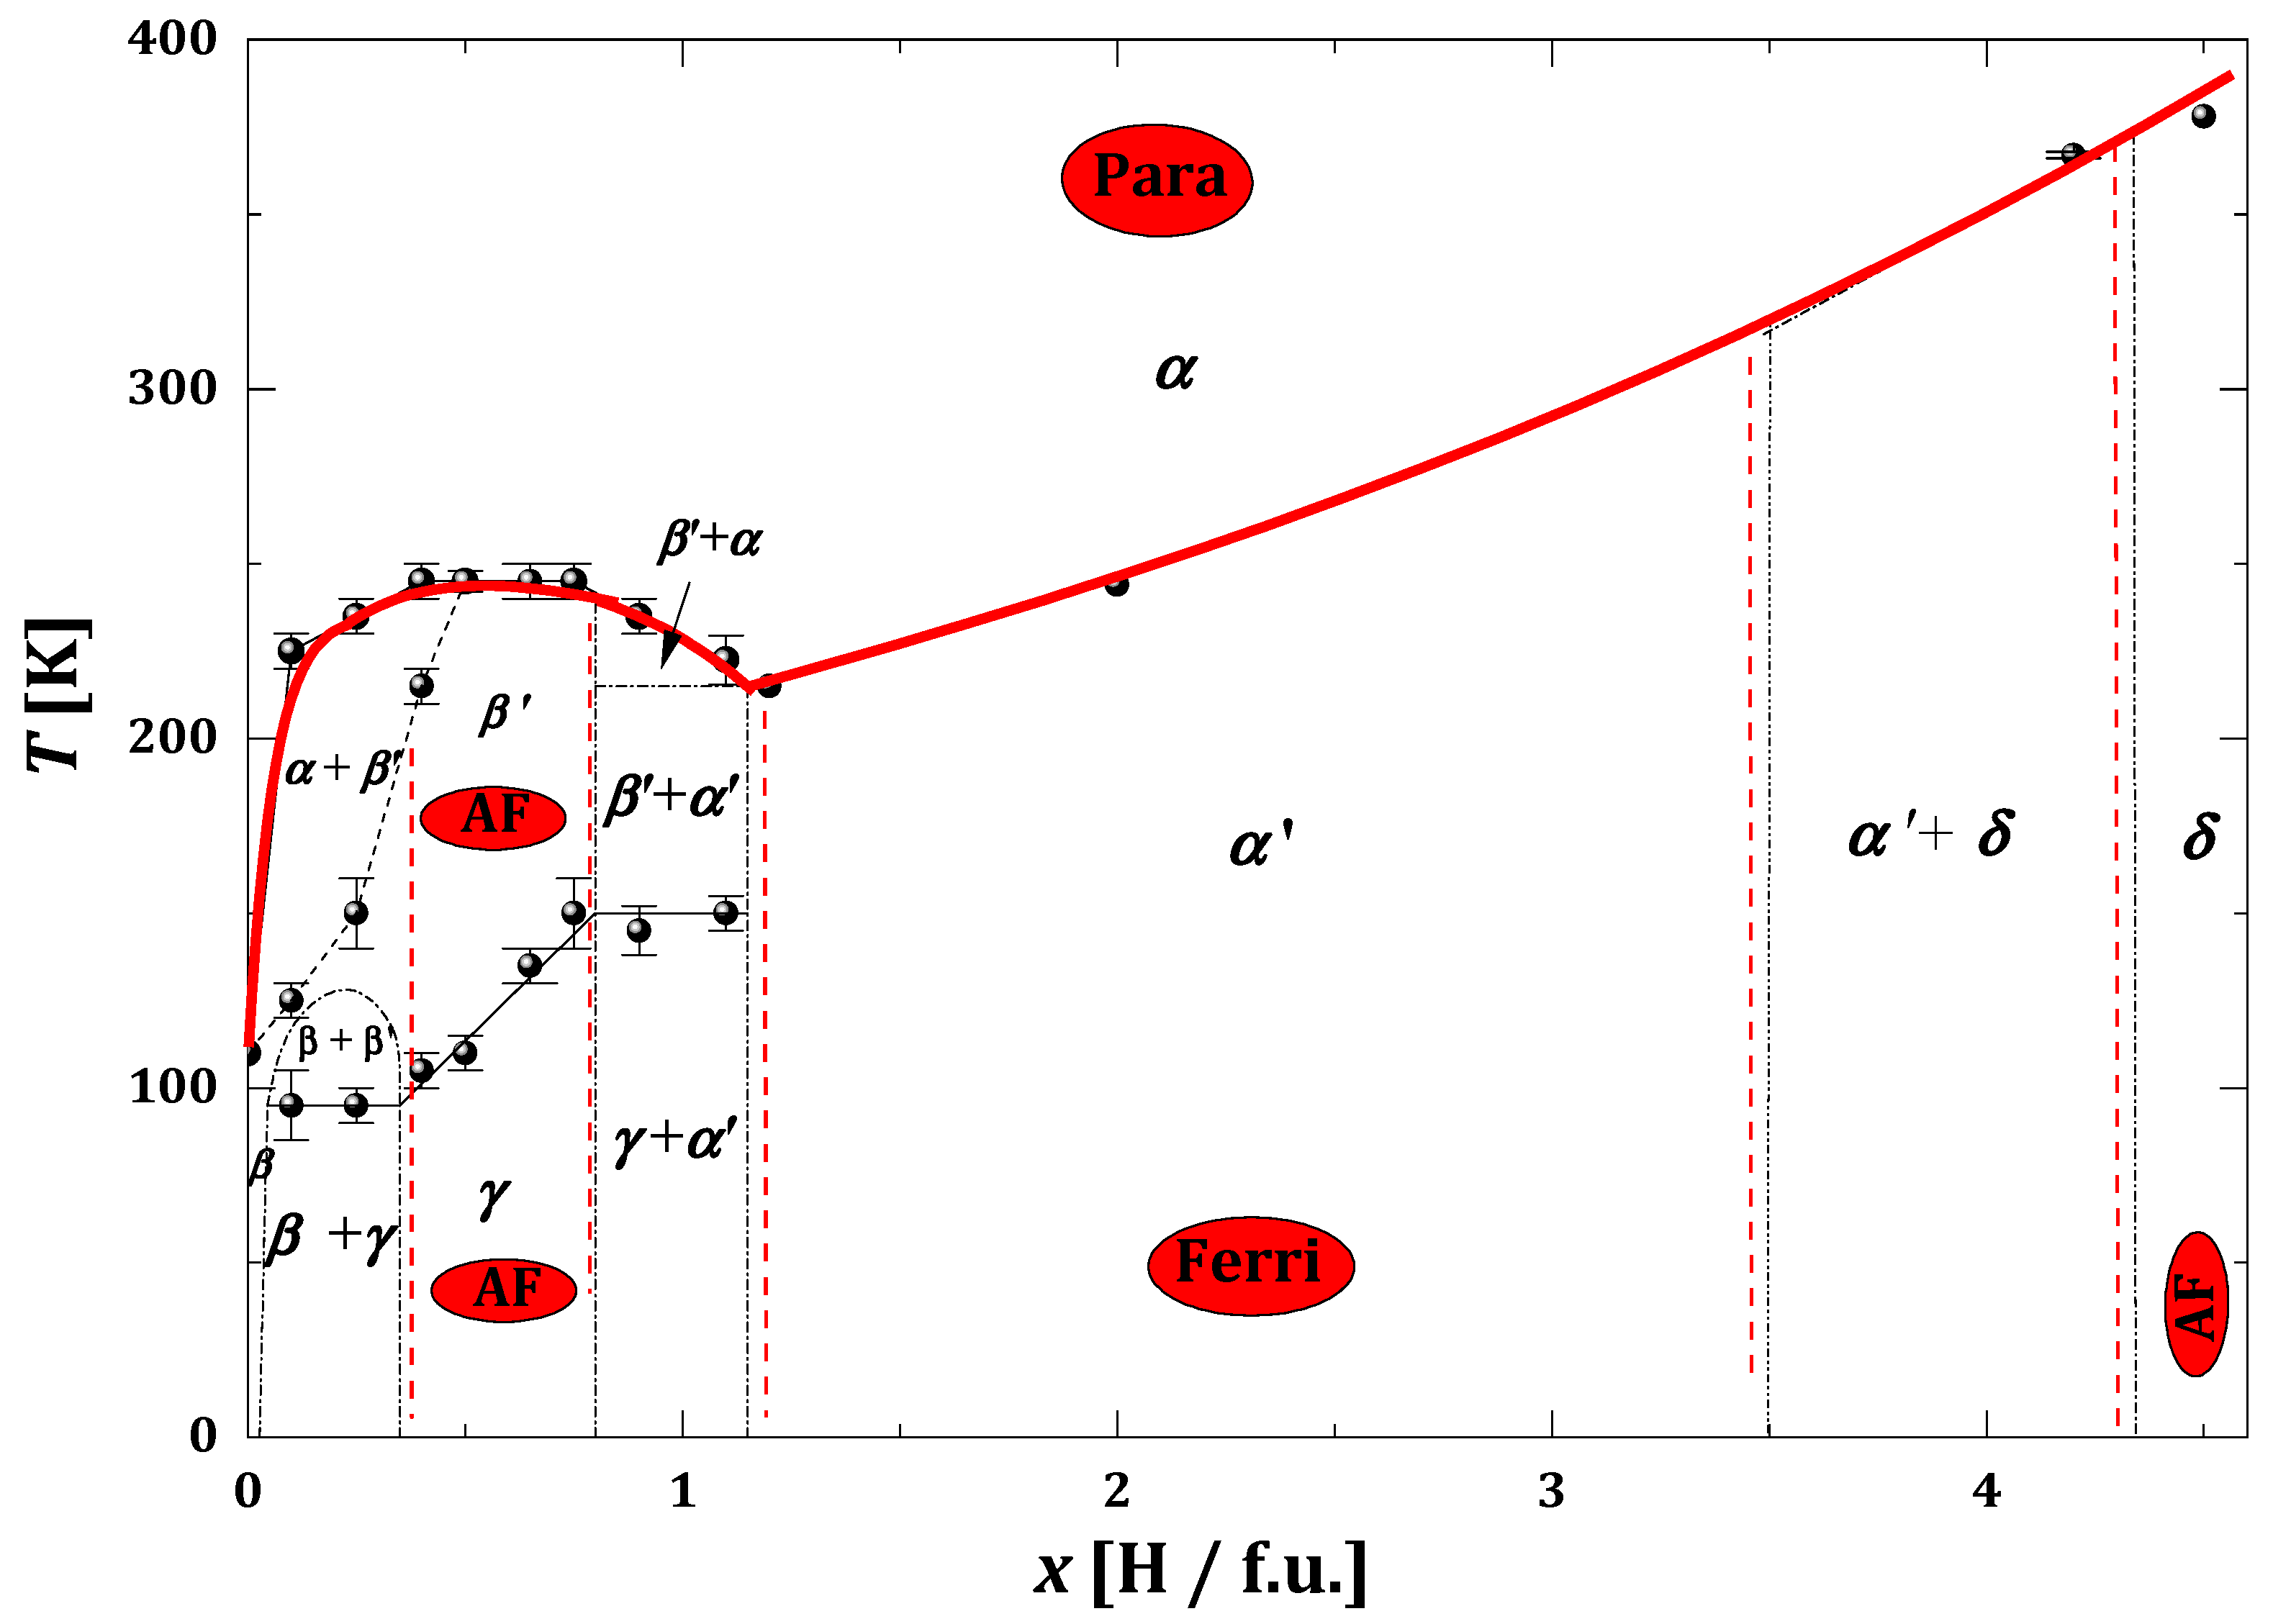
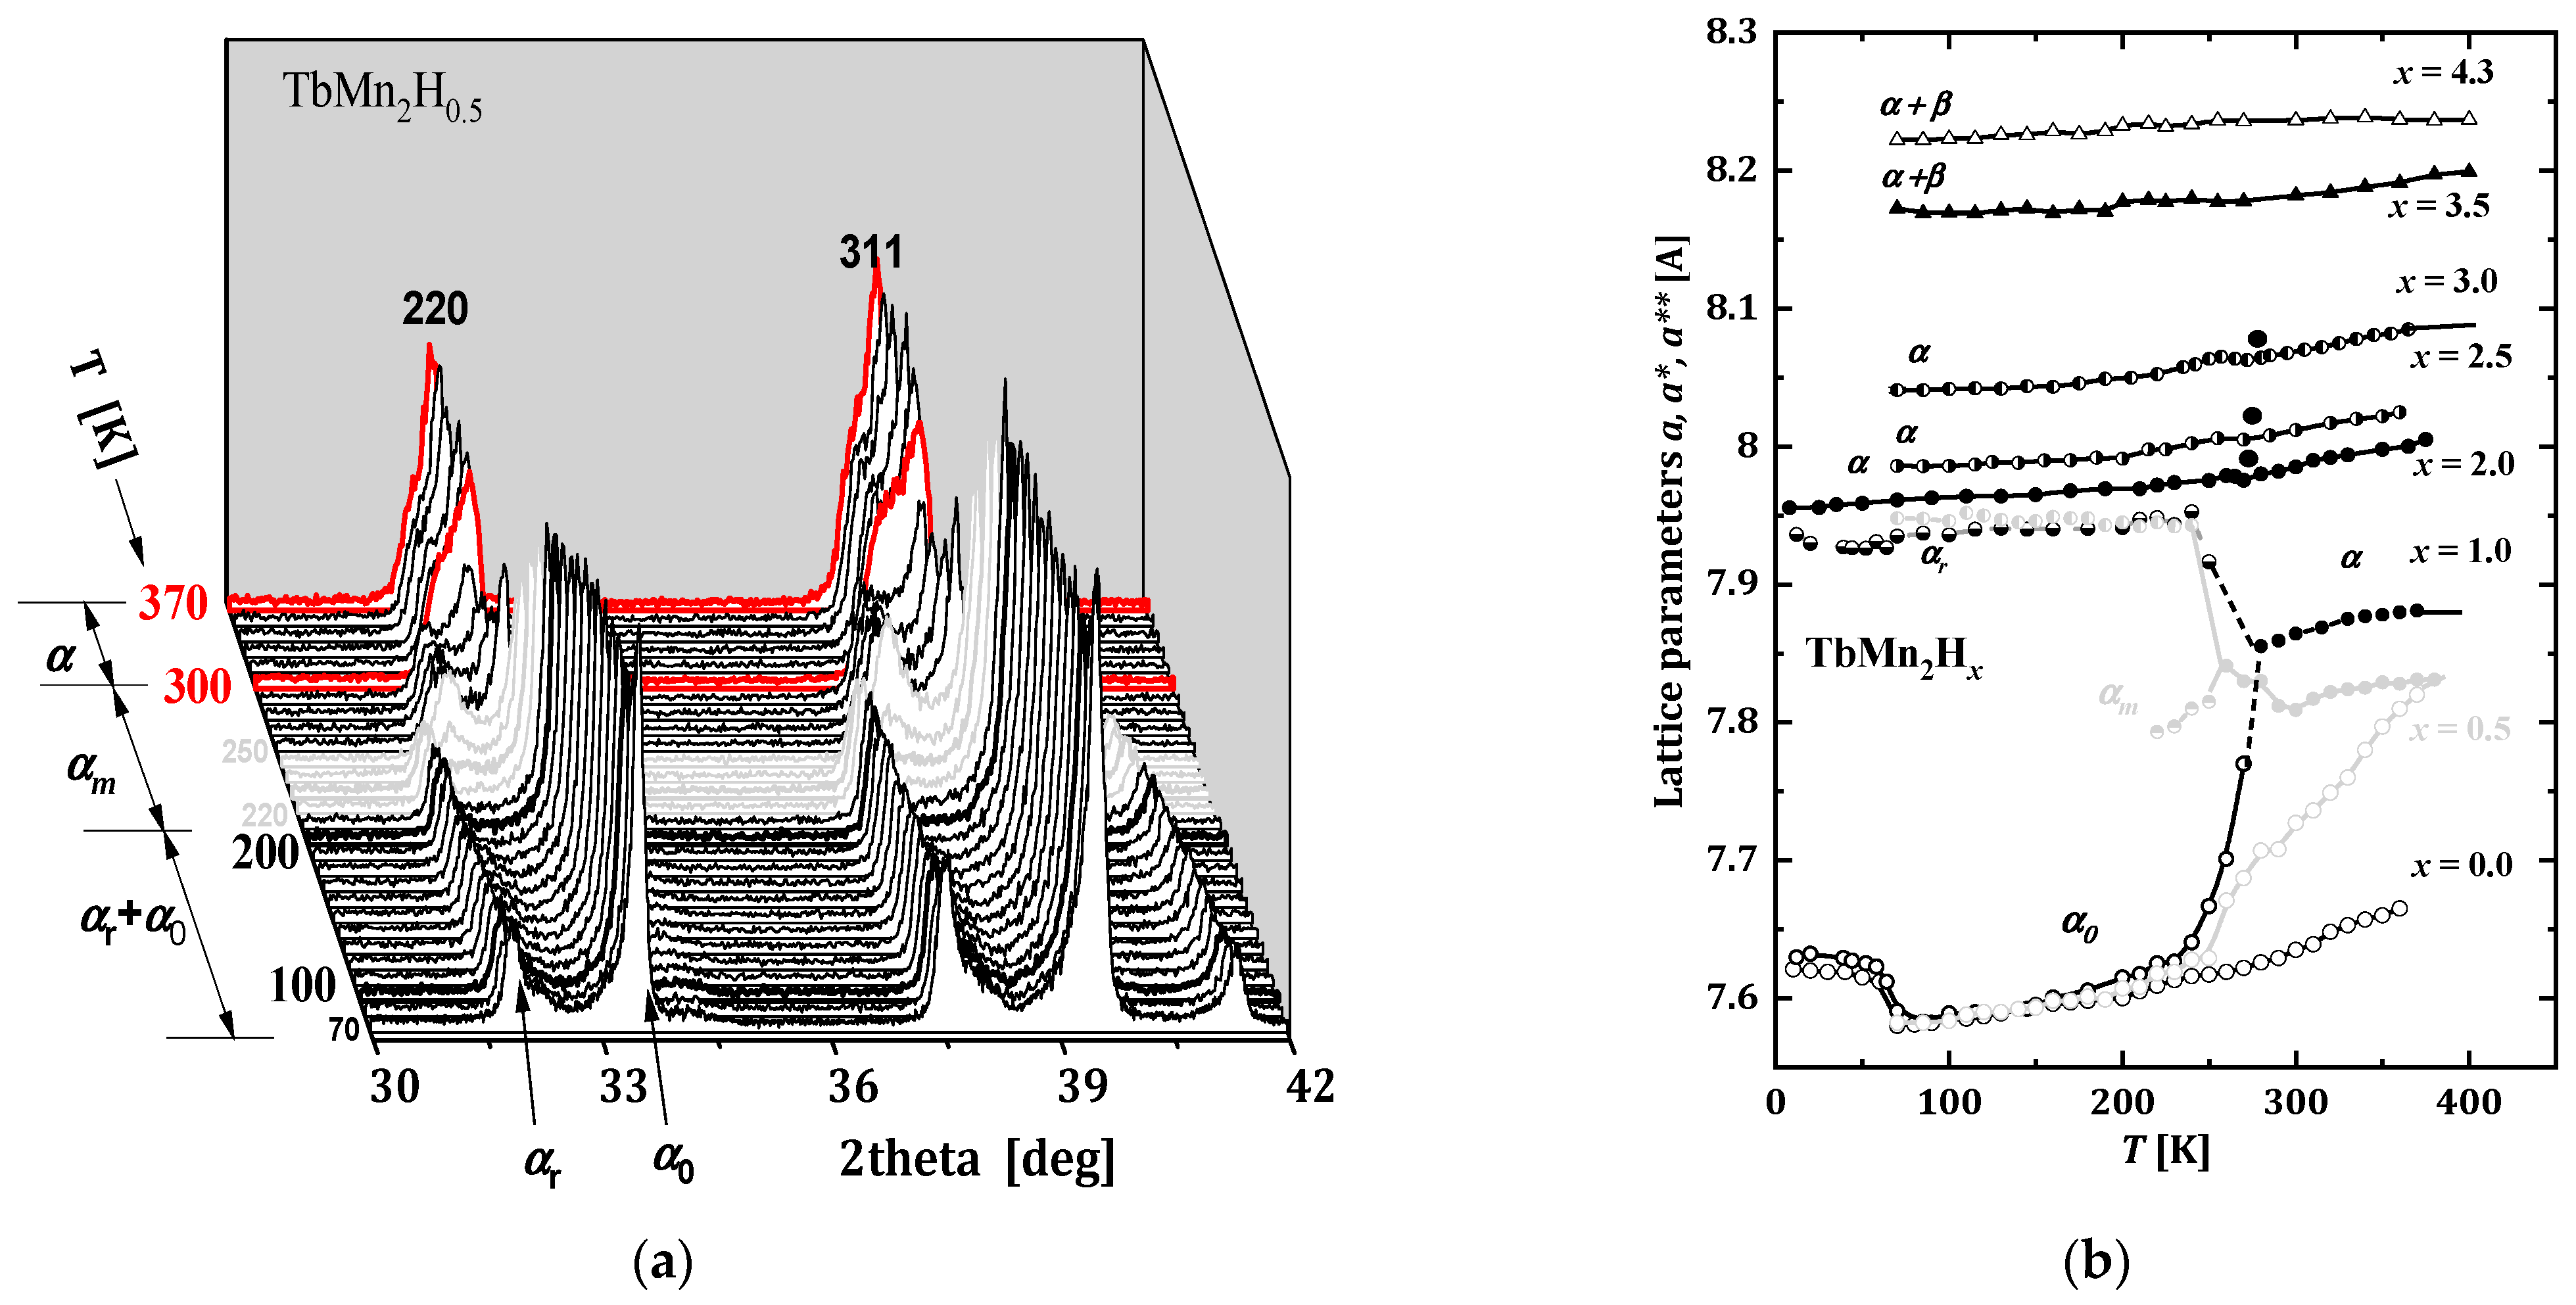
2.3.2. TbMn2Hx
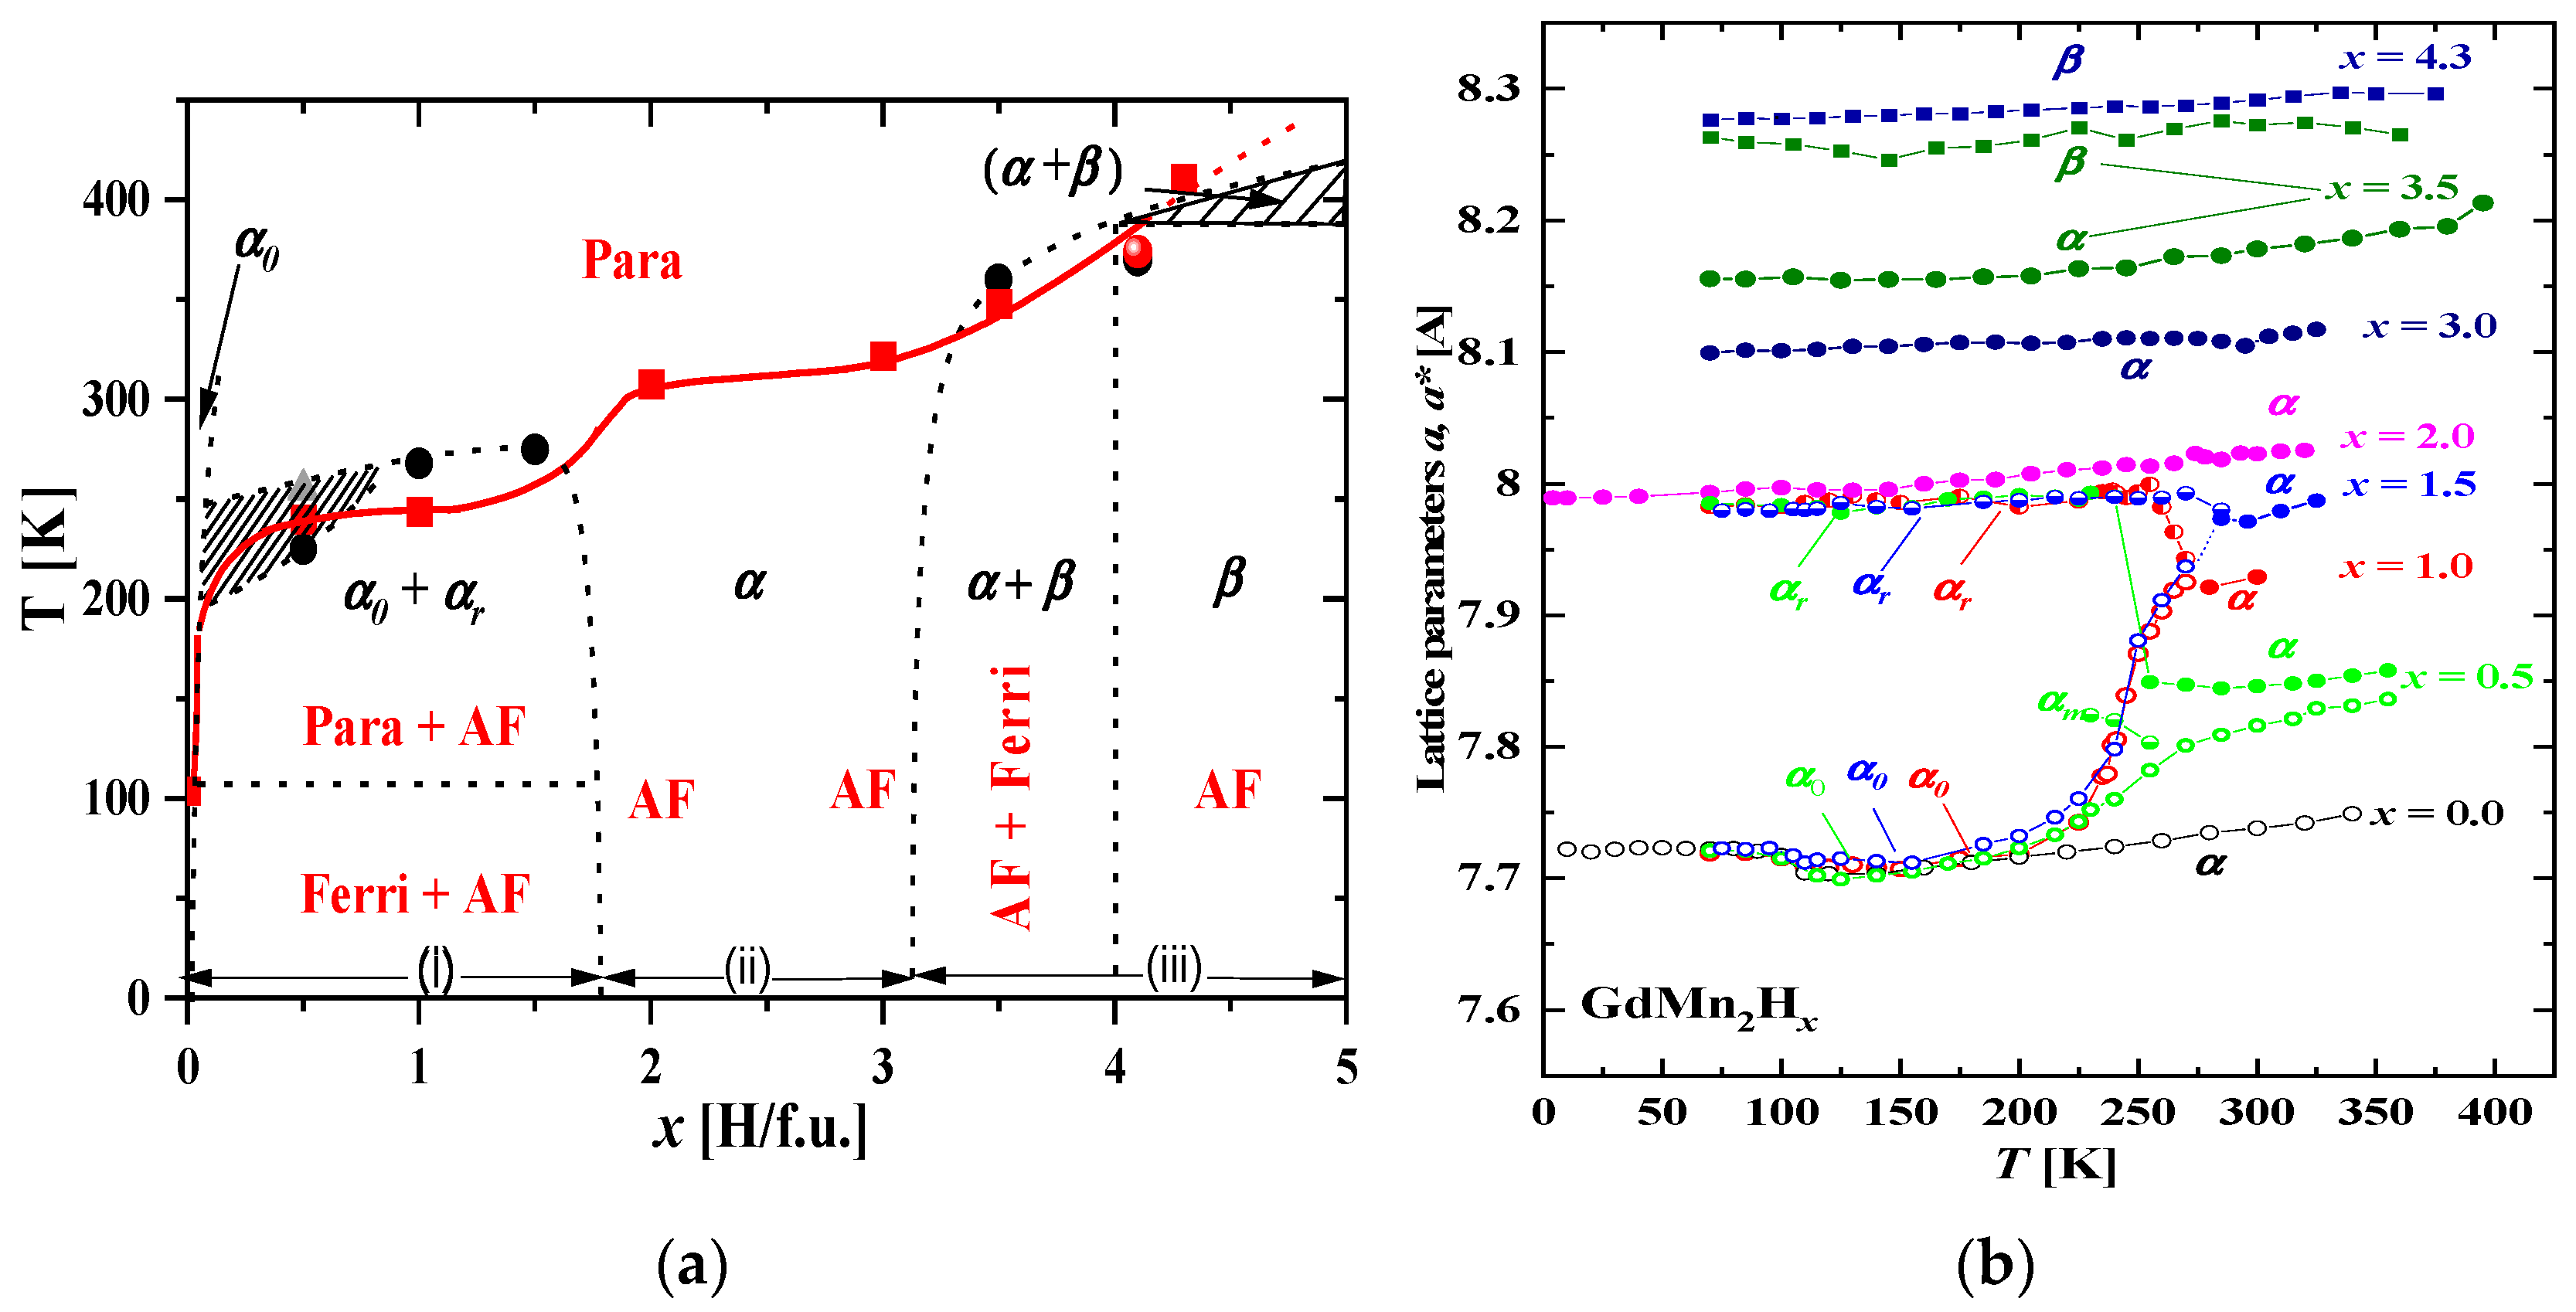
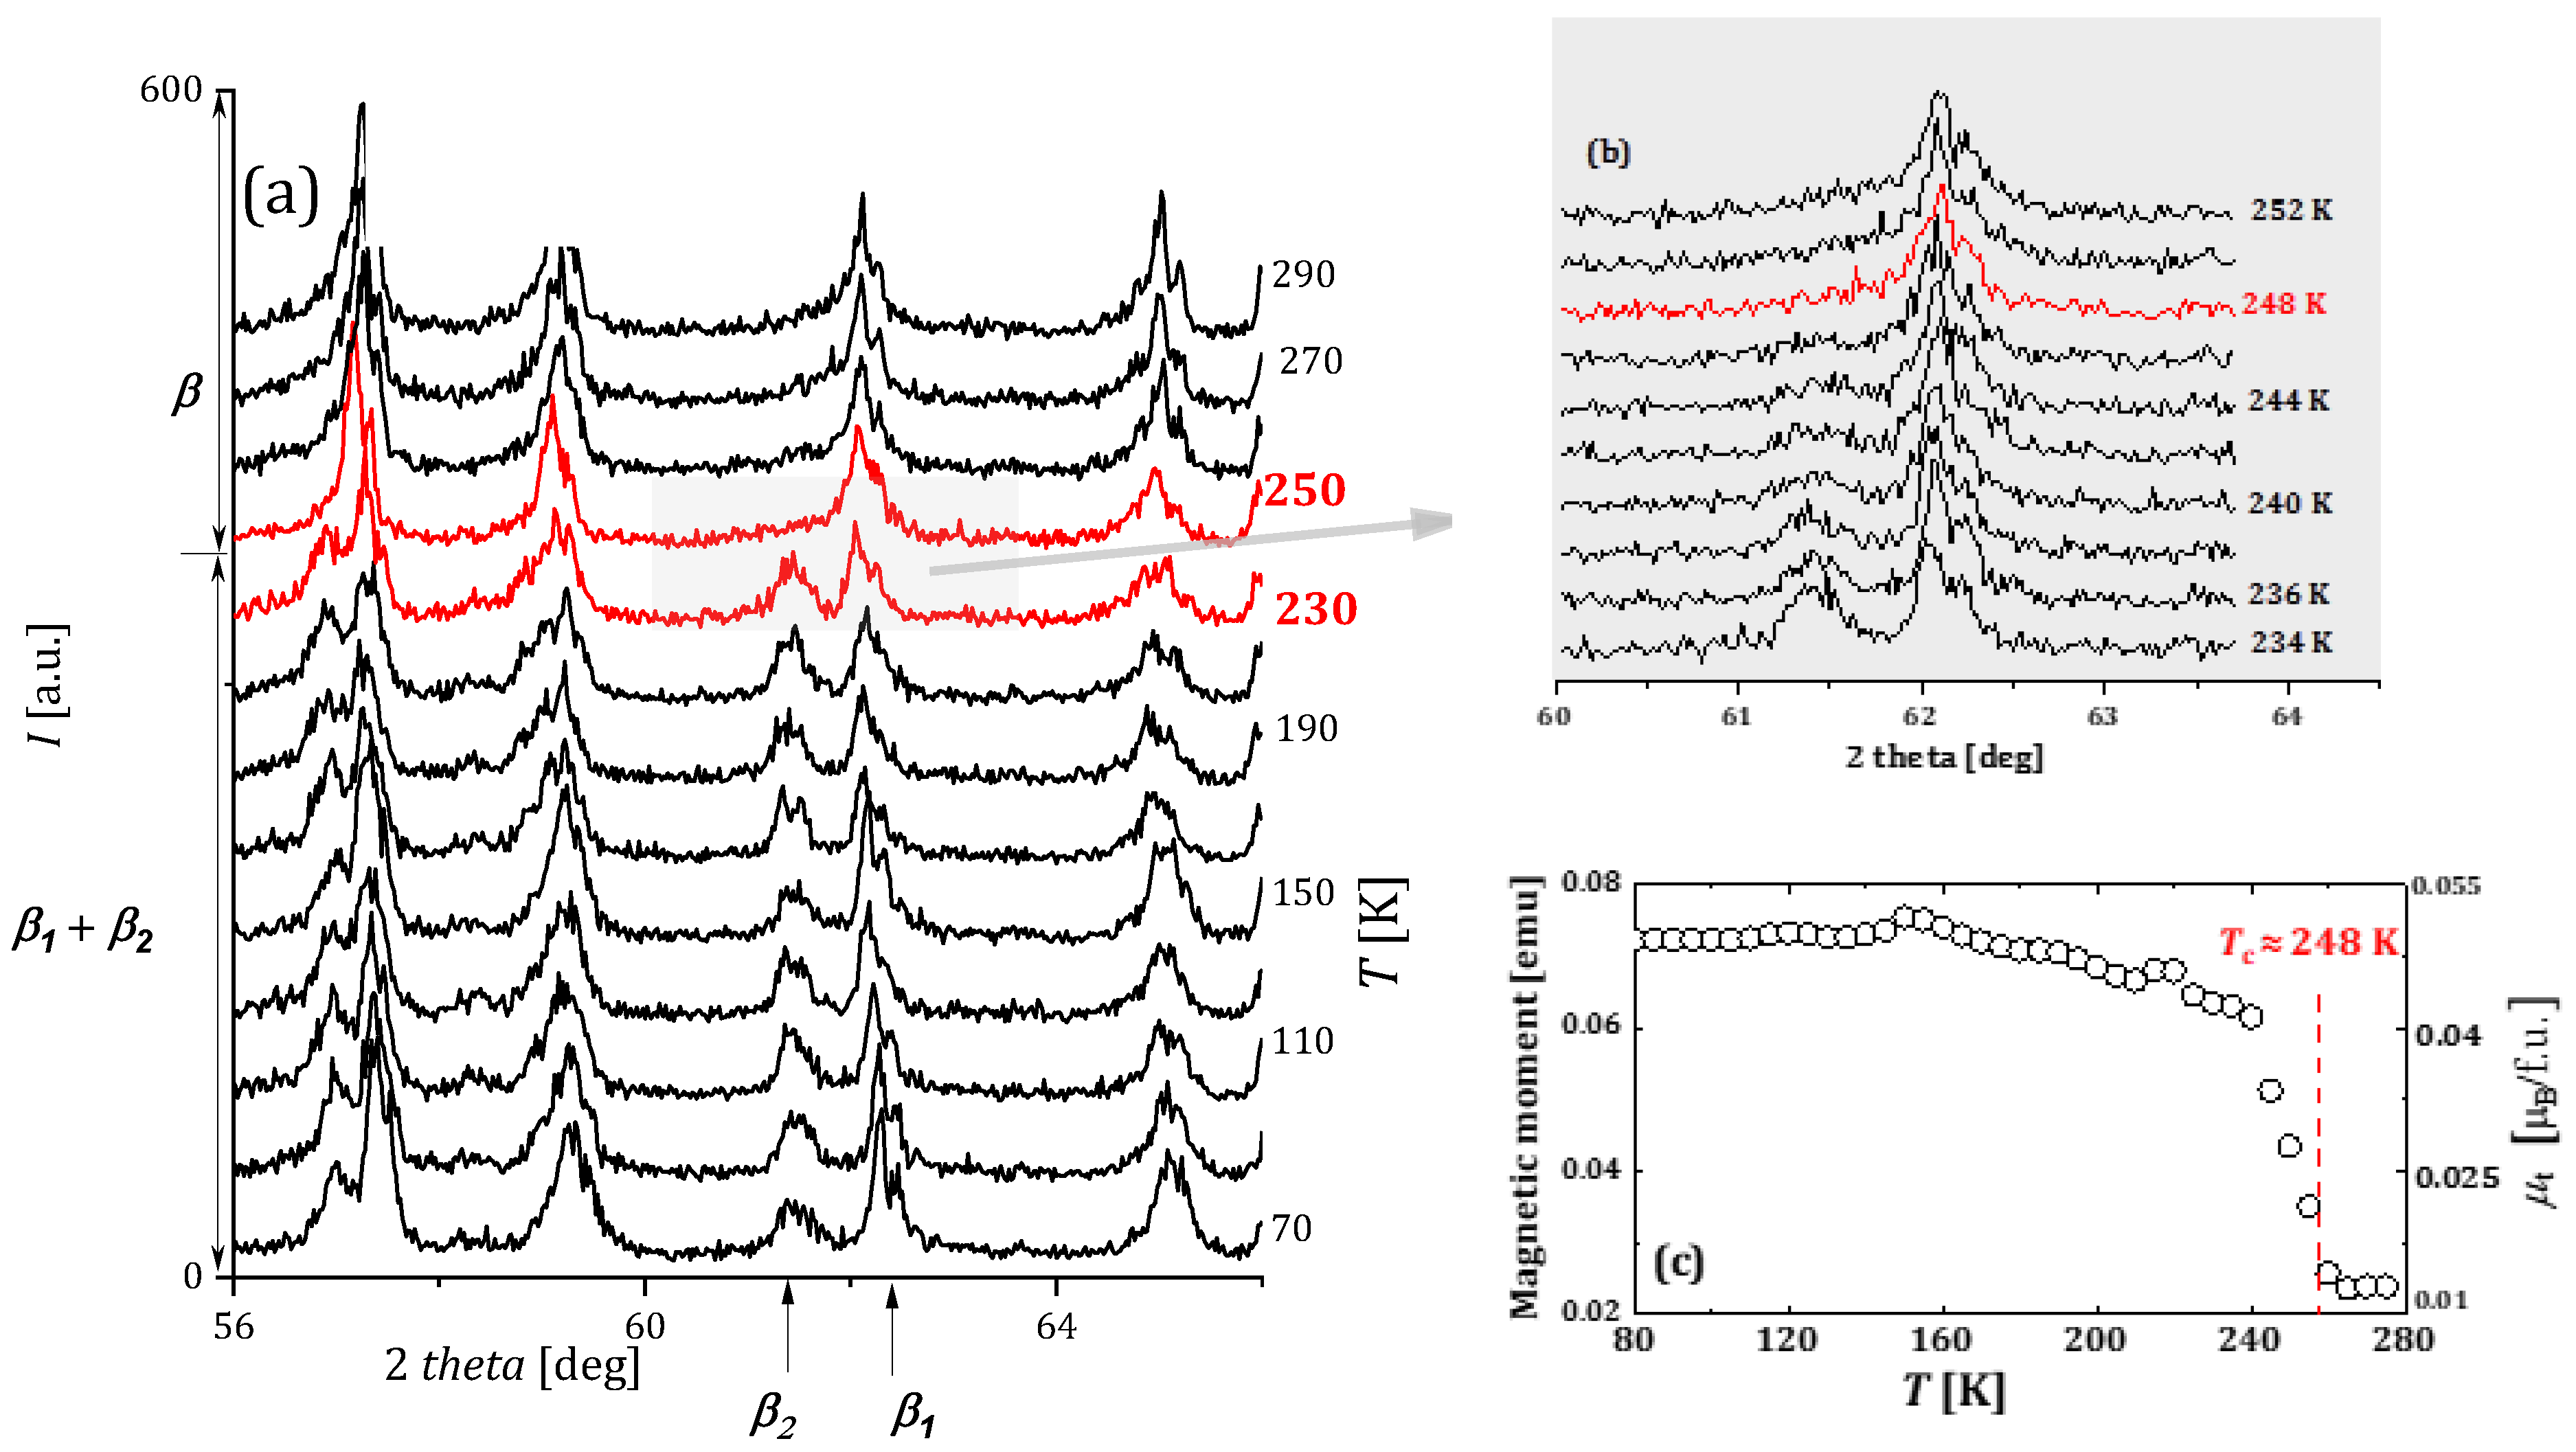
2.3.3. GdMn2Hx
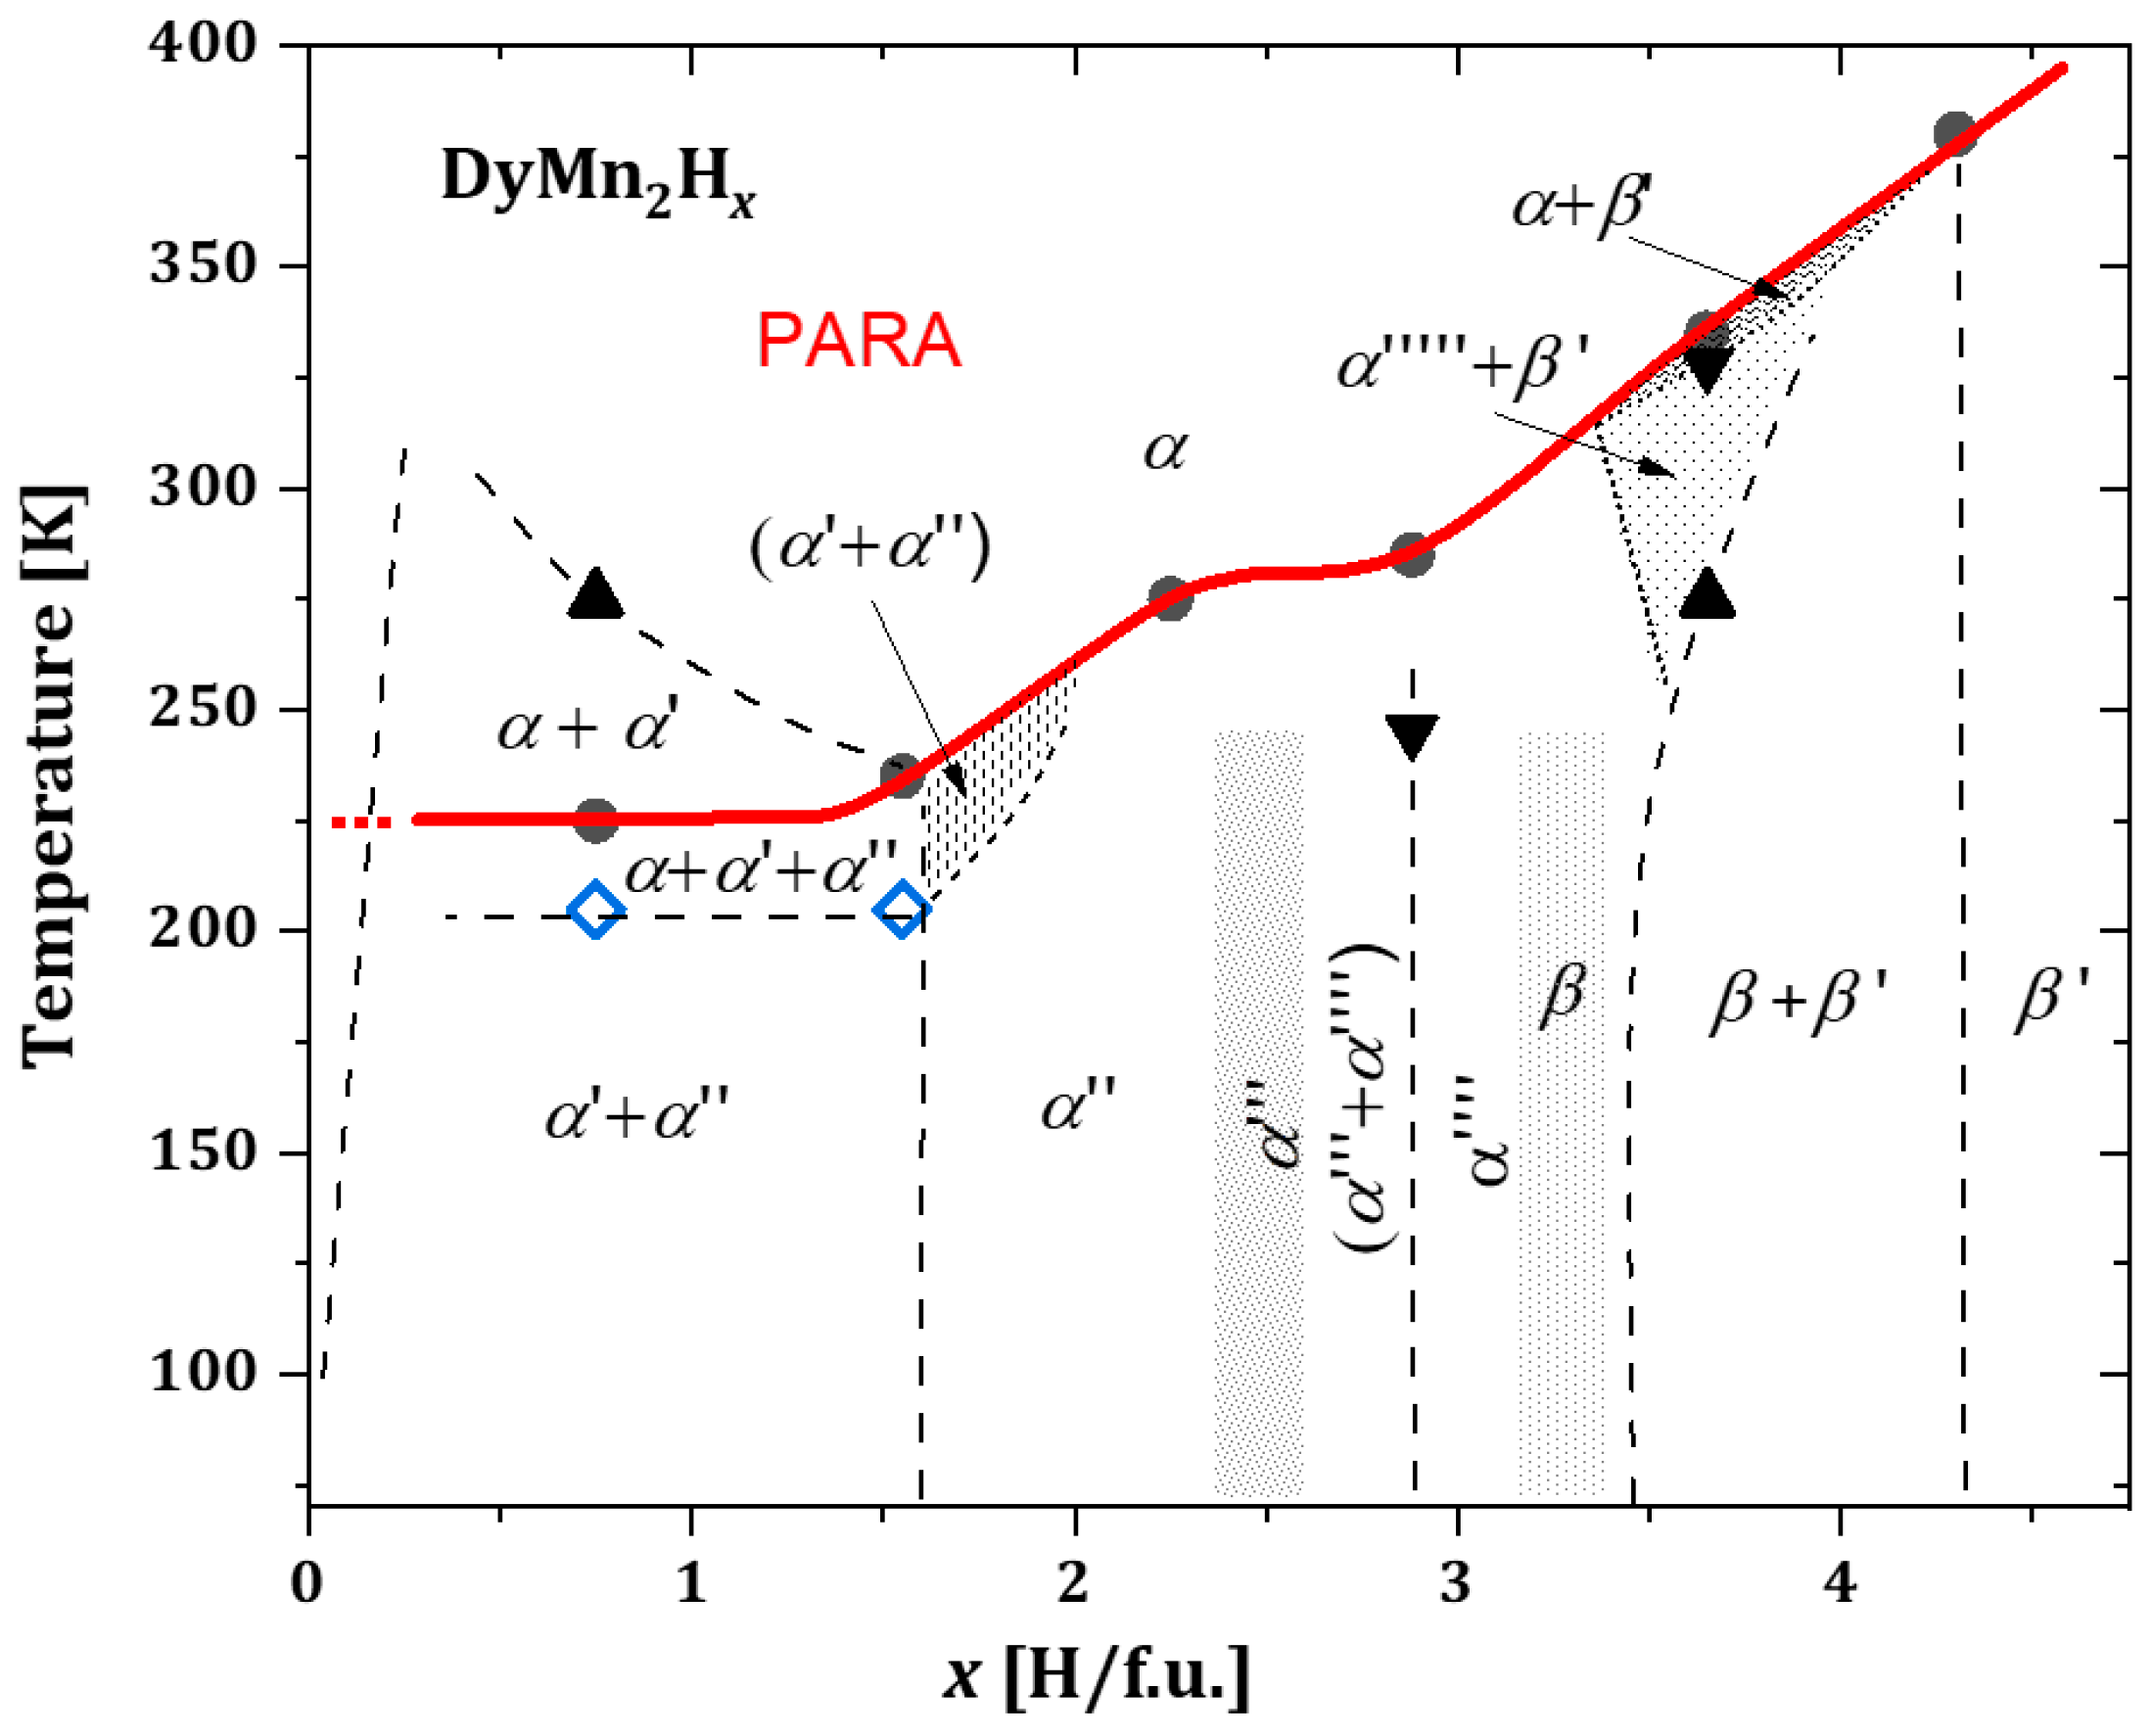
2.3.4. DyMn2Hx
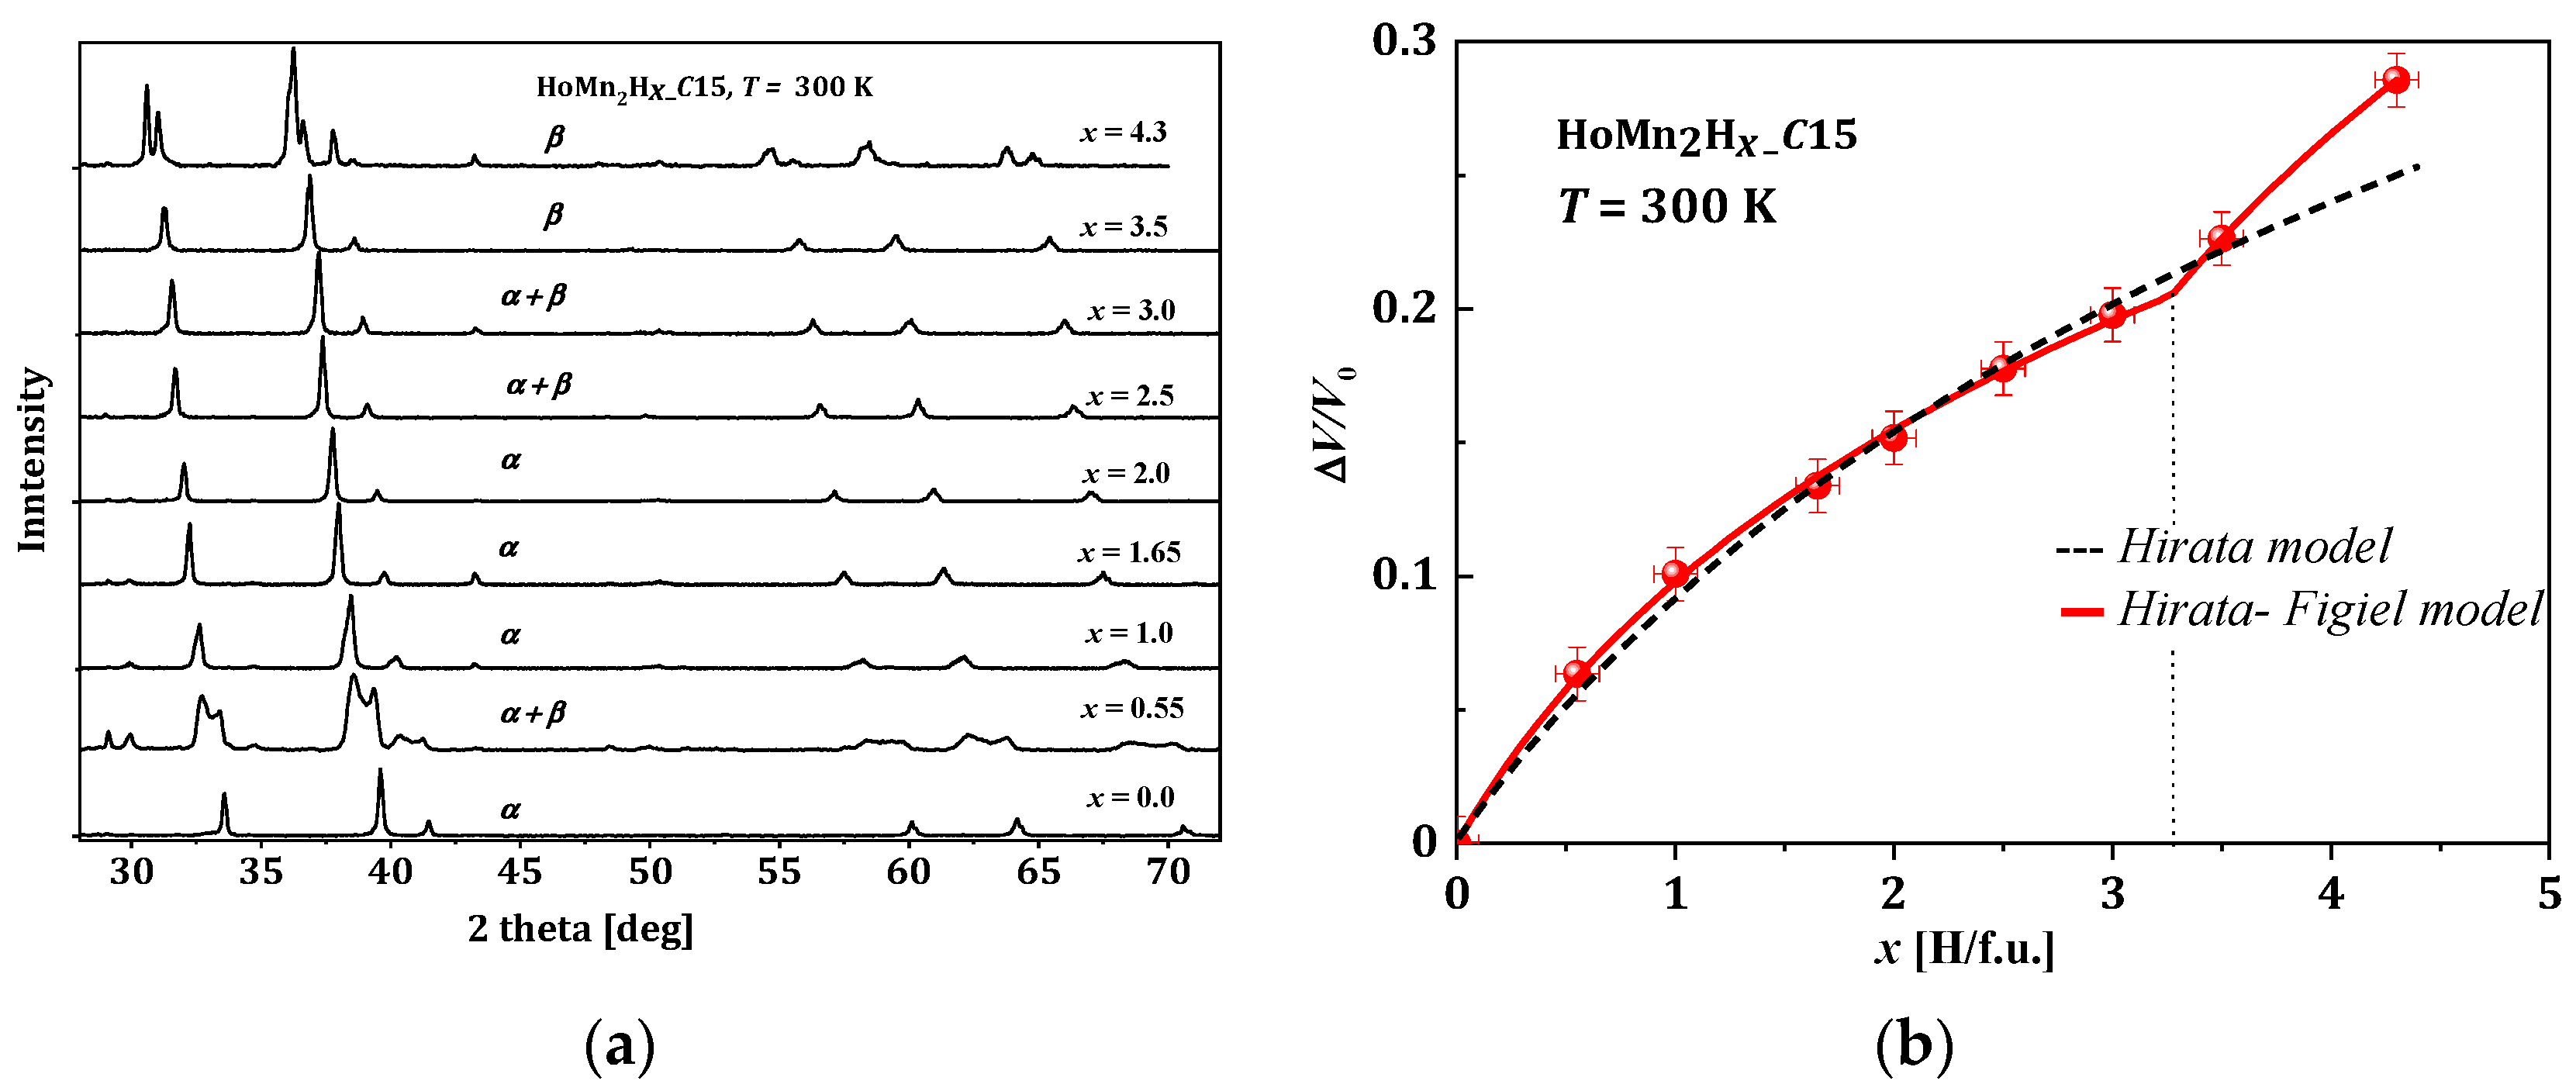
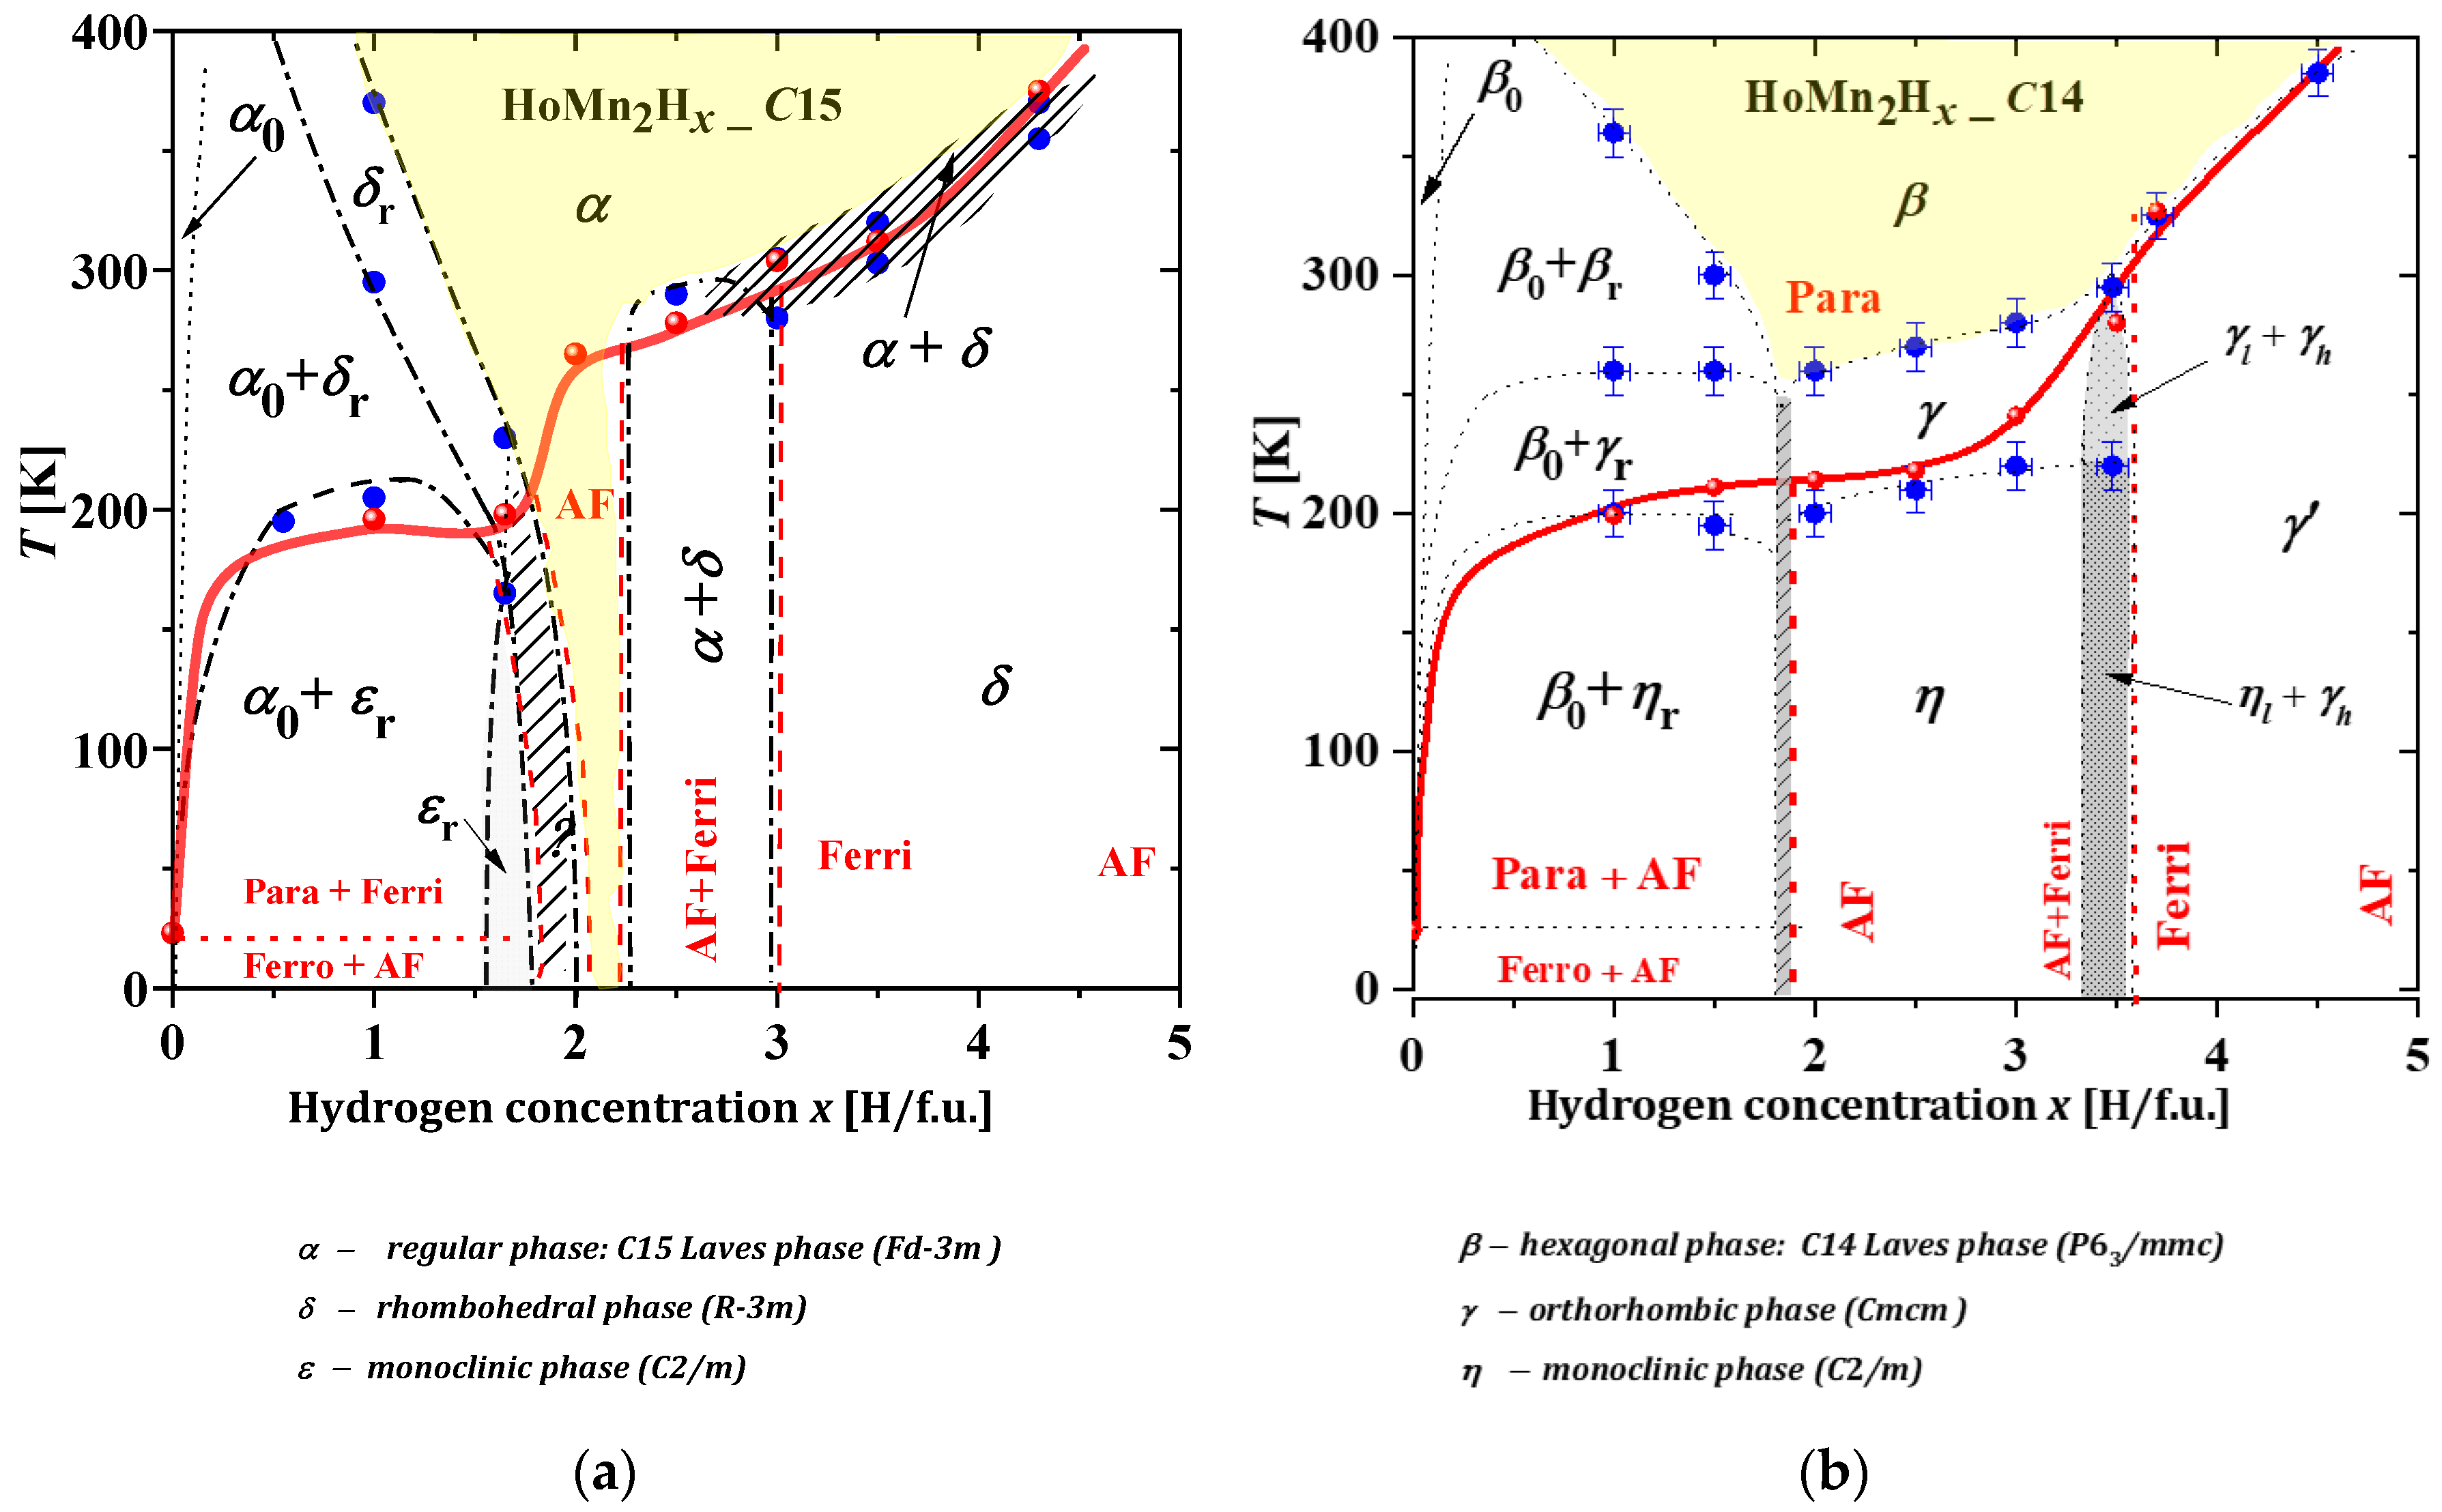
2.3.5. HoMn2Hx_C15 and HoMn2Hx_C14
- x ≲ 2.0. In this area, two phases are observed at the lowest temperatures: “hydrogen-poor” α0 and “hydrogen-rich” εr. The α0 phase is identical to the C15-type phase of the starting compound HoMn2_C15 and contains a negligible amount of dilute hydrogen (x ≈ 0.04 H/f.u.). The εr phase is monoclinic and contains ~1.6 H/f.u. As the temperature increases (above ~200 K), the εr phase undergoes a structural transformation to a rhombohedral δr phase and further, together with the α0 phase, coexists up to the highest temperatures (for x < 0.5 H/f.u.) or transforms to a single rhombohedral δ phase (for 0.5 ≲ x ≲ 1.6) to finally undergo a structural transformation to a regular α phase. For the hydride x = 1.65, no spinodal type decays were observed, only ε → δ → α type transformations at ~230 K and ~250 K, respectively. For higher concentrations of 1.65 ≲ x ≲ 2.0, a multiphase system is expected and noted as a hatched area;
- An area of an exclusively α phase. This is mainly a high-temperature area with the exception of a low-temperature narrow range of 2.0 ≲ x ≲ 2.2 (yellow area);
- An area of 2.2 ≲ x ≲ 2.8, where again a spinodal type decay is observed. The two phases α and δ occur from the lowest to room temperature;
- An area of x ≳ 2.8. The δ phase occurs from the lowest temperatures up to ~(300–360) K, above which it is transformed to the regular α phase through a narrow two-phase region (α + δ).
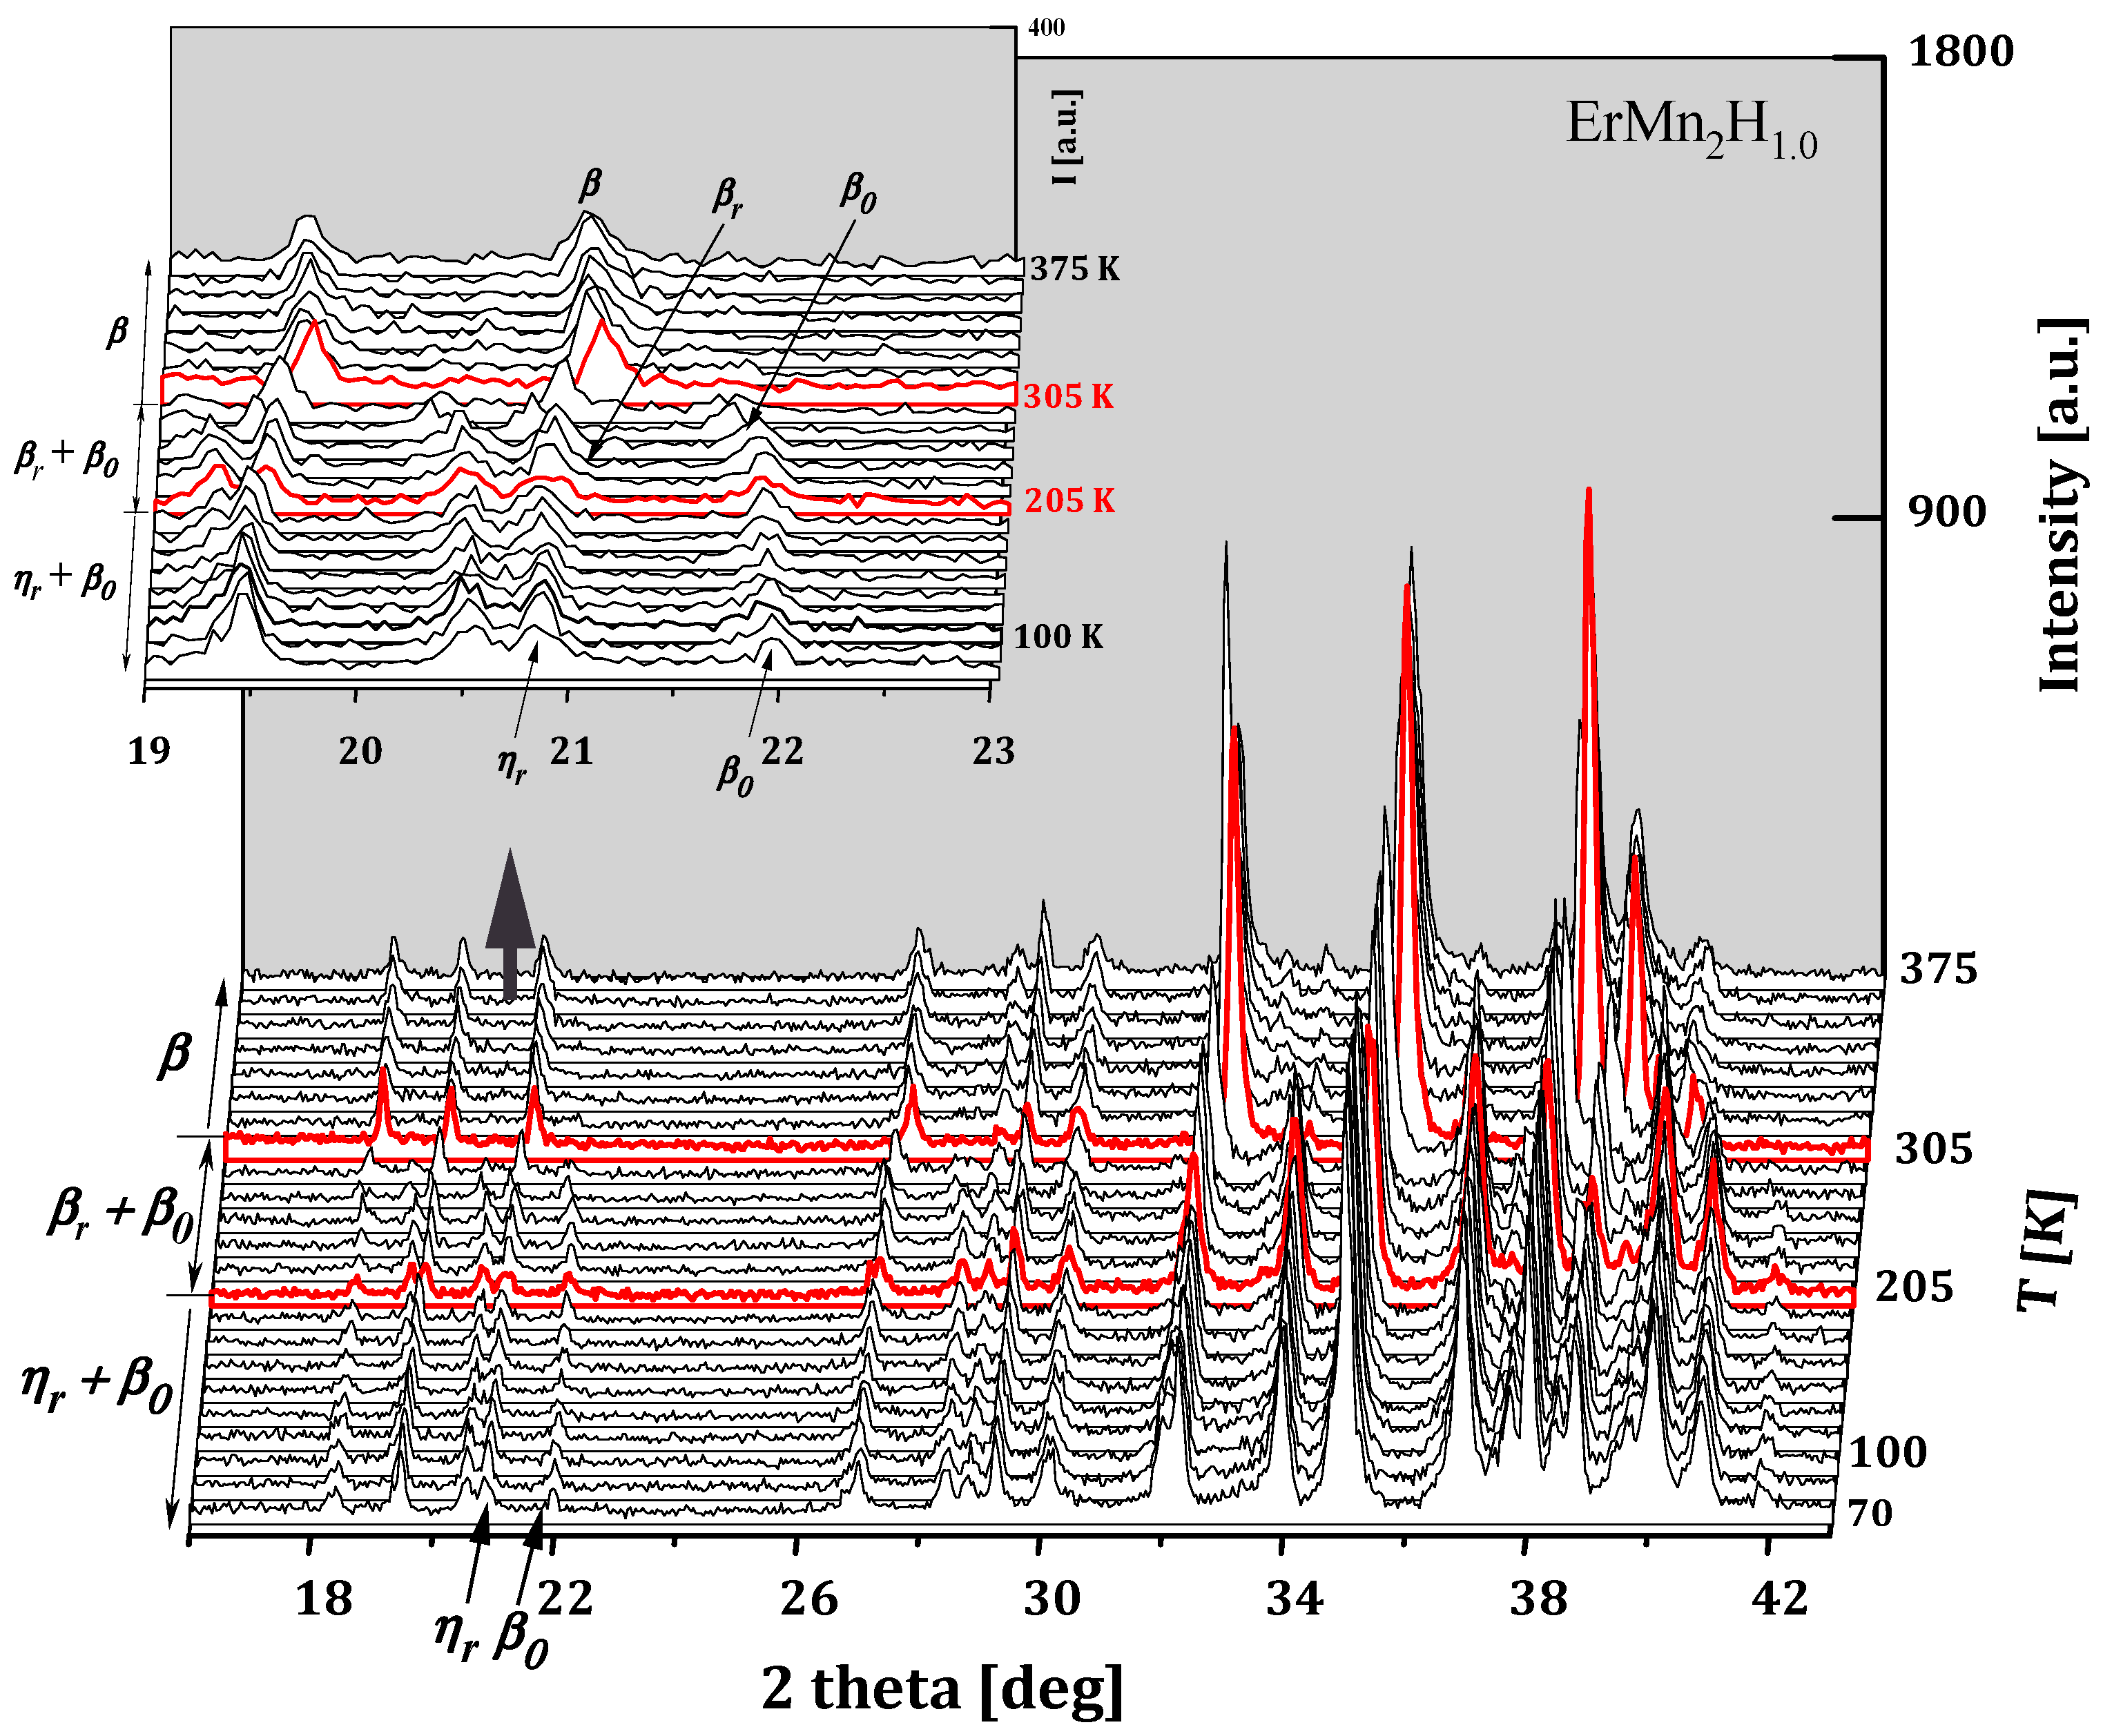
- Area x ≲ 1.8, in which there is the coexistence of a ‘hydrogen-poor’ β0 phase that does not undergo any structural transformation from the lowest temperatures to temperatures ~270–400 K and a ‘hydrogen-rich’ phase in which structural transformations of the type (ηr → γr → βr) are observed. The β0 phase is structurally identical to the C14-type phase, with an estimated hydrogen content of less than 0.05 H/f.u. The ηr, γr and βr phases correspond to the monoclinic, orthorhombic and hexagonal phases, respectively, with an estimated hydrogen content of ~1.8 H/f.u.;
- Area 1.8 ≲ x ≲ 3.4, in which the low-temperature monoclinic phase η is transformed to the high-temperature hexagonal phase β via the orthorhombic phase γ. The temperatures of the structural transformations increase almost linearly with the hydrogen content of the sample;
- Area 3.4 ≲ x ≲ 3.6, covering a narrow x-range, in which spinodal-type decay is again observed. Two phases (ηl and γh) with similar hydrogen contents (~ 3.4 H/f.u. and ~3.55 H/f.u) coexist from the lowest temperatures up to ~200 K, above which a structural transformation of the ηl → γl type occurs (during which time γh undergoes no structural transformation). The spinodal type decomposition (γl +γh) disappears above ~300 K;
- Area x ≳ 3.6, in which the low-temperature γ′ phase transforms to the high-temperature β phase in the temperature range ~(320 ÷ 380) K;
- The high-temperature region of the β phase only (yellow area).
2.3.6. SmMn2H2
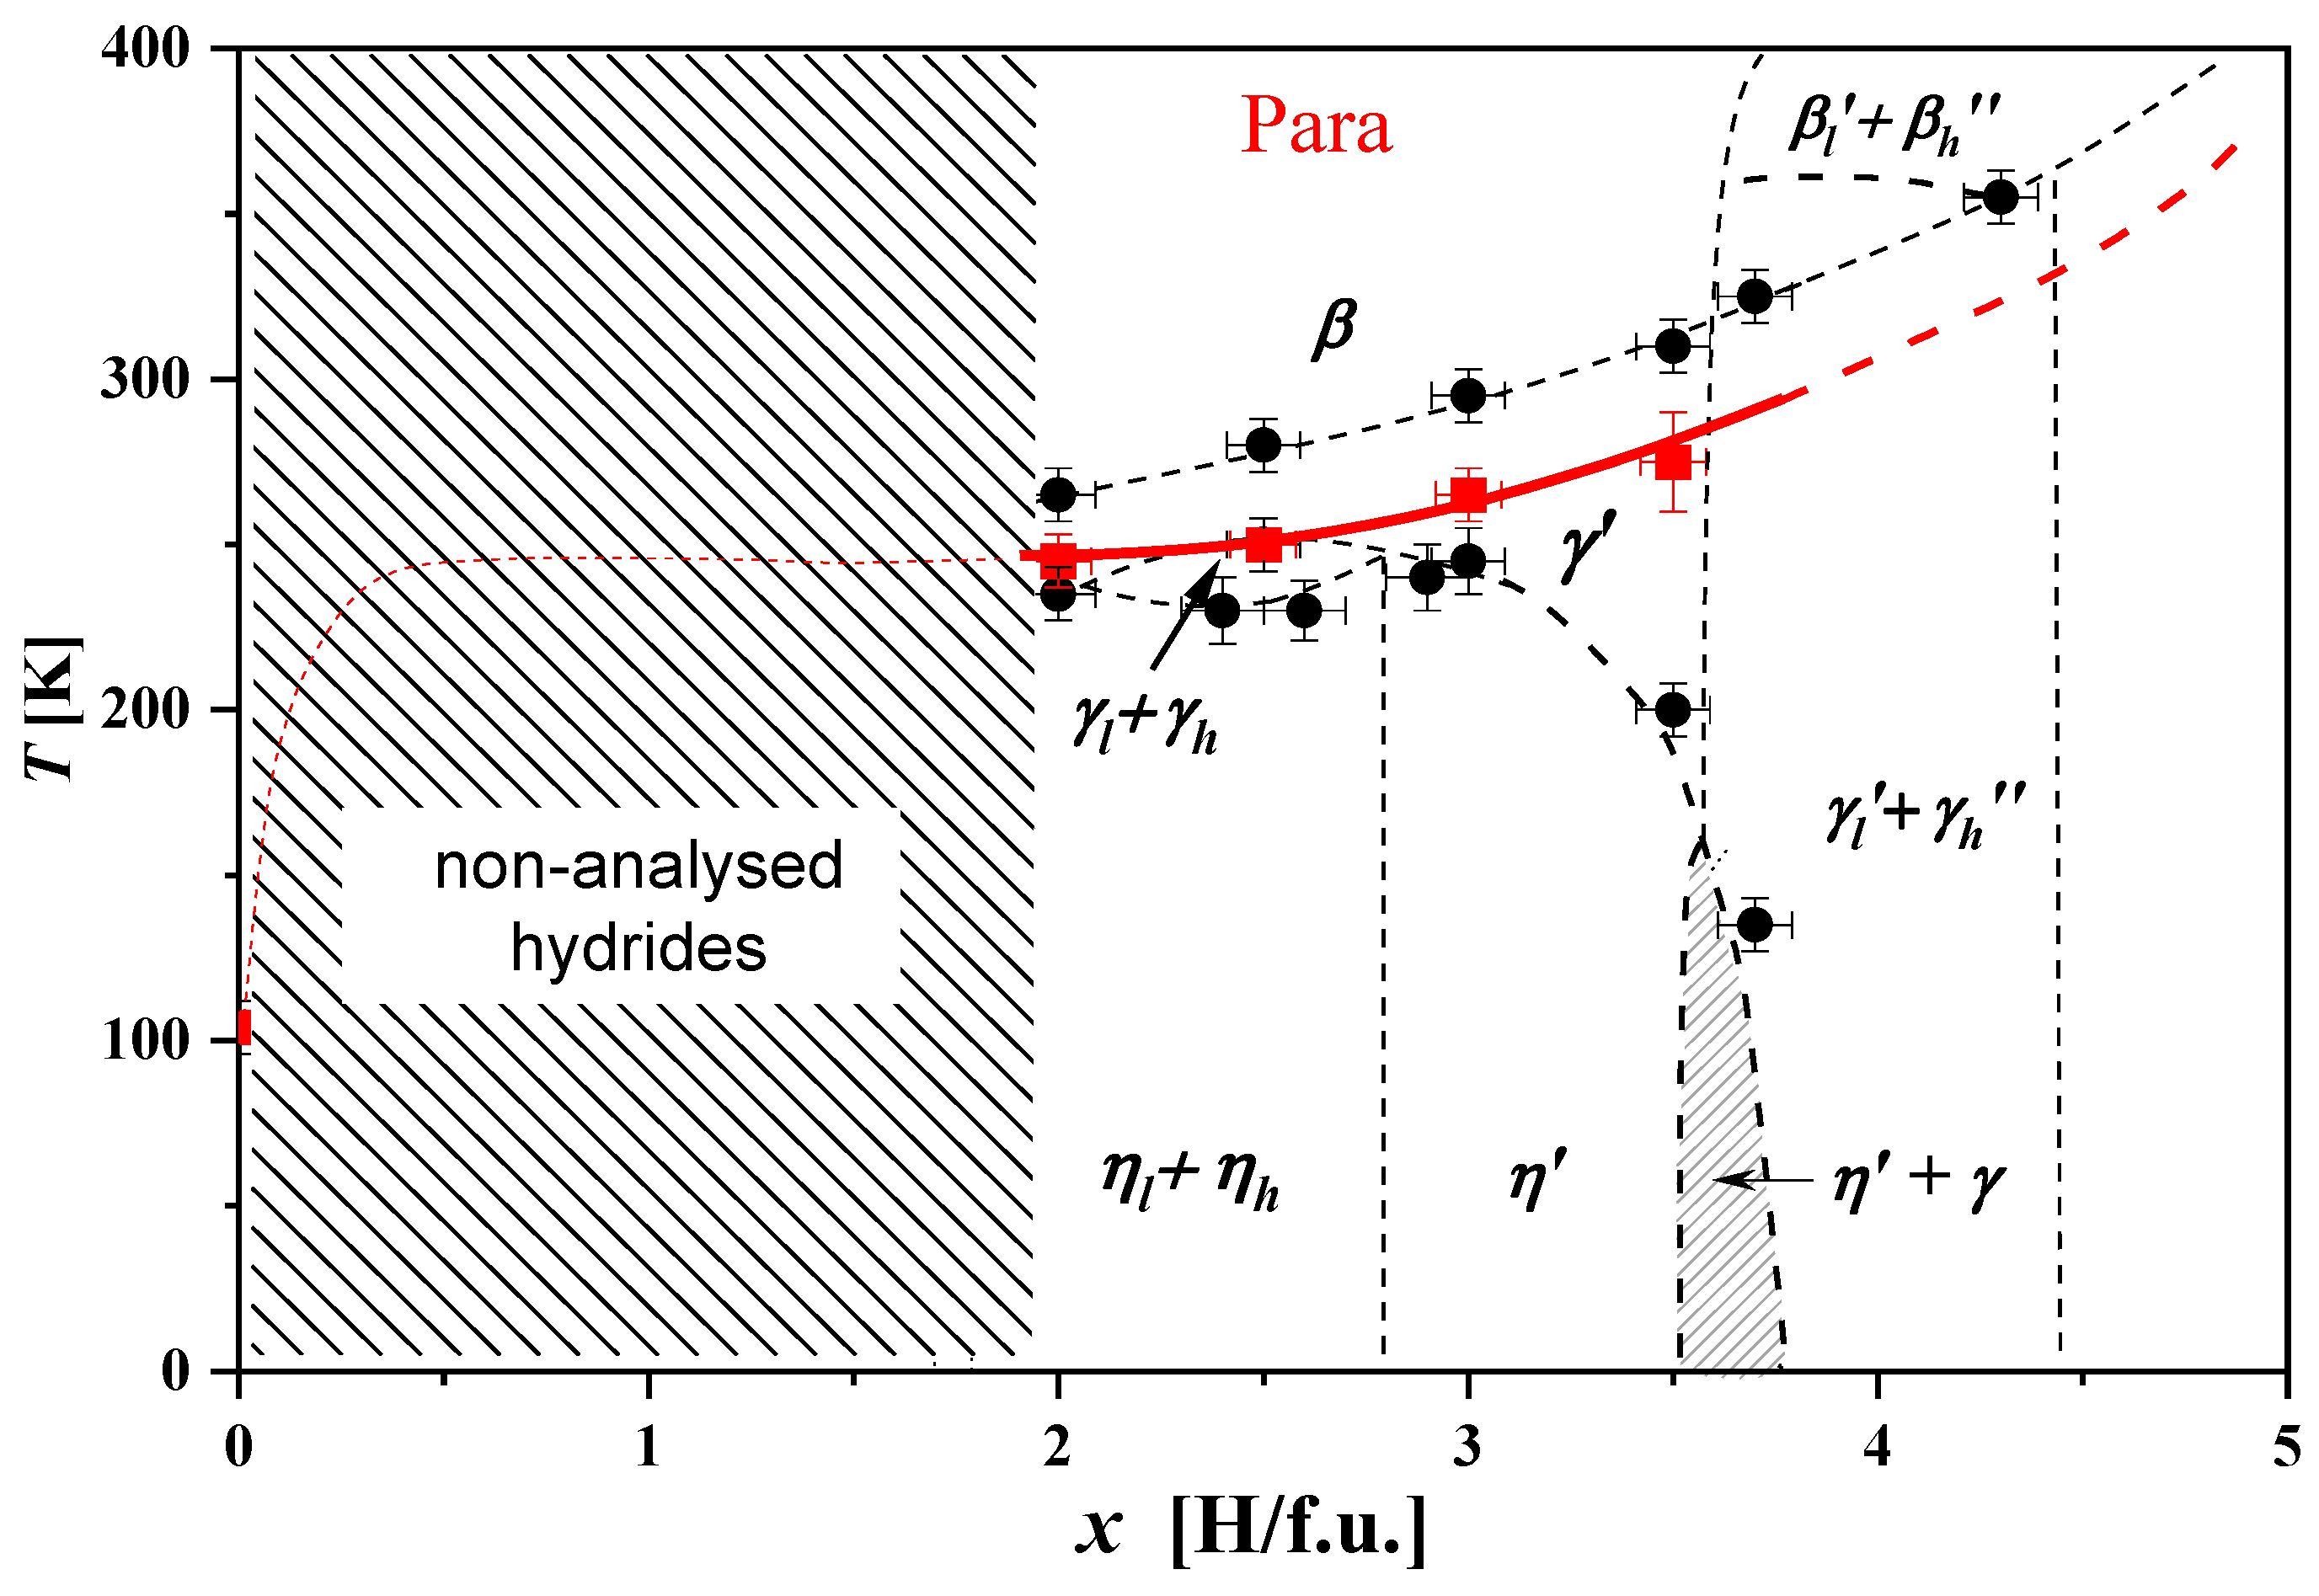
2.3.7. ErMn2Hx
2.3.8. NdMn2Hx
3. Summary
3.1. Structural Changes in RMn2Hx Hydrides
- The phase diagram of GdMn2Hx can be divided into three main areas. In the first area (x ≲ 1.8 H/f.u.), as the temperature decreases, the high-temperature cubic phase decomposes into, initially, three phases with different hydrogen contents. The phase with intermediate hydrogen content quickly disappears as the temperature decreases. The remaining two are clearly segregated into phases: “poor in hydrogen” (x ≲ 0.05 H/f.u.) and “rich in hydrogen” (x ≈ 1.8 H/f.u.). The “hydrogen-poor” phase can be treated as a solid solution of hydrogen in the metal. In the second range, 1.8 ≲ x ≲ 3.2, there is only a cubic phase in the entire temperature range, which is increased in third area.
- The phase diagram of TbMn2Hx is very similar to the hydride diagram of Gd. However, the boundary separating the areas of coexistence of rhombohedral and cubic phases from the highly hydrogenated rhombohedral phase is slightly different.
- In the phase diagram of DyMn2Hx hydrides, below x ≈ 1.6 H/f.u., the same type of phase transformations observed in hydrides with Tb and Gd are noted. However, the middle region (single phase, without structural transformations) narrows (1.6 ≲ x ≲ 2.4). For x ≳ 2.4 H/f.u., additional two-phase regions appear, which are a combination of cubic and rhombohedral phases with different hydrogen contents.
- In hydrides with HoMn2Hx_C14 and C15 and for x ≲ (1.6–1.7) H/f.u., there are, as noted above, spinodal-type decays into two phases “rich and poor in hydrogen” (no “intermediate” phase is observed). However, here the “hydrogen-rich” phase undergoes structural transformations as the temperature increases from the monoclinic through orthorhombic to hexagonal phase.
- Also in ErMn2Hx hydrides, for x ≲ 1.8 H/f.u., there is a decomposition into phases “rich” and “poor” in hydrogen (without the “intermediate” phase). The “hydrogen-rich” phase (as in HoMn2H_C14 hydrides) crystallizes in the monoclinic structure at the lowest temperatures. As the temperature increases, it transforms into the hexagonal phase. The erbium hydride diagram can be described as the alternation of two-phase and single-phase regions as a function of hydrogen content. At low temperatures, only monoclinic phases occur above x ≈ 1.8 H/f.u.
- In the hexagonal hydride SmMn2H2.0, spinodal-type decomposition into two hexagonal phases with slightly different hydrogen contents (~1.9 H/f.u. and ~2.1 H/f.u.) was observed; such a small difference in x concentrations in the area of spinodal decay does not occur for other RMn2Hx.
- The NdMn2Hx phase diagram is filled mainly with two-phase systems, even for x ≈ 4.0 H/f.u., which makes it similar to the erbium hydride diagram in this respect.
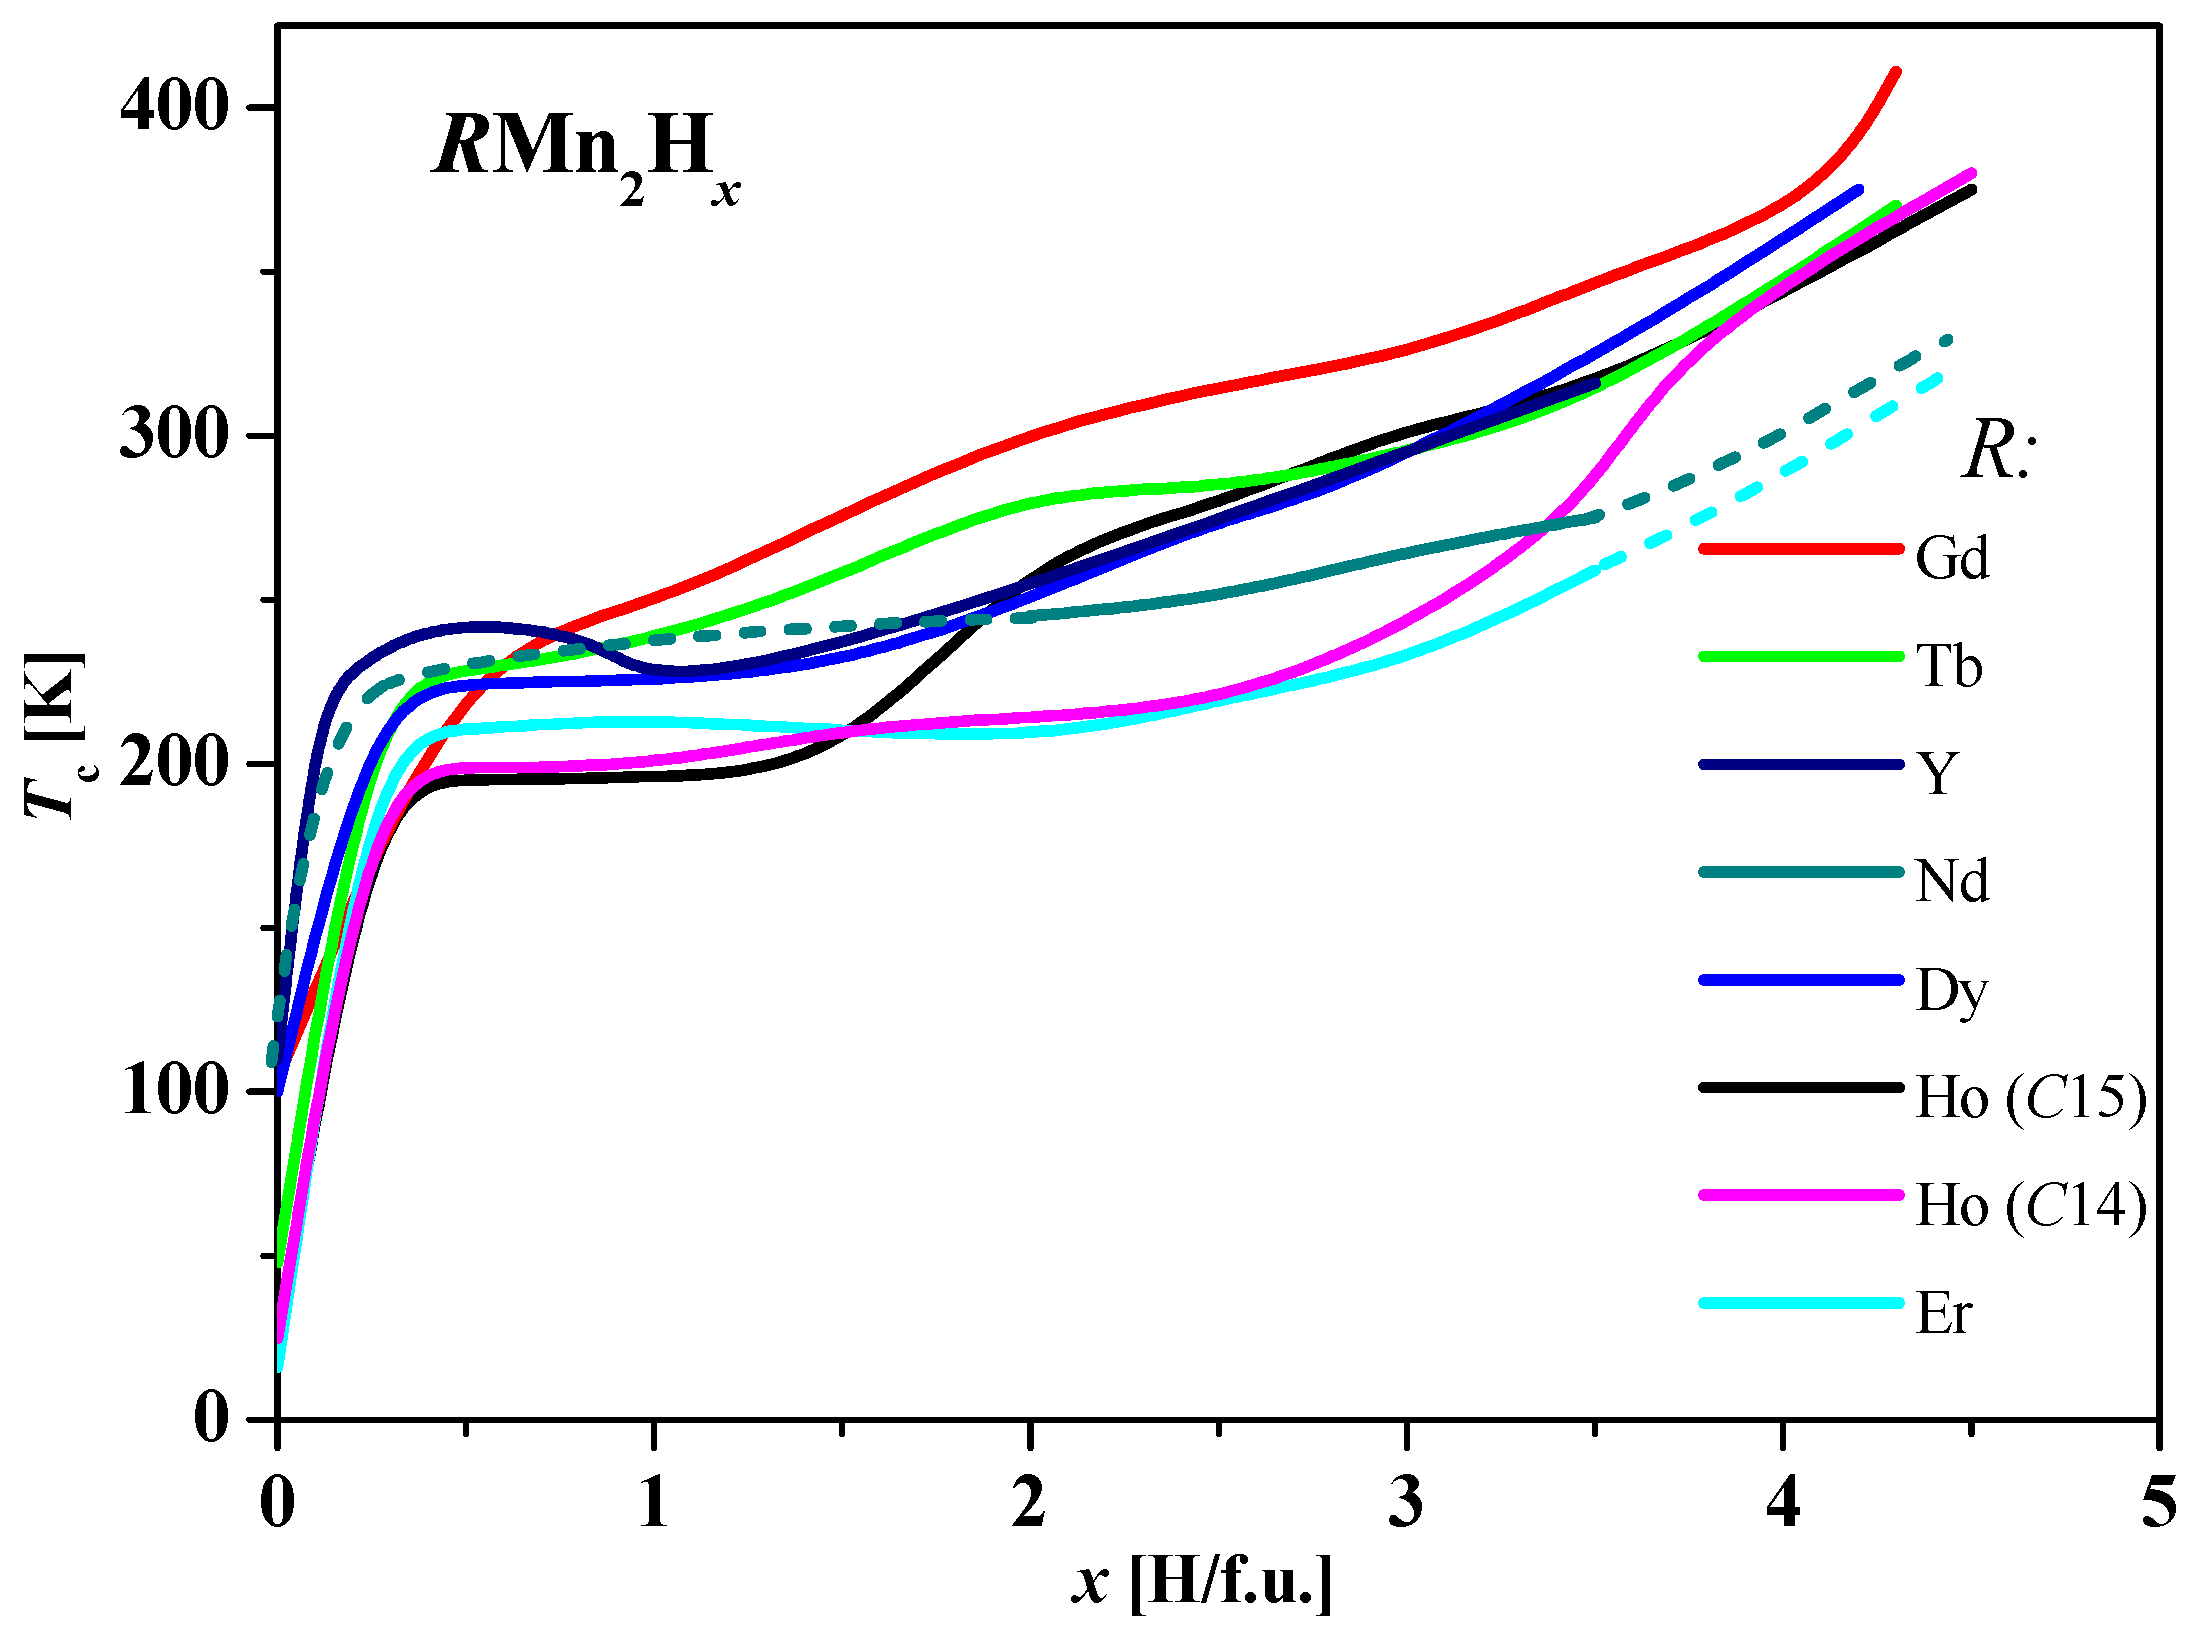
3.2. Magnetic Transformations and Properties
Supplementary Materials
Author Contributions
Funding
Conflicts of Interest
References
- Laves, F. Theory of Alloy Phases; American Society for Metals: Metals Park, OH, USA, 1956; p. 12. [Google Scholar]
- Stein, F.; Palm, M.; Sauthoff, G. Structure and stability of Laves phases. Part I. Critical assessment of factors controlling Laves phase stability. Intermetallics 2004, 12, 713–720. [Google Scholar] [CrossRef]
- Liu, C.T.; Zhu, J.H.; Brady, M.P.; McKamey, C.G.; Pike, L.M. Physical metallurgy and mechanical properties of transition-metal Laves phase alloys. Intermetallics 2000, 8, 1119–1129. [Google Scholar] [CrossRef]
- Stein, F.; Leineweber, A. Laves phases: A review of their functional and structural applications and an improved fundamental understanding of stability and properties. J. Mater. Sci. 2021, 56, 5321–5427. [Google Scholar] [CrossRef]
- YMn2 Crystal Structure, Springer Material. Available online: https://materials.springer.com/isp/crystallographic/docs/sd_0382661 (accessed on 8 October 2023).
- Talik, E.; Kulpa, M.; Winiarski, A.; Mydlarz, T.; Neumann, M. Electronic structure and magnetic properties of HoMn2 single crystals. J. Alloys Compd. 2001, 316, 51–57. [Google Scholar] [CrossRef]
- Budziak, A.; Żurek, M.; Żukrowski, J.; Bałanda, M.; Pacyna, A.; Czapla, M. Influence of hydrogen on structural and magnetic properties of the hexagonal Laves phase HoMn2. J. Magn. Magn. Mater. 2012, 324, 735–741. [Google Scholar] [CrossRef]
- Żukrowski, J.; Figiel, H.; Budziak, A.; Zachariasz, P.; Fisher, G.; Dormann, E. Structural and magnetic transformations in the GdMn2Hx hydrides. J. Magn. Magn. Mater. 2002, 238, 129–139. [Google Scholar] [CrossRef]
- Figiel, H.; Budziak, A.; Żukrowski, J.; Fisher, G.; Kelemen, M.T.; Dormann, E. Structural and magnetic properties of TbMn2Hx hydrides. J. Alloys Compd. 2002, 335, 48–58. [Google Scholar] [CrossRef]
- Nassau, K.; Cherry, L.V.; Wallace, W.E. Intermetallic compounds between lanthanons and transition metals of the first long period: I—Preparation, existence, and structural studies. J. Phys. Chem. Solid 1960, 16, 123–130. [Google Scholar] [CrossRef]
- Wernick, J.H.; Geller, S. Rare-earth compounds with the MgCu2 structure. Trans. Met. Soc. AIME 1960, 218, 866. [Google Scholar]
- Wernick, J.H.; Haszko, S.E. Manganese rare earth compounds with the MgZn2 structure. J. Appl. Phys. 1961, 48, 207–209. [Google Scholar] [CrossRef]
- Hardman, K.; Rhyne, J.J.; Malik, S.; Wallace, W.E. Site magnetization of cubic and hexagonal HoMn2. J. Appl. Phys. 1982, 53, 1944. [Google Scholar] [CrossRef]
- Labroo, S.; Nausahad, A.; Robinson, P. Magnetic properties of RMn2 compounds (R=heavy rare earths). J. Appl. Phys. 1990, 67, 5292–5294. [Google Scholar] [CrossRef]
- Malik, S.K.; Wallace, W.E. Magnetic behavior of cubic Laves phase RMn2 (R = Gd, Dy and Ho) compounds. J. Magn. Magn. Mater. 1981, 24, 23–28. [Google Scholar] [CrossRef]
- Wada, H.; Nakamura, H.; Yoshimura, K.; Shiga, M.; Nakamura, Y. Stability of Mn moments and spin fluctuations in RMn2 (R: Rare earth). J. Magn. Magn. Mat. 1987, 70, 134. [Google Scholar] [CrossRef]
- Shiga, M.; Wada, H.; Nakamura, Y. Magnetism and thermal expansion anomaly of RMn2 (R=Y, Gd, Tb, Ho and Er). J. Magn. Magn. Mat. 1983, 31–34, 119. [Google Scholar] [CrossRef]
- Nakamura, J. Magnetovolume effects in Laves phase intermetallic compounds. J. Magn. Magn. Mat. 1983, 31–34, 829–834. [Google Scholar] [CrossRef]
- Tagawa, Y.; Sakurai, J.; Komura, Y.; Wada, H.; Shiga, M.; Nakamura, Y. X-ray Study of Crystal Distortions in RMn2 Compounds (R: Y, Pr, Nd, Sm and Gd). J. Phys. Soc. Jpn. 1985, 54, 591. [Google Scholar] [CrossRef]
- Shiga, M. Magnetism and spin fluctuations of Laves phase manganese compounds. Phys. B+C 1988, 149, 293–305. [Google Scholar] [CrossRef]
- Gaidukova, I.Y.; Kruglyasher, S.B.; Markosyan, A.S.; Levitin, R.Z.; Pastuschenkov, Y.G.; Snegirev, V.V. Metamagnetism of the manganese subsystem in RMn2 intermetallic compounds. Sov. Phys. JEPT 1983, 57, 1083–1088. [Google Scholar]
- Yoshimura, K.; Shiga, M.; Nakamura, Y. NMR Study of Magnetic State of RMn2 Intermetallic Compounds. II. R=Heavy Rare-Earth. J. Phys. Soc. Jpn. 1986, 55, 3585–3595. [Google Scholar] [CrossRef]
- Makarova, O.L.; Goncharenko, I.N.; Irodova, A.V.; Mirebeau, I.; Suard, E. Interplay of magnetic and hydrogen ordering in the hexagonal Laves hydrides. Phys. Rev B 2002, 66, 104423. [Google Scholar] [CrossRef]
- Felcher, G.P.; Corliss, L.M.; Hastings, J.M. Investigation of the Magnetic Structure of ErMn2, TmMn2, TbNi2 by Neutron Diffraction. J. Appl. Phys. 1965, 36, 1001–1002. [Google Scholar] [CrossRef]
- Ouladdiaf, B.; Ballou, R.; Deportes, J.; Lamaire, R.; Sayet, F. Effects of exchange frustrations in NdMn2. J. Phys. Cond. Matter 1992, 4, 4675–4686. [Google Scholar] [CrossRef]
- Cywinski, R.; Kilcoyne, S.H.; Scott, C.A. Magnetic order and moment stability in YMn2. J. Phys. Cond. Matter 1991, 3, 6473–6488. [Google Scholar] [CrossRef]
- Corliss, L.; Hastings, J. A Neutron Diffraction Investigation of the Magnetic Structure of TbMn2. J. App. Phys. 1964, 35, 1051–1053. [Google Scholar] [CrossRef]
- Brown, P.J.; Ouladdiaf, B.; Ballou, R.; Deportes, J.; Markosyan, A.S. Mn moment instability in the TbMn2 intermetallic compound. J. Phys. Cond. Matter 1992, 4, 1103–1113. [Google Scholar] [CrossRef]
- Ritter, C.; Kilcoyne, S.H.; Cywinski, R. The magnetic structure of DyMn2. J. Phys. Condens. Matter 1991, 3, 727–738. [Google Scholar] [CrossRef]
- Ritter, C.; Cywinski, R.; Kilcoyne, S.H.; Mondal, S. The magnetic structure of HoMn2. J. Phys. Condens. Matter 1992, 4, 1559–1566. [Google Scholar] [CrossRef]
- Ballou, R.; Brown, P.J.; Deportes, J.; Lemaire, R.; Ouladdiaf, B. Exchange frustration and metastability of the magnetic structure of TbMn2. J. Magn. Magn. Mater. 1992, 104–107, 935–936. [Google Scholar] [CrossRef]
- Nakamura, Y.; Shiga, M.; Kawano, S. Antiferromagnetism of YMn2 intermetallic compound. Phys. B+C 1983, 120, 212–215. [Google Scholar] [CrossRef]
- Nakamura, H.; Metoki, N.; Suzuki, S.; Takayanagi, F.; Shiga, M. Helimagnetic structure of YMn2 observed by means of nuclear magnetic resonance and neutron diffraction. J. Phys. Condens Matter 2001, 13, 475–500. [Google Scholar] [CrossRef]
- Deportes, J.; Ouladdiaf, B.; Ziebeck, K.R.A. Thermal dependence of the longitudinal spin fluctuations in YMn2. J. Physigue 1987, 48, 1029–1034. [Google Scholar] [CrossRef]
- Goncharenko, I.N.; Mirebeau, I.; Irodova, A.V.; Suard, E. Magnetic and hydrogen ordering in the frustrated Laves hydrides RMn2 (R = Gd, Tb, Dy, Ho): A neutron-diffraction study. Phys. Rev B 1999, 59, 9324–9331. [Google Scholar] [CrossRef]
- Suwarno, S.; Lototskyy, M.V.; Yartys, V.A. Thermal desorption spectroscopy studies of hydrogen desorption from rare earth metal trihydrides REH3 (RE=Dy, Ho, Er). J. Alloys Compd. 2020, 842, 155530. [Google Scholar] [CrossRef]
- Charraud, J.-B.; Geneste, G.; Torrent, M. Manganese hydrides and superhydrides at high pressure. Phys. Rev. B 2019, 100, 224102. [Google Scholar] [CrossRef]
- Kirchheim, R.; Pundt, A. Hydrogen in Metals. In Physical Metallurgy, 5th ed.; Laughlin, D.E., Hono, K., Eds.; Elsevier: Amsterdam, The Netherlands, 2014; pp. 2597–2705. [Google Scholar] [CrossRef]
- Staliński, B.; Terpiłowski, J. Wodór i wodorki; Wydawnictwa Naukowo–Techniczne: Warszawa, Poland, 1987. [Google Scholar]
- Turnbull, A. 4–Hydrogen diffusion and trapping in metals. In Gaseous Hydrogen Embrittlement of Materials in Energy Technologies; Woodhead Publishing: Cambridge, UK, 2012; pp. 89–128. [Google Scholar] [CrossRef]
- Fukai, Y. The Metal–Hydrogen System: Basic Bulk Properties; Springer Science+Business Media: Berlin/Heidelberg, Germany, 2006. [Google Scholar]
- Skripov, A.V. Hydrogen jump motion in Laves-phase hydrides: Two frequency scales. J. Alloys Compd. 2005, 404–406, 224–229. [Google Scholar] [CrossRef]
- Kehr, K.W. Hydrogen in Metals I–Basic Properties; Alefeld, G., Volkl, J., Eds.; Springer: Berlin/Heidelberg, Germany, 1978. [Google Scholar]
- Graubert, H.; Schrober, H.R. Hydrogen in Metals III—Properties and Applications; Wipf, H., Ed.; Springer: Berlin/Heidelberg, Germany, 1997. [Google Scholar]
- Coey, J.M.D. Interstitial intermetallics. J. Magn. Magn. Mat. 1996, 159, 80–89. [Google Scholar] [CrossRef]
- Zuttel, A. Materials for hydrogen storage. Mater. Today 2003, 6, 24–33. [Google Scholar] [CrossRef]
- Łodziana, Z.; Dębski, A.; Cios, G.G.; Budziak, A. Ternary LaNi4.75M0.25 hydrogen storage alloys: Surface segregation, hydrogen sorption and thermodynamic stability. Int. J. Hydrogen Energy 2019, 44, 1760–1773. [Google Scholar] [CrossRef]
- Fujiwara, K. Effect of Hydrogen Absorption on the Magnetic Properties of Pseudobinary Intermetallics Y(Mn1-xTx)2 (T=Al, Co and Ni). J. Phys. Soc. Jpn. 1988, 57, 2133. [Google Scholar] [CrossRef]
- Somenkov, V.A.; Irodova, A.V. Lattice structure and phase transitions of hydrogen in intermetallic compounds. J. Less–Common Met. 1984, 101, 481–492. [Google Scholar] [CrossRef]
- Figiel, H.; Lindbaum, A.; Kapusta, C.; Gratz, E. Thermal expansion of YMn2Hx compounds. J. Alloys Comp. 1995, 217, 157. [Google Scholar] [CrossRef]
- Figiel, H.; Osuchowski, S.; Paja, A. Unit cell expansion in Laves phase-type compounds caused by interstitial hydrogen. Phys. Stat. Sol(A) 2007, 204, 3286–3290. [Google Scholar] [CrossRef]
- Budziak, A.; Figiel, H.; Żukrowski, J.; Gratz, E.; Ouladdiaf, B. Magnetic ordering in TbMn2D2. J. Phys. Cond. Matt. 2001, 13, L871. [Google Scholar] [CrossRef]
- Switendick, A.C. Band structure calculations for metal hydrogen systems. Z. Phys. Chem. 1979, 117, 89–112. [Google Scholar] [CrossRef]
- Westlake, D.G. Hydrides of intermetallic compounds: A review of stabilities, stoichiometries and preferred hydrogen sites. J. Less–Common Met. 1983, 91, 1–20. [Google Scholar] [CrossRef]
- Żukrowski, J.; Strecker, M.; Wortmann, G.; Przewoźnik, J.; Krop, K. X-ray diffraction and 155Gd-Mössbauer effect study of GdMn2Hx (0≤ x≤ 4.3). J. Alloys Compd. 1997, 261, 47–53. [Google Scholar] [CrossRef]
- Przewoźnik, J.; Żukrowski, J.; Krop, K. Mössbauer effect study of the magnetic ordering in GdMn2Hx. J. Magn. Magn. Mater. 1998, 187, 337–344. [Google Scholar] [CrossRef]
- Shoemaker, D.P.; Shoemaker, C.B. Concerning atomic sites and capacities for hydrogen absorption in the AB2 Friauf-Laves phases. J. Less-Common Met. 1979, 68, 43–58. [Google Scholar] [CrossRef]
- Wang, C.Y.; Paul-Boncour, V.; Kang, C.C.; Liu, R.S.; Filipek, S.M.; Dorogova, M.; Marchuk, I.; Hirata, T.; Percheron-Guegan, A.; Sheu, H.-S.; et al. The novel YMn2D6 deuteride synthesized under high pressure of gaseous deuterium. Solid State Commun. 2004, 130, 815–820. [Google Scholar] [CrossRef]
- Paul-Boncour, V.; Filipek, S.M.; Dorogova, M.; Bouree, F.; Andre, G.; Marchuk, I.; Percheron-Guegan, A.; Liu, R.S. Neutron diffraction study, magnetic properties and thermal stability of YMn2D6 synthesized under high deuterium pressure. J. Sol. State Chem. 2005, 178, 356. [Google Scholar] [CrossRef]
- Paul–Boncour, V.; Filipek, S.M.; Andre, G.; Bourée, F.; Guillot, M.; Wierzbicki, R.; Marchuk, I.; Liu, R.S.; Villeroy, B.; Percheron-Guégan, A.; et al. Structural, thermal and magnetic properties of ErMn2D6 synthesized under high deuterium pressure. J. Phys. Condens. Matter 2006, 18, 6409. [Google Scholar] [CrossRef]
- Paul–Boncour, V.; Filipek, S.M.; Wierzbicki, R.; Andre, G.; Bouree, F.; Guillot, M. Structural and magnetic properties of DyMn2D6 synthesized under high deuterium pressure. J. Phys. Condens. Matter 2009, 21, 016001. [Google Scholar] [CrossRef]
- Figiel, H.; Przewoźnik, J.; Paul–Boncour, V.; Lindbaum, A.; Gratz, E.; Latroche, M.; Escorne, M.; Percheron-Guegan, A.; Mietniowski, P. Hydrogen induced phase transitions in YMn2. J. Alloys Compd. 1998, 274, 29–37. [Google Scholar] [CrossRef]
- Przewoźnik, J.; Żukrowski, J.; Friendl, K.; Japa, E.; Krop, K. Magnetic and structural properties of DyMn2Hx (0≤x≤4.2). J. Alloys Comp. 1999, 284, 31–41. [Google Scholar] [CrossRef]
- Figiel, H.; Budziak, A.; Zachariasz, P.; Żukrowski, J.; Fisher, G.; Dormann, E. Hydrogen induced structural and magnetic transformations in the hexagonal Laves phase ErMn2. J. Alloys Comp. 2004, 368, 260–268. [Google Scholar] [CrossRef]
- Budziak, A.; Zachariasz, P.; Pełka, R.; Figiel, H.; Żukrowski, J.; Woch, M.W. Structural and magnetic transformations in NdMn2Hx hydrides. J. Alloys Comp. 2012, 525, 175–183. [Google Scholar] [CrossRef]
- Budziak, A.; Zachariasz, P.; Kolwicz-Chodak, L.; Figiel, H.; Pacyna, A.; Żukrowski, J. Structural and magnetic properties of C15 HoMn2 hydrides. J. Alloys Comp. 2011, 509, 1347–1354. [Google Scholar] [CrossRef]
- Maehlen, J.P.; Yartys, V.A.; Riabov, A.B.; Budziak, A.; Figiel, H.; Żukrowski, J. Synchrotron X-ray diffraction study of ErMn2D2. J. Alloys Comp. 2007, 437, 140–145. [Google Scholar] [CrossRef]
- Makihara, Y.; Iwata, Y.; Umeda, K.; Miyairi, Y.; Fujii, H. Structural and Hydriding/Dehydriding Properties of HoMn2Hx with Cubic and Hexagonal Laves Phase Structure. MRS Online Proc. Libr. (OPL) 2006, 927, 0927-EE03. [Google Scholar] [CrossRef]
- Hirata, T.; Dorogowa, M.; Filipek, S. The hydrogen concentration dependence of the unit-cell volume in RMn2Hx (R = Y.; Gd, Tb and Dy). Phys. Stat. Sol(A) 2004, 201, 1458–1462. [Google Scholar] [CrossRef]
- Paul–Boncour, V. Comparison of the influence of hydrogen on the magnetic properties of RMn2 and RFe2 Laves phase compounds. J. Alloys Comp. 2004, 367, 185–190. [Google Scholar] [CrossRef]
- Latroche, M.; Paul-Boncour, V.; Percheron-Guegan, A.; Bouree-Vigneron, F. Temperature dependence study of YMn2D4.5 by means of neutron powder diffraction. J. Alloys Comp. 1998, 274, 59–64. [Google Scholar] [CrossRef]
- Latroche, M.; Paul-Boncour, V.; Percheron-Guegan, A.; Bouree-Vigneron, F.; Andre, G. Neutron diffraction study of YMn2D1.15. Physica B 2000, 276–278, 666–667. [Google Scholar] [CrossRef]
- Latroche, M.; Paul-Boncour, V.; Percheron-Guegan, A.; Bouree-Vigneron, F.; André, G. Structural and Magnetic Properties of Low D Content YMn2 Deuteride. J. State Chem. 2000, 154, 398–404. [Google Scholar] [CrossRef]
- Przewoźnik, J.; Latroche, M.; Percheron-Guegan, A.; Paul-Boncour, V. Neutron diffraction study of YMn2Dx deuterides (1 ⩽ x ⩽ 3.4). J. Alloys Comp. 1995, 225, 436. [Google Scholar] [CrossRef]
- Goncharenko, I.N.; Mirebeau, I.; Irodova, A.V.; Suard, E. Interplay of magnetic and hydrogen orders in the laves hydride YMn2H4.3. Phys. Rev. B 1997, 56, 2580. [Google Scholar] [CrossRef]
- Mirebeau, I.; Goncharenko, I.; Irodova, A.V.; Suard, E. Pressure decoupling of a magneto-structural transition in YMn2D4.3. Physica B 1998, 241–243, 672–674. [Google Scholar] [CrossRef]
- Budziak, A.; Bałanda, M.; Figiel, H.; Kolwicz-Chodak, L.; Tarnawski, Z. Structural and magnetic transformations in HoMn2Hx hydrides. Jt. Eur. Magn. Symp.–JEMS 2010 J. Phys. Conf. Ser. 2011, 303, 012010. [Google Scholar] [CrossRef]
- Figiel, H.; Budziak, A.; Żukrowski, J. Hydrogen induced structural and magnetic transformation in the SmMn2H2 compound. Solid State Comm. 1999, 111, 519–524. [Google Scholar] [CrossRef]
- Viccaro, P.J.; Shenoy, G.K.; Niarchos, D.; Dnulap, B.D. 166Er Mössbauer and X-ray diffraction study of ErMn2 hydrides. J. Less–Common Met. 1980, 73, 265. [Google Scholar] [CrossRef]
- Zhu, J.H.; Liu, C.T.; Pike, L.M.; Liaw, P.K. A thermodynamic interpretation of the size-ratio limits for laves phase formation. Metall. Mater. Trans. A 1999, 30, 1449–1452. [Google Scholar] [CrossRef]
- Thoma, D.J.; Perepezko, J.H. A geometric analysis of solubility ranges in Laves phases. J. Alloys Compd. 1995, 224, 330–341. [Google Scholar] [CrossRef]
- Hahn, T. International Tables for Crystallography, 5th ed.; Springer: Dordrecht, The Netherlands, 2002; Volume A. [Google Scholar]
- Available online: https://next-gen.materialsproject.org/materials/mp-1124/ (accessed on 19 September 2023).
- Chojnacki, J. Metalografia Strukturalna; Wydawnictwo “Śląsk”: Katowice, Poland, 1966. [Google Scholar]
- Available online: https://next-gen.materialsproject.org/materials/mp-1038 (accessed on 19 September 2023).


| Laves Phase | Positions of Hydrogen | Number of Sites/f.u. | ||
|---|---|---|---|---|
| A2B2 | AB3 | A2B2 | AB3 | |
| C14 | 24l, 12k, 6h1, 6h2 | 12k, 4f | 12 | 4 |
| C15 | 96g | 32e | ||
| Sample | B0 | b | Xc | P |
|---|---|---|---|---|
| YMn2Hx (300 K) * | 9.24 | 9.63 | 3.25 | 0.77 |
| DyMn2Hx (300 K) * | 7.03 | 9.08 | 3.20 | 0.61 |
| GdMn2Hx (300 K) * | 9.43 | 10.01 | 3.06 | 0.52 |
| TbMn2Hx (300 K) * | 7.78 | 9.36 | 3.15 | 0.56 |
| HoMn2Hx (300 K) * | 6.93 | 8.90 | 3.33 | 0.88 |
| HoMn2Hx_C14, (300 K) ** | 4.7(6) | 13(1) | 3.48(3) | 0.9(1) |
| HoMn2Hx_C14, (75 K) ** | 6.1(2) | 9 (1) | 3.41(3) | 0.8(1) |
| HoMn2Hx_C15, (300 K) *** | 6.0(5) | 10(1) | 3.2(1) | 0.6(1) |
Disclaimer/Publisher’s Note: The statements, opinions and data contained in all publications are solely those of the individual author(s) and contributor(s) and not of MDPI and/or the editor(s). MDPI and/or the editor(s) disclaim responsibility for any injury to people or property resulting from any ideas, methods, instructions or products referred to in the content. |
© 2023 by the authors. Licensee MDPI, Basel, Switzerland. This article is an open access article distributed under the terms and conditions of the Creative Commons Attribution (CC BY) license (https://creativecommons.org/licenses/by/4.0/).
Share and Cite
Budziak, A.; Szafraniec, J. The Influence of Hydrogen on Structural and Magnetic Transformations in RMn2Hx Hydrides with Laves Phase C15 and C14 Structures—A Review. Energies 2023, 16, 7383. https://doi.org/10.3390/en16217383
Budziak A, Szafraniec J. The Influence of Hydrogen on Structural and Magnetic Transformations in RMn2Hx Hydrides with Laves Phase C15 and C14 Structures—A Review. Energies. 2023; 16(21):7383. https://doi.org/10.3390/en16217383
Chicago/Turabian StyleBudziak, Andrzej, and Joanna Szafraniec. 2023. "The Influence of Hydrogen on Structural and Magnetic Transformations in RMn2Hx Hydrides with Laves Phase C15 and C14 Structures—A Review" Energies 16, no. 21: 7383. https://doi.org/10.3390/en16217383
APA StyleBudziak, A., & Szafraniec, J. (2023). The Influence of Hydrogen on Structural and Magnetic Transformations in RMn2Hx Hydrides with Laves Phase C15 and C14 Structures—A Review. Energies, 16(21), 7383. https://doi.org/10.3390/en16217383