Abstract
The development of shale oil often encounters a series of challenges, such as insufficient natural energy, rapid declines in production, and low oil recovery. Given its wide availability and low cost, natural gas serves as an ideal injection medium to enhance shale oil recovery. Based on the foundational data from Chang 7 block X in the Ordos Basin and considering the influence of reservoir stress sensitivity, this study uses numerical simulation methods in conjunction with the random forest algorithm to examine gas flooding in shale oil. This research aims to identify the key factors influencing the effectiveness of natural gas flooding for shale oil and to establish a chart for the adaptive natural gas flooding development boundary. The findings suggest that, for reservoirs with permeability less than 0.2 × 10⁻³ μm2 and oil saturation below 55%, it is advisable to adopt longer fracture lengths during hydraulic fracturing to achieve better development results. After 10 years of gas flooding, continuing the use of this method is not recommended, and adjusting of the development strategy becomes essential. For extended development periods, avoiding long-length fractures is crucial to mitigate gas channeling and ensure the effectiveness of the development process. This study offers theoretical guidance and technical support for developing shale reservoirs with natural gas flooding.
1. Introduction
Currently, the dominant method for primary oil recovery from shale oil is depletion development [1,2,3,4]. However, in the process of shale reservoir development, there are often problems such as insufficient formation energy, low permeability, and rapid production depletion [5]. The primary means of supplementing energy are through water injection and gas injection. Shale reservoirs exhibit poor properties, and water injection development faces challenges such as injection difficulties and low displacement efficiency, resulting in a limited enhanced oil recovery [6,7,8]. Compared to water injection, gas injection causes less damage to the reservoir and has better injectivity, making it more suitable for shale reservoirs [9,10,11]. Research by various scholars indicates that gas injection is the most promising method for enhancing the recovery of shale oil [12,13,14,15]. Pilot tests in the tight oil fields of the United States and Canada highlight the favorable production enhancement effects of gas injection, with an expected increase in cumulative oil production of 10–25% compared to depletion development [16,17].
The injected gas medium typically includes carbon dioxide (CO2), natural gas, and nitrogen (N2) [18,19,20,21]. Several scholars investigated the effects of different gases on enhancing the recovery rates of tight oil and shale oil through experimental research. The results indicated that, under the same conditions, CO2 exhibits the highest oil recovery, followed by CH4, and N2 yields the lowest oil recovery. Numerical simulation studies yield consistent results [22]. Although CO2 has a high solubility in crude oil and a lower miscibility pressure, its gas source and separation costs are relatively high [23,24,25,26]. Nitrogen possesses good expansibility and high elastic energy [27], but it has high miscibility pressure, poor solubility, and limited enhanced oil recovery effects. Natural gas, which is used for gas injection in oilfields, is abundant in supply and has lower costs compared to nitrogen [28,29]. It demonstrates superior solubility and enhanced oil recovery effects, with simplified gas separation processes. Methane has been used in non-miscible gas flooding experiments in the Saskatchewan field, resulting in a significant increase in block production and a reduced decline rate [30]. Natural gas flooding of low-permeability reservoirs in the Zhongyuan Oilfield in China indicates noticeable increases in formation pressure and production rates, yielding significantly enhanced oil recovery effects [31]. Considering the gas source, costs, and recovery rates, natural gas is an ideal injection medium.
During the gas flooding process, reservoir properties such as matrix permeability, fracture conductivity, reservoir heterogeneity, reservoir thickness, gas injection rate, and bottom hole flow pressure play crucial roles in the development effectiveness [11,32]. Li and Li [33] conducted numerical simulation studies to investigate the influence of reservoir heterogeneity on gas flooding development, concluding that the stronger the heterogeneity of the reservoir, the more severe the effects of viscous fingering and gravity segregation. Warner [34] performed gas flooding experiments on different high-permeability layers to simulate the impact of internal heterogeneity on enhanced oil recovery by gas flooding. The findings indicate that in anti-rhythm reservoirs, gas easily enters the high-permeability layers due to overburden effects, resulting in channeling at the top. For positive-rhythm reservoirs, when the high-permeability layer is at the bottom, the combined effects of gravity and overburden lead to a similarly favorable gas flooding effect on the lower permeability layers. Wan [35], through numerical simulation studies, investigated the influence of fracture spacing and fracture conductivity on oil recovery rates, concluding that fracture spacing has a greater impact on the final recovery rate compared to fracture conductivity. Increasing fracture conductivity from 60 × 10−3 μm2·m to 120 × 10−3 μm2·m resulted in a 6% increase in oil recovery, while reducing fracture spacing from 60 m to 30 m led to a 27% increase in oil recovery. Ding [36] conducted oil displacement experiments using fine tubes and long cores and studied the effect of gas injection pressure on the oil displacement efficiency. The results showed that the oil displacement efficiency increased with the increase in gas injection pressure, but the improvement in oil displacement efficiency decreases significantly when the gas breaks through.
In this paper, for typical shale reservoirs, numerical simulation methods, combined with random forest algorithm, are used to clarify the key factors of shale oil development effectiveness by natural gas displacement and established a shale oil development adaptive boundary chart, which provides theoretical guidance and technical support for efficient shale oil development.
2. Numerical Simulation and Methodology
2.1. Reservoir Characteristics
This research block is located in the shale block X of Ordos Basin, China. It is located in the Chang 7 shale formation, belonging to the Triassic formation. Figure 1 shows the local situation map of the well location in block X. The selected area consists of 9 gas injection wells and 4 horizontal production wells. Figure 2 shows the regional lithostratigraphy section of Chang 7 formation in Ordos Basin. The block is to be developed using a five-spot well pattern, with a well spacing of 400 m. Table 1 provides the specific reservoir parameters. The main reservoir layer in the block is at a burial depth of 1959 m, with an original formation pressure of 15.8 MPa and a pressure coefficient of 0.82. The effective thickness of the oil-bearing layer is 8.7 m, with an average porosity of 8.9% and an average permeability of 0.13 × 10⁻³ μm2. The initial oil saturation is 65%.
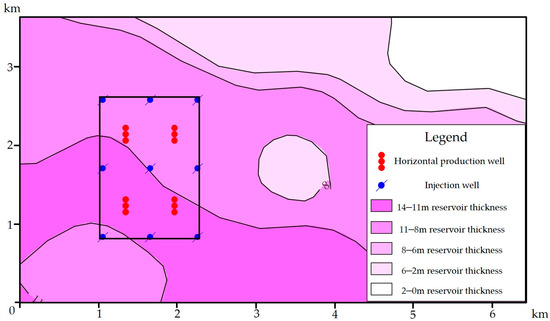
Figure 1.
Local situation map of the well location in block X.
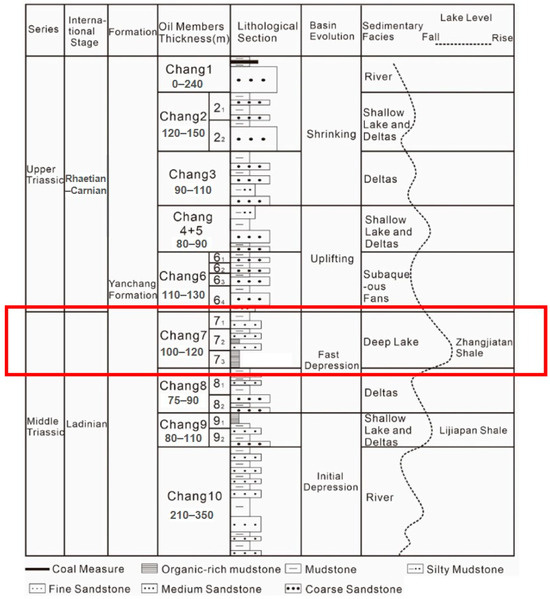
Figure 2.
Lithostratigraphy section of Chang 7 formation in Ordos Basin (modified from [37]).

Table 1.
Reservoir parameters of block X.
2.2. Model Description
2.2.1. Study Area and Grid Division
In light of the reservoir characteristics of block X, the present study employs the GEM module of the CMG2020.10 numerical simulation software to construct a multi-scale fracture model at the reservoir scale, predicated on stress-sensitive zones. In order to make the model more comparative when studying the influence of a certain factor, the model established in this study is a mechanism dual-porosity and dual-permeability model. The reservoir parameters (porosity, etc.) in this model are the average parameters of block X. This model is ideal, but it is more suitable for studying the influence of various parameters on gas injection development of block X. Moreover, the structure of block X is synclinal. However, this model is a part of block X, not the entire region. Therefore, the different surfaces of the model show horizontal trends, rather than high or low trends. Within this framework, the non-fractured domain is delineated as a dual-porosity dual-permeability system, whereas the fractured domain is characterized as a dual-porosity triple-permeability system. This distinction implies that the matrix and natural fractures are accounted for in the non-fractured domain, whilst the matrix, natural fractures, and hydraulic fractures are contemplated in the fractured domain.
Integrating a five-spot well pattern for horizontal wells with an elliptical fracture distribution pattern, the efficiency of gas displacement can be effectively enhanced, gas channeling time can be mitigated, and reservoir energy can be efficiently supplemented. The study probes the developmental impact of shale oil through natural gas injection using this well arrangement, specifically, gas injection in directional wells succeeded by oil extraction from horizontal wells. To reflect the development effect of individual wells and the interaction between well groups, while considering numerical simulation efficiency, a numerical simulation model consisting of four injection-production units is established. The model utilizes a square grid with a size of 25 m × 25 m, resulting in a total of 49 × 73 × 1 grids. Figure 3 shows the permeability distribution of the established model. In order to better study the effect of different parameters on gas injection development, the ideal model is established in this paper. Therefore, its permeability is the average permeability of block X, shown as the same permeability on the graph.
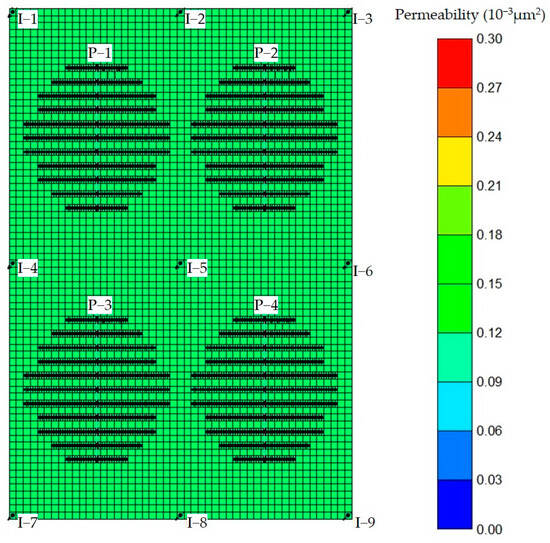
Figure 3.
Permeability distribution of basic model.
The region encompasses four “intact” horizontal wells, one “intact” directional well, and eight “incomplete” directional wells. Considering the boundary effects, the injection rates of the nine directional wells are adjusted based on their respective locations. In this context, the injection rate of the “intact” directional well I–5 functions as the reference injection rate. The injection rates of the four corner wells, I–1, I–3, I–7, and I–9, should be one-fourth of the reference injection rate. The injection rates of the four boundary wells, I–2, I–4, I–6, and I–8, should be half of the reference injection rate. The specific parameter settings of the model are presented in Table 2.

Table 2.
Parameters of simulation model.
2.2.2. Stress Sensitive Model
During reservoir development, formation pressure fluctuations directly impact the pressure within the pore spaces and fracture networks, modulating with fluid injection or production activities. Consequently, these pressure variations influence the reservoir’s permeability, impacting the overall efficiency of hydrocarbon extraction. During gas injection, overly elevated injection pressures can instigate the initiation of microfractures in the proximity of the wellbore, leading to its increased permeability. If the dynamic changes in permeability are not considered in the simulation process, it can result in issues such as excessively high injection pressure, inability to inject gas, excessively small time steps, and non-convergence of calculations.
Geomechanical Parameters
The Chang 7 formation in the Ordos Basin dates back to the Middle Triassic Ladinian and is mainly composed of fine sandstone and mudstone, as shown in Figure 2. During the production phase, the permeability of the reservoir is influenced by various rock mechanical properties, including elastic modulus, Poisson’s ratio, tensile strength, and cohesion. For this investigation, a geomechanical model is established based on the measured data of different lithology rock mechanical properties in the target block (Table 3) to conduct modeling and analysis.

Table 3.
Rock mechanics parameters of Chang 7 reservoir geomechanical model.
Geomechanical Model
In this research, the CMG2020.10 software is employed to establish a geomechanically coupled model, constrained by the block boundaries, as illustrated in Figure 4.
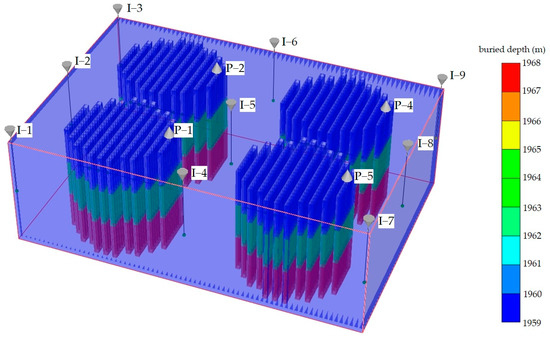
Figure 4.
The establishment of the geomechanical model of the block.
The numerical simulation results considering stress-sensitive characteristics are shown in Figure 5. This model acknowledges the pressure-induced opening of natural fractures in the near-wellbore zone and the partial closure of fractures due to the pressure decline near the production well, resulting in a decrease in permeability. Accounting for these dynamics enables a more precise representation of reservoir property modifications resulting from pressure fluctuations during gas injection operations. Furthermore, it adeptly resolves non-convergence challenges in model computations and enhances computational efficiency.
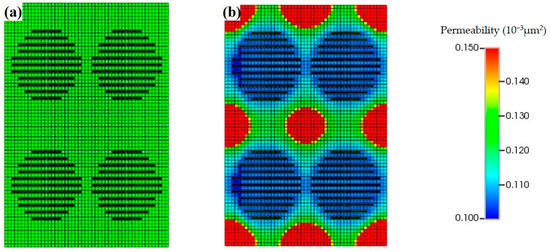
Figure 5.
Grid permeability variation considering reservoir stress-sensitive characteristics. (a) Initial permeability of the model. (b) Grid permeability distribution in 5 years of gas injection development.
2.2.3. Component Characteristics of Crude Oil
Compared to the conventional black oil model, the compositional reservoir simulation model offers a more precise representation of the phase behavior of crude oil under reservoir thermodynamic conditions, as well as the interactions between the injected gas and the crude oil. It serves as the foundation for predicting the effectiveness of gas displacement development. To balance computational efficiency while ensuring simulation accuracy, a pseudo-component division is performed based on the crude oil composition (Table 4). The high content of gaseous hydrocarbons in the oil components is due to the temperature and pressure conditions of the reservoir. The average reservoir pressure is 15.8 MPa, and the average temperature is 58.9 °C. Under the condition of reservoir temperature and pressure, more gaseous hydrocarbons dissolve in the crude oil and remain stable. There is no degassing of crude oil. In this study, the Winprop module integrated within the Computer Modeling Group (CMG) software suite is utilized to subdivide the crude oil into seven pseudo-components, as shown in Table 5. This partitioning strategy facilitates a compromise between the requisites of simulation accuracy and computational feasibility.

Table 4.
The composition of crude oil.

Table 5.
Result of crude oil pseudo-component classification.
Figure 6 compares the P-T phase diagrams calculated by the crude oil composition and pseudo-component. At a reservoir temperature of 58.9 °C, the corresponding saturation pressures are 9.07 MPa and 9.10 MPa, respectively. These values are very close to the actual saturation pressure of 9.09 MPa for block X (the blue dot in Figure 6 represents the X block condition, and the dotted line indicates the temperature and pressure at the blue point). The saturation pressure error of the pseudo-component calculation is 0.11%, demonstrating the rationality of the pseudo-component division.
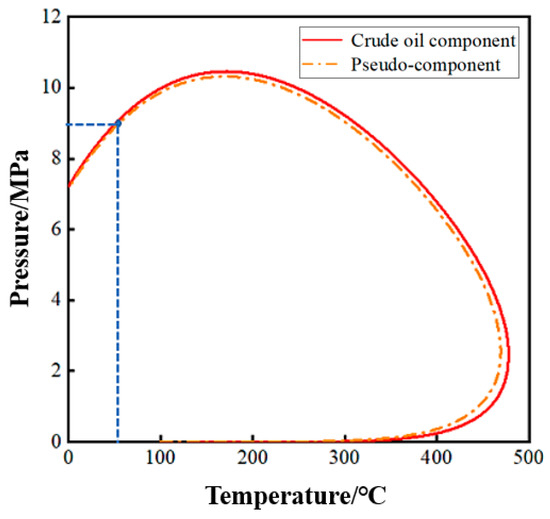
Figure 6.
The P-T phase diagram of crude oil component and pseudo-component.
2.2.4. Curves of Relative Permeability
Figure 7 shows the water–oil relative permeability curves and liquid–gas relative permeability curves of block X, which are used in this study.
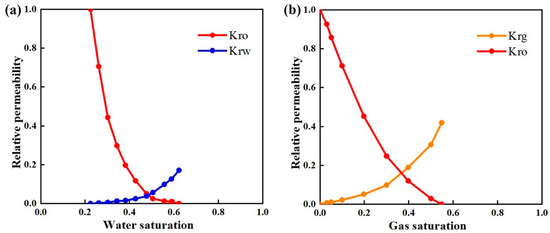
Figure 7.
Curves of relative permeability. (a) Oil–water relative permeability curve. (b) Oil–gas relative permeability curve (considering irreducible water).
3. Results and Discussion
3.1. Effectiveness of Natural Gas Flooding
3.1.1. Water Flooding vs. Natural Gas Flooding
An evaluation of the efficacy of three reservoir development strategies—depletion, water flooding, and natural gas flooding—is undertaken. Initially, the reservoir underwent a one-year depletion phase, subsequent to which either water flooding or natural gas flooding is implemented. During the simulation procedure, the pore volume (PV) of the injected gas and water is precisely controlled to be approximately equivalent. The maximum gas injection volume at surface conditions is 4000 m3, and the maximum water injection volume is 16 m3. The maximum bottomhole injection pressure is set at 30 MPa to avoid fracturing the formation.
Figure 8 compares the development effectiveness of depletion, water flooding, and natural gas flooding. After 10 years of depletion, the cumulative oil recovery is 8.98%. Oil production declines rapidly after one year of depletion, indicating the rapid depletion of reservoir energy. Energy replenishment is necessary to meet the demands of industrial production. After 10 years of water flooding, the cumulative oil recovery is 21.94%. The oil production stabilizes at around 8.5 m3/d after water injection, and the reservoir energy is partially replenished. After 10 years of gas flooding, the cumulative oil recovery reaches 27.42%. Both the individual well oil production and the replenishment of reservoir energy are superior to water flooding throughout the development period. The distribution of remaining oil saturation after 10 years of development (Figure 9) shows that gas flooding results in a more concentrated distribution of remaining oil with lower oil saturation. In conclusion, after one year of depletion, oil production declines rapidly, necessitating energy replenishment. Gas flooding for 10 years achieves a 5.48% higher cumulative oil recovery compared to water flooding.
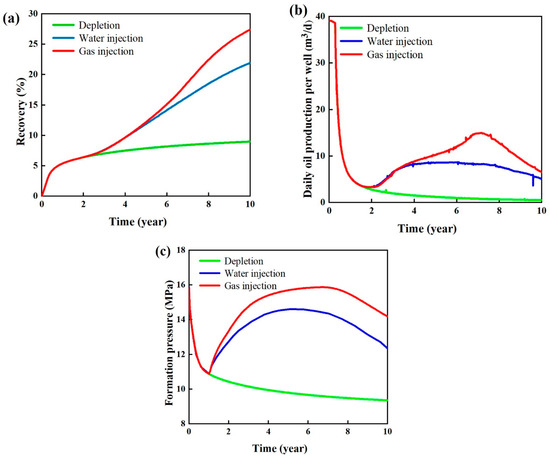
Figure 8.
Simulation results of different development methods. (a) Recovery. (b) Daily oil production per well. (c) Formation pressure.
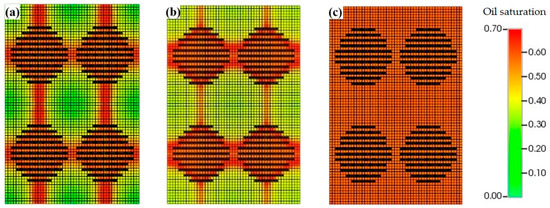
Figure 9.
Distribution of remaining oil saturation in different development methods. (a) Gas injection. (b) Water injection. (c) Depletion.
3.1.2. Effectiveness of Different Gas Injection Methods
In evaluating the comparative efficacy of three distinct gas injection methodologies within a fixed total gas injection volume—namely, horizontal well five-spot gas flooding, horizontal well gas huff-n-puff, and horizontal well in situ inter-fracture gas injection and production—the reservoir is initially subjected to a one-year depletion phase, followed by the application of the respective enhanced oil recovery technique. For the horizontal well gas huff-n-puff method, the injection and soaking phases are each designed to span one month, whereas the production phase is extended to a four-month duration. The daily gas injection rate for gas flooding and inter-fracture gas injection and production is 4000 m3/d, while the daily gas injection rate during the huff-n-puff injection period is 24,000 m3/d.
The simulation results for the different gas injection methods are shown in Figure 10. In the early stages of development, inter-fracture gas injection and production exhibits the highest cumulative oil recovery, followed by gas flooding and gas huff-n-puff. The inter-fracture gas injection and production method converts inter-well displacement to inter-fracture displacement, resulting in faster effectiveness and higher cumulative oil recovery in the early stages of development [38,39,40]. However, this method also has limitations as gas channeling between injection and production fractures is more likely to occur due to the reduced distance. Gas huff-n-puff shows a gradual decline in effectiveness after multiple cycles and has the poorest overall development performance. Gas flooding demonstrates the best energy replenishment effect and maintains the highest reservoir pressure among the three gas injection methods. Although its production in the early stages is lower than that of inter-fracture gas injection and production, the overall production remains at a higher level throughout the development period. When assessing both short-term and long-term reservoir development efficacies, gas flooding emerges as the most promising strategy for increasing recovery factors.
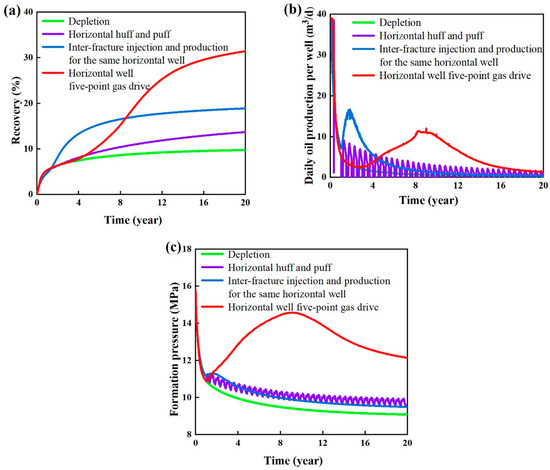
Figure 10.
Simulation results of different gas injection methods. (a) Recovery. (b) Daily oil production per well. (c) Formation pressure.
3.2. Analysis of Influencing Parameters on Shale Oil Development with Natural Gas Flooding
3.2.1. Reservoir Physical Property
Matrix Permeability
To study the impact of matrix permeability on the effectiveness of shale oil development with gas displacement, this study adopted seven different matrix permeabilities: 0.01 × 10⁻³ μm2, 0.02 × 10⁻³ μm2, 0.05 × 10⁻³ μm2, 0.1 × 10⁻³ μm2, 0.2 × 10⁻³ μm2, 0.5 × 10⁻³ μm2, and 1 × 10⁻³ μm2. Due to the low permeability of shale reservoirs, it is generally 0.01–1 × 10⁻³ μm2. In addition, different permeability values of the same order of magnitude exhibit little difference in reservoir development. In order to highlight the difference of development effect between different permeability values, only these permeability values are selected as the matrix permeability research objects in this study. The effects of these permeabilities are compared with the performance of depletion development. Other reservoir parameters, such as fluid properties, fracturing, and injection-production parameters, are kept consistent when studying the impact of matrix permeability on development effectiveness.
Figure 11 illustrates the performance of gas flooding across varying matrix permeabilities. In the initial phase of reservoir development, a positive correlation is observed between the cumulative oil recovery and increasing matrix permeability, resulting in noticeable disparities in cumulative recovery among the different permeability strata. In the mid-term of development (5–10 years), the difference in cumulative recovery among different matrix permeabilities reaches its peak, with the most significant variation observed at 0.2 × 10⁻³ μm2. In the late stages of development, the difference in cumulative recovery among different matrix permeabilities gradually diminishes, and the final cumulative recovery becomes very similar between 0.5 × 10⁻³ μm2 and 1 × 10⁻³ μm2.
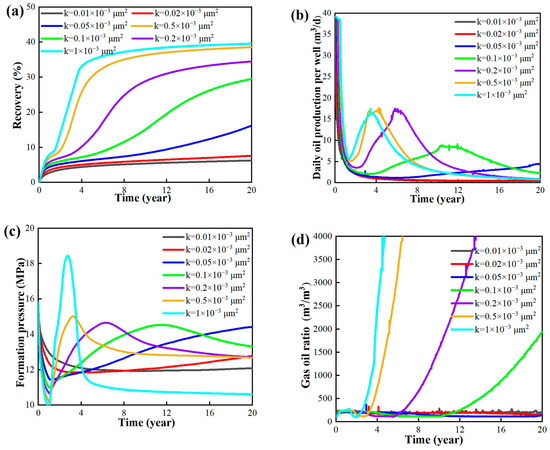
Figure 11.
Simulation results of different permeabilities. (a) Recovery. (b) Daily oil production per well. (c) Formation pressure. (d) Gas–oil ratio.
Table 6 and Figure 12 present a comparative analysis of cumulative oil recovery, incremental recovery, and gas breakthrough time across varied matrix permeabilities over a 20-year development horizon. Gas breakthrough refers to the formation of a high permeability channel between the gas injection well and the production well. This phenomenon usually occurs after a production well has emitted gas for some time. This phenomenon will cause more gas to flow along the hyperpermeability channel, resulting in a decrease in gas sweep efficiency and oil recovery. Therefore, the later gas breakthrough time will lead to improved gas injection development efficiency and oil recovery. As the matrix permeability increases, both the depletion development and gas flooding cumulative recovery increase. The recovery increment is significant for matrix permeabilities below 0.2 × 10⁻³ μm2. However, for matrix permeabilities above 0.5 × 10⁻³ μm2, the increase in matrix permeability leads to early gas breakthrough and severe gas channeling. The improvement in flow capacity due to the increased matrix permeability is almost offset, resulting in insensitivity of the final cumulative recovery to matrix permeability changes. When the matrix permeability is between 0.01 × 10⁻³ μm2 and 0.05 × 10⁻³ μm2, it is challenging to achieve economically efficient oil production. Based on the analysis, the use of a horizontal well five-spot gas flooding method can achieve better development effectiveness in the region where the matrix permeability ranges from 0.05 × 10⁻³ μm2 to 0.5 × 10⁻³ μm2.

Table 6.
Comparison of simulation results under different permeabilities.
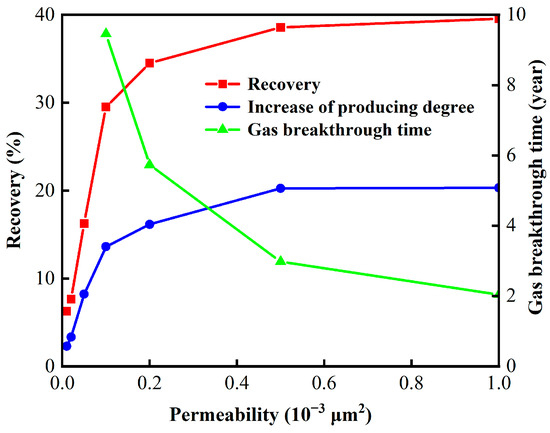
Figure 12.
Influence of permeability on recovery and gas breakthrough time.
Oil Saturation
To systematically examine the effect of initial oil saturation on gas flooding efficacy, an investigation is conducted utilizing six distinct initial oil saturation benchmarks: 45%, 50%, 55%, 60%, 65%, and 70%. The bound water saturation is 22%, and the residual oil saturation is 38% in block X. Therefore, to ensure the two-phase flow of oil and water, the reasonable range of initial oil saturation is between 45–70%. Moreover, different initial oil saturation values of the same order of magnitude have similar development effects. In order to ensure that the development effect of different initial oil saturation is highlighted, only these initial oil saturation values are selected as the object of this study. It is postulated that the reservoir commences in an oil–water biphasic state with an initial gas saturation of zero. To isolate the impact of this variable, all other reservoir parameters, fluid properties, fracture geometries, and injection-production metrics are held constant.
Figure 13 presents the simulation outcomes across varying initial oil saturation levels. Specifically, Figure 13b illustrates that, in reservoirs with an initial oil saturation ranging between 55% and 70%, gas flooding sustains elevated production rates throughout the development trajectory. Conversely, when initial oil saturations fall within 45% and 55%, production remains suboptimal and is insufficient to meet the demands of large-scale industrial production. Figure 13c indicates that there is a partial recuperation of reservoir energy during the initial gas injection phase. For higher initial oil saturations, the rate of energy replenishment lags the consumption rate, resulting in a decline in formation pressure and a concomitant decrease in oil production rates. In contrast, lower initial oil saturations correspond to a greater rate of energy replenishment relative to consumption, facilitating a steady increase in reservoir pressure over the development period.
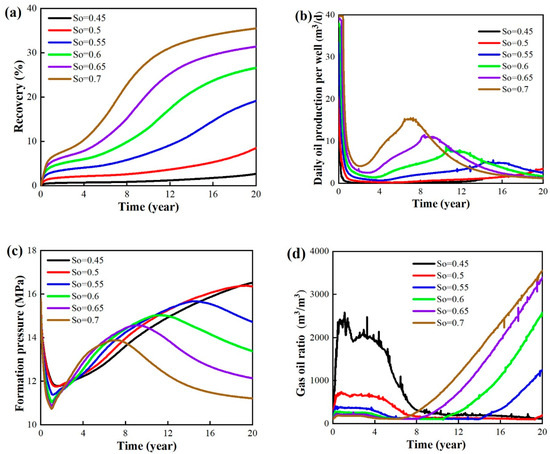
Figure 13.
Simulation results of different oil saturations. (a) Recovery. (b) Single well daily oil production. (c) Formation pressure. (d) Gas–oil ratio.
Due to the model’s initial configuration, the reservoir’s original state only accounted for the two-phase flow of oil and water. However, after gas injection, the reservoir experienced the three-phase flow of oil, gas, and water. By conducting comparative analysis of the water–oil ratio of production wells and the three-phase saturation of oil, gas, and water after 10 years of development, we aim to study the effectiveness of natural gas displacement under varying initial oil saturation levels. The water–oil ratio of production wells under different oil saturation levels is illustrated in Figure 14.
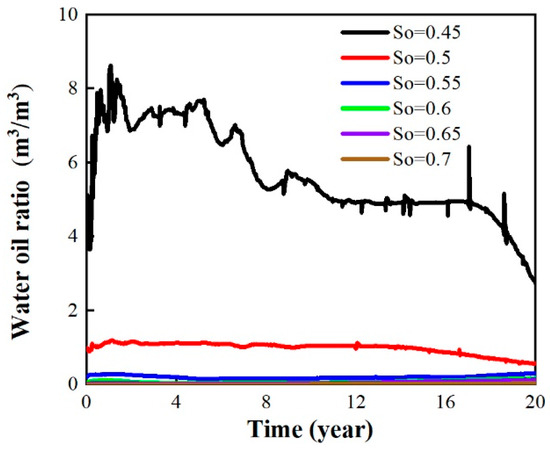
Figure 14.
Water–oil ratio under different oil saturations.
When the oil saturation level is 45%, the water–oil ratio remains above four throughout the entire development process, indicating a poor development performance. However, as the oil saturation level increases to 50%, the water–oil ratio rapidly decreases to around one. When the oil saturation level ranges between 55% and 70%, the water–oil ratio falls within the range of 0.03 to 0.3. The distribution of oil, gas, and water saturation after 10 years of development (Figure 15) reveals that, when the initial oil saturation level is 45%, the injected gas has a limited sweep efficiency, mainly concentrated around the injection well, making it challenging to mobilize the reservoir’s crude oil. As the oil saturation level rises to 50%, influenced by the fluid flow characteristics of the reservoir (such as the relative permeability curve), the effective permeability of the oil phase remains relatively low. The distribution of oil, gas, and water after 10 years of gas injection development in the entire block is similar to that of the 45% oil saturation case. Gradually increasing the initial oil saturation level from 50% to 70%, the effective permeability of the crude oil significantly improves, enhancing the flowability of the oil. Based on the comprehensive analysis of the reservoir and fluid properties of the target block, it is observed that gas displacement achieves better development results when the oil saturation level exceeds 50%. Moreover, as the oil saturation level increases, the effectiveness of gas displacement improves significantly.
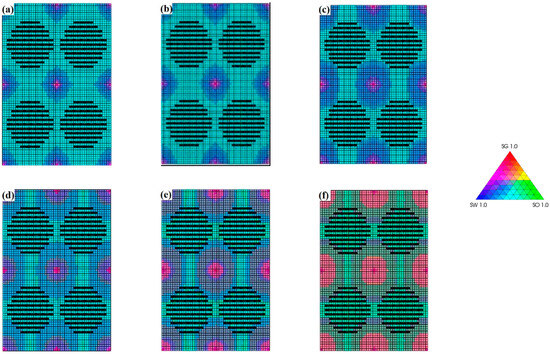
Figure 15.
Three-phase distribution of oil, gas, and water under different oil saturation levels. (a) 45%. (b) 50%. (c) 55%. (d) 60%. (e) 65%. (f) 70%.
Formation Thickness
To assess the influence of a reservoir’s effective thickness on the efficacy of the five-spot gas displacement method in horizontal wells, five distinct reservoir thicknesses are evaluated, i.e., 4 m, 8 m, 12 m, 16 m, and 20 m. The thickness of shale reservoirs is relatively small, generally less than 20 m. In addition, there is little difference in reservoir development effect with different formation thickness values of the same order of magnitude. In order to highlight the development effect of reservoirs with different formation thickness values, only these formation thickness values are selected as the object of this study. To isolate the impact of reservoir thickness on development performance, the daily gas injection rate within the reservoir block is held constant. Concurrently, other reservoir characteristics, fluid properties, fracturing parameters, and injection-production settings are maintained consistently.
The simulation results of development indicators under different reservoir thicknesses are illustrated in Figure 16. As the effective thickness of the reservoir increases, the daily oil production per well also increases. The results of the gas–oil ratio under different reservoir thicknesses indicate that the time to reach gas breakthrough is approximately 8 years, and the impact of reservoir thickness on the gas breakthrough time in gas displacement development is minimal. However, after gas breakthrough, a smaller reservoir thickness leads to a faster rise in the gas–oil ratio, indicating a more severe gas channeling. A larger effective thickness corresponds to higher oil production. Given that the total volume of gas injected remains invariant across different thickness scenarios, gas output from production wells is relatively consistent after gas breakthrough. Therefore, larger effective reservoir thicknesses correlate with reduced gas–oil ratios.
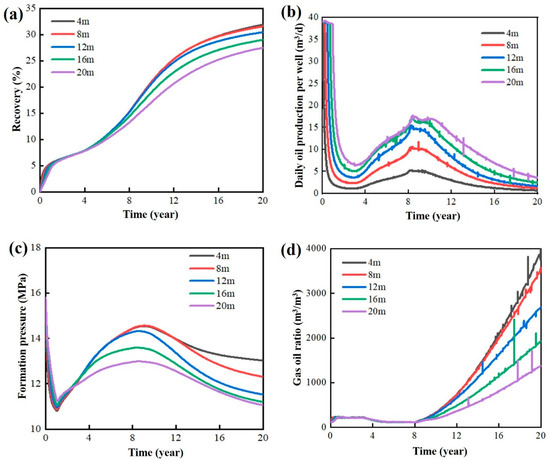
Figure 16.
Simulation results for different effective thicknesses. (a) Recovery. (b) Daily oil production per well. (c) Formation pressure. (d) Gas–oil ratio.
Table 7 and Figure 17 compare the gas displacement ultimate recovery, recovery increment (compared to depletion development), and cumulative oil production for different reservoir thicknesses. The results indicate that, under the condition of the same daily gas injection rate, increasing reservoir thickness has a certain adverse impact on the effectiveness of gas displacement development. However, within the range of reservoir thickness for the target reservoir, the negative effects of thickness increase are relatively small. Notably, even at a reservoir thickness of 20 m, the development outcome remains favorable. Conversely, when the reservoir thickness is insufficient, well production levels may fall short of meeting the criteria for large-scale industrial operations.

Table 7.
Oil recovery and cumulative oil production changes with different thicknesses.
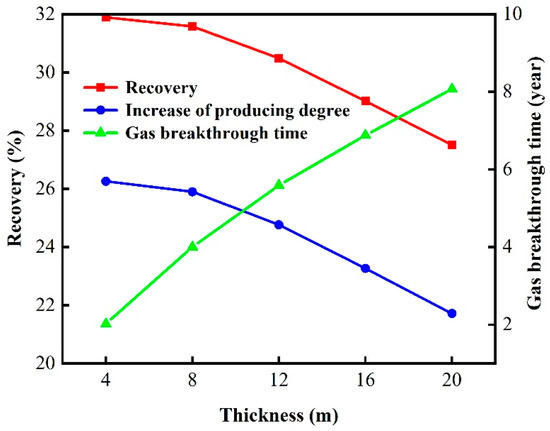
Figure 17.
Influence of thickness on oil recovery and gas breakthrough time.
In conclusion, the target block, with a reservoir effective thickness ranging from 8 m to 20 m, can achieve favorable development results through natural gas displacement. When implementing this technique in an actual mining field, it is crucial to set an appropriate daily gas injection rate based on the reservoir thickness.
3.2.2. Fracturing Parameters
Fracture Half-Length
In order to study the impact of fracture half-length on the effectiveness of gas displacement in horizontal wells, four different fracture half-lengths are selected for investigation: 120 m, 140 m, 160 m, and 180 m. When the fracture is too long, it will lead to gas breakthrough of injected gas and affect the gas injection development effect. When the fracture is too short, the formation property around the production well is poor, which will lead to a low production of the production well. Therefore, the reasonable fracture half-length is between 120–180 m. In addition, the development effects of fracture half-length reservoirs with different values of the same order of magnitude exhibit little difference. In order to highlight the development effect of different fracture half-lengths, only these fracture half-lengths are selected as the object of this study. Due to the model’s consideration of control over streamline with hydraulic fracturing, the fracture pattern is set as an elliptical pattern. Therefore, the mentioned fracture half-lengths represent the average fracture half-length. To control a single variable, other reservoir parameters, fluid properties, fracture conductivity, and injection-production parameters are kept consistent.
The simulation results of development indicators under different fracture half-lengths are illustrated in Figure 18. During the early stage of development, longer fracture half-lengths result in a better development performance. Increasing the fracture half-length expands the well-control range and shortens the distance between the injection well and the production well. However, the increase in fracture half-length also accelerates the depletion of reservoir energy, leading to inadequate energy replenishment and premature gas channeling. The variation in reservoir pressure (Figure 18c) demonstrates that longer fractures result in lower maximum reservoir pressure and earlier onset of pressure decline. The changes in gas–oil ratio (Figure 18d) indicate that longer fractures experience earlier gas breakthrough. However, in the later stages of development, insufficient reservoir energy and rapid decline in production become issues. Therefore, it is important to adopt an appropriate fracture half-length based on the production cycle of the oil field.
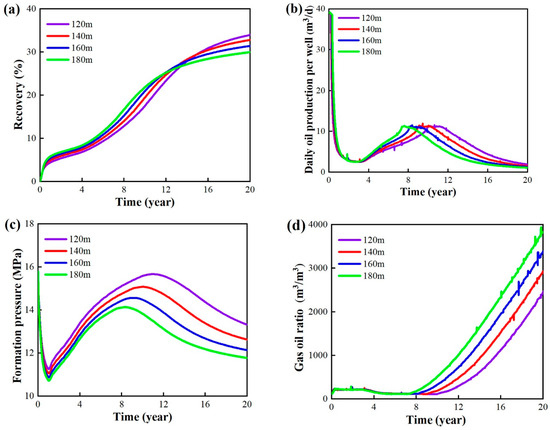
Figure 18.
Simulation results of different fracture half-lengths. (a) Recovery. (b) Daily oil production per well. (c) Formation pressure. (d) Gas–oil ratio.
Figure 19 and Table 8 compare the trends of gas displacement ultimate recovery and gas breakthrough time with varying fracture half-lengths for 10 years and 20 years. The simulation results for the 10-year ultimate recovery demonstrate that the recovery increases with an increase in fracture half-length. Nonetheless, the 20-year ultimate recovery data reveal a diminishing trend in oil recovery as the fracture half-length increases. Analysis of gas breakthrough times in relation to varying fracture half-lengths indicates a heightened sensitivity when the half-length surpasses 160 m. In the context of optimizing both short-term and long-term development performance, a fracture half-length of 160 m is recommended for the target reservoir block.
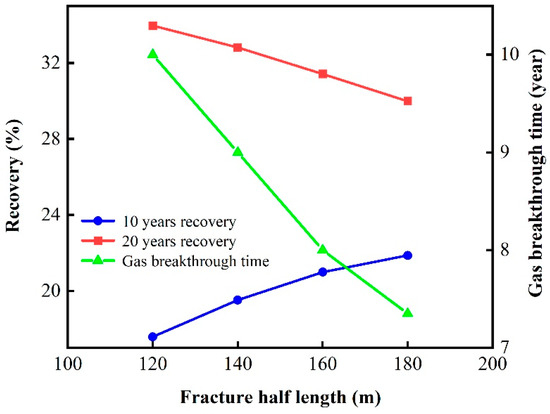
Figure 19.
Influence of fractures half-length on recovery and gas breakthrough time.

Table 8.
Oil recovery and gas breakthrough time under different fracture half-lengths.
Fracture Conductivity
To study the impact of hydraulic fracturing and fracture conductivity on the effectiveness of gas displacement, five different fracture conductivity values are selected for investigation: 20 × 10−3 μm2∙m, 40 × 10−3 μm2∙m, 60 × 10−3 μm2∙m, 80 × 10−3 μm2∙m, and 100 × 10−3 μm2∙m. To control a single variable, other reservoir parameters, fluid properties, fracture half-length, and injection-production parameters are kept consistent.
The simulation outcomes for key development indicators across varying fracture conductivity coefficients are shown in Figure 20. Elevated fracture conductivity coefficients correspond to augmented initial production rates during the incipient phases of reservoir development. However, towards the end of the development, the ultimate recovery decreases with the increasing fracture conductivity capability, albeit with minor variations among different conductivity coefficients. The variation in daily oil production per well (Figure 20b) also reflects that a higher fracture conductivity coefficient leads to a higher production in the initial stages of development. However, as the development progresses, it faces the challenge of earlier and faster production decline. The variations in formation pressure (Figure 20c) and gas–oil ratio (Figure 20d) indicate that a higher fracture conductivity coefficient results in an earlier gas breakthrough, a faster increase in gas–oil ratio, a poorer post-gas breakthrough energy replenishment, and a lower formation pressure.
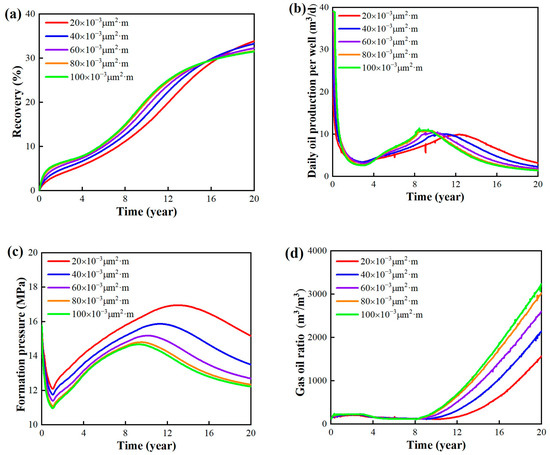
Figure 20.
Simulation results under different fracture conductivity coefficients. (a) Recovery. (b) Daily oil production per well. (c) Formation pressure. (d) Gas–oil ratio.
Table 9 and Figure 21 compare the variations in recovery and gas breakthrough time with changes in fracture conductivity coefficients for 10-year and 20-year developments. The results demonstrate that gas breakthrough time advances with an increase in fracture conductivity coefficient. The recovery after 10 years of development increases with an increasing fracture conductivity coefficient, while the recovery after 20 years of development decreases with an increasing fracture conductivity coefficient. When the fracture conductivity coefficient exceeds 80 × 10−3 μm2·m, its influence on recovery and gas breakthrough time becomes relatively small. Considering the additional cost associated with enhancing fracture conductivity, it is advisable to select the target block with a fracture conductivity coefficient of 80 × 10−3 μm2·m for optimal hydraulic fracturing.

Table 9.
Oil recovery and gas breakthrough time under different conductivity coefficients.
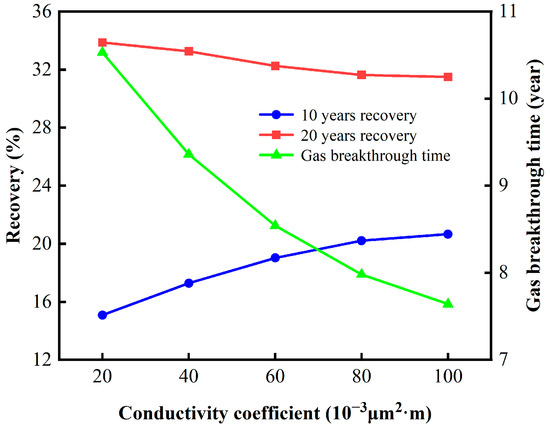
Figure 21.
Influence of conductivity coefficients on recovery and gas breakthrough time.
3.2.3. Parameters of Injection and Production
Gas Injection Rate
To investigate the impact of gas injection rate on the effectiveness of gas displacement development, four gas injection rates are selected for the study: 2000 m3/d, 3000 m3/d, 4000 m3/d, and 5000 m3/d. In order to control a single variable, other reservoir properties, fluid properties, fracturing parameters, and bottom hole flow pressure are kept consistent.
The simulated results of development indicators for different gas injection rates are illustrated in Figure 22. The simulation results of formation pressure indicate that a higher gas injection rate leads to a higher pressure maintenance level throughout the entire development period. The formation pressure continues to rise before gas breakthrough, and after gas breakthrough, the consumption rate of formation energy exceeds the replenishment rate, causing the formation pressure to decline Additionally, an elevated rate of gas injection correlates with an accelerated decline in formation pressure. The simulation results for gas–oil ratio during production reveal that a higher gas injection rate leads to an earlier gas breakthrough, a more rapid increase in gas–oil ratio after gas breakthrough, and a more significant decline in production.
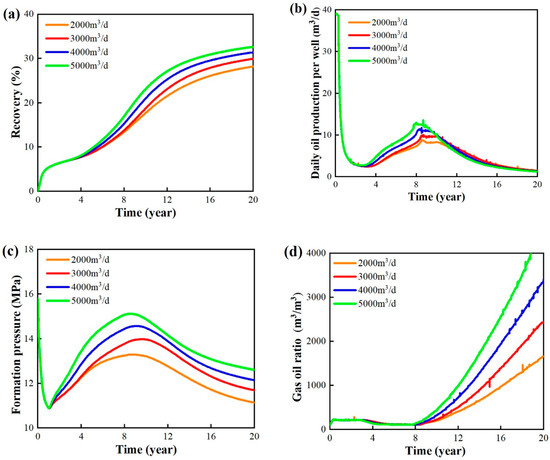
Figure 22.
Simulation results at different daily gas injection rate. (a) Recovery. (b) Daily oil production per well. (c) Formation pressure. (d) Gas–oil ratio.
Table 10 and Figure 23 compare the recovery and gas breakthrough time for 10-year and 20-year gas flooding developments. The recovery increases with an increase in the gas injection rate. For the 10-year development, the increase in recovery with the gas injection rate becomes more significant when the injection rate exceeds 3000 m3/d. However, for the 20-year development, the increase in recovery with the gas injection rate becomes smaller when the injection rate exceeds 4000 m3/d. The simulation results for gas breakthrough time indicate that, when the gas injection rate is below 3000 m3/d, there is a noticeable delay in gas breakthrough, but the recovery is relatively lower. Taking into account both recovery and gas breakthrough time, the optimal gas injection rate for the target reservoir block is in the range of 3000–4000 m3/d.

Table 10.
Oil recovery and gas breakthrough time under different daily gas injection amount.
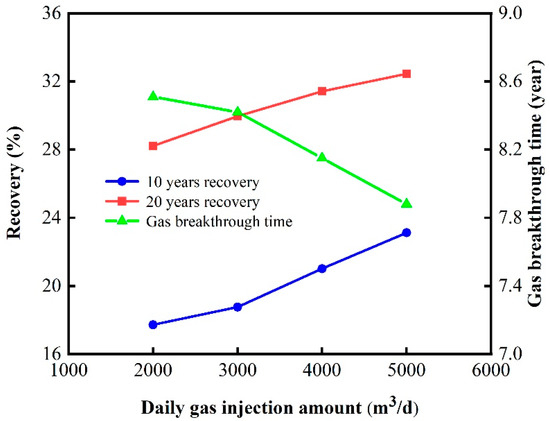
Figure 23.
Influence of daily gas injection rate on recovery and gas breakthrough time.
Bottom Hole Flow Pressure
To study the impact of bottom hole flow pressure on the effectiveness of gas displacement development, this study selected three bottom hole flow pressures: 9 MPa, 11 MPa, and 13 MPa. In order to control a single variable, other reservoir properties, fluid properties, fracturing parameters, and gas injection rates are kept consistent.
The simulated results of development indicators for different bottom hole flow pressures are shown in Figure 24. A lower bottom hole flow pressure results in a higher recovery, an earlier attainment of peak production, and a faster decline in production after reaching the peak. However, the peak production levels for different bottom hole flow pressures are almost the same. Lower bottom hole flow pressures lead to greater production differentials and higher daily oil production rates during the early stages of development. The influence of bottom hole flow pressure on recovery is significant, but it also faces a faster depletion of formation energy and an earlier gas breakthrough. The influence of bottom hole flow pressure on recovery diminishes in the later stages of development.
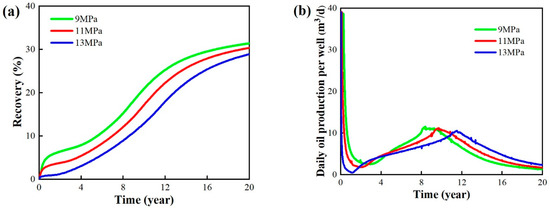
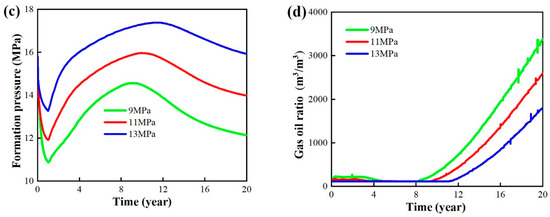
Figure 24.
Simulation results under different bottom hole flow pressures. (a) Recovery. (b) Daily oil production per well. (c) Formation pressure. (d) Gas–oil ratio.
Table 11 and Figure 25 compare the recovery and gas breakthrough time for 10-year and 20-year gas flooding developments with varying bottom hole flow pressures. The results indicate that a bottom hole flow pressure of 9 MPa leads to an earlier gas breakthrough, but both the 10-year and 20-year recoveries are the highest. Therefore, the optimal bottom hole flow pressure for the target reservoir block is 9 MPa.

Table 11.
Oil recovery and gas breakthrough time under different bottom hole pressures.
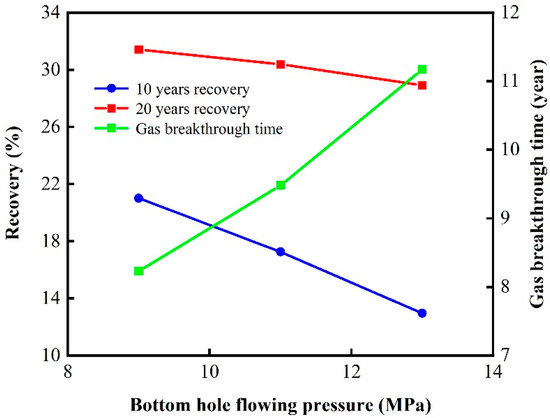
Figure 25.
Influence of injection rate on recovery and gas breakthrough time.
3.3. Adaptive Boundary of Shale Oil Development with Natural Gas Flooding
3.3.1. Analysis of the Key Controlling Factors for Natural Gas Flooding
Analysis of Influencing Factor Weights Based on Random Forest Algorithm
A machine learning algorithm, random forest, is used to determine the effect of seven parameters on the development effect: permeability, oil saturation, reservoir thickness, daily gas injection volume, fracture conductivity, fracture half-length, and bottom hole flow pressure in the shale oil development process with natural gas flooding.
The random forest method is a machine learning algorithm that is flexible and easy to use. As one of the classification and regression algorithms, the random forest algorithm uses a decision tree as the basic decision unit and generates multiple sample sets randomly by repeated sampling of samples [41,42,43]. The computation of random forest is divided into six main steps, and its decision process is shown in Figure 26. The sampling method used in this study is bootstrap method [44]. Bootstrap sampling is a sampling method with put back. It creates a new sample dataset by randomly selecting samples from the original dataset. At each sampling, the selected sample is copied and put back into the original dataset, making it possible for each sample to appear multiple times in the new sample dataset. This sampling method can effectively utilize the rest of the original data set, while maintaining the diversity of the sample data set.
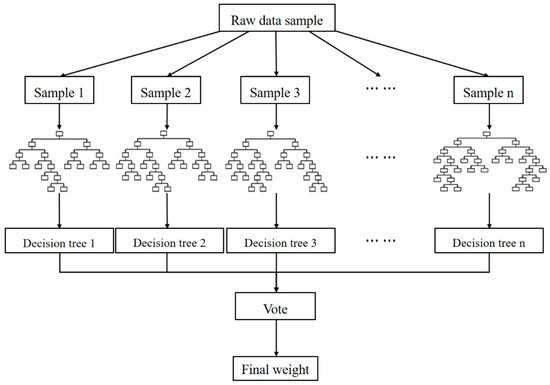
Figure 26.
Random forest decision flowchart.
Because random forest classifiers tend to favor the majority of classifiers, the misclassification of a small number of classifiers will cause greater penalties. We assign a weight to each class, with a few classes having larger weights (i.e., higher misclassification costs). The class weights are incorporated into the random forest algorithm in two places. During the tree induction, class weights are used to weigh the Gini criteria used to find splits. At the end node of each tree, class weights should be considered again. The class prediction of each terminal node is determined with “weighted majority vote”. The weighted vote of a class is the weight of the class multiplied by the number of cases of the class on the terminal node. The weighted votes for each tree are then added to determine the final category prediction for the random forest, where the weights are the average weights of the end nodes. Class weights are an essential tuning parameter to achieve the desired performance. The out-of-bag estimation accuracy of random forest can be used to select the weights [45].
① The sample set is resampled using the bootstrap method to generate k training sets θ1, θ2, …, θk. Based on these k training sets, decision trees {T(x, θ1)}, {T(x, θ2)}, ⋯, {T(x, θk)} are further generated.
② Randomly m features from all M features are selected, and they are used as the feature set for splitting in the current decision tree. The optimal splitting method among these m features is chosen as the splitting method.
③ Pruning is not performed on individual decision tree branches, allowing them to grow to their fullest extent.
④ The prediction result of a single decision tree T(θ) for new data is obtained by averaging the values of the leaf nodes l(x, θ). Assuming Xi is an observed value that is nonzero and included in the leaf node l(x, θ), its weight ωi(x, θ) can be represented as follows:
⑤ The prediction value of a single decision tree can be obtained by taking the weighted average of the observed values of the dependent variable Yi (i = 1, 2, …, n). The prediction value of a single decision tree can be represented as follows:
⑥ The weight wi(x) for each observed value Yi ∈ (1, 2, …, n) can be represented by taking the average of the weights ωi(x, θt) (t = 1, 2, …, k) of the decision tree:
where Xi is the observed value of each leaf node; ωi(x, θt) is the weight of the observed value X; Rl(x, θ) is the data set for each sample; n is the total number of observations; Yi is the observed value of each decision tree; is the predicted value of a single decision tree; and wi(x) is the weight of observation Yi.
Weight Determination
Based on the data from the single-factor sensitivity analysis results of shale oil and gas flooding development (Appendix A), the weights of the influencing factors on the recovery degree at 10 years and 20 years of gas flooding development are quantitatively characterized. The single-factor simulation results are input into the algorithm, with 80% of the data randomly selected as the training set and the remaining data as the test set. The random seed is set to 44 to carry out model training and data analysis.
① Recovery Degree at 10 Years
The recovery degree at 10 years for different parameter values is input into the established random forest model for data processing. The Pearson correlation coefficient after model training is found to be 0.9357, and the root mean square error (RMSE) is 4.5973. The results indicate a good fit and training effect of the model. The weights of the seven parameters on the recovery degree at 10 years of gas flooding development are shown in Table 12.

Table 12.
Calculation results of 10-year oil recovery weight.
② Recovery Degree at 20 Years
The recovery degree at 20 years for different parameter values is input into the established random forest model for data processing. The Pearson correlation coefficient after model training is found to be 0.9873, and the root mean square error (RMSE) is 5.4317. The results indicate a good fit and training effect of the model. The weights of the seven parameters on the recovery degree at 20 years of gas flooding development are shown in Table 13.

Table 13.
Calculation results of 20-year oil recovery weight.
③ Key Factor Analysis
The weights of different parameters on the effectiveness of gas flooding development are shown in Figure 27 and Figure 28. The results indicate that, for the recovery degree at 10 years, the influence of the parameters from high to low is as follows: oil saturation, permeability, fracture half-length, reservoir thickness, daily gas injection rate, bottomhole pressure, and fracture conductivity. For the recovery degree at 20 years, the influence of the parameters from high to low is as follows: permeability, oil saturation, fracture half-length, reservoir thickness, daily gas injection rate, fracture conductivity, and bottomhole pressure. Permeability, oil saturation, and fracture half-length are the key controlling factors for gas flooding development, with matrix permeability and oil saturation playing a dominant role in natural gas flooding development.
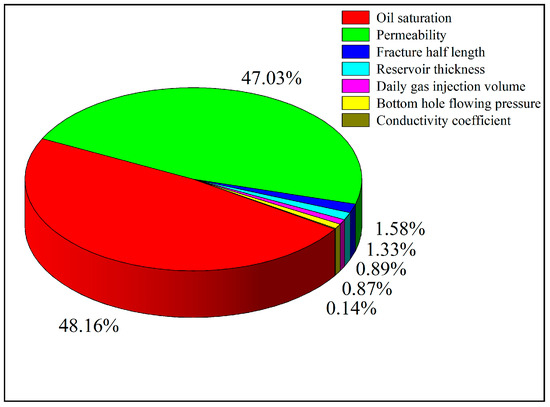
Figure 27.
Pie chart of 10-year oil recovery weight.
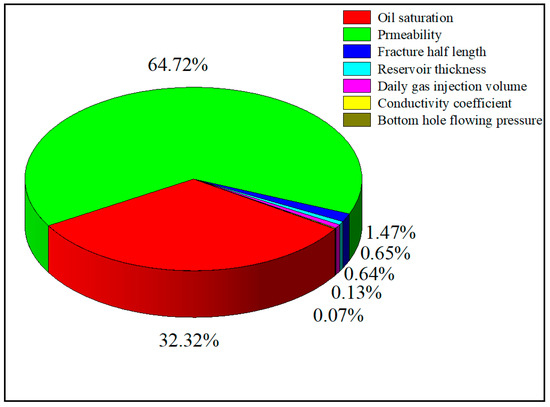
Figure 28.
Pie chart of 20-year oil recovery weight.
3.3.2. Adaptive Boundary Chart of Natural Gas Flooding
Permeability–Oil Saturation
In this study, seven permeability values are selected and are as follows: 0.01 × 10⁻³ μm2, 0.02 × 10⁻³ μm2, 0.05 × 10⁻³ μm2, 0.1 × 10⁻³ μm2, 0.2 × 10⁻³ μm2, 0.5 × 10⁻³ μm2, and 1 × 10⁻³ μm2. The oil saturation is set to 45%, 50%, 55%, 60%, 65%, and 70%. The recovery degrees at 10 years and 20 years are calculated for each permeability value and oil saturation combination. Based on the calculation results, the discrete data points are transformed into continuous contours with permeability as the x-axis and oil saturation as the y-axis, as shown in Figure 29.
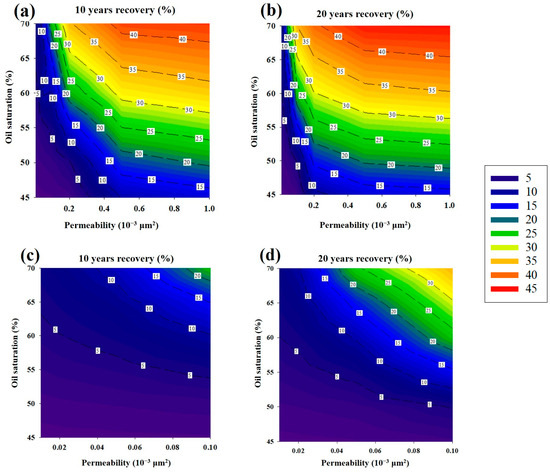
Figure 29.
Adaptive boundary chart of permeability–oil saturation. (a) 10-year recovery chart (to 1.0 × 10⁻³ μm2). (b) 20-year recovery chart (to 1.0 × 10⁻³ μm2). (c) 10-year recovery chart (to 0.1 × 10⁻³ μm2). (d) 20-year recovery chart (to 0.1 × 10⁻³ μm2).
The degree of hydrocarbon recovery increases with the increasing matrix permeability and initial oil saturation. When holding the range of permeability values constant across differing development timeframes, the contour lines of the recovery degree at 10 and 20 years exhibit parallel tendencies. Conversely, when the development duration remains unchanged but the permeability values differ, the general trend of the contour lines differs and is as follows:
① When the permeability is below 0.1 × 10⁻³ μm2 and the oil saturation is below 50%, the influence of permeability on the recovery degree is small. As the permeability increases, the influence of permeability on the recovery degree also increases.
② The inflection point of the influence of permeability on the recovery degree is at 0.2 × 10⁻³ μm2.
③ When the permeability is below 0.2 × 10⁻³ μm2, the contour lines become steeper with increasing permeability, indicating that the influence of permeability on the recovery degree increases while the influence of oil saturation becomes relatively smaller.
④ When the permeability is above 0.2 × 10⁻³ μm2, the contour lines become flatter with increasing permeability, indicating that the influence of permeability on the recovery degree decreases while the influence of oil saturation becomes relatively larger.
For the recovery degree at 10 years, when the permeability is below 0.1 × 10⁻³ μm2, the maximum recovery degree can reach 21.5%; when the permeability range is extended to 1 × 10⁻³ μm2, the maximum achievable recovery degree is 41.8%. For the recovery degree at 20 years, when the permeability is below 0.1 × 10⁻³ μm2, the maximum recovery degree is 33.9%. When the permeability range is expanded to 1 × 10⁻³ μm2, the maximum recovery degree at 20 years can reach 42.7%. The contour lines of the recovery degree at 10 years and 20 years enclose a similar region when the recovery degree is above 25%. This indicates that when the reservoir properties are within this enclosed region, it is not advisable to continue using gas flooding for development after 10 years, and it is necessary to adjust the development strategy in a timely manner.
The analysis indicates that permeability and initial oil saturation are key variables affecting the success of gas flooding in oil recovery. When formulating a development plan, the expected recovery factor is a crucial consideration. Table 14 and Table 15 outline the optimal reservoir properties needed to achieve specific recovery factors for various development timelines. These optimal properties are derived from the end-points of the recovery contour lines.

Table 14.
Limiting properties limitation of 10-year oil recovery.

Table 15.
Limiting properties of 20-year oil recovery.
Permeability–Fracture Half-Length
In this study, seven permeability values are selected and are as follows: 0.01 × 10⁻³ μm2, 0.02 × 10⁻³ μm2, 0.05 × 10⁻³ μm2, 0.1 × 10⁻³ μm2, 0.2 × 10⁻³ μm2, 0.5 × 10⁻³ μm2, and 1 × 10⁻³ μm2. The fracture half-length is set to 120 m, 140 m, 160 m, and 180 m. The recovery degree at 10 years and 20 years is calculated for each permeability value and corresponding fracture half-length. The calculated discrete data points are then used to generate a continuous contour plot of the recovery degree with permeability and fracture half-length as the x and y axes, respectively, as shown in Figure 30.
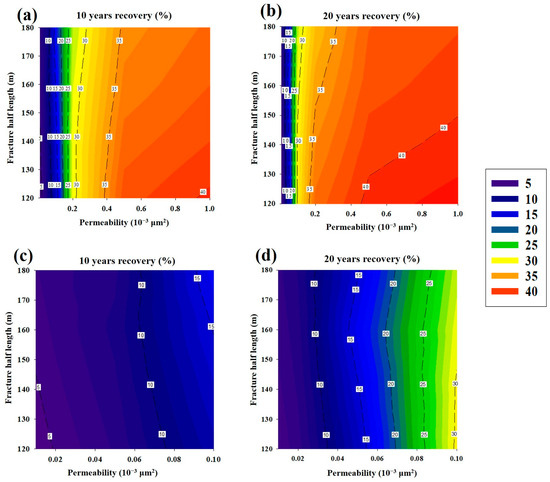
Figure 30.
Adaptive boundary chart of permeability–fracture half-length. (a) 10-year recovery chart (to 1.0 × 10⁻³ μm2). (b) 20-year recovery chart (to 1.0 × 10⁻³ μm2). (c) 10-year recovery chart (to 0.1 × 10⁻³ μm2). (d) 20-year recovery chart (to 0.1 × 10⁻³ μm2).
When dealing with low-permeability reservoirs, permeability exerts a significant impact on the recovery factor, whereas the effect of fracture half-length is comparatively minimal. As reservoir permeability increases, its influence on the recovery factor diminishes, while the significance of fracture half-length correspondingly amplifies. When the permeability is below 0.1 × 10⁻³ μm2, the recovery degree increases with the increase in fracture half-length, but this pattern changes when the permeability is higher than 0.2 × 10⁻³ μm2. With higher permeability, improved fluid flow capacity combined with longer fractures can cause a significant advance in gas breakthrough time, leading to a decrease in reservoir energy replenishment and ultimately resulting in a lower recovery degree.
For the recovery degree at 10 years, when the permeability is below 0.1 × 10⁻³ μm2, the maximum recovery degree is 16.25%. When the permeability range is expanded to 1 × 10⁻³ μm2, the maximum recovery degree is 40.13%. For the recovery degree at 20 years, when the permeability is below 0.1 × 10⁻³ μm2, the maximum recovery degree is 30.06%. When the permeability range is expanded to 1 × 10⁻³ μm2, the maximum recovery degree is 43.4%.
Figure 30 indicates that, for reservoirs with permeability less than 0.2 × 10⁻³ μm2, longer fracture half-lengths should be chosen. For reservoirs with permeability higher than 0.2 × 10⁻³ μm2, the impact of fracture half-length on the effectiveness of gas flooding development increases with longer development periods. For longer development periods, it is advisable to avoid adopting longer fracture half-lengths to mitigate gas channeling and ensure the effectiveness of the development.
Oil Saturation–Fracture Half-Length
In this study, the oil saturation is set to 45%, 50%, 55%, 60%, 65%, and 70%, and the fracture half-length is set to 120 m, 140 m, 160 m, and 180 m. The recovery degree at 10 years and 20 years is calculated for each oil saturation and corresponding fracture half-length. The calculated discrete data points are then used to generate a continuous contour plot of the recovery degree with oil saturation and fracture half-length as the x and y axes, respectively, as shown in Figure 31.
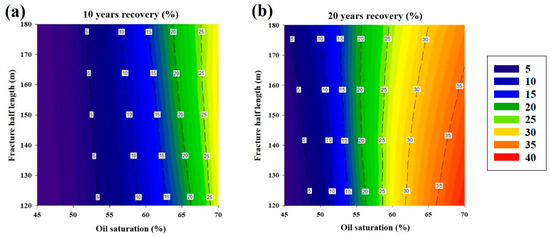
Figure 31.
Adaptive boundary chart of oil saturation–fracture half-length. (a) 10-year recovery chart. (b) 20-year recovery chart.
In the contour plot observed over a 10-year period, the degree of recovery exhibits a direct correlation with both oil saturation and fracture half-length. The contour lines of the recovery degree become denser as the oil saturation increases, indicating that higher oil saturation has a greater impact on the recovery degree. Longer fractures allow for a larger effective drainage area of horizontal wells, and a longer fracture length leads to better development results before gas breakthrough occurs.
The adaptive boundary chart of the recovery degree at 20 years shows that, when the oil saturation is below 55%, a longer fracture length results in a higher recovery degree, and the contour lines become denser. This indicates that as the oil saturation increases, the impact of oil saturation on the recovery degree becomes more significant. When the oil saturation is low, the difficulty of oil flow due to fluid flow characteristics (immiscible fluid flow) can be overcome by increasing the fracture half-length, which expands the effective drainage area of horizontal wells and improves the recovery degree. However, when the oil saturation is above 55%, a longer fracture length results in a lower recovery degree, and the contour lines become sparser. It indicates that as the oil saturation increases, the impact of fracture half-length on the recovery degree becomes more significant. With higher oil saturation, the fluid mobility improves, and for longer development periods, increasing the fracture half-length leads to earlier gas breakthrough and ultimately resulting in poorer development results.
Within the studied range of oil saturation and fracture half-length, the maximum recovery degree at 10 years can reach 27.54%, and the maximum recovery degree at 20 years can reach 36.96%. For reservoirs with oil saturation below 55%, longer fracture lengths should be adopted to achieve better development results. For reservoirs with oil saturation above 55%, a longer fracture half-length should be adopted for 10-year development, while a shorter fracture half-length should be adopted for 20-year development to ensure effective development.
4. Conclusions
This paper focuses on the study of the shale oil of block X in the Chang 7 reservoir of the Ordos Basin. A numerical reservoir model is established to evaluate the influence of parameters on the natural gas injection development results of shale reservoirs. And the random forest algorithm is used to complete the weight evaluation of the parameters on the natural gas injection development results of shale reservoirs. Finally, the reservoir development adaptive boundary chart is established to evaluate the development effect of natural gas injection in shale reservoirs with different parameters. This paper plays an important role in guiding the research and oilfield plan of natural gas injection in shale reservoir. The following are the detailed conclusions of the study:
(1) Depletion development with a significant pressure drop in the reservoir results in a rapid production decline, with only 8.98% recovery over a 10-year period. Consequently, the target block requires additional energy for sustained development. Natural gas flooding, when contrasted with water flooding, can overcome injection challenges and efficiently restore reservoir energy. The 10-year recovery factor for natural gas flooding is 27.42%, an improvement of 5.48% compared to water flooding. Under the same total gas injection volume, the five-spot horizontal well gas flooding method is more effective than gas injection and inter-well gas injection.
(2) Regions with reservoir properties satisfying a matrix permeability ranging from 0.05 to 0.5 × 10⁻³ μm2, oil saturation greater than 50%, and effective reservoir thickness between 8 and 20 m show better development results with natural gas flooding. The preferred parameters for gas flooding in the target block are a reasonable fracture length of 160 m, fracture conductivity of 80 × 10−3 μm2·m, a daily gas injection rate of 3000–4000 m³/d, and a bottom hole flow pressure of 9 MPa.
(3) Permeability, oil saturation, and fracture length are the primary controlling factors for natural gas flooding, with matrix permeability and oil saturation playing a dominant role in the effectiveness of gas reservoir development.
(4) After 10 years of natural gas flooding, it is not advisable to continue with this development method. It is necessary to promptly adjust the development strategy. For longer development periods, adopting shorter fracture lengths is preferred to mitigate gas channeling and ensure development effectiveness.
(5) The adaptability boundary chart of permeability–oil saturation, permeability–fracture half-length, and oil saturation–fracture half-length indicate that recovery factor increases as permeability and oil saturation increase. For reservoirs with permeability less than 0.2 × 10⁻³ μm2, longer fracture lengths should be adopted. As for reservoirs with permeability higher than 0.2 × 10⁻³ μm2, the impact of fracture length on the effectiveness of gas flooding increases with longer development periods. For reservoirs with oil saturation below 55%, longer fracture lengths should be adopted to achieve better development results.
Author Contributions
Methodology, W.Y. and J.S. (Jiabang Song); Software, J.S. (Jiabang Song); Formal analysis, M.A.A.; Data curation, L.C.; Conceptualization, L.C. and M.A.A.; Validation, J.S. (Jian Shi) and H.Y.; Resources, W.Y.; Investigation, H.Y.; Writing—original draft, Q.X.; Writing—review & editing, P.S.; Visualization, J.S. (Jian Shi); Supervision, H.Y. All authors have read and agreed to the published version of the manuscript.
Funding
This work was financially supported by the National Natural Science Foundation of China (52074317) and Strategic Cooperation Technology Projects of CNPC and CUPB (ZLZX2020-02-04-04).
Data Availability Statement
Not applicable.
Conflicts of Interest
The authors declare no conflict of interest.
Appendix A. Recovery for Different Parameter Values

Table A1.
The oil recovery under different conditions.
Table A1.
The oil recovery under different conditions.
| No. | Permeability /×10−3 μm2 | Thickness /m | Conductivity Coefficient /×10−3 μm2∙m | Oil Saturation /% | Bottomhole Pressure /MPa | Fracture Half-Length /m | Daily Gas Injection Amount /(m3/d) | 10 Years Recovery /% | 20 Years Recovery /% |
|---|---|---|---|---|---|---|---|---|---|
| 1 | 0.01 | 8.7 | 100 | 65 | 9 | 160 | 4000 | 4.92 | 6.03 |
| 2 | 0.02 | 8.7 | 100 | 65 | 9 | 160 | 4000 | 7.32 | 8.82 |
| 3 | 0.05 | 8.7 | 100 | 65 | 9 | 160 | 4000 | 9.77 | 14.45 |
| 4 | 0.1 | 8.7 | 100 | 65 | 9 | 160 | 4000 | 15.04 | 24.42 |
| 5 | 0.2 | 8.7 | 100 | 65 | 9 | 160 | 4000 | 23.35 | 32.60 |
| 6 | 0.5 | 8.7 | 100 | 65 | 9 | 160 | 4000 | 25.35 | 36.91 |
| 7 | 1 | 8.7 | 100 | 65 | 9 | 160 | 4000 | 26.27 | 36.98 |
| 8 | 0.13 | 4 | 100 | 65 | 9 | 160 | 4000 | 21.04 | 31.89 |
| 9 | 0.13 | 8 | 100 | 65 | 9 | 160 | 4000 | 21.04 | 31.58 |
| 10 | 0.13 | 12 | 100 | 65 | 9 | 160 | 4000 | 20.72 | 30.48 |
| 11 | 0.13 | 16 | 100 | 65 | 9 | 160 | 4000 | 19.05 | 29.01 |
| 12 | 0.13 | 20 | 100 | 65 | 9 | 160 | 4000 | 17.12 | 27.51 |
| 13 | 0.13 | 8.7 | 20 | 65 | 9 | 160 | 4000 | 15.08 | 33.86 |
| 14 | 0.13 | 8.7 | 40 | 65 | 9 | 160 | 4000 | 17.28 | 33.26 |
| 15 | 0.13 | 8.7 | 60 | 65 | 9 | 160 | 4000 | 19.02 | 33.26 |
| 16 | 0.13 | 8.7 | 80 | 65 | 9 | 160 | 4000 | 20.21 | 32.25 |
| 17 | 0.13 | 8.7 | 100 | 65 | 9 | 160 | 4000 | 21.00 | 31.42 |
| 18 | 0.13 | 8.7 | 100 | 45 | 9 | 160 | 4000 | 1.05 | 2.74 |
| 19 | 0.13 | 8.7 | 100 | 50 | 9 | 160 | 4000 | 3.10 | 8.60 |
| 20 | 0.13 | 8.7 | 100 | 55 | 9 | 160 | 4000 | 7.37 | 19.19 |
| 21 | 0.13 | 8.7 | 100 | 60 | 9 | 160 | 4000 | 13.11 | 26.64 |
| 22 | 0.13 | 8.7 | 100 | 65 | 9 | 160 | 4000 | 21.00 | 31.42 |
| 23 | 0.13 | 8.7 | 100 | 70 | 9 | 160 | 4000 | 28.15 | 35.53 |
| 24 | 0.13 | 8.7 | 100 | 65 | 9 | 160 | 4000 | 21.00 | 31.42 |
| 25 | 0.13 | 8.7 | 100 | 65 | 11 | 160 | 4000 | 17.25 | 30.38 |
| 26 | 0.13 | 8.7 | 100 | 65 | 13 | 160 | 4000 | 12.95 | 28.91 |
| 27 | 0.13 | 8.7 | 100 | 65 | 9 | 120 | 4000 | 17.58 | 33.96 |
| 28 | 0.13 | 8.7 | 100 | 65 | 9 | 140 | 4000 | 19.51 | 32.81 |
| 29 | 0.13 | 8.7 | 100 | 65 | 9 | 160 | 4000 | 20.98 | 31.42 |
| 30 | 0.13 | 8.7 | 100 | 65 | 9 | 180 | 4000 | 21.86 | 29.98 |
| 31 | 0.13 | 8.7 | 100 | 65 | 9 | 160 | 2000 | 17.72 | 28.22 |
| 32 | 0.13 | 8.7 | 100 | 65 | 9 | 160 | 3000 | 18.76 | 29.96 |
| 33 | 0.13 | 8.7 | 100 | 65 | 9 | 160 | 4000 | 21.01 | 31.42 |
| 34 | 0.13 | 8.7 | 100 | 65 | 9 | 160 | 5000 | 23.12 | 32.45 |
References
- Wan, T.; Sheng, J.J.; Soliman, M. Evaluate EOR Potential in Fractured Shale Oil Reservoirs by Cyclic Gas Injection. In Proceedings of the SPE/AAPG/SEG Unconventional Resources Technology Conference, Denver, CO, USA, 12–14 August 2013. [Google Scholar]
- Li, H.-B.; Yang, Z.-M.; Li, R.-S.; Zhou, T.-Y.; Guo, H.-K.; Liu, X.-W.; Dai, Y.-X.; Hu, Z.-G.; Meng, H. Mechanism of CO2 enhanced oil recovery in shale reservoirs. Pet. Sci. 2021, 18, 1788–1796. [Google Scholar] [CrossRef]
- Sanchez-Rivera, D.; Mohanty, K.; Balhoff, M. Reservoir simulation and optimization of Huff-and-Puff operations in the Bakken Shale. Fuel 2015, 147, 82–94. [Google Scholar] [CrossRef]
- Jia, H.; Sheng, J.J. Discussion of the feasibility of air injection for enhanced oil recovery in shale oil reservoirs. Petroleum 2017, 3, 249–257. [Google Scholar] [CrossRef]
- Ahmed, B.; Bakht, S.; Wahid, S.; Hanif, M. Structural analysis and reservoir characterisation of cretaceous sequence in Kohala Bala, Khyber Pakhtunkhwa, Pakistan. Rud. Geološko Naft. Zb. 2022, 37, 65–81. [Google Scholar] [CrossRef]
- Sheng, J.J. Enhanced oil recovery in shale reservoirs by gas injection. J. Nat. Gas Sci. Eng. 2015, 22, 252–259. [Google Scholar] [CrossRef]
- Akbarabadi, M.; Alizadeh, A.; Piri, M.; Nagarajan, N. Experimental evaluation of enhanced oil recovery in unconventional reservoirs using cyclic hydrocarbon gas injection. Fuel 2023, 331, 125676. [Google Scholar] [CrossRef]
- Sui, H.; Zhang, F.; Zhang, L.; Wang, Z.; Yuan, S.; Wang, D.; Wang, Y. Mechanism of CO2 enhanced oil recovery in kerogen pores and CO2 sequestration in shale: A molecular dynamics simulation study. Fuel 2023, 349, 128692. [Google Scholar] [CrossRef]
- Sheng, J.J.; Chen, K. Evaluation of the EOR potential of gas and water injection in shale oil reservoirs. J. Unconv. Oil Gas Resour. 2014, 5, 1–9. [Google Scholar] [CrossRef]
- Hoffman, B.T. Comparison of Various Gases for Enhanced Recovery from Shale Oil Reservoirs. In Proceedings of the SPE Improved Oil Recovery Symposium, Tulsa, OK, USA, 14–18 April 2012. [Google Scholar]
- Yu, W.; Lashgari, H.R.; Wu, K.; Sepehrnoori, K. CO2 injection for enhanced oil recovery in Bakken tight oil reservoirs. Fuel 2015, 159, 354–363. [Google Scholar] [CrossRef]
- Dong, C.; Hoffman, B.T. Modeling Gas Injection into Shale Oil Reservoirs in the Sanish Field, North Dakota. In Proceedings of the Unconventional Resources Technology Conference, Denver, CO, USA, 12–14 August 2013. [Google Scholar]
- Kong, B.; Wang, S.; Chen, S. Simulation and Optimization of CO2 Huff-and-Puff Processes in Tight Oil Reservoirs. In Proceedings of the SPE Improved Oil Recovery Conference, Tulsa, OK, USA, 11–13 April 2016. [Google Scholar]
- Zhu, P.; Balhoff, M.T.; Mohanty, K.K. Simulation of Fracture-to-Fracture Gas Injection in an Oil-Rich Shale. In Proceedings of the SPE Annual Technical Conference and Exhibition, Houston, TX, USA, 28–30 September 2015. [Google Scholar]
- Syed, F.I.; Dahaghi, A.K.; Muther, T. Laboratory to field scale assessment for EOR applicability in tight oil reservoirs. Pet. Sci. 2022, 19, 2131–2149. [Google Scholar] [CrossRef]
- Carpenter, C. Huff ‘n’ Puff Gas-Injection Pilot Improves Oil Recovery in the Eagle Ford. J. Pet. Technol. 2018, 70, 91–92. [Google Scholar] [CrossRef]
- Hoffman, B.T. Huff-N-Puff Gas Injection Pilot Projects in the Eagle Ford. In Proceedings of the SPE Canada Unconventional Resources Conference, Calgary, AB, Canada, 13–14 March 2018. [Google Scholar]
- Wang, L.; Tian, Y.; Yu, X.; Wang, C.; Yao, B.; Wang, S.; Winterfeld, P.H.; Wang, X.; Yang, Z.; Wang, Y.; et al. Advances in improved/enhanced oil recovery technologies for tight and shale reservoirs. Fuel 2017, 210, 425–445. [Google Scholar] [CrossRef]
- Burrows, L.C.; Haeri, F.; Cvetic, P.; Sanguinito, S.; Shi, F.; Tapriyal, D.; Goodman, A.L.; Enick, R.M. A Literature Review of CO2, Natural Gas, and Water-Based Fluids for Enhanced Oil Recovery in Unconventional Reservoirs. Energy Fuels 2020, 34, 5331–5380. [Google Scholar] [CrossRef]
- Liu, Y.; Rui, Z. A Storage-Driven CO2 EOR for a Net-Zero Emission Target. Engineering 2022, 18, 79–87. [Google Scholar] [CrossRef]
- Song, Y.-L.; Song, Z.-J.; Zhang, Y.-F.; Xie, Z.-H.; Zhang, L.-C.; Wang, D.-G.; Hui, G. Pore scale performance evaluation and impact factors in nitrogen huff-n-puff EOR for tight oil. Pet. Sci. 2022, 19, 2932–2940. [Google Scholar] [CrossRef]
- Li, L.; Su, Y.; Hao, Y.; Zhan, S.; Lv, Y.; Zhao, Q.; Wang, H. A comparative study of CO2 and N2 huff-n-puff EOR performance in shale oil production. J. Pet. Sci. Eng. 2019, 181, 106174. [Google Scholar] [CrossRef]
- Yan, X. Study on corrosion mechanism in CO2-driven gathering pipelines. Chem. Eng. Technol. 2020, 1, 100–102. [Google Scholar]
- Belhaj, H.; Abukhalifeh, H.; Javid, K. Miscible oil recovery utilizing N2 and/or HC gases in CO2 injection. J. Pet. Sci. Eng. 2013, 111, 144–152. [Google Scholar] [CrossRef]
- Yu, H.; Chen, Z.; Lu, X.; Cheng, S.; Xie, Q.; Qu, X. Review of enhanced oil recovery by carbonated water injection. Pet. Sci. Bull. 2020, 2, 204–228. [Google Scholar]
- Matkivskyi, S.; Kondrat, O. Studying the influence of the carbon dioxide injection period duration on the gas recovery factor during the gas condensate fields development under water drive. Min. Miner. Deposits 2021, 15, 95–101. [Google Scholar] [CrossRef]
- Bustin, A.; Bustin, R.; Chikatamarla, L.; Downey, R.; Mansoori, J. Learnings from a failed nitrogen enhanced coalbed methane pilot: Piceance Basin, Colorado. Int. J. Coal Geol. 2016, 165, 64–75. [Google Scholar] [CrossRef]
- Wu, J.; Gan, Y.; Shi, Z.; Huang, P.; Shen, L. Pore-scale lattice Boltzmann simulation of CO2-CH4 displacement in shale matrix. Energy 2023, 278, 127991. [Google Scholar] [CrossRef]
- Liu, Z.-X.; Liang, Y.; Wang, Q.; Guo, Y.-J.; Gao, M.; Wang, Z.-B.; Liu, W.-L. Status and progress of worldwide EOR field applications. J. Pet. Sci. Eng. 2020, 193, 107449. [Google Scholar] [CrossRef]
- Schmidt, M.; Sekar, B. Innovative Unconventional 2 EOR-a light EOR an unconventional tertiary recovery approach to an unconventional bakken reservoir in southeast saskatchewan. In Proceedings of the SPE 21st World Petroleum Congress, Moscow, Russia, 15–19 June 2014. [Google Scholar]
- Tang, Y.; Chen, Y.; He, Y.; Yu, G.; Guo, X.; Yang, Q.; Wang, Y. An improved system for evaluating the adaptability of natural gas flooding in enhancing oil recovery considering the miscible ability. Energy 2021, 236, 121441. [Google Scholar] [CrossRef]
- Long, K.; Tang, Y.; He, Y.; Wang, Y.; Qin, J.; Tang, L. Fluid phase behavior during multi-cycle injection and production of underground gas storage based on gas-condensate reservoirs with oil rim. Geoenergy Sci. Eng. 2023, 226, 211769. [Google Scholar] [CrossRef]
- Li, J.; Li, X.; Jiang, T. Underground storage of hydrogen and hydrogen/methane mixtures in porous reservoirs: Influence of reservoir factors and engineering choices on deliverability and storage operations. Int. J. Hydrogen Energy 2023, 4, 95–99. [Google Scholar]
- Warner, J. An Evaluation of Miscible CO2 Flooding in Waterflooded Sandstone Reservoirs. J. Pet. Technol. 1977, 29, 1339–1347. [Google Scholar] [CrossRef]
- Wan, T.; Meng, X.; Sheng, J.J.; Watson, M. Compositional Modeling of EOR Process in Stimulated Shale Oil Reservoirs by Cyclic Gas Injection. In Proceedings of the SPE Improved Oil Recovery Symposium, Tulsa, OK, USA, 14–18 April 2014. [Google Scholar]
- Ding, M.; Zhao, H.; Zhao, Q. Experimental study on factors affecting hydrocarbon gas drive efficiency. Sci. Technol. Soc. 2013, 13, 7816–7818. [Google Scholar]
- Yang, Y.; Liu, Y.; Zhou, D.; Jiao, X.; Cao, Q.; Meng, Z.; Zhao, M. Lithotypes, organic matter and paleoenvironment characteristics in the Chang73 submember of the Triassic Yanchang Formation, Ordos Basin, China: Implications for organic matter accumulation and favourable target lithotype. J. Pet. Sci. Eng. 2022, 216, 110691. [Google Scholar] [CrossRef]
- Yu, H.; Song, J.; Chen, Z.; Zhang, Y.; Wang, Y.; Yang, W.; Lu, J. Numerical study on natural gas injection with allied in-situ injection and production for improving shale oil recovery. Fuel 2022, 318, 123586. [Google Scholar] [CrossRef]
- Yu, H.; Yang, Z.; Luo, L.; Liu, J.; Cheng, S.; Qu, X.; Lei, Q.; Lu, J. Application of cumulative-in-situ-injection-production technology to supplement hydrocarbon recovery among fractured tight oil reservoirs: A case study in Changqing Oilfield, China. Fuel 2019, 242, 804–818. [Google Scholar] [CrossRef]
- Cheng, S.; Wang, Y.; Lang, H.; Yu, H.; Zhu, C.; Yang, B.; Zhang, H.; Sun, Z. Feasibility of inter-fracture injection and production for the same multistage fractured horizontal well in tight oil reservoir. Acta Petrolei Sin. 2017, 38, 1411–1419. [Google Scholar]
- Liu, X.; Li, D.; Jia, Y.; Liyong, Y.; Xiaoting, G.; Tao, Z.; Ziwei, C.; Mao, L.; Juan, W.; Xiangyun, S.; et al. Optimizing construction parameters for fractured horizontal wells in shale oil. Front. Earth Sci. 2023, 10, 1015107. [Google Scholar] [CrossRef]
- Wang, J.; Zhao, Z.; Liu, G.; Xu, H. A robust optimization approach of well placement for doublet in heterogeneous geothermal reservoirs using random forest technique and genetic algorithm. Energy 2022, 254, 124427. [Google Scholar] [CrossRef]
- Fiki, H. Applied random forest for parameter sensitivity of low salinity water Injection (LSWI) implementation on carbonate reservoir. Alex. Eng. J. 2022, 61, 2408–2417. [Google Scholar]
- Ivšinović, J.; Litvić, N. Application of the bootstrap method on a large input data set-case study western part of the Sava Depression. Rud.-Geološko-Naft. Zb. 2021, 36, 13–19. [Google Scholar] [CrossRef]
- Chen, C.; Breiman, L. Using Random Forest to Learn Imbalanced Data; University of California: Berkeley, CA, USA, 2004. [Google Scholar]
Disclaimer/Publisher’s Note: The statements, opinions and data contained in all publications are solely those of the individual author(s) and contributor(s) and not of MDPI and/or the editor(s). MDPI and/or the editor(s) disclaim responsibility for any injury to people or property resulting from any ideas, methods, instructions or products referred to in the content. |
© 2023 by the authors. Licensee MDPI, Basel, Switzerland. This article is an open access article distributed under the terms and conditions of the Creative Commons Attribution (CC BY) license (https://creativecommons.org/licenses/by/4.0/).